Submitted:
16 April 2024
Posted:
16 April 2024
You are already at the latest version
Abstract
Preterm infants have increased body adiposity at term equivalent age and risk for adverse metabolic outcomes. The aim of the study was to define how nutrient intake may impact body composition (BC) of very low birth weight infants fed with early progressive enteral feeding and standard fortification. Eighty-six infants with
Keywords:
preterm
; very low birth weight
; newborn
; nutrient intake
; body composition
; dual X-ray absorptiometry
1. Introduction
Numerous studies revealed altered body composition of preterm infants at term equivalent age compared to their term counterparts [1] and increased risk of metabolic consequences later in life [2,3,4]. Current feeding practices aim at preterm body composition similar to that of term infants. However, it is challenging, if not impossible, to reach this target due to the extrauterine environment being much different from intrauterine. For intrauterine growth, the fetus receives nutrients and oxygen delivered via placenta and body fat content increases with gestational age [5]. Body fat storages become crucial for extrauterine survival of infants [6], and the fat mass percentage increases even more over the first months of life [7,8]. Thus, fat mass accumulation in early life is physiological and may be inevitable for preterm infants growing ex-utero and being fed with human milk. However, excess fat accumulation in early life may result in metabolic consequences later in life [9,10], and lean mass accretion is associated with better neurocognitive outcomes [11,12]. Many factors may influence further developmental and metabolic disturbances in this population, with nutrition being the most modifiable factor. There is no doubt human milk (HM) is the best food for all infants, however, for those born prematurely, human milk alone may not ensure adequate nutrient intake and requires fortification. It is known that for term breastfed infants, breast milk composition may influence body composition, with higher fat and energy content resulting in higher fat mass gain, however, healthy infants may regulate the breastmilk and nutrient intake through satiety mechanisms [13]. These mechanisms are absent in gavage fed very preterm infants, moreover, nutritional human milk composition is altered by fortifiers. To date, there is no evidence on ideal supplementation of human milk [14,15,16] and variability of human milk and multi-nutrient fortifier composition results in variability of nutrient composition and proportions in preterm infants. With the increasing awareness of childhood obesity, the goal is to balance between improving neurodevelopment and preventing cardiometabolic consequences later in life. Recently, the understanding of preterm newborn physiology, growth and nutritional needs has been changing, replacing “fetus-like” growth concept with the establishment of postnatal preterm growth standards [17,18,19], and leading to attempts of early feeding with human milk.
The aim of our study was to define the impact of early nutrient intake (during the first 28 days of life) on body composition of very low birth weight infants fed with early progressive enteral feeding with human milk and standard human milk fortification.
2. Materials and Methods
Study Subjects
Non-interventional observational study was conducted at the Hospital of Lithuanian University of Health Sciences, Department of Neonatology in 2018–2022. One hundred and twenty infants with the birth weight of <1500 g and gestational age of ≤34 weeks without chromosomal abnormalities and major birth defects were included into the study. Approval for the study was obtained at the Kaunas Regional Bioethics Committee (approval no. BE-2-12) and the study was registered at ISRCTN Database (No. ISRCTN64647571). Both parents signed informed consent. During the hospital stay, 8 infants died, and 3 infants were excluded from further follow-up due to necrotizing enterocolitis and subsequent partial bowel removal. At discharge, which occurred at the median age of 36 weeks of corrected gestational age (CGA), a whole-body dual X-ray absorptiometry (DXA) scan was performed in 93 infants. After exclusion of scans which were considered inaccurate due to excessive movement artefacts, 86 scans were included into final analysis. Scanning was impossible in certain medical conditions, such as supplemental oxygen or orthopaedic cast at discharge. 11 infants missed the scan due to early COVID-19 restrictions for non-emergency procedures and DXA machine technical problems.
For more detailed analysis, the cohort was stratified into two gestational age groups: extremely preterm infants, EP (born at 23–27 gestational weeks) and very/moderately preterm infants, VP (born at 28–33 gestational weeks). The flow chart of the study subjects and reasons of exclusion for DXA analysis are presented in Figure 1.
Feeding Practices and Nutritional Calculations
All infants were started on both parenteral and enteral nutrition right after birth. Enteral nutrition was started at 20 mL/kg/day with oral application of own mother’s colostrum and advanced rapidly by 20–30 mL/kg/day with fresh own mother’s milk and donor milk if mothers’ lactation was not fully established. Feeding tolerance and advancement rate was defined by the attending physician. Parenteral nutrition was gradually weaned with the increasing enteral milk volume. After reaching full enteral feeding, standard human milk (HM) fortification with multi-nutrient bovine-milk based fortifier (Aptamil FMS®, Milupa/Danone GmbH, Friedrichsdorf, Germany, Danone Nutricia, Cuijk, The Netherlands) was started according to manufacturer’s recommendations, i.e., 4,4 g of fortifier was added to 100 mL of milk. The fortification was continued until discharge and no post-discharge feeding interventions were administered. HM composition was measured twice a week using a mid-infrared spectroscopy HM analyser (MIRIS, Uppsala, Sweden) and actual daily nutrient intake was calculated. Detailed nutritional practices and nutrient intake calculation were described previously [20]. Mother’s milk was analysed only after there was enough of it to feed the infant. The benefits of colostrum and early own mother’s milk were considered superior over nutritional analysis. Total nutrient intake (enteral and parenteral) was calculated during the full first 4 weeks and used for regression analysis. Only known values of nutrients in HM were used in calculations, therefore, only a few first week enteral intakes from mother’s milk could be included and average nutrient intake for the whole 28-day period was slightly underestimated.
Body Composition Assessment and Anthropometric Measurements
Body composition was measured by dual energy X-ray absorptiometry (DXA) scanner Hologic Discovery, model Horizon A (Hologic Inc., Marlborough, MA) using infant whole-body software (Version APEX v.5.6.0.5). The median age at the DXA scan was 36 weeks of CGA. The infant was scanned lying supine during natural sleep, usually after feeding. All infants were dressed in the same type of light clothing and disposable diaper and swaddled into the same type of light blanket. Each infant was scanned only once, and scans with excessive movement artefacts were excluded from final analysis. Total body mass, lean mass, fat mass and fat mass percentage were evaluated. Lean mass values were estimated as lean mass plus bone mineral content (LM+BMC). There was no possibility to perform DXA analysis without sedation at 12 months of CA, thus, the skinfold thickness measurements at four body sites were used to assess body adiposity at the follow-up day and the day of DXA scan.
Skinfold thickness (SFT) measurements were performed using Harpenden calliper (Baty International, Burgess Hill, UK). Harpenden calliper operated with a pressure of 10 g/mm2, to the nearest measure of 0.1 mm. Measures were duplicated and the average value was used for analysis. SFT was measured at 4 sites on the right side of the body: biceps, triceps, subscapular and suprailiac. Biceps SFT was measured in the middle of the upper arm, parallel to the long axis with the arm extended, triceps SFT was measured in the middle of the upper arm, parallel to the long axis with the arm flexed. Subscapular SFT was measured right below the angle of right scapula and suprailiac SFT was measured above the iliac crest at the mid-axillary line. The pressure was applied until the reading was stable [21,22]. Mathematical sum of skinfold thickness was used to estimate body adiposity at the day of DXA scan and at 12 months of CA. Skinfold thickness at 12 months of CA was measured in 30 EP and 45 VP infants, with the dropouts occurring due to COVID-19 restrictions.
Anthropometric measurements were performed following the standard procedure [23]. Infants were weighed using electronic infant scales (Marsden, Rotherham, UK). Length was measured with an infant measuring rod (SECA, Hamburg, Germany).
Statistical Analysis
Statistical analyses were performed using Microsoft Excel version 16.81 and IBM SPSS Statistics for Windows (version 29.0.1.0, IBM Corp., Armonk, NY, USA). Descriptive analysis for normally distributed variables included means and standard deviations (SD); for those without normal distribution – medians and interquartile ranges (IQR); for categorical indicators – percentages. The normality of variables distribution was estimated using skewness and kurtosis. For group comparisons the parametric Student’s t-test for normally distributed values and non-parametric Mann-Whitney U test for values without normal distribution were employed. For comparison of categorical indicators Chi-squared test was used and Fisher’s exact test was used when the conditions for Chi-squared test were not met. The results of dependent measurements were compared using paired-samples t-test. The relationships between two continuous variables were assessed using Pearson correlation coefficient.
For prediction of total body mass, lean body mass, fat mass, fat mass proportion and body adiposity at 12 months of CA expressed by sum of SFT, multivariable linear regression models were created. The effect size of the factors in the model was evaluated in terms of standardised beta coefficients (βs). Model fit was estimated through determination coefficient R2. The statistical significance was set at p<0.05.
3. Results
Main demographic characteristics of the infants included in the final analysis are described in Table 1.
3.1. Nutritional Characteristics
Median time to reach full enteral feeding was 7 days in the whole cohort. EP infants received longer parenteral support and had higher median parenteral protein, carbohydrates and energy intake than VP infants, while the fat intake did not differ between the groups. EP infants were started on enteral feeding later and the fortification was introduced later compared to VP infants. Enteral intake during the weeks 2 to 4 did not differ between the groups as well as total intake during the first four weeks. Total nutrient intake did not differ between boys and girls (p=0.865 for protein, p=0.927 for carbohydrates, p=0.435 for fat and p=0.556 for energy intake). Main nutritional characteristics are presented in Table 2.
3.2. Body Composition Estimated by DXA at the Hospital Discharge
DXA estimated mean body mass was higher than the infants’ actual body weight at the DXA scan day (2614 (±393) g vs 2386 (±378) g in the whole cohort, t=34.30, p<0.001), however, the correlation between actual weight and DXA estimated weight was very good (r=0.99, p<0.001). Boys had significantly higher lean body mass at discharge than girls in the whole cohort (2164 (±247) g vs 1945 (±208) g; t=4.46, p<0.001) but fat mass and fat mass percentage did not differ between the sexes (616 (±217) g vs 543 (±238) g; t=1.46, p=0.147 and 21.7 (±5.5)% vs 21.2 (±7.2)%; t=0.34, p=0.731, respectively). Data of total body mass, lean mass fat mass and fat mass proportion of all subjects by gestational age are shown in Figure 2.
Extremely preterm infants were scanned at the median corrected gestational age of 36 weeks (Table 3) and very preterm infants were scanned at the median age of 35 weeks. EP infants had higher body weight at discharge than VP infants (2558 g vs 2284 g, p<0.001) and higher DXA estimated whole body mass (2876 g vs 2512 g, p=0.001). Lean mass was similar in both groups (2086 g in EP and 2012 g in VP, p=0.188), while the fat mass and fat mass percentage (%) was increasing with gestational age and was significantly higher in EP infants than in VP (700 g and 24.8% vs 500 g and 19.4%, p<0.001). Sum of skinfold thickness measured at discharge highly correlated with DXA estimated body fat percentage (r=0.59, p<0.001), thus, it was used as body adiposity estimate at 12 months of CA. By 12 months of CA there was no difference in body adiposity expressed by the sum of SFT between EP and VP (26.9 and 26.3 mm, p=0.661).
The main differences in body composition values between the two groups are presented in Table 3.
3.3. The Association Between Early Nutrient Intake And Body Composition
Multivariable regression was conducted to see how nutrient intake may impact the body composition at discharge and at 12 months of CA (Table 4). Models included total average nutrient intake during the first 28 days, sex, and gestational age. Energy was not included into the models due to collinearity. In the group of EP infants, none of the macronutrients had any effect on total mass, lean mass, and fat mass or fat mass percentage at discharge and body adiposity expressed as sum of SFT at 12 months of CA. Higher protein intake did not result in higher lean body mass in either group at both assessment time points. Higher carbohydrates intake during the first 28 postnatal days did not affect body composition in either group at discharge and at 12 months of CA, however, higher fat intake in VP infants was a significant predictor of higher absolute fat mass (βs 0.424, p=0.002), fat mass percentage (βs 0.455, p=0.001) at discharge, and body adiposity expressed as sum of SFT at 12 months of CA (βs 0.406, p=0.021).
At discharge, male sex was associated with higher lean mass in both groups (βs -0.475, p=0.022 in EP and (βs -0.475, p=0.003 in VP infants). In VP infants, male sex was associated also with higher total body mass (p=0.002). Higher gestational age was associated with lower total body mass, lean mass, fat mass, and fat mass proportion at discharge, but not at 12 months of CA in VP infants. Regression analysis results are presented in Table 4.
4. Discussion
Body Composition of Preterm Infants at Discharge and at 12 Months of CA
Assessment of body composition in the preterm population is gaining more interest since it is a valuable tool to evaluate quality of growth together with the anthropometric measurements. However, little knowledge is present about ideal body composition for preterm infants growing ex-utero. Current body composition references for preterm infants are based on cross-sectional measurements of preterm infants soon after birth measured by air displacement plethysmography (ADP) [5]. ADP is one of the validated methods of body composition assessment in infants and more commonly used in research than DXA [25]. Study by Yumani et al. compared the results of ADP, DXA and clinical body adiposity assessment by skinfold measurements and found poor agreement between ADP and DXA, with DXA giving higher estimates of fat mass and fat mass percentage than ADP [26]. Blankets and ingested milk may influence DXA results in infants [27], and all our study patients were examined when swaddled and fed. This may explain the difference between actual weight and DXA estimated total body mass; similar differences are reported in other DXA studies [28,29].
Infants in our cohort receiving early progressive enteral feeding with own mother’s milk had increased body adiposity compared to term reference values from published studies where fat mass percentage measured by DXA in term infants ranged from 11% to 13% [27,30]. One of the determinants of higher body adiposity in EP infants in our study may be a longer exposure to extrauterine environment, as they had similar fat percentage at 10 weeks after birth (24.8%) comparable to term infants at 2 months of age (24.5%) in the study by Schmelzle at al. [30]. VP infants in our study were scanned at the median age of 6 weeks, which may explain their lower fat mass percentage.
Our results are consistent with a similar prospective observational study conducted in Austria, where infants born at <32 gestational weeks received nutrition according to ESPGHAN 2010 guidelines and body composition was assessed using PEA POD air displacement plethysmography close to term equivalent age [31]. Extremely preterm infants in this study had higher fat mass than very preterm infants – 17% versus 15.5%. Like in our cohort, very preterm infants were discharged and scanned earlier than extremely preterm, and VP had lower weight at discharge. The Austrian study did not analyse associations between nutrients and body composition, and parenteral support was much longer compared to our cohort (28 days in extremely preterm and 9 days in very preterm infants). Another study in Germany included 105 preterm infants who were started on enteral feeding right after birth, just like in our cohort; feeding was advanced rapidly and time to reach full enteral feeding was 5 days, even shorter than in our study [32]. Body composition was assessed using ADP at 37.6 weeks. The cohort was stratified to EP and VP infants and SGA and AGA infant groups. EP infants were examined at later postnatal and postmenstrual age than VP infants and, contrary to our findings, fat mass, fat mass percentage did not significantly differ between these groups. Fat free mass was similar in infants of the German cohort to our study infants, even though examined by different techniques. Interestingly, other previous studies found good agreement between ADP and DXA estimated fat free mass [26,33]. The above mentioned study examined the influence of parenteral protein intake during the first week of life on body composition, however, no associations were found. We analysed average daily nutrient intake throughout the 28-day period and did not find any associations between protein intake and fat mass or fat free mass at discharge in either group of infants. A randomised trial by Sallas et al. [34] reported that increased protein intake with additional fortification resulted in higher fat free mass z-scores in extremely preterm infants at discharge, however, at 3 months of CA the fat free mass difference between higher and lower protein groups was not statistically significant. Moreover, higher protein did not result in lower fat mass percentage in that study. Higher protein/energy ratio was found to be significantly associated with decreased risk of fat free mass deficit in the study by Simon [35]; protein/energy ratio was 2.5–2.6 g/100 kcal, while in our study it was 3.1 g/100 kcal in both groups. It may suggest that there is a certain threshold for protein/energy intake, above which lean mass accretion will not be improved. Another finding in that study was that male sex is associated with higher risk of fat free mass deficit besides nutrition, whereas in our study male sex was a significant predictor of higher absolute lean body mass in both groups. Boys in our cohort also had higher lean mass close to the term equivalent age even though nutrient intake was not different between boys and girls. Fat mass and fat mass percentage did not differ between sexes, and this is consistent with the finding of another study by Simon et al., which found that fat mass percentage did not differ between preterm boys and girls, while term male infants had higher fat free mass and lower fat mass percentage than females [36].
In our cohort, despite a significant difference of fat mass at discharge between two gestational age groups, this difference was not maintained by 12 months of CA. Gestational age was no longer predictive of body adiposity at 12 months of CA in VP infants. It is unclear whether this happened by slowing down of fat mass accumulation in the extremely preterm or the opposite process in more mature infants. These results should be interpreted with caution, since at follow-up we could apply only clinical methods of adiposity evaluation, i.e., skinfold measurements.
The Association Between Early Nutrient Intake and Body Composition
Our study reveals differences in the impact of early nutrition on the body composition in infants born at different gestational ages. With early enteral feeding with own mother’s milk, nutritional deficits may be minimised, especially in infants born at higher gestational ages. With the variability of human milk composition, standard fortification, which is mostly used in the clinical setting, may provide too little or too much of nutrients. The latest ESPGHAN recommendations on enteral nutrient intakes involve recommendations for all infants born <1800 g [37]. Extrauterine growth and development might be completely different in infants born at the earliest gestation and those who are more mature. Moreover, nutritional management is different for acutely sick infants and those recovering from acute illness or ones without major morbidities [38], and this practice was not always applied in infants of our study. In our cohort, VP infants had little morbidities compared to those born extremely premature, and growth patterns were different during early postnatal period despite the average nutrient intake not being significantly different, which is described in a previous publication [39].
Duration of parenteral nutrition was short in VP infants – median 5 days, therefore, enteral fat intake was dominant during the first 28 postnatal days. It is important to note that the only source of enteral fat intake was human milk. Fortifier consisted of additional protein, carbohydrates, and micronutrients, however, providing excess carbohydrates, especially in the group of VP infants. At the time of the study, recommended carbohydrates intake was 11.6–13.2 g/kg/d [40], while in the current recommendations carbohydrates intake limit is increased up to 15 g/kg/day [37]. It is known that nutrient proportions in the diet of low birth weight infants may influence the quality of growth. Randomised trial by Kashyap et al. [41] analysed different energy, carbohydrates and fat proportions in infant formulas and reported better weight gain and nitrogen retention in the group of infants fed with the formula in which carbohydrates were dominant over fat as non-protein energy source, suggesting that carbohydrates could be easier utilised for protein accretion than fat. Although this study was performed with infant formulas, the same principles might apply to feeding with fortified human milk. With extra carbohydrates in the fortifier in our study, we may hypothesise that some non-protein energy from fat intake may have been stored as excess body fat.
Associations between fat intake and body adiposity were reported in the earlier studies. In the study performed by Tremblay [28] authors found that intravenous lipids during the first week of life were positively associated with DXA estimated abdominal fat mass at discharge, however, duration of parenteral nutrition in this study was longer (29 days), full enteral feeding was achieved later than in our cohort and enteral intake was not assessed. Whether parenteral intake has the same effect on body composition as enteral, is not known. Another study conducted by McLeod et al. [42] evaluated enteral nutrient intake effects on body composition in infants born <33 gestational weeks. Body composition was assessed using ADP. Mean enteral intake in subjects of this study was similar to ours, with breastmilk being the predominant nutrient source. Study revealed that fat intake was associated with increased absolute fat mass in grams, but not in percentage of body fat, while in our cohort associations were found in both absolute fat mass and percentage of body fat in the group of infants born at 28–33 weeks. Contrary to McLeod’s study, we did not find a positive association between protein intake and fat-free mass in either group. Higher lipid intake was associated with higher percentage of body fat in a prospective cohort study of very preterm infants conducted by Han et al. [43], with actual nutrient intake estimation by human milk analysis. Mean time to achieve full enteral feeding was 21.5 days, much later than in our cohort, suggesting that solely enteral intake was not dominant. Important finding of this study is that the impact of higher lipid intake on fat mass persisted to 6 months of CA, which is consistent with our findings – at 12 months of CA in our VP infants, higher lipid intake predicted higher body adiposity measured by SFT. Impact of nutrient intake and nutrient proportions on body composition was also reported in the study by Lingwood [44], where it was found that higher protein, carbohydrates and protein-carbohydrates ratio were associated with lower fat mass in infants born less than 32 weeks; nutrient intake was calculated using the reference values for human milk and more infants received unfortified human milk rather than fortified, i.e., the nutritional intervention was different from our cohort, which might explain different results in our study.
The importance of human milk composition variations on fortification strategies and infant growth and body composition are well described in the studies by Belfort [45] and Rochow [46]. In the Belfort study, analysis of unfortified human milk showed remarkable variations between mothers and subsequent day-to-day variation in individual infants. Analysing the associations between unfortified human milk nutrient intakes and growth and body composition of very preterm infants, authors found that higher fat and energy from human milk was associated with higher fat-free mass z-score. When compared to our study results, where fat intake was associated with more fat mass, it might be suggested that nutrients from unfortified and fortified human milk may have different effects on growth and body composition. In the randomised trial by Rochow and colleagues, human milk was analysed three times per week and the intervention group received standard fortification with additional targeted fortification to achieve recommended nutrient intakes, while the control group received standard fortification only. In this study, the fortifier used for standard fortification had different macronutrient composition than that in our study, therefore, the nutrient intake proportions in the standard fortification group were not the same; the standard group received less carbohydrates and more fat than infants in our cohort: even with additional fortification in the intervention group, carbohydrates intake was lower than in our cohort. The intervention group had better growth, higher fat-free mass and higher fat mass measured by ADP. Fat mass percentage did not differ between the groups and it is not clear which nutrient resulted in more fat or fat-free mass. Authors of this trial discuss the importance of the natural variations in composition of the human milk and possible nutritional deficits as well as possible nutrient excess with the standard fortification.
In comparison with aforementioned studies, our study results may support the hypothesis that both human milk and fortifier composition may influence quality of growth in certain subgroups of very low birth weight infants. More mature and relatively “healthy” preterm infants, especially those who’s mother’s milk has higher concentrations of nutrients may not benefit from standard routine multinutrient fortification and may face a risk of increased body adiposity with this effect observed even later in life. Longer term follow-up studies show that nutrient enriched diet and accelerated early growth may result in higher body fat mass in childhood and are associated with increased adiposity and determinants of cardiovascular disease in young adults [47,48].
Our study has several limitations. The main limitation is the observative nature of the study and the relatively small single-centre cohort. Early COVID-19 restrictions and DXA machine maintenance issues resulted in dropout of 11 infants at discharge, 11 infants did not return to 12 months follow-up, making the final cohort even smaller. At 12 months of CA follow-up, we could not perform DXA scans without sedation, it was not possible to arrange the scan during natural sleep for older infants, and skinfold thickness might have been an estimate of low accuracy. Despite DXA being validated for infants, ADP is more widely used due to the absence of ionising radiation and ease of measurement [25]. For that reason, results of our study are difficult to compare with recent nutritional studies with similar feeding practices. In addition, we did not assess or control post-discharge feeding that may have played a role in body composition at follow-up.
5. Conclusions
Results of our study suggest that preterm infants born at different gestational ages may have different nutritional needs; moreover, fortification without HM analysis may result in undernutrition as well as overnutrition of certain ingredients. Own mother’s milk should be the primary food for preterm infants with careful choice of fortifiers, probably single nutrient over multi-nutrient, depending on HM composition. Extrauterine growth and body composition of preterm infants is influenced by extrauterine environmental factors and aiming for fetus-like body composition with relatively low fat mass at term equivalent age may be an unachievable goal. Further studies should aim at finding postnatal growth patterns of preterm infants ensuring most favourable long-term outcomes.
Author Contributions
Conceptualization, R.V., K.A.-W. and R.B.; methodology, R.V., K.A.-W. and R.B.; formal analysis, K.Š.; investigation, A.V.; resources, A.V., data curation, R.B. and K.Š.; writing—original draft preparation, R.B.; writing—review and editing, R.V., R.T. and I.A.; visualisation, K.Š. and I.A. All authors have read and agreed to the published version of the manuscript.
Funding
The supplies for this study’s human milk analysis were donated by the Rotary Club of Chicagoland Lithuanians. Financial support was acknowledged from the Swedish government grants under the ALF agreement (ALFGBG-965451).
Institutional Review Board Statement
The study was conducted in accordance with the Declaration of Helsinki and approved by Kaunas Regional Bioethics Committee (approval No. BE-2-12). The study was registered at ISRCTN database, No. ISRCTN64647571.
Informed Consent Statement
Informed consent was obtained from both parents of all subjects involved in the study.
Data Availability Statement
The data generated and analysed during the current study are not publicly available but are available from the corresponding author on reasonable request.
Acknowledgments
We thank all families for participating in this study.
Conflicts of Interest
The authors declare no conflict of interest. The funders had no role in the design of the study; in the collection, analyses, or interpretation of data; in the writing of the manuscript; or in the decision to publish the results.
References
- Johnson, M.J.; Wootton, S.A.; Leaf, A.A.; Jackson, A.A. Preterm Birth and Body Composition at Term Equivalent Age: A Systematic Review and Meta-analysis. Pediatrics 2012, 130, e640–e649. [Google Scholar] [CrossRef] [PubMed]
- Huang, Y.-T.; Lin, H.-Y.; Wang, C.-H.; Su, B.-H.; Lin, C.-C. Association of preterm birth and small for gestational age with metabolic outcomes in children and adolescents: A population-based cohort study from Taiwan. Pediatr. Neonatol. 2018, 59, 147–153. [Google Scholar] [CrossRef] [PubMed]
- Luu TM, Rehman Mian MO, Nuyt AM. Long-Term Impact of Preterm Birth: Neurodevelopmental and Physical Health Outcomes. Clin Perinatol. 2017, 44, 305–14.
- Lapillonne, A.; Griffin, I.J. Feeding Preterm Infants Today for Later Metabolic and Cardiovascular Outcomes. J. Pediatr. 2013, 162, S7–S16. [Google Scholar] [CrossRef] [PubMed]
- Demerath, E.W.; Johnson, W.; A Davern, B.; Anderson, C.G.; Shenberger, J.S.; Misra, S.; E Ramel, S. New body composition reference charts for preterm infants. Am. J. Clin. Nutr. 2017, 105, 70–77. [Google Scholar] [CrossRef] [PubMed]
- Ikenoue, S.; Kasuga, Y.; Endo, T.; Tanaka, M.; Ochiai, D. Newer Insights Into Fetal Growth and Body Composition. Front. Endocrinol. 2021, 12. [Google Scholar] [CrossRef] [PubMed]
- Eriksson, B.; Löf, M.; Forsum, E. Body composition in full-term healthy infants measured with air displacement plethysmography at 1 and 12 weeks of age. Acta Paediatr. 2010, 99, 563–568. [Google Scholar] [CrossRef] [PubMed]
- E Carberry, A.; Colditz, P.B.; E Lingwood, B. Body Composition From Birth to 4.5 Months in Infants Born to Non-Obese Women. Pediatr. Res. 2010, 68, 84–88. [Google Scholar] [CrossRef]
- Stutte, S.; Gohlke, B.; Peiler, A.; Schreiner, F.; Born, M.; Bartmann, P.; Woelfle, J. Impact of Early Nutrition on Body Composition in Children Aged 9.5 Years Born with Extremely Low Birth Weight. Nutrients 2017, 9, 124. [Google Scholar] [CrossRef]
- Matinolli, H.-M.; Hovi, P.; Männistö, S.; Sipola-Leppänen, M.; Eriksson, J.G.; Mäkitie, O.; Järvenpää, A.-L.; Andersson, S.; Kajantie, E. Early Protein Intake Is Associated with Body Composition and Resting Energy Expenditure in Young Adults Born with Very Low Birth Weight. J. Nutr. 2015, 145, 2084–2091. [Google Scholar] [CrossRef]
- Bua, J.; Risso, F.M.; Bin, M.; Vallon, F.; Travan, L.; Paviotti, G. Association between body composition at term equivalent age and Bayley scores at 2 years in preterm infants. J. Perinatol. 2021, 41, 1852–1858. [Google Scholar] [CrossRef] [PubMed]
- Pfister, K.M.; Zhang, L.; Miller, N.C.; Ingolfsland, E.C.; Demerath, E.W.; Ramel, S.E. Early body composition changes are associated with neurodevelopmental and metabolic outcomes at 4 years of age in very preterm infants. Pediatr. Res. 2018, 84, 713–718. [Google Scholar] [CrossRef] [PubMed]
- de Fluiter, K.S.; Kerkhof, G.F.; van Beijsterveldt, I.A.; Breij, L.M.; van de Heijning, B.J.; Abrahamse-Berkeveld, M.; Hokken-Koelega, A.C. Longitudinal human milk macronutrients, body composition and infant appetite during early life. Clin. Nutr. 2020, 40, 3401–3408. [Google Scholar] [CrossRef] [PubMed]
- A Amissah, E.; Brown, J.; E Harding, J. Protein supplementation of human milk for promoting growth in preterm infants. Emergencias 2020, 2020. [Google Scholar] [CrossRef]
- A Amissah, E.; Brown, J.; E Harding, J. Carbohydrate supplementation of human milk to promote growth in preterm infants. Emergencias 2020, 2020. [Google Scholar] [CrossRef]
- Amissah EA, Brown J, Harding JE. Fat supplementation of human milk for promoting growth in preterm infants. Cochrane Database Syst Rev. 2020 Aug 25;2020(10).
- Fenton TR, Cormack B, Goldberg D, Nasser R, Alshaikh B, Eliasziw M; et al. “Extrauterine growth restriction” and “postnatal growth failure” are misnomers for preterm infants. J Perinatol. 2020, 40, 704–14.
- Villar, J.; Giuliani, F.; Barros, F.; Roggero, P.; Coronado Zarco, I.A.; Rego, M.A.S.; Ochieng, R.; Gianni, M.L.; Rao, S.; Lambert, A.; et al. Monitoring the Postnatal Growth of Preterm Infants: A Paradigm Change. Pediatrics 2018, 141, e20172467. [Google Scholar] [CrossRef]
- Villar, J.; Giuliani, F.; Figueras-Aloy, J.; Barros, F.; Bertino, E.; Bhutta, Z.A.; Kennedy, S.H. Growth of preterm infants at the time of global obesity. Arch. Dis. Child. 2019, 104, 725–727. [Google Scholar] [CrossRef] [PubMed]
- Brinkis R, Albertsson-Wikland K, Tamelienė R, Vinskaitė A, Šmigelskas K, Verkauskienė R. Nutrient Intake with Early Progressive Enteral Feeding and Growth of Very Low-Birth-Weight Newborns. Nutrients. 2022 Mar 11;14, 1181.
- Koo, W.W.K.; Walters, J.C.; Hockman, E.M. Body Composition in Neonates: Relationship Between Measured and Derived Anthropometry with Dual-Energy X-Ray Absorptiometry Measurements. Pediatr. Res. 2004, 56, 694–700. [Google Scholar] [CrossRef]
- Oakley JR, Parsons RJ, Whitelaw AG. Standards for skinfold thickness in British newborn infants. Arch Dis Child. 1977 Apr 1;52, 287–90.
- The International Fetal and Newborn Growth Consortium International Fetal and Newborn Growth Standards for the 21 st Century Anthropometry Handbook. [Internet]. 2012.
- Morkuniene, R.; Cole, T.J.; Jakimaviciene, E.M.; Bankauskiene, A.; Isakova, J.; Drazdiene, N.; Basys, V.; Tutkuviene, J. Regional references vs. international standards for assessing weight and length by gestational age in Lithuanian neonates. Front. Pediatr. 2023, 11, 1173685. [Google Scholar] [CrossRef]
- Hamatschek, C.; Yousuf, E.I.; Möllers, L.S.; So, H.Y.; Morrison, K.M.; Fusch, C.; Rochow, N. Fat and Fat-Free Mass of Preterm and Term Infants from Birth to Six Months: A Review of Current Evidence. Nutrients 2020, 12, 288. [Google Scholar] [CrossRef] [PubMed]
- Yumani DFJ, de Jongh D, Lafeber HN, van Weissenbruch MM. A comparative study using dual-energy X-ray absorptiometry, air displacement plethysmography, and skinfolds to assess fat mass in preterms at term equivalent age. Eur J Pediatr. 2021, 180, 919–27.
- de Knegt VE, Carlsen EM, Bech Jensen JE, Lade Rasmussen AM, Pryds O. DXA performance in a pediatric population: Precision of body composition measurements in healthy term-born infants using dual-energy X-ray absorptiometry. J Clin Densitom. 2015, 18, 117–23.
- Tremblay, G.; Boudreau, C.; Bélanger, S.; St-Onge, O.; Pronovost, E.; Simonyan, D.; Marc, I. Body Composition in Very Preterm Infants: Role of Neonatal Characteristics and Nutrition in Achieving Growth Similar to Term Infants. Neonatology 2016, 111, 214–221. [Google Scholar] [CrossRef] [PubMed]
- Godang, K.; Qvigstad, E.; Voldner, N.; Isaksen, G.A.; Frøslie, K.F.; Nøtthellen, J.; Henriksen, T.; Bollerslev, J. Assessing Body Composition in Healthy Newborn Infants: Reliability of Dual-Energy X-Ray Absorptiometry. J. Clin. Densitom. 2010, 13, 151–160. [Google Scholar] [CrossRef] [PubMed]
- Schmelzle, H.R.; Fusch, C. Body fat in neonates and young infants: validation of skinfold thickness versus dual-energy X-ray absorptiometry,, Am. J. Clin. Nutr. 2002, 76, 1096–1100. [Google Scholar] [CrossRef] [PubMed]
- Bruckner, M.; Khan, Z.; Binder, C.; Morris, N.; Windisch, B.; Holasek, S.; Urlesberger, B. Extremely Preterm Infants Have a Higher Fat Mass Percentage in Comparison to Very Preterm Infants at Term-Equivalent Age. Front. Pediatr. 2020, 8, 61. [Google Scholar] [CrossRef] [PubMed]
- Wiechers, C.; Avellina, V.; Luger, B.; Böckmann, K.; Minarski, M.; Maas, C.; Bernhard, W.; Poets, C.F.; Franz, A.R. Body Composition of Preterm Infants following Rapid Transition to Enteral Feeding. Neonatology 2022, 119, 246–254. [Google Scholar] [CrossRef] [PubMed]
- Wrottesley, S.V.; Pisa, P.T.; Micklesfield, L.K.; Pettifor, J.M.; A Norris, S. A comparison of body composition estimates using dual-energy X-ray absorptiometry and air-displacement plethysmography in South African neonates. Eur. J. Clin. Nutr. 2016, 70, 1254–1258. [Google Scholar] [CrossRef]
- Salas, A.A.; Jerome, M.; Finck, A.; Razzaghy, J.; Chandler-Laney, P.; Carlo, W.A. Body composition of extremely preterm infants fed protein-enriched, fortified milk: a randomized trial. Pediatr. Res. 2021, 91, 1231–1237. [Google Scholar] [CrossRef]
- Simon, L.; Frondas-Chauty, A.; Senterre, T.; Flamant, C.; Darmaun, D.; Rozé, J.-C. Determinants of body composition in preterm infants at the time of hospital discharge. Am. J. Clin. Nutr. 2014, 100, 98–104. [Google Scholar] [CrossRef] [PubMed]
- Simon, L.; Borrego, P.; Darmaun, D.; Legrand, A.; Rozé, J.-C.; Chauty-Frondas, A. Effect of sex and gestational age on neonatal body composition. Br. J. Nutr. 2012, 109, 1105–1108. [Google Scholar] [CrossRef] [PubMed]
- Embleton, N.D.M.; Moltu, S.J.; Lapillonne, A.; Akker, C.H.v.D.; Carnielli, V.; Fusch, C.; Gerasimidis, K.; van Goudoever, J.B.; Haiden, N.M.; Iacobelli, S.; et al. Enteral Nutrition in Preterm Infants (2022): A Position Paper From the ESPGHAN Committee on Nutrition and Invited Experts. J. Pediatr. Gastroenterol. Nutr. 2022, 76, 248–268. [Google Scholar] [CrossRef] [PubMed]
- Moltu SJ, Bronsky J, Embleton N, Gerasimidis K, Indrio F, Köglmeier J; et al. Nutritional Management of the Critically Ill Neonate: A Position Paper of the ESPGHAN Committee on Nutrition. J Pediatr Gastroenterol Nutr. 2021, 73, 274–89.
- Brinkis, R.; Albertsson-Wikland, K.; Tamelienė, R.; Aldakauskienė, I.; Rimdeikienė, I.; Marmienė, V.; Šmigelskas, K.; Verkauskienė, R. Impact of Early Nutrient Intake and First Year Growth on Neurodevelopment of Very Low Birth Weight Newborns. Nutrients 2022, 14, 3682. [Google Scholar] [CrossRef] [PubMed]
- Agostoni, C.; Buonocore, G.; Carnielli, V.P.; De Curtis, M.; Darmaun, D.; Decsi, T.; Domellöf, M.; Embleton, N.D.; Fusch, C.; Genzel-Boroviczeny, O.; et al. Enteral Nutrient Supply for Preterm Infants: Commentary From the European Society of Paediatric Gastroenterology, Hepatology and Nutrition Committee on Nutrition. J. Pediatr. Gastroenterol. Nutr. 2010, 50, 85–91. [Google Scholar] [CrossRef] [PubMed]
- Kashyap, S.; Ohira-Kist, K.; Abildskov, K.; Towers, H.M.; Sahni, R.; Ramakrishnan, R.; Schulze, K. Effects of Quality of Energy Intake on Growth and Metabolic Response of Enterally Fed Low-Birth-Weight Infants. Pediatr. Res. 2001, 50, 390–397. [Google Scholar] [CrossRef]
- McLeod, G.; Simmer, K.; Sherriff, J.; Nathan, E.; Geddes, D.; Hartmann, P. Feasibility study: Assessing the influence of macronutrient intakes on preterm body composition, using air displacement plethysmography. J. Paediatr. Child Heal. 2015, 51, 862–869. [Google Scholar] [CrossRef]
- Han, J.; Zhang, L.; Li, S.; Zhang, Y.; Jiang, Y.; Chen, X.; Wang, Y.; Dou, Y.; Dong, P.; Lv, Y.; et al. Associations of early nutrition with growth and body composition in very preterm infants: a prospective cohort study. Eur. J. Clin. Nutr. 2021, 76, 103–110. [Google Scholar] [CrossRef]
- Lingwood BE, Al-Theyab N, Eiby YA, Colditz PB, Donovan TJ. discharge is associated with macronutrient intakeBody composition in very preterm infants before. Br J Nutr. 2020, 123, 800–6.
- Belfort, M.; Cherkerzian, S.; Bell, K.; Soldateli, B.; Ramos, E.C.; Palmer, C.; Steele, T.; Pepin, H.; Ellard, D.; Drouin, K.; et al. Macronutrient Intake from Human Milk, Infant Growth, and Body Composition at Term Equivalent Age: A Longitudinal Study of Hospitalized Very Preterm Infants. Nutrients 2020, 12, 2249. [Google Scholar] [CrossRef] [PubMed]
- Rochow, N.; Fusch, G.; Ali, A.; Bhatia, A.; So, H.Y.; Iskander, R.; Chessell, L.; el Helou, S.; Fusch, C. Individualized target fortification of breast milk with protein, carbohydrates, and fat for preterm infants: A double-blind randomized controlled trial. Clin. Nutr. 2020, 40, 54–63. [Google Scholar] [CrossRef] [PubMed]
- Singhal, A.; Kennedy, K.; Lanigan, J.; Fewtrell, M.; Cole, T.J.; Stephenson, T.; Elias-Jones, A.; Weaver, L.T.; Ibhanesebhor, S.; MacDonald, P.D.; et al. Nutrition in infancy and long-term risk of obesity: evidence from 2 randomized controlled trials. Am. J. Clin. Nutr. 2010, 92, 1133–1144. [Google Scholar] [CrossRef] [PubMed]
- Kerkhof, G.F.; Willemsen, R.H.; Leunissen, R.W.; Breukhoven, P.E.; Hokken-Koelega, A.C. Health Profile of Young Adults Born Preterm: Negative Effects of Rapid Weight Gain in Early Life. J. Clin. Endocrinol. Metab. 2012, 97, 4498–4506. [Google Scholar] [CrossRef] [PubMed]
Figure 1.
Flowchart of the study. DXA – dual X-ray absorptiometry, NEC – necrotising enterocolitis.
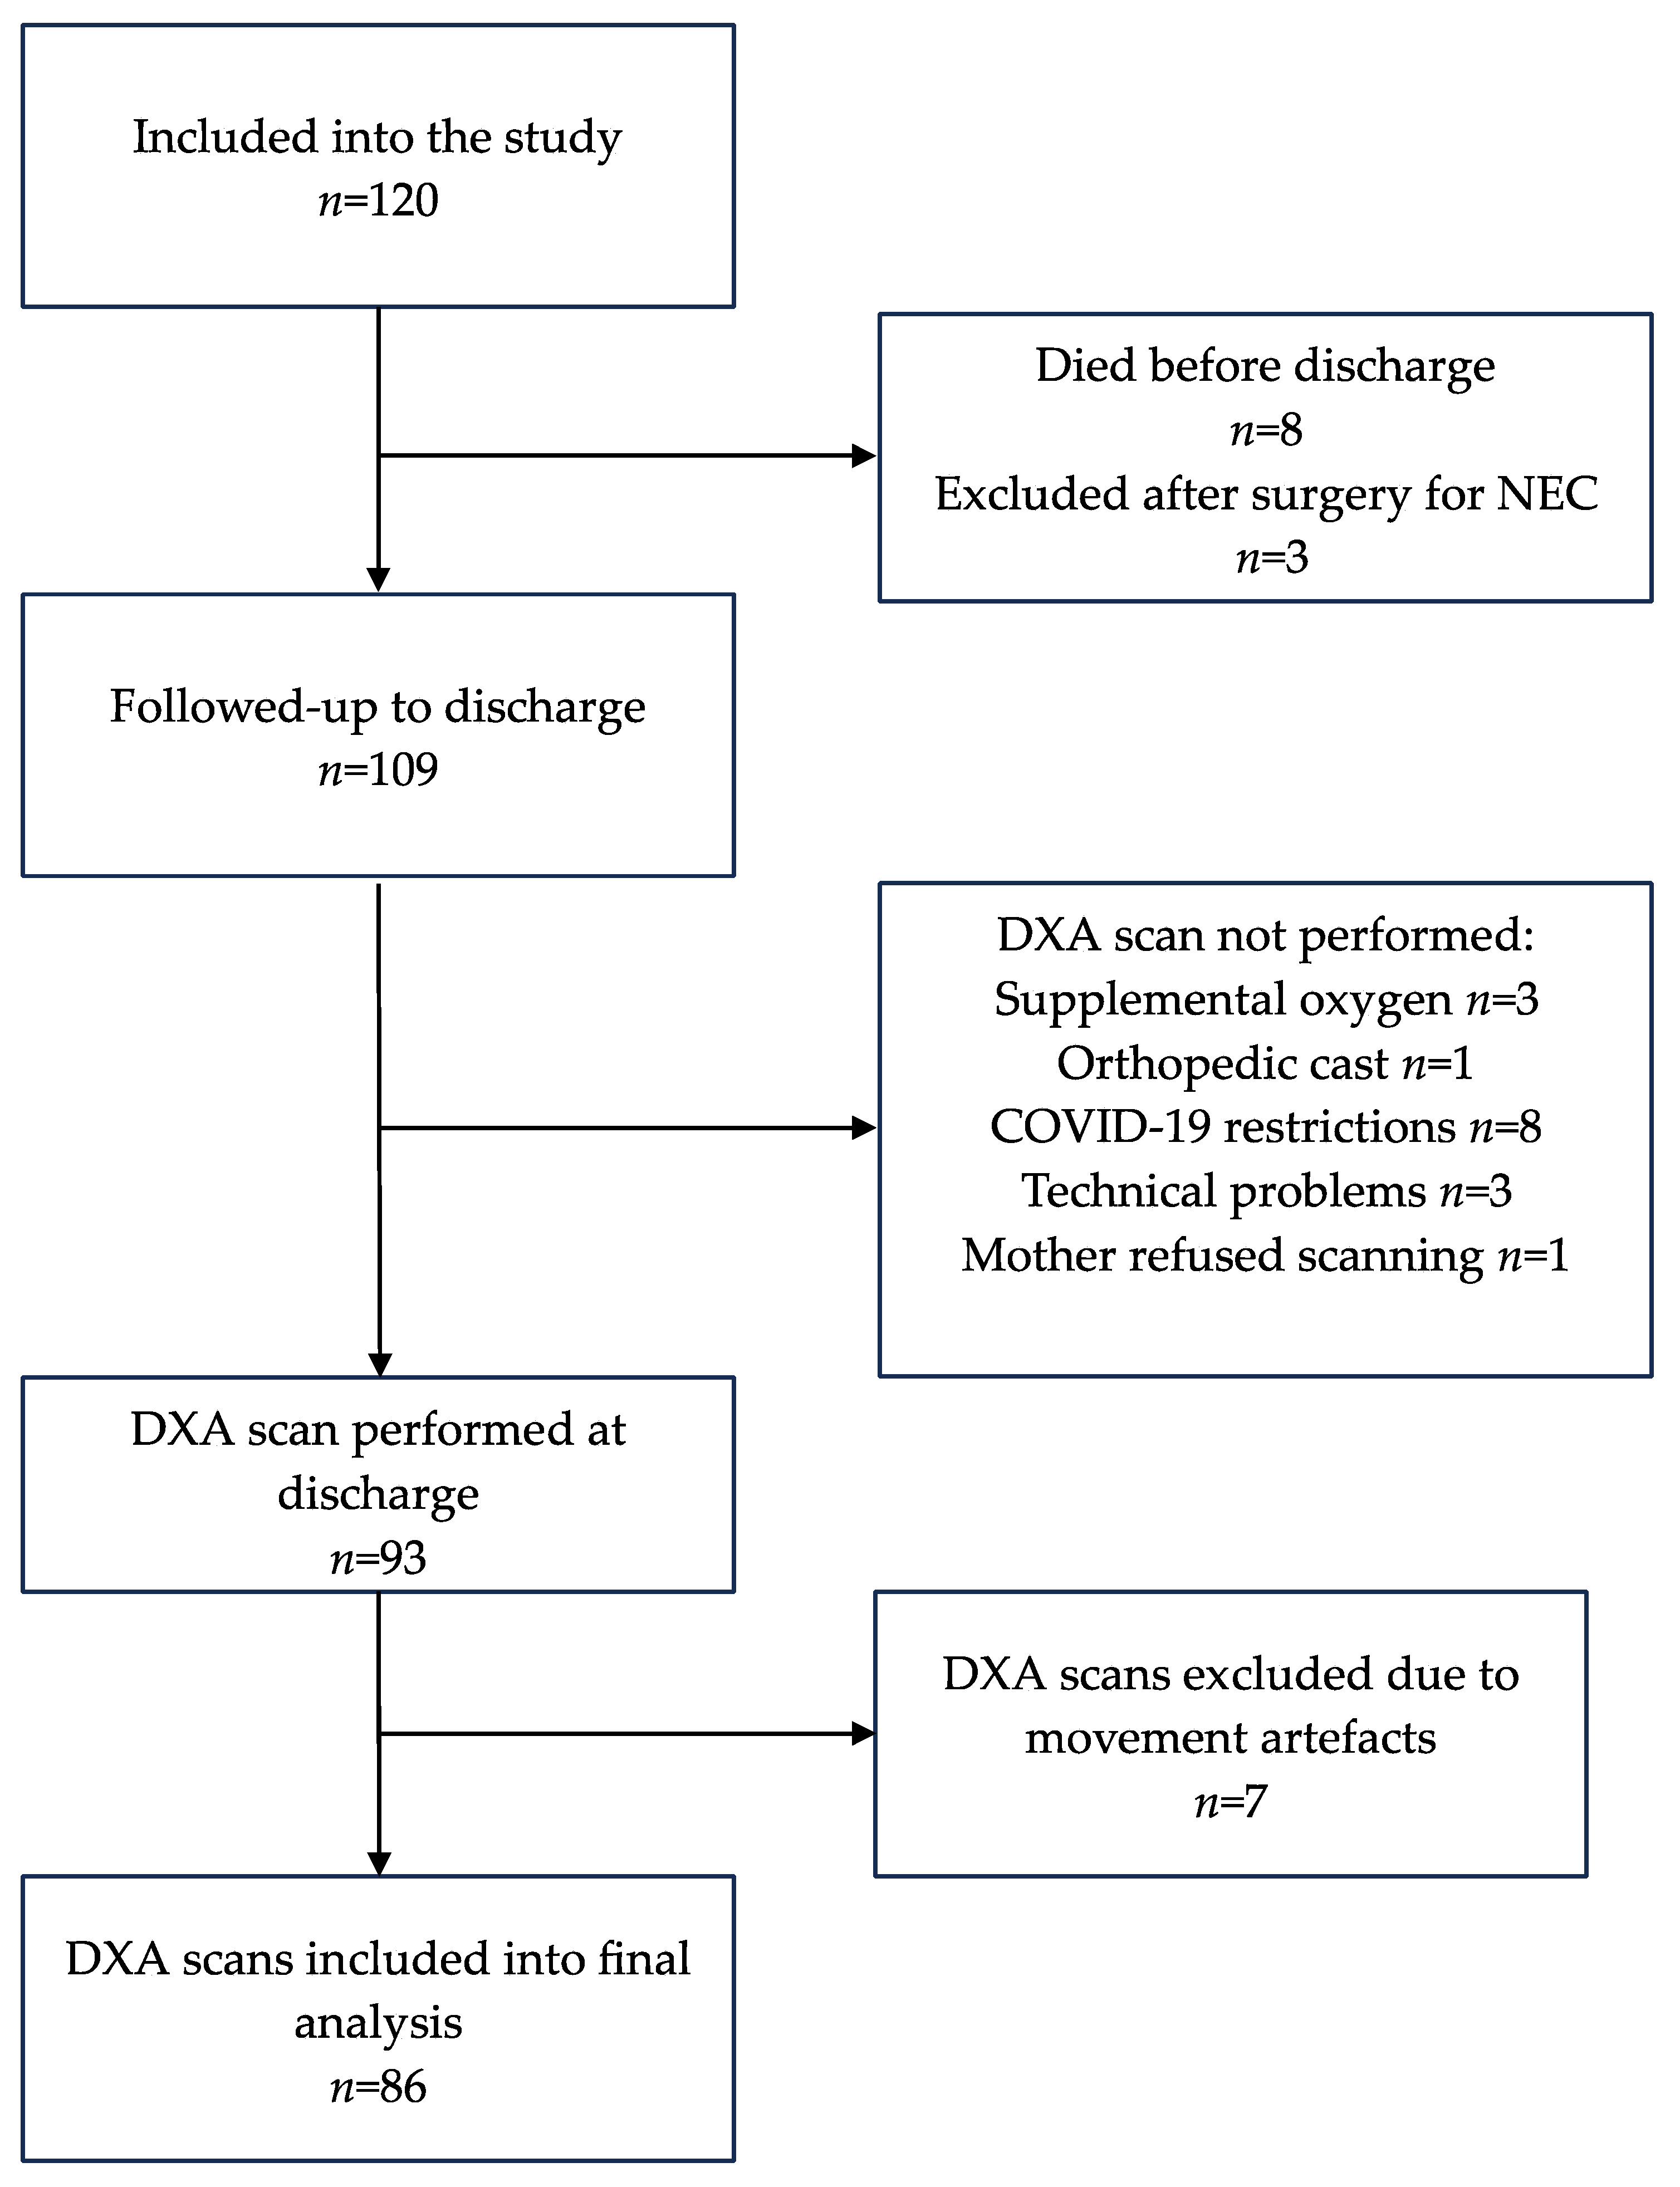
Figure 2.
DXA estimated total body mass, lean mass, fat mass in grams and fat mass proportion in percentage of all subjects. (a) DXA estimated total body mass in grams; (b) DXA estimated lean mass in grams; (c) DXA estimated fat mass in grams; (d) DXA estimated fat mass proportion, percent.
Figure 2.
DXA estimated total body mass, lean mass, fat mass in grams and fat mass proportion in percentage of all subjects. (a) DXA estimated total body mass in grams; (b) DXA estimated lean mass in grams; (c) DXA estimated fat mass in grams; (d) DXA estimated fat mass proportion, percent.
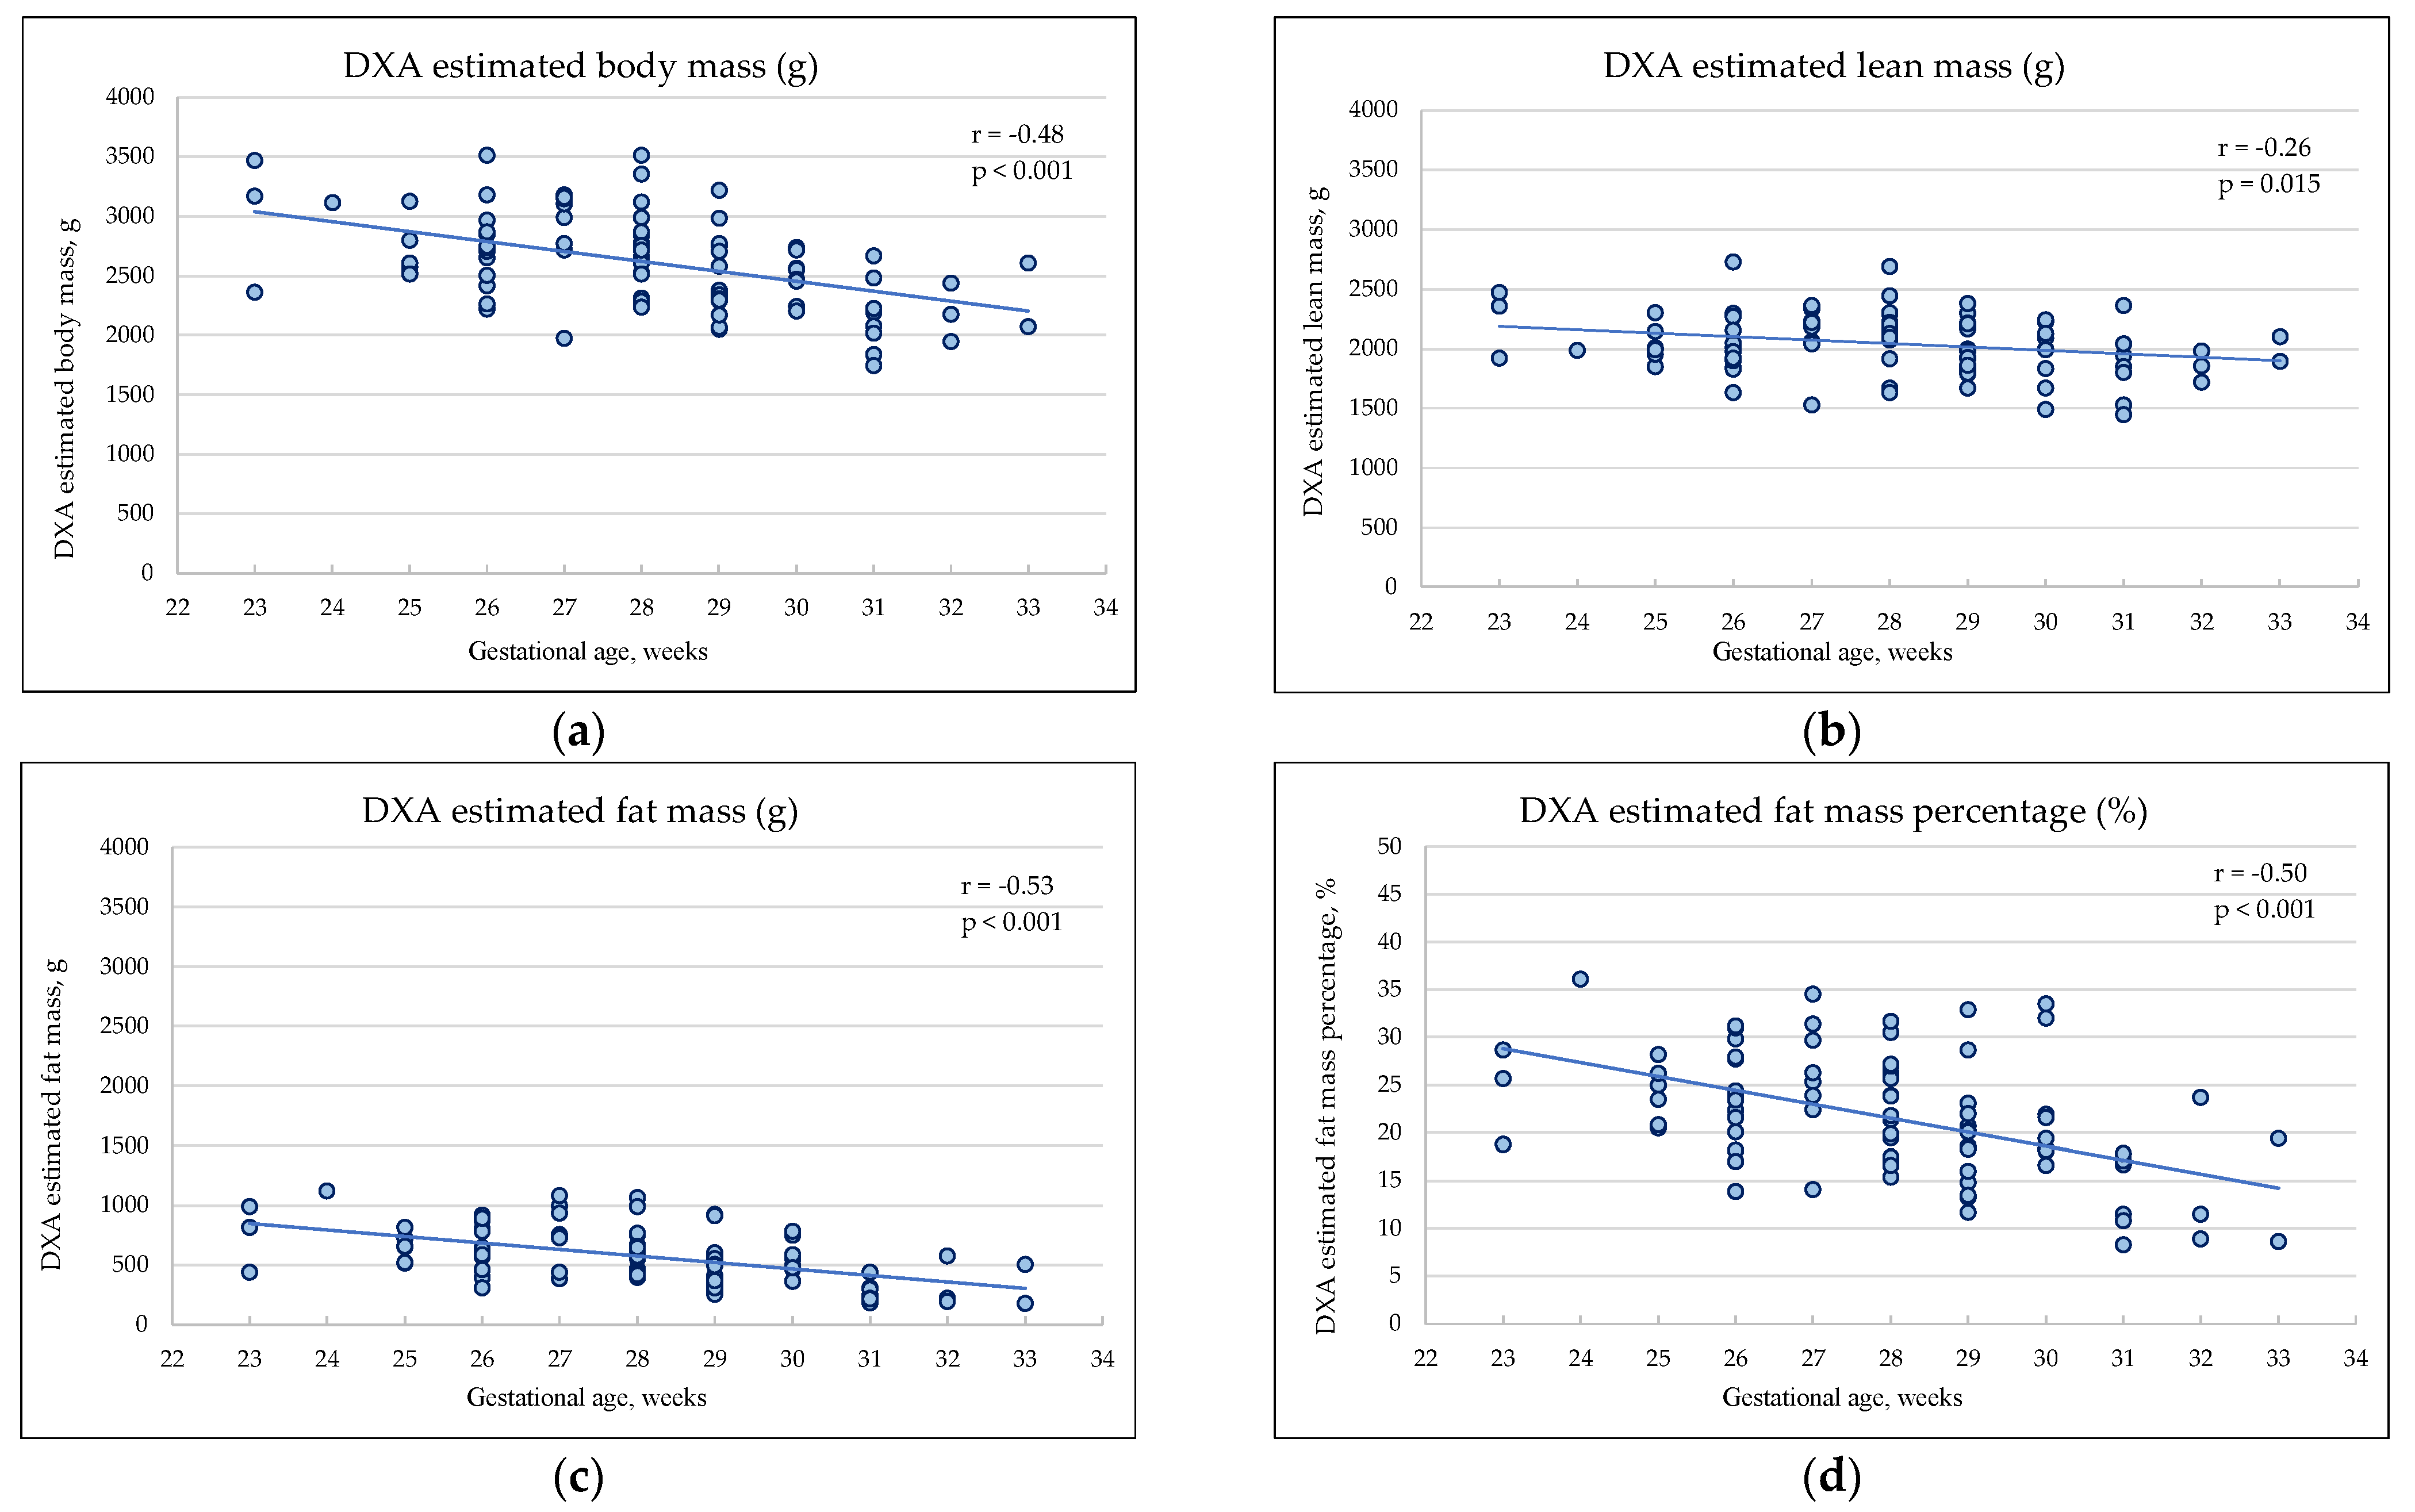

Table 1.
Main demographic characteristics of the infants included into final analysis.
| Characteristics | Extremely Preterm n=32 |
Very Preterm n=54 |
p |
|---|---|---|---|
| Male sex, n (%) | 16 (50.0) | 21 (38.9) | 0.314 |
| Gestational age, weeks | 26 (25–27) | 29 (28–30) | <0.001 |
| Birthweight g, mean (SD) | 878 (±197) | 1267 (±140) | <0.001 |
| Apgar score 1 min | 6 (3–8) | 8 (7–8) | <0.001 |
| Apgar score 5 min | 8 (6–8) | 8 (8–9) | <0.001 |
| Caesarean section, n (%) | 14 (43.8) | 32 (59.3) | 0.163 |
| Multiple pregnancy, n (%) | 5 (15.6) | 18 (33.3) | 0.073 |
| SGA, n (%) | 6 (18.8) | 12 (22.2) | 0.702 |
| Mechanical ventilation, n (%) | 16 (50.0) | 2 (3.8) | <0.001 |
| Sepsis*, n (%) | 18 (56.3) | 7 (13.0) | <0.001 |
| PDA (HS), n (%) | 18 (56.3) | 8 (14.8) | <0.001 |
| BPD, n (%) | 3 (9.4) | 1 (1.9) | 0.143 |
| NEC, n (%) | 0 (0.0) | 1 (1.9) | N/A |
SGA – small for gestational age (Lithuanian national reference, 2023 [24]), PDA (HS) – hemodynamically significant patent ductus arteriosus, BPD – bronchopulmonary dysplasia, NEC – necrotising enterocolitis. *Sepsis – both early and late onset.
Table 2.
Enteral, parenteral, and total daily average nutrient intake in two gestational age groups.
Table 2.
Enteral, parenteral, and total daily average nutrient intake in two gestational age groups.
| Characteristics | Extremely Preterm n=32 |
Very Preterm n=54 |
p |
|---|---|---|---|
| Enteral feeding started, hours | 5 (3–6) | 3 (3–5) | 0.005 |
| Parenteral nutrition, days | 7 (6–9) | 5 (4–6) | <0.001 |
| Fortification started, days | 9 (7–11) | 7 (6–8) | <0.001 |
| Parenteral | |||
| Protein, g/kg/day | 2.3 (2.1–2.7) | 2.0 (1.8–2.3) | <0.001 |
| Carbohydrates, g/kg/day | 7.4 (6.1–8.4) | 6.2 (5.3–6.8) | <0.001 |
| Fat, g/kg/day | 1.5 (1.3–1.8) | 1.5 (1.2–1.8) | 0.712 |
| Energy, kcal/kg/day | 48 (44–56) | 43 (38–47) | 0.003 |
| Enteral* | |||
| Protein, g/kg/day | 3.3 (2.9–3.7) | 3.6 (3.1–3.9) | 0.148 |
| Carbohydrates, g/kg/day | 14.6 (11.5–15.7) | 15.1 (13.8–15.8) | 0.376 |
| Fat, g/kg/day | 5.8 (5.1–7.0) | 5.9 (4.9–6.8) | 0.469 |
| Energy, kcal/kg/day | 129 (112–142) | 131 (122–142) | 0.714 |
| Total | |||
| Protein, g/kg/day | 3.1 (3.0–3.4) | 3.2 (3.0–3.4) | 0.908 |
| Carbohydrates, g/kg/day | 13.4 (11.4–14.1) | 12.9 (12.1–13.8) | 0.655 |
| Fat, g/kg/day | 5.0 (4.6–5.8) | 5.0 (4.4–5.7) | 0.503 |
| Energy, kcal/kg/day | 114 (105–125) | 114 (107–120) | 0.886 |
| Protein/NPE ratio, g/100kcal | 3.1 (3.0–3.4) | 3.1 (2.9–3.4) | 0.872 |
NPE – non-protein energy. *Due to lack of mother’s milk composition data during the first week, enteral intakes from both own mother’s and donor milk are calculated for weeks 2–4.
Table 3.
Main differences in body composition estimates between two groups, given as median and interquartile ranges and means and standard deviations.
Table 3.
Main differences in body composition estimates between two groups, given as median and interquartile ranges and means and standard deviations.
| Characteristics | Extremely Preterm n=32 |
Very Preterm n=54 |
p |
|---|---|---|---|
| CGA at the DXA scan, weeks |
36 (35–36) | 35 (34–36) | 0.007 |
| Chronological age on DXA scan, weeks | 10 (9–11) | 6 (4–7) | <0.001 |
| Weight on the DXA day, g |
2558 (± 354) | 2284 (± 358) | <0.001 |
| Length on the DXA day, cm | 46.0 (± 1.9) | 45.3 (± 2.0) | 0.074 |
| DXA estimated total mass, g | 2786 (± 374) | 2512 (± 371) | 0.001 |
| DXA estimated lean mass, g |
2086 (± 246) | 2012 (± 249) | 0.188 |
| DXA estimated fat mass, g | 700 (± 212) | 500 (± 209) | <0.001 |
| DXA estimated fat mass percentage, % | 24.8 (± 5.4) | 19.4 (± 6.4) | <0.001 |
| Skinfold thickness sum at DXA scan day, mm | 17.8 (±2.6) | 15.9 (±2.9) | 0.004 |
| Skinfold thickness sum at 12 months of CA, mm | 26.9(±5.5) | 26.3(±4.6) | 0.661 |
CGA – corrected gestational age, CA – corrected age, DXA – dual X-ray absorptiometry.
Table 4.
Associations between early nutrient intake and body composition indices estimated by DXA at discharge and sum of SFT at 12 months of CA.
Table 4.
Associations between early nutrient intake and body composition indices estimated by DXA at discharge and sum of SFT at 12 months of CA.
| Extremely Preterm, n=32 | ||||||||||
|---|---|---|---|---|---|---|---|---|---|---|
| DXA mass, g | DXA LM, g | DXA FM, g | DXA FM, % | ∑ SFT, mm | ||||||
| R2=0.207 | R2=0.250 | R2=0.096 | R2=0.066 | R2=0.192 | ||||||
| βs | p | βs | p | βs | p | βs | p | βs | p | |
| Protein, g/kg/day | 0.027 | 0.923 | -0.049 | 0.858 | 0.106 | 0.726 | 0.125 | 0.685 | -0.274 | 0.373 |
| Carbohydrates, g/kg/day | -0.148 | 0.627 | 0.021 | 0.942 | -0.287 | 0.381 | -0.297 | 0.373 | 0.361 | 0.287 |
| Fat, g/kg/day | 0.411 | 0.080 | 0.331 | 0.143 | 0.340 | 0.170 | 0.226 | 0.364 | 0.145 | 0.559 |
| Sex | -0.327 | 0.114 | -0.475 | 0.022 | -0.026 | 0.906 | 0.150 | 0.496 | -0.103 | 0.629 |
| Gestational age, weeks | -0.272 | 0.239 | -0.305 | 0.177 | -0.126 | 0.604 | -0.006 | 0.981 | 0.221 | 0.379 |
| Very preterm, n=54 | ||||||||||
| DXA mass, g | DXA LM, g | DXA FM, g | DXA FM, % | ∑ SFT, mm | ||||||
| R2=0.411 | R2=0.298 | R2=0.410 | R2=0.375 | R2=0.163 | ||||||
| βs | p | βs | p | βs | p | βs | p | βs | p | |
| Protein, g/kg/day | 0.099 | 0.558 | 0.207 | 0.262 | -0.072 | 0.670 | -0.196 | 0.261 | -0.248 | 0.344 |
| Carbohydrates, g/kg/day | -0.186 | 0.280 | -0.094 | 0.617 | -0.218 | 0.207 | -0.169 | 0.341 | -0.087 | 0.736 |
| Fat, g/kg/day | 0.198 | 0.126 | -0.062 | 0.657 | 0.424 | 0.002 | 0.455 | 0.001 | 0.406 | 0.021 |
| Sex | -0.370 | 0.002 | -0.400 | 0.003 | -0.179 | 0.127 | -0.057 | 0.632 | 0.089 | 0.565 |
| Gestational age, weeks | -0.460 | <0.001 | -0.268 | 0.035 | -0.495 | <0.001 | -0.461 | <0.001 | -0.037 | 0.807 |
LM – lean mass, FM – fat mass, ∑ SFT – sum of skinfold thickness at 12 months of CA.
Disclaimer/Publisher’s Note: The statements, opinions and data contained in all publications are solely those of the individual author(s) and contributor(s) and not of MDPI and/or the editor(s). MDPI and/or the editor(s) disclaim responsibility for any injury to people or property resulting from any ideas, methods, instructions or products referred to in the content. |
© 2024 by the authors. Licensee MDPI, Basel, Switzerland. This article is an open access article distributed under the terms and conditions of the Creative Commons Attribution (CC BY) license (http://creativecommons.org/licenses/by/4.0/).
Copyright: This open access article is published under a Creative Commons CC BY 4.0 license, which permit the free download, distribution, and reuse, provided that the author and preprint are cited in any reuse.


