1. INTRODUCTION
Concrete is one of the most widely used building materials due to its simplicity and availability, and cement is an expensive material used in its production (Neville and Brooks 1987). Approximately 4.3 gigatons of cement were produced in 2020, according to the International Energy Agency (IEA). Carbon dioxide emissions due to cement production have increased by 1.8% every year from 2015 to 2020 (Cheah et al. 2023). Cement production requires a significant amount of natural resources and energy, which significantly impacts the environment due to harmful gas emissions. Approximately 600 kg of cement production releases 400 kg of carbon dioxide (Mangi et al. 2019); therefore, finding a binding material to replace cement is critical for long-term sustainability.
Coal bottom ash (CBA) and coal boiler slag (CBS) are byproducts of coal-fired power plants. The properties of these byproducts depend on the furnace type used by the power plant (FHWA 2016). The oven-dried CBA or CBS are mechanically ground to obtain Ground Coal Bottom Ash (GCBA) or Ground Coal Boiler Slag (GCBS), the physical properties of which vary by fineness. GCBA has good pozzolanic properties, which increase as the fineness increases (Arun et al. 2020).
Pozzolanic materials are used to partially replace Ordinary Portland Cement (OPC) in concrete or mortar. Pozzolanic properties depend on the physical and chemical properties of the pozzolanic materials (Abdulmatin et al. 2018). Calcium Silicate Hydrate (C-S-H) and Calcium Hydroxide (Ca(OH)2) are the products of Portland cement hydration. Approximately 50% C-S-H and 15% to 25% calcium hydroxide are typically found in hydrated Portland cement paste. C-S-H, often referred to as glue or gel, is the primary cementitious binder in hardened Portland cement concrete. Calcium hydroxide possesses fewer cementitious qualities and does not significantly increase the concrete's strength. The pozzolanic material reacts with the calcium hydroxide to form additional C-S-H gels. This C-S-H composition may differ from Portland cement hydration; however, it increases the concrete's strength and decreases its permeability (Kosmatka and Wilson 2016).
Only 41% percent of the CBA and 61% of the CBS produced were utilized in 2021 (Kim and Lee 2011). CBA is generally disposed of in landfills and ponds, contaminating the water source (ACAA 2021). Using these materials as cementitious materials will reduce waste in landfills, preserve natural resources, reduce health hazards, and benefit the economy (Khan and Ganesh 2016). Fly ash is currently used as partial cement replacement in concrete because of its pozzolanic properties, which improve the durability and strength of concrete (Gedafa and Tolliver 2016). Very few studies have focused on using GCBA as a cement replacement; therefore, this study examined using GCBA or GCBS as a cement replacement, which is possible due to its pozzolanic properties that improve concrete durability and mechanical properties (Arun et al. 2020, Gedafa and Tolliver 2016, Cheriaf et al. 1999, Jaturapitakkul and Cheerarot 2003).
Concrete that has cement replaced with coal byproducts has low early-age compressive strength due to the slower hydration of those particles; therefore, nanomaterials were added to increase the concrete’s early strength. Nanomaterials can enhance concrete's mechanical and durability properties by allowing it to produce more C-S-H gel and improving the pore structure. Adding GCBA and nanomaterials enhances the concrete’s early strength and improves concrete infrastructure sustainability (Poudel 2023, Shaikh et al. 2014).
1.1. Objectives of the Study
This study aimed to:
- 1)
Determine the optimum amount of GCBA or GCBS that could be used as a cement replacement, with and without nanomaterials, by comparing these concretes’ compressive strength to a cement-based control.
- 2)
Evaluate the effects of replacing cement with optimum amounts of GCBA or GCBS on the fresh, mechanical, and durability properties when compared to the control.
- 3)
Assess the impacts of the GCBA and GCBS properties on flow, water requirements, strength activity index (SAI), and compressive strength of a mortar.
2. MATERIAL AND METHODOLOGY
2.1. Experimental Plan
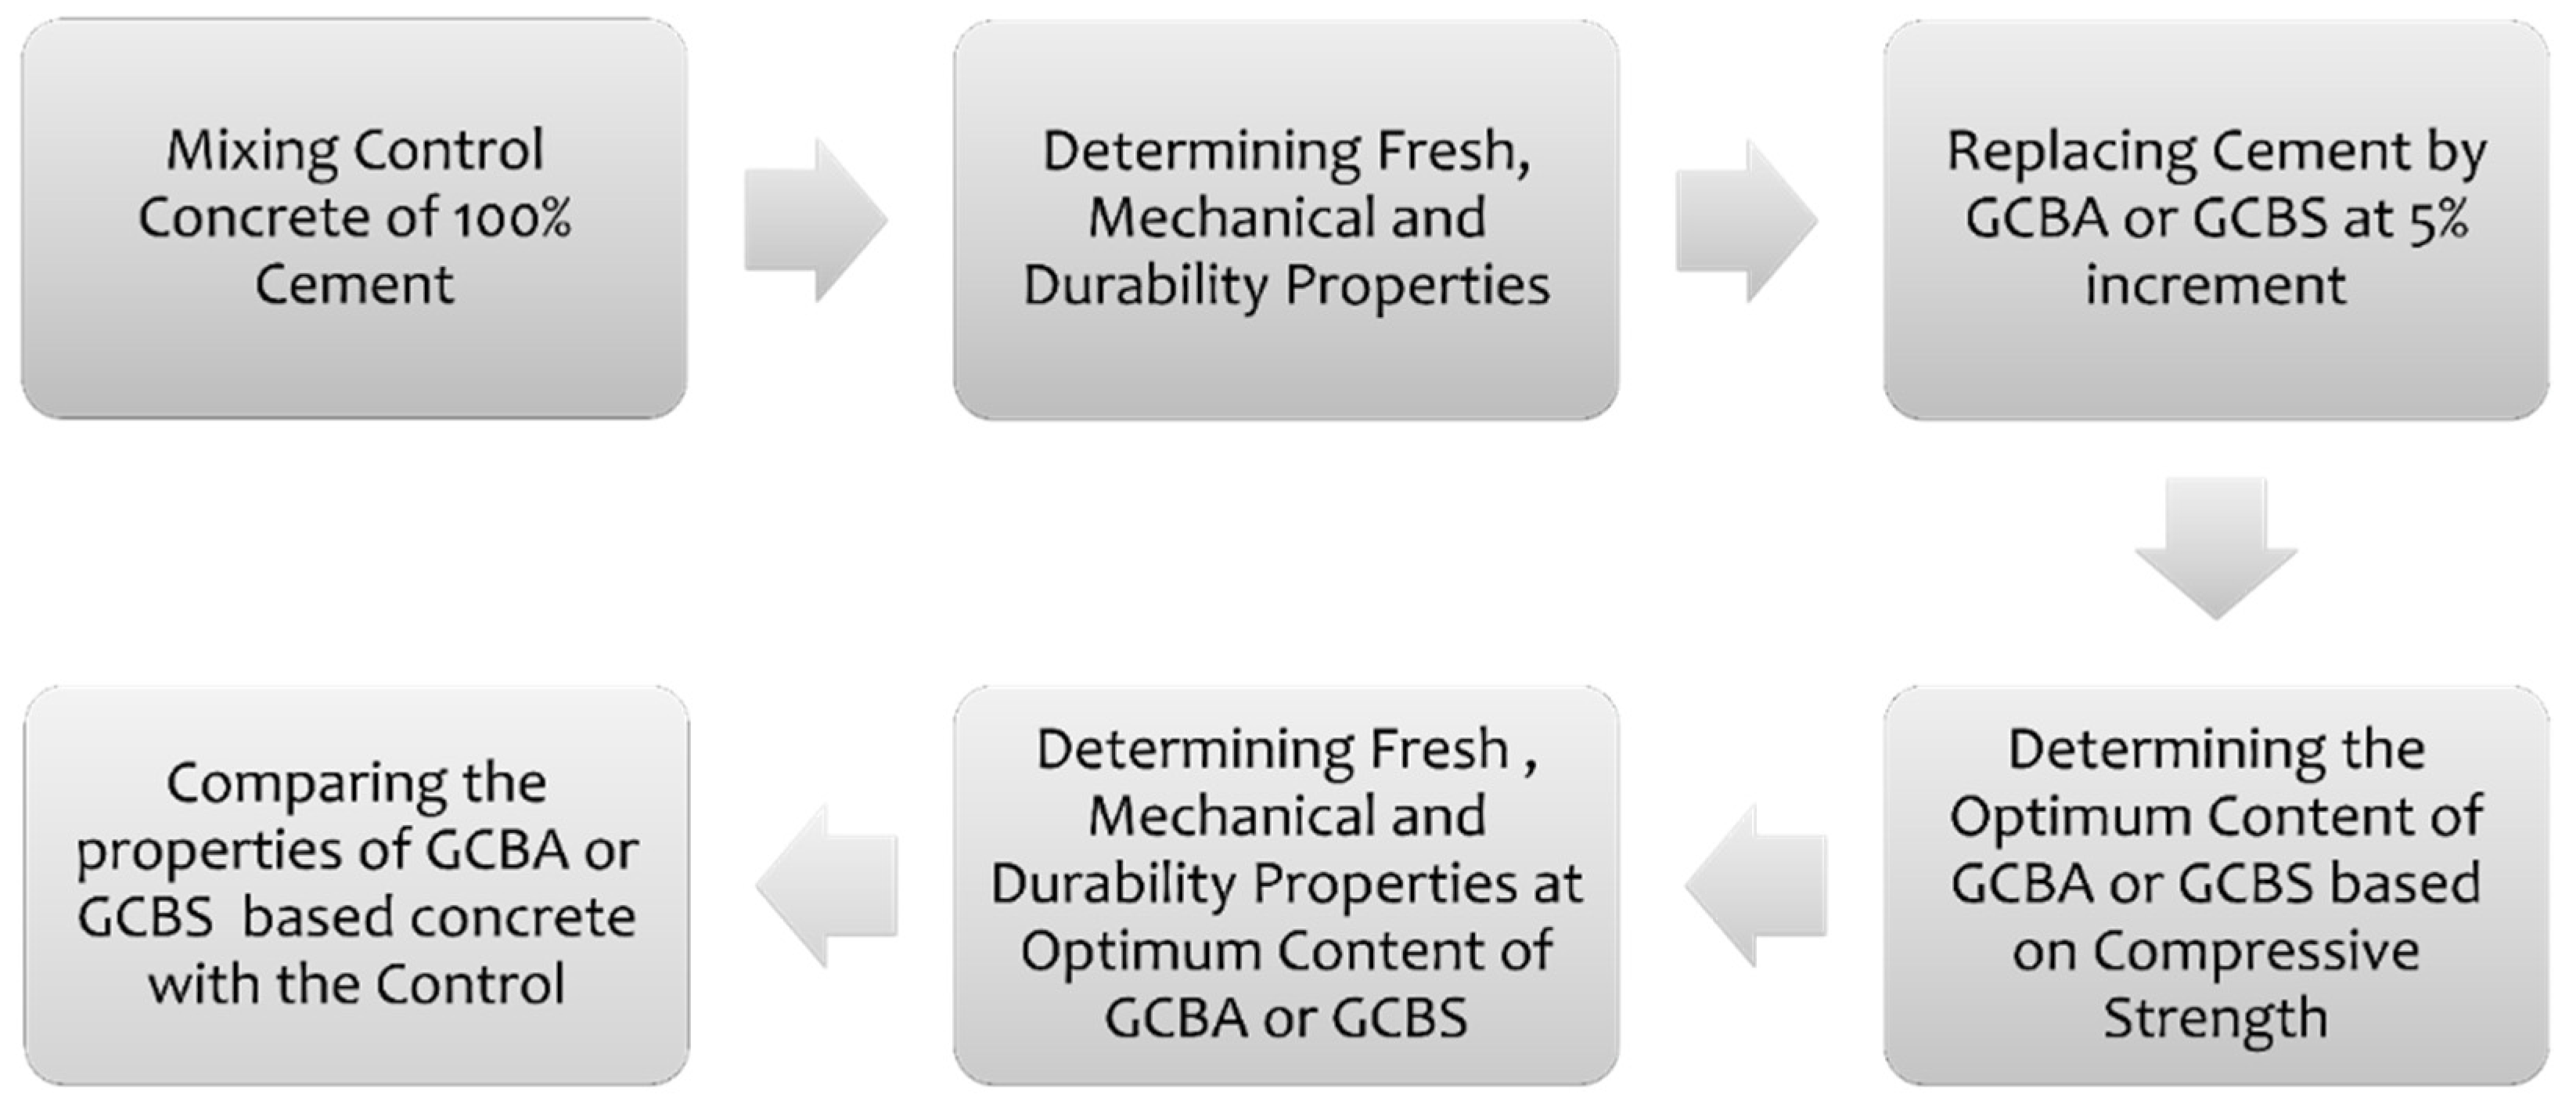
The experimental plan is illustrated in
Figure 1. Cement-based concrete (control) was first mixed and tested for its fresh properties, mechanical properties, and durability. The compressive strength was then evaluated after replacing cement with GCBA or GCBS in 5% increments. The optimum GCBA replacement amount was the concrete that exhibited a compressive strength comparable to or greater than the control. The fresh, mechanical, and durability properties were evaluated. Nano clay was also used to replace cement in increments of 0.5%, and the optimum content was determined. The properties of the GCBA and GCBS-based concrete with and without nano clay were compared to the control.
2.2. Material
Fine and Coarse Aggregate, CBA, and CBS
Kost Materials and Strata Corporation provided Holcim Type I Portland Cement, fine aggregate, and coarse aggregate. The companies also provided information on their coarse aggregate and fine aggregate physical properties, such as fineness modulus, specific gravities, and absorption. The lab measured the same properties following the American Society for Testing and Materials (ASTM) and American Association of State Highway and Transportation Officials (AASHTO) standards. The results were similar to those provided by the companies (
Table 1). Specific gravity and absorption were measured in accordance with the AASHTO T 84 standard for fine aggregates and the AASHTO T 85 standard for coarse aggregates. The fineness modulus of the fine aggregate was calculated following the ASTM C136 standard.
Four power plant stations supplied coal byproducts for the project. Great River Energy (Coal Creek Station) and Basin Electric Power Cooperative (Leland Olds Power Plant) supplied CBA, and Minnkota Power Cooperative (Milton R. Young Power Plant) and Otter Tail Power Company (Coyote Station) supplied CBS. The physical properties of the CBA and CBS were determined using the standards for fine aggregates. The physical properties of the CBA and CBS were similar to the fine aggregates (
Table 1). The absorption of the CBA was higher than that of the CBS due to its porous nature. The specific gravity of the CBS was higher than the CBA since it is denser and glassier.
Figure 2 depicts the CBA and CBS with their respective GCBA and GCBS.
GCBA and GCBS
The physical properties of the cement, GCBA, and GCBS, including Sieve No. 325 fineness, Blaine Fineness, and Specific Gravity, were determined in the lab following the ASTM C40, ASTM C204, and ASTM C188 standards, respectively (
Table 2). Two companies ground the CBA and CBS, denoted as 1 and 2. CC1 and CC2 were designations given to the GCBA received from the Coal Creek Station, which was ground by Company 1 and Company 2, respectively. L1 and L2 denote the GCBA received from the Leland Olds Station, ground by Company 1 and Company 2, respectively. Similarly, MR1 and MR2 denote the GCBS received from the Milton R. Young Station, and CO1 and CO2 denote the GCBS received from the Coyote Station. These acronyms are also used for the mortar based on each material.
Ecomaterial Technologies provided the chemical properties of the GCBA and GCBS. The cement supplier provided the chemical properties of the cement. The research team determined the loss on ignition (LOI) and moisture content of the GCBA and GCBS following the ASTM C311 standard. The LOI value for the GCBA from the Leland Old Station was high, whereas it was negative for the GCBS from the Coyote and MR Young Stations. The negative LOI value for the GCBS could be because of the oxidation of magnetite to hematite when heating at 750 °C, which increases the weight instead of decreasing it
(Vandenberghe et al. 2010). The oxidation of the sulfur present in the slag could be the reason for the negative LOI
(Zhang et al. 2022). The chemical properties, LOI, and moisture content are listed in
Table 2. The LOI for the GCBA from the Leland Old Station was 9.8%, which does not meet the chemical requirement criteria for fly ash: less than 6% as per the ASTM C618 standard. GCBA and GCBS fineness is dependent on the grounding process. The Sieve No. 325 fineness for the GCBA and GCBS, except the L1 sample from the Leland Old Station ground by Company 1 and the CO1 sample from the Coyote Station ground by Company 1, failed to comply with the minimum requirements for the fly ash class, in accordance with the ASTM C618 standard.
2.3. Mix Design
Mortar Mix Design
The mortar mix design was adopted from the ASTM C311 standard. GCBA and GCBS replaced 20% of the cement by weight. Graded standard sand was used as the fine aggregate. The water required for the GCBA-based mortar depends on the mortar’s flow. The mortar’s flow should be in the range of ±5 of the control; therefore, 242 ml of water was used for the cement mortar following the ASTM standard.
Mix Design of Concrete and Mixing
Mix design information was provided by the companies who provided the materials. The research team also adjusted this design after the trial mix. The control mix contained coarse aggregates, fine aggregates, cement, water, and air-entraining admixture. The GCBA or GCBS content was increased at a rate of 5% to replace cement by weight to reach the optimum content. GCBA or GCBS was used to replace the weight of the cement to maintain the same water-to-cement ratio, keeping the water-to-cement ratio constant at 0.45 for the Strata mix and 0.42 for the Kost mix. The mix design was corrected for aggregate moisture before mixing. The suppliers provided fine and coarse aggregate properties, which were also tested by the laboratory, with similar results (
Table 2). The properties from the suppliers were used to perform moisture corrections since the aggregate samples they used were more representative of the source.
Table 3 lists the Strata and Kost mix designs used for one cubic yard of concrete. The concrete was mixed following the AASHTO R39-19 standard using a mechanical mixer. Only one mixer was used during the project to reduce the variability caused by mixer rotation.
2.4. Testing
Mortar Flow and Compressive Strength
The mortars’ compressive strength was tested following the ASTM C109 standard. Mortar flow was measured using the ASTM C1437 standard after mixing, according to the procedure given by ASTM C305. The mortar was then mixed for 15 seconds at medium speed, and mortar cubes were created following the ASTM C109 standard. The cubes were kept in a moist room immediately after casting, removed from the mold after 24 hours, and cured in saturated lime water. The mortar cubes were tested for compressive strength after 7 and 28 days of curing using a Universal Testing Machine (UTM). The strength capacity index and water requirements were only computed once the flow of the mix containing 20% GCBA was within ±5 of the control, in accordance with ASTM C311.
Fresh Properties of Concrete
Fresh properties, such as slump, air content, and unit weight, were measured after the concrete was mixed. A Super Air Meter was used to measure the air content using the pressure method following AASHTO TP118. Air content is the key factor for determining a concrete’s resistance to freezing and thawing. An increase in air content can lower compressive strength; therefore, it is necessary to maintain an appropriate air content for strength and durability. Slump was measured according to ASTM C143M using the slump cone test. The unit weight of the fresh concrete was measured following ASTM C138M. The control mix’s fresh properties were compared to the GCBA-based concrete to analyze the effect of replacing concrete with GCBA.
Mechanical Properties of Concrete
Cylindrical specimens 4-inches in diameter by 8-inches in length were cast to test the compressive strength, splitting tensile strength, modulus of elasticity (MOE), and Poisson’s ratio following AASHTO R39 using a UTM after 7, 28, 56, and 90 days of curing. All specimens were moist cured in the curing room following the AASHTO R39 standard. Compressive strength was tested following AASHTO T22 M/T, the splitting tensile strength was tested following AASHTO T 198, and MOE and Poisson’s ratio were determined according to the ASTM C469 standard. Flexural strength was determined following the AASHTO T97 standard. Beam specimens sized 6 inches * 6 inches * 21 inches were cast according to the AASHTO T23 standard.
Durability Properties of Concrete Using the Rapid Chloride Permeability Test (RCPT)
The concrete's permeability to chloride ions was measured using the Rapid Chloride Permeability Test (RCPT) following the ASTM C1202 standard. The RCPT test was conducted after 28 and 56 days of curing. The test assesses the concrete’s susceptibility to chloride ions, an important aspect when predicting the likelihood of steel reinforcement corrosion. The test’s findings are reported in coulombs, reflecting the total charge applied to the concrete during the test.
3. RESULTS AND DISCUSSIONS
3.1. Mortar
Flow, Water Requirement, and Strength Activity Index (SAI)
Table 4 lists the values for the Strength Activity Index (SAI), flow, and water requirements for the GCBA and GCBS samples. The 7- or 28-day SAI should be a minimum of 75% for fly ash use in concrete, as per ASTM C618. The GCBA or GCBS SAI is the percentage of compressive strength compared to the control. Only CC1, L1, L2, and CO1 met the SAI requirements. The water requirements, as specified in ASTM C618, are a maximum of 105% for Class C and Class F fly ash, which was met by all GCBA and GCBS samples. The water needs for the L1 and L2 samples were greater than the other GCBA and GCBS samples (
Table 4), possibly because L1 and L2 had high LOI values of approximately 9.8%. A high LOI value implies a significant percentage of unburned carbon content, which absorbs water around the GCBA particles
(Kim 2015). L1 and L2 were also finer materials than the other GCBA and GCBS materials, indicating a higher surface area, which increases the water demand for the pastes. The water requirements for the CC1 and CC2 samples were reduced to 99.2% compared to the control. The water requirements for the MR1, MR2, CO1, and CO2 samples were 100%, but the flow was higher than the control for the same amount of water. The fineness of all GCBA and GCBS samples was lower than the cement (
Table 2), indicating less surface area and water required for workability. The LOI values for these GCBA and GCBS samples were also less than 1.5%, indicating less unburned carbon.
Mortar Compressive Strength
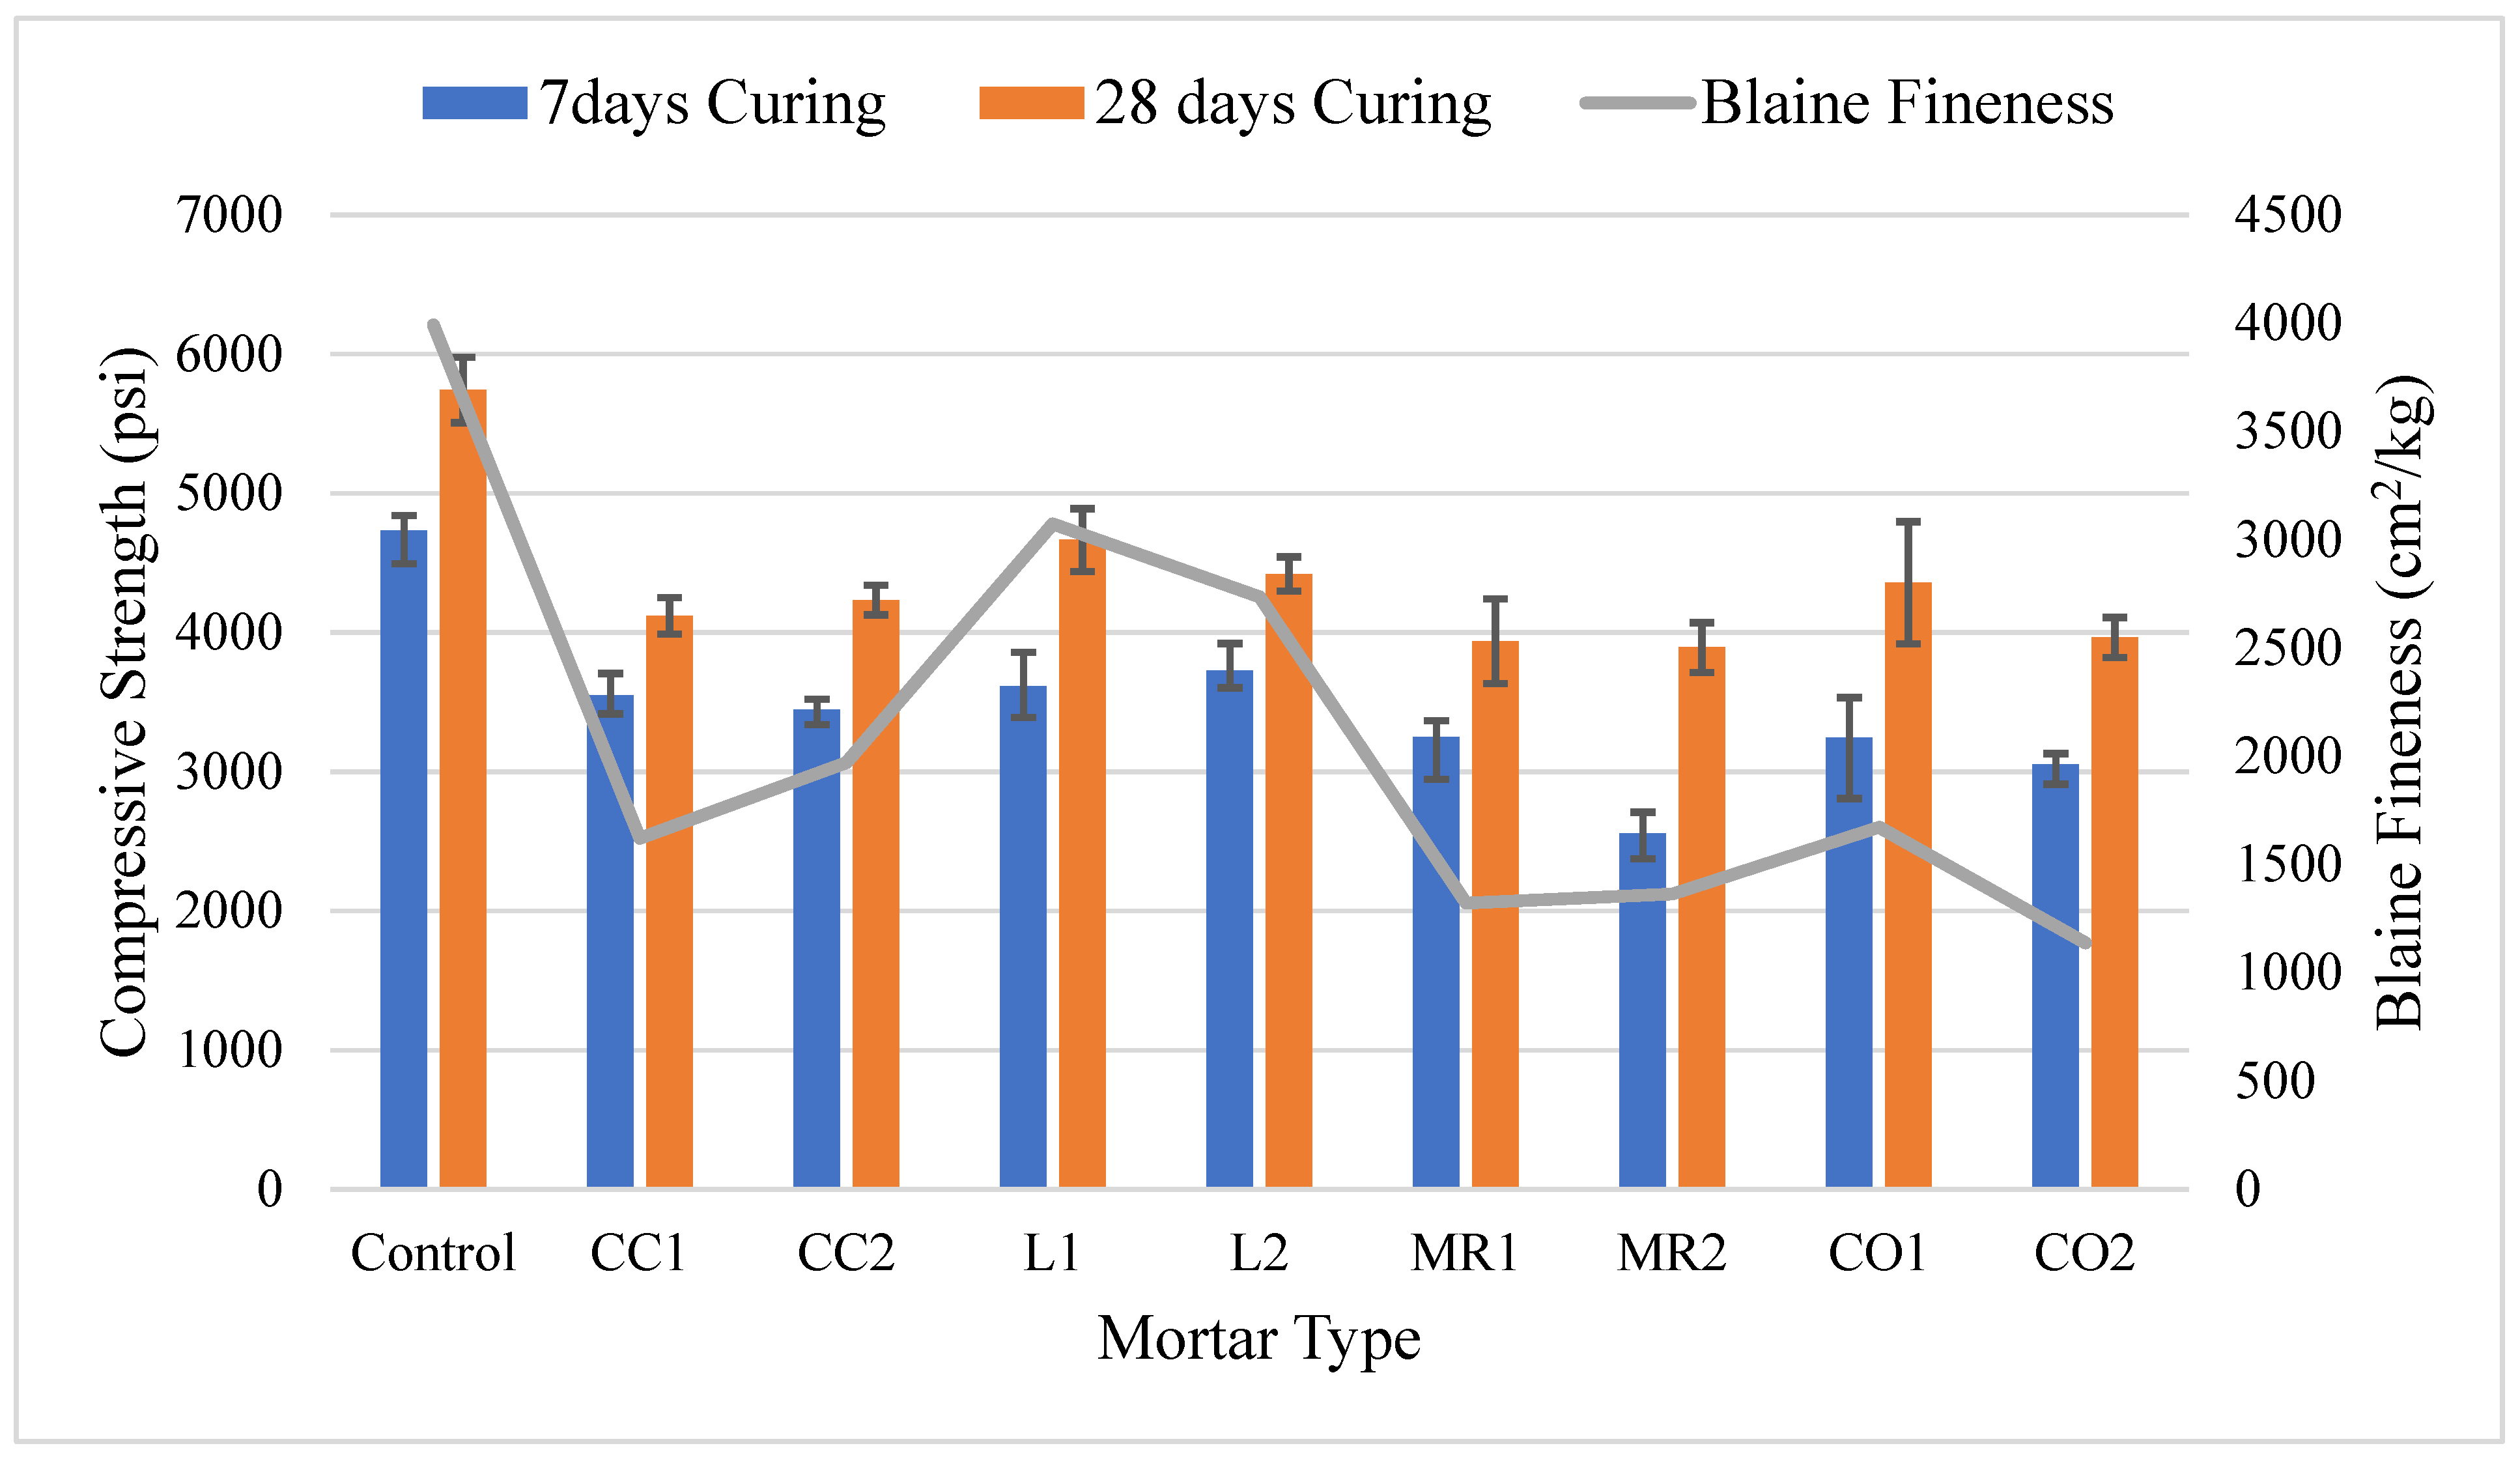
Figure 3 depicts the mortar’s compressive strength and the Blaine fineness for all GCBA and GCBS samples. The control’s compressive strength was always higher than the GCBA or GCBS-based mortar. The L1 sample had the highest compressive strength compared to all other GCBA and GCBS samples. The L1 sample was also the finest material among all other GCBA and GCBS samples. The specific gravity of the CBA sample from the Leland Station was the lowest, with a value of 2.11, which indicates it was a weaker material and easier to grind than other CBA and CBS samples. These results indicate that the compressive strength of the GCBA and GCBS-based mortars is directly related to the material’s fineness.
The MR2 sample had the lowest compressive strength compared to all other GCBA and GCBS samples. The MR2 sample’s fineness was higher than the CO2 samples; however, the MR2 sample’s chemical composition revealed a lower amount of CaO than CO2, which could be the reason for the mortar’s low early strength after 28 days. The MR1 sample had a high compressive strength compared to the MR2 sample after 7 and 28 days of curing; however, the percentage increase in compressive strength was 17.5%, whereas it was 34.4% for MR2. The compressive strength of the MR1 and MR2 samples was nearly the same after 28 days. The Blaine fineness properties for MR2 were finer than MR1 (
Table 2). These results indicate that MR2 could possess better pozzolanic qualities than MR1, despite the lower compressive strength at 7 and 28 days.
The CC2 sample had a lower compressive strength than the CC1 sample after 7 days of curing; however, the compressive strength of the CC2 sample was higher than the CC1 sample after 28 days of curing. The CC1 sample’s percentage increase in compressive strength from 7 to 28 days of curing was 13.9%, whereas the increase was 18.6% for CC2. The Baine fineness for the CC2 sample was finer than CC1. GCBA fineness is a critical property for boosting pozzolanic reactions. The pozzolanic reactions were minimal after 14 days of curing but rose after 28 days (Cheriaf et al. 1999). The chemical composition was the same for the CC1 and CC2 samples; however, the differences in material fineness resulted in a variation in compressive strength.
The L1 sample exhibited lower compressive strength than the L2 sample after 7 days of curing; however, the compressive strength was better after 28 days. The L1 sample’s percentage increase in compressive strength from 7 to 28 days of curing was 22.5%, whereas it was 15.7% for L2. The Blaine fineness and Sieve No. 325 fineness properties were finer for L1 than L2. These results are similar to the mortar based on the GCBAs from the Coal Creek Station. The compressive strength of the mortar increased after 7 days of curing, which is expected since the pozzolanic reactions are directly related to fineness (Kim 2015).
The CO1 sample had a much higher compressive strength than the CO2 sample after 7 and 28 days of curing. The CO1 sample’s percentage increase in compressive strength from 7 to 28 days of curing was 25.5%, whereas it was 22.9% for CO2. The CO1 sample was significantly finer than the CO2 sample. The fineness of the CO1 sample boosted the pozzolanic reaction, which raised the mortar’s compressive strength.
3.2. Concrete
Optimum GCBA and GCBS Content
GCBA from the Coal Creek (CC1) and Leland Olds Stations (L1), and GCBS from the MR Young (MR1) and Coyote Stations (CO1) were used to partially replace cement for the Strata mix design project. The Coal Creek GCBA-based concrete was evaluated by making a small control mix of 0.3 ft
3 following the Strata mix design to make cylindrical specimens for 7-day compressive strength testing. The compressive strength of the GCBA-based concrete after 7 days of curing was the only value used to discover the optimum amount since it exhibits superior compressive strength at later ages due to an increase in pozzolanic reaction. Cement was then replaced with GCBA in 5% increments, after which 0.3 ft
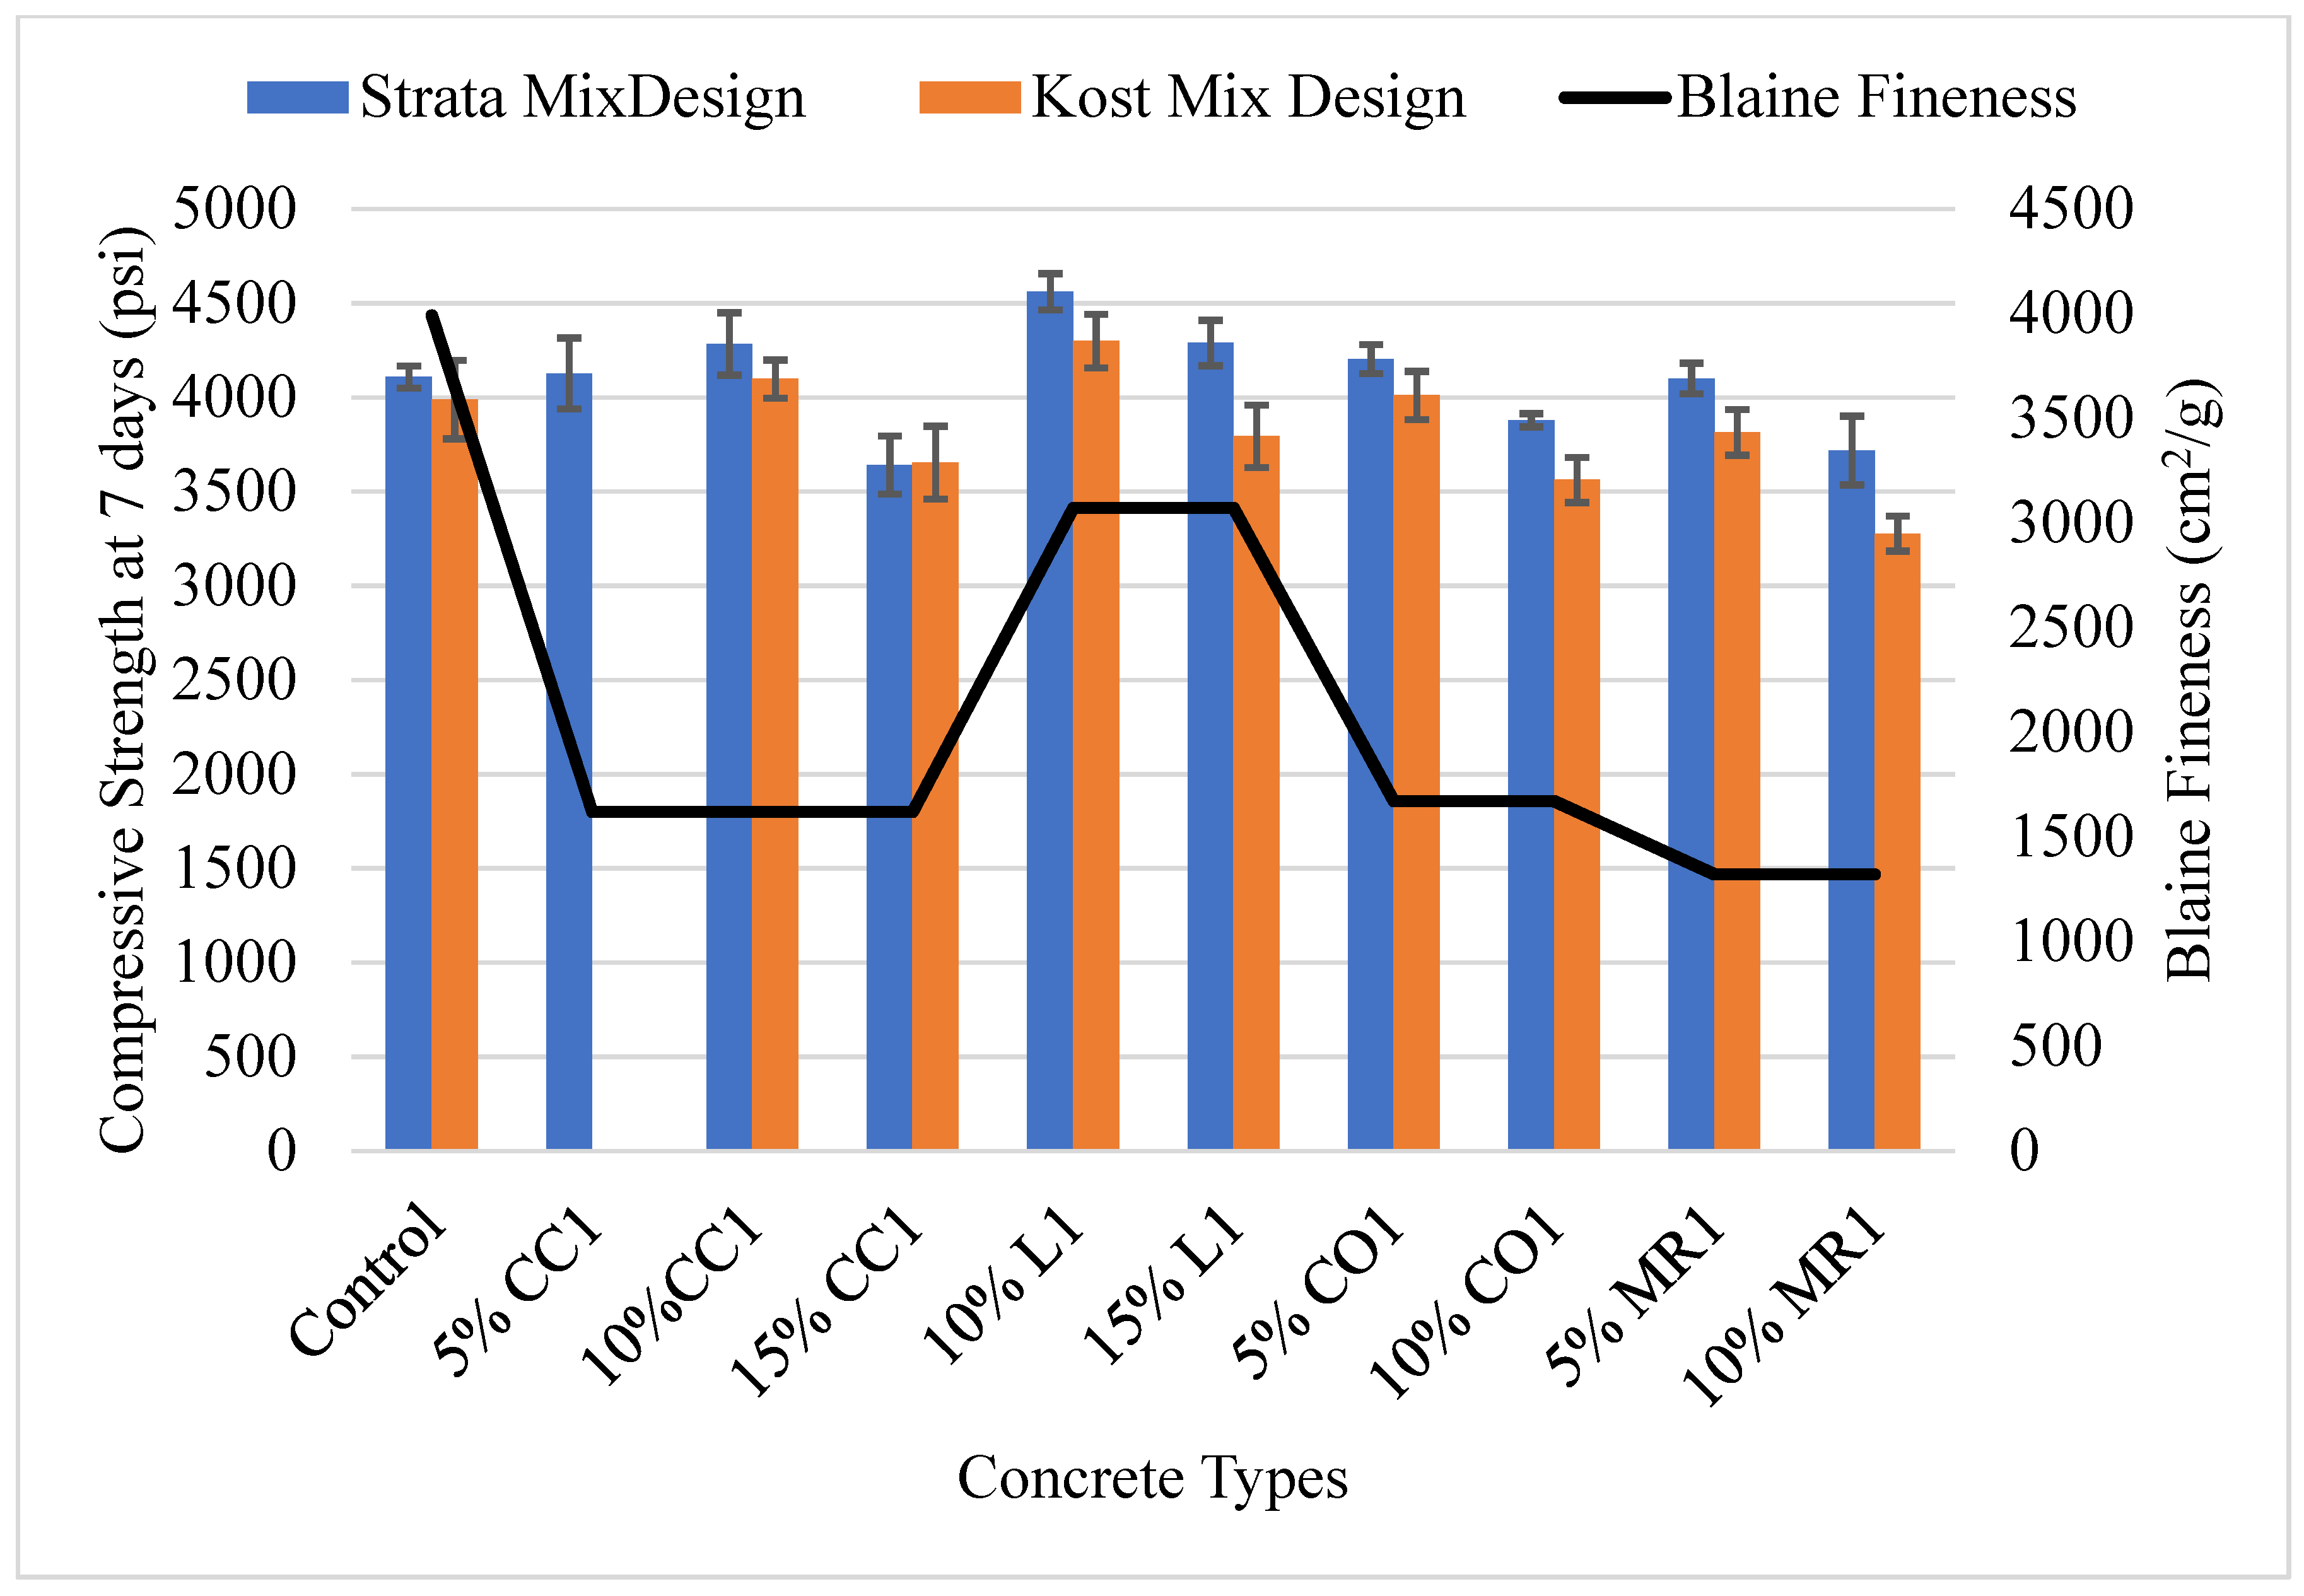
3 of concrete was made for every increment because the compressive strength could vary for different volumes of concrete mix. The specimens were tested for compressive strength, and the optimum GCBA content was determined. The optimum GCBA content was established as the mix with a compressive strength comparable to or greater than the control. The optimum content for the Coal Creek GCBA (CC1) sample was determined, then the other GCBA and GCBS-based concretes were mixed to determine the optimum content. The compressive strength of the CC1 concrete increased when 10% of the cement was replaced but decreased at 15%; therefore, the optimum content was established as 10%. The concrete also exhibited better compressive strength than the control at 10%.
Figure 4 illustrates the 7-day compressive strength for all GCBA and GCBS-based concretes and the Blaine fineness for the Strata and Kost mix designs.
The optimum content for the Strata CC1 mix was 10%; therefore, GCBA and GCBS cement replacement began at 10% and was changed to either 5% or 15% based on the 10% compressive strength result. The compressive strength of the L1 sample containing 10% cement replacement was the highest. The MR1 sample had the lowest compressive strength, at 10%. The L1 sample’s optimum content was established as 15% because the compressive strength was still higher than the control. The optimum replacement for the MR1 and CO1 samples was established as 5% since increasing the substitution to 10% did not improve the concrete's compressive strength beyond the control. The Blaine fineness of the CO1 and CC1 samples was similar; however, the compressive strength for CC1 at 10% was higher than CO1. These results indicate that GCBA is more reactive than GCBS.
A 0.3 ft3 volume Kost mix control was mixed. The optimum content of the samples created using the Strata mix and Coal Creek GCBA was approximately 10%; therefore, the research team began the Kost experiments by replacing 10% of the cement with GCBA or GCBS and then changed the amounts to 5% or 15%. The MR1 and CO1 GCBS materials were used to replace cement in 5% increments since their compressive strength at 10% replacement was lower than the control. The compressive strength when using L1 to replace 10% of the cement was the highest compared to all other GCBA and GCBS samples. The lowest compressive strength was recorded for the MR1 sample at 10%. The optimum content for L1 was established as 10%. Substituting 10% of the cement with MR1 and CO1 did not improve the concrete's compressive strength beyond the control; therefore, the optimum quantity was determined as 5%.
Fresh Properties of the Mixes Based on Optimum GCBA and GCBS
Specimens were prepared for all mechanical and durability tests once the optimum content was determined for the CC1 mix. This mix was similar in volume to the control mix. The fresh properties, such as slump, unit weight, and air content, were determined.
Table 5 lists the fresh properties of the control mixes and those containing 10% CC1. The optimal Strata and Kost mixes’ air content and slump values were lower than the control, and the unit weight was higher.
Compressive Strength Comparison Based on Optimum GCBA and GCBS
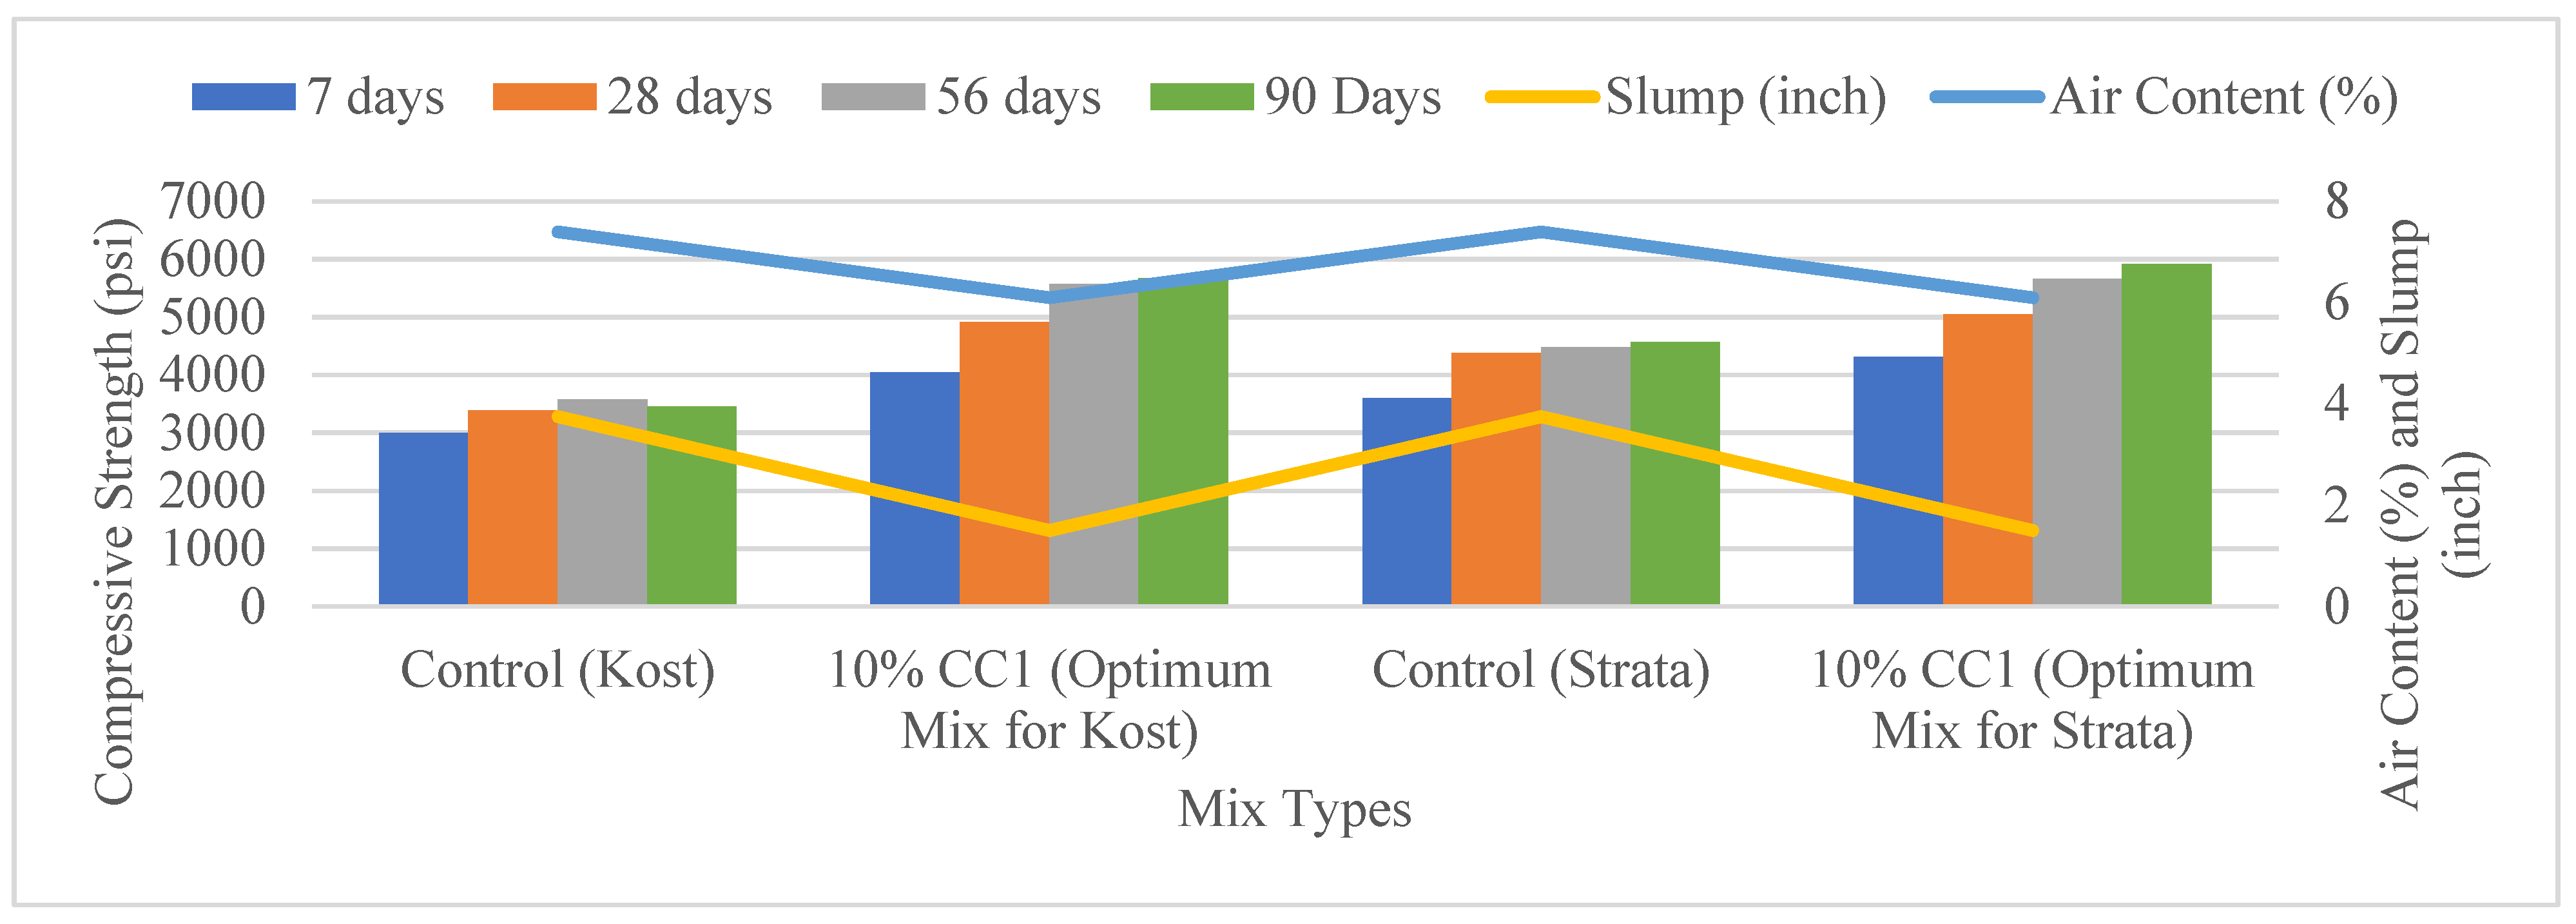
Figure 5 compares the compressive strength of the control to the compressive strength of the Coal Creek GCBA-based Strata and Kost concretes containing 10% GCBA. The two lines in the figure represent the slump and air content. The compressive strength of the concrete containing 10% CC1 was higher than the control after 7, 28, 56, and 90 days of curing. The workability and air content for both mixes with optimum CC1 content were lower than the control. Compressive strength decreases by 5% – 6% when air content is increased by 1%
(Kosmatka and Wilson 2016); therefore, the higher compressive strength of the GCBA-based concrete can be attributed to the decrease in air content and workability.
Comparison of Splitting Tensile Strength Based on Optimum GCBA and GCBS
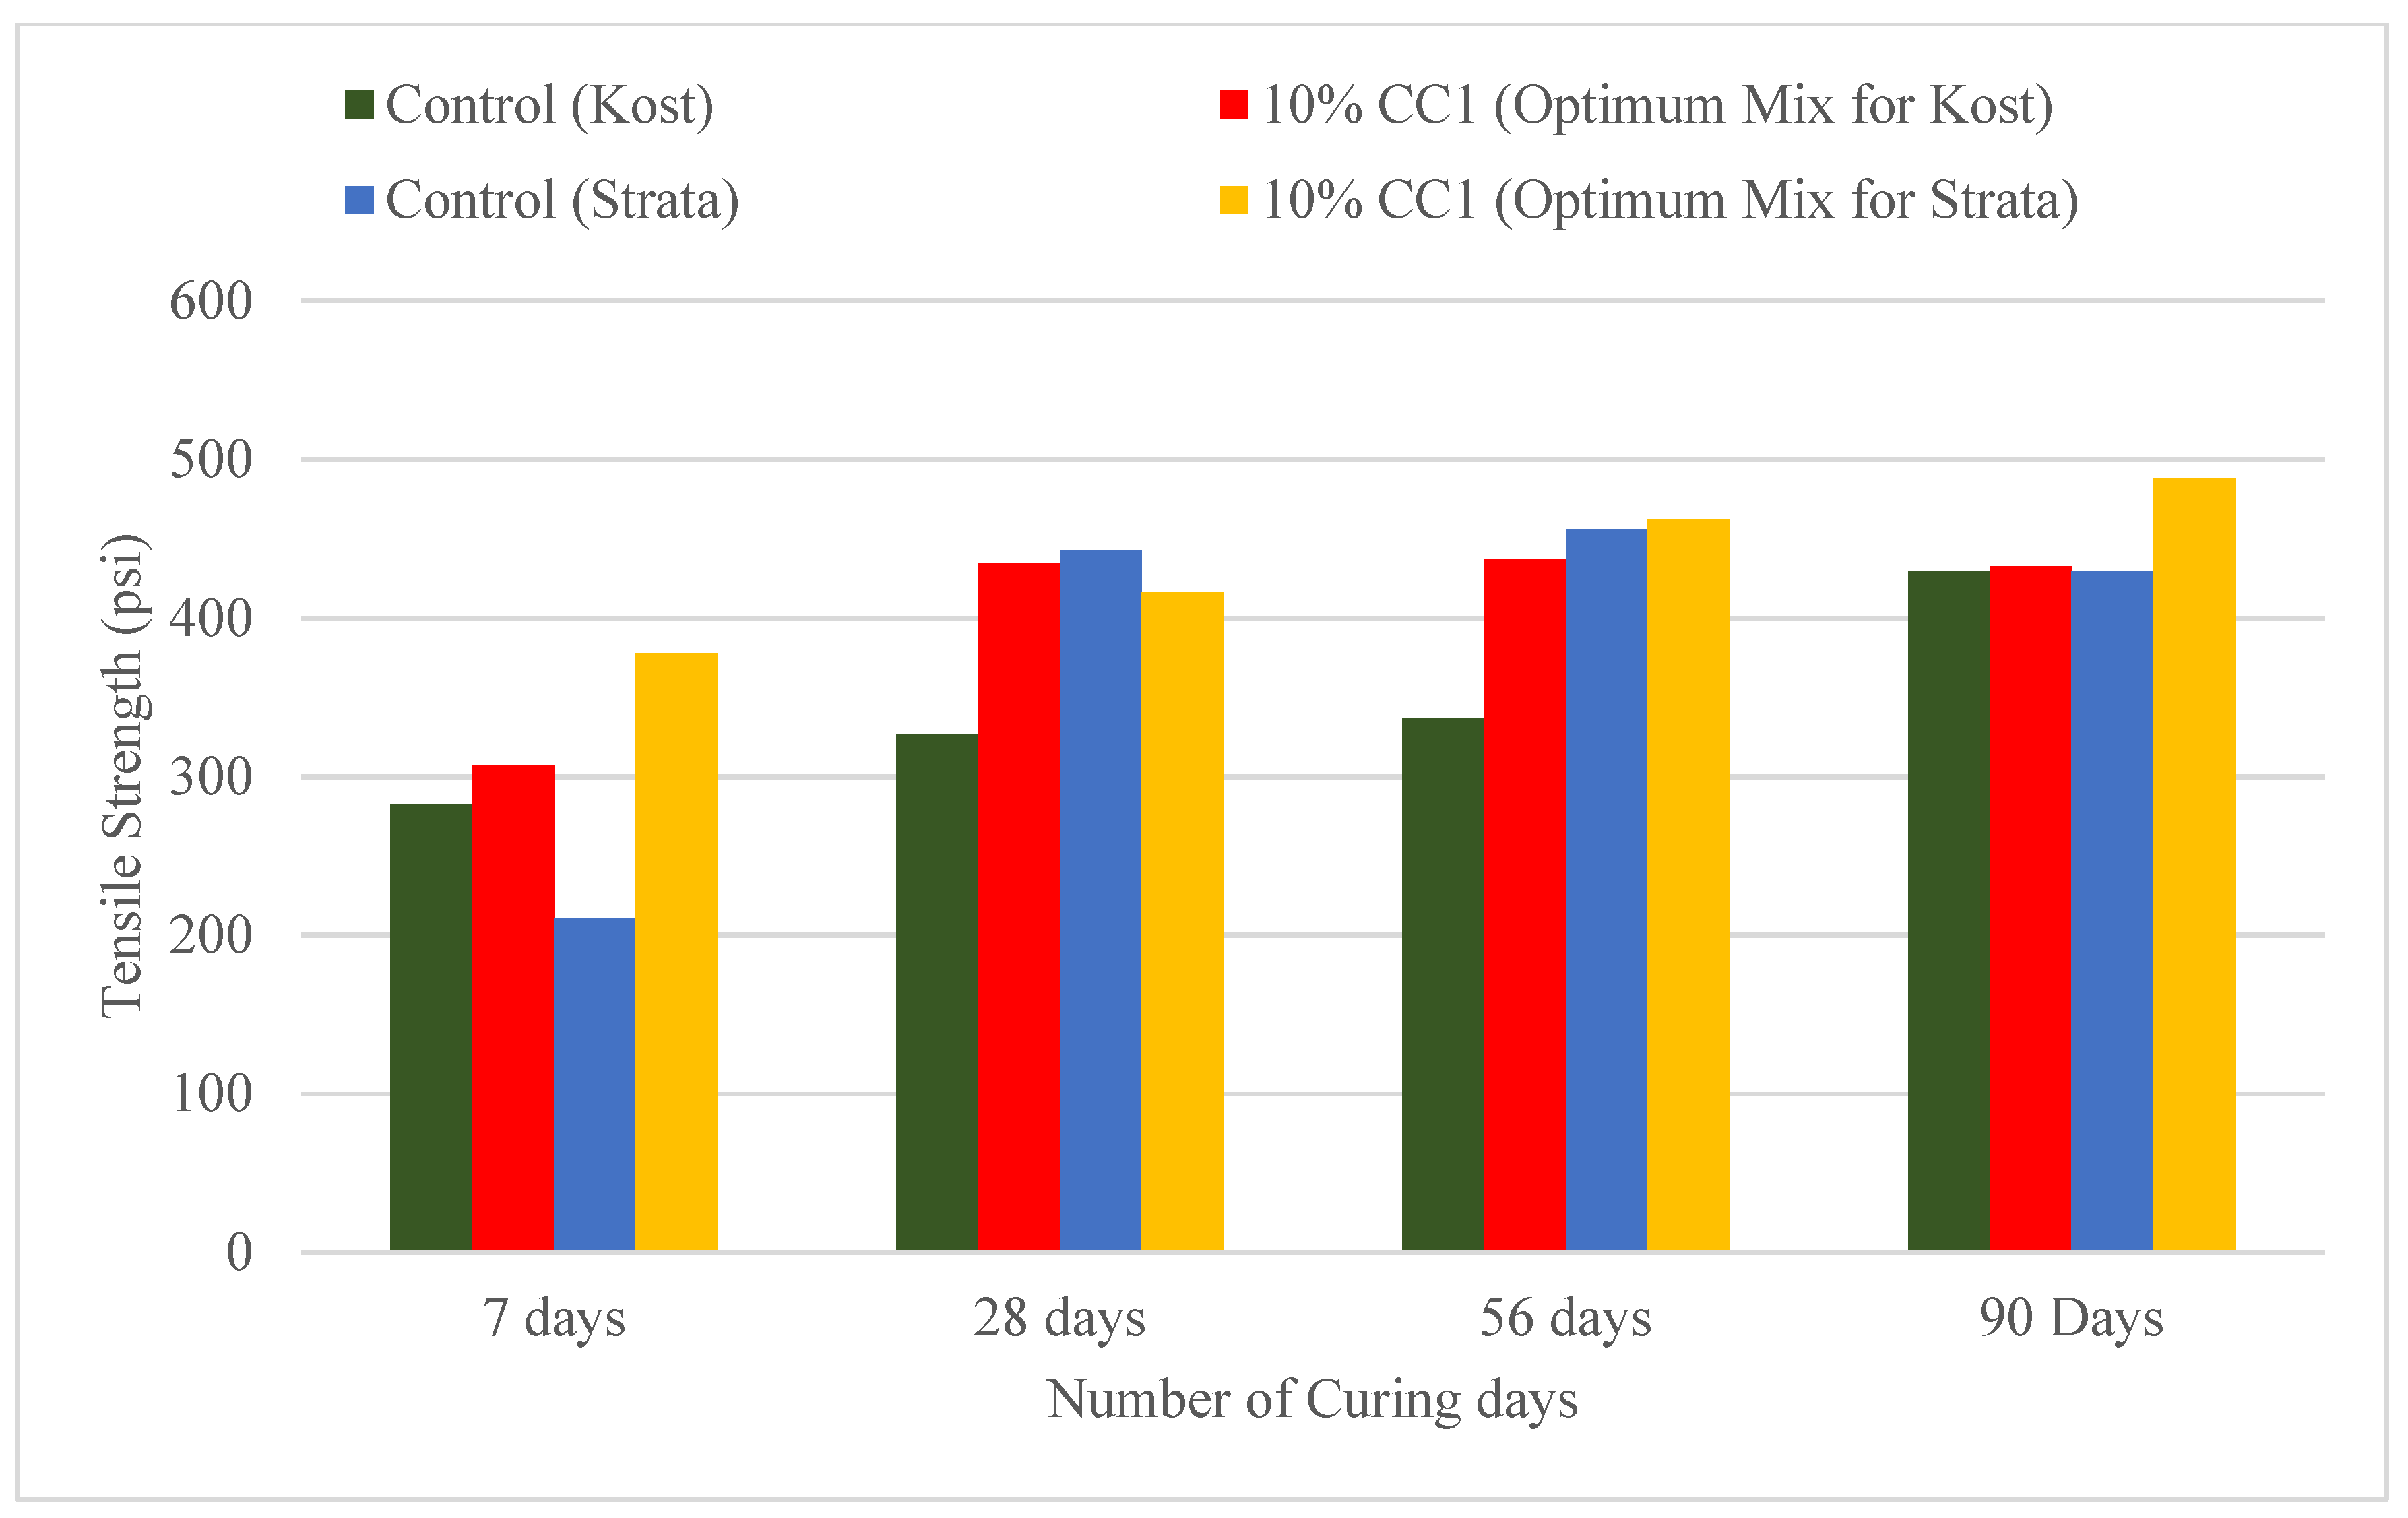
Figure 6 illustrates the splitting tensile strength of the control concrete compared to the tensile strength of the Coal Creek GCBA-based concretes with the optimum content of 10%. The splitting tensile strength of the Strata mix containing 10% CC1 was greater than the control at 7 and 90 days, similar at 56 days, and less at 28 days. The 10% CC1 mix’s tensile strength was only 8.2% of the compressive strength, and the control’s tensile strength was 10% of the compressive strength after 56 days of curing. The compressive strength was much higher than the control; however, the tensile strength was approximately the same. Compressive strength is the concrete’s ability to resist compression; however, tensile strength is localized to a specific area, which could have resulted in lower or similar tensile strength compared to the control.
The splitting tensile strength of the Kost mix containing 10% CC1 was greater than the control up to 90 days of curing. The 10% CC1 mix’s tensile strength after 56 days of curing was only 7.8 % of the compressive strength, whereas it was 9.4% for the control. The higher early tensile strength could also be related to the high amount of cement in the mix design, which initiated the pozzolanic reaction earlier than the Strata mix.
Comparison of Flexural Strength Based on Optimum GCBA and GCBS
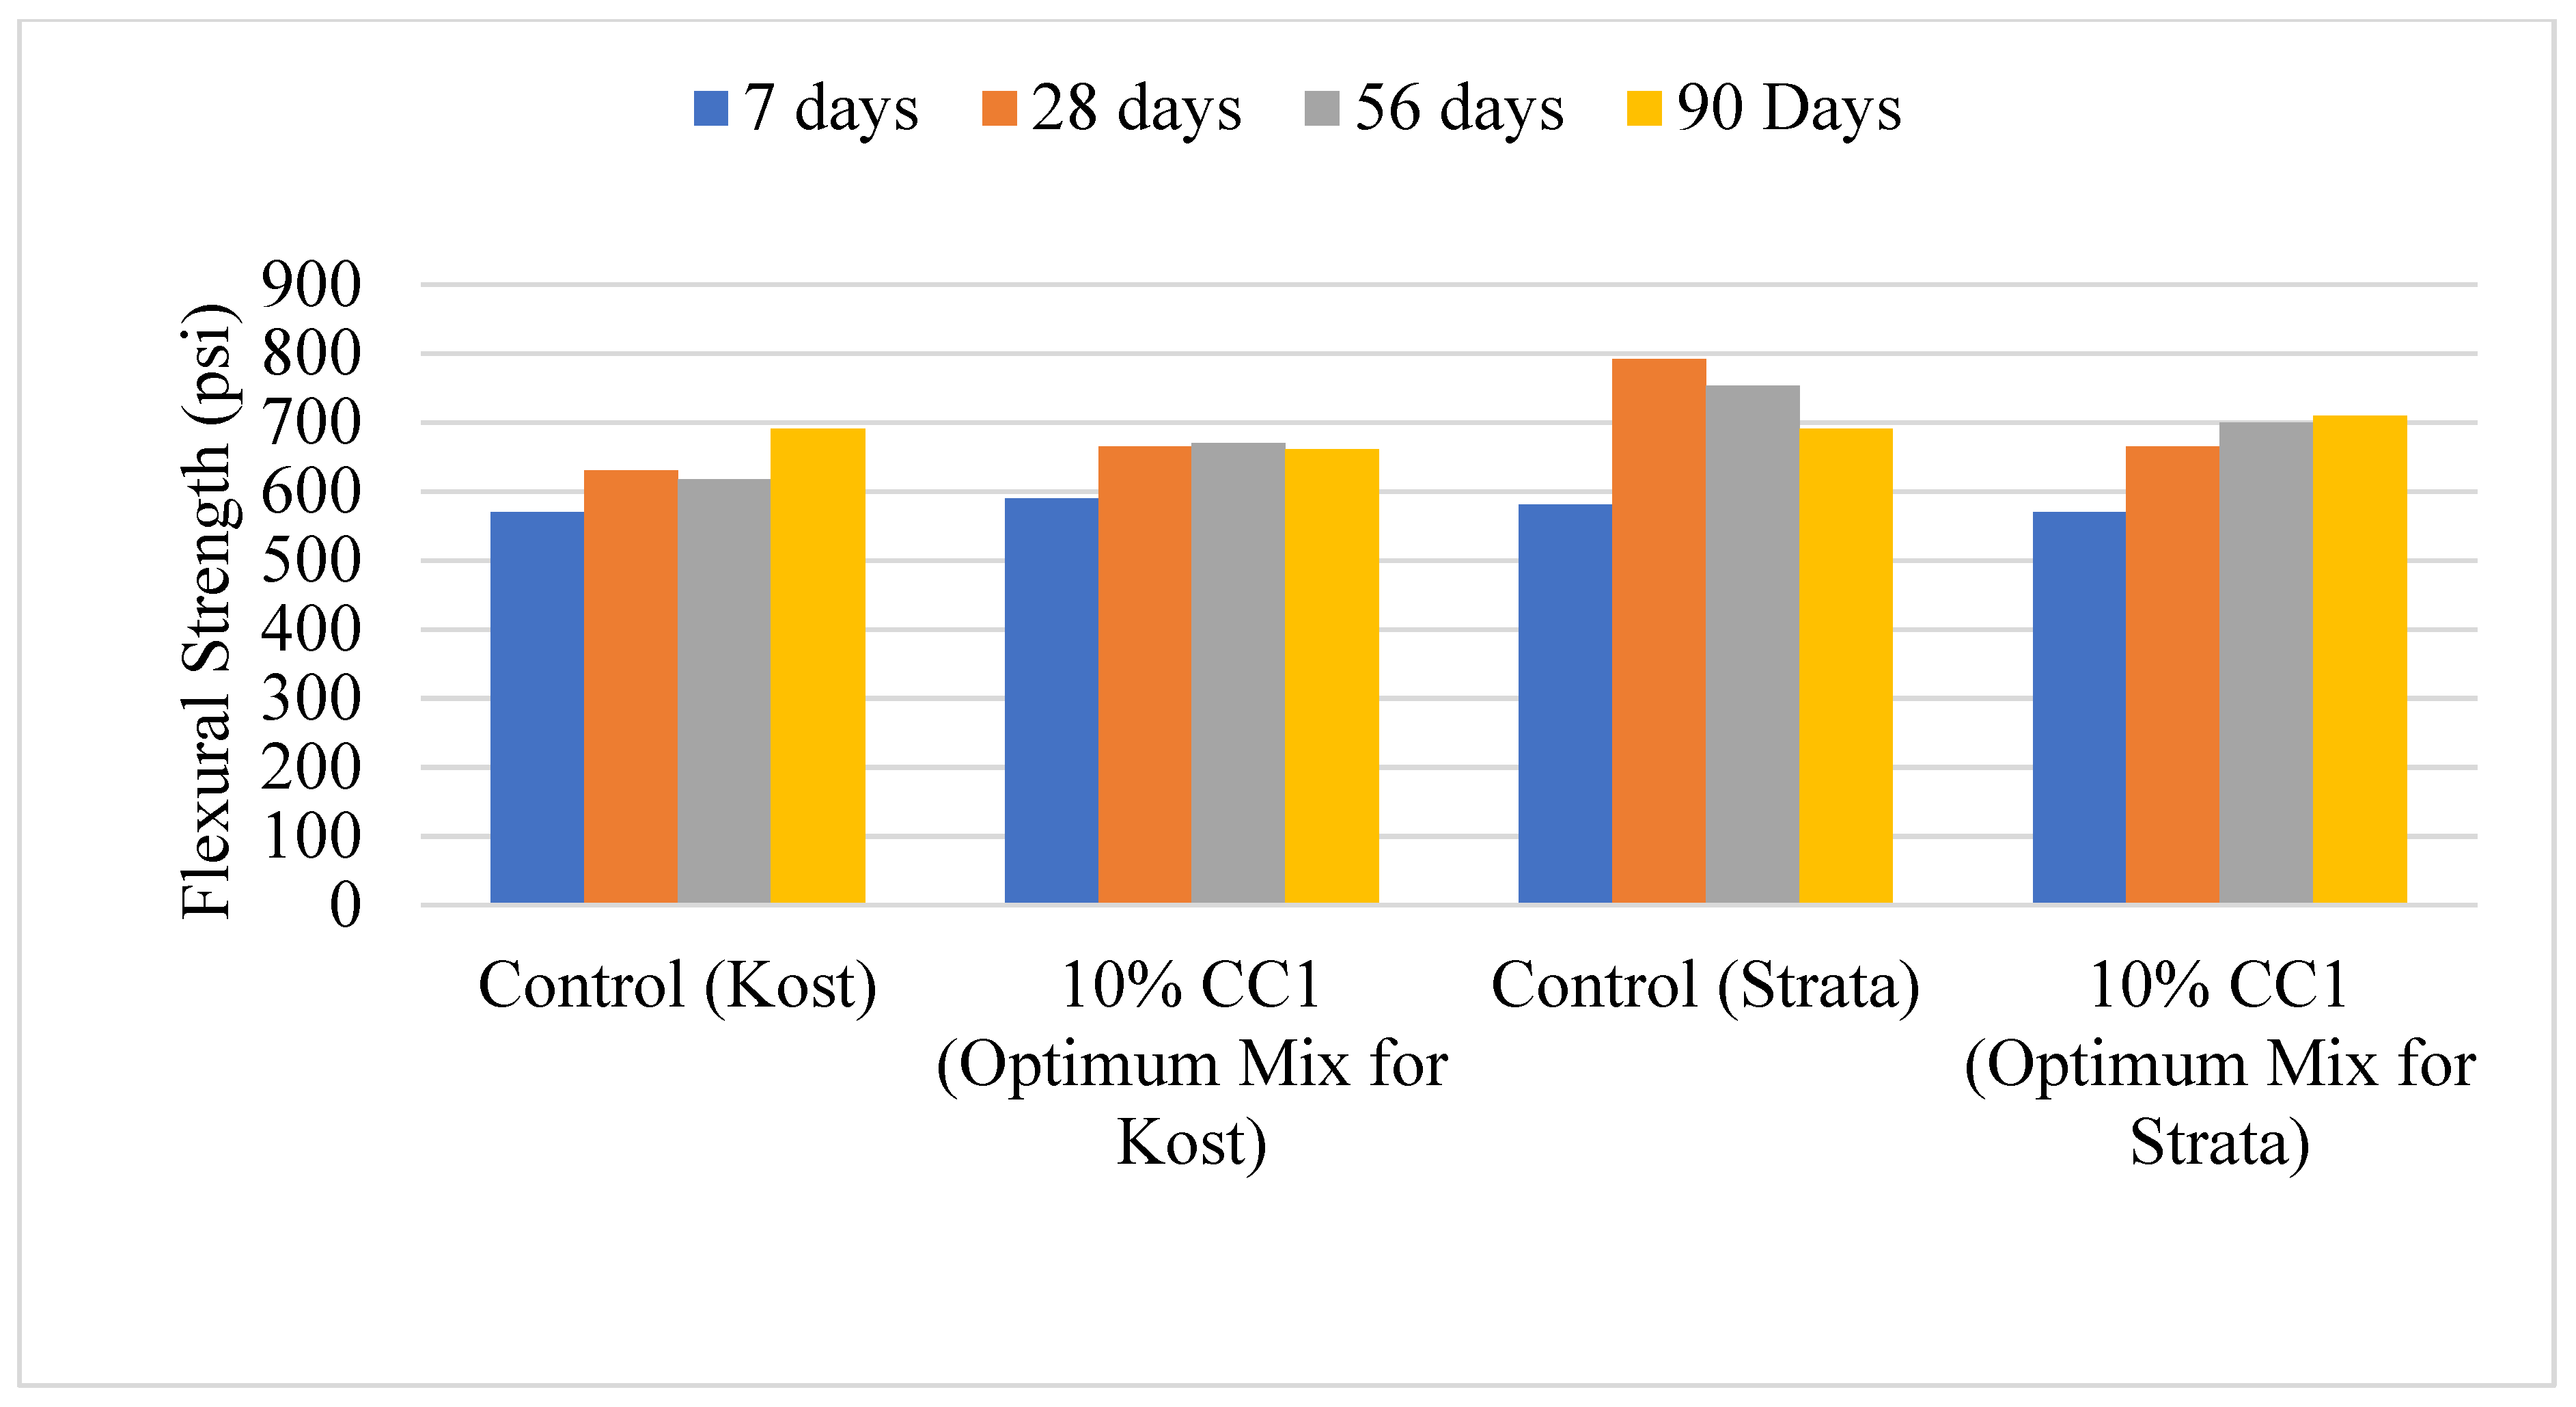
Figure 7 depicts the flexural strength of the Kost and Strata mixes containing 10% CC1 mix compared to the controls. The Strata mix containing 10% Coal Creek GCBA had a flexural strength lower than the control after 7, 28, and 56 days of curing; however, it was higher at 90 daysThe control’s flexural strength was approximately 17% of the compressive strength, whereas it was only 12% for both mix designs containing GCBA. A concrete’s flexural strength is expected to be 10 to 20% of the compressive strength, and the measured values can vary depending on the testing method. Using GCBA in concrete might lower the bonding strength between the cement paste and aggregates. Flexural strength is carried from the cement paste to the aggregates; therefore, a lower bond strength might result in a lower flexural strength. These findings are comparable to the results from Mangi et al.
(2019), where the GCBA-based concrete's flexural strength was lower than the control as the replacement percentage increased.
MOE and Poisson’s Ratio Based on Optimum GCBA and GCBS
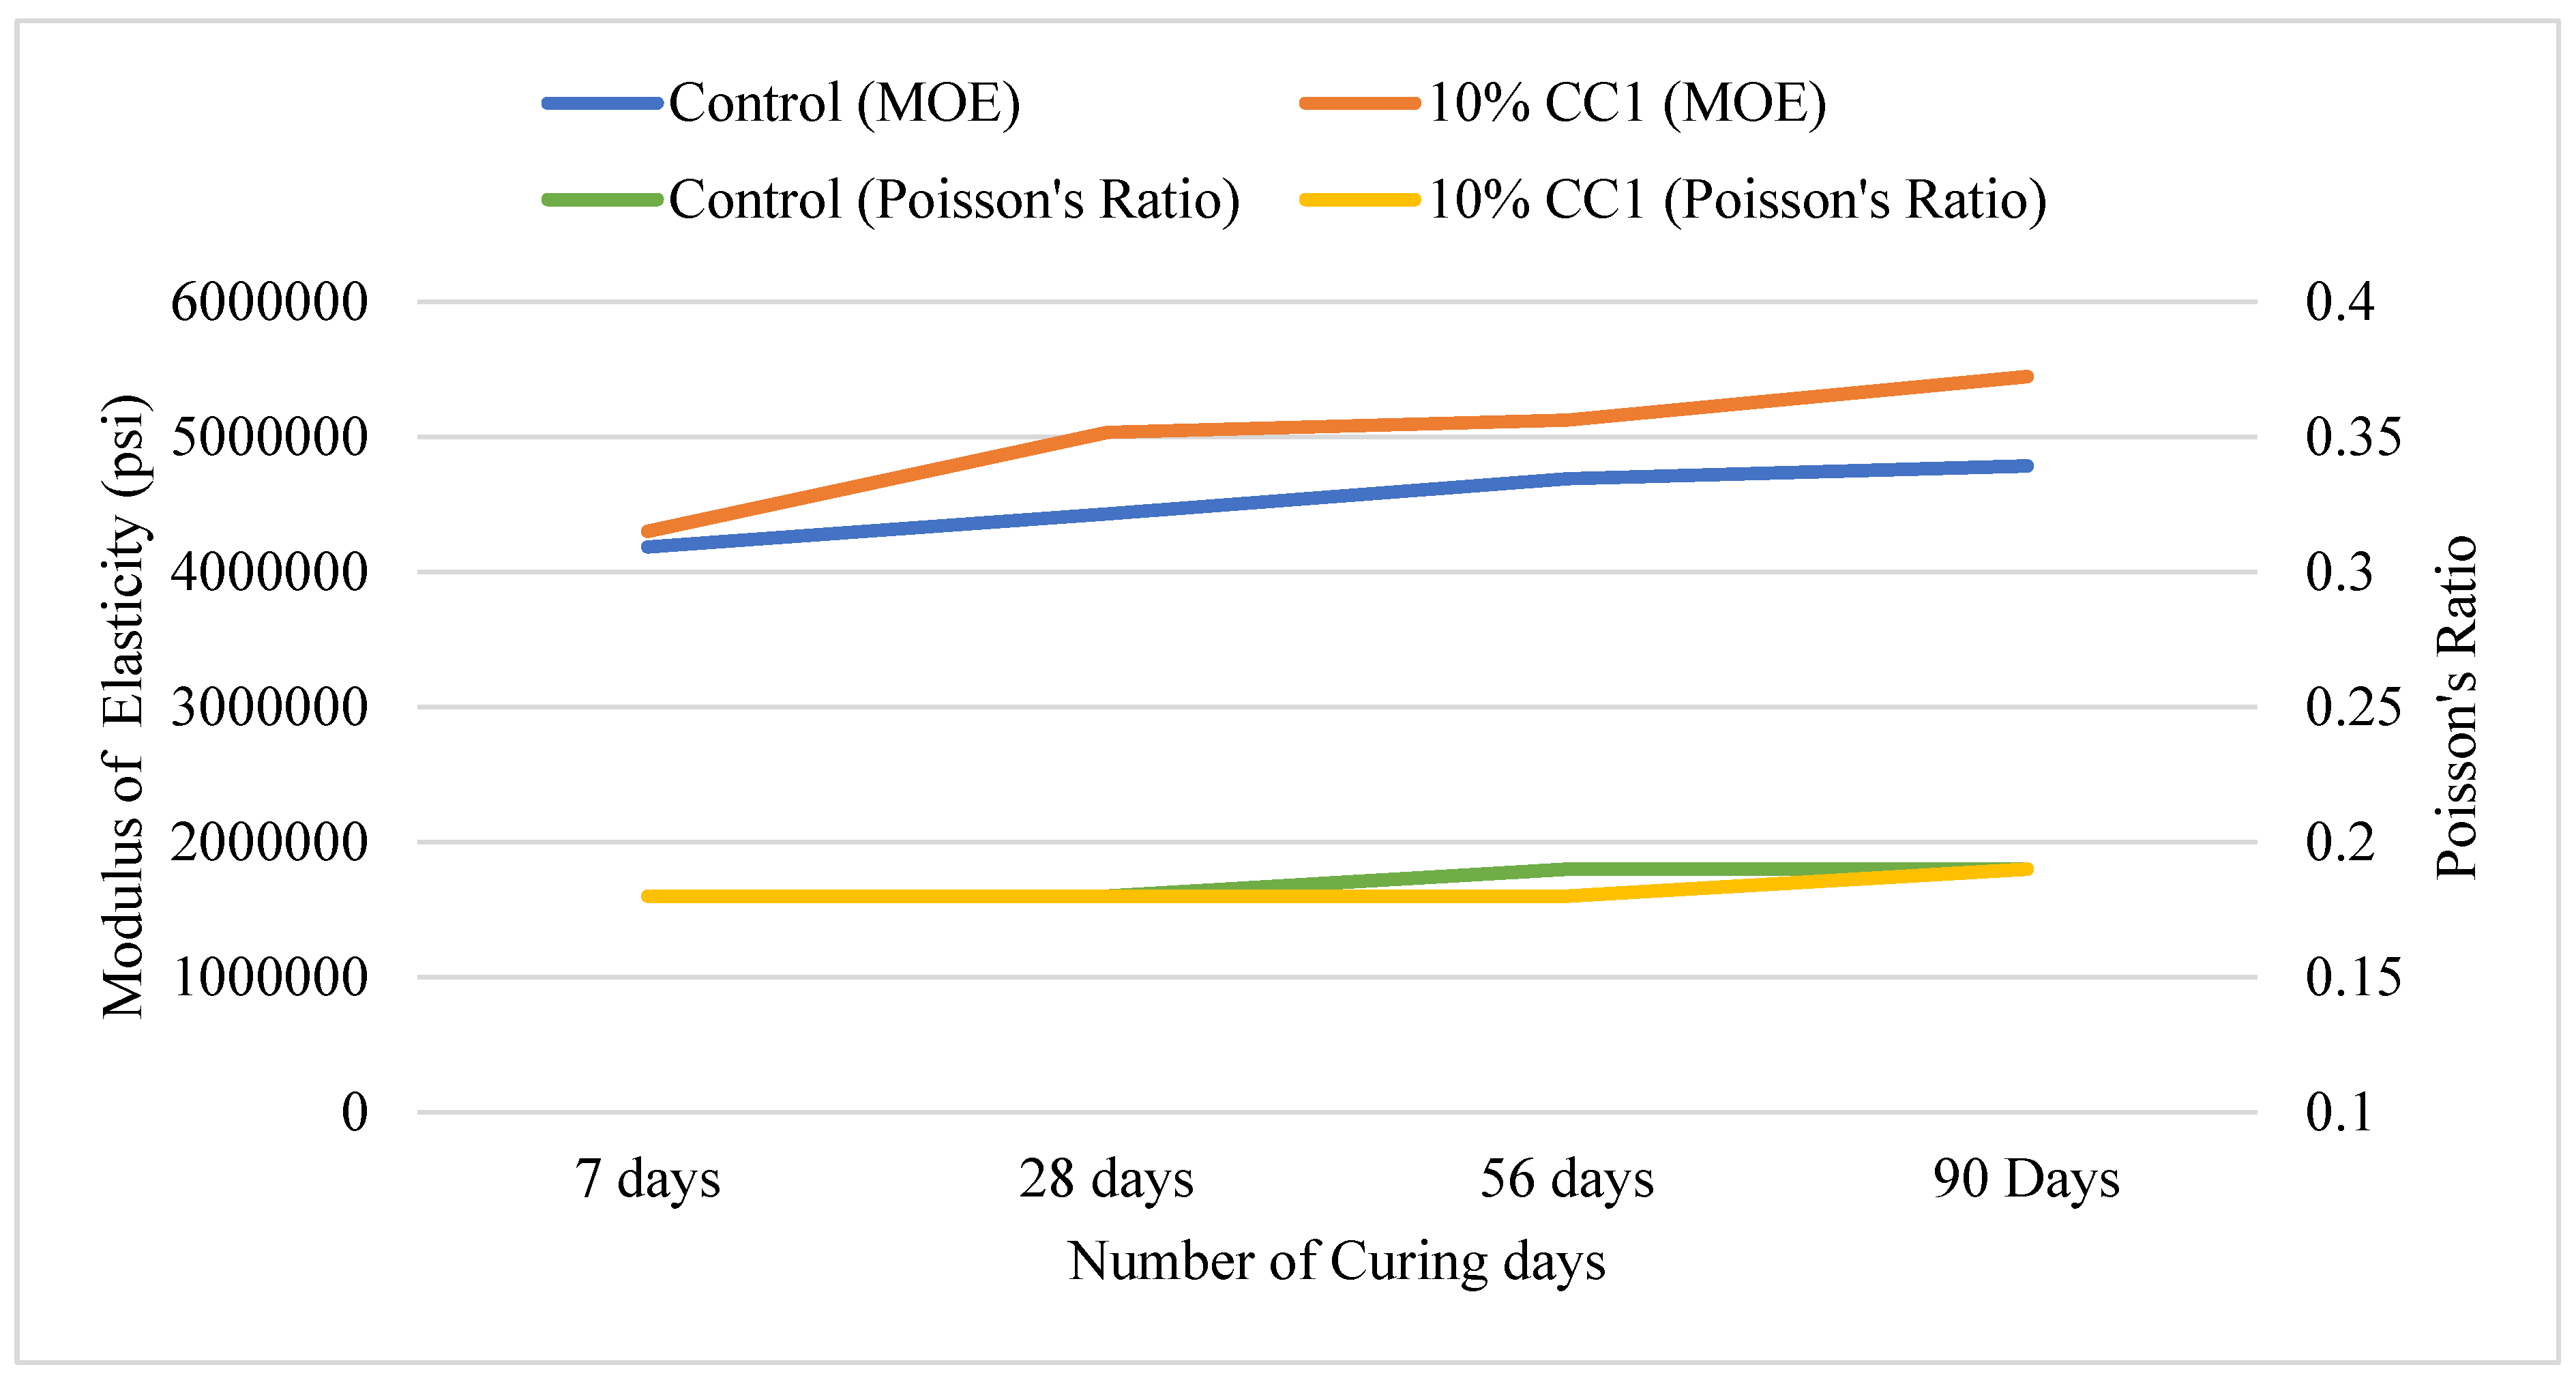
Figure 8 illustrates the MOE and Poisson’s ratio of Strata mix containing 10% CC1. The MOE of the GCBA-based concrete was higher than the control until 90 days of curing. The general range of MOE for concrete is 2 million psi to 6 million psi. The MOE of the GCBA-based concrete was approximately 8% higher than the control after 56 days of curing. The Poisson’s ratio was between 0.18 and 0.19 for both the control and the mix containing the optimum amount of GCBA, which was within the normal range of 0.15 to 0.25.
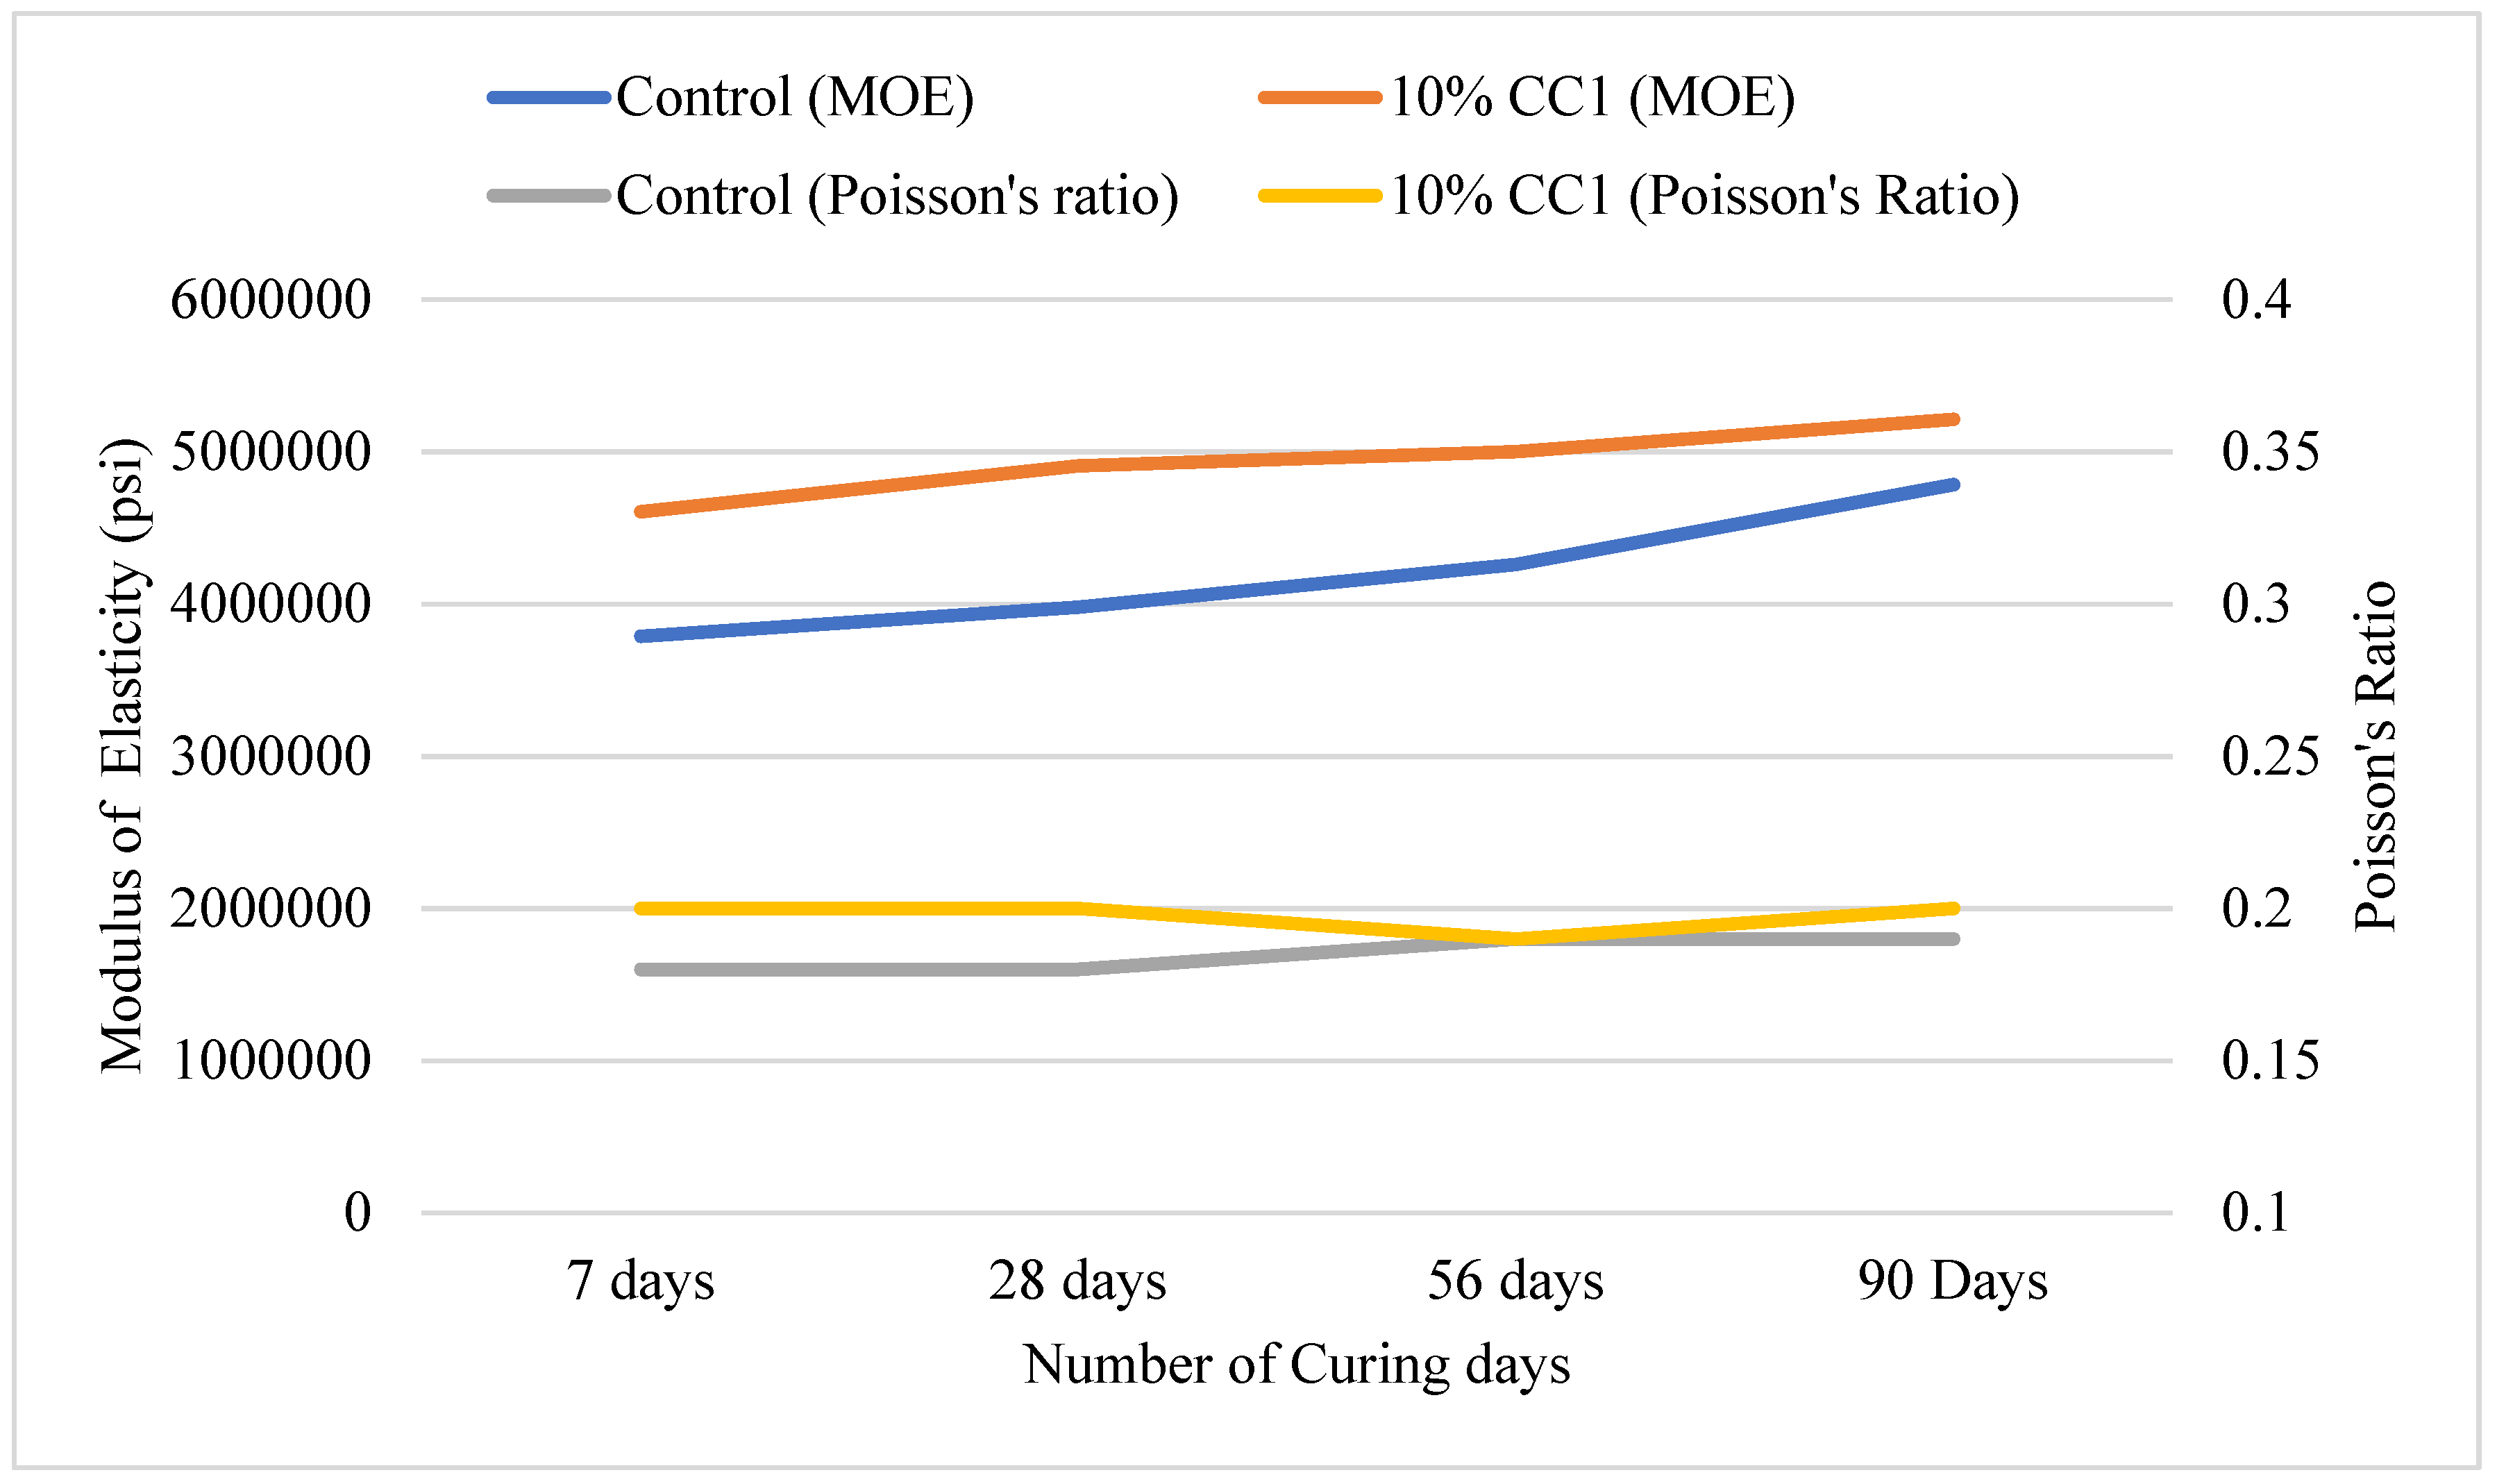
Figure 9 illustrates the MOE and Poisson’s ratio of the Kost mix containing 10% CC1. The MOE of the GCBA-based concrete was higher than the control until 90 days of curing. The MOE of the GCBA-based concrete was approximately 19% higher than the control after 56 days of curing. The Poisson’s ratio was similar. The Poisson’s ratio ranged from 0.18 to 0.20. The results indicated that the GCBA-based concrete's MOE was higher than the control. A greater MOE suggests that it is stiffer and more rigid, which means it will deform less when loaded. A larger MOE can also lead to increased load-carrying capacity, allowing concrete pavements to tolerate higher stresses and loads without failure.
Comparison of RCPT Test Results for Durability Based on Optimum GCBA and GCBS
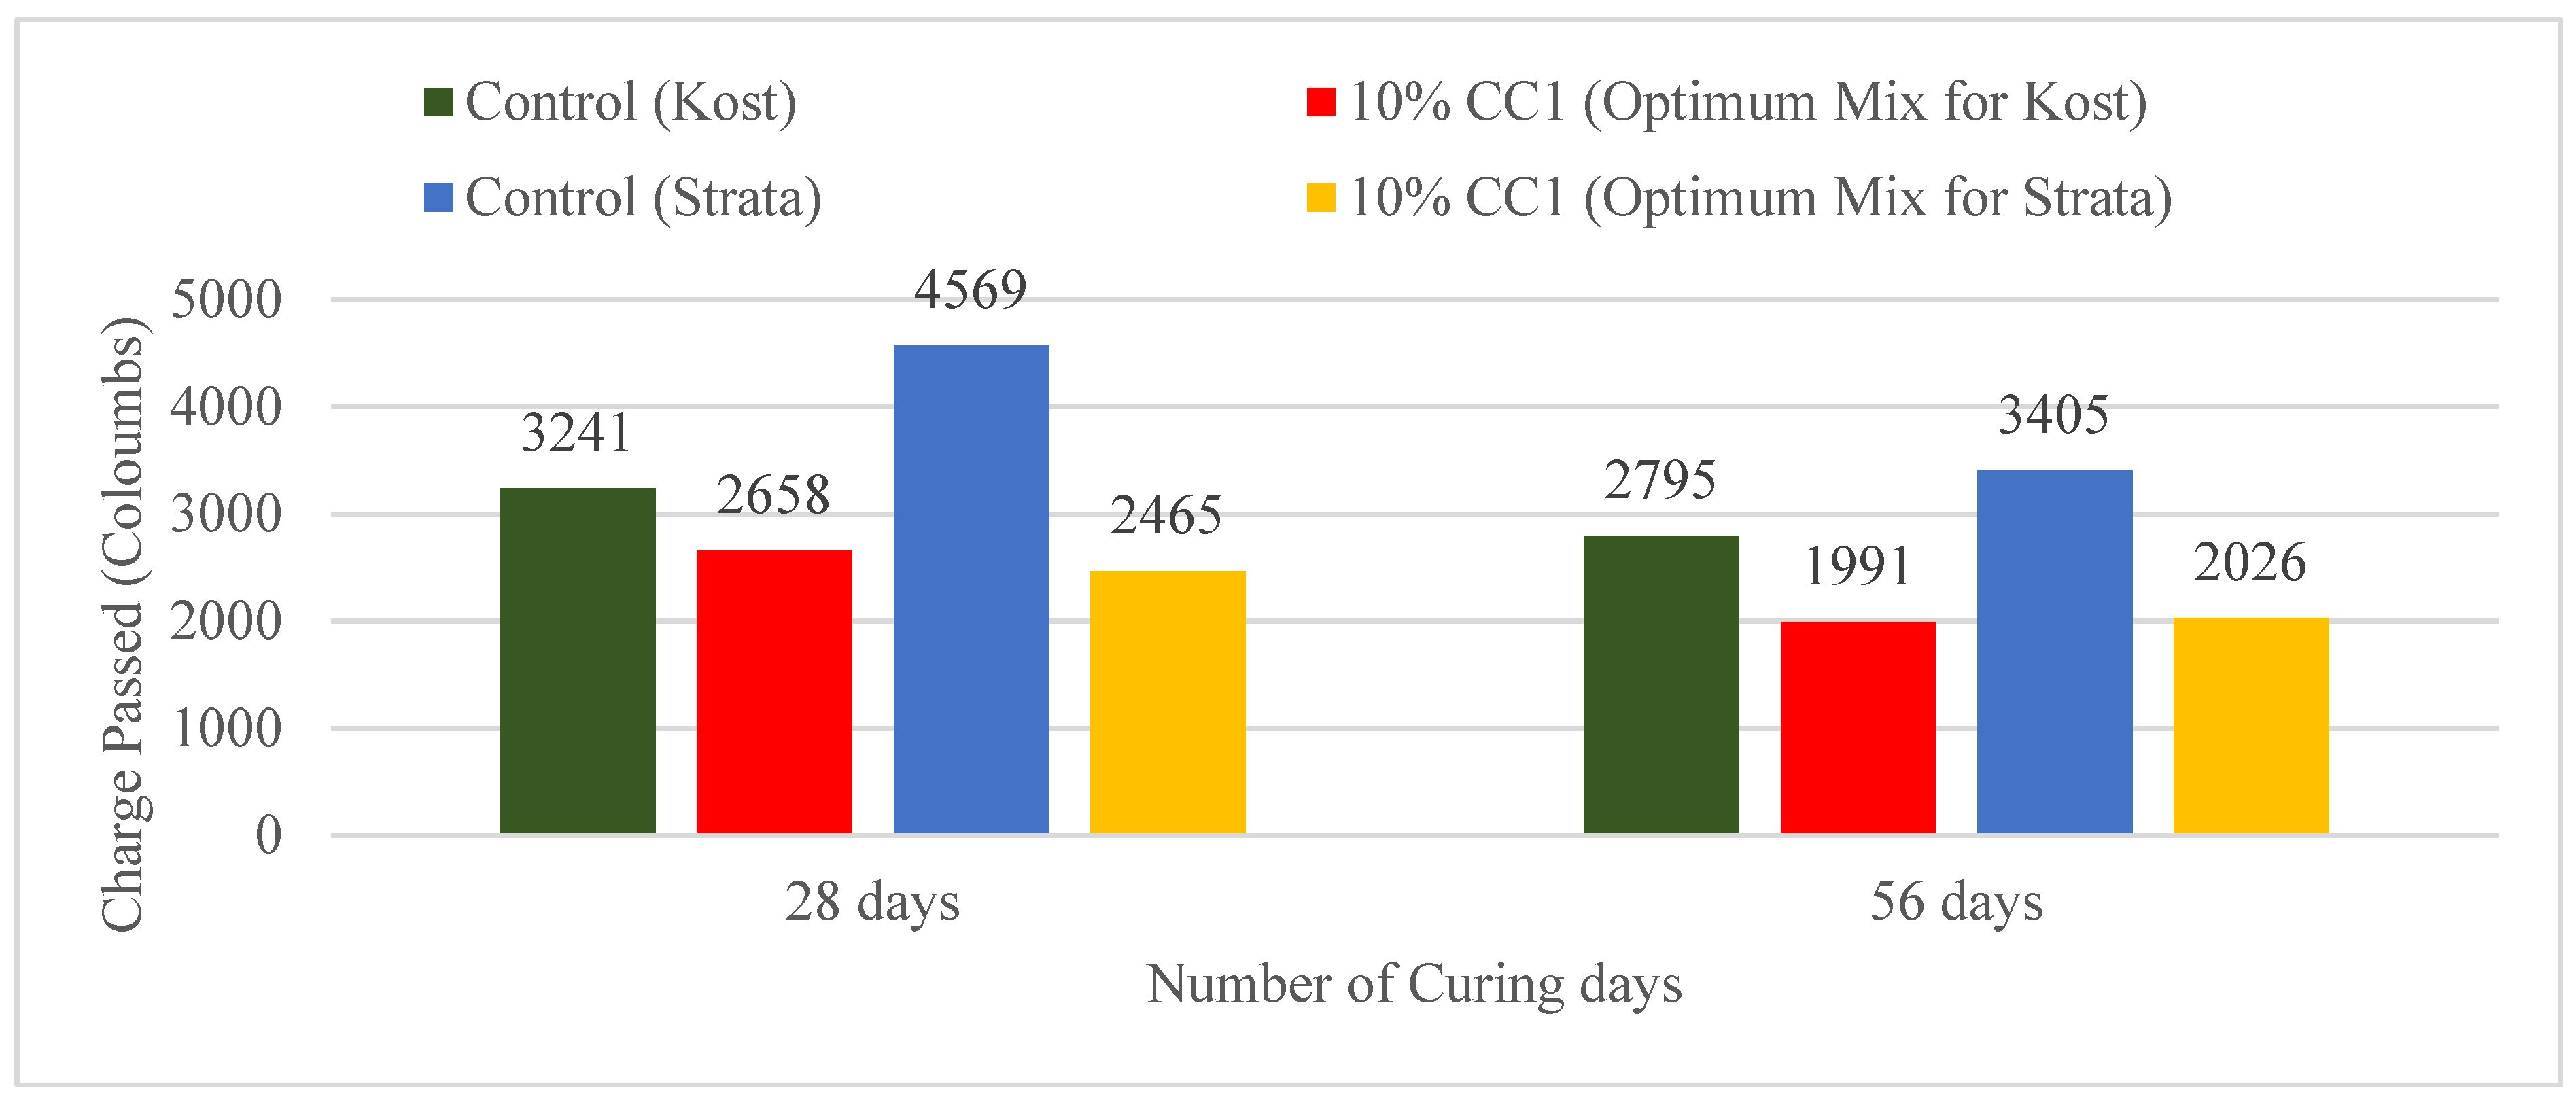
Figure 10 illustrates the charges passed in coulombs for the control and the Strata and Kost mixes containing 10% CC1. There is a significant difference in concrete permeability between the control and the Strata mix containing 10% CC1 after 28 days of curing. The charge passed in the control after 28 days was 84% higher than in the 10% CC1 Strata mix. The 56-day permeability also indicates that there was less charge passing through the GCBA-based concrete compared to the control.
The charge passed in the control at 28 days was only 21% more than in the Kost mix containing 10% CC1. The control passed 40% more charge than the 10% CC1 Kost mix at 56 days. The Kost mix control’s permeability was lower than the Strata control because the amount of cement in the Kost was higher, which reduced concrete permeability.
Kosmatka and Wilson (2016) revealed that using SCMs (Supplementary Cementitious Material) can reduce concrete permeability. GCBA-based concrete permeability decreases more at later ages due to more pozzolanic reactions taking place.
Optimum Content of Nano Clay with Coal Creek GCBA (CC1)
The Strata mix design’s optimum CC1 GCBA content was 10% without nano clay; however, this content can be increased by adding nano clay. Selvasofia et al. (2022) suggested that higher amounts of GCBA could be used if 2% of the cement was replaced with nanomaterials; therefore, 2% nano clay was added, and the CC1 content was increased to 15%. The total cement replacement was 17%. The percentage of nano clay and CC1 were then either increased or decreased based on the results, and the optimum nano clay content was determined for the amount of GCBA added.
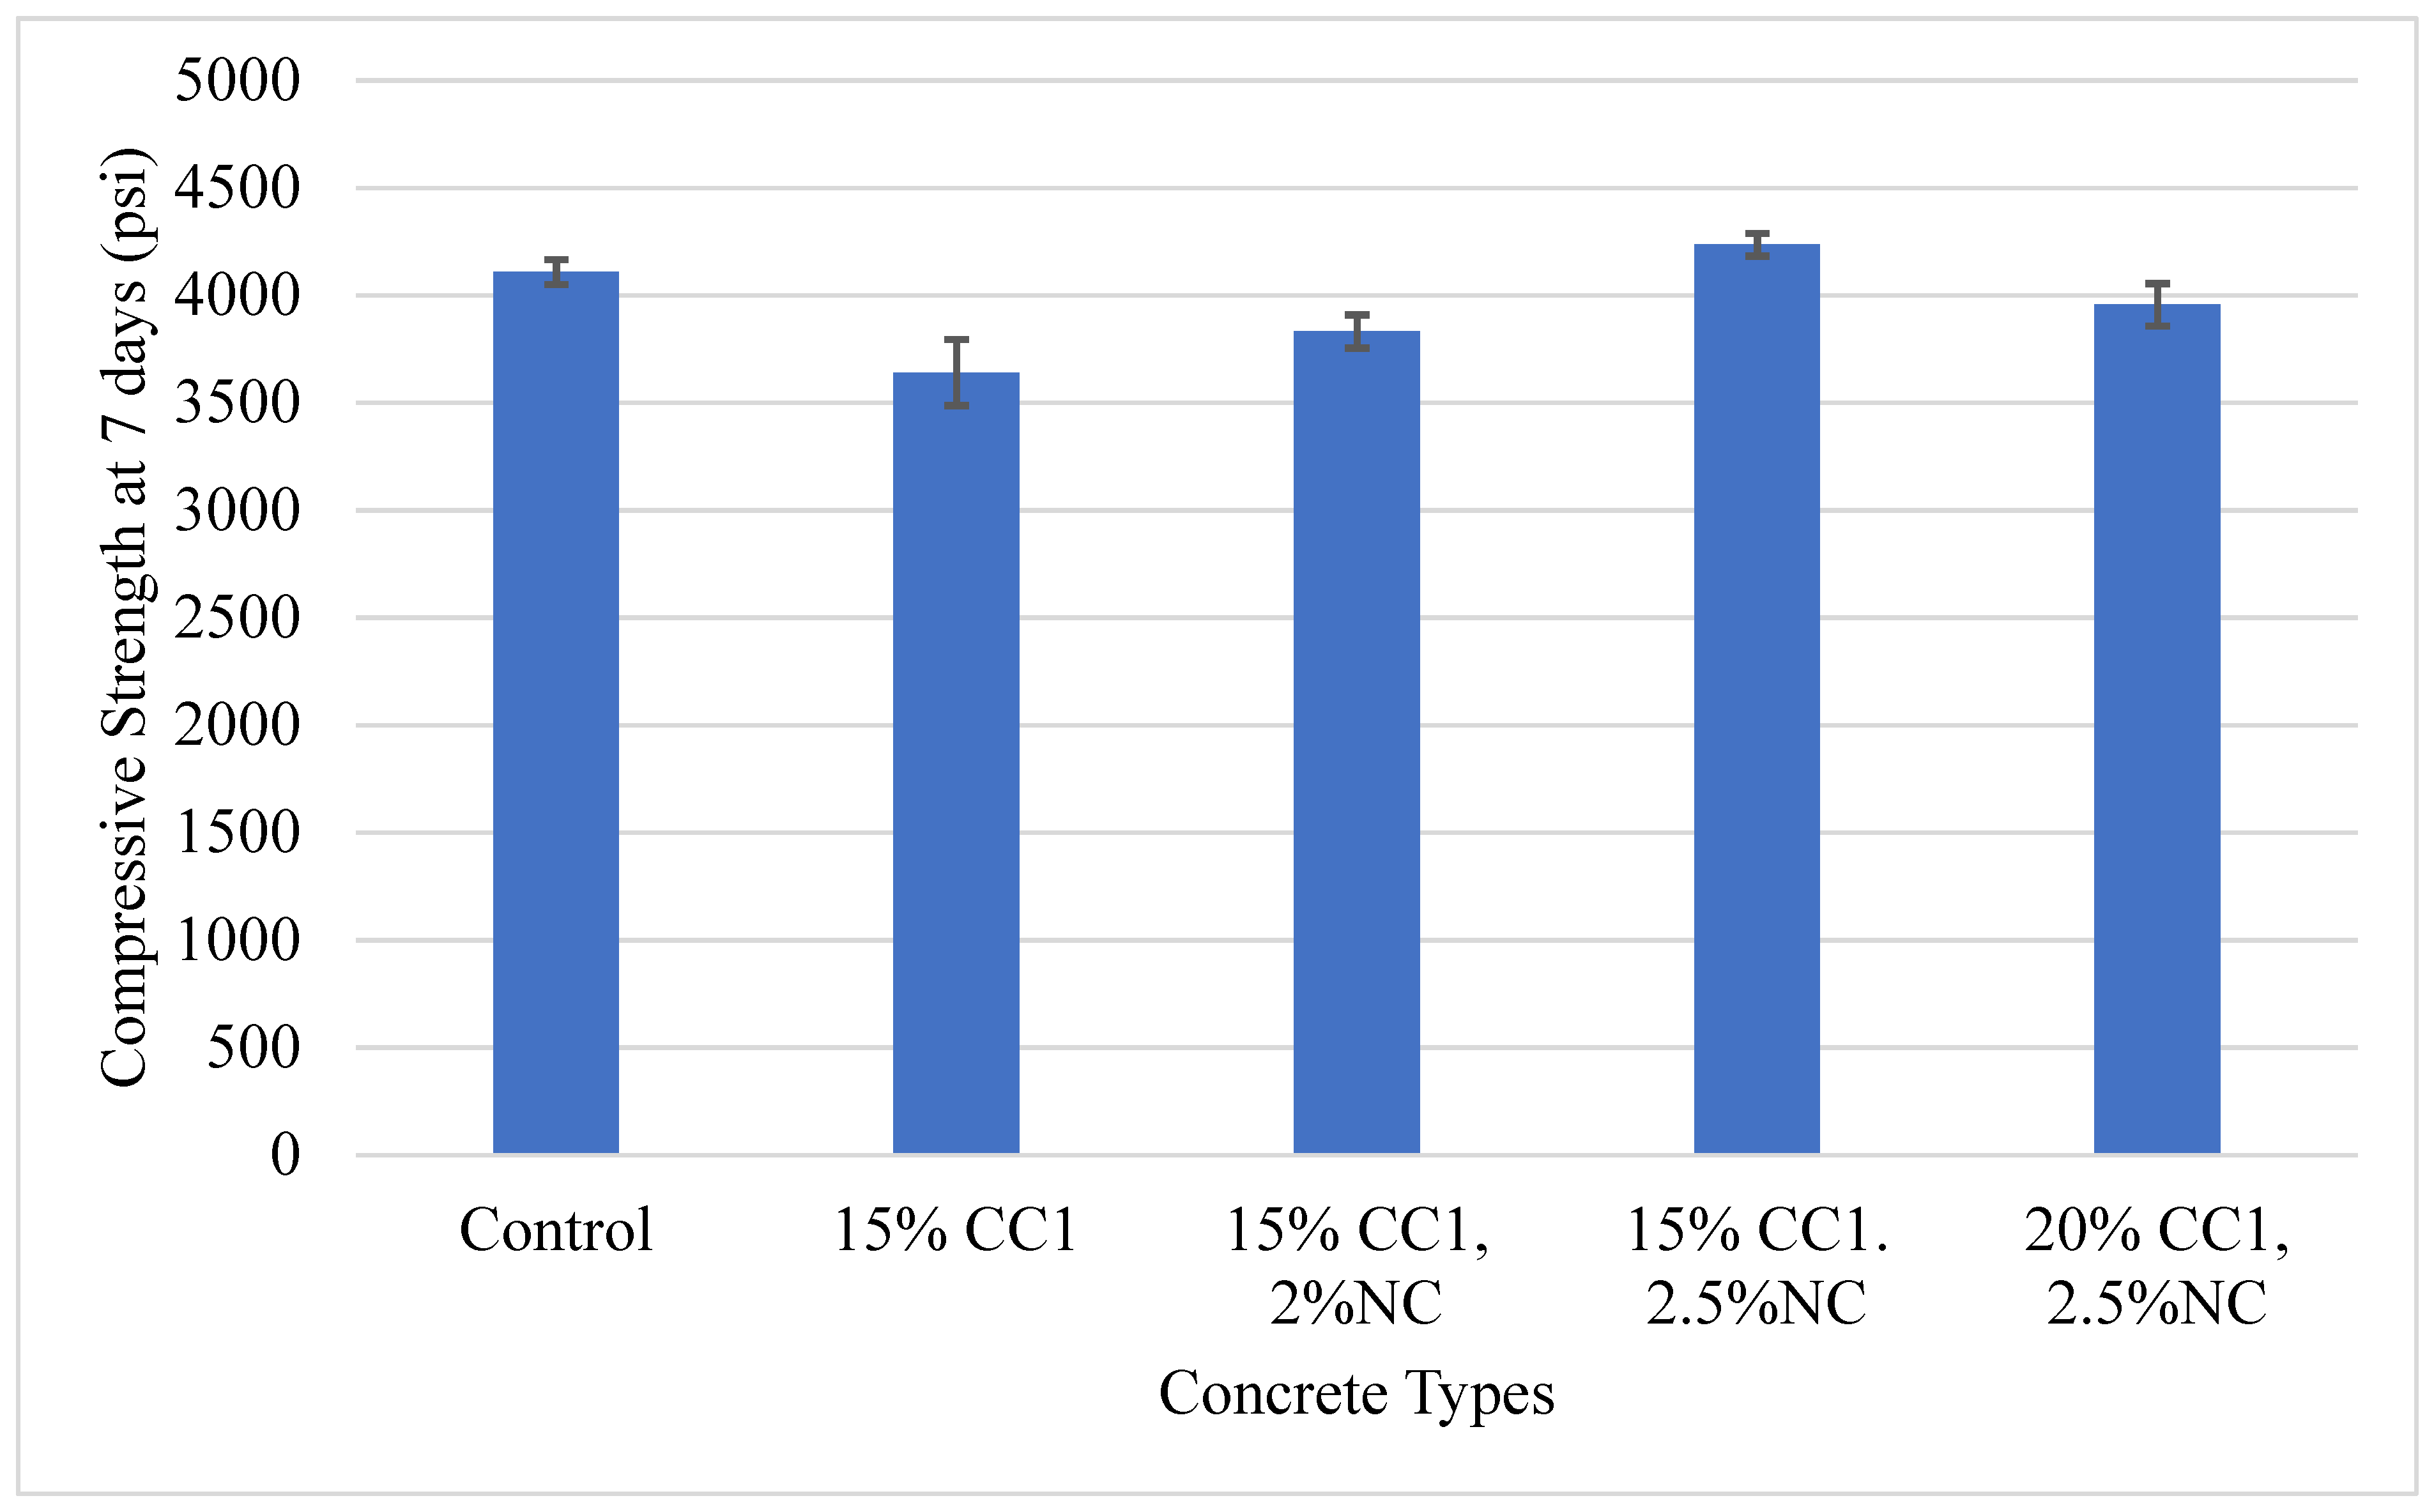
Figure 11 illustrates the 7-day compressive strength of the Strata mix containing CC1 and nano clay. The concrete containing 2% nano clay (NC) and 15% GCBA had a lower compressive strength than the control; therefore, the next mix contained 15% CC1 and 2.5% NC, which resulted in higher compressive strength. A Strata mix containing 20% GCBA and 2.5% nano clay was created; however, the compressive strength was lower than the control. Nano clay is an expensive material; therefore, experiments with 3% nano clay and 20 % CC1 were not performed. The optimum content for nano clay was established as 2.5% due to this expense. Incorporating 2% nano clay in the 15% CC1 concrete mix increased the compressive strength by approximately 5% compared to the 15% CC1 concrete. Adding 2.5% nano clay increased the compressive strength of the 15% CC1 concrete by approximately 16%.
4. CONCLUSIONS
The following conclusions can be drawn from this study:
Mortar and concrete compressive strength depend on the fineness of the GCBA and GCBS. Finer GCBA and GCBS results in a higher compressive strength due to an increase in pozzolanic reactions.
GCBS has a lower LOI than GCBA. A high LOI indicates an increase in water demand in the mix.
The optimum content of GCBA in concrete is 10% and 5% GCBS based on compressive strength, which indicates that GCBA has more potential for replacing cement in concrete than GCBS.
Coal Creek Station GCBA-based concrete had better compressive strength and MOE at the optimum mix of 10%; however, there was no significant increase in tensile strength and flexural strength, which could be due to the weak bonding of the GCBA and cement paste with the aggregates.
GCBA-based concrete was more resistant to chloride penetration.
Nano clay increased the early compressive strength of the concrete. Adding 2.5% nano clay increased the optimum content of the Coal Creek GCBA from 10% to 15%.
RECOMMENDATIONS
The following recommendations can be made based on the research:
GCBA or GCBS fineness should meet the specifications in ASTM C618 to obtain better results.
Using fiber in GCBA-based concrete must be studied because the flexural strength was lower compared to the cement concrete.
FUTURE WORK
Future work includes:
Comparing the freeze and thaw durability of the GCBA-based concrete to the control.
Comparing the SAM number of the fresh concrete to the spacing factor of the hardened concrete to determine durability.
DATA AVAILABILITY STATEMENT
Some or all data, models, or code that support the findings of this study are available from the corresponding author upon reasonable request.
ACKNOWLEDGMENTS
We would like to thank the NDIC for funding this research. We are also grateful to Great River Energy, Strata Corporation, Kost Materials, Basin Electric Power Cooperative, Minnkota Power Cooperative, and Otter Tail Power Company for providing the materials for this study. Most of this work was part of Poudel's (2020) M.S. Thesis at the University of North Dakota under the supervision of Professor Daba Gedafa and advisory committee members.
References
- Abdulmatin, A., Tangchirapat, W., & Jaturapitakkul, C. (2018). An investigation of bottom ash as a pozzolanic material. Construction and Building Materials, 186, 155-162. [CrossRef]
- ACAA. (2021). Production & Use Reports, American Coal Ash Association, Sandy, UT. Accessed January 26, 2023. https://acaa-usa.org/publications/production-use-reports/.
- Arun, N. R., Singh, P., & Gupta, S. (2020). Utilisation of ground bottom ash in concrete. Materials Today: Proceedings, 32, 663-669. [CrossRef]
- Cheah, C.B., Liew, J.J., Kevin, K.L.P., Siddique, R. and Tangchirapat, W., 2023. Influence of milling parameters on the properties of ground coal bottom ash and its blended cement. Construction and Building Materials, 363, p.129745. [CrossRef]
- Cheriaf, M., Rocha, J. C., & Pera, J. (1999). Pozzolanic properties of pulverized coal combustion bottom ash. Cement and concrete research, 29(9), 1387-1391. [CrossRef]
- FHWA. 2016. Coal Bottom Ash/Boiler Slag – Material Description – User Guidelines for Waste and Byproduct Materials in Pavement Construction – FHWA-RD-97-148.
- Jaturapitakkul, C., & Cheerarot, R. (2003). Development of bottom ash as pozzolanic material. Journal of materials in civil engineering, 15(1), 48-53. [CrossRef]
- Khan, R. A., & Ganesh, A. (2016). The effect of coal bottom ash (CBA) on mechanical and durability characteristics of concrete. Journal of building materials and structures, 3(1), 31-42. [CrossRef]
- Kim, H. K. (2015). Utilization of sieved and ground coal bottom ash powders as a coarse binder in high-strength mortar to improve workability. Construction and Building Materials, 91, 57-64. [CrossRef]
- Kim, H. K., & Lee, H. K. (2011). Use of power plant bottom ash as fine and coarse aggregates in high-strength concrete. Construction and Building Materials, 25(2), 1115-1122. [CrossRef]
- Kosmatka, S. H., and Wilson, M.L. (2016). Design and Control of Concrete Mixtures. Portland Cement Association, Skokie, Illinois.
- Mangi, S.A., Wan Ibrahim, M.H., Jamaluddin, N., Arshad, M.F. and Ramadhansyah, P.J., 2019. Effects of ground coal bottom ash on the properties of concrete. Journal of Engineering Science and Technology, 14(1), pp.338-350.
- Neville, A.M. and Brooks, J.J., 1987. Concrete technology (Vol. 438). England: Longman Scientific & Technical.
- Poudel, S. (2023). Determining the optimum ground coal bottom ash content for sustainable concrete infrastructure, MS Thesis, University of North Dakota, Grand Forks, ND.
- Selvasofia, S. A., Sarojini, E., Moulica, G., Thomas, S., Tharani, M., Saravanakumar, P. T., & Kumar, P. M. (2022). Study on the mechanical properties of the nanoconcrete using nano- TiO2 and nanoclay. Materials Today: Proceedings, 50, 1319-1325. [CrossRef]
- Shaikh, F. U. A., Supit, S. W. M., & Sarker, P. K. (2014). A study on the effect of nano silica on compressive strength of high volume fly ash mortars and concretes. Materials & Design, 60, 433-442. [CrossRef]
- Tolliver, S., & Gedafa, D. S. (2016). Investigating the use of Fly Ash and Nanomaterials for Sustainable Concrete Infrastructure. International Journal of Engineering Research, 5 (07): 5.
- Vandenberghe, R. E., De Resende, V. G., da Costa, G. M., & De Grave, E. (2010). Study of loss- on-ignition anomalies found in ashes from combustion of iron-rich coal. Fuel, 89(9), 2405- 2410. [CrossRef]
- Zhang, Y., Schlangen, E., & Çopuroğlu, O. (2022). Effect of slags of different origins and the role of sulfur in slag on the hydration characteristics of cement-slag systems. Construction and Building Materials, 316, 125266. [CrossRef]
Figure 1.
Experimental plan.
Figure 1.
Experimental plan.
Figure 2.
CBA, CBS, GCBA, and GCBS.
Figure 2.
CBA, CBS, GCBA, and GCBS.
Figure 3.
Comparison of compressive strength of mortar and Blaine fineness.
Figure 3.
Comparison of compressive strength of mortar and Blaine fineness.
Figure 4.
Compressive strength of the GCBA and GCBS-based concretes vs. control.
Figure 4.
Compressive strength of the GCBA and GCBS-based concretes vs. control.
Figure 5.
Compressive strength of the 10% CC1 vs. control mixes.
Figure 5.
Compressive strength of the 10% CC1 vs. control mixes.
Figure 6.
Tensile strength of the 10% CC1 vs. control mixes.
Figure 6.
Tensile strength of the 10% CC1 vs. control mixes.
Figure 7.
Flexural strength of the 10% CC1 vs. control mixes.
Figure 7.
Flexural strength of the 10% CC1 vs. control mixes.
Figure 8.
MOE and Poisson’s ratio for the Strata mixes.
Figure 8.
MOE and Poisson’s ratio for the Strata mixes.
Figure 9.
MOE and Poisson’s ratio for the Kost mixes.
Figure 9.
MOE and Poisson’s ratio for the Kost mixes.
Figure 10.
RCPT Test Results for the 10% CC1 vs. control mixes.
Figure 10.
RCPT Test Results for the 10% CC1 vs. control mixes.
Figure 11.
Compressive strength of the Strata mixes: GCBA with nano clay vs. the control.
Figure 11.
Compressive strength of the Strata mixes: GCBA with nano clay vs. the control.
Table 1.
Physical properties of the fine and coarse aggregates, CBA, and CBS.
Table 1.
Physical properties of the fine and coarse aggregates, CBA, and CBS.
| Physical Properties |
Bulk Specific Gravity |
Bulk SSD Specific Gravity |
Absorption (%) |
Fineness Modulus |
| Strata Corporation |
Fine Aggregate |
Lab |
2.62 |
2.641 |
0.36 |
2.85 |
| Supplier |
2.668 |
2.678 |
0.36 |
2.86 |
| Coarse Aggregate |
Lab |
2.605 |
2.634 |
0.91 |
- |
| Supplier |
2.660 |
2.690 |
0.91 |
- |
| Kost Materials |
Fine Aggregate |
Lab |
2.651 |
2.65 |
0.38 |
2.74 |
| Supplier |
2.668 |
2.678 |
0.36 |
2.86 |
| Coarse Aggregate |
Lab |
2.64 |
2.688 |
0.86 |
- |
| Supplier |
2.693 |
2.709 |
Not Received |
- |
| CBA |
Coal Creek |
Lab |
2.23 |
2.26 |
2.31 |
2.55 |
| Supplier |
NA |
NA |
NA |
NA |
| Leland Olds |
Lab |
2.11 |
2.17 |
5.53 |
2.93 |
| Supplier |
NA |
NA |
NA |
NA |
| CBS |
MR Young |
Lab |
2.23 |
2.26 |
2.31 |
2.55 |
| Supplier |
NA |
NA |
NA |
NA |
| Coyote |
Lab |
2.11 |
2.17 |
5.53 |
2.93 |
| Supplier |
NA |
NA |
NA |
NA |
Table 2.
Physical and chemical properties of the GCBA, GCBS, and cement.
Table 2.
Physical and chemical properties of the GCBA, GCBS, and cement.
| |
Cem-ent |
GCBA
(Coal Creek) |
GCBA (Leland Olds) |
GCBS
(MR Young) |
GCBS (Coyote) |
| CC1 |
CC2 |
L1 |
L2 |
MR1 |
MR2 |
CO1 |
CO2 |
| Physical Properties |
| Sieve No. 325 Fineness (% retained) |
2.3 |
46.8 |
48.9 |
32.9 |
37.2 |
45.9 |
52.4 |
33.8 |
62.1 |
| Blaine Fineness (cm/g) |
3992 |
1621 |
1970 |
3072 |
2735 |
1322 |
1364 |
1672 |
1138 |
| Specific Gravity |
3.104 |
2.665 |
2.674 |
2.556 |
2.632 |
2.717 |
2.753 |
2.904 |
2.899 |
| Chemical Properties |
| SiO2 (%) |
19.8 |
51.87 |
36.61 |
47.9 |
35.96 |
| Al2O3 (%) |
4.3 |
13.98 |
13.34 |
14.87 |
13.97 |
| Fe2O3 (%) |
3.1 |
7.2 |
14.54 |
12.55 |
15.01 |
| Sum of Oxides (SiO2, Al2O3, Fe2O3) |
27.2 |
73.06 |
64.5 |
75.32 |
64.95 |
| Cao (%) |
64 |
15.05 |
20.06 |
12.34 |
18.8 |
| MgO (%) |
2.5 |
4.63 |
6.26 |
4.48 |
5.35 |
| SO3 (%) |
3.3 |
0.66 |
2.66 |
0.21 |
0.31 |
| LOI (%) |
1.5 |
1.5 |
9.8 |
-1.4 |
-0.5 |
| Moisture Content (%) |
0.5 |
0.3 |
1.5 |
0.1 |
0.1 |
Class of Fly Ash
(ASTM C618) |
NA |
F |
C |
F |
C |
Table 3.
Concrete Mix Design for the Strata Corporation and Kost Materials.
Table 3.
Concrete Mix Design for the Strata Corporation and Kost Materials.
| Type |
Control |
5% GCBA or GCBS |
10% GCBA or GCBS |
15% GCBA or GCBS |
| Mix Design |
Strata |
Kost |
Strata |
Kost |
Strata |
Kost |
Strata |
Kost |
| Material |
Weight lbs /CY |
Weight lbs /CY |
Weight lbs /CY |
Weight lbs /CY |
| Cement |
564 |
619 |
536 |
588 |
508 |
557 |
479 |
526 |
| Coal Creek (GCBA) |
- |
- |
28 |
31 |
56 |
62 |
85 |
93 |
| Leland (GCBA) |
- |
- |
28 |
31 |
56 |
62 |
85 |
93 |
| Minnkota (GCBS) |
- |
- |
28 |
31 |
56 |
62 |
85 |
93 |
| Coyote (GCBS) |
- |
- |
28 |
31 |
56 |
62 |
85 |
93 |
| Coarse Aggregate #1 |
1640 |
1909 |
1640 |
1909 |
1640 |
1909 |
1640 |
1909 |
| Coarse Aggregate #2 |
125 |
- |
125 |
- |
125 |
- |
125 |
- |
| Fine Aggregate |
1380 |
982 |
1380 |
982 |
1380 |
982 |
1380 |
982 |
| Water |
254 |
260 |
254 |
260 |
254 |
260 |
254 |
260 |
| Air Content (ml/CY) |
88 |
183 |
88 |
183 |
88 |
183 |
88 |
183 |
| W/C |
0.45 |
0.42 |
0.45 |
0.42 |
0.45 |
0.42 |
0.45 |
0.42 |
Table 4.
Flow, Water Requirements, and SAI of the GCBA and GCBS Mortar.
Table 4.
Flow, Water Requirements, and SAI of the GCBA and GCBS Mortar.
| Sample |
Water (mL) |
Flow |
Average Compressive Strength (psi) |
Strength Activity Index (%) |
Water Requirement (%) |
| 7-day |
28-day |
7-day |
28-day |
| Control |
242 |
93 |
4729.3 |
5741.7 |
100.0 |
100.0 |
100.0 |
| CC1 |
240 |
91 |
3546.0 |
4119.7 |
75.0 |
71.8 |
99.2 |
| CC2 |
240 |
91 |
3444.3 |
4232.3 |
72.8 |
73.7 |
99.2 |
| L1 |
250 |
92 |
3614.0 |
4664.0 |
76.4 |
81.2 |
103.3 |
| L2 |
250 |
91 |
3725.7 |
4420.3 |
78.8 |
77.0 |
103.3 |
| MR1 |
242 |
94 |
3249.0 |
3936.7 |
68.7 |
68.6 |
100.0 |
| MR2 |
242 |
98 |
2554.3 |
3892.0 |
54.0 |
67.8 |
100.0 |
| CO1 |
242 |
98 |
3245.7 |
4357.7 |
68.6 |
75.9 |
100.0 |
| CO2 |
242 |
96 |
3054.0 |
3963.3 |
64.6 |
69.0 |
100.0 |
Table 5.
Fresh Properties of the 10% CC1 and Control Mixes.
Table 5.
Fresh Properties of the 10% CC1 and Control Mixes.
| |
Slump (inch) |
Air Content (%) |
Unit Weight (lb/ft3) |
| Control (Strata) |
3.75 |
7.4 |
143.6 |
| 10% CC1 (Optimum Strata Mix) |
1.5 |
6.1 |
145.6 |
| Control (Kost) |
4.75 |
8.1 |
142.4 |
| 10% CC1 (Optimum Kost Mix) |
3.25 |
6.7 |
144.8 |
|
Disclaimer/Publisher’s Note: The statements, opinions and data contained in all publications are solely those of the individual author(s) and contributor(s) and not of MDPI and/or the editor(s). MDPI and/or the editor(s) disclaim responsibility for any injury to people or property resulting from any ideas, methods, instructions or products referred to in the content. |
© 2024 by the authors. Licensee MDPI, Basel, Switzerland. This article is an open access article distributed under the terms and conditions of the Creative Commons Attribution (CC BY) license (http://creativecommons.org/licenses/by/4.0/).
