Submitted:
09 April 2024
Posted:
10 April 2024
You are already at the latest version
Abstract
This study aimed to evaluate the early-childhood comorbidities of cerebral palsy (CP) in children with low birth weight (LBW) and assess the impact of maternal bio-psychosocial factors on the risk of CP in preterm infants across varying birth weights. Data for 15,181 prematurely born infants from 2009 to 2013 and 151,810 matched controls from Taiwan's National Health Insurance Research Database were analyzed. Period prevalence of CP, and comorbidities of LBW were verified, and odds ratios (ORs) were calculated. Results confirmed that increasing prematurity and low birth weight (LBW) rates in Taiwan. LBW was associated with higher CP prevalence. Maternal age extremes (<20 and >40 years) were significant risk factors of CP in LBW infants. LBW infants showed higher risks of respiratory, circulatory, and nervous system and psycho-developmental comorbidities compared to controls. Infants with the lowest birth weights had even higher ORs for these comorbidities. However, gastrointestinal and nutritional comorbidities were less prevalent in premature infants. Maternal factors such as family income, number of hospital admissions, and length of hospital stay were significantly correlated with birth weight and subsequent complications. Each additional gestational week significantly reduced the risk of complications in premature infants. Additionally, maternal bio-psychosocial factors were associated with birth weight and related outcomes in premature infants, emphasizing the importance of addressing these factors in prenatal care and interventions.
Keywords:
Preterm infants
; Low birth weight
; Comorbidities
; Maternal factors
; Cerebral palsy
; National Health Insurance Research Database
1. Introduction
Cerebral palsy (CP), one of the most prevalent motor disorders affecting children worldwide, results from a static brain lesion in pregnancy or early life[1]. It is characterized by impaired movement and posture, often accompanied by associated conditions such as intellectual impairment, epilepsy, and sensory deficits[2]. It represents a significant public health concern due to its lifelong impact on affected individuals and their families[3,4]. Despite advancements in perinatal care and medical interventions, CP continues to pose substantial challenges to clinical management and has long-term outcomes for affected children[5].
Analysis of the prevalence and risk factors of CP among children with low birth weight (LBW) is crucial for early intervention. While many studies have focused on CP prevalence in preterm populations in Western countries, research on preterm children in Asia is limited[6]. In Taiwan, prematurity rates have risen steadily, increasing from 8.85% to 10.73% between 2004 and 2014[7]. Wang et al.’s study using Taiwan’s National Health Insurance Research Database (NHIRD) found the highest CP prevalence among extremely low birth weight (ELBW) preterm children (147.3 cases per 1000 neonatal survivors), followed by very low birth weight (VLBW) preterm (97.2 cases) and LBW preterm (27.7 cases) children, with the lowest prevalence among term-born children (2.5 cases)[8].
Low birth weight, defined as birth weight below 2500 grams, is a well-established risk factor of adverse neonatal outcomes, including CP[1]. LBW infants face heightened susceptibility to a myriad of complications, stemming from intrauterine growth restriction, prematurity, or a combination[8]. These infants often require specialized care in neonatal intensive care units to mitigate potential morbidities and improve survival rates. Data on preterm populations consistently indicate that the prevalence of CP increases with decreased gestational age or birth weight. However, even for preterm infants at a similar gestational age or birth weight range, the estimations of CP prevalence significantly vary across studies[8,9,10,11].
The relationship between CP and LBW has been extensively studied, revealing a complex interplay between biological, environmental, and socioeconomic factors influencing neurodevelopmental outcomes. Epidemiological data consistently highlight LBW as a significant risk factor of CP, with LBW infants exhibiting a substantially higher prevalence of CP compared to their normal birth–weight counterparts. The etiology of CP in LBW infants is multifactorial, involving prenatal, perinatal, and postnatal factors that contribute to brain injury and subsequent motor impairment[1,10,11,12].
However, despite the wealth of evidence linking LBW and CP, knowledge gaps persist regarding the precise mechanisms underlying this association, as well as the specific risk factors that contribute to CP development in LBW infants. Moreover, the literature has a predominant focus on Western populations, with limited data available from Asian countries such as Taiwan.
Therefore, the present study aimed to address these knowledge gaps by conducting a nationwide population-based cohort study in Taiwan, focusing on the prevalence and risk analysis of CP in children with LBW. By capitalizing on the comprehensive dataset provided by the NHIRD, we aimed to elucidate the epidemiological profile of CP in LBW children, identify potential risk factors associated with CP development in this population, and explore the impact of sociodemographic factors on CP outcomes[13].
Through a rigorous analysis of longitudinal data spanning multiple years, we sought to provide valuable insights into the epidemiology and etiology of CP in LBW children in Taiwan to inform clinical practice, public health policies, and future research endeavors aimed at improving the prevention, diagnosis, and management of CP in this vulnerable population.
2. Materials and Methods
The participants were selected from meticulously organized datasets comprising comprehensive patient claims data from January 2009 to December 2013. These datasets encompassed three types of files: ambulatory care claims, inpatient claims, and beneficiary registries, all linked via encrypted but unique personal identification numbers. These files contained crucial information pertaining to patients’ medical diagnoses and demographic attributes. To ensure data accuracy, ambulatory care claims were confined to those sourced from outpatient care datasets specific to medical centers and individuals with severe medical conditions.
The enrolled individuals identified as born prematurely were classified based on specific codes (765.0x, 765.1x, and V21.3x) in the International Classification of Diseases, Ninth Edition, Clinical Modification (ICD-9-CM), 2001 Edition. These individuals comprised children born prematurely and aged under 6 years in 2009, including infants born prematurely and aged under 1 year in 2010. Patient characteristics, including sex, date of birth, family income, and place of residence, along with admission and visit dates, were meticulously documented.
Premature infants were further categorized into four groups based on birth weight standards outlined in the ICD-9-CM code for premature infants: <999 g; 1000–1499 g; 1500–1999 g; and 2000–2500 g (Table 1).
Control groups were matched with prematurity groups throughout the study period. Each premature infant was carefully matched by age and sex with 10 controls. Participants lacking medical records, both preterm and term-born children, were excluded from the study (Figure 1).
2.1. Definition of Comorbidities
Comorbidities of each individual were verified to ensure comprehensive examination of childhood health conditions. All enrolled individuals were included in the analysis to provide a thorough investigation. Making use of the unique identification number of each participant, we analyzed their inpatient and outpatient service records within the NHIRD for the presence of common comorbidities, as each medical claim record can contain additional ICD-9-CM codes. A comprehensive literature review informed the compilation of a list of comorbidities associated with preterm birth; their diagnostic codes are detailed in Supplementary Table 2. In addition, data on the number of admissions (NOA) and length of hospital stay (LOS) were collected for each participant and control.
2.2. Maternal Biopsychosocial Factors
Information on family income, maternal age at childbirth (MACB), and maternal NOA and LOS was obtained using the personal identification numbers of enrolled individuals and controls, which are linked to a beneficiary registry enabling indirect access to maternal data. Four maternal groups were characterized based on MACB: <20 years, 20–29 years, 30–39 years, and ≥40 years. This stratification facilitated comprehensive analysis of maternal influences on child health outcomes.
2.3. Statistical Analysis
All data processing procedures, including data selection, merging, and aggregation, as well as statistical analyses, were conducted using the R Project for Statistical Computing (version 3.6.2). The chi-square test was applied to examine both categorical and continuous demographic variables, including birth weight, sex, family income, and place of residence, of enrolled individuals and controls. Additionally, the binomial test was used to compare the proportions of CP prevalence in each premature group with the control group. A significance level of p ≤ 0.05 was used.
To evaluate comorbidities, the chi-square test was initially used to assess differences in the proportions of comorbidities between various birth-weight groups. Subsequently, conditional logistic regression was employed to compute sex- and age-stratified odds ratios (ORs) for each comorbidity of the birth-weight groups relative to the control group, providing nuanced insights into these associations. Furthermore, logistic regression was employed to determine the ORs of each comorbidity for various income levels compared to the control group. In addition, logistic regression facilitated the calculation of MACB-stratified ORs for various birth-weight groups relative to the control group and offered a comprehensive understanding of the impact of maternal age, comorbidities, and birth complications.
Maternal and infant outcomes, including the NOA and LOS, were assessed using analysis of variance (ANOVA) to examine the differences between birth-weight groups, with the addition of Pearson correlation coefficients to measure the strength of association. Where ANOVA assumptions were not met, alternative statistical methods such as the Kruskal–Wallis test and Welch’s ANOVA were employed to evaluate medians rigorously.
3. Results
3.1. Descriptive Statistics of Demographic Characteristics
Table 2 presents demographic characteristics of enrollees and controls. A total of 15,181 enrollees and 151,810 controls were included in the analysis. The birth-weight distribution of enrollees was as follows: 14.76% had a birth weight of <1000 g; 29.39% were in the range of 1000–1499 g; 34.52% were 1500–1999 g; and 21.34% were 2000–2500 g. The proportion of females was similar between enrollees (46.89%) and controls (46.89%), as was the proportion of males (53.11% for both), with a p-value of 1.0002 for the sex distribution, indicating no significant difference between the groups. Analysis of household income revealed differences between enrollees and controls.
A higher proportion of enrollees were in the lowest income level (22.71%) compared to controls (11.54%). Conversely, a smaller proportion of enrollees were in the highest income level (12.86%) compared to controls (15.71%). This difference was statistically significant (p < 0.0011). Geographic distribution also differed between the two groups. While 47.84% of the enrollees were born in northern Taiwan, this proportion was slightly higher for the controls (53.93%). Conversely, enrollees were less represented in the central, southern, eastern, and off-island regions compared to controls. The differences in geographic distribution were statistically significant (p < 0.0011), indicating regional disparities between enrollees and controls.
3.2. Comorbidities of Premature Infants Stratified by Family Income Level
Table 3 presents the ORs of premature comorbidities stratified by family income level. In the lowest income bracket (0–10000 new Taiwan dollars [NTD]), the enrollees had significantly higher odds of respiratory (OR=2.31; 95% CI: 2.11–1.31), circulatory (OR=2.68; 95% CI: 2.27–3.10), neurological (OR=2.61; 95% CI: 2.25–2.97), psycho-developmental (OR=1.51; 95% CI: 1.29–1.73), and GI and nutritional (OR=1.51; 95% CI: 1.29–1.73) comorbidities compared to the controls. Similarly, in the 10000–25000 income bracket, enrollees had increased odds of respiratory (OR=1.21; 95% CI: 1.12–1.31), circulatory (OR=1.53; 95% CI: 1.34–1.73), neurological (OR=1.50; 95% CI: 1.32–1.67), and psycho-developmental (OR=1.01; 95% CI: 0.88–1.13) comorbidities.
Notably, for circulatory and psycho-developmental comorbidities in the highest income bracket (>50000 NTD), no OR was estimated due to the limited sample size. Our findings indicate a significant association between family income level and psycho-developmental comorbidities of infants born prematurely and with LBW, suggesting that lower income is linked to higher ORs for these comorbidities. Similarly, for pulmonary and circulatory comorbidities in prematurely born infants, increased ORs were observed only in the two groups with the lowest income levels. In addition, only the lowest income level showed an increased OR for GI–nutritional comorbidities. Conversely, income level showed a weak association with neurological comorbidities. These results emphasize the socioeconomic disparities in the prevalence of specific comorbidities in prematurely born infants and underscore the importance of addressing socioeconomic factors in healthcare interventions aimed at reducing the burden of these conditions in vulnerable populations.
3.3. Common Comorbidities in Infants Born Prematurely and the Association with Birth Weight
Table 4 presents the ORs of neurological comorbidities for different LBW groups compared to the normal control group in Taiwan between 2009 and 2014. In the case of congenital brain anomalies, all LBW groups had significantly higher odds compared to the normal control group. The highest OR was observed for the <1000 g group (OR: 6.55; 95% CI: 5.30–8.09), followed by the 1000–1499 g group (OR: 6.14; 95% CI: 5.24–7.20), 1500–1999 g group (OR: 5.54; 95% CI: 4.75–6.47), and 2000–2499 g group (OR: 6.35; 95% CI: 5.31–7.59). Similarly, for CP, the OR decreased with increasing birth weight. The highest OR was observed for the <1000 g group (OR: 11.80; 95% CI: 9.42–14.79), followed by the 1000–1499 g group (OR: 5.53; 95% CI: 4.41–6.93), 1500–1999 g group (OR: 3.36; 95% CI: 2.57–4.38), and 2000–2499 g group (OR: 1.47; 95% CI: 0.90–2.39).
Similar trends were observed for other neurological comorbidities such as hydrocephalus, stroke, ophthalmic problems, and epilepsy, with significantly higher ORs for lower-birth-weight groups compared to the control. Certain comorbidities such as movement disorders, sleep disorders, and anxiety showed decreasing ORs with increasing birth weight. These findings underscore the association between LBW and increased risk of neurological comorbidities in children.
Figure 2 illustrates all comorbidities with an OR greater than 1 for various birth-weight groups relative to the control group. It demonstrates a correlation wherein lower birth weight of prematurely born infants is correlated with a higher number of comorbidities with an OR greater than 1 compared to the control group. All infants born prematurely had respiratory distress syndrome (RDS), congenital brain anomalies, respiratory failure, cerebral palsy, and congenital heart diseases. Notably, RDS and respiratory failure showed a trend in which lower birth weight was correlated with a significantly higher OR. In addition, all infants born prematurely with a birth weight below 2000 g experienced ophthalmic problems. Those with a birth weight below 1500 g showed significantly more comorbidities, including mixed developmental delay, hydrocephalus, and pulmonary hypertension, compared to those with a birth weight of 1500 g or higher. Specifically, the <1000 g group showed a higher OR for stroke (2.44) compared to the 1000–1499 g group.
Figure 3 reveals a notable inverse correlation between the prevalence of CP and birth weight, highlighting the substantially higher prevalence of CP in babies with lower birth weights. Infants born under 1000 g have an over 11-fold increased risk of CP compared to those born weighing 2500 g or more. Each ascending birth weight category (1000-1499 g, 1500–1999 g, and 2000–2499 g) shows a decreased risk, demonstrating a clear link between higher birth weight and reduced CP prevalence. The binomial test results indicate a high level of statistical significance (p<0.001) for the lower weight categories compared to the control group, confirming the robustness of this association. However, the 2000-2499 g group does not show a statistically significant difference from the control group (p=0.123).
This trend underscores the significant impact of birth weight on the likelihood of developing CP, with lower birth weights being correlated with a higher prevalence of this neurological condition. This finding emphasizes the critical role of birth weight as a predictive factor of CP development and underscores the importance of early interventions and tailored care for infants with lower birth weights to mitigate the risk of CP.
3.4. Inpatient Care Use
Table 5 presents the admission frequency and LOS in hospital of both preterm infants and mothers, categorized by birth-weight group. For preterm infants, the mean NOA increased with decreasing birth weight. Specifically, infants weighing less than 1000 g had the highest mean NOA (2.80, SD=2.67), followed by those in the 1000–1499 g (2.35, SD=2.30), 1500–1999 g (2.23, SD=2.27), and 2000–2499 g (2.30, SD=2.32) groups. The NOA of these groups was significantly higher than that of the control group (mean NOA = 2.00, SD=1.89). Statistical analysis indicated a significant difference in NOA between the birth-weight groups (p < 0.001).
Similarly, there was a decreasing trend in LOS in hospital of preterm infants with increasing birth weight. Infants weighing less than 1000 g had the longest mean LOS (16.85 days, SD=26.07), followed by the 2000–2499 g (13.05 days, SD=23.25), 1000–1499 g (12.11 days, SD=17.55), and 1500–1999 g (12.01 days, SD=21.28) groups. The LOS of these groups was significantly higher than that of the control group (mean LOS = 8.80 days, SD=12.96). The differences in LOS between the birth-weight groups were statistically significant (p < 0.001).
Furthermore, similar trends were observed for mothers in both NOA and LOS. Mothers of infants with lower birth weights had a higher mean NOA and longer LOS compared to mothers of infants with higher birth weights and the control group. Statistical analysis revealed significant differences in both NOA and LOS between the birth-weight groups (p < 0.001). These findings underscore the increased healthcare use by and duration of hospitalization of both preterm infants and their mothers, particularly infants with lower birth weights and their mothers, necessitating comprehensive care and support strategies for this vulnerable population.
3.5. Correlations of NOA and LOS of Preterm Infants and Mothers
Figure 4 illustrates correlations between NOA and birth-weight categories and reported the positive correlation (Pearson r = 0.61, p < 0.001) between the NOA of preterm infants and of mothers and different birth-weight categories. As the birth weight decreased, the NOA of pre-term infants and that of mothers showed an upward trend, indicating a potential association between maternal and infant healthcare use. Furthermore, the relationship between the LOS of preterm infants (Pearson r = 0.53, p < 0.001) and the NOA of mothers across birth weight categories was explored. A similar positive correlation was evident, with lower-birth-weight categories associated with longer LOS of preterm infants and higher NOA of mothers. This trend suggests that infants born with lower birth weights may require more extended hospital stays, potentially leading to increased healthcare use by mothers.
Overall, these findings underscore the interconnectedness of maternal and infant healthcare experiences, highlighting the importance of considering both maternal and infant factors in the management of preterm birth and associated healthcare needs.
3.6. Association Between Low Birth Weight and Maternal Age
Table 6 presents the association between LBW and MACB, revealing noteworthy trends across different maternal-age groups. Among enrollees, LBW infants exhibited different ORs across maternal-age categories. The ORs of infants weighing less than 1000 g of mothers aged <20 years (OR: 2.29; 95% CI: 1.07–4.92) and mothers aged ≥40 years (OR: 2.57; 95% CI: 1.78–3.72) were significantly elevated. Similarly, the ORs of infants weighing 1000–1499 g of both younger and older maternal-age groups were elevated. Notably, the OR of infants weighing 2000–2499 g of mothers aged ≥40 years showed an increase (OR: 2.68; 95% CI: 2.04–3.51). Conversely, no significant associations were observed between LBW and maternal age in the case of the control group. These findings underscore the complex interplay between LBW and maternal age, suggesting differential risk patterns across LBW categories and maternal-age groups.
4. Discussion
In this nationwide population-based cohort study conducted in Taiwan, we aimed to investigate the prevalence of CP and its associated risk factors among children with LBW. Our findings focus on the epidemiology of CP in this vulnerable population and provide valuable insights for clinical practice and public health interventions.
Our findings revealed a notably higher prevalence of CP among children with LBW compared to the general population. This finding is consistent with previous research, which has consistently identified LBW as a significant risk factor of CP development[14,15,16]. A cohort study by Wang et al. using Taiwan’s NHIRD data reported LBW, extreme prematurity as notable risk factors of CP in Taiwanese Children[8]. Kim et al. also found that LBW prevalence rose from 1.40% in 2007 to 2.09% in 2011, a nearly 1.5-fold increase. In addition, the proportion of individuals with a history of prematurity or LBW among those with CP increased from 29.8% in 2007 to 37.7% in 2011[17]. Moreover, the findings of our study highlighted an inverse correlation between CP incidence and birth-weight categories, further supporting the established association between LBW and CP. This result underscores the pivotal role of birth weight as a predictive factor of CP in children and emphasizes the urgent need for targeted screening and intervention strategies for LBW infants.
Our study also found that prematurely born infants faced an increased risk of various comorbidities, which affected their respiratory, circulatory, and nervous systems and psychological development. Similar findings have been reported by other studies, indicating that preterm birth is linked to increased risks of diverse multimorbidity patterns[12,18,19]. In addition, Chang et al.’s study of a Taiwanese cohort revealed that preterm babies were more susceptible to mortality and development of morbidities, with patients with CP being particularly vulnerable to various diseases[20].
Furthermore, our study investigated the impact of socioeconomic factors on CP prevalence among LBW infants. We observed a significant association between family income level and the likelihood of psycho-developmental comorbidities among LBW infants. Previous studies have consistently highlighted the vulnerability of premature infants to lifelong neurological conditions such as CP, autism spectrum disorder, learning disability, and cognitive or developmental delays[21,22]. Our findings are similar to those of a systematic review conducted by Solaski et al., which identified low socioeconomic status as a significant risk factor of increased CP prevalence[23]. Similarly, a study conducted in Korea revealed a marked discrepancy in CP incidence between affluent and deprived groups, with the latter experiencing significantly higher rates. Specifically, lower family income was correlated with a higher risk of psycho-developmental comorbidities, emphasizing the role of socioeconomic status in shaping health outcomes in vulnerable populations[17].
Our analysis of healthcare patterns also shed light on the needs of LBW infants and their mothers. We found a correlation between birth-weight categories and preterm infant admissions and maternal admissions, suggesting intertwined healthcare use. LBW categories were associated with longer preterm infant hospital stays and more maternal admissions, emphasizing the need for comprehensive support strategies for LBW infants and their mothers. These findings align with those of previous studies showing that longer hospital stays are linked to LBW[24,25]. Mehretie et al.'s cross-sectional study further linked gestational age, complications, and initial management with duration of hospital stay of VLBW preterm neonates[26]. This highlights the importance of coordinated care and multidisciplinary interventions for addressing the complex healthcare needs of LBW infants and their families.
Our analysis also explored the relationship between CP prevalence and maternal age. Interestingly, we found that infants with LBW born to mothers aged below 20 years or above 40 years exhibited significantly higher odds of CP compared to those born to mothers aged 20–30 years. This finding aligns with the results of previous research emphasizing maternal age as a risk factor of adverse pregnancy outcomes and neurodevelopmental disorders in offspring[27,28,29]. A Taiwanese cohort study revealed that a maternal age of 25–29 years was associated with a lower risk of preterm birth, followed by 30–34 years. In contrast, the >35-year age group showed increased odds[7,30]. These findings suggest that extremes in maternal age may contribute to the heightened risk of CP among LBW infants, possibly due to maternal health conditions or disparities in prenatal care associated with advanced or adolescent maternal age.
The strengths of our study are its large sample size, population-based design, and comprehensive analysis of risk factors and healthcare-use patterns providing robust evidence for our findings. The use of nationwide data allowed us to capture a representative sample of LBW infants and their mothers. Moreover, our study employed standardized diagnostic criteria for CP and rigorous statistical methods to adjust for potential confounders, which enhanced the validity and reliability of our results.
Despite these strengths, our study has some limitations that warrant consideration. The retrospective nature of the study design limited our ability to establish causal relationships between risk factors and CP outcomes. In addition, the reliance on an administrative database might have introduced biases related to data completeness and accuracy. Furthermore, the lack of detailed clinical information, such as gestational age and severity of CP, limited our ability to perform subgroup analyses and explore potential effect modifiers.
This study significantly contributes to the understanding of CP prevalence among and risk factors of children with LBW in Taiwan. It underscores the importance of early identification and intervention strategies targeting LBW infants, particularly those born to mothers in extreme age groups or from disadvantaged socioeconomic backgrounds.
Recommendations and future research
Based on our study, we recommend enhancing the care for children with LBW and CP in Taiwan through early screening and intervention. This includes implementing standardized protocols to detect CP in LBW infants and providing prompt access to physical, occupational, and speech therapy. Strengthening maternal and infant healthcare services, addressing socioeconomic disparities, promoting healthcare integration, and raising public awareness about CP are also crucial. These measures aim to optimize outcomes and support families facing the challenges of caring for children with LBW and CP.
Future research should focus on elucidating the underlying mechanisms linking LBW to CP and developing tailored interventions to mitigate CP risk of vulnerable populations. In addition, prospective studies with longitudinal follow-up are needed to further elucidate the long-term outcomes and trajectories of LBW infants with CP. By addressing these gaps in knowledge, we can enhance early intervention efforts and improve outcomes for children with LBW and CP.
5. Conclusions
In conclusion, our nationwide population-based cohort study provides valuable insights into the prevalence of and risk factors associated with CP among children with LBW in Taiwan. Our findings highlight the increased risk of CP among LBW infants and underscore the importance of early detection, intervention, and comprehensive healthcare support for this vulnerable population. By identifying maternal age, family income level, and healthcare use patterns as significant predictors of CP among LBW infants, our study informs targeted intervention strategies aimed at reducing the burden of CP and improving outcomes for affected children and their families. Concerted efforts from healthcare providers, policymakers, and community stakeholders are needed to implement evidence-based interventions and support programs to address the complex needs of children with LBW and CP in Taiwan. Collaborative efforts and proactive initiatives can enhance the quality of care and promote better health outcomes for children with LBW and CP, ultimately improving their quality of life and long-term prognosis.
Supplementary Materials
The following supporting information can be downloaded at the website of this paper posted on Preprints.org.
Author Contributions
Conceptualization, H.-C.F. and K.-L.C.; methodology, Y.-M.C., J.-Y.L., and F.-C.K..; software, Y.-M.C., J.-Y.L., and F.-C.K.; validation, K.-L.C.; formal analysis, K.-L.C.; investigation, S, -W. H., C, -M. C., and D, -S. W.; resources, Y.-M.C., J.-Y.L., and F.-C.K.; data curation, Y.-M.C., J.-Y.L., and F.-C.K.; writing—original draft preparation, H.-C.F.; writing—review and editing, S, -W. H., C, -M. C., and D, -S. W.; visualization, K.-L.C.; supervision, C, -M. C.; project administration, Y.-M.C. and J.-Y.L..; funding acquisition, K.-L.C. and F.-C.K.. All authors have read and agreed to the published version of the manuscript.
Funding
This work was supported by grants from the Tungs’ MetroHarbor Hospital (grant number:TTMHH-C1130022) and the Academic Development Committee of Hungkuang University (Grant number: TCVGH-HK1078002).
Institutional Review Board Statement
This study was reviewed and review exemptions have been approved by the Institutional Review Board of the Kuang Tien General Hospital. On 25/Mar/2021 (KTGH11015)
Informed Consent Statement
Due to the anonymized nature of the dataset, the need for informed consent was waived.
Data Availability Statement
The following information was supplied regarding data availability: Data are available from the National Health Insurance Research Database (NHIRD) published by Taiwan National Health Insurance (NHI) Bureau. The data utilized in this study cannot be made available in the paper, the supplementalfiles,orinapublicrepository due to the ‘‘Personal Information Protection Act’’ executed by Taiwan’s government, starting from 2012. Requests for data can be sent as a formal proposal to the NHIRD (http://nhird.nhri.org.tw) or by email to nhird@nhri.org.tw.
Acknowledgments
We would like to express our sincere gratitude to Kai-Ping Chang (Division of Pediatric Neurology, Department of Pediatrics, Taipei Veterans General Hospital, Taipei, Taiwan; Department of Pediatrics, Wei-Gong Memorial Hospital, Miaoli, Taiwan). Shyi-Jou Chen (Department of Pediatrics, Tri-Service general hospital, Taipei, Taiwan). I-Ching Chou (Department of Pediatrics, Children’s medical center, China Medical University Hospital, Taichung, Taiwan), Wang-Tso Lee (Department of Pediatric Neurology, National Taiwan University Children’s Hospital), and Kuang-Lin Lin and Huei-Shyong Wang (Division of Pediatric Neurology, Chang Gung Children’s Hospital at Linkou, Taoyuan, Taiwan; College of Medicine, Chang Gung University, Taoyuan, Taiwan), Ching-Shiang Chi (Department of Pediatrics, Taichung Veterans General Hospital), for their helpful suggestions and comments.
Conflicts of Interest
The authors declare no conflict of interest. The funders had no role in the design of the study; in the collection, analyses, or interpretation of data; in the writing of the manuscript, or in the decision to publish the results.
References
- Fan, H.C.; Ho, L.I.; Chi, C.S.; Cheng, S.N.; Juan, C.J.; Chiang, K.L.; Lin, S.Z.; Harn, H.J. Current proceedings of cerebral palsy. Cell Transplant 2015, 24, 471–485. [Google Scholar] [CrossRef] [PubMed]
- Rosenbaum, P. Cerebral palsy: what parents and doctors want to know. BMJ 2003, 326, 970–974. [Google Scholar] [CrossRef]
- Sadowska, M.; Sarecka-Hujar, B.; Kopyta, I. Cerebral Palsy: Current Opinions on Definition, Epidemiology, Risk Factors, Classification and Treatment Options. Neuropsychiatr Dis Treat 2020, 16, 1505–1518. [Google Scholar] [CrossRef] [PubMed]
- Paneth, N. Cerebral palsy as a public health indicator. Paediatr Perinat Epidemiol 2023, 37, 413–414. [Google Scholar] [CrossRef] [PubMed]
- Badawi, N.; McIntyre, S.; Hunt, R.W. Perinatal care with a view to preventing cerebral palsy. Dev Med Child Neurol 2021, 63, 156–161. [Google Scholar] [CrossRef] [PubMed]
- Oskoui, M.; Coutinho, F.; Dykeman, J.; Jette, N.; Pringsheim, T. An update on the prevalence of cerebral palsy: a systematic review and meta-analysis. Dev Med Child Neurol 2013, 55, 509–519. [Google Scholar] [CrossRef] [PubMed]
- Wu, S.T.; Lin, C.H.; Lin, Y.H.; Hsu, Y.C.; Hsu, C.T.; Lin, M.C. Maternal risk factors for preterm birth in Taiwan, a nationwide population-based cohort study. Pediatr Neonatol 2024, 65, 38–47. [Google Scholar] [CrossRef] [PubMed]
- Wang, H.H.; Hwang, Y.S.; Ho, C.H.; Lai, M.C.; Chen, Y.C.; Tsai, W.H. Prevalence and Initial Diagnosis of Cerebral Palsy in Preterm and Term-Born Children in Taiwan: A Nationwide, Population-Based Cohort Study. Int J Environ Res Public Health 2021, 18. [Google Scholar] [CrossRef]
- McIntyre, S.; Goldsmith, S.; Webb, A.; Ehlinger, V.; Hollung, S.J.; McConnell, K.; Arnaud, C.; Smithers-Sheedy, H.; Oskoui, M.; Khandaker, G.; et al. Global prevalence of cerebral palsy: A systematic analysis. Dev Med Child Neurol 2022, 64, 1494–1506. [Google Scholar] [CrossRef]
- Chen, R.; Sjolander, A.; Johansson, S.; Lu, D.; Razaz, N.; Tedroff, K.; Villamor, E.; Cnattingius, S. Impact of gestational age on risk of cerebral palsy: unravelling the role of neonatal morbidity. Int J Epidemiol 2022, 50, 1852–1863. [Google Scholar] [CrossRef]
- Arnaud, C.; Ehlinger, V.; Delobel-Ayoub, M.; Klapouszczak, D.; Perra, O.; Hensey, O.; Neubauer, D.; Hollody, K.; Virella, D.; Rackauskaite, G.; et al. Trends in Prevalence and Severity of Pre/Perinatal Cerebral Palsy Among Children Born Preterm From 2004 to 2010: A SCPE Collaboration Study. Front Neurol 2021, 12, 624884. [Google Scholar] [CrossRef] [PubMed]
- Chiang, K.L.; Huang, C.Y.; Fan, H.C.; Kuo, F.C. Prolonged length of stay for acute hospital admissions as the increasing of age: A nationwide population study for Taiwan's patients with cerebral palsy. Pediatr Neonatol 2019, 60, 74–82. [Google Scholar] [CrossRef] [PubMed]
- Hsieh, C.Y.; Su, C.C.; Shao, S.C.; Sung, S.F.; Lin, S.J.; Kao Yang, Y.H.; Lai, E.C. Taiwan's National Health Insurance Research Database: past and future. Clin Epidemiol 2019, 11, 349–358. [Google Scholar] [CrossRef] [PubMed]
- Chang, M.J.; Ma, H.I.; Lu, T.H. Estimating the prevalence of cerebral palsy in Taiwan: A comparison of different case definitions. Res Dev Disabil 2015, 36C, 207–212. [Google Scholar] [CrossRef] [PubMed]
- Murphy, D.J.; Hope, P.L.; Johnson, A. Neonatal risk factors for cerebral palsy in very preterm babies: case-control study. BMJ 1997, 314, 404–408. [Google Scholar] [CrossRef] [PubMed]
- Touyama, M.; Touyama, J.; Toyokawa, S.; Kobayashi, Y. Trends in the prevalence of cerebral palsy in children born between 1988 and 2007 in Okinawa, Japan. Brain Dev 2016, 38, 792–799. [Google Scholar] [CrossRef] [PubMed]
- Kim, S.W.; Jeon, H.R.; Shin, J.C.; Youk, T.; Kim, J. Incidence of Cerebral Palsy in Korea and the Effect of Socioeconomic Status: A Population-Based Nationwide Study. Yonsei Med J 2018, 59, 781–786. [Google Scholar] [CrossRef] [PubMed]
- Cremer, N.; Hurvitz, E.A.; Peterson, M.D. Multimorbidity in Middle-Aged Adults with Cerebral Palsy. Am J Med 2017, 130, 744–e749. [Google Scholar] [CrossRef] [PubMed]
- Heikkila, K.; Metsala, J.; Pulakka, A.; Nilsen, S.M.; Kivimaki, M.; Risnes, K.; Kajantie, E. Preterm birth and the risk of multimorbidity in adolescence: a multiregister-based cohort study. Lancet Public Health 2023, 8, e680–e690. [Google Scholar] [CrossRef]
- Chang, Y.K.; Tseng, Y.T.; Chen, K.T. The epidemiologic characteristics and associated risk factors of preterm birth from 2004 to 2013 in Taiwan. BMC Pregnancy Childbirth 2020, 20, 201. [Google Scholar] [CrossRef]
- Laverty, C.; Surtees, A.; O'Sullivan, R.; Sutherland, D.; Jones, C.; Richards, C. The prevalence and profile of autism in individuals born preterm: a systematic review and meta-analysis. J Neurodev Disord 2021, 13, 41. [Google Scholar] [CrossRef] [PubMed]
- Spittle, A.J.; Morgan, C.; Olsen, J.E.; Novak, I.; Cheong, J.L.Y. Early Diagnosis and Treatment of Cerebral Palsy in Children with a History of Preterm Birth. Clin Perinatol 2018, 45, 409–420. [Google Scholar] [CrossRef] [PubMed]
- Solaski, M.; Majnemer, A.; Oskoui, M. Contribution of socio-economic status on the prevalence of cerebral palsy: a systematic search and review. Dev Med Child Neurol 2014, 56, 1043–1051. [Google Scholar] [CrossRef] [PubMed]
- Faramarzi, R.; Darabi, A.; Emadzadeh, M.; Maamouri, G.; Rezvani, R. Predicting neurodevelopmental outcomes in preterm infants: A comprehensive evaluation of neonatal and maternal risk factors. Early Hum Dev 2023, 184, 105834. [Google Scholar] [CrossRef] [PubMed]
- Jadi, J.; Hyder, S.; Rodriguez Ormaza, N.P.; Twer, E.; Phillips, M.; Akinkuotu, A.; Reid, T.D. Evaluation of Complications and Weight Outcomes in Pediatric Cerebral Palsy Patients With Gastrostomy Tubes. Am Surg 2023, 89, 632–640. [Google Scholar] [CrossRef] [PubMed]
- Mehretie, Y.; Amare, A.T.; Getnet, G.B.; Mekonnen, B.A. Length of hospital stay and factors associated with very-low-birth-weight preterm neonates surviving to discharge a cross-sectional study, 2022. BMC Pediatr 2024, 24, 80. [Google Scholar] [CrossRef]
- Keiser, A.M.; Salinas, Y.D.; DeWan, A.T.; Hawley, N.L.; Donohue, P.K.; Strobino, D.M. Risks of preterm birth among non-Hispanic black and non-Hispanic white women: Effect modification by maternal age. Paediatr Perinat Epidemiol 2019, 33, 346–356. [Google Scholar] [CrossRef]
- Razaz, N.; Cnattingius, S.; Lisonkova, S.; Nematollahi, S.; Oskoui, M.; Joseph, K.S.; Kramer, M. Pre-pregnancy and pregnancy disorders, pre-term birth and the risk of cerebral palsy: a population-based study. Int J Epidemiol 2023, 52, 1766–1773. [Google Scholar] [CrossRef]
- Sundelin, H.E.K.; Stephansson, O.; Johansson, S.; Ludvigsson, J.F. Pregnancy outcome in women with cerebral palsy: A nationwide population-based cohort study. Acta Obstet Gynecol Scand 2020, 99, 518–524. [Google Scholar] [CrossRef]
- Vogel, J.P.; Chawanpaiboon, S.; Moller, A.B.; Watananirun, K.; Bonet, M.; Lumbiganon, P. The global epidemiology of preterm birth. Best Pract Res Clin Obstet Gynaecol 2018, 52, 3–12. [Google Scholar] [CrossRef]
Figure 1.
Figure 1. Flowchart of the patient selection process in this study.
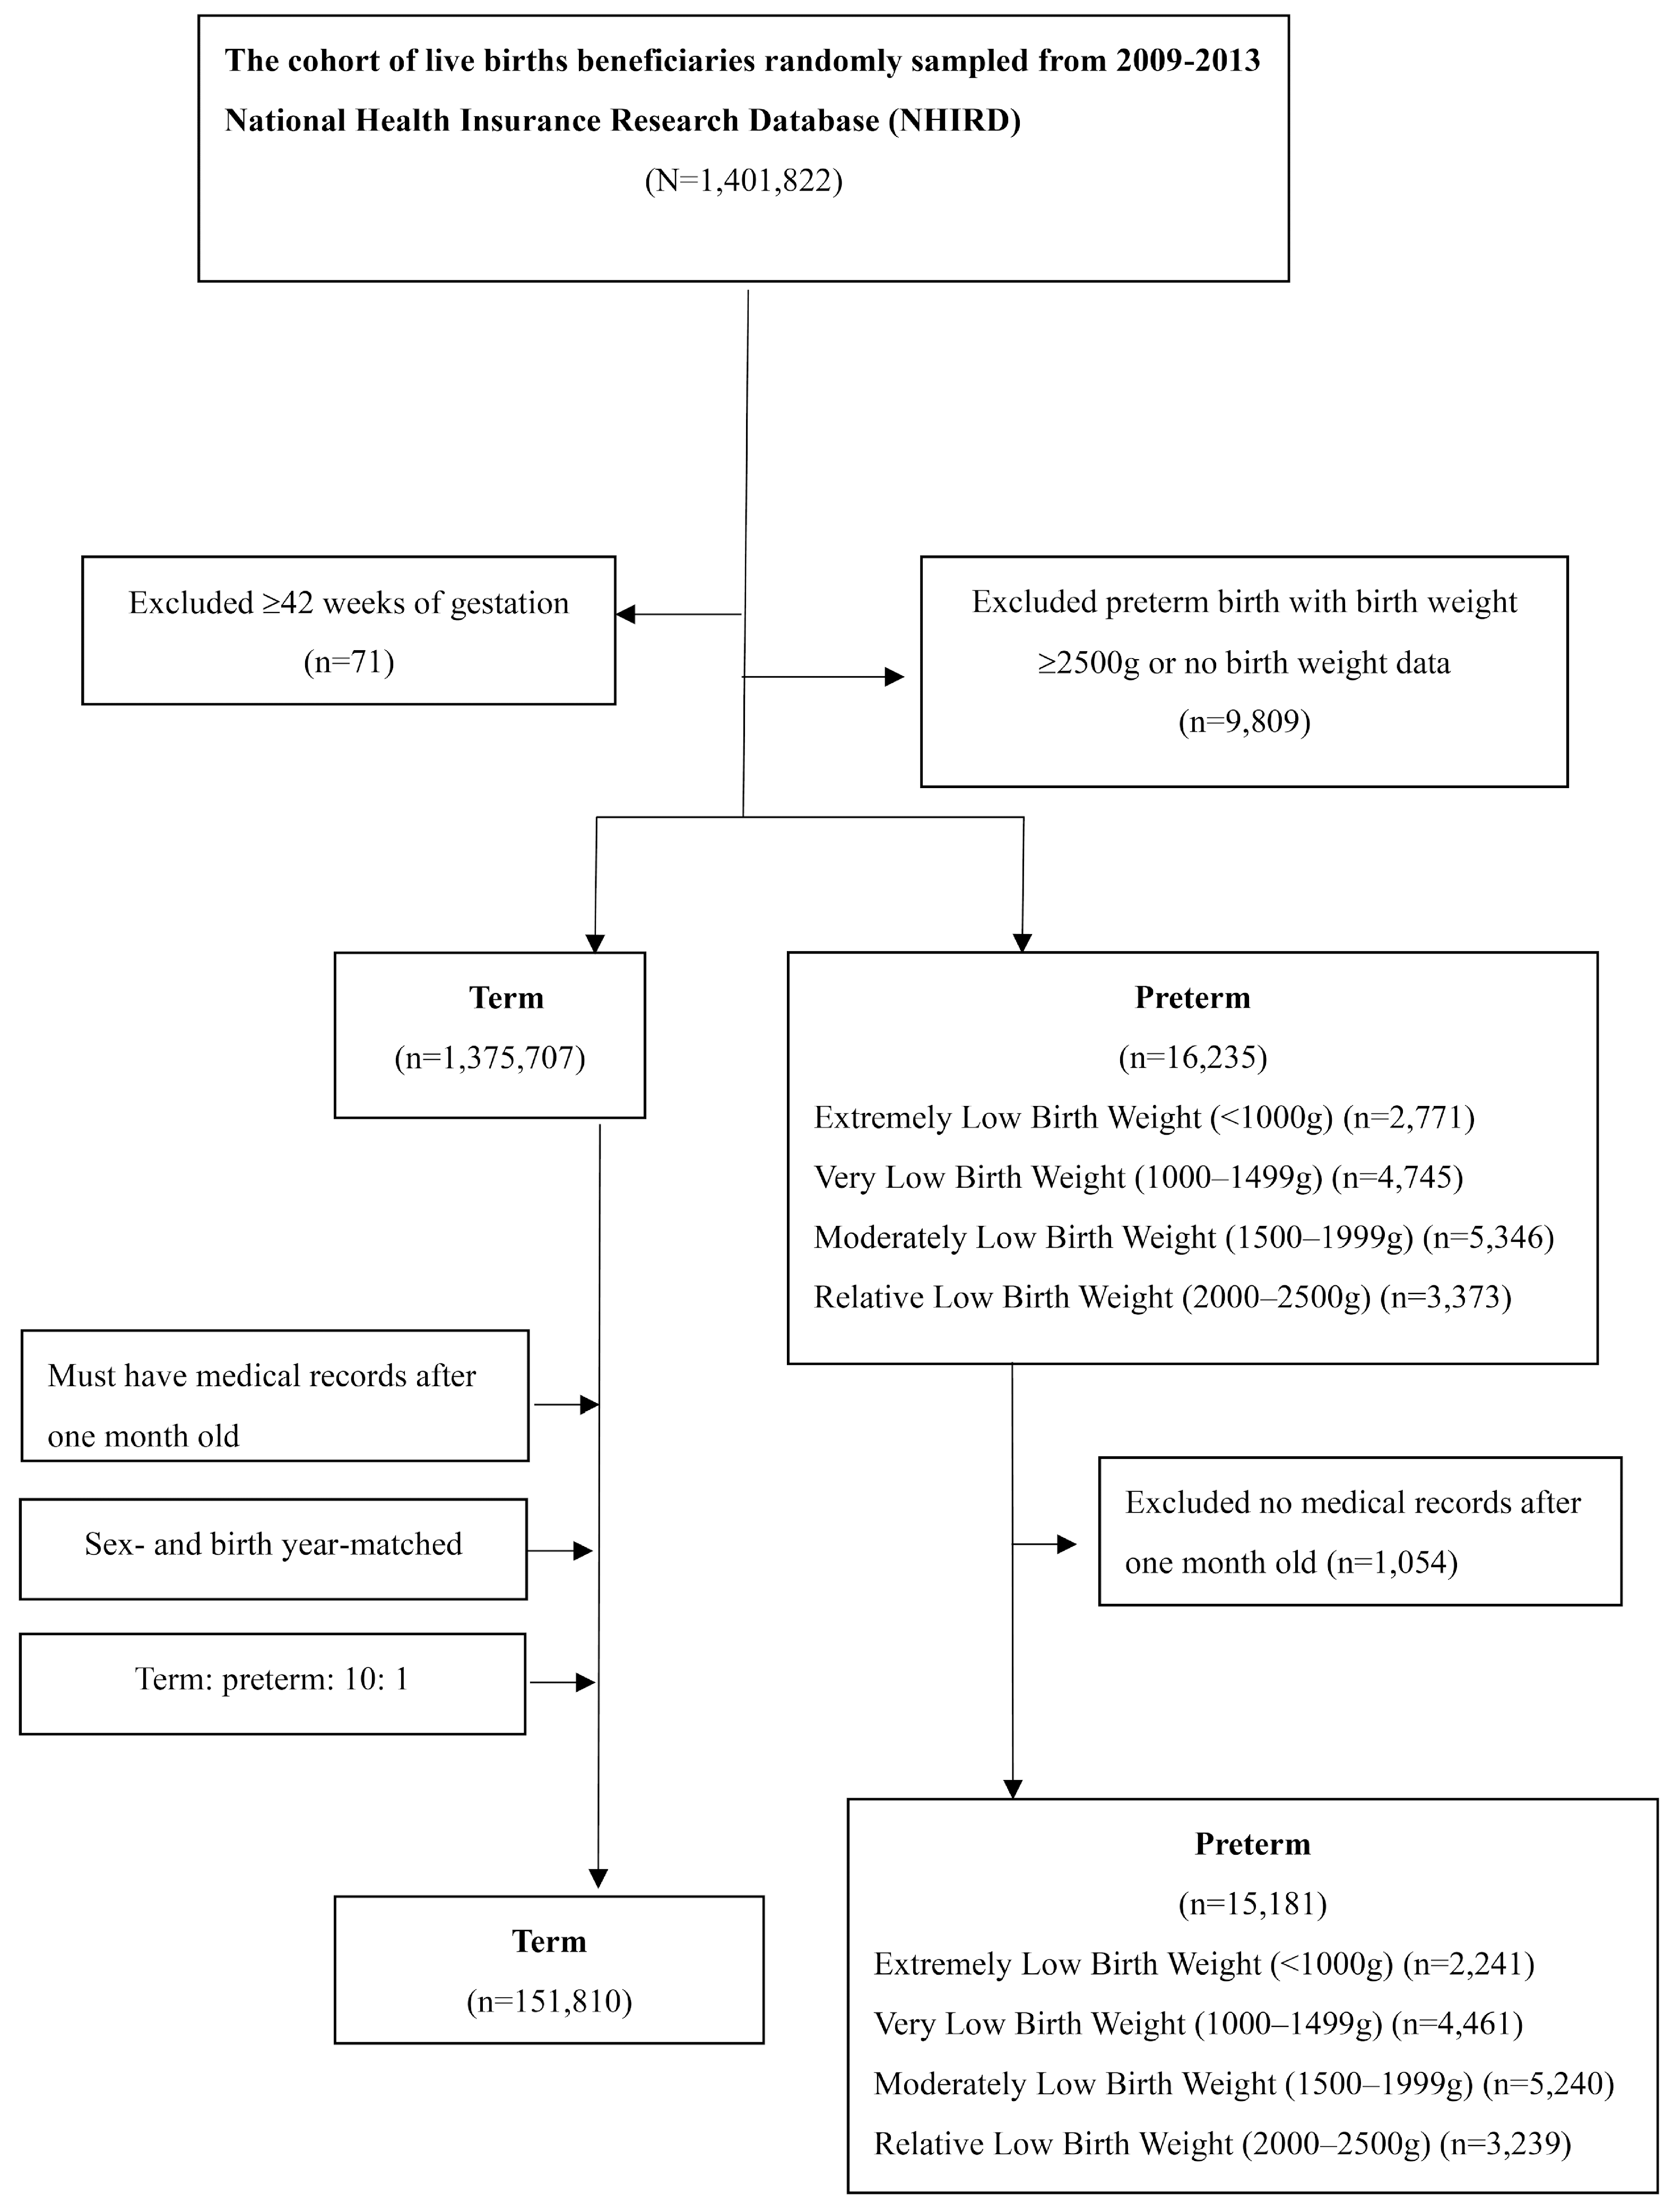
Figure 2.
Comorbidities with odds ratio >1 in different birth-weight groups compared to the control group.
Figure 2.
Comorbidities with odds ratio >1 in different birth-weight groups compared to the control group.
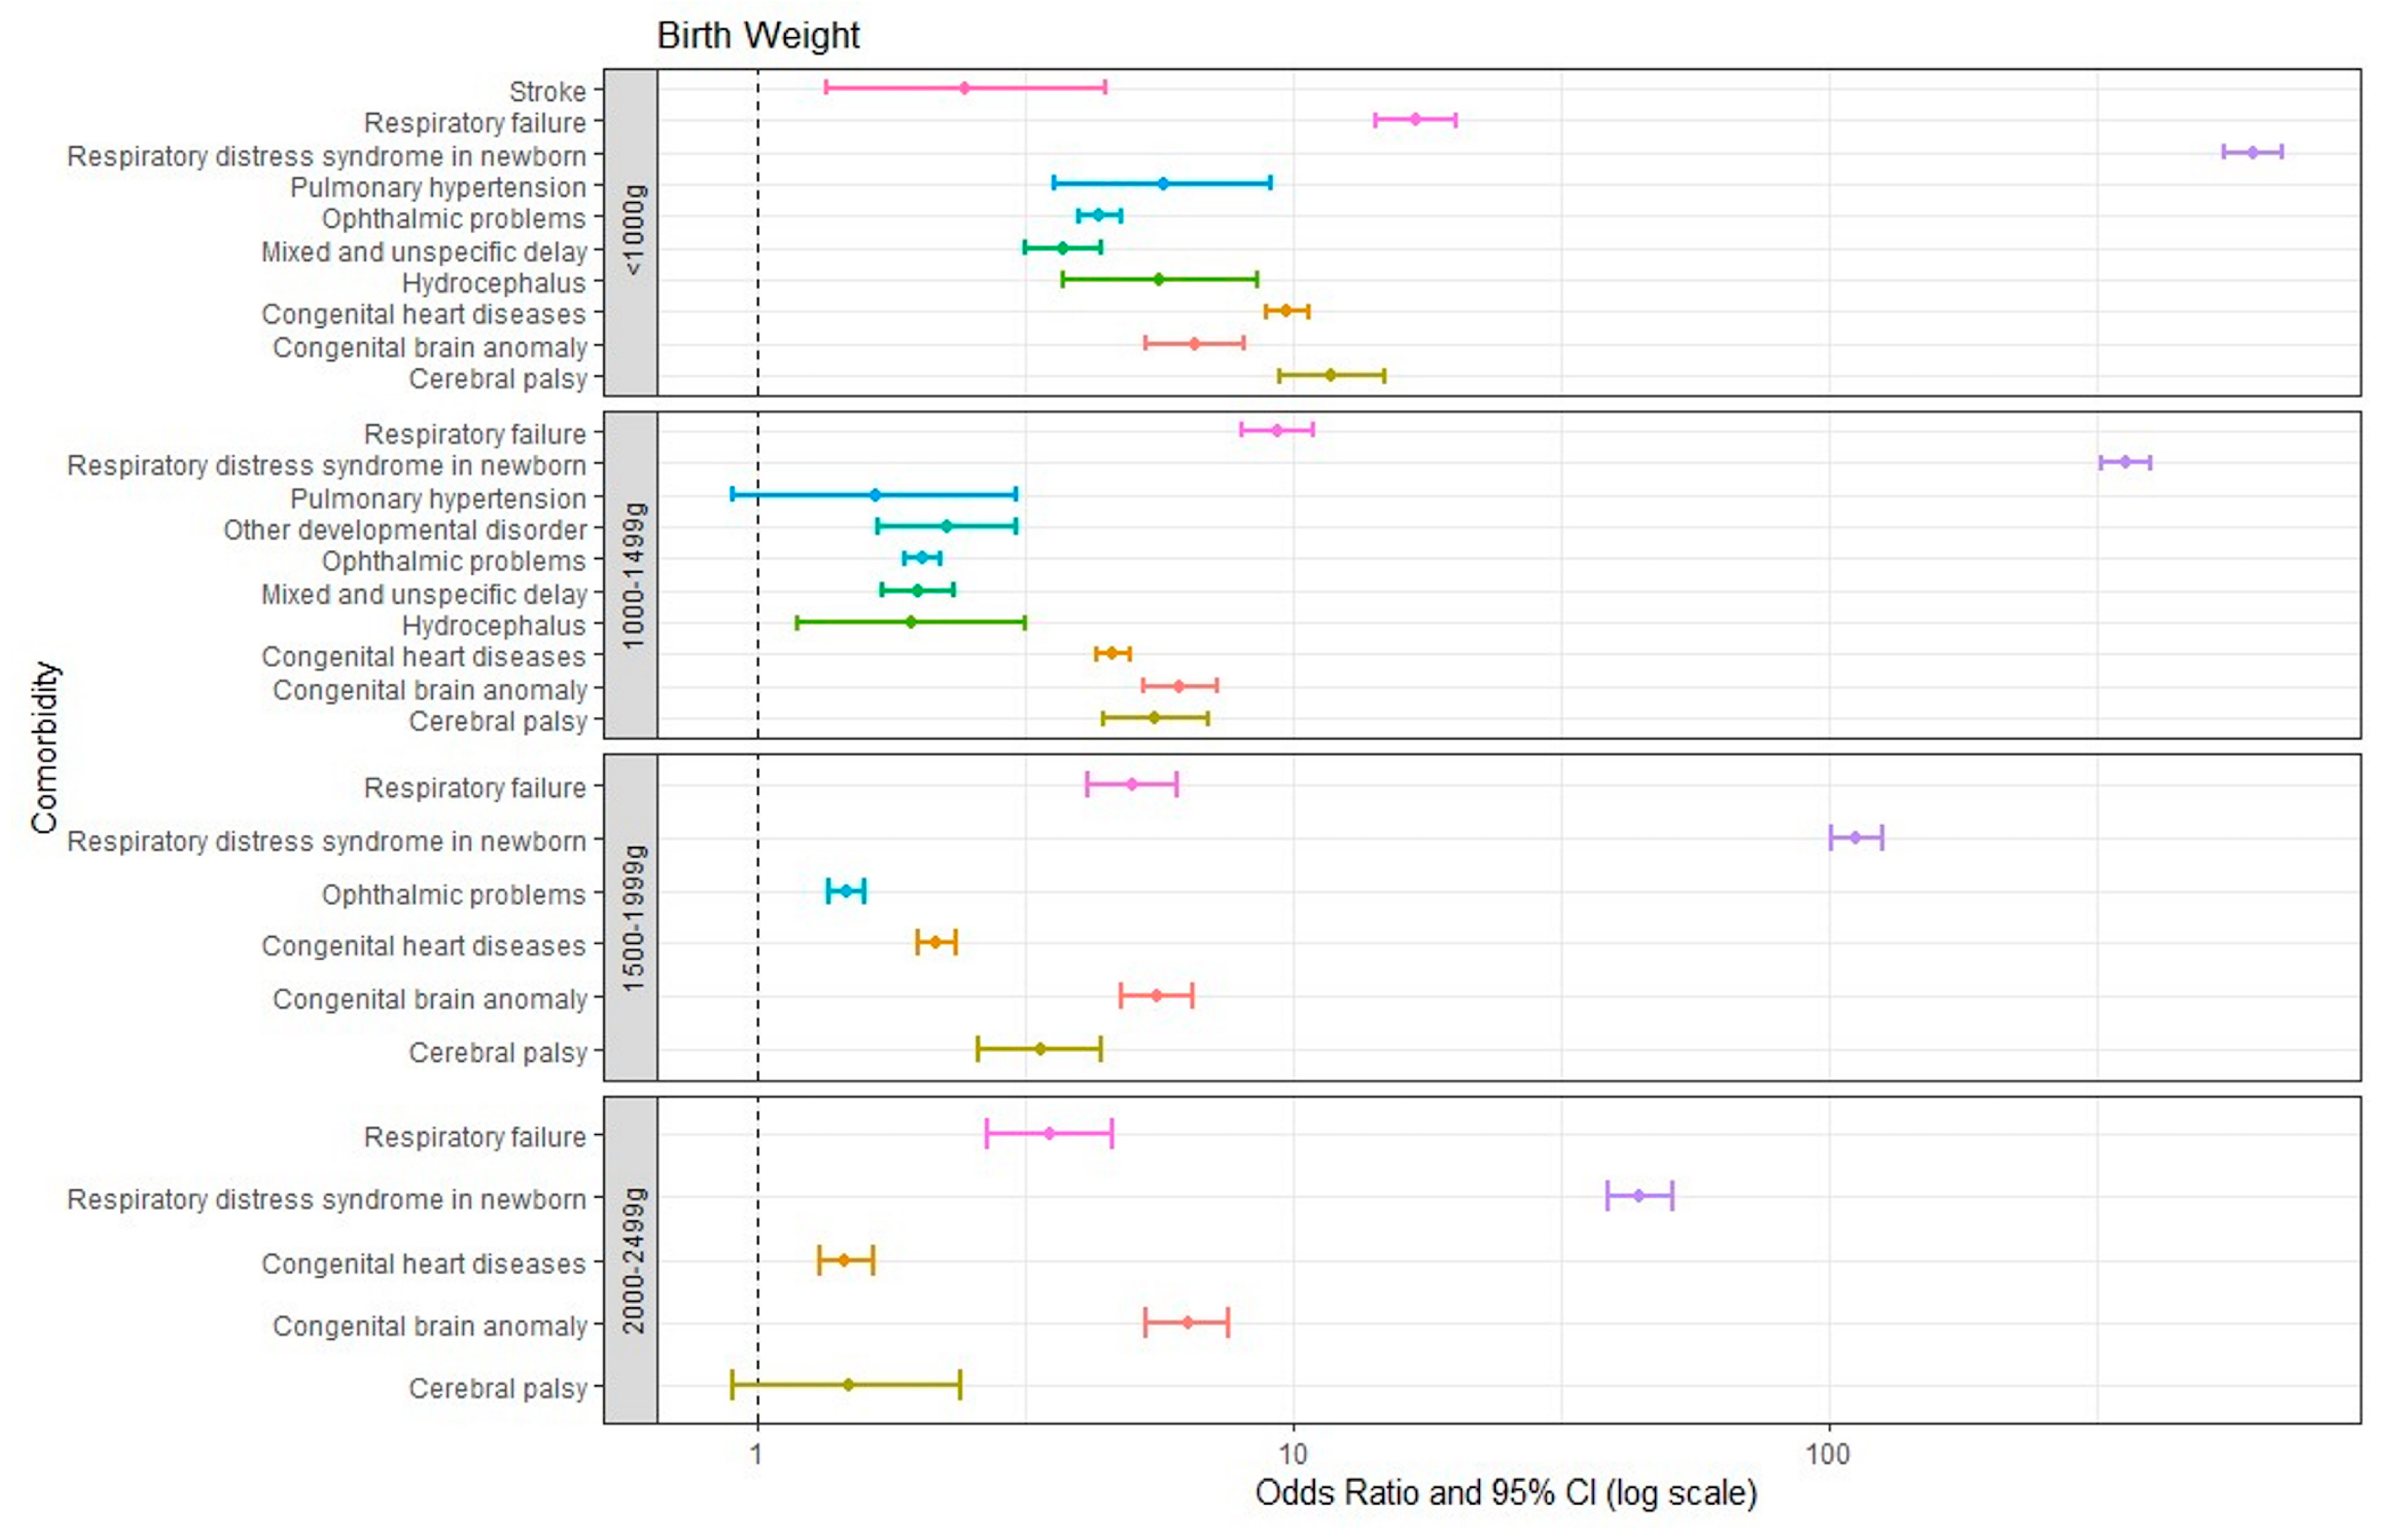
Figure 3.
The prevalence of cerebral palsy (CP) under different birth weights. These results demonstrate a significant inverse relationship between the prevalence of CP and birth weight, particularly highlighting the high prevalence rate of CP among infants with low birth weight.
Figure 3.
The prevalence of cerebral palsy (CP) under different birth weights. These results demonstrate a significant inverse relationship between the prevalence of CP and birth weight, particularly highlighting the high prevalence rate of CP among infants with low birth weight.
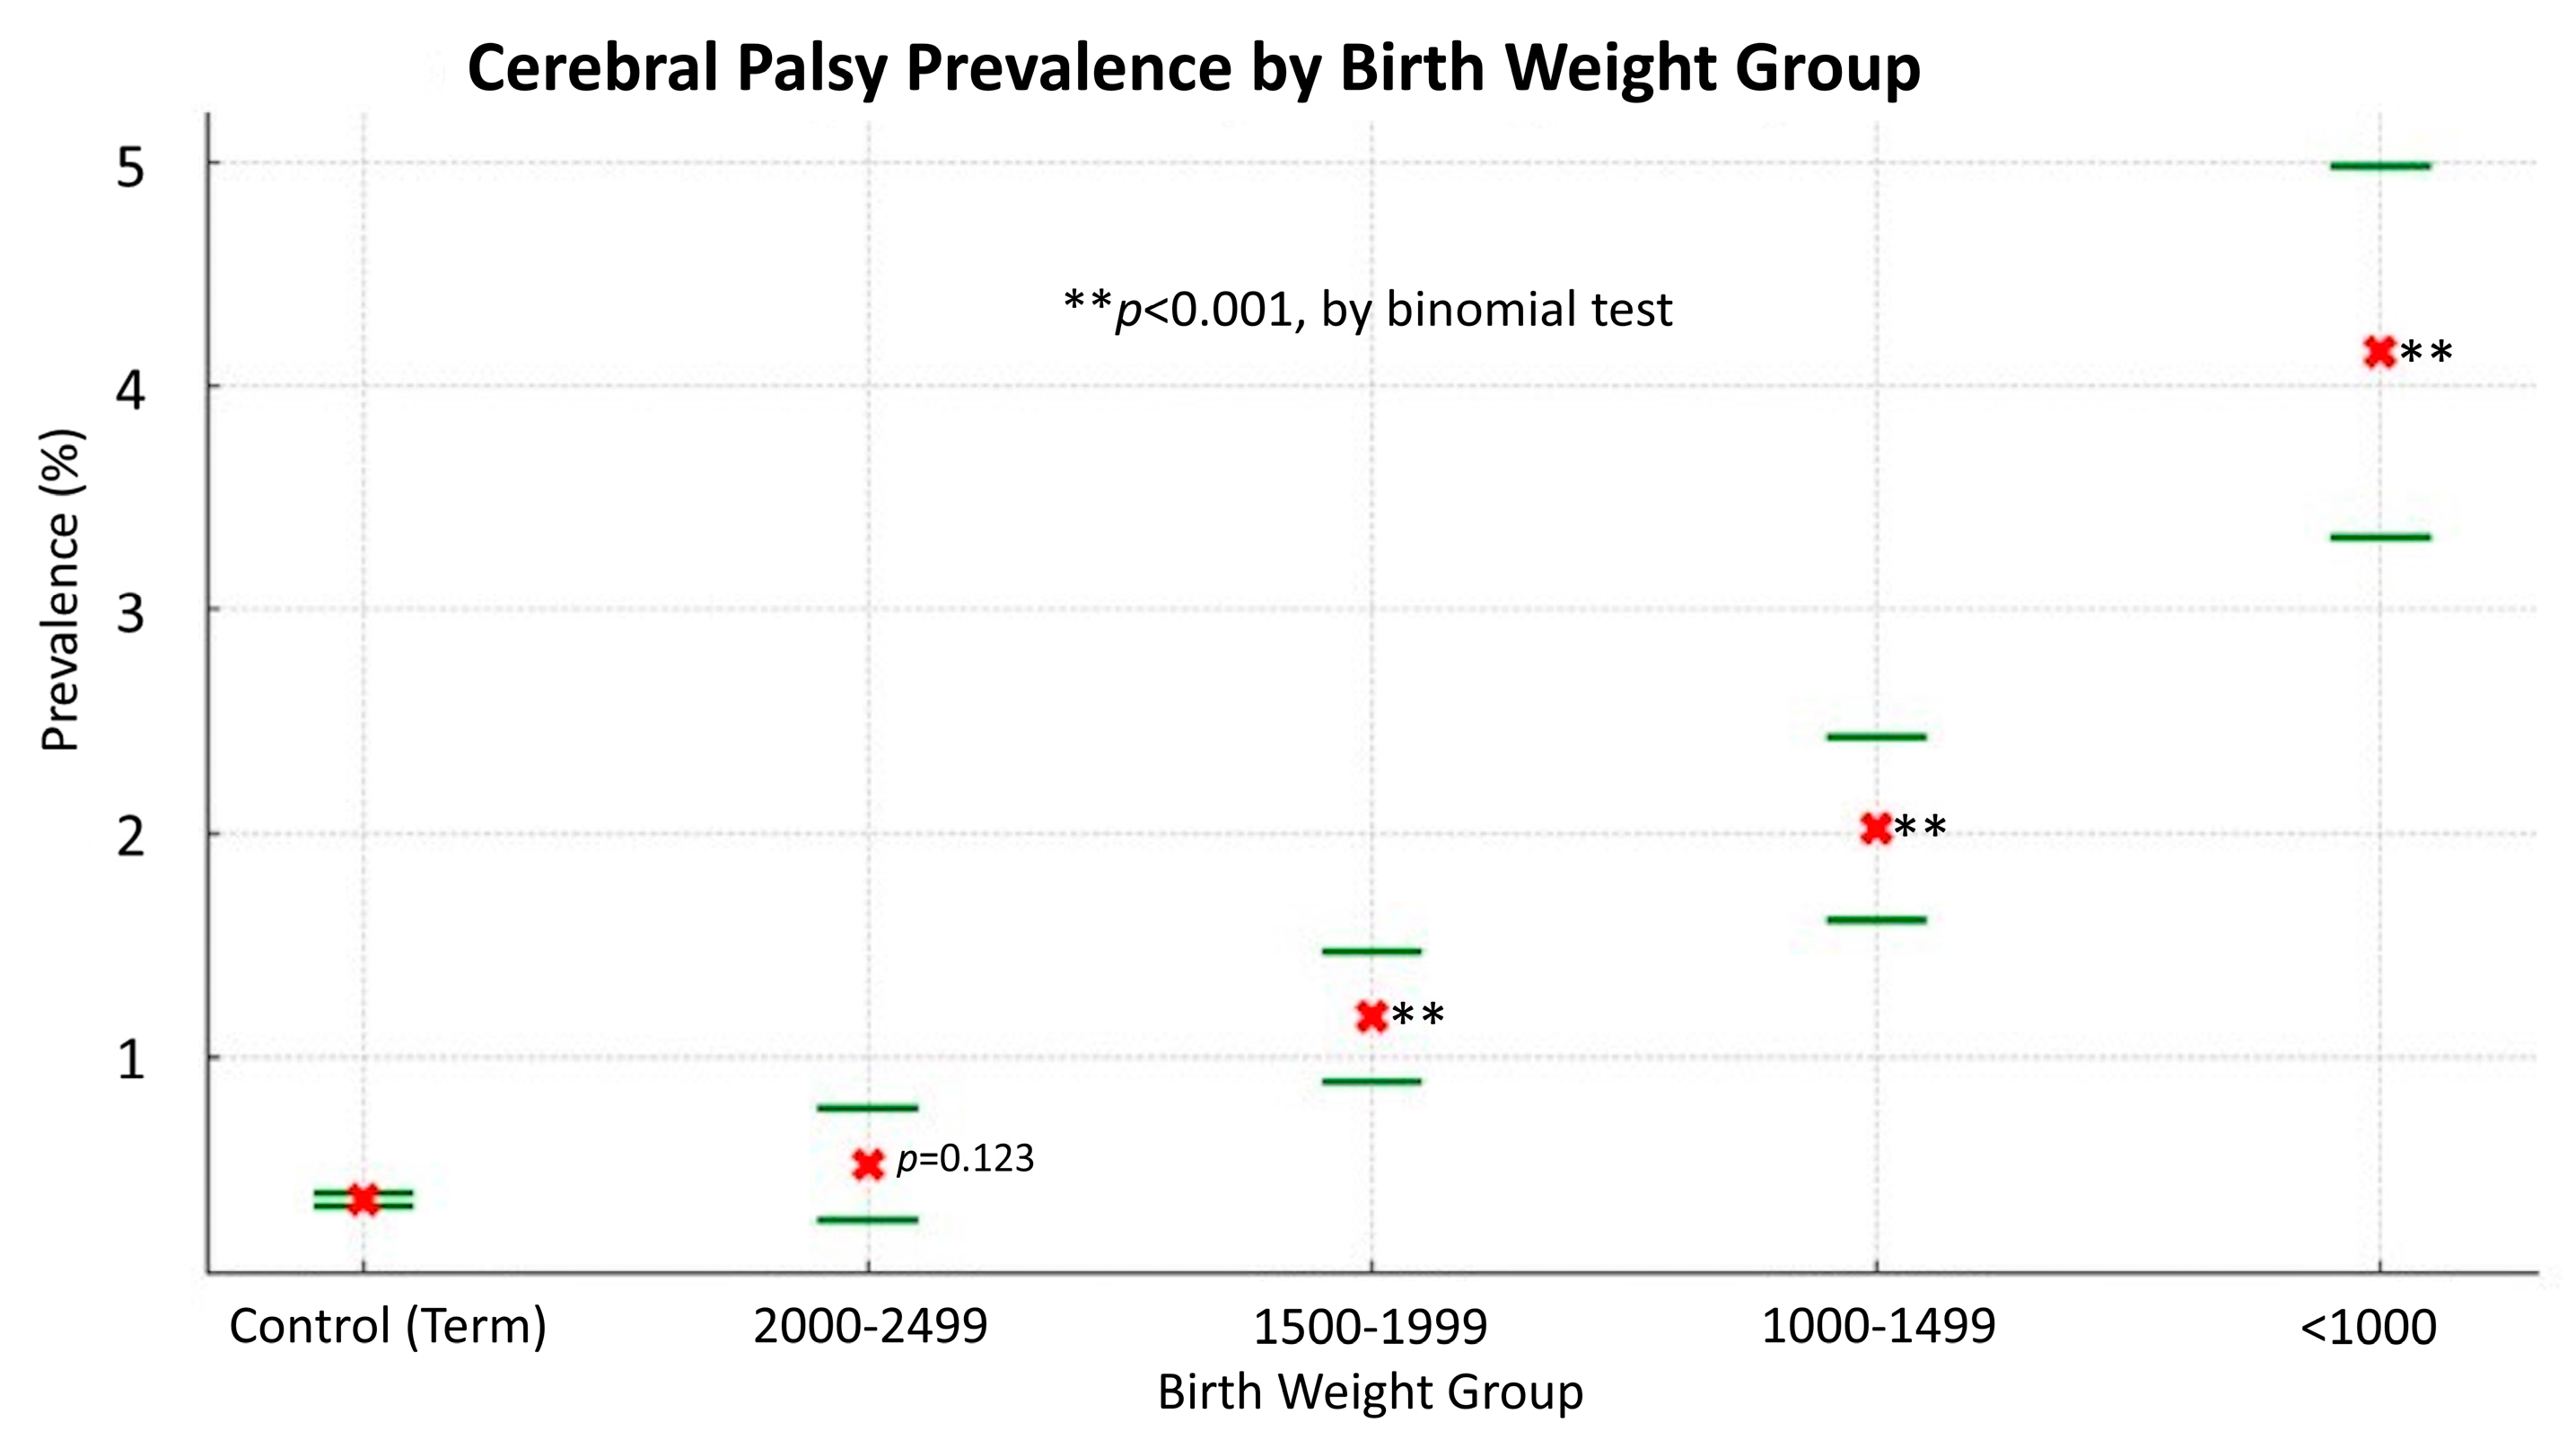
Figure 4.
Correlations between birth weight and the number of admissions (NOA) of preterm infants and mothers and between birth weight and length of stay (LOS) in hospital of preterm infants and mothers, suggesting that there is a significant correlation between birth weight and both the NOA and the LOS in the hospital for preterm infants and mothers.
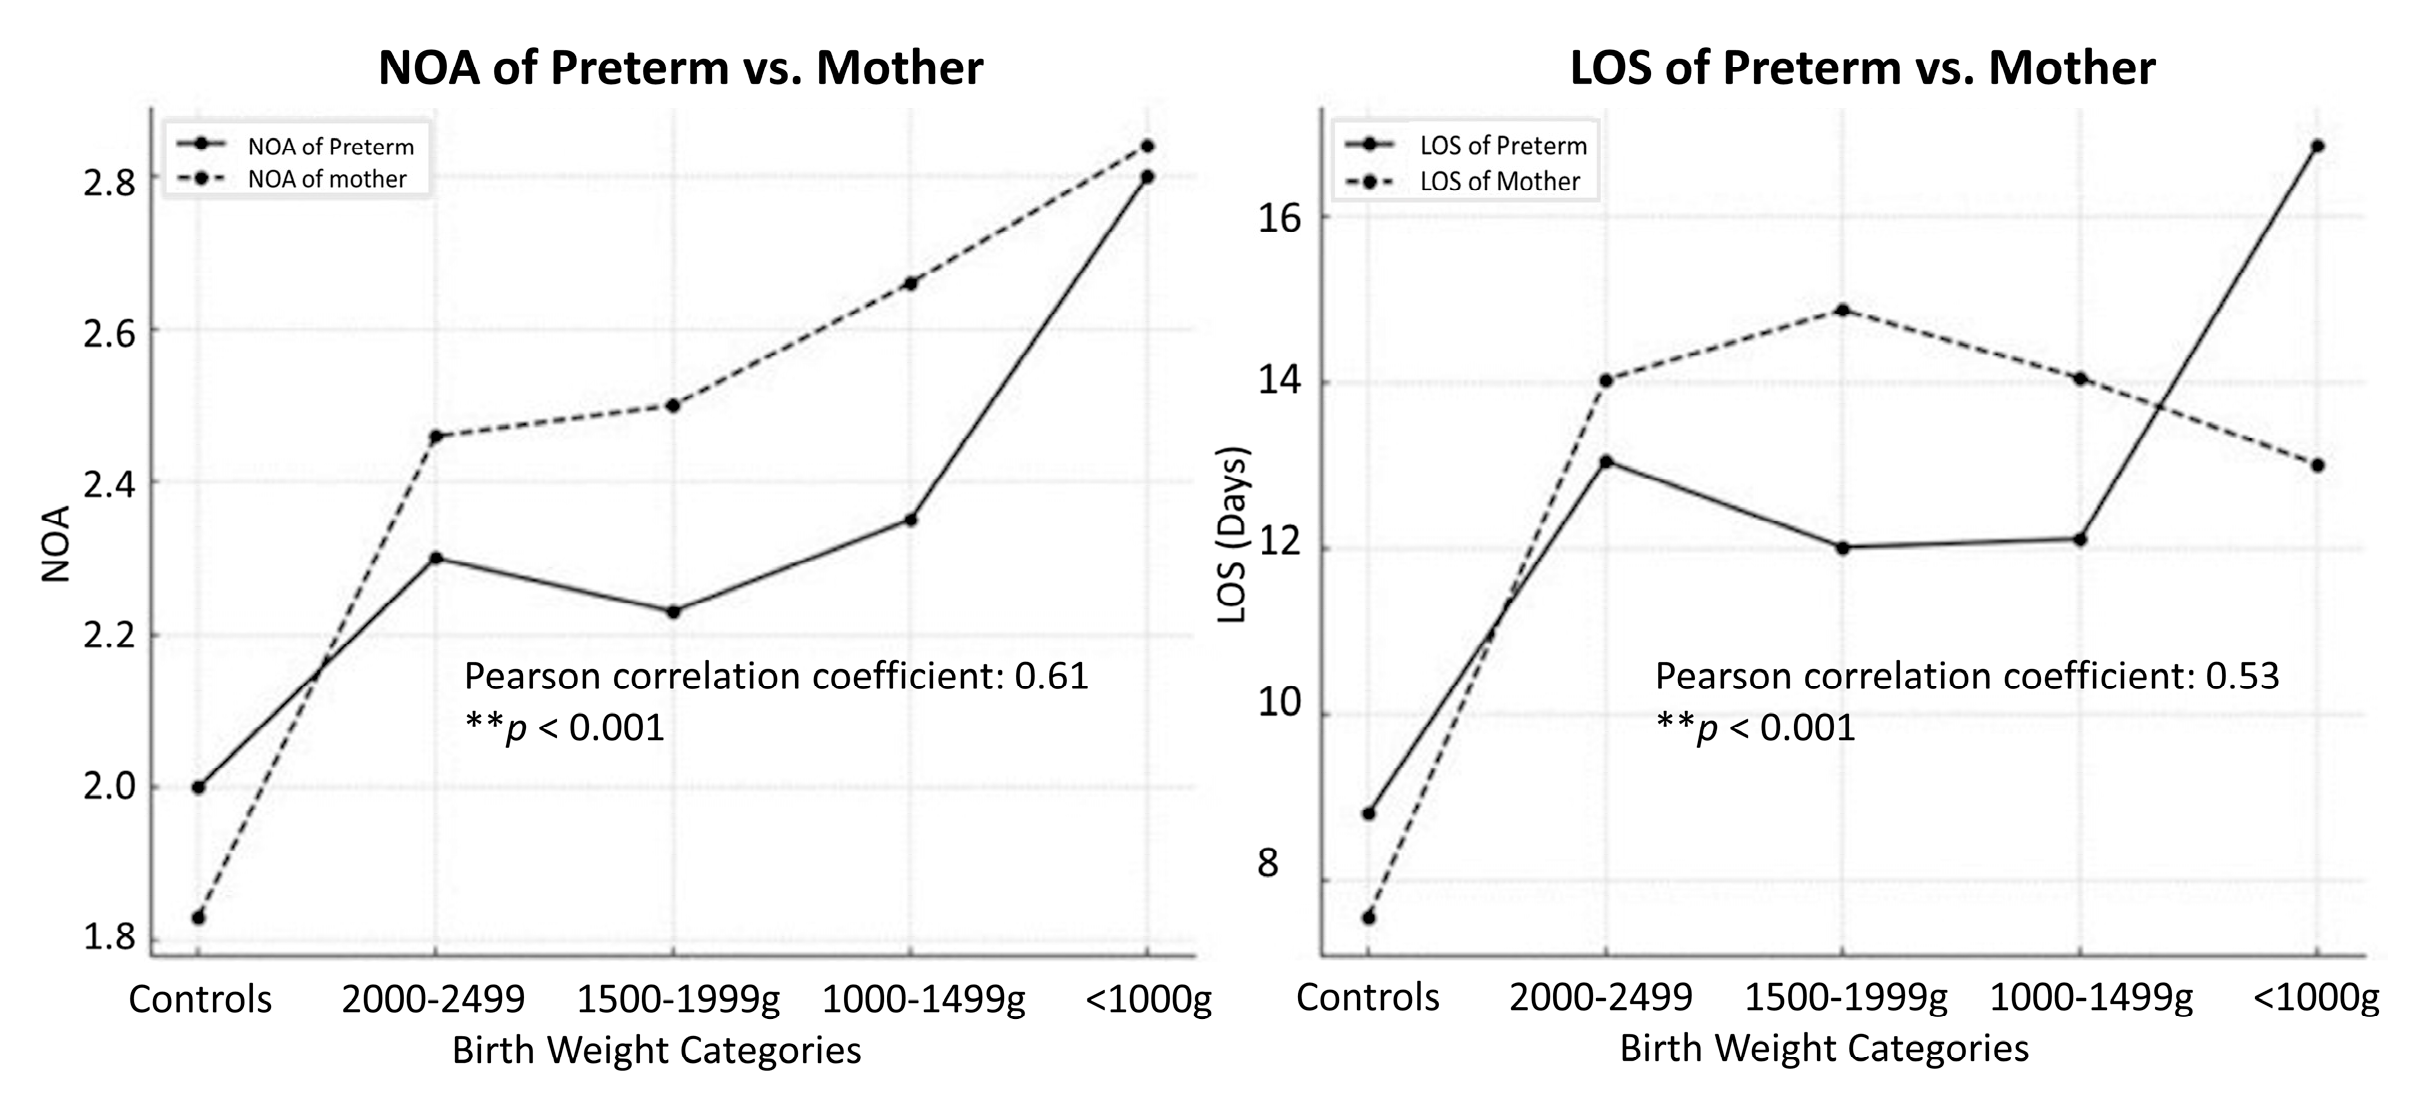

Table 1.
ICD 9 codes and subcategories of premature children enrolled in this study.
| Subcategories of preterm birth or low birth weight | ICD 9 codes |
|---|---|
| Extremely preterm (<1000 g) | 765.01, 765.02, 765.03, 765.11, 765.12, 765.13, V21.31, V21.32 |
| Very preterm (1000–1499 g) | 765.04, 765.05, 765.14, 765.15, V21.33 |
| Moderately preterm (1500–1999 g) | 765.06, 765.07, 765.16, 765.17, V21.34 |
| Late preterm (2000–2499 g) | 765.08, 765.18, V21.35 |
ICD: International Classification of Diseases.
Table 2.
Demographic characteristics of enrollees and controls.
| Enrollees n (%) | Controls n (%) | p-value | |
|---|---|---|---|
| Birth weight | |||
| Total sample size | 15,181 | 151,810 | |
| <1000 g | 2,241 (14.76) | ||
| 1000–1499 g | 4,461 (29.39) | ||
| 1500–1999 g | 5,240 (34.52) | ||
| 2000–2500 g | 3,239 (21.34) | ||
| Sex | |||
| Female | 7,119 (46.89) | 71,190 (46.89) | |
| Male | 8,062 (53.11) | 80,620 (53.11) | 1.0002 |
| Income | |||
| 1 (Lowest) | 3447 (22.71) | 17525 (11.54) | |
| 2 | 5756 (37.92) | 61905 (40.78) | |
| 3 | 4026 (26.52) | 48524 (31.96) | |
| 4 (Highest) | 1952 (12.86) | 23856 (15.71) | < 0.001 |
| Location | |||
| Northern | 7,263 (47.84) | 81,875 (53.93) | |
| Central | 3,661 (24.12) | 32,401 (21.34) | |
| Southern | 3,982 (26.23) | 35,252 (23.22) | |
| Eastern | 267 (1.76) | 2,032 (1.33) | |
| Off island | 8 (0.05) | 250 (0.18) | <0.001 |
1 matched by sex and age, 2Chi-square test for independence
Table 3.
Comorbidities of premature infants stratified by family income level.
| Comorbidities | Income level (in NTD) | Enrollees | Controls | OR | 95% CI |
|---|---|---|---|---|---|
| 0–10000 (lowest) | 1506 | 9860 | 2.31 | (2.11, 1.31) | |
| 10001–25000 | 3039 | 37857 | 1.21 | (1.12, 1.31) | |
| Respiratory | 25001–50000 | 2003 | 28374 | 1.07 | (0.98, 1.16) |
| >50001 (highest) | 872 | 13197 | --- | --- | |
| 0–10000 (lowest) | 510 | 1031 | 2.68 | (2.27, 3.10) | |
| 10001–25000 | 1343 | 4756 | 1.53 | (1.34, 1.73) | |
| Circulatory | 25001–50000 | 906 | 3812 | 1.29 | (1.12, 1.46) |
| >50001 (highest) | 360 | 1954 | --- | --- | |
| 0–10000 (lowest) | 72 | 693 | 1.10 | (0.75, 1.45) | |
| 10001–25000 | 321 | 3250 | 1.05 | (0.80, 1.29) | |
| Neurological | 25001–50000 | 205 | 2314 | 0.94 | (0.71, 1.17) |
| >50001 (highest) | 105 | 1112 | --- | --- | |
| 0–10000 (lowest) | 567 | 1835 | 2.61 | (2.25, 2.97) | |
| 10001–25000 | 1459 | 8218 | 1.50 | (1.32, 1.67) | |
| Psycho-developmental | 25001–50000 | 964 | 6513 | 1.25 | (1.10, 1.40) |
| >50001 (highest) | 417 | 3517 | --- | --- | |
| 0–10000 (lowest) | 405 | 6539 | 1.51 | (1.29, 1.73) | |
| 10001–25000 | 1091 | 26420 | 1.01 | (0.88, 1.13) | |
| GI and nutritional | 25001–50000 | 721 | 19508 | 0.90 | (0.78, 1.02) |
| >50001 (highest) | 362 | 8821 | --- | --- |
NTD: new Taiwan dollars
Table 4.
Neurological comorbidities in each low-birth-weight group compared to the normal control group in Taiwan (2009–2014).
Table 4.
Neurological comorbidities in each low-birth-weight group compared to the normal control group in Taiwan (2009–2014).
| Comorbidities | Birth-weight group | |||
|---|---|---|---|---|
| <1000 g (OR, 95% CI) |
1000–1499 g (OR, 95% CI) |
1500–1999 g (OR, 95% CI) |
2000–2499 g (OR, 95% CI) |
|
| Neurological | 4.27 | 2.08 | 1.53 | 1.11 |
| Congenital brain anomaly | 6.55 (5.30–8.09) | 6.14 (5.24–7.20) | 5.54 (4.75–6.47) | 6.35 (5.31–7.59) |
| Cerebral palsy | 11.80 (9.42–14.79) | 5.53 (4.41–6.93) | 3.36 (2.57–4.38) | 1.47 (0.90–2.39) |
| Hydrocephalus | 5.63 (3.71–8.54) | 1.93 (1.18–3.16) | 0.87 (0.44–1.70) | 0.61 (0.22–1.68) |
| Stroke | 2.44 (1.34–4.44) | 0.87 (0.43–1.74) | 0.46 (0.19–1.11) | 0.44 (0.14–1.33) |
| Ophthalmic problems | 4.34 (3.96–4.75) | 2.02 (1.87–2.19) | 1.46 (1.35–1.58) | 0.94 (0.84–1.06) |
| Hearing problems | 1.12 (0.83–1.51) | 0.82 (0.64–1.05) | 0.42 (0.31–0.58) | 0.17 (0.10–0.31) |
| Epilepsy | 0.99 (0.74–1.39) | 0.53 (0.39–0.72) | 0.43 (0.32–0.59) | 0.38 (0.25–0.57) |
| Movement disorders | 0.17 (0.06–0.54) | 0.20 (0.10–0.41) | 0.10 (0.04–0.25) | 0.04 (0.01–0.17) |
| Sleep disorders | 0.44 (0.11–1.67) | 0.22 (0.06–0.82) | 0.10 (0.02–0.57) | 0.00 (0.00–0.60) |
| Psycho-developmental: | 2.09 (1.82–2.41) | 1.27 (1.12–1.44) | 0.62 (0.53–0.73) | 0.35 (0.27–0.45) |
| Developmental delay | 2.69 (2.32–3.12) | 1.58 (1.39–1.80) | 0.78 (0.67–0.92) | 0.43 (0.33–0.56) |
| - Mixed and nonspecific delay | 3.70 (3.14–4.36) | 1.99 (1.71–2.31) | 0.94 (0.77–1.14) | 0.44 (0.31–0.62) |
| - Other developmental disorder | 2.44 (1.64–3.63) | 2.25 (1.67–3.02) | 1.14 (0.79–1.66) | 0.83 (0.49–1.41) |
| - Speech or language developmental disorder | 0.73 (0.51–1.04) | 0.45 (0.33–0.60) | 0.30 (0.21–0.43) | 0.21 (0.12–0.35) |
| - Developmental coordination disorder | 0.69 (0.27–1.74) | 0.75 (0.40–1.42) | 0.36 (0.15–0.85) | 0.00 (0.00–0.00) |
| Learning disability | 1.49 (0.37–6.00) | 1.11 (0.36–3.45) | 0.00 (0.00–0.00) | 0.00 (0.00–0.00) |
| Childhood emotional disturbances | 0.00 (0.00–0.00) | 0.12 (0.02–0.68) | 0.11 (0.02–0.57) | 0.00 (0.00–0.00) |
| ADHD | 0.33 (0.13–0.79) | 0.25 (0.13–0.50) | 0.21 (0.10–0.44) | 0.15 (0.05–0.44) |
| Intellectual disabilities | 0.34 (0.05–2.26) | 0.51 (0.17–1.54) | 0.00 (0.00–0.00) | 0.00 (0.00–0.00) |
| Autistic spectrum disorder | 0.37 (0.10–1.34) | 0.26 (0.09–0.78) | 0.23 (0.08–0.70) | 0.00 (0.00–0.00) |
| Anxiety | 0.00 (0.00–0.00) | 0.00 (0.00–0.00) | 0.22 (0.03–1.58) | 0.00 (0.00–0.00) |
| Acute stress reaction | 1.80 (0.25–13.24) | 0.00 (0.00–0.00) | 0.00 (0.00–0.00) | 0.00 (0.00–0.00) |
Table 5.
Admission frequency (NOA) and length of stay (LOS) in hospital of preterm infants and their mothers.
Table 5.
Admission frequency (NOA) and length of stay (LOS) in hospital of preterm infants and their mothers.
| Birth weight | Mean | Standard deviation | Number of patients | p-value3 | |
|---|---|---|---|---|---|
| NOA1 of preterm infants | <1000 g | 2.80 | 2.67 | 1243 | < 0.001 |
| 1000–1499 g | 2.35 | 2.30 | 2045 | ||
| 1500–1999 g | 2.23 | 2.27 | 2153 | ||
| 2000–2499 g | 2.30 | 2.32 | 1306 | ||
| Control | 2.00 | 1.89 | 79466 | ||
| LOS2 of preterm infants | <1000 g | 16.85 | 26.07 | 1243 | < 0.001 |
| 1000–1499 g | 12.11 | 17.55 | 2045 | ||
| 1500–1999 g | 12.01 | 21.28 | 2153 | ||
| 2000–2499 g | 13.05 | 23.25 | 1306 | ||
| Control | 8.80 | 12.96 | 79466 | ||
| NOA of mothers | <1000 g | 2.84 | 1.79 | 758 | < 0.001 |
| 1000–1499 g | 2.66 | 1.97 | 1561 | ||
| 1500–1999 g | 2.50 | 1.53 | 1911 | ||
| 2000–2499 g | 2.46 | 1.51 | 1236 | ||
| Control | 1.83 | 1.15 | 57974 | ||
| LOS of mothers | <1000 g | 13.01 | 13.55 | 758 | < 0.001 |
| 1000–1499 g | 14.05 | 16.08 | 1561 | ||
| 1500–1999 g | 14.87 | 16.64 | 1911 | ||
| 2000–2499 g | 14.03 | 14.01 | 1236 | ||
| Control | 7.55 | 8.20 | 57974 |
1 Number of admissions; 2 length of stay; 3 p-values of the comparisons of group mean using ANOVA, Kruskal–Wallis test and Welch's ANOVA are all less than 0.001.
Table 6.
Odds ratios (ORs) for associations between low birth weight of infants and maternal age.
| Maternal age | ||||||||
| <20 years | 20–30 years | 30–40 years | ≥40 years | |||||
| Birth weight | n, OR1 (95 % CI) | |||||||
| Enrollees | 42 | 1.70 (1.23–2.36) | 1512 | --- | 3680 | 1.37 (1.29–1.46) | 232 | 2.17 (1.86–2.51) |
| <1000 g | 7 | 2.29 (1.07–4.92) | 187 | --- | 530 | 1.60 (1.35–1.89) | 34 | 2.57 (1.78–3.72) |
| 1000–1499 g | 16 | 2.25 (1.35–3.75) | 436 | --- | 1044 | 1.35 (1.21–1.51) | 65 | 2.11 (1.61–2.75) |
| 1500–1999 g | 11 | 1.23 (0.67–2.26) | 546 | --- | 1286 | 1.33 (1.20–1.47) | 68 | 1.76 (1.36–2.28) |
| 2000–2499 g | 8 | 1.43 (0.70–2.91) | 343 | --- | 820 | 1.35 (1.19–1.53) | 65 | 2.68 (2.04–3.51) |
| Control group | 331 | --- | 20286 | --- | 35921 | --- | 1436 | --- |
1 Reference groups for OR calculation was the 20–30-year age group for maternal age and the control group for birth-weight groups.
Disclaimer/Publisher’s Note: The statements, opinions and data contained in all publications are solely those of the individual author(s) and contributor(s) and not of MDPI and/or the editor(s). MDPI and/or the editor(s) disclaim responsibility for any injury to people or property resulting from any ideas, methods, instructions or products referred to in the content. |
© 2024 by the authors. Licensee MDPI, Basel, Switzerland. This article is an open access article distributed under the terms and conditions of the Creative Commons Attribution (CC BY) license (http://creativecommons.org/licenses/by/4.0/).
Copyright: This open access article is published under a Creative Commons CC BY 4.0 license, which permit the free download, distribution, and reuse, provided that the author and preprint are cited in any reuse.


