
Submitted:
02 April 2024
Posted:
04 April 2024
You are already at the latest version
Abstract
Background: Both of cognitive decline and unhealthy lifestyle have been associated with an increased risk of mortality in older people. We aimed to investigate whether lifestyle behaviors might modify the association between cognitive function and the risk of all-cause mortality in Chinese older populations.
Methods: The study included 5,124 individuals free of dementia in the Chinese Longitudinal Healthy Longevity Survey from 2011 to 2018. Cognitive function was measured using the Mini-Mental State Examination in 2011. A lifestyle score was calculated on the basis of five lifestyle factors including smoking, alcohol consumption, physical activity, diet and body mass index. Cox proportional hazards models were performed to examine the association between baseline cognitive function and all-cause mortality, with an interaction term of cognitive function and lifestyle score being added to the models
Results: During a median follow-up of 6.4 years, we documented 1,461 deaths. Both higher cognitive function (HR: 0.96; 95% CI: 0.96–0.97) and healthier lifestyle (HR: 0.92; 95% CI: 0.87–0.97) were significantly associated with a lower risk of mortality. We found that lifestyle significantly modified the association of cognitive function with mortality (P for interaction = 0.004). The inverse association between high cognitive function and mortality was more prominent among participants with healthier lifestyle. Of note, among the lifestyle scores component, diet showed a significant interaction with mortality (P for interaction = 0.003), with the protective HR of the all-cause mortality associated with higher MMSE scores was stronger among participants with healthy diets compared with unhealthy diets.
Conclusion: Our study indicates that cognitive decline is associated with an increased risk of mortality, and such relations are modified by overall lifestyle, with healthy diet being the major contributor.
Keywords:
Cognitive function
; Healthy lifestyle
; Healthy diet
; Mortality
; Older adults
1. Introduction
Dementia is one of the major predictor of mortality in old age [1,2]. It is estimated that by 2050, there will be 131.5 million individuals living with dementia [3], presenting a major challenge for health care and social support systems. Cognitive as fundamental function of daily life that continuously declines with increasing age, has been shown to be the most prevalent cause of dementia [4,5]. Numerous previous prospective studies have demonstrated that lower cognitive function was associated with an increased risk of mortality in middle-aged and older populations [6,7,8,9]. Thus, the prevention and intervention of cognitive decline in older individuals is paramount for longevity and later-life quality. Fortunately, cognitive decline is potentially mutable and preventable through various established contributing factors.
Notably, emerging evidence has linked various lifestyle factors with cognitive function [10,11,12]. For example, population-based and experimental studies have identified a beneficial effect of physical activity on cognition and brain function [13,14]. In addition to dietary patterns, high nutrient adequacy has been found to be associated with better cognitive performance [15]. Previous studies have indicated that smoking, alcohol consumption and body mass index (BMI) are also related to an increased risk of cognitive decline among old people [16,17]. In addition, it is consistently reported that unhealthy lifestyle is associated with an increased risk of mortality [18,19,20]. Given their intertwined relationship, we hypothesized that lifestyle factors might modify the association between cognitive function and the risk of mortality. While several studies have examined associations of cognitive function, healthy lifestyle with mortality, the modification effect of healthy lifestyle on the relationship between cognition function and mortality in prospective cohorts is less investigated.
In the present prospective cohort study of older adults from the Chinese Longitudinal Healthy Longevity Survey (CLHLS), we aimed to examine the association between cognition function and all-cause mortality, and particularly investigate the modification effects of lifestyle factors including smoking status, alcohol consumption, physical activity, diet and BMI on the association.
2. Materials and Methods
The Study Design and Participants
The CLHLS is an ongoing population-based prospective cohort study, which aimed to study determinants of healthy ageing among Chinese older adults. The survey applied a multistage, stratified cluster sampling, and conducted in randomly selected counties and cities from 23 of the 31 provinces in Mainland China. Health-related information was collected through structured questionnaires and anthropometric measurements by trained interviewers at each wave of the CLHLS. More detailed information about study design and data collection have been published previously [21,22,23,24].
The present analysis includes data cross the three recent waves, each approximately three years apart from the next, from 2011/2012 to 2018. The 2011 survey wave including 9,765 total respondents was treated as the baseline survey. In the current study, we excluded participants who were lost to follow-up or died during 2011-2014 (n=3699). In accordance with previous studies [25], older adults were defined as those aged 65 years or above. Hence, those younger than 65 years old were excluded (n=57). Moreover, participants with self-reported dementia at baseline (n=67) or those with missing values on cognitive function or lifestyle (n=818) at baseline were excluded, leaving a total of 5,124 participants in the final analysis. The detailed study flowchart of participant inclusion and exclusion is provided in the supplemental material Figure S1. Written informed consent was obtained from all participants, and ethical approval was obtained from the Research Ethics Committee of Peking University (IRB00001052–13074).
Measurement of Cognitive Function
The Mini Mental State Examination (MMSE) continues to be the most widely used instrument in assessing cognitive function [26,27]. Cognitive function was measured using the validated Chinese version of 24-item MMSE [23,28]. The 24 items covers six dimensions: (1) orientation (5 items), (2) registration (3 items), (3) naming (1 item), (4) attention and calculation (5 items), (5) recall (3 items) and (6) language (7 items), with the total score ranging from 0 to 30. A higher MMSE score indicates better cognitive function. Based on the literature [28], we treated responses of “unable to answer” as “wrong”. Participants were categorized into three groups according to the total MMSE score: low ≤ 24; moderate 25–28; high ≥ 29.
Measurement of Healthy Lifestyle
A lifestyle score was constructed on the basis of five factors, including smoking status, alcohol consumption, physical activity, diet and BMI in accordance with previous studies [20,29,30]. Self-reported information on smoking status (never, former, and current), alcohol consumption (never, former, and current) and regular exercise (yes/no) were collected by trained interviewers at baseline. The participants who never smoked, never drank and exercised regularly were defined as healthy. Dietary consumption was assessed by self-reported diversity score according to the World Health Organization recommendations and previous research [31,32]. The respondents were asked to report their current intake frequency of various food groups including vegetables, fruits, legumes and its products, meat, fish, eggs, milk products, nuts and tea. In the analysis, participants received a score of 1 point if the response for one food group was ‘almost every day’, ‘once per week at least’ or ‘once per month at least’ and scored 0 point if the response was ‘occasionally’ or ‘rarely or never’. Especially for the frequency of fruit and vegetable intake, participants scored 1 point if the response was ‘almost every day’, ‘almost every day except in winter” or ‘quite often’, otherwise received a score of 0. The dietary diversity score was equal to the sum of the points for all nine food groups mentioned above. The score ranged from 0 to 9, with a higher score indicating better dietary diversity. A healthy diet was defined as the dietary diversity score at or above the mean value in accordance with previous studies [33,34]. Height and weight were measured directly by trained investigators and used to calculate BMI as weight in kilograms divided by height in meters squared. BMI was categorized as underweight (< 18.5 kg/m2), normal weight (≥ 18.5 kg/m2 and < 24.0 kg/m2), overweight (≥ 24.0 kg/m2 and < 28.0 kg/m2), or obese (≥ 28 kg/m2). We defined a healthy body weight as individuals with normal weight. Participants scored 1 point for each favorable behavior (no smoking, no alcohol consumption, regular exercise, healthy diet and normal weight), otherwise received a score of 0. The total lifestyle score ranged from 0 to 5, with a higher score indicating a healthier lifestyle. Participants were categorized into three groups according to the total lifestyle score: unhealthy ≤ 2; intermediate = 3; healthy ≥ 4.
3. Results
The outcome of interest in this analysis was all-cause mortality occurring in the 2014 and 2017/2018 waves. The participants’ vital status and date of death were collected from officially issued death certificates whenever available, and otherwise through interviews with the next-of-kin. Duration of follow-up was calculated as the time from baseline to death or the censoring time depending on which occurred first.
During a median follow-up of 6.4 years, a total of 1,461 deaths were observed. We found that higher MMSE scores were significantly associated with a lower risk of mortality (Table 2). In the age- and sex-adjusted model, a 1-point increase of MMSE scores was associated with a 5% reduction in the risk of mortality (95% CI 4–5%). After further adjustment for age, sex, education, residence, marital status, living pattern, self-rated of economic status, ADL in disability, history of chronic disease (diabetes, heart diseases, cancer and stroke), and lifestyle, MMSE scores were inversely associated with the risk of mortality. The HR (95% CI) of mortality was 0.96 (0.96–0.97) for a 1-point increase of MMSE scores; and a 39% lower risk was observed in the highest quintile compared with the lowest quintile of MMSE scores (P for trend <0.001).
In addition, we found that healthier lifestyles were significantly associated with a lower risk of mortality (Table 3). In the age- and sex-adjusted model, a 1-point increase of lifestyle scores was associated with a 13% reduction in the risk of mortality (95% CI 9–17%). After further adjustment for MMSE scores and all covariates, healthy lifestyles were inversely associated with the risk of mortality. The HR (95% CI) of mortality was 0.92 (0.87–0.97) for a 1-point increase of lifestyle scores; and a 20% lower risk was observed in the group with healthy lifestyle compared with the group with unhealthy lifestyle (P for trend <0.001).
A stratified analysis was conducted according to the lifestyle scores to evaluate whether overall lifestyle modified the association between MMSE scores and the risk of all-cause mortality. We found a significant interaction between MMSE scores and lifestyle scores on the risk of mortality (P for interaction = 0.004), in which the protective HR of high MMSE scores was more evident among participants with a healthier lifestyle. The HR (95% CI) of mortality associated with 1-point increase of MMSE scores was 0.98 (0.96–0.99) among participants with a healthy lifestyle, 0.96 (0.95–0.97) among participants with an intermediate lifestyle, and 0.95 (0.93–0.96) among participants with an unhealthy lifestyle, respectively. Similar interaction patterns were observed in the analysis on the quintiles of MMSE scores (Figure 1).
We further tested the interaction between MMSE scores and each lifestyle behavior separately on the risk of all-cause mortality. Table S1 reported the risks of all-cause mortality by per 1-point increase in MMSE scores, stratified by five lifestyle behaviors. We found that diet showed a significant interaction with MMSE scores for mortality (P for interaction = 0.003). A 1-point higher MMSE scores showed more prominent associations with the risk of mortality among participants with healthy diet (HR 0.956 [95% CI 0.944-0.967]) than those with unhealthy diet (HR 0.969 [95% CI 0.959-0.979]). In particular, the negative HRs of mortality for quintiles 2–3 groups compared with quintile 1 group of MMSE scores were also attenuated among participants with healthier diet (Figure 2). For other lifestyle behavior, although a 1-point higher MMSE scores also showed stronger associations with the risk of mortality among participants with healthy behavior than those with unhealthy behavior, the interactions were not statistically significant.
The sensitivity analysis showed that the cognitive-lifestyle interactions remained significant on mortality after excluding participants with diabetes, heart diseases, cancer or stroke at baseline (Figure S2).
4. Discussion
Maintaining cognitive function and favorable lifestyle are essential for healthy ageing. In this prospective cohort study of the Chinese elderly, we found that both cognitive function and lifestyle were inversely associated with the risk of all-cause mortality. We also observed that overall lifestyle significantly modified the relations between cognitive function and mortality risk, with healthy die being the main contributor. The associations between cognitive decline and increased risks for mortality were attenuated in people with a healthy lifestyle, especially in those with a healthy diet.
The findings from our data suggest that low cognitive function was inversely associated with longevity in older populations, which is consistent with results from several prospective cohort studies in developed countries [7,9,38]. A previous systematic review showed that severity levels of cognitive impairment gave rise to an elevated mortality risk [39]. Similar findings of the inverse association between cognitive function and mortality was also found among the oldest-old Chinese 80 years of age and above [40]. In addition, a previous study also suggests that the faster decline of cognitive function was associated with higher mortality independent of initial cognitive function among Chinese older people [36].
In line with previous studies [19,20,41], we observed that a combination of favorable lifestyle factors is associated with a lower risk of mortality among older Chinese populations. The selection of healthy lifestyle indicators in this study has been largely guided by prior studies, as these indicators are modifiable and universal. Interestingly, we further found a significant modification effect of lifestyle scores combining the five modifiable lifestyle factors on the associations of cognitive function and mortality. Furthermore, these modification effect remained unchanged after excluding participants who had major chronic disease at baseline. The mechanisms underlying the modification effect of lifestyle on the associations between cognitive and the risk of mortality remain unclear, while our findings could be partly explained by the close relationship between lifestyle behaviors and cognitive function. Cognitive function might be associated with healthy literacy, as a consequence, people with lower cognitive function are less able to engage in a healthy lifestyle [6,42]. As the potential mechanisms of cognition-death relationships may be partly explained by health literacy, our study adds to the limited evidence examining the association between cognitive function and healthy lifestyle on all-cause mortality risk. Consistently, mounting evidence highlights the importance of healthy lifestyle in reducing the risk of cognitive decline [11,12,35,43].
Among the individual lifestyle behaviors, we found that healthy diet showed stronger interaction with cognitive function on mortality risk than other lifestyle behaviors. The finding was supported by previous studies that good dietary diversity was associated with a reduced risk of cognitive impairment among elderly people [31,44,45,46]. Even though the biological mechanism underlying the interaction was not clear, several plausible explanations have been proposed. First, good dietary diversity has been reported as a proxy indicator of nutrient adequacy [46] that can help reduce the burden of cognitive impairment [47,48]. Second, low dietary diversity is associated with enhanced oxidative stress, which would affect normal brain function and increase the risk of mild cognitive impairment [49,50]. Third, healthy food diversity is correlated with a more diverse gut microbiota [51], which may influence host cognition via the Brain–Gut–Microbiome Axis [52,53]. Further dietary intervention studies are needed to advance current understanding of the mechanistic effects of dietary modification on cognitive function and mortality.
To be noted, although no significant interaction was detected for other lifestyle behaviors, the negative association of high cognitive function with mortality appeared to be more marked among participants with normal weight, no smoking, no alcohol consumption, and regular exercise. Previous studies also showed that smoking, alcohol consumption, regular exercise, and BMI played vital roles in cognitive function [12,54,55].
The study has important implications for the development of new public health intervention strategies to improve healthy aging. To our knowledge, the study is the first to assess the interaction between cognitive function and lifestyle on all-cause mortality among Chinese older adults. More importantly, the study also adds to the limited evidence examining the modification effects of healthy diet on cognitive function and mortality risk. The findings indicate that adherence to a healthy lifestyle may attenuate the adverse association between cognitive decline and mortality risk, highlighting the importance of healthy diet for longevity among the older. These findings, if validated in intervention trials, can be taken as a new supplement to personalized health interventions.
However, the study has several limitations to be addressed. The study was conducted in the CLHLS, in which most participants were Chinese older people. Therefore, the generalizability of our results to other populations should be interpreted with caution. Additionally, unknown residual confounding might still exist even though the vast majority of measurable socio-demographic and potential health-related factors were adjusted. Furthermore, causality could not be determined because of the observational nature of this study, and further randomized clinical trials are required to confirm our findings in the ageing brain.
5. Conclusions
The longitudinal prospective study indicates that higher cognitive function is associated with a lower risk of all-cause mortality, and such relations are modified by lifestyle. Our findings highlight the importance to consider lifestyle factors in investigation of the relation between cognitive function and longevity. Our findings, if confirmed by replications, may have implications for the development of healthy aging strategies targeting improvement of cognitive function among people with unhealthy lifestyle, especially diet.
Supplementary Materials
The following supporting information can be downloaded at the website of this paper posted on Preprints.org.
Acknowledgments
We thank the staff and the participants of the CLHLS study.
Availability of data and materials
The CLHLS questionnaires are available at http://opendata.pku.edu.cn/. The full datasets used in this analysis are available from the corresponding author upon reasonable request.
Authors’ contributions
HL designed the study, analyzed and interpreted the data, and wrote the draft manuscript. MW participated in the design of the study and revised the manuscript. All authors revised and approved the final manuscript.
Ethics approval and consent to participate
The CLHLS study was approved by the Research Ethics Committee of Peking University (IRB00001052-13074), and all participants or their proxy respondents provided written informed consent.
Conflicts of Interest
The authors declare that they have no competing interests.
Abbreviations
ADL: activities of daily living; BMI: Body mass index; CI: Confidence interval; CLHLS: Chinese Longitudinal Healthy Longevity Survey; HR: Hazard ratio; MMSE: Mini-Mental State Examination.
References
- Wetterberg, H.; Najar, J.; Rydén, L.; Ribbe, M.; Rydberg Sterner, T.; Zettergren, A.; Guo, X.; Falk Erhag, H.; Sacuiu, S.; Kern, S. Dementia remains the major predictor of death among octogenarians. A study of two population cohorts of 85-year-olds examined 22years apart. European Journal of Epidemiology 2021, 36, 507-517.
- Tschanz, J.T.; Corcoran, C.; Skoog, I.; Khachaturian, A.S.; Herrick, J.; Hayden, K.M.; Group, C.C.S. Dementia: The leading predictor of death in a defined elderly population: The Cache County Study. Neurology 2004, 62, 1156-1162.
- Prince, M. World Alzheimer report 2015: the global impact of dementia; 2015.
- Scheltens, P.; Blennow, K.; Breteler, M.M.B.; Strooper, B.D.; Frisoni, G.B.; Salloway, S.; Flier, W.M.V.D. Alzheimer’s disease. The Lancet 2016, 388, 505-517.
- Bookheimer, S.Y.; Strojwas, M.H.; Cohen, M.S.; Sanders, A.M.; Pericakvance, M.A.; Mazziotta, J.C.; Small, G.W. Patterns of Brain Activations in People at Risk for Alzheimer’s Disease. N Engl J Med 2000, 343, 450-456.
- Batty GD; Deary IJ; P, Z. Association of Cognitive Function With Cause-Specific Mortality in Middle and Older Age: Follow-up of Participants in the English Longitudinal Study of Ageing. American Journal of Epidemiology 2016, 183, 183-190.
- Gale, C.R.; Martyn, C.N.; Cooper, C. Cognitive impairment and mortality in a cohort of elderly people. Bmj 1996, 312, 608-611.
- Liu, I.Y.; Lacroix, A.Z.; White, L.R.; Kittner, S.J.; Wolf, P.A. Cognitive impairment and mortality: a study of possible confounders. American Journal of Epidemiology 1990, 136-143.
- Perna, L.; Wahl, H.W.; Mons, U.; Saum, K.U.; Holleczek, B.; Brenner, H. Cognitive impairment, all-cause and cause-specific mortality among non-demented older adults. Age Ageing 2015, 44, 445-451.
- Séverine Sabia, H.N., Mika Kivimaki, Martin J. Shipley, Michael G. Marmot,; Singh-Manoux, A. Health Behaviors From Early to Late Midlife as Predictors of Cognitive Function: The Whitehall II Study. American Journal of Epidemiology 2009, 170, 428-437.
- Yu, J.; Feng, Q.; Yu, J.; Zeng, Y.; Feng, L. Late-Life Cognitive Trajectories and their Associated Lifestyle Factors. Journal of Alzheimer’s disease: JAD 2020, 73, 1-9.
- Clare, L.; Wu, Y.T.; Teale, J.C.; Macleod, C.; Woods, B. Potentially modifiable lifestyle factors, cognitive reserve, and cognitive function in later life: A cross-sectional study. Plos Medicine 2017, 14, e1002259.
- Hillman, C.H.; Erickson, K.I.; Kramer, A.F. Be Smart, Exercise Your Heart: Exercise Effects on Brain and Cognition. Nature Reviews Neuroscience 2008, 9, 58-65.
- Northey, J.M.; Cherbuin, N.; Pumpa, K.L.; Smee, D.J.; Rattray, B. Exercise interventions for cognitive function in adults older than 50: a systematic review with meta-analysis. Br J Sports Med 2018, 52, 154-160.
- Beydoun, M.A.; Gamaldo, A.A.; Beydoun, H.A.; Tanaka, T.; Zonderman, A.B. Caffeine and alcohol intakes and overall nutrient adequacy are associated with longitudinal cognitive performance among U.S. adults. Journal of Nutrition 2014, 144, 890-901.
- Zhou, S.; Zhou, R.; Zhong, T.; Tan, J.; Zhou, H. Association of Smoking and Alcohol Drinking with Dementia Risk Among Elderly Men in China. Current Alzheimer Research 2014, 11, 899-907.
- Zhang, W.; Chen, Y.; Chen, N. Body mass index and trajectories of the cognition among Chinese middle and old-aged adults. BMC Geriatrics 2022, 22, 1-8.
- Zhu, N.; Yu, C.; Guo, Y.; Bian, Z.; Han, Y.; Yang, L.; Chen, Y.; Du, H.; Li, H.; Liu, F. Adherence to a healthy lifestyle and all-cause and cause-specific mortality in Chinese adults: a 10-year prospective study of 0.5 million people. The International Journal of Behavioral Nutrition and Physical Activity 2019, 16, 98.
- Jin, S.; Li, C.; Cao, X.; Chen, C.; Ye, Z.; Liu, Z. Association of lifestyle with mortality and the mediating role of aging among older adults in China. Archives of Gerontology and Geriatrics 2021, 98, 104559.
- Lian, Z.; Zhu, C.; Yuan, H.; Chen, Y. Combined impact of lifestyle-related factors on total mortality among the elder Chinese: a prospective cohort study. BMC Geriatrics 2022, 22, 1-11.
- Gu, D. General Data Quality Assessment of the CLHLS. Springer Netherlands 2008.
- Zeng, Y. Introduction to the Chinese Longitudinal Healthy Longevity Survey (CLHLS). Springer Netherlands 2008.
- Zeng, Y.; Feng, Q.; Hesketh, T.; Christensen, K.; Vaupel, J.W. Survival, disabilities in activities of daily living, and physical and cognitive functioning among the oldest-old in China: a cohort study. Lancet 2017, 389, 1619-1629.
- Zeng, Y.; Jr, D.P.; Vlosky, D.A.; Gu, D. Healthy longevity in China : demographic, socioeconomic, and psychological dimensions. Springer Ebooks 2008, 63, 312-313.
- Rodda, J.; Walker, Z.; Carter, J. Depression in older adults. BMJ 2011, 343, d5219.
- Folstein, M.F.; Folstein, S.E.; McHugh, P.R. “Mini-mental state”. A practical method for grading the cognitive state of patients for the clinician. J Psychiatr Res 1975, 12, 189-198.
- Steis, M.R.; Schrauf, R.W. A review of translations and adaptations of the Mini-Mental State Examination in languages other than English and Spanish. Research in Gerontological Nursing 2009, 2, 214-224.
- Zhang, Z.; Gu, D.; Hayward, M.D. Childhood nutritional deprivation and cognitive impairment among older Chinese people. Social Science & Medicine 2010, 71, 941-949.
- Sun, Q.; Yu, D.; Fan, J.; Yu, C.; Guo, Y.; Pei, P.; Yang, L.; Chen, Y.; Du, H.; Yang, X., et al. Healthy lifestyle and life expectancy at age 30 years in the Chinese population: an observational study. The Lancet. Public health 2022, 7, e994-e1004. [CrossRef]
- Li, Y.; Schoufour, J.; Wang, D.D.; Dhana, K.; Hu, F.B. Healthy lifestyle and life expectancy free of cancer, cardiovascular disease, and type 2 diabetes: prospective cohort study. BMJ 2020, 368, l6669.
- Yin, Z.; Fei, Z.; Qiu, C.; Brasher, M.S.; Kraus, V.B.; Zhao, W.; Shi, X.; Zeng, Y. Dietary diversity and cognitive function among elderly people: A population-based study. Journal of Nutrition Health & Aging 2017, 21, 1089-1094.
- WHO. Preparation and use of food-based dietary guidelines Report of a joint FAO/WHO consultation; Geneva, Switzerland, 1998.
- Yin, Z.; Brasher, M.S.; Kraus, V.B.; Lv, Y.; Shi, X.; Zeng, Y. Dietary Diversity Was Positively Associated with Psychological Resilience among Elders: A Population-Based Study. Nutrients 2019, 11, 650.
- Kennedy, G.; Ballard, T.; Dop, M.C. Guidelines for Measuring Household and Individual Dietary Diversity; Food and Agriculture Organization of the United Nations: 2013.
- Wang, Z.; Pang, Y.; Liu, J.; Wang, J.; Huang, T. Association of healthy lifestyle with cognitive function among Chinese older adults. European Journal of Clinical Nutrition 2021, 75, 325-334.
- Lv, X.; Li, W.; Ma, Y.; Chen, H.; Zeng, Y.; Yu, X.; Hofman, A.; Wang, H. Cognitive decline and mortality among community-dwelling Chinese older people. BMC Medicine 2019, 17, 63.
- Katz, S.C.; Ford, A.B.; Moskowitz, R.W.; Jackson, B.A.; Jaffe, M.W. Studies of Illness in the Aged. The Index of Adl: A Standardized Measure of Biological and Psychosocial Function. JAMA The Journal of the American Medical Association 1963, 185, 914-919.
- Stump, T. Cognitive impairment and mortality in older primary care patients. J Am Geriat Soc 2001, 49, 934-940.
- Dewey, M.E.; Saz, P. Dementia, cognitive impairment and mortality in persons aged 65 and over living in the community: a systematic review of the literature. Int J Geriatr Psychiatry 2001, 16, 751-761.
- An, R.L., Gordon G. Cognitive impairment and mortality among the oldest-old Chinese. International journal of geriatric psychiatry 2016, 31, 1345-1353.
- Sun, C.; Liu, H.; Xu, F.; Qin, Y.; Wang, P.; Zhou, Q.; Liu, D.; Jia, S.; Zhang, Q. Combined lifestyle factors on mortality among the elder population: evidence from a Chinese cohort study. BMC Geriatrics 2022, 22, 1-10.
- Mcdougall, G.J.; Mackert, M.; Becker, H. Memory Performance, Health Literacy, and Instrumental Activities of Daily Living of Community Residing Older Adults. Nursing research 2012, 61, 70-75.
- Song, S.; Stern, Y.; Gu, Y. Modifiable lifestyle factors and cognitive reserve: A systematic review of current evidence. Ageing Research Reviews 2022, 74, 101551-.
- Song, Y.; Zeng, L.; Gao, J.; Chen, L.; Sun, C.; Yan, M.; Li, M.; Jiang, H. Adherence to High Dietary Diversity and Incident Cognitive Impairment for the Oldest-Old: A Community-Based, Nationwide Cohort Study. Nutrients 2022, 14, 4530. [CrossRef]
- Zheng, J.; Zhou, R.; Li, F.; Chen, L.; Wu, K.; Huang, J.; Liu, H.; Huang, Z.; Xu, L.; Yuan, Z., et al. Association between dietary diversity and cognitive impairment among the oldest-old: Findings from a nationwide cohort study. Clinical nutrition 2021, 40, 1452-1462.
- Xiao, Q.; Li, Y.; Li, B.; Li, T.; Li, F.; Li, Y.; Chen, L.; Zhao, Z.; Wang, Q.; Rong, S. Dietary Diversity and Mild Cognitive Impairment in Middle-Aged and Older Chinese People: A Cross-Sectional Study. Journal of Alzheimer’s disease reports 2023, 7, 1045-1053. [CrossRef]
- Tucker, K.L. Nutrient intake, nutritional status, and cognitive function with aging. Annals of the New York Academy of Sciences 2016, 1367, 38-49.
- Wang, H.P.; Liang, J.; Kuo, L.M.; Chen, C.Y.; Shyu, Y.I. Trajectories of nutritional status and cognitive impairment among older Taiwanese with hip fracture. The journal of nutrition, health & aging 2017, 21, 38-45.
- Narmaki, E.; Siassi, F.; Koohdani, F.; Qorbani, M.; Shiraseb, F.; Ataie-Jafari, A.; Sotoudeh, G. Dietary diversity as a proxy measure of blood antioxidant status in women. Nutrition 2015, 31, 722-726.
- Guidi, I.; Galimberti, D.; Lonati, S.; Novembrino, C.; Bamonti, F.; Tiriticco, M.; Fenoglio, C.; Venturelli, E.; Baron, P.; Bresolin, N. Oxidative imbalance in patients with mild cognitive impairment and Alzheimers disease. Neurobiology of Aging 2006, 27, 262-269.
- Claesson, M.J.; Jeffery, I.B.; Conde, S.; Power, S.E.; O’Connor, E.M.; Cusack, S.; Harris, H.M.B.; Coakley, M.; Lakshminarayanan, B.; O’Sullivan, O. Gut microbiota composition correlates with diet and health in the elderly. Nature 2012, 488, 178-184.
- Sun, M.; Ma, K.; Wen, J.; Wang, G.; Zhang, C.; Li, Q.; Bao, X.; Wang, H. A Review of the Brain-Gut-Microbiome Axis and the Potential Role of Microbiota in Alzheimer’s Disease. Journal of Alzheimer’s Disease 2020, 73, 849-865.
- Kesika, P.; Suganthy, N.; Sivamaruthi, B.S.; Chaiyasut, C. Role of gut-brain axis, gut microbial composition, and probiotic intervention in Alzheimer’s disease. Life sciences 2021, 264, 118627.
- Momtaz, Y.A.; Haron, S.A.; Hamid, T.A.; Ibrahim, R.; Tanjani, P.T. Body Mass Index (BMI) and Cognitive Functions in Later Life. Current Alzheimer Research 2018, 15, 195-200.
- Lautenschlager, N.T.; Cox, K.L.; Flicker, L.; Foster, J.K.; van Bockxmeer, F.M.; Xiao, J.; Greenop, K.R.; Almeida, O.P. Effect of physical activity on cognitive function in older adults at risk for Alzheimer disease : a randomized trial. JAMA 2008, 300, 1027-1037.
Figure 1.
Associations of the MMSE scores with mortality stratified by lifestyles.—Associations between MMSE scores and all-cause mortality stratified by lifestyles. Results were adjusted for age, sex, education, residence, marital status, living pattern, self-rated of economic status, ADL in disability, and history of chronic disease (diabetes, heart diseases, cancer and stroke). MMSE, Mini-Mental State Examination; HR, hazard ratio; CI, confidence interval.
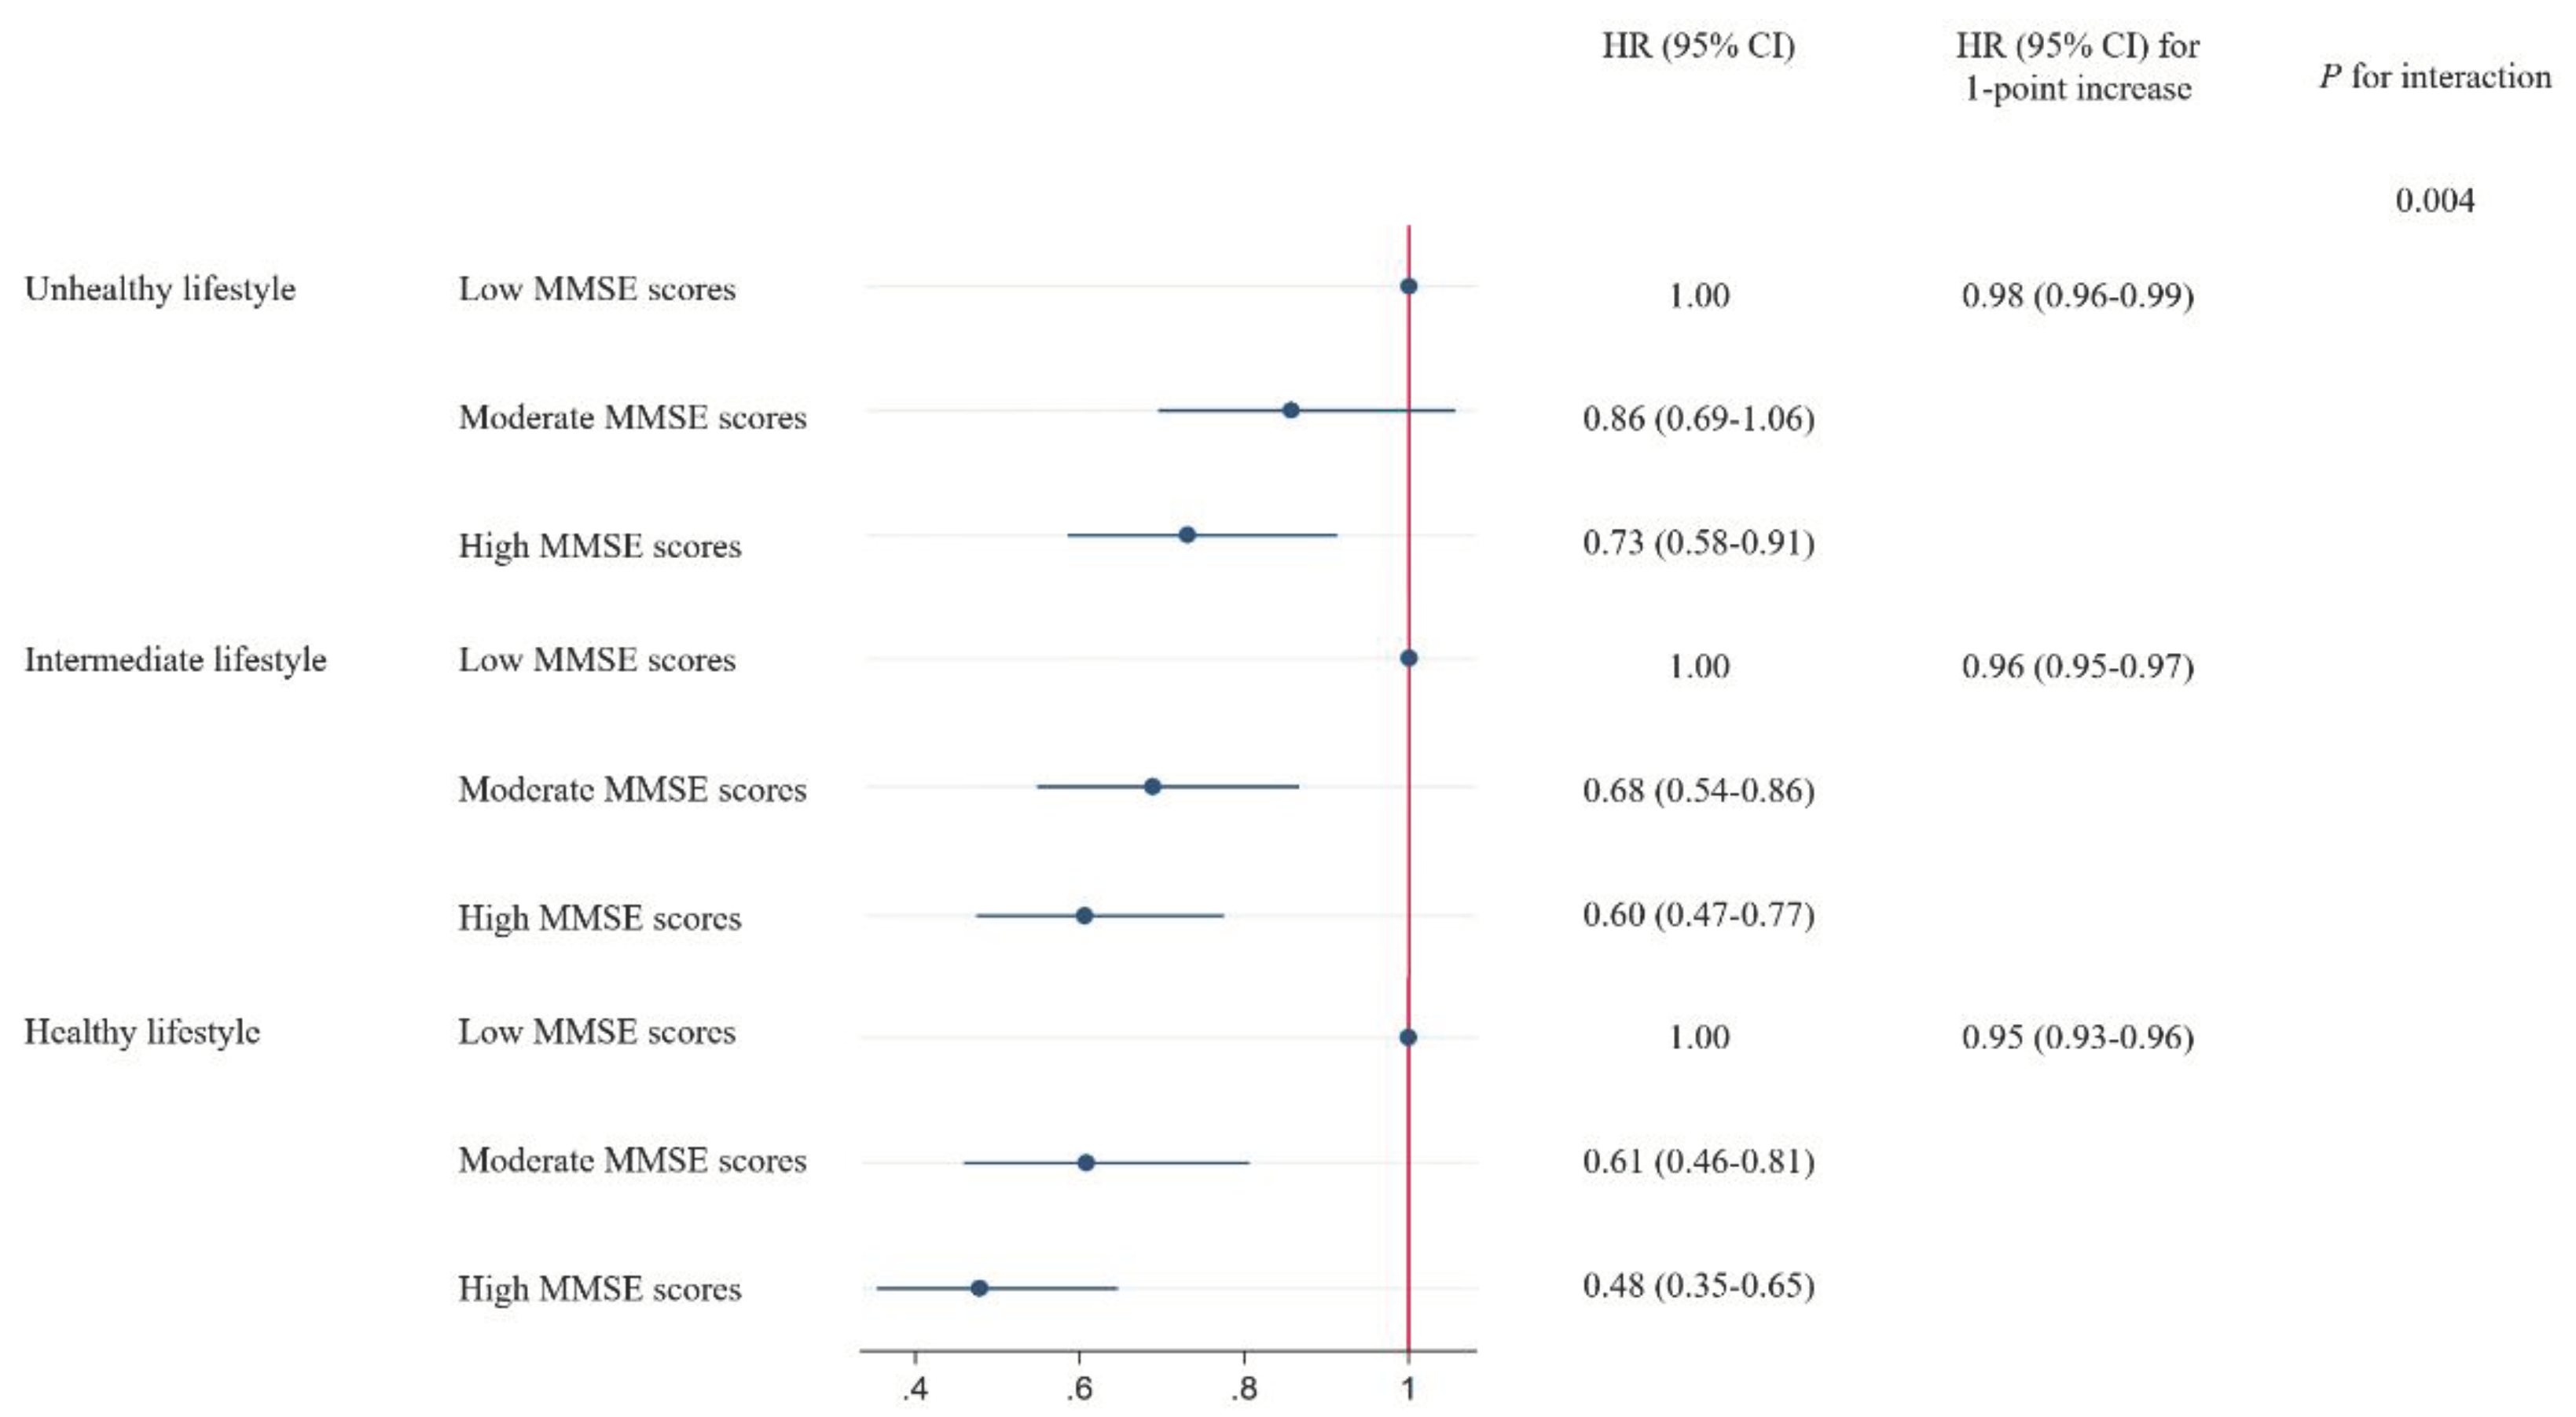

Table 2.
Adjusted HRs and 95% CIs for the MMSE scores with all-cause mortality.
| MMSE scores | HR (95% CI) for 1-point increase |
P for trend | |||
| Low | Moderate | High | |||
| Model 1a | 1.00 | 0.61 (0.54-0.70) | 0.49 (0.43-0.56) | 0.95 (0.95-0.96) | <0.001 |
| Model 2b | 1.00 | 0.62 (0.55-0.71) | 0.51 (0.44-0.58) | 0.96 (0.95-0.96) | <0.001 |
| Model 3c | 1.00 | 0.72 (0.63-0.83) | 0.60 (0.52-0.69) | 0.96 (0.96-0.97) | <0.001 |
| Model 4d | 1.00 | 0.73 (0.64-0.83) | 0.61 (0.53-0.71) | 0.96 (0.96-0.97) | <0.001 |
a Adjusted for age and sex. b Adjusted for age, sex, and lifestyle. c Adjusted for all the covariates, including age, sex, education, residence, marital status, living pattern, self-rated of economic status, ADL in disability, and history of chronic disease (diabetes, heart diseases, cancer and stroke). d Adjusted for lifestyle and all the covariates, including age, sex, education, residence, marital status, living pattern, self-rated of economic status, ADL in disability and history of chronic disease (diabetes, heart diseases, cancer and stroke). MMSE, Mini-Mental State Examination; HR, hazard ratio; CI, confidence interval; ADL, activities of daily living; BMI, body mass index.
Table 3.
Adjusted HRs and 95% CIs for the lifestyle with all-cause mortality.
| Lifestyle | HR (95% CI) for 1-point increase |
P for trend | |||
| Unhealthy | Intermediate | Healthy | |||
| Model 1a | 1.00 | 0.91 (0.81-1.03) | 0.69 (0.60-0.79) | 0.87 (0.83-0.91) | <0.001 |
| Model 2b | 1.00 | 0.93 (0.83-1.05) | 0.74 (0.65-0.85) | 0.90 (0.86-0.94) | <0.001 |
| Model 3c | 1.00 | 0.95 (0.84-1.07) | 0.78 (0.68-0.90) | 0.90 (0.86-0.95) | <0.001 |
| Model 4d | 1.00 | 0.96 (0.85-1.08) | 0.80 (0.70-0.93) | 0.92 (0.87-0.97) | 0.001 |
a Adjusted for age and sex. b Adjusted for age, sex, and MMSE scores. c Adjusted for all the covariates, including age, sex, education, residence, marital status, living pattern, self-rated of economic status, ADL in disability, and history of chronic disease (diabetes, heart diseases, cancer and stroke). d Adjusted for MMSE scores and all the covariates, including age, sex, education, residence, marital status, living pattern, self-rated of economic status, ADL in disability, and history of chronic disease (diabetes, heart diseases, cancer and stroke). MMSE, Mini-Mental State Examination; HR, hazard ratio; CI, confidence interval; ADL, activities of daily living; BMI, body mass index.
Disclaimer/Publisher’s Note: The statements, opinions and data contained in all publications are solely those of the individual author(s) and contributor(s) and not of MDPI and/or the editor(s). MDPI and/or the editor(s) disclaim responsibility for any injury to people or property resulting from any ideas, methods, instructions or products referred to in the content. |
© 2024 by the authors. Licensee MDPI, Basel, Switzerland. This article is an open access article distributed under the terms and conditions of the Creative Commons Attribution (CC BY) license (http://creativecommons.org/licenses/by/4.0/).
Copyright: This open access article is published under a Creative Commons CC BY 4.0 license, which permit the free download, distribution, and reuse, provided that the author and preprint are cited in any reuse.


