Submitted:
29 March 2024
Posted:
01 April 2024
You are already at the latest version
Abstract
This study delves into hospital mobility, understood as an indicator of perceived service quality, across the Italian regions of Apulia and Emilia Romagna, utilizing logistic regression among machine learning techniques. The focus is on how structural, operational, and clinical variables impact patient perceptions of service quality, influencing their healthcare choices. Through the analysis of mobility trends with machine learning, significant differences between regions were uncovered, highlighting the influence of regional context on perceived quality. The integration of SHAP (SHapley Additive exPlanations) values into our analysis provided deeper insights into the logistic regression model, elucidating the specific contribution of each variable to perceived healthcare quality. This incorporation of SHAP values underscores the study's commitment to employing advanced, explainable AI techniques to enhance the interpretability and fairness of healthcare service evaluations. The choice of logistic regression elucidated the impact of specific variables on quality perception, offering essential insights for optimizing healthcare resource distribution and underscoring the importance of data-driven strategies to foster more equitable, efficient, and patient-centred healthcare systems. Contributing to the understanding of perceived quality dynamics within the healthcare context, the research paves the way for further investigations into enhancing accessibility and service quality, leveraging machine learning as a tool for improving healthcare services efficiency in diverse regional settings.
Keywords:
Hospital Mobility
; Machine Learning
; Healthcare Quality Assessment
1. Introduction
Italy's National Health Service is steadfast in providing high-quality medical care to all citizens. However, the regionalized health structure introduces performance disparities across regions, prompting experts to scrutinize and benchmark regional health systems to discern models of excellence, areas needing improvement, and best practices [7].
Our analysis zeroes in on the hospital systems of Apulia and Emilia-Romagna, chosen for their distinct characteristics. Emilia-Romagna, as per the GIMBE Report 2023, is a frontrunner in delivering Essential Levels of Assistance (LEA), showcasing its prowess in providing essential services. This region's success is partly attributed to the Guarantee System, ensuring quality, appropriateness, and uniformity in health service delivery, a domain where Emilia-Romagna shines (GIMBE Foundation , http://www.gimbe.org/).
Conversely, Apulia, with its unique history, demography, and geography, demonstrates remarkable adaptability and innovation in healthcare, tackling specific challenges head-on. The comparative study between Emilia-Romagna and Apulia aims not to rank their services but to reveal how differing contexts, resources, and strategies influence healthcare service efficiency and effectiveness. Emilia-Romagna leverages its extensive experience to offer proven solutions, whereas Apulia introduces innovative approaches to address unique challenges, potentially applicable in other settings.
A pivotal aspect of our research is evaluating hospital efficiency through the lens of resident patient quality perception, considering Apulia and Emilia-Romagna as a unified territory for health mobility analysis. This methodology enables a nuanced assessment of healthcare service efficiency and quality, factoring in patient experiences and preferences in healthcare facility selection.
Patient perceptions of hospital service quality are vital for elevating health standards. An analysis of Facebook reviews using machine learning techniques has established a significant correlation between hospital accreditation and online emotional expressions, emphasizing the importance of valuing patient feedback [1]. Additionally, the deployment of a specific conceptual framework has equipped hospital administrators with a robust tool for scrutinizing and enhancing service quality across various hospital settings [22]. These strategies highlight the critical need to integrate patient perspectives in healthcare service optimization, ensuring state-of-the-art, patient-centric care. The analysis of the territorial distribution of healthcare facilities and accessibility offers an interesting perspective on the importance of integrating the healthcare dimension into territorial planning to address inequalities in service access [16]. Furthermore, the study on healthcare inequalities and disparities in disadvantaged areas gathers evidence and field experiences, providing recommendations to tackle inequities and improve access to care [3], thus enriching our understanding of regional healthcare dynamics in Italy with examples and lessons from international contexts.
Hospital efficiency is a cornerstone for ensuring quality healthcare in Italy. The Hub & Spoke network model, transient efficiency strategies, prudent management of hospital and intensive care beds, and the adoption of a Prospective Payment System are instrumental in promoting hospital efficiency, contributing to a more agile and sustainable funding model [6; 8; 24; 25]. These initiatives underscore Italy's commitment to a comprehensive health system renewal, aiming to bolster efficiency and better meet the needs of all citizens.
The examination of perceived quality underscores the significance of considering patient hospitalization propensity as an insightful indicator. This propensity, reflecting on hospitalization outcomes and patient mobility, directly impacts the perceived quality of hospital services. Patient mobility, indicative of the quest for quality care, influences perceptions of hospital service quality through patient transfers across health facilities, both within and beyond regional borders.
Furthermore, the endeavor to enhance hospital service quality incorporates complex nuances, including patient mobility, proposing a holistic framework for the continuous improvement of hospital service quality [26]. This comprehensive approach provides a clearer, more in-depth view of perceived quality within the hospital systems of Apulia and Emilia-Romagna.
In an era marked by global interconnectedness and unparalleled knowledge exchange, understanding the variances and commonalities between different regional hospital systems is imperative. This understanding is crucial not only for national improvement but also for offering valuable insights to other countries, especially in navigating health crises like the COVID-19 pandemic.
This comparative analysis between Apulia and Emilia-Romagna transcends mere performance evaluation, offering a holistic perspective on the dynamics, processes, and strategies that can elevate care quality and citizen health. Through critical analysis and mutual learning, the aim is to forge a health system that is equitable, resilient, and efficient, catering to the needs of all citizens.
The text is structured as follows: it begins by defining the problem and outlining the goals of the research, then moves on to describe the methodological background and the practical example to which this methodology was applied. This is followed by a chapter dedicated to the details of the investigation carried out, highlighting the most significant findings, which are subsequently critically analyzed in another chapter. This latter section also includes a reflection on the originality, potential, and constraints of the suggested approach. The conclusions provide insights into the implications of using the methodology for decision support at various levels and propose directions for future research.
2. Background
Within the varied landscape of the Italian healthcare system, regional differences outline a unique context for analyzing the dynamics of access to care. Hospital networks, with their territorial specificities, offer a lens through which to explore how healthcare facilities meet the needs of a diverse population. In this scenario, our study focuses on investigating patient mobility, a crucial aspect that reflects individual choices in accessing hospital care. Recent research has confirmed that the endowment of hospital beds is a determining factor in patient mobility, especially in decentralized healthcare contexts, suggesting a direct area of interest for our work [12].
By adopting a predictive model based on logistic regression, we aim to uncover the factors that guide patients in their choice of hospital, paying particular attention to organizational, outcome, and structural variables. This advanced methodological approach, situated at the intersection of data science and healthcare research, allows for an in-depth analysis of expected mobility towards hospitals, offering valuable insights to optimize the distribution of healthcare resources and improve accessibility and quality of care. The analysis of interregional pediatric healthcare mobility has highlighted deficiencies in pediatric services in some Italian regions, indicating the need for a strengthening of healthcare offerings [9].
The interplay between energy management and hospital performance points to how energy efficiency represents a critical factor for the overall efficiency of a hospital. Incorporating machine learning-based energy monitoring methods can significantly contribute to understanding and improving hospital energy demands, directly impacting operational efficiency [34]. Our work is set within a research context that extends previous investigations examining the interaction between energy management and hospital performance, highlighting the importance of improved management practices [27]. Our study broadens the research horizon by exploring patient mobility as a key indicator of hospital efficiency and the perceived quality of healthcare services.
This study offers an innovative perspective on the mobility choices of patients in Italy, highlighting how a detailed analysis of these dynamics can significantly contribute to the strategic planning and management of healthcare services. Through data analysis and the application of machine learning techniques, we aim to outline strategies for a more efficient, effective, and patient-centered care system, promoting a balance between the quality of care and economic sustainability in the national healthcare context.
2.1. Application Context
Incorporating data from 2021, our study provides a sharp and scientifically rigorous overview of healthcare facilities in the regions of Apulia and Emilia-Romagna, following the guidelines of the Ministry of Health. In Apulia, the healthcare system is organized around 6 Local Health Authorities (ASL), each responsible for delivering a comprehensive range of health services to the local population. Similarly, Emilia-Romagna's healthcare services are structured around 8 Local Health Units (USL), which play a pivotal role in ensuring access to health services across the region. These entities, ASLs in Apulia and USLs in Emilia-Romagna, are crucial for implementing national health policies at the local level, adapting them to meet the specific needs of their communities. Through detailed analysis, significant differences in the distribution and efficiency of healthcare facilities emerge, reflecting the diversity and complexity of the Italian healthcare system. First-Level Hospitals, providing essential services such as emergency care, diagnostics, regular hospitalization, and outpatient services, represent the community's first contact with healthcare. Their widespread presence across the national territory ensures access to primary care for the local community. Second-Level Hospitals, characterized by greater specialization compared to first-level hospitals, offer more complex services such as specialized surgery, intensive care, and hemodynamics services. These centers, distributed in numerous regions of Italy, serve as reference points for the provision of advanced care. Basic Hospitals, primarily focused on primary care functions, offer basic care, outpatient services, and primary level diagnostics. Their role is crucial in connecting primary care with more specialized hospital facilities, ensuring continuity in healthcare. Institutes of Scientific Research and Care (IRCCS), dedicated to scientific research and highly specialized healthcare, play a fundamental role in the development of new therapies and medical research, offering highly specialized care. Accredited Private Healthcare Facilities, which have obtained accreditation from the National Health Service (SSN), collaborate with the public healthcare system by providing care and rehabilitation services, operating in compliance with the quality and safety standards set by the SSN.
To make an effective comparison between the two regions in terms of healthcare services, a hypothetical macro-region was conceived, focusing exclusively on the mobility of residents, to offer a clear and precise picture of the health situation and patient mobility exclusively between Emilia-Romagna and Apulia. The analysis, based on 2021 data, aims to evaluate the efficiency, accessibility, and quality of the present healthcare facilities, as well as to understand the dynamics of choice and preference of patients in relation to the healthcare services offered by the two regions. Table 1 details the distribution of these facilities in the two regions, highlighting a marked predominance of private hospitals in Emilia Romagna, with 27 base hospitals and 15 second-level hospitals, while Apulia shows a balanced distribution, with a significant presence of 5 public second-level hospitals.
Table 2 presents the results of the χ² test, conducted to assess the differences in the distribution of hospitals and hospital complexes in the two regions and overall.
The very low p-value (<.001) indicates a significant association between the region and the distribution of hospitals by type and sector, suggesting notable differences in the distribution of hospitals between the two regions, with a different distribution by type (First Level, Second Level, Basic Level) and sector (Public and Private) in each region.
In Emilia-Romagna, the private hospital network, accredited to the regional health system, is strongly oriented towards basic services, with 27 base-level hospitals out of a total of 46. The presence of four IRCCS (one in the private sector and three in the public sector) and 12 second-level hospitals in the public sector highlights a substantial commitment towards research and specialized care.
In Apulia, the private hospital network, also accredited, is mainly composed of first-level structures (4 out of 30), with no presence of base-level hospitals. This distribution suggests a focus on specialized care in the private sector. However, in the public sector, the presence of five second-level structures underlines a parallel commitment to provide a broad spectrum of health services.
Considering macro-region, the difference in the distribution of hospital levels becomes evident. While Emilia-Romagna focuses on basic and specialized services, Apulia shows a greater emphasis on second-level structures in the public sector, compensating for the absence of base-level hospitals in the private sector. This inter-regional balance could reflect strategic complementarity, with each region covering different aspects of the population's health needs.
The configuration of the hospital network in Apulia, with a strong presence of second-level structures in the public sector, highlights a commitment to ensuring specialized care, even in the absence of base-level hospitals in the private sector. This may indicate a strategy of focusing resources on specialized and advanced care. However, it is essential to ensure that access to basic care is not compromised, and that there is an adequate geographical distribution of facilities to ensure accessibility for all residents.
3. Materials and Methods
In our study, we utilized the dataset originally employed in the research by Santamato et al. (2023), enriched with 2021 data. Our selection focused on a carefully curated set of key variables presented in aggregated form. This set includes the total number of available beds and departments, healthcare personnel (nurses, doctors, and other professionals), as well as crucial data on mortality rates, readmissions, and surgical procedures. We also introduced categorical variables to distinguish between hospital networks (public vs. private) and to classify the level of healthcare facilities. These variables serve as fundamental features in our predictive model, which aims to forecast the active kilometer mobility of patients.
Our analytical journey was structured into three key phases to ensure the derivation of accurate and insightful results:
1. Data Preprocessing: This initial phase was dedicated to improving data quality and uniformity. We carefully addressed missing values, eliminated outliers, and standardized variables, preparing the ground for a consistent and homogenized dataset. The significance of this step is echoed in a study that emphasizes the critical role of data preprocessing in healthcare analytics, highlighting how such practices can significantly enhance the accuracy of predictive models [18].
2. Cluster Analysis: In the subsequent phase, we used the k-means algorithm for a nuanced categorization of the target variable, setting the stage for more detailed insights into patient mobility patterns. This approach is supported by research that demonstrates the utility of k-means clustering in healthcare for identifying patterns and improving patient care management, further validating the choice of this method for our analysis [4].
3. Predictive Modeling: The final phase will see the development of an advanced predictive model, powered by logistic regression algorithms. This model will focus on the mobility variable categorized after cluster analysis, using the initially selected health variables as features. The importance of logistic regression in healthcare predictive modeling is highlighted in a review that discusses the role of predictive modeling in healthcare research, underscoring how effectively researchers can take decisions based on predictive modeling [23].
The entire workflow is encapsulated in Figure 1, offering a visual map of our methodological approach.
Our analyses were powered by Orange Data Mining v3.36, running on an advanced Apple M1 Pro system with 16GB of RAM and 1TB of storage, under macOS Sonoma 14.2.1. This high-level setup, combined with sophisticated machine learning techniques, ensured the efficiency and reproducibility of our analyses. The crucial role of such machine learning methodologies in extracting meaningful insights and predictive models from complex datasets has been previously underscored and validated in foundational studies, such as those focusing on machine learning for predicting neurodevelopmental disorders in children [30].
This study not only advances our understanding of healthcare dynamics but also showcases the transformative power of machine learning in navigating and interpreting complex data landscapes.
3.1. Data Preprocessing
In the initial phase of pre-processing in the machine learning context, we executed the following procedures:
1. We formulated the aggregated variables Nurses and Physicians by using the sum function in the "Formula" widget, accumulating values separately for females and males.
2. We selected the 10 features under study, specifically 8 numeric: number of beds, departments, doctors, nurses, staff, deaths, readmissions, interventions; and 2 categorical: type of hospital network (private or public) and hospital level, using the "select column" widget.
3. We standardized the chosen variables using the "continue" widget, setting the mean to 0 and the standard deviation to 1. This step underscores the importance of standardization in data processing, as highlighted by a study that developed a standardization algorithm for categorical laboratory tests, demonstrating how such practices can facilitate the handling of clinical big data and minimize manual standardization efforts [15].
Additionally, it was noted that the dataset includes a total of 127 instances (hospitals) in the hypothetical macro-region of Apulia Emilia-Romagna.
3.2. Cluster Analysis
As described in the study by Santamato et al. (2023), to calculate intra-regional active mobility in kilometers, we initially determined the interpolated distance between the capital city of the ASL/USL where the patient resides and the city where the service-providing hospital is located (Dist kmHospi). We then aggregated the total active hospitalizations by ASL/USL (HospiASL/USL) and by territorial area (HospiArea) for each hospital. The intra-regional active mobility in kilometers was calculated using the formula:
This calculation considers patient movement to a different territory from their residence as motivated by a perceived higher quality of service.
To transform active kilometric mobility, originally a continuous variable, into a categorical variable reflecting a mobility gradient (low, medium, high) based on the distance patients travel to the hospital, we employed the K-means clustering algorithm. This approach allowed us to investigate the impact of various variables more accurately on hospital choice, enhancing our understanding of the perceived quality of care.
The K-means algorithm is crucial in data analysis for its ability to divide a dataset into K distinct clusters, minimizing the sum of squared distances between the data points and the cluster centroids. This process is effectively synthesized by the formula:
where k is the number of clusters, Ci is the set of points in cluster i, x is a point in Ci, and μi is the centroid of i, reflecting how the algorithm minimizes the internal variances of the clusters to effectively group the data based on their intrinsic characteristics. Its applicability ranges from exploratory data analysis to market segmentation, highlighting its importance in various fields such as biology, marketing, and network optimization [31]. The simplicity and efficiency of K-means in processing large datasets make it essential for identifying hidden patterns and guiding data-based decisions. Its ability to adapt to complex optimization problems and improve network coverage highlights its versatility, making it a valuable tool for optimizing resources and strategies [21].
The implementation of the K-means clustering algorithm aimed to categorize active kilometric mobility into three distinct levels: low, medium, and high. The three identified clusters are depicted in the scatter plot in Figure 2.
This methodological choice was supported by a preliminary analysis, which revealed a silhouette coefficient of 0.724, indicating a significant separation and internal cohesion among the identified clusters. This separation was further confirmed and illustrated by the box plots in Figure 3, through an ANOVA approach with a p-value < 0.05. Consequently, we outlined three main groups: cluster C1, with 81 hospitals and an average mobility distance of 15,191.7 km, indicative of "low" mobility; cluster C2, comprising 17 hospitals with an average distance of 400,618 km, associated with "high" mobility; and cluster C3, aggregating 29 hospitals with an average distance of 122,101 km, corresponding to "medium" mobility. The term "medium mobility" refers to the average kilometers traveled in 2021 by patients residing in the hypothetical macroregion (Puglia-Emilia Romagna) to the chosen facility.
This segmentation provides a solid empirical foundation for delving into healthcare access dynamics, highlighting the importance of the distance patients travel in choosing a hospital, and offers key insights for optimizing healthcare services based on population mobility needs.
3.3. Prediction Model
The predictive model will employ the Logistic Regression algorithm to estimate the mobility gradient of hospitals in 2021, categorizing them into three classes: LOW, MEDIUM, and HIGH mobility, based on the distance patients travel to reach the hospital. This choice is supported by studies demonstrating the effectiveness of Logistic Regression in predicting mobility behaviors and health risks, such as the analysis of travel behavior during the COVID-19 pandemic [19] and the assessment of cardiovascular risk [32], highlighting its applicability in complex healthcare contexts.
To optimize the model's performance, we have configured the parameters with Ridge (L2) regularization, C=1, and without differentially weighting the classes, reflecting a standardized approach to maximize computational efficiency and predictive accuracy. Logistic Regression, known for its ability to handle multinomial classifications and quick training times, is ideal for analyzing large datasets in the healthcare sector, providing a solid foundation for interpreting the influence of various features on hospital mobility.
In the Logistic Regression process, feature values are combined into a weighted sum and transformed through the logistic function, producing probability values that determine the mobility classification of each hospital. This method not only provides clear predictions but also insights into the features that most significantly influence hospital mobility, supporting informed decisions to improve the accessibility and efficiency of healthcare services. This choice is based on the demonstrated effectiveness of such configurations in analyzing complex data, as highlighted in recent studies that have explored the application of logistic regression in healthcare contexts. To address the challenge of training and validation in a context of limited data, we adopted an integrated approach, dividing the dataset consisting of 127 instances (hospitals) into a training set (70%, equivalent to 89 hospitals) and a validation set (30%, corresponding to 38 hospitals) through a data sampling process. This strategy has allowed us to mitigate the risk of overfitting and ensure the model's generalizability using cross-validation techniques, which facilitated a complete and iterative use of the dataset.
We have paid particular attention to data quality, committing to rigorous data preparation and cleaning to provide the model with accurate and significant inputs. This approach has maximized the effectiveness of the available information, strengthening the robustness and reliability of the model in a scenario characterized by a limited number of observations. The model training was designed to be replicable, using a method of stratified cross-validation sampling with 10 folds.
4. Experimental Results and Discussions
The results achieved by the model have highlighted high accuracy, with an Area Under the Curve (AUC) of 0.965, an accuracy (CA) of 85.4%, an F1 score of 0.852, a precision (PREC) of 85.1%, a recall rate of 85.4%, and a Matthews Correlation Coefficient (MCC) of 0.717. For a more in-depth analysis of the model's performance, the analysis of the confusion matrix and the Receiver Operating Characteristic (ROC) curves were included. The confusion matrix (Figure 4) showed a significant match between the model's predictions and the actual classifications, with 91.4% of low mobility cases correctly identified (Low-Low), 83.3% of high mobility cases accurately classified (High-High), and 68.4% of medium mobility cases correctly recognized (Medium-Medium).
Classification errors were found in cases of medium mobility, with 21.1% mistakenly classified as low mobility and 10.5% as high mobility; 8.6% of low mobility cases were classified as medium, and 16.7% of high mobility as medium. The ROC curves for the three classes (low, medium, and high mobility) provided an effective visual representation of the model's ability to discriminate between these categories, demonstrating excellent separation with high AUC values, a sign of the model's strong ability to correctly classify hospitals based on their active mobility (Figure 5).
The analysis of feature importance, as depicted in Figure 6 and quantitatively detailed in Table 5, reveals a complex interaction between structural, operational, and systemic factors that influence the model's classification accuracy. Each feature's MEAN and STD scores provide further quantification of their respective influences. For example, a higher standard deviation indicates greater variability in a feature's influence across different model iterations, pointing to potential instabilities in its impact.
The DEATHS variable (0.10063) emerges as the most influential factor, highlighting the importance of mortality rates within hospitals as indicators of the quality of care.
Following in significance, the NETWORK variable (0.0390019) illustrates how the affiliation to public or private networks impacts hospital performance, emphasizing systemic-structural differences. The PHYSICIANS variable (0.0342539) underscores the critical role of medical staff in health outcomes.
INTERVENTIONS (0.0198643) demonstrate the relevance of the volume of medical procedures to hospital mobility classification, indicating operational efficiency and the capacity to provide care. READMISSIONS (0.0164729) reflect the impact of patient management policies and the quality of post-discharge care.
Other variables such as BEDS (0.0108043), LEVEL (0.00547481), HOSPITAL STAFF (0.00203488), DEPARTMENTS (0.00135659), and NURSES (0.00523256), while having lower importance scores, underscore the significance of structural and operational aspects in hospital mobility. These data indicate that hospital capacity, specialization level, staff composition, and available resources play a significant role in optimizing health services performance.
The analysis details how a multitude of factors, each with its specific degree of influence, contribute to hospital mobility. These figures highlight how a combination of structural, operational, and clinical factors collectively interacts in determining hospital mobility.
We adopted SHAP (SHapley Additive exPlanations) for the fair interpretation of variables in our logistic regression model, crucial for informed decisions in healthcare. This technique, which assigns an impact value to each feature, has been applied in studies demonstrating its value in the analysis of complex models [33].
The model demonstrated remarkable accuracy in classifying hospitals with "low mobility," with a final prediction of 0.97, significantly higher than the baseline value of 0.64, which represents the average probability of low mobility derived from the training data. In this context, the SHAP values illustrated in Figure 7 play a crucial role in clarifying the contribution of each variable:
- DEATHS: With a SHAP value of 0.142692 and a value of -0.63, this indicates that a lower mortality rate positively contributes to the low mobility classification in the model.
- BEDS: A SHAP value of 0.0493684 with a value of -0.8 suggests that a smaller number of beds is associated with a higher probability of low mobility.
- LEVEL=BASE LEVEL and NETWORK=PRIVATE: Both with positive SHAP values (0.0398403 and 0.0382124, respectively) and values of 1, show that base hospitals and private ones are more likely to be classified as having low mobility.
- NETWORK=PUBLIC: With a SHAP of 0.0249563 and a value of 0, it appears that belonging to a public network does not significantly impact the probability of low mobility for the hospital in this case.
- NURSES and DEPARTMENTS: These features have positive SHAP values (0.0189351 and 0.0182643) but negative values, indicating that a smaller number of nurses and departments could contribute to a higher probability of low mobility.
- PHYSICIANS and READMISSIONS: With negative SHAP values (-0.0204742 and -0.00863305) and values of -0.34 and 0.19, they indicate that a smaller number of doctors and a higher number of readmissions are associated with a reduction in the probability of being classified as having low mobility.
The model's prediction for hospitals classified as having "medium mobility" is significantly low at 0.03, indicating a much lower probability compared to the baseline value of 0.23. This suggests that the observed features tend to shift the prediction towards other mobility classes. According to SHAP values, the features influence as follows:
- BEDS and DEPARTMENTS: Present marginally negative SHAP values, suggesting that a higher number of beds and departments does not favor the classification of a hospital in the medium mobility category.
- HOSPITAL STAFF: With a positive SHAP, this feature shows a slightly favorable effect on the likelihood of medium classification, although the associated value indicates less staff than commonly expected.
- DEATHS: The mortality rate seems to have the most significant impact in reducing the probability of medium mobility, as highlighted by a considerably negative SHAP value.
- INTERVENTIONS and READMISSIONS: Both with positive SHAP values, suggest that a higher number of interventions and readmissions might push the classification towards medium mobility.
- NETWORK=PRIVATE and NETWORK=PUBLIC: Substantial negative SHAP values indicate that belonging to these networks contributes to reducing the likelihood of a medium classification, potentially in favor of a high or low mobility classification.
- LEVEL=BASE LEVEL: A negative SHAP value shows that hospitals with basic services are less likely to be considered of medium mobility.
- PHYSICIANS: This factor has the highest positive SHAP value, implying that a smaller number of doctors is correlated with an increased probability of a medium mobility classification.
The model's prediction for hospitals classified as having "high mobility" is 0.0, well below the baseline value of 0.14. This indicates that, according to the model, the considered features are generally not indicative of high mobility for this instance. Specific values:
- BEDS, DEPARTMENTS, HOSPITAL STAFF, DEATHS: All have negative SHAP values, meaning that a smaller number of beds, departments, and staff, as well as a lower mortality rate, are associated with a reduced likelihood of being classified as high mobility.
- INTERVENTIONS, READMISSIONS: These also have negative SHAP values, indicating that a higher number of interventions and readmissions is not correlated with a high mobility classification.
- NETWORK=PRIVATE, NETWORK=PUBLIC: Surprisingly, these features have positive SHAP values despite the model's prediction being 0.0. This might indicate that while belonging to a private or public network has a positive influence, it is not enough on its own to tip the classification towards high mobility.
- LEVEL=BASE LEVEL: Presents a small positive SHAP value, suggesting a slightly favorable influence towards a high mobility classification, which is interesting given the model's prediction value of 0.0.
- NURSES, PHYSICIANS: Both present the highest negative SHAP values, indicating that a smaller number of nurses and doctors is strongly associated with a lower probability of high mobility.
- The combination of these SHAP values, which are predominantly negative, clarifies why the model's prediction for high mobility is 0.0, indicating that, according to the model, the current conditions are largely not indicative of high mobility in the hospitals under examination.
We have meticulously examined the predictive value differences between Apulia and Emilia-Romagna, analyzing the impact of each characteristic on the predictions for the three mobility classes (low, medium, high) across the two regions. The graphical representations of the variables' effects on the model outcome, for the target classes (LOW, MEDIUM, HIGH), are illustrated in the violin plots in Figure 8, Figure 9 and Figure 10. The features are positioned to the left, ordered according to their importance for predicting the specific class. Positive SHAP values (indicated to the right of the center) represent the impact of a feature on the prediction for the selected class, while negative SHAP values (to the left of the center) denote an opposite effect on the classification. Red signifies higher feature values, whereas blue indicates lower values.
The numerical impact scores for each target class were compared between the two regions using the Student's t-test. Statistically significant differences, with a p-value less than 0.005 between Apulia and Emilia-Romagna, are reported in Table 6, Table 7 and Table 8, where the impact values are sorted by relevance within each target class.
For low mobility:
- Level = Base Level: In Emilia-Romagna, the presence of base-level hospitals positively contributes to the classification of low mobility, suggesting that these hospitals are adequate to meet local health needs. Conversely, in Apulia, the impact is reversed, indicating there might be less confidence in the services provided by base hospitals or a need for more specialized services.
- Network = Private: Private hospitals in Emilia-Romagna positively impact low mobility, which might reflect a higher perceived quality or greater accessibility compared to Apulia, where the impact is negative. This could indicate a different perception of quality among private healthcare networks in the two regions.
- Readmissions: A strong negative impact of readmissions on low mobility in Apulia suggests that high readmission rates might be seen as an indicator of a lack in care quality, prompting patients to seek hospitals with a better reputation or more specialized services.
For medium mobility:
- Hospital Staff: The positive impact of hospital staff allocation on medium mobility in Apulia suggests that an adequate number of staff correlates with the choice of hospitals closer to home or with an intermediate level of specialization. Conversely, a negative impact in Emilia-Romagna might reflect different expectations or a distinct distribution of human resources within healthcare facilities.
- Nurses: Similar to hospital staff, a higher number of nurses in Apulia positively influences the choice of hospitals for medium mobility, highlighting the importance of nursing staff in the perception of care quality. In Emilia-Romagna, the negative effect could indicate that other factors more significantly influence hospital choice.
For high mobility:
- Mortality: In Apulia, lower hospital mortality rates do not seem to be a decisive factor for high mobility, suggesting that other aspects of care quality or service accessibility are more relevant in-patient decisions. In Emilia-Romagna, a negative impact of mortality on high mobility might indicate a greater sensitivity to this indicator when assessing hospital quality.
- Hospital Staff: The difference in the impact of hospital staff on high mobility between the two regions may reflect a varying evaluation of hospitals' ability to provide specialized or emergency care, with a negative impact in Apulia suggesting patients are seeking better-equipped hospitals.
The investigation into hospital mobility between Apulia and Emilia-Romagna unveils a complex landscape of how quality perceptions and accessibility to healthcare services shape patient decisions in these two regions. On one side, in Emilia-Romagna, the trust in basic hospital services and private facilities for less complex care suggests a healthcare network perceived as effective and reliable. On the other, Apulia shows a tendency to favor hospitals based on the availability of qualified staff, indicating the significance of human capital in hospital choice for care of medium complexity. Regarding more specialized care, both regions exhibit a preference for well-equipped facilities with positive outcomes, revealing a common expectation of excellence in high-complexity treatments. This contrast in hospital choice dynamics between Apulia and Emilia-Romagna not only reflects regional peculiarities in quality perceptions but also underscores the need for targeted healthcare strategies capable of strengthening trust in basic and intermediate care and ensuring accessibility to highly specialized services.
4.1. Experiments
In our analysis on hospital mobility prediction, we employed advanced methodologies to identify the optimal predictive model. Figure 8 summarizes the comparison across various models - Logistic Regression, Random Forest, Gradient Boosting, SVM, kNN, Naive Bayes, and AdaBoost - using metrics such as AUC, Accuracy, F1 Score, Precision, Recall, and MCC. This selection of metrics allows for a comprehensive assessment of performance, guiding the choice of the most suitable model for hospital mobility prediction. One study examined the effectiveness of predictive models for the early diagnosis of diabetes, emphasizing the critical role of model selection in healthcare outcomes [13]. Another work discussed the development and deployment of predictive models in the healthcare sector, providing practical insights into predictive modeling in healthcare [10]. Furthermore, the comparison of predictive models for hospital readmission of heart failure patients was analyzed, highlighting the importance of cost considerations in model evaluation [17].
Figure 8.
Performance Parameters of Prediction Models.
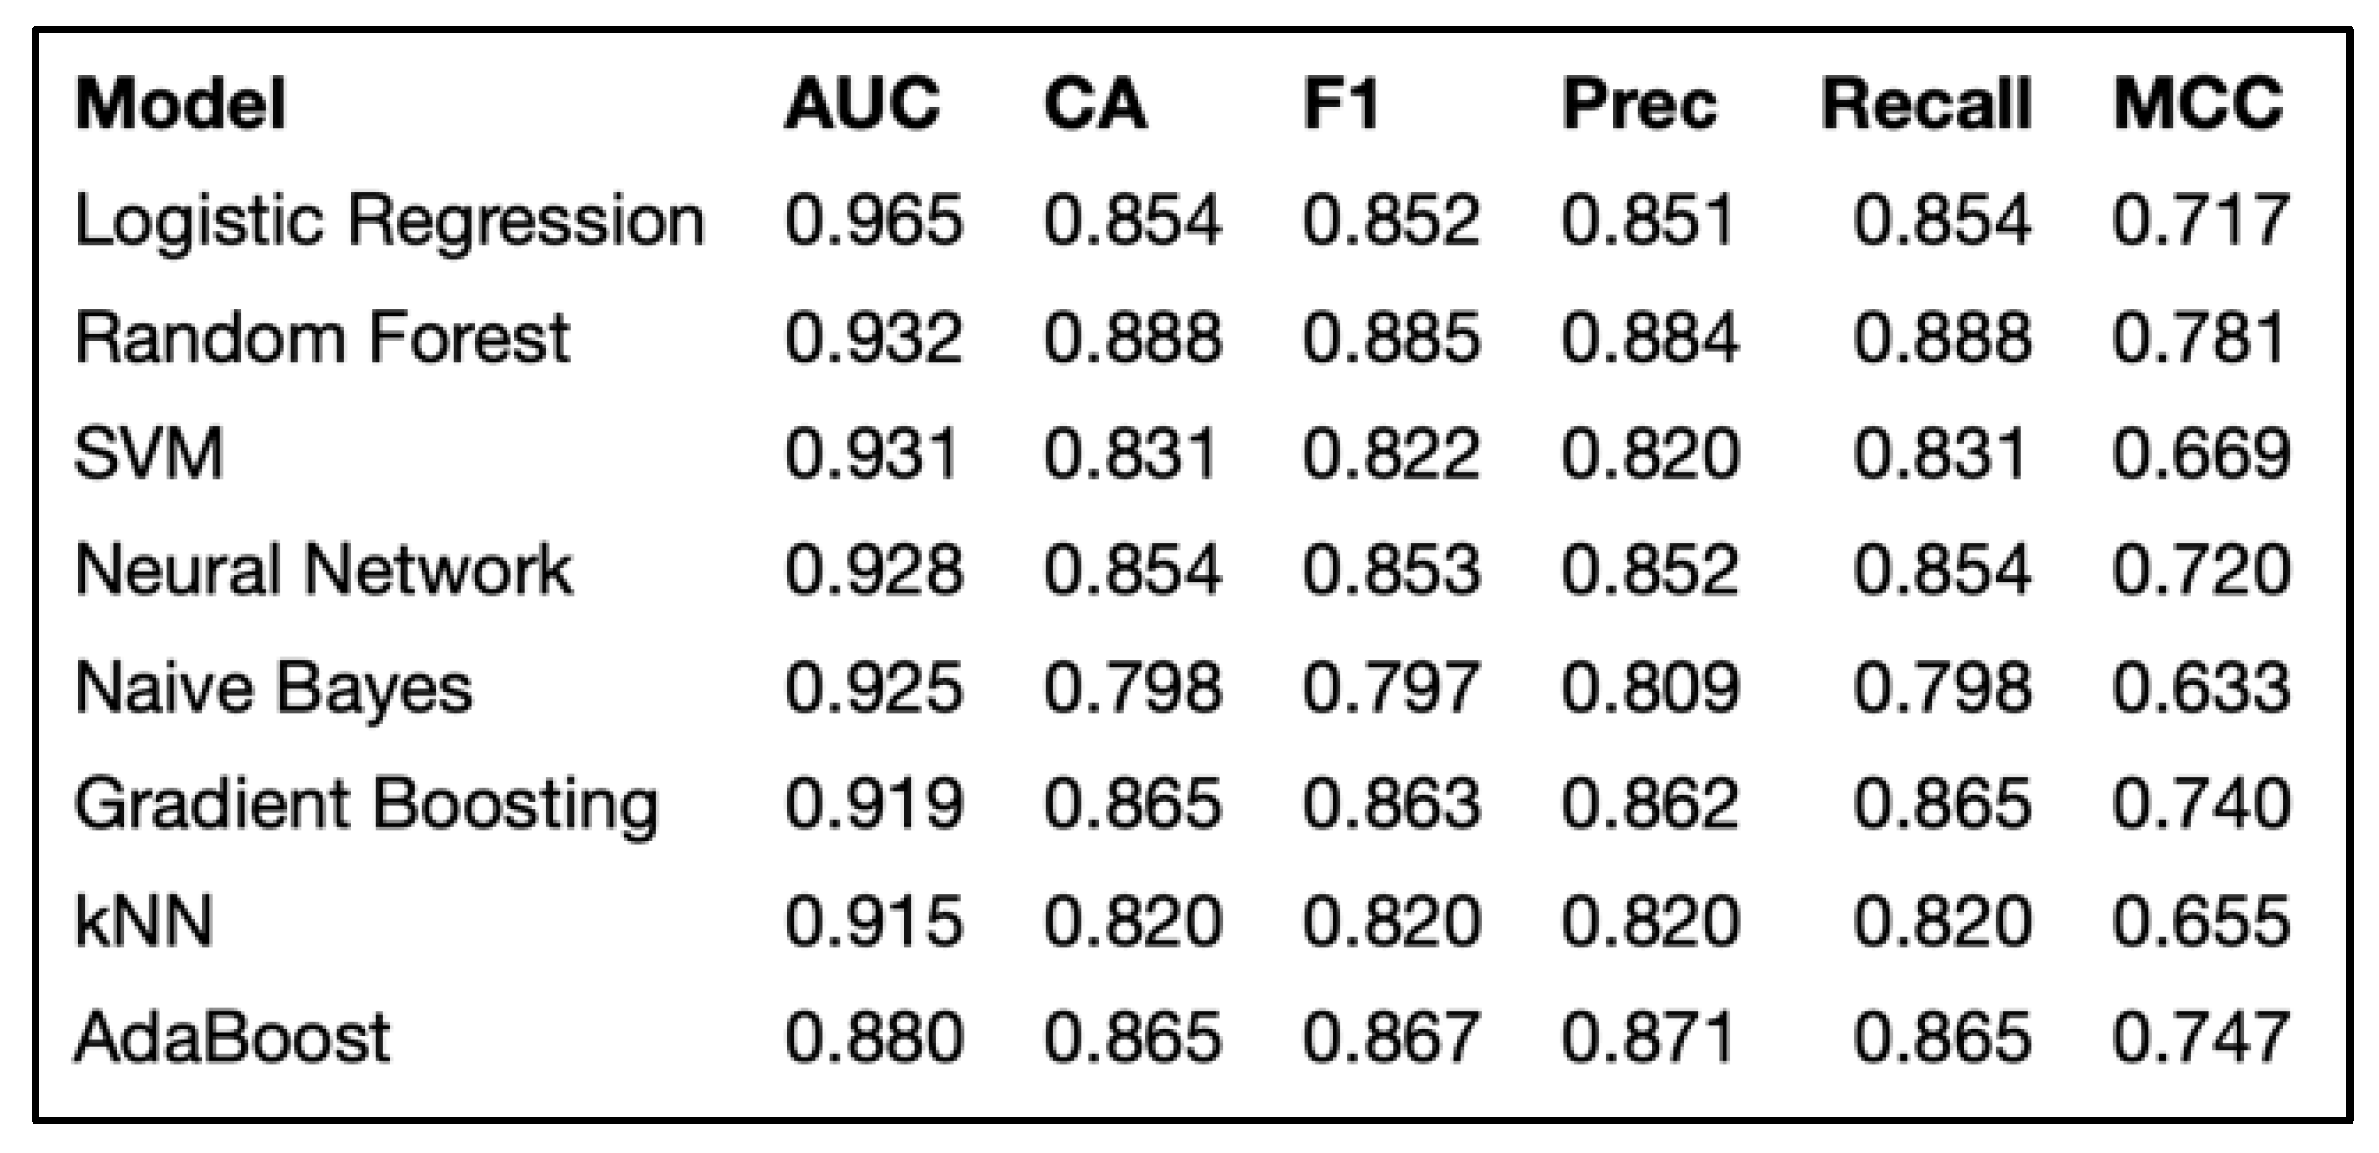
Logistic Regression, chosen for predicting hospital mobility levels (low, medium, high), is distinguished by an AUC of 0.965. This metric reflects the model's high ability to differentiate between the predicted classes, a critical aspect for ensuring precision in clinical and operational decisions. The AUC, by measuring the model's quality across the entire spectrum of classification thresholds, provides an assessment independent of the specific distribution of classes in the dataset, a fundamental aspect when considering multiple outcome categories. Logistic Regression, with its probabilistic nature, offers a robust interpretative framework and flexibility in adapting to multi-class dependent variables, making it particularly suitable for addressing our tripartite target variable. The rigor in model validation was uniformly maintained for all, using 10-fold cross-validation and dividing the dataset into a proportion of 70% for training and 30% for testing, thus ensuring the robustness and generalizability of the predictive performances.
4.2. Impact of Machine Learning on Hospital Mobility: Perspectives and Challenges
The adoption of logistic regression and SHAP values in analyzing variables that influence hospital mobility opens new perspectives for understanding patients' perception of healthcare service quality. This approach, enriched using advanced machine learning techniques, allows for the interpretation of complex relationships between variables, significantly improving the transparency and interpretability of predictive models. Recent studies on seismic vulnerability assessment and the interpretation of behaviors in strategy games demonstrate the effectiveness of SHAP values in providing detailed insights and enhancing predictive analyses across various fields [11; 14]. This enables highlighting how specific factors influence patients' decisions regarding hospital mobility, offering valuable insights for the optimization of healthcare services.
The decision to compare two regions with distinct healthcare contexts enriches the analysis, highlighting how regional peculiarities can influence the perception of service quality. This approach is supported by studies that have examined both perceived and technical healthcare quality in primary care facilities, with significant implications for the sustainability of national health insurance schemes, as demonstrated in Ghana [2]. Additionally, an analysis between the Lombardy Region and national data from Italy revealed substantial differences in hospital care quality and clinical outcomes, underscoring the importance of regional context in healthcare quality assessment [29]. These examples illustrate the critical role of regional comparisons in understanding and improving healthcare quality, offering valuable insights for optimizing healthcare services based on regional characteristics and patient perceptions.
Despite the significant contributions, the study has some limitations, including its geographical scope limited to Puglia and Emilia-Romagna. Expanding the analysis to other regions or comparing Italian data with that of other countries could provide a more comprehensive view. This is supported by research that has examined interregional healthcare mobility within a decentralized healthcare system, highlighting how factors such as regional income, hospital capacity, organizational structure, performance, and technology influence such mobility. Interregional patient mobility in a context of a decentralized healthcare system underscores the importance of these factors in driving patient decisions regarding the choice of healthcare outside their region of residence [5]. Recent research emphasizes the importance of these factors in guiding patient decisions regarding the choice of healthcare outside their region of residence, offering valuable insights for more effective health policies [20]. These insights underline the need for a deeper understanding and targeted strategies to address the challenges posed by interregional healthcare mobility, to ensure equity and efficiency in access to care across the national territory.
Furthermore, data access and its quality are critical aspects that can influence the generalizability of results. Future research should aim for a broader and more diversified data collection to overcome these limitations and further strengthen the research foundation. This study marks an important step towards using machine learning to better analyze and understand hospital mobility and the perception of healthcare service quality.
Future research should aim to expand the geographical scope and the available data base, integrating interdisciplinary perspectives for a more holistic understanding of hospital mobility dynamics.
These insights highlight the need for a deeper understanding and targeted strategies to address the challenges posed by interregional healthcare mobility, to ensure equity and efficiency in access to care across the national territory.
5. Conclusions
The research delves into the dynamics of hospital mobility within the Italian regions of Apulia and Emilia-Romagna, employing predictive models, notably logistic regression, derived from machine learning techniques to highlight the pronounced differences in hospital mobility trends. This choice of methodology underscores the profound impact regional contexts exert on patient mobility choices, with the inherent methodological advantage of machine learning lying in its capability to dissect complex datasets. This allows for the uncovering of patterns and correlations that might not be immediately visible. Through logistic regression, a deepened understanding of the effects various variables has on hospital mobility has been achieved, laying down an evidence-based foundation for strategic enhancements in healthcare services. However, it's pertinent to acknowledge the study's limitations, primarily the specificity of the models and data which might impede the broad applicability of the findings across different contexts. The quality and availability of data further tightens the need for cautious interpretation of the results and their applicability beyond the regions studied.
Despite these challenges, the practical implications that emerge from the analysis carry significant weight for the planning and management of hospital mobility. The study accentuates the criticality of embracing data-driven approaches to refine the distribution of healthcare resources, with the aim of fostering more equitable, efficient, and patient-centric healthcare systems. Ultimately, this research enriches the existing body of literature on hospital mobility, showcasing the invaluable role of machine learning techniques in dissecting the factors that influence healthcare mobility decisions. The findings stress the importance of accounting for regional nuances and patient perceptions when optimizing healthcare services, encouraging further exploration into other healthcare scenarios and geographical locales. The overarching objective is to enhance the accessibility and quality of healthcare nationwide, ensuring a fair distribution of healthcare resources.
Author Contributions
Conceptualization, V.S., C.T., N.F., M.I., J.P. and A.M.; methodology, V.S., N.F., J.P. and A.M.; data curation, V.S., C.T., N.F., M.I., J.P. and A.M.; writing—original draft preparation, V.S., and A.M.; writing—review and editing, V.S., C.T., N.F., M.I., J.P. and A.M.; visualization, V.S. and A.M.; supervision, V.S., C.T., N.F., M.I., J.P. and A.M.; project administration, A.M.; funding acquisition, J.P. All authors have read and agreed to the published version of the manuscript.
Conflicts of Interest
The authors declare that they have no known competing financial interests or personal relationships that could have appeared to influence the work reported in this paper.
Abbreviations
The following abbreviations are used in this manuscript (presented in alphabetical order):
| ASL | Local Health Authorities |
| AUC | Area Under the Curve |
| CA | Accuracy |
| CNN | Convolutional Neural Networks |
| F1 | F1 score |
| k-NN | k-nearest neighbor |
| MCC | Matthews Correlation Coefficient |
| ML | Machine Learning |
| Prec | Precision |
| ROC | Receiver Operating Characteristic |
| SHAP | SHapley Additive exPlanations |
| SVM | Support Vector Machine |
| USL | Local Health Units |
References
- A Rahim, A. I., Ibrahim, M. I., Musa, K. I., Chua, S.-L., & Yaacob, N. M. (2021). Assessing Patient-Perceived Hospital Service Quality and Sentiment in Malaysian Public Hospitals Using Machine Learning and Facebook Reviews. International Journal of Environmental Research and Public Health, 18(18), 9912. [CrossRef]
- Alhassan, R. K., Duku, S. O., Janssens, W., Nketiah-Amponsah, E., Spieker, N., van Ostenberg, P., Arhinful, D. K., Pradhan, M., & Rinke de Wit, T. F. (2015). Comparison of Perceived and Technical Healthcare Quality in Primary Health Facilities: Implications for a Sustainable National Health Insurance Scheme in Ghana. PloS One, 10(10), e0140109. [CrossRef]
- Alvarez-Elías, A. C., Lou-Meda, R., Exeni, R., Exantus, J., Bonilla-Felix, M., González-Camac, S., & de Ferris, M. E. D.-G. (2023). Addressing Health Inequities and Disparities in Children With Kidney Disease in Disadvantaged Areas: The Latin American and Caribbean Experience. Current Pediatrics Reports, 11(2), 40–49. [CrossRef]
- Awad, F. H., Hamad, M. M., & Alzubaidi, L. (2023). Robust Classification and Detection of Big Medical Data Using Advanced Parallel K-Means Clustering, YOLOv4, and Logistic Regression. Life (Basel, Switzerland), 13(3), 691. [CrossRef]
- Balia, S., Brau, R., & Marrocu, E. (2018). Interregional patient mobility in a decentralized healthcare system. Regional Studies, 52(3), 388–402. [CrossRef]
- Cavalieri, M., Guccio, C., Lisi, D., & Pignataro, G. (2014). Does the Extent of Per-Case Payment System Affect Hospital Efficiency? Evidence from the Italian NHS (SSRN Scholarly Paper 2515772). [CrossRef]
- Chisari, G., & Lega, F. (2023). Impact of austerity programs: Evidence from the Italian national health service. Health Services Management Research, 36(2), 145–152. [CrossRef]
- Colombi, R., Martini, G., & Vittadini, G. (2017). Determinants of transient and persistent hospital efficiency: The case of Italy. Health Economics (United Kingdom), 26, 5–22. Scopus. [CrossRef]
- De Curtis, M., Bortolan, F., Diliberto, D., & Villani, L. (2021). Pediatric interregional healthcare mobility in Italy. Italian Journal of Pediatrics, 47(1), 139. [CrossRef]
- 10. G. Stiglic. (2014). Tutorial: Developing and Deploying Healthcare Predictive Models in R. 2014 IEEE International Conference on Healthcare Informatics, 363–363. [CrossRef]
- G. W. Greenwood, H. Abbass, & A. Hussein. (2023). Interpretation of Neural Network Players for a Generalized Divide the Dollar Game Using SHAP Values. 2023 IEEE Symposium Series on Computational Intelligence (SSCI), 1808–1813. [CrossRef]
- Guarducci, G., Messina, G., Carbone, S., & Nante, N. (2023). Identifying the Drivers of Inter-Regional Patients’ Mobility: An Analysis on Hospital Beds Endowment. Healthcare (Basel, Switzerland), 11(14), 2045. [CrossRef]
- Jahani, M., & Mahdavi, M. (2016). Comparison of Predictive Models for the Early Diagnosis of Diabetes. Healthcare Informatics Research, 22(2), 95–100. [CrossRef]
- Karampinis, I., Iliadis, L., & Karabinis, A. (2024). Rapid Visual Screening Feature Importance for Seismic Vulnerability Ranking via Machine Learning and SHAP Values. Applied Sciences, 14(6), Articolo 6. [CrossRef]
- Kim, M., Shin, S.-Y., Kang, M., Yi, B.-K., & Chang, D. K. (2019). Developing a Standardization Algorithm for Categorical Laboratory Tests for Clinical Big Data Research: Retrospective Study. JMIR Medical Informatics, 7(3), e14083. [CrossRef]
- Lahmar, B., Dridi, H., & Akakba, A. (2021). Territorial health approach outputs of geo-governance of health facilities: Case study of Batna, Algeria. GeoJournal, 86(5), 2305–2319. [CrossRef]
- Landicho, J. A., Esichaikul, V., & Sasil, R. M. (2021). Comparison of predictive models for hospital readmission of heart failure patients with cost-sensitive approach. International Journal of Healthcare Management, 14(4), 1536–1541. [CrossRef]
- Malkusch, S., Hahnefeld, L., Gurke, R., & Lötsch, J. (2021). Visually guided preprocessing of bioanalytical laboratory data using an interactive R notebook (pguIMP). CPT: Pharmacometrics & Systems Pharmacology, 10(11), 1371–1381. [CrossRef]
- Mazanec, J., Harantová, V., Štefancová, V., & Brůhová Foltýnová, H. (2023). Estimating Mode of Transport in Daily Mobility during the COVID-19 Pandemic Using a Multinomial Logistic Regression Model. International Journal of Environmental Research and Public Health, 20(5), 4600. [CrossRef]
- Nante, N., Guarducci, G., Lorenzini, C., Messina, G., Carle, F., Carbone, S., & Urbani, A. (2021). Inter-Regional Hospital Patients’ Mobility in Italy. Healthcare, 9(9), Articolo 9. [CrossRef]
- P. Bharadwaj, R. Gupta, R. Gurjar, & A. Singh. (2023). Importance of CURE Clustering Algorithm over K-Means Clustering Algorithm for Large Data-set. 2023 Third International Conference on Secure Cyber Computing and Communication (ICSCCC), 421–426. [CrossRef]
- Pai, Y. P., Chary, S. T., & Pai, R. Y. (2018). Patient-perceived hospital service quality: An empirical assessment. International Journal of Health Care Quality Assurance, 31(1), 76–91. [CrossRef]
- Panda, N. R. (2022). A Review on Logistic Regression in Medical Research. National Journal of Community Medicine, 13(04), Articolo 04. [CrossRef]
- Pecoraro, F., Clemente, F., & Luzi, D. (2020). The efficiency in the ordinary hospital bed management in Italy: An in-depth analysis of intensive care unit in the areas affected by COVID-19 before the outbreak. PloS One, 15(9), e0239249. [CrossRef]
- Rosa, A. (2018). Il modello di rete Hub & Spoke: Fattori critici di successo e barriere organizzative. Mecosan : management ed economia sanitaria : 107, 3, 2018, 33–56. [CrossRef]
- Rose, R. C., Uli, J., Abdul, M., & Ng, K. L. (2004). Hospital service quality: A managerial challenge. International Journal of Health Care Quality Assurance Incorporating Leadership in Health Services, 17(2–3), 146–159. [CrossRef]
- Santamato, V., Esposito, D., Tricase, C., Faccilongo, N., Marengo, A., & Pange, J. (2023). Assessment of Public Health Performance in Relation to Hospital Energy Demand, Socio-Economic Efficiency and Quality of Services: An Italian Case Study. In O. Gervasi, B. Murgante, A. M. A. C. Rocha, C. Garau, F. Scorza, Y. Karaca, & C. M. Torre (A c. Di), Computational Science and Its Applications – ICCSA 2023 Workshops (pp. 505–522). Springer Nature Switzerland. [CrossRef]
- Santamato, V., Tricase, C., Faccilongo N., Marengo A., Pange, J. (2024). Healthcare performance analytics based on the novel PDA methodology for assessment of efficiency and perceived quality outcomes: a Machine Learning Approach. Expert Systems with Applications. Preprint.
- Signorelli, C., Pennisi, F., Lunetti, C., Blandi, L., Pellissero, G., & Fondazione Sanità Futura, W. G. (2024). Quality of hospital care and clinical outcomes: A comparison between the Lombardy Region and the Italian national data. Annali Di Igiene: Medicina Preventiva E Di Comunita, 36(2), 234–249. [CrossRef]
- Toki, E. I., Tsoulos, I. G., Santamato, V., & Pange, J. (2024). Machine Learning for Predicting Neurodevelopmental Disorders in Children. Applied Sciences, 14(2), Articolo 2. [CrossRef]
- Wang, C., & Wu, D.-H. (2023). A K-Means Clustering-Based Multiple Importance Sampling Algorithm for Integral Global Optimization. Journal of the Operations Research Society of China, 11(1), 157–175. [CrossRef]
- Xi, Y., Wang, H., & Sun, N. (2022). Machine learning outperforms traditional logistic regression and offers new possibilities for cardiovascular risk prediction: A study involving 143,043 Chinese patients with hypertension. Frontiers in Cardiovascular Medicine, 9, 1025705. [CrossRef]
- Yao, Z., Chen, M., Zhan, J., Zhuang, J., Sun, Y., Yu, Q., & Yu, Z. (2023). Refined Landslide Susceptibility Mapping by Integrating the SHAP-CatBoost Model and InSAR Observations: A Case Study of Lishui, Southern China. Applied Sciences, 13(23), Articolo 23. [CrossRef]
- Zini, M., & Carcasci, C. (2024). Machine learning-based energy monitoring method applied to the HVAC systems electricity demand of an Italian healthcare facility. Smart Energy, 100137. [CrossRef]
Figure 1.
Methodological workflow.
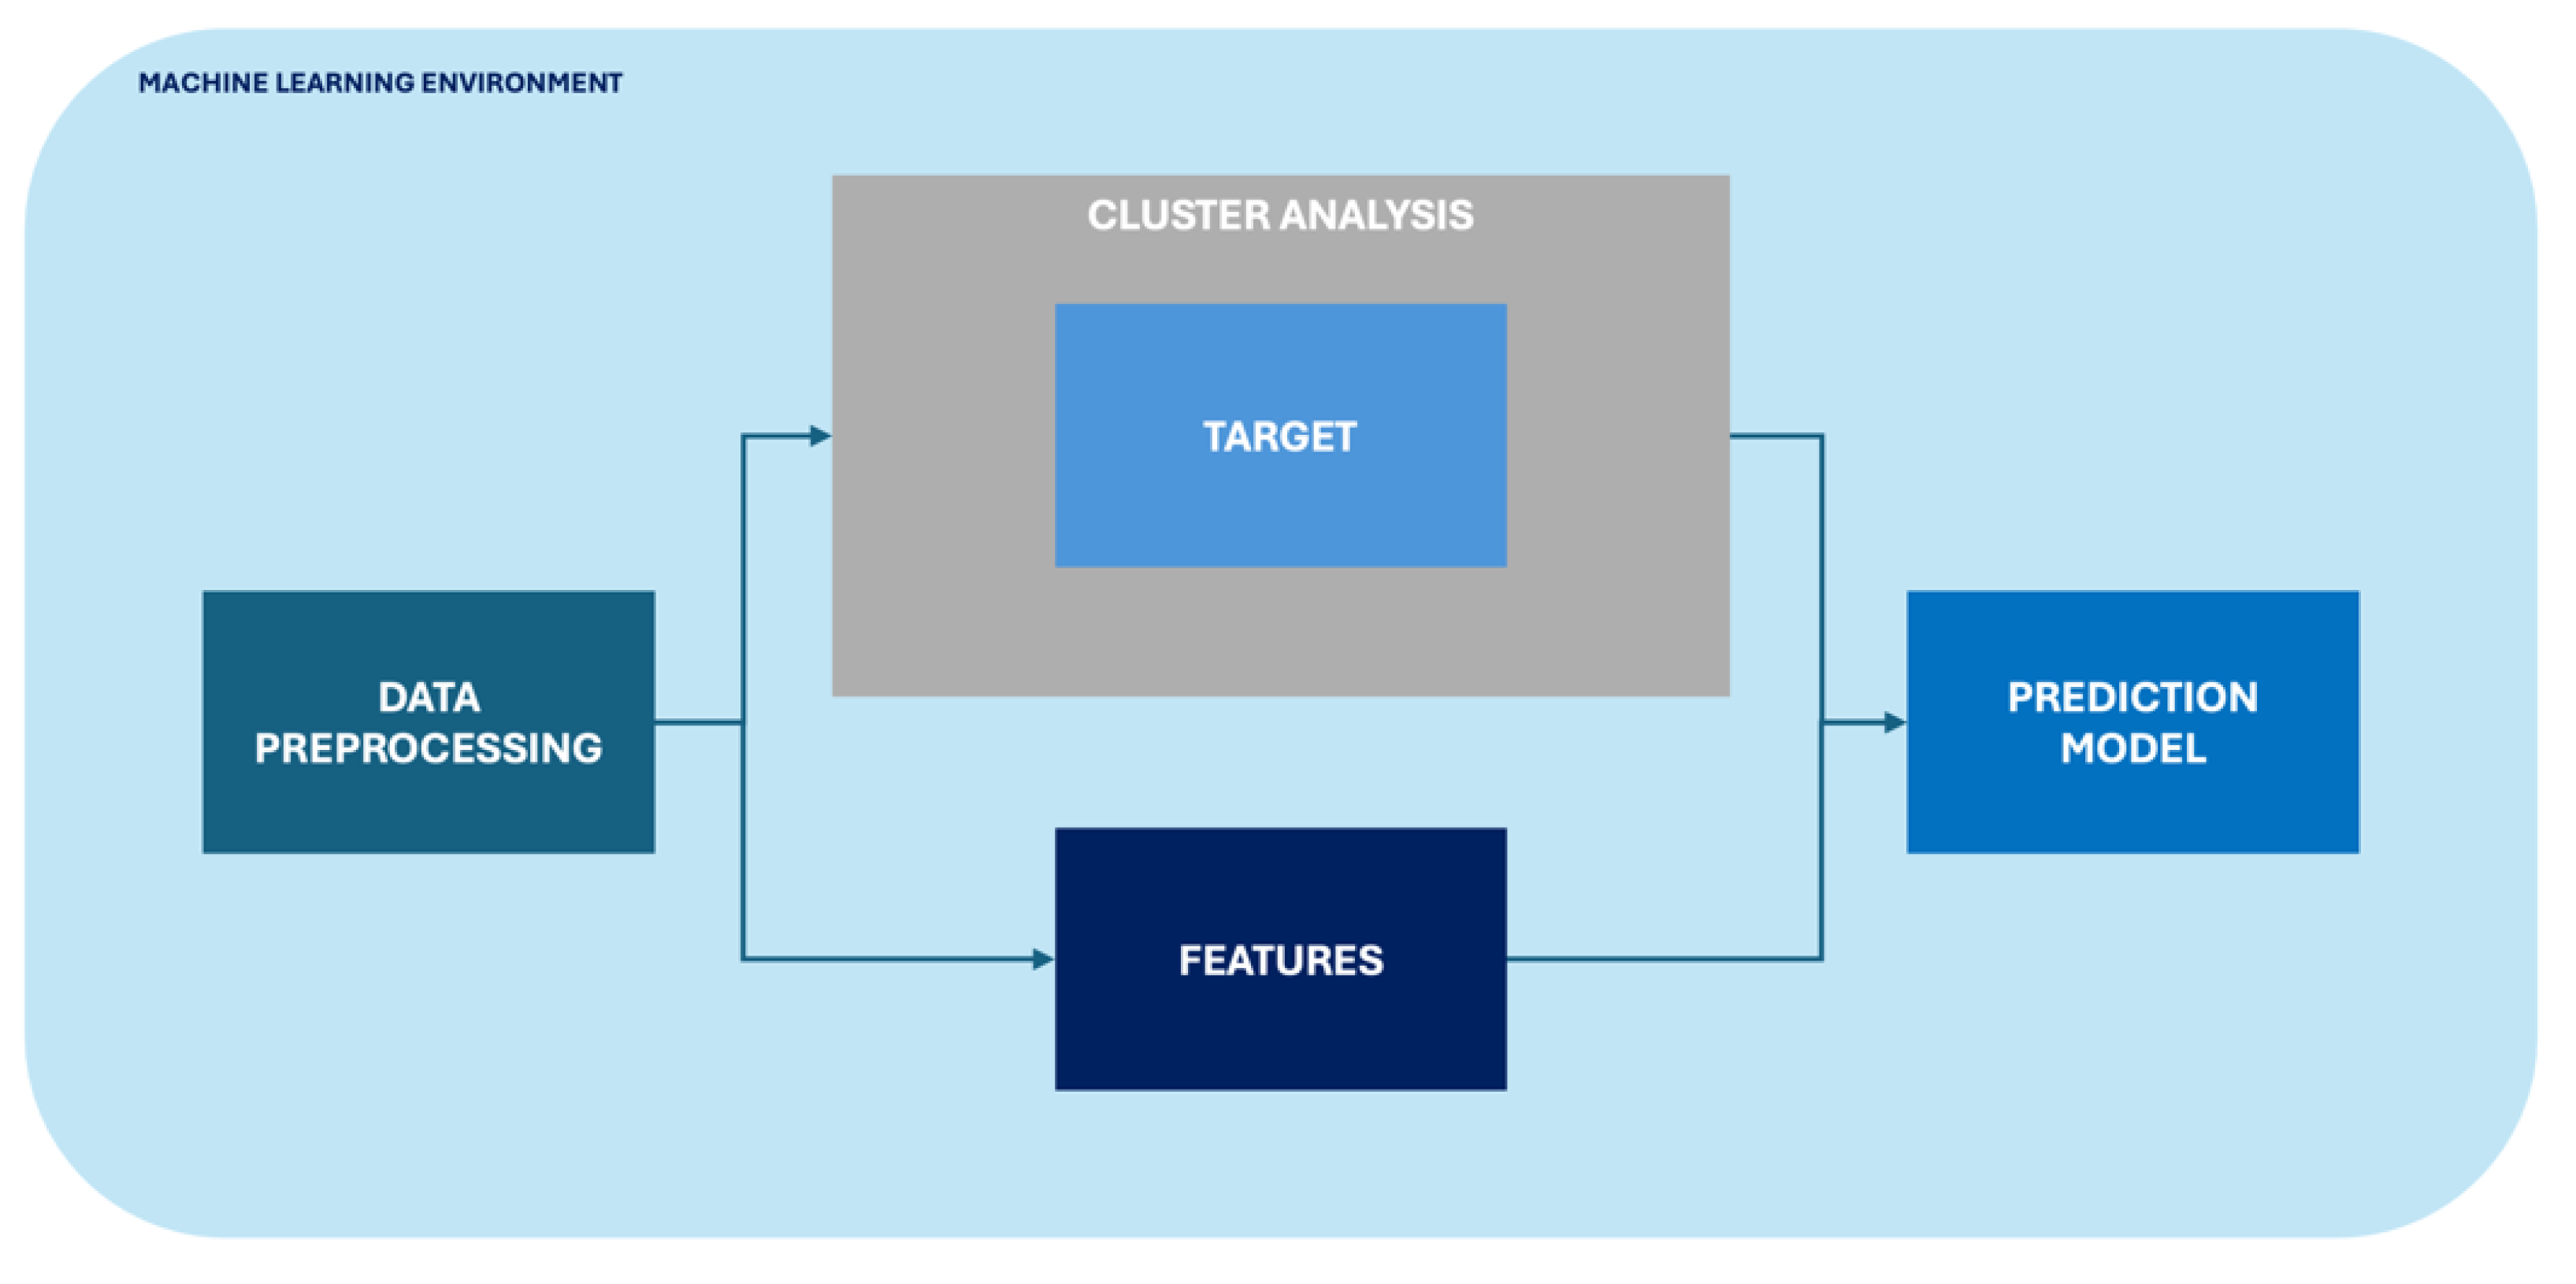
Figure 2.
Scatter plot of 3 clusters identified by K-means algorithm.
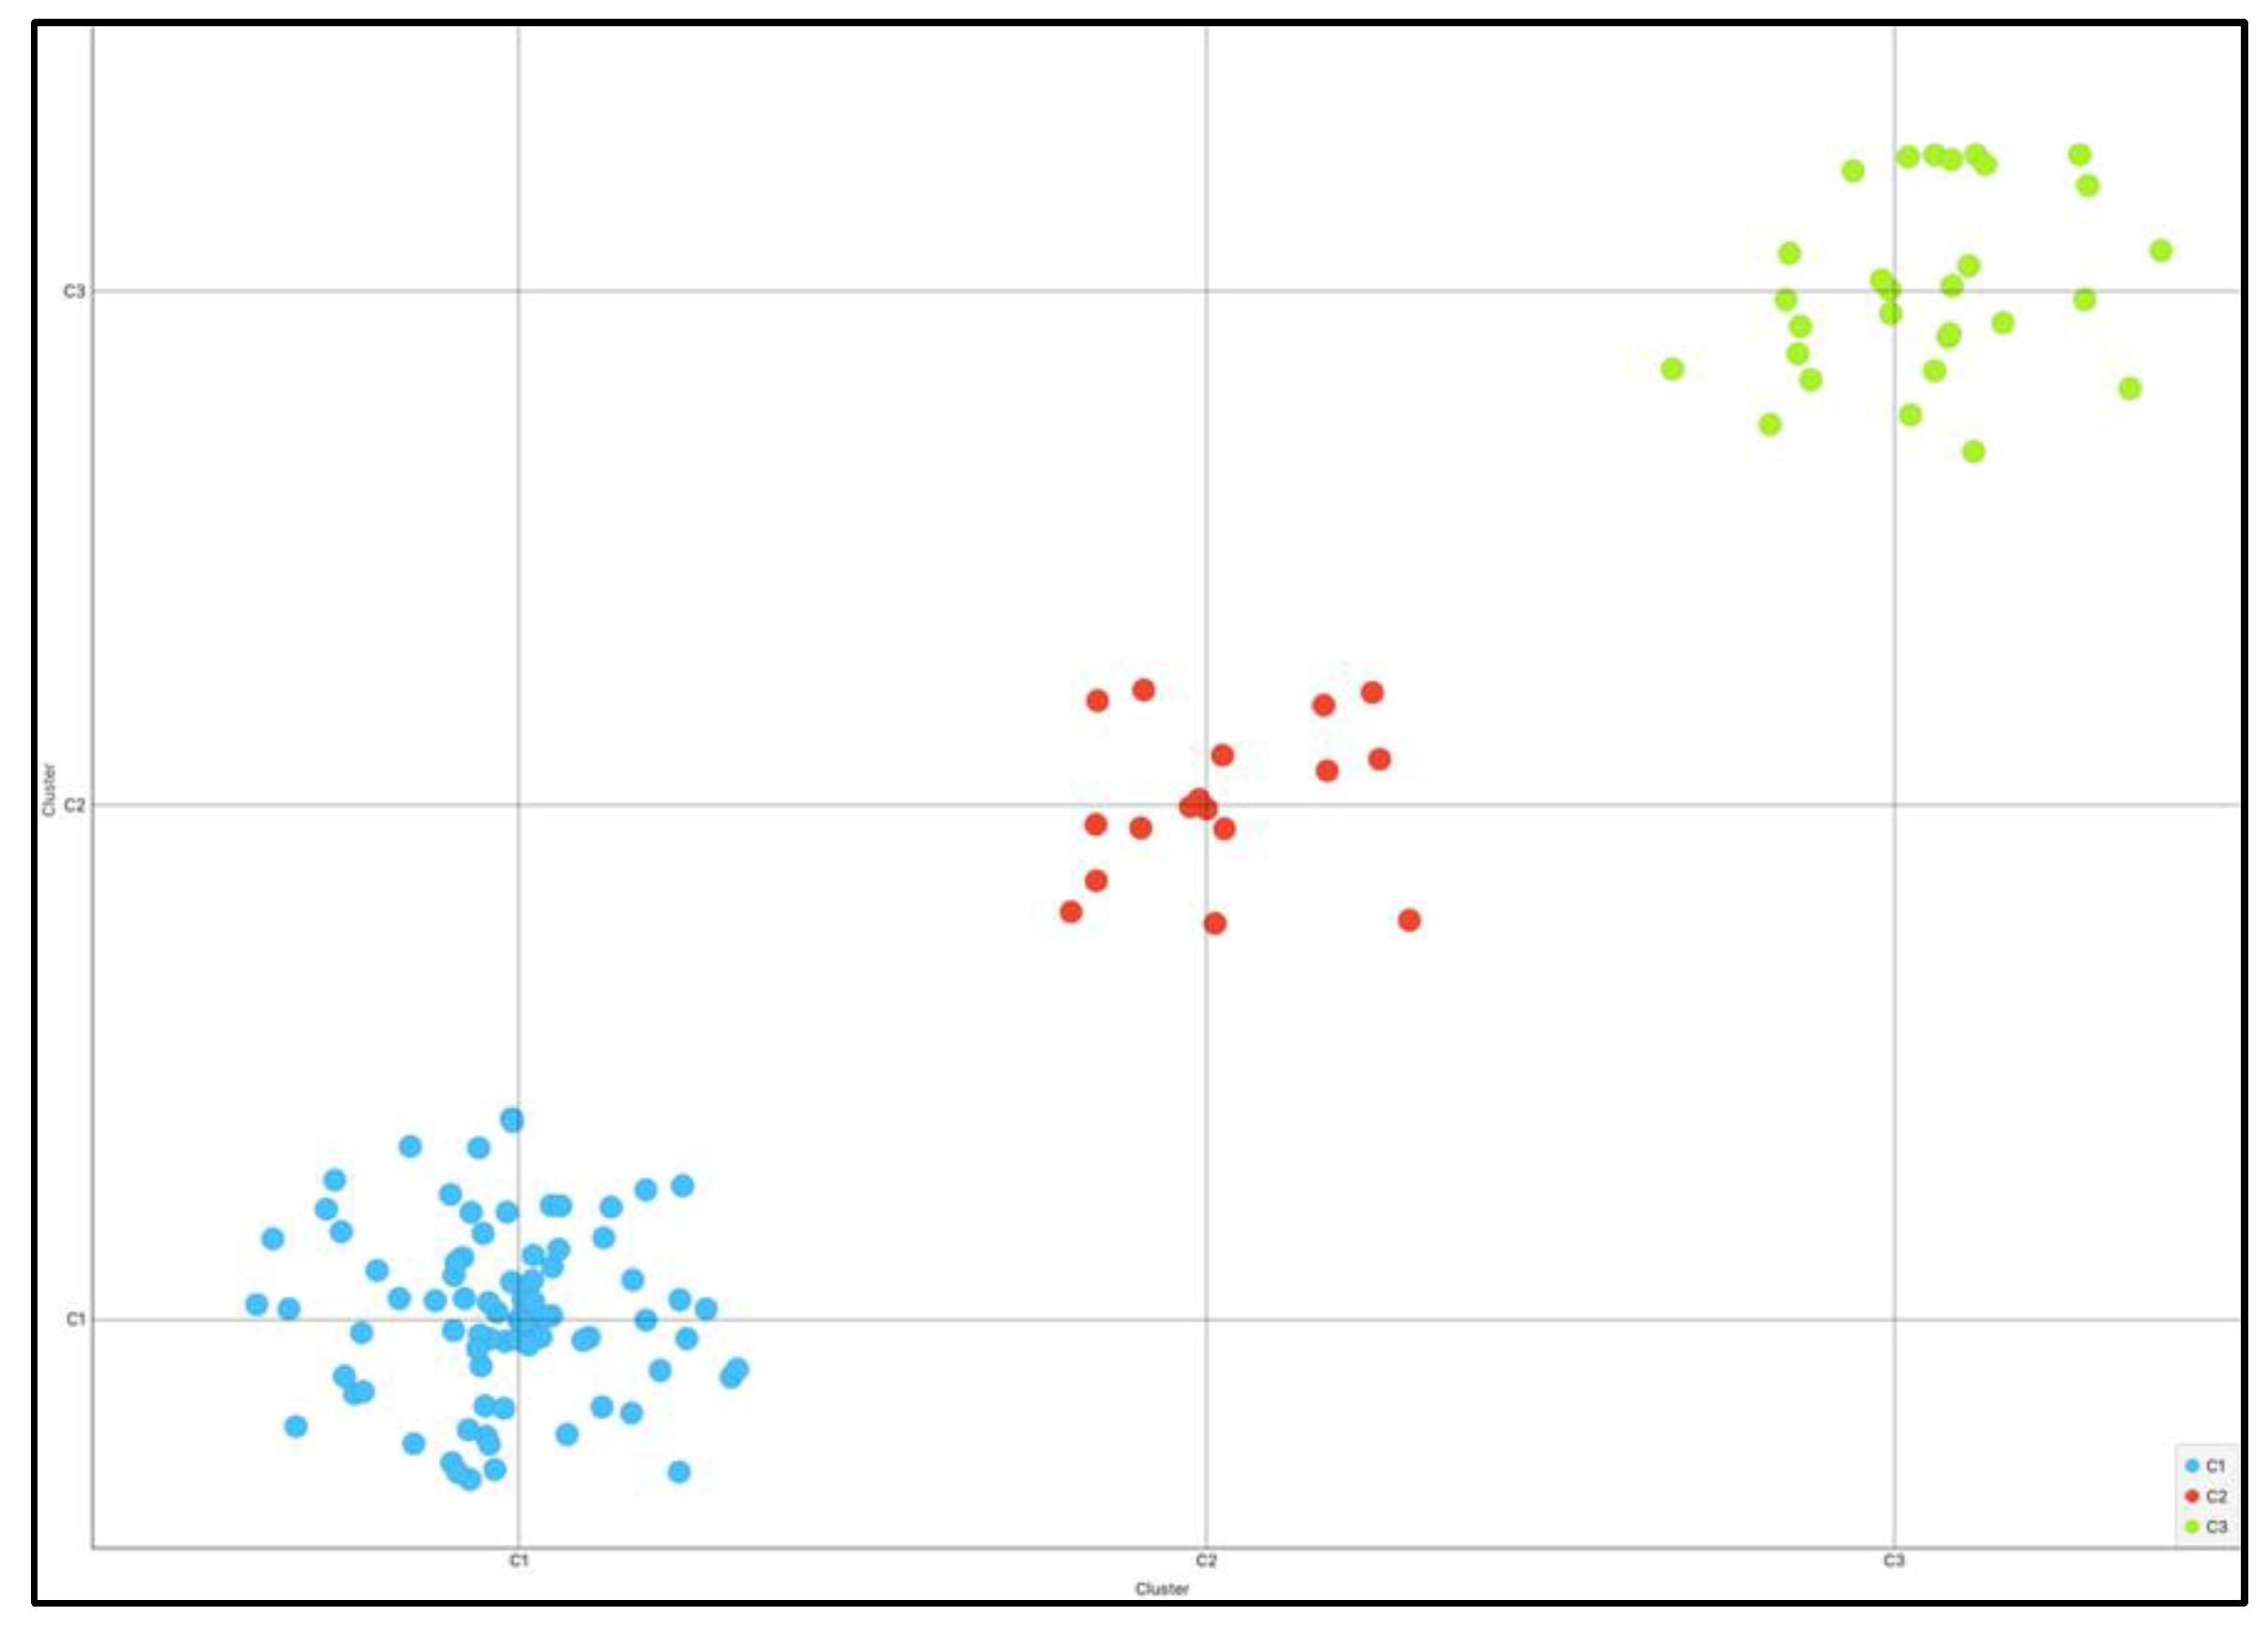
Figure 3.
ANOVA analysis by 3 clusters.
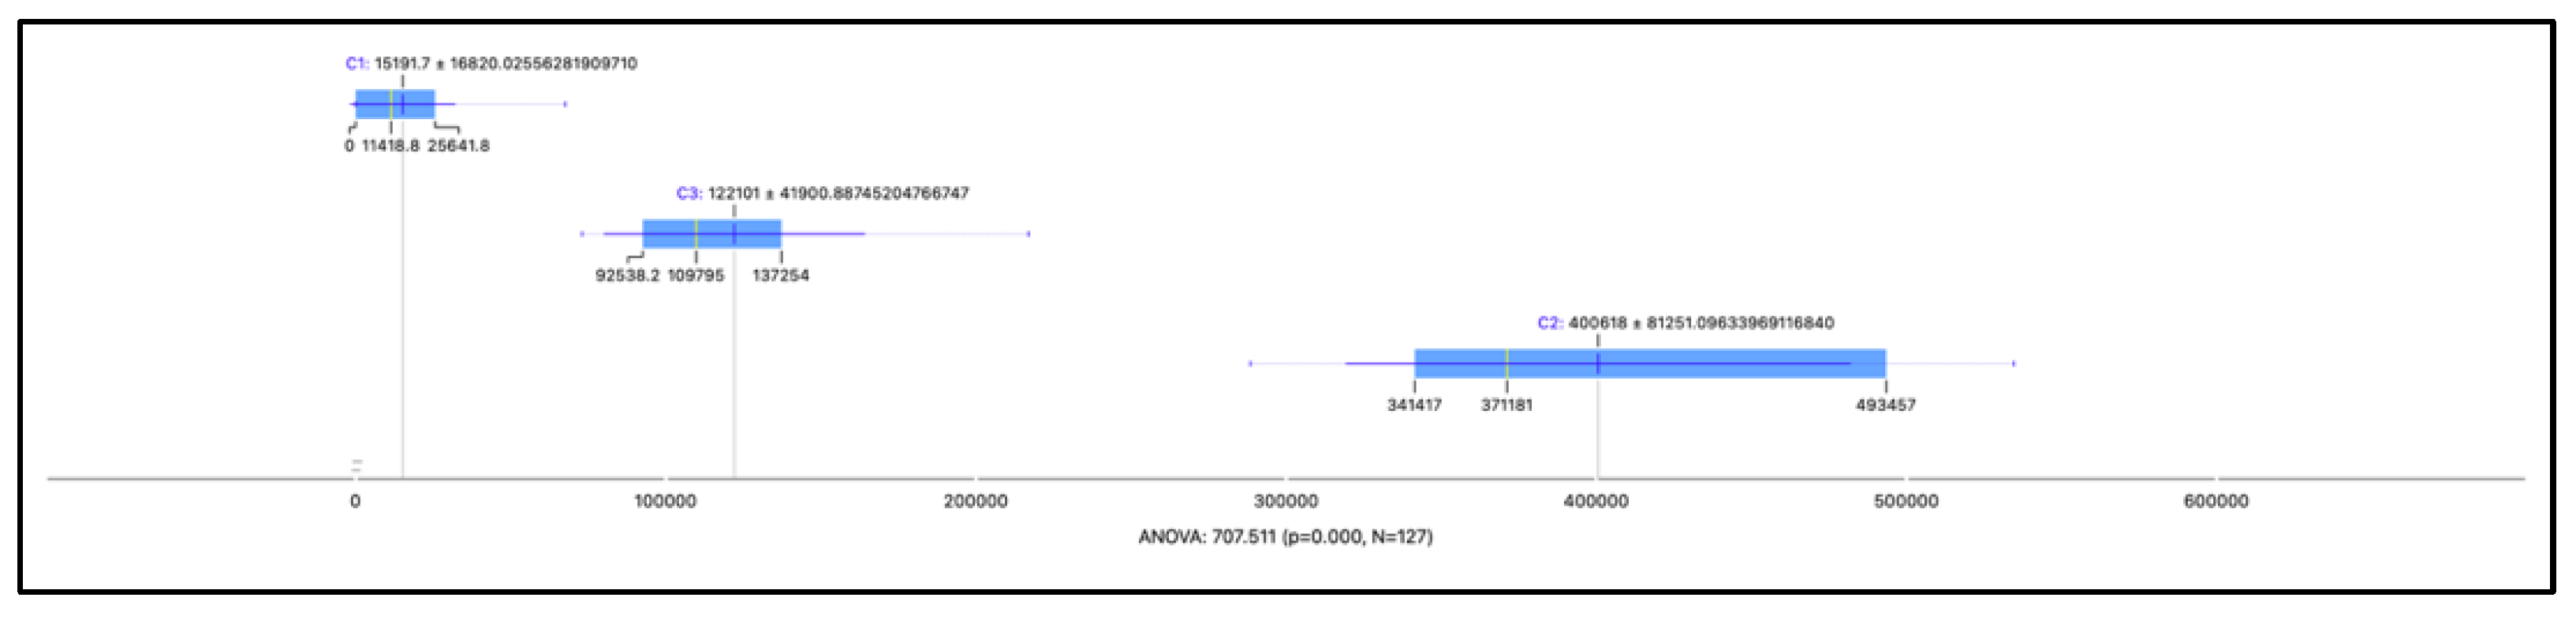
Figure 4.
Confusion Matrix.
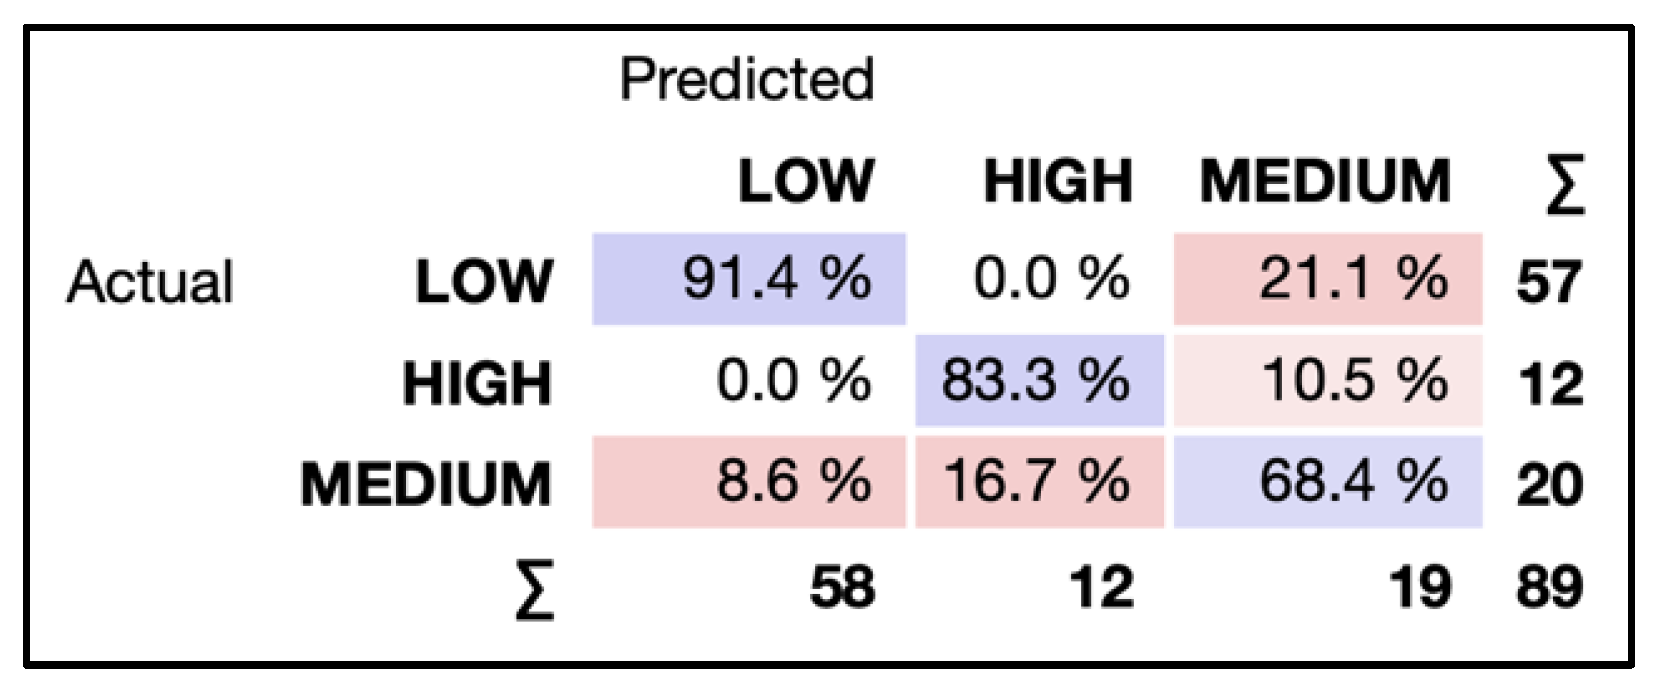
Figure 5.
ROC curves for the three classes (Low, Medium, and High mobility).

Figure 6.
Features Importance.
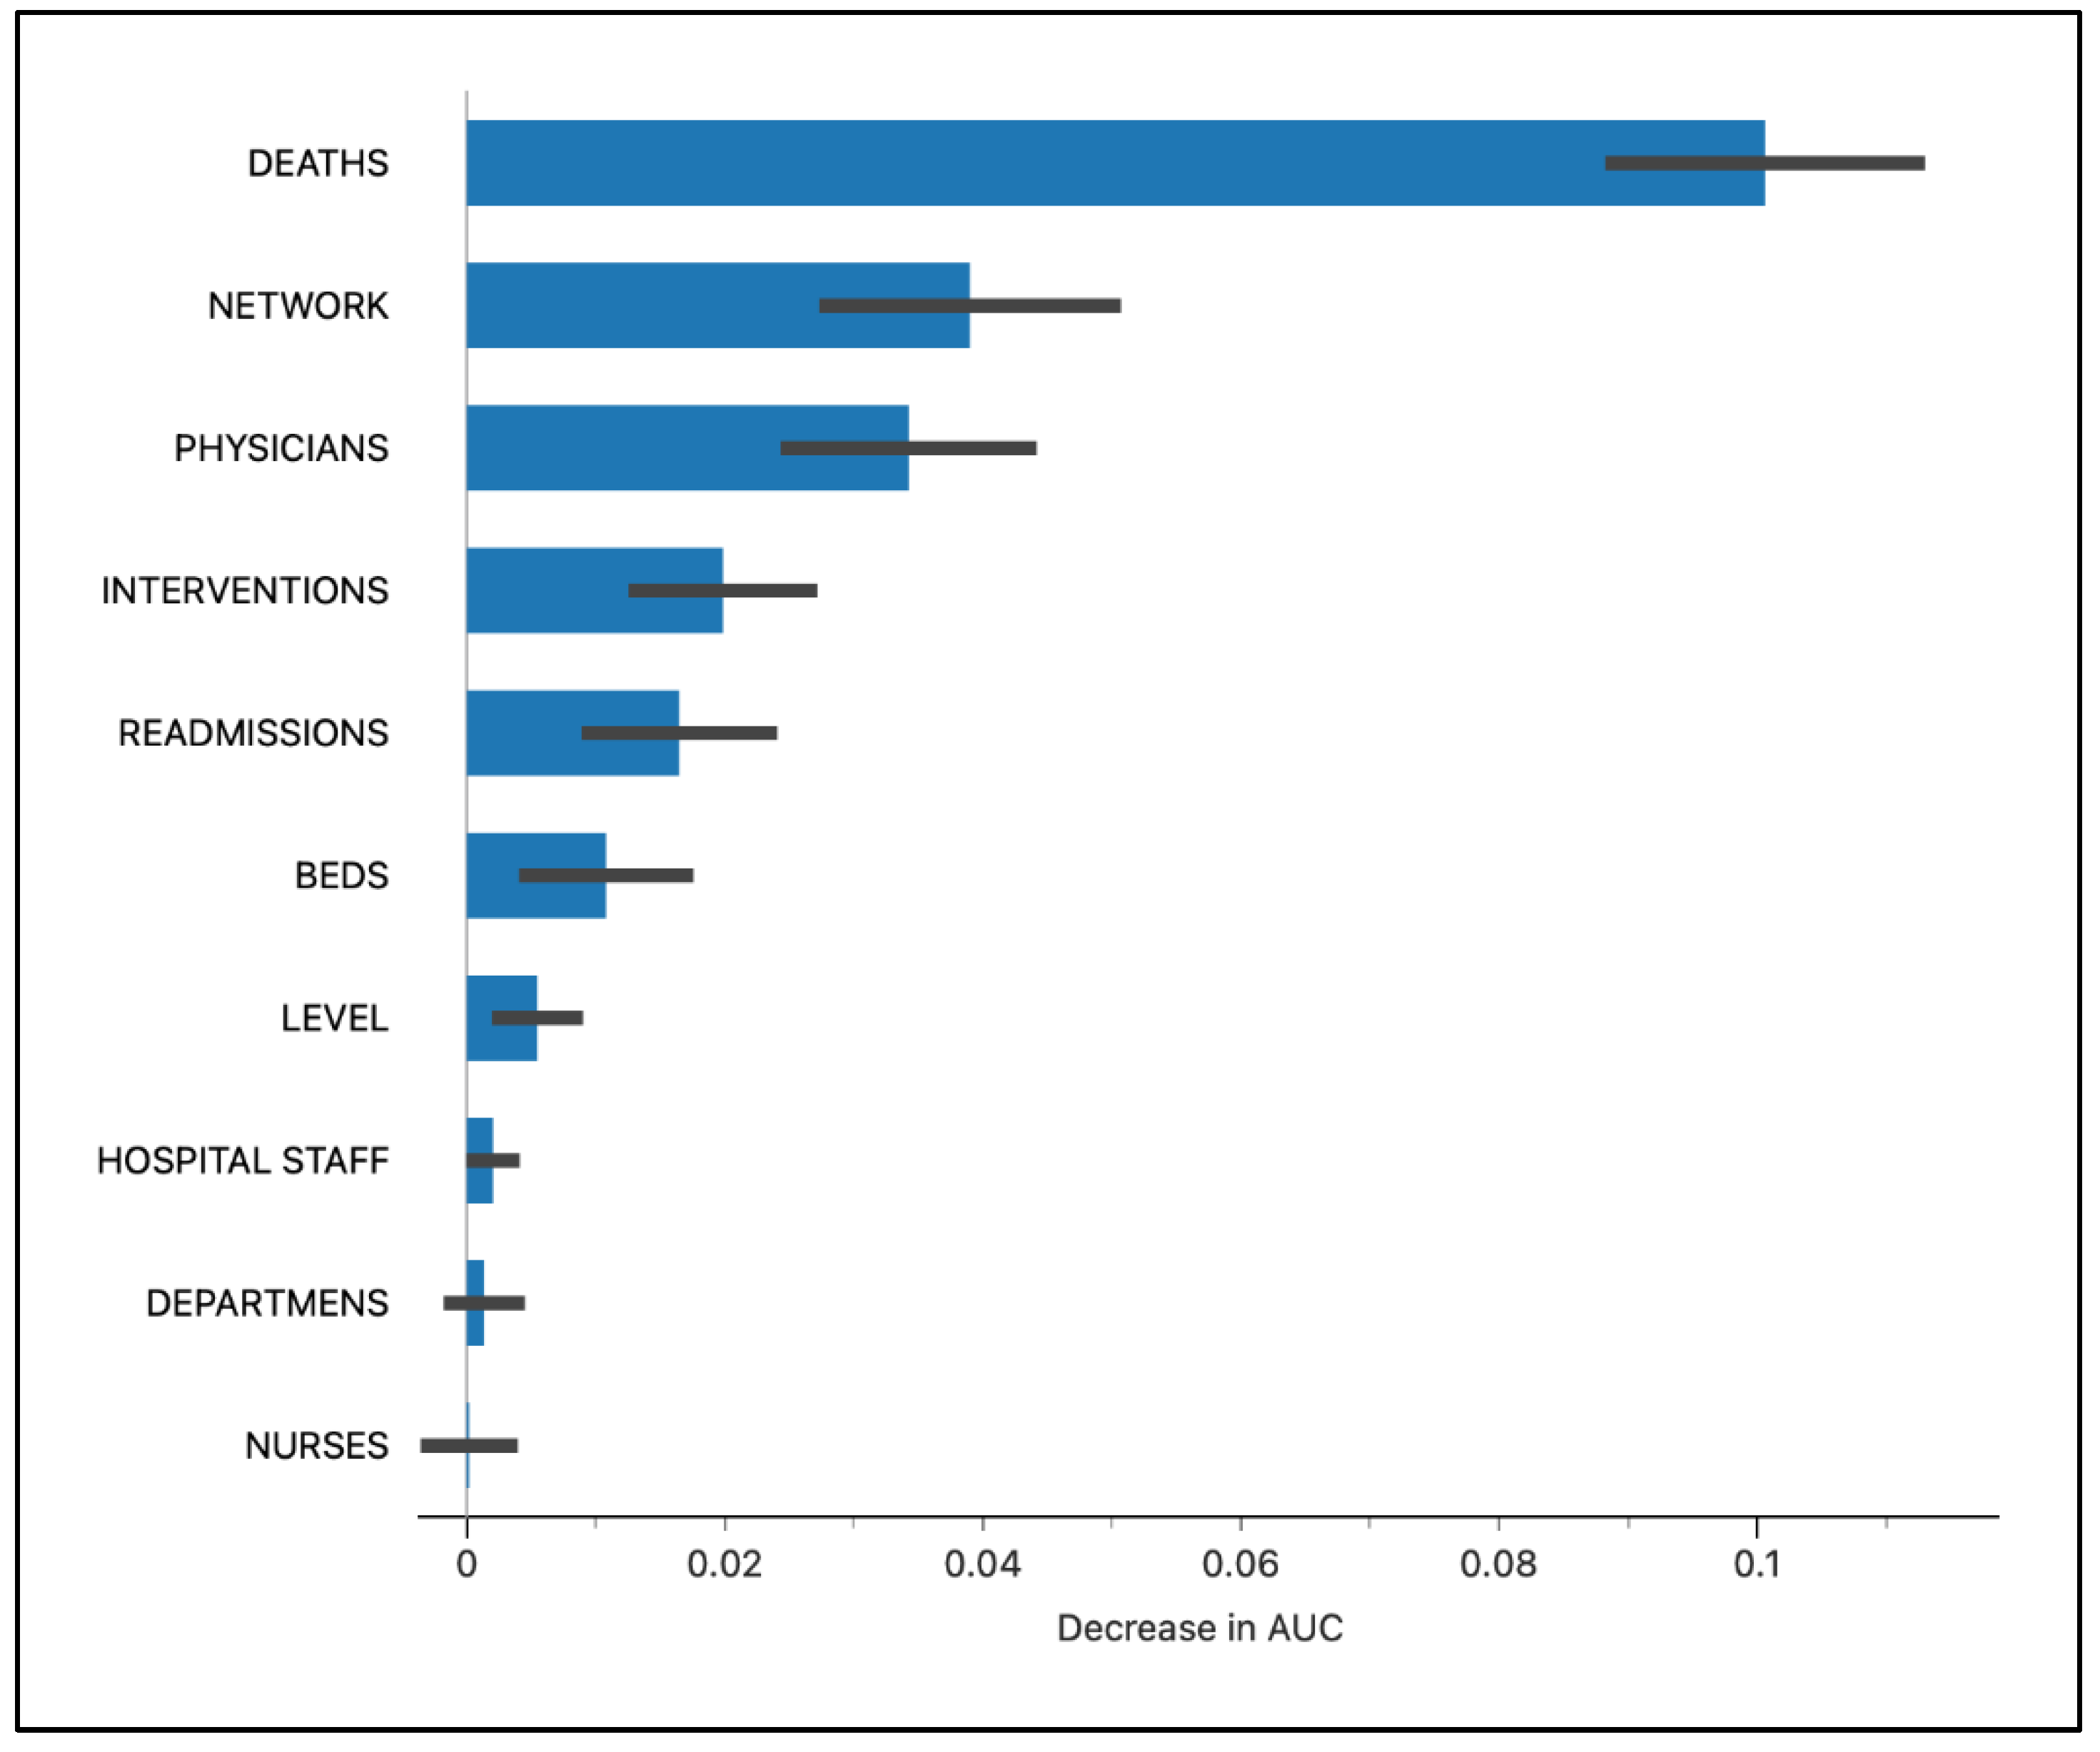
Figure 7.
SHAP analysis for predicting mobility class.
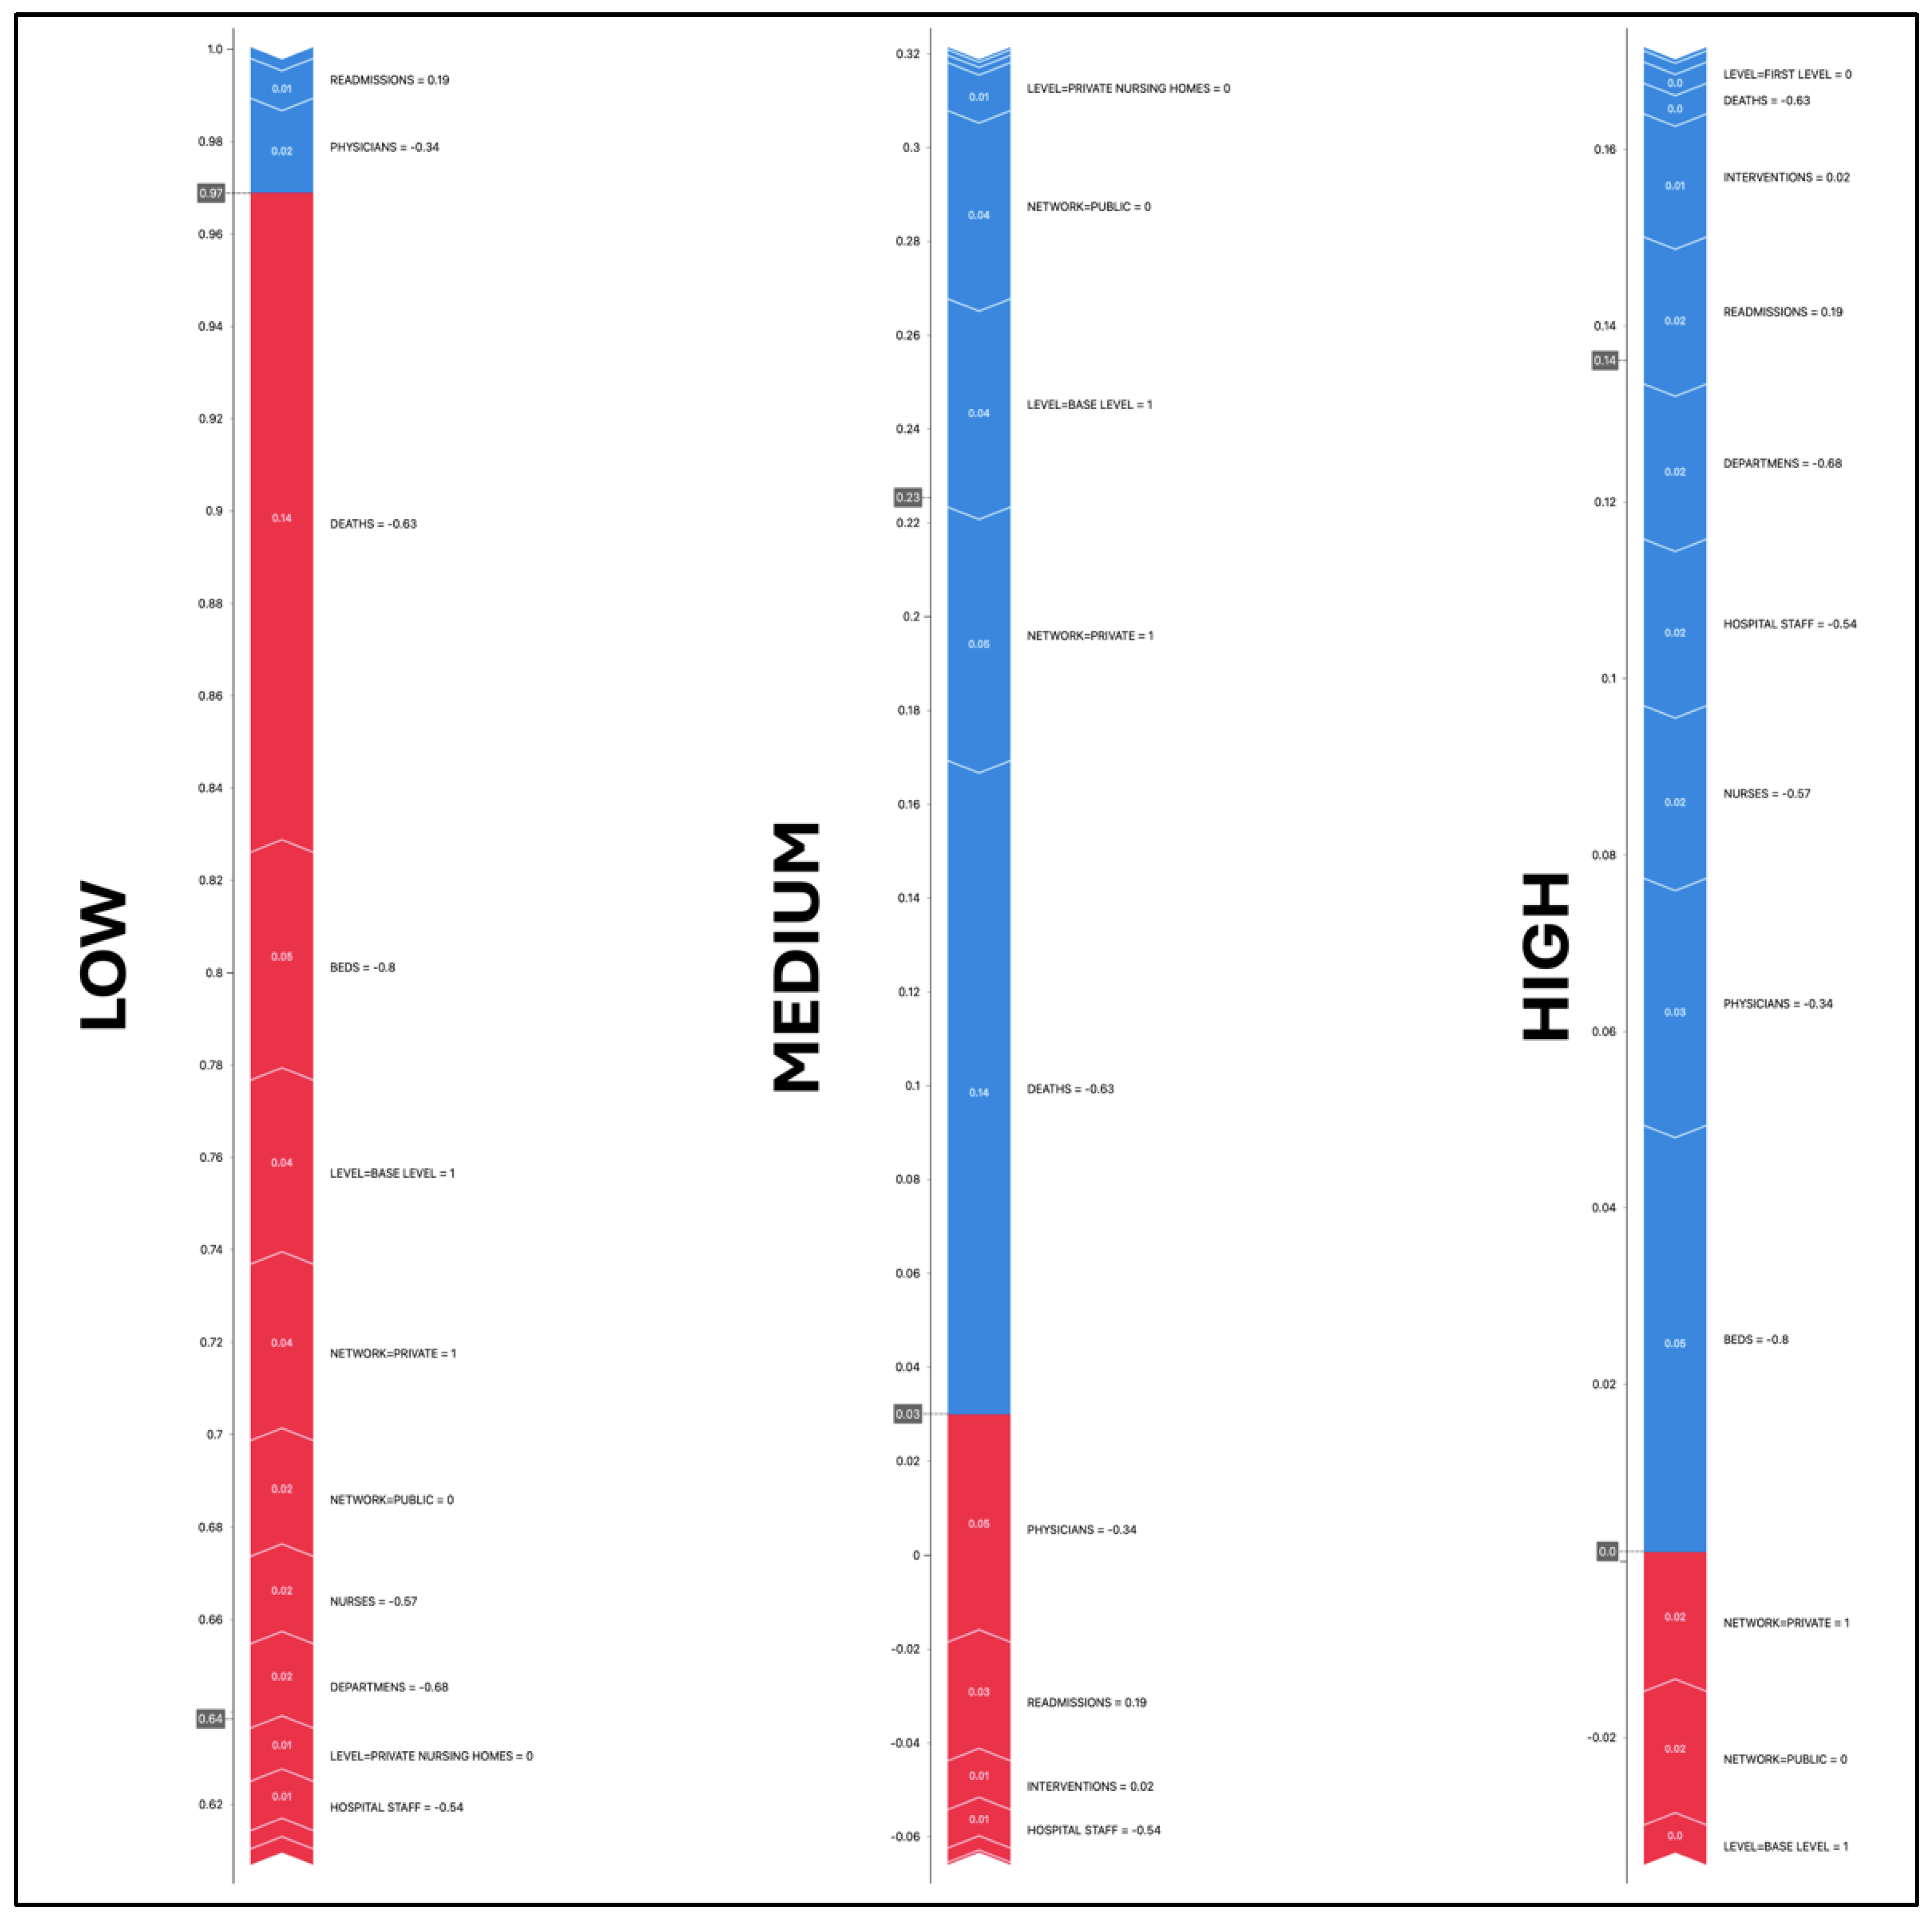
Figure 8.
SHAP Violin plot for target class LOW.
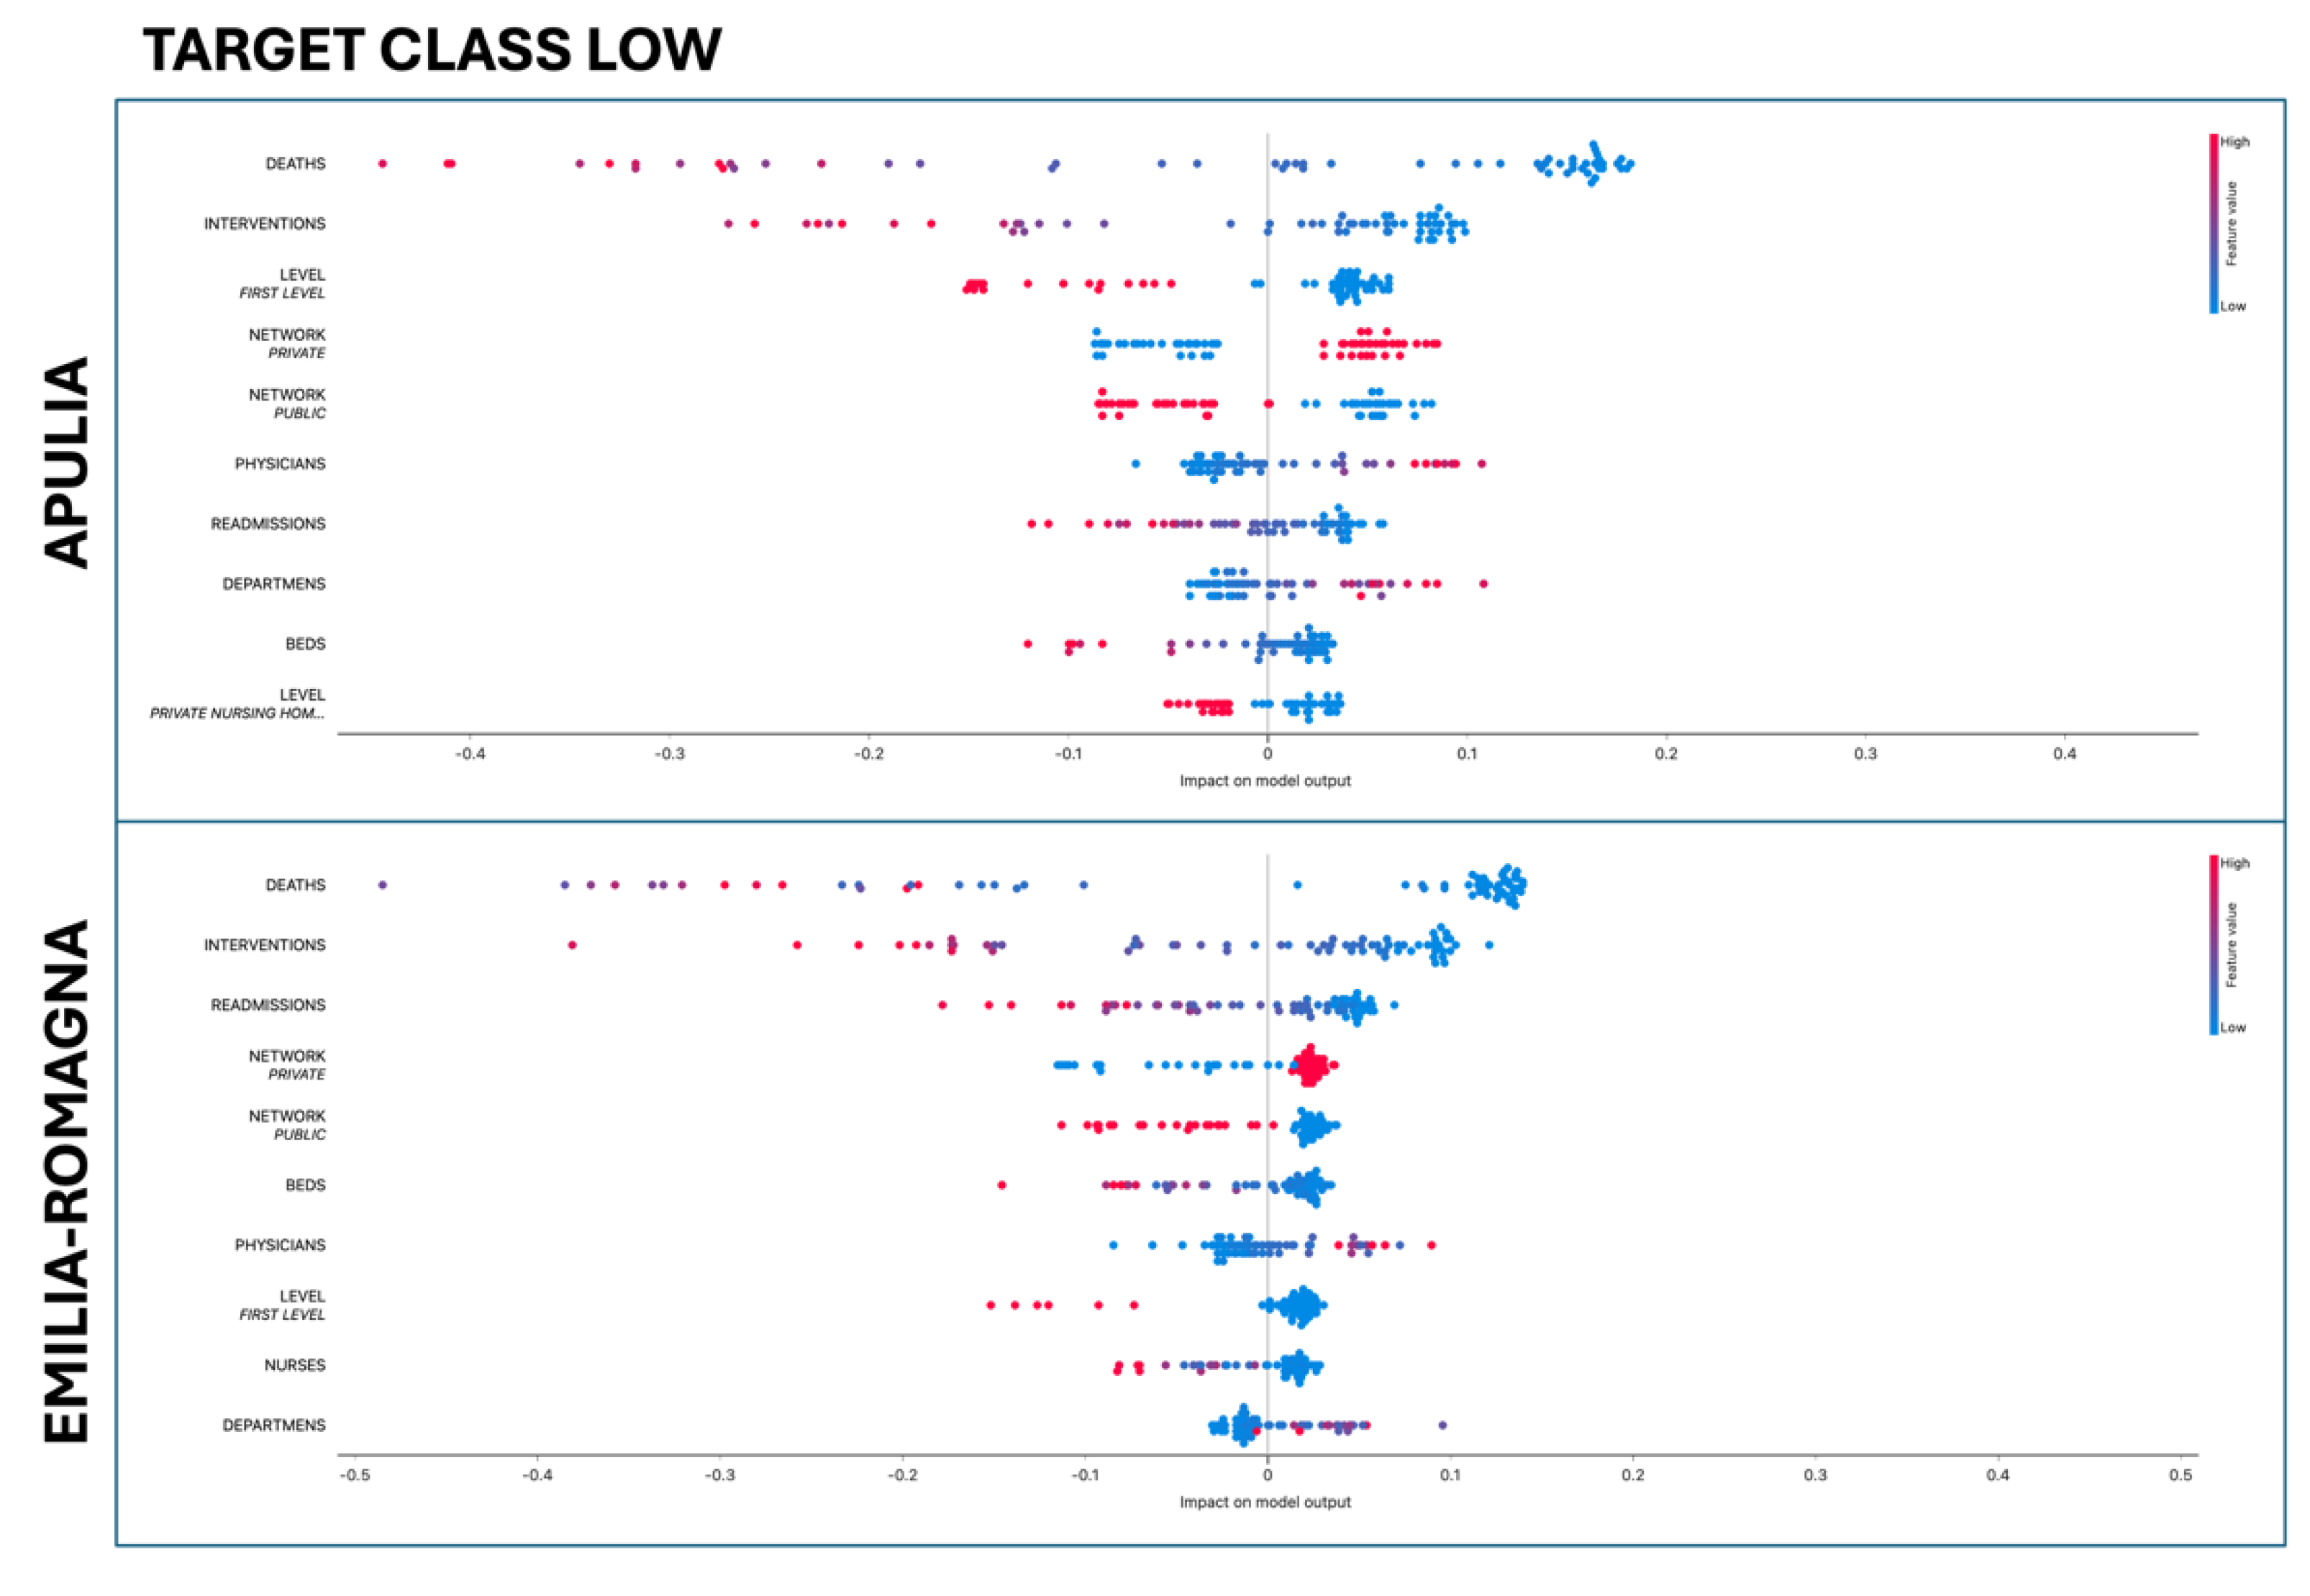
Figure 9.
SHAP Violin plot for target class MEDIUM.
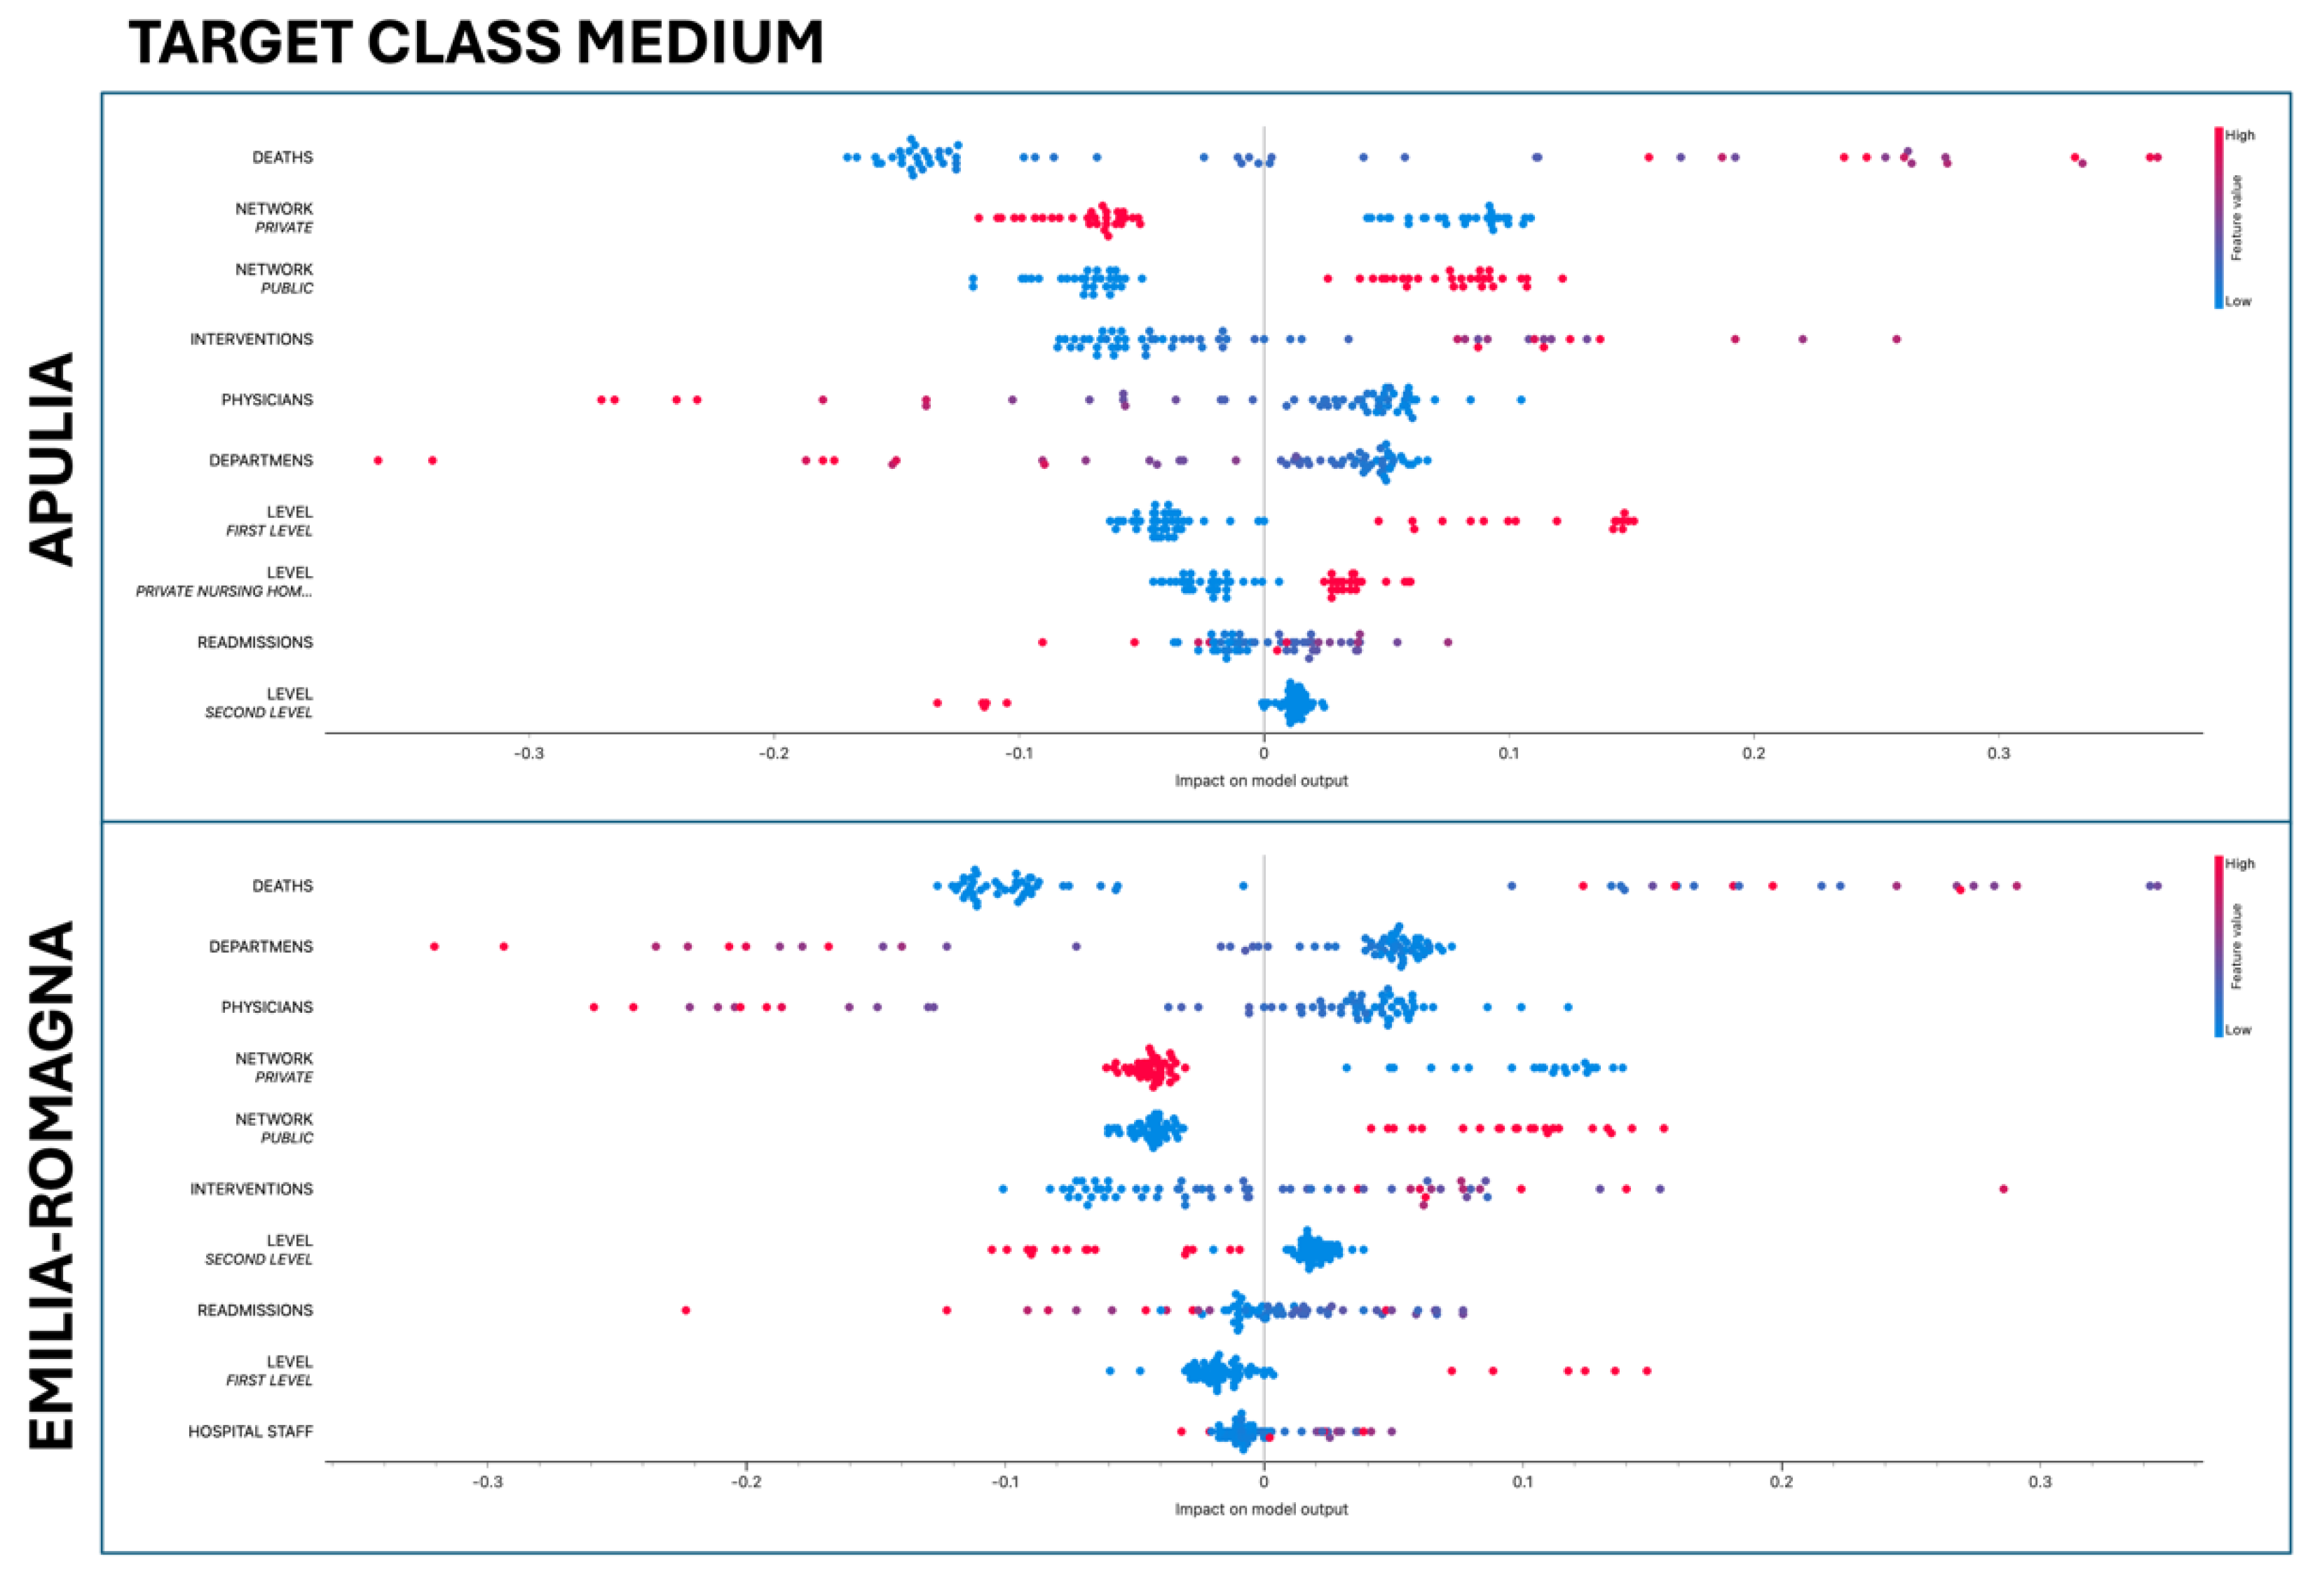
Figure 10.
SHAP Violin plot for target class HIGH.


Table 1.
Contingency Table: Relationship between Hospital Network Nature and Hospital Level in the Apulia and Emilia Romagna Region.
Table 1.
Contingency Table: Relationship between Hospital Network Nature and Hospital Level in the Apulia and Emilia Romagna Region.
| Level | ||||||||
|---|---|---|---|---|---|---|---|---|
| Region | Network | Base Level | First Level | Irccs | Private Nursing Homes | Second Level | Total | |
| Apulia | Private | N. | 0 | 4 | 2 | 24 | 0 | 30 |
| % | 0.0 | 6.8 | 3.4 | 40.7 | 0.0 | 50.8 | ||
| Public | N. | 9 | 13 | 2 | 0 | 5 | 29 | |
| % | 15.3 | 22.0 | 3.4 | 0.0 | 8.5 | 49.2 | ||
| Total | N. | 9 | 17 | 4 | 24 | 5 | 59 | |
| % | 15.3 | 28.8 | 6.8 | 40.7 | 8.5 | 100 | ||
| Emilia Romagna | Private | N. | 27 | 0 | 1 | 15 | 3 | 46 |
| % | 39.7 | 0.0 | 1.5 | 22.1 | 4.4 | 67.6 | ||
| Public | N. | 1 | 6 | 3 | 0 | 12 | 22 | |
| % | 1.5 | 8.8 | 4.4 | 0.0 | 17.6 | 32.4 | ||
| Total | N. | 28 | 6 | 4 | 15 | 15 | 68 | |
| % | 41.2 | 8.8 | 5.9 | 22.1 | 22.1 | 100 | ||
| Total | Private | N. | 27 | 4 | 3 | 39 | 3 | 76 |
| % | 21.3 | 3.1 | 2.4 | 30.7 | 2.4 | 59.8 | ||
| Public | N. | 10 | 19 | 5 | 0 | 17 | 51 | |
| % | 7.9 | 15.0 | 3.9 | 0.0 | 13.4 | 40.2 | ||
| Total | N. | 37 | 23 | 8 | 39 | 20 | 127 | |
| % | 29.1 | 18.1 | 6.3 | 30.7 | 15.7 | 100 | ||
Table 2.
χ 2 test.
| Region | Value | df | p | |
|---|---|---|---|---|
| Apulia | χ² | 42.8 | 4 | < .001 |
| N | 59 | |||
| Emilia Romagna | χ² | 49.2 | 4 | < .001 |
| N | 68 | |||
| Total | χ² | 64.5 | 4 | < .001 |
| N | 127 |
Table 3.
Descriptive statistics for 8 numeric features.
| N | Missing | Mean | Median | SD | Minimum | Maximum | |
|---|---|---|---|---|---|---|---|
| BEDS | 127 | 0 | -7.32e−8 | -0.411 | 1.00 | -0.803 | 4.11 |
| DEPARTMENS | 127 | 0 | -1.03e−7 | -0.375 | 1.00 | -0.681 | 5.21 |
| HOSPITAL STAFF | 127 | 0 | -2.60e−8 | -0.394 | 1.00 | -0.672 | 4.39 |
| DEATHS | 127 | 0 | 1.12e-7 | -0.509 | 1.00 | -0.627 | 4.41 |
| INTERVENTIONS | 127 | 0 | -2.54e−7 | -0.375 | 1.00 | -0.779 | 4.07 |
| READMISSIONS | 127 | 0 | -2.42e−7 | -0.312 | 1.00 | -0.843 | 3.96 |
| NURSES | 127 | 0 | -4.80e−8 | -0.453 | 1.00 | -0.629 | 4.40 |
| PHYSICIANS | 127 | 0 | 9.45e-8 | -0.376 | 1.00 | -0.776 | 3.86 |
Table 4.
Frequencies of target variable Mobility Level.
| MOBILITY_LEVEL | Counts | % of Total | Cumulative % |
|---|---|---|---|
| HIGH | 17 | 13.4 % | 13.4 % |
| LOW | 81 | 63.8 % | 77.2 % |
| MEDIUM | 29 | 22.8 % | 100.0 % |
Table 5.
Features Importance Scores.
| FEATURE | MEAN | STD |
|---|---|---|
| DEATHS | 0.10063 | 0.0123775 |
| NETWORK | 0.0390019 | 0.0116953 |
| PHYSICIANS | 0.0342539 | 0.00990863 |
| INTERVENTIONS | 0.0198643 | 0.00732855 |
| READMISSIONS | 0.0164729 | 0.00758821 |
| BEDS | 0.0108043 | 0.00675972 |
| LEVEL | 0.00547481 | 0.00353914 |
| HOSPITAL STAFF | 0.00203488 | 0.00207034 |
| DEPARTMENS | 0.00135659 | 0.00315332 |
| NURSES | 0.00523256 | 0.00420033 |
Table 6.
Impact Scores for Target Class LOW.
| FEATURES IN ORDER BY RELEVANCE | APULIA (I) | EMILIA-ROMAGNA (I) | STUDENT’S T (P-VALUE) |
|---|---|---|---|
| LEVEL = BASE LEVEL | -0.0133272 | 0.00511418 | 0.006 |
| NETWORK = PRIVATE | -0.0136174 | 0.012132 | 0.017 |
| LEVEL = FIRST LEVEL | -0.00813901 | 0.0030237 | 0.020 |
| LEVEL = PRIVATE NURSING HOME | -0.00191983 | 0.00888514 | 0.013 |
| NETWORK = PUBLIC | -0.0148221 | 0.0113703 | 0.018 |
| READMISSION | -0.163328 | 0.0129196 | 0.049 |
Table 7.
Impact Scores for Target Class MEDIUM.
| FEATURES IN ORDER BY RELEVANCE | APULIA (I) | EMILIA-ROMAGNA (I) | STUDENT’S T (P-VALUE) |
|---|---|---|---|
| LEVEL = BASE LEVEL | 0.0126471 | -0.00541074 | 0.011 |
| HOSPITAL STAFF | 0.0113689 | -0.00378169 | 0.016 |
| NURSES | 0.00617414 | -0.00257164 | 0.030 |
Table 8.
Impact Scores for Target Class HIGH.
| FEATURES IN ORDER BY RELEVANCE | APULIA (I) | EMILIA-ROMAGNA (I) | STUDENT’S T (P-VALUE) |
|---|---|---|---|
| DEATHS | 0.00669119 | -0.00202985 | 0.004 |
| HOSPITAL STAFF | -0.0100554 | 0.00594934 | 0.038 |
Disclaimer/Publisher’s Note: The statements, opinions and data contained in all publications are solely those of the individual author(s) and contributor(s) and not of MDPI and/or the editor(s). MDPI and/or the editor(s) disclaim responsibility for any injury to people or property resulting from any ideas, methods, instructions or products referred to in the content. |
© 2024 by the authors. Licensee MDPI, Basel, Switzerland. This article is an open access article distributed under the terms and conditions of the Creative Commons Attribution (CC BY) license (http://creativecommons.org/licenses/by/4.0/).
Copyright: This open access article is published under a Creative Commons CC BY 4.0 license, which permit the free download, distribution, and reuse, provided that the author and preprint are cited in any reuse.


