Submitted:
26 March 2024
Posted:
27 March 2024
You are already at the latest version
Abstract
Keywords:
1. Introduction
2. Experimental Section
2.1. Materials
2.2. Synthesis of Novolac PF Resin and Bio-Based Novolac PF Resin
2.3. Thermal Analysis
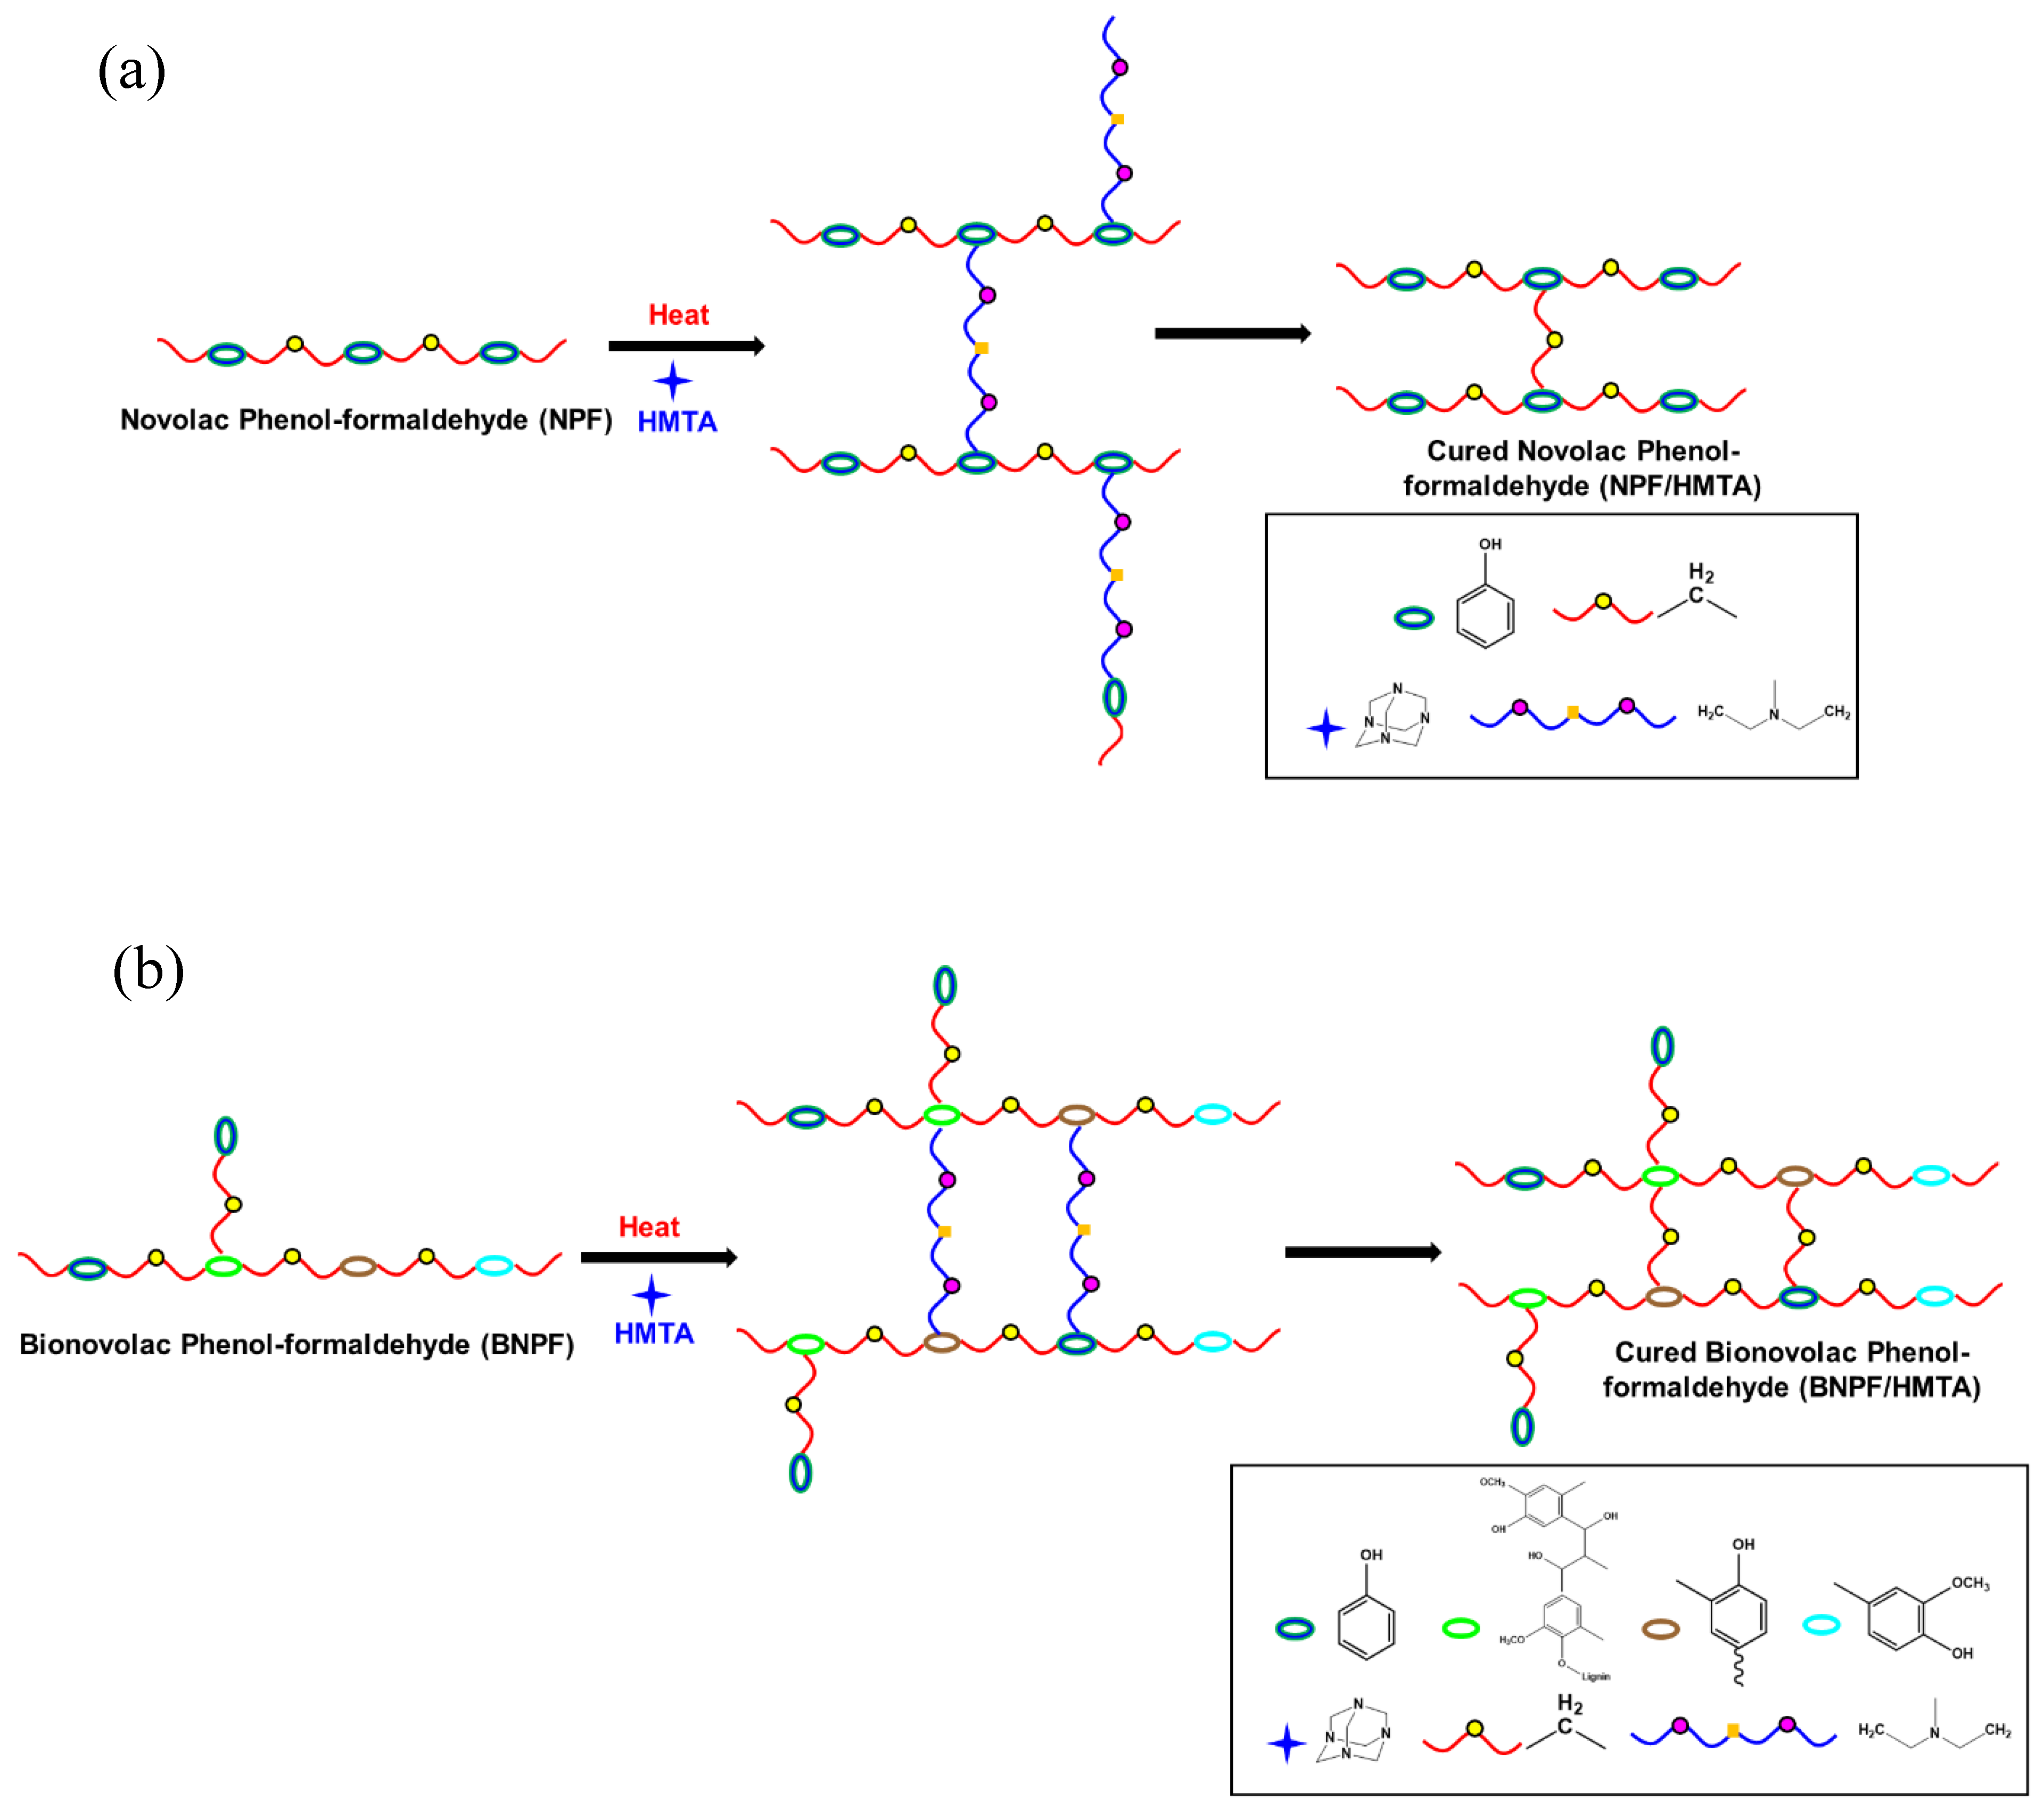
2.4. Fundamental Theory of Curing Kinetics
2.5. Model-Free Isoconversional Method
2.6. Model-Fitting Method
3. Results and Discussion
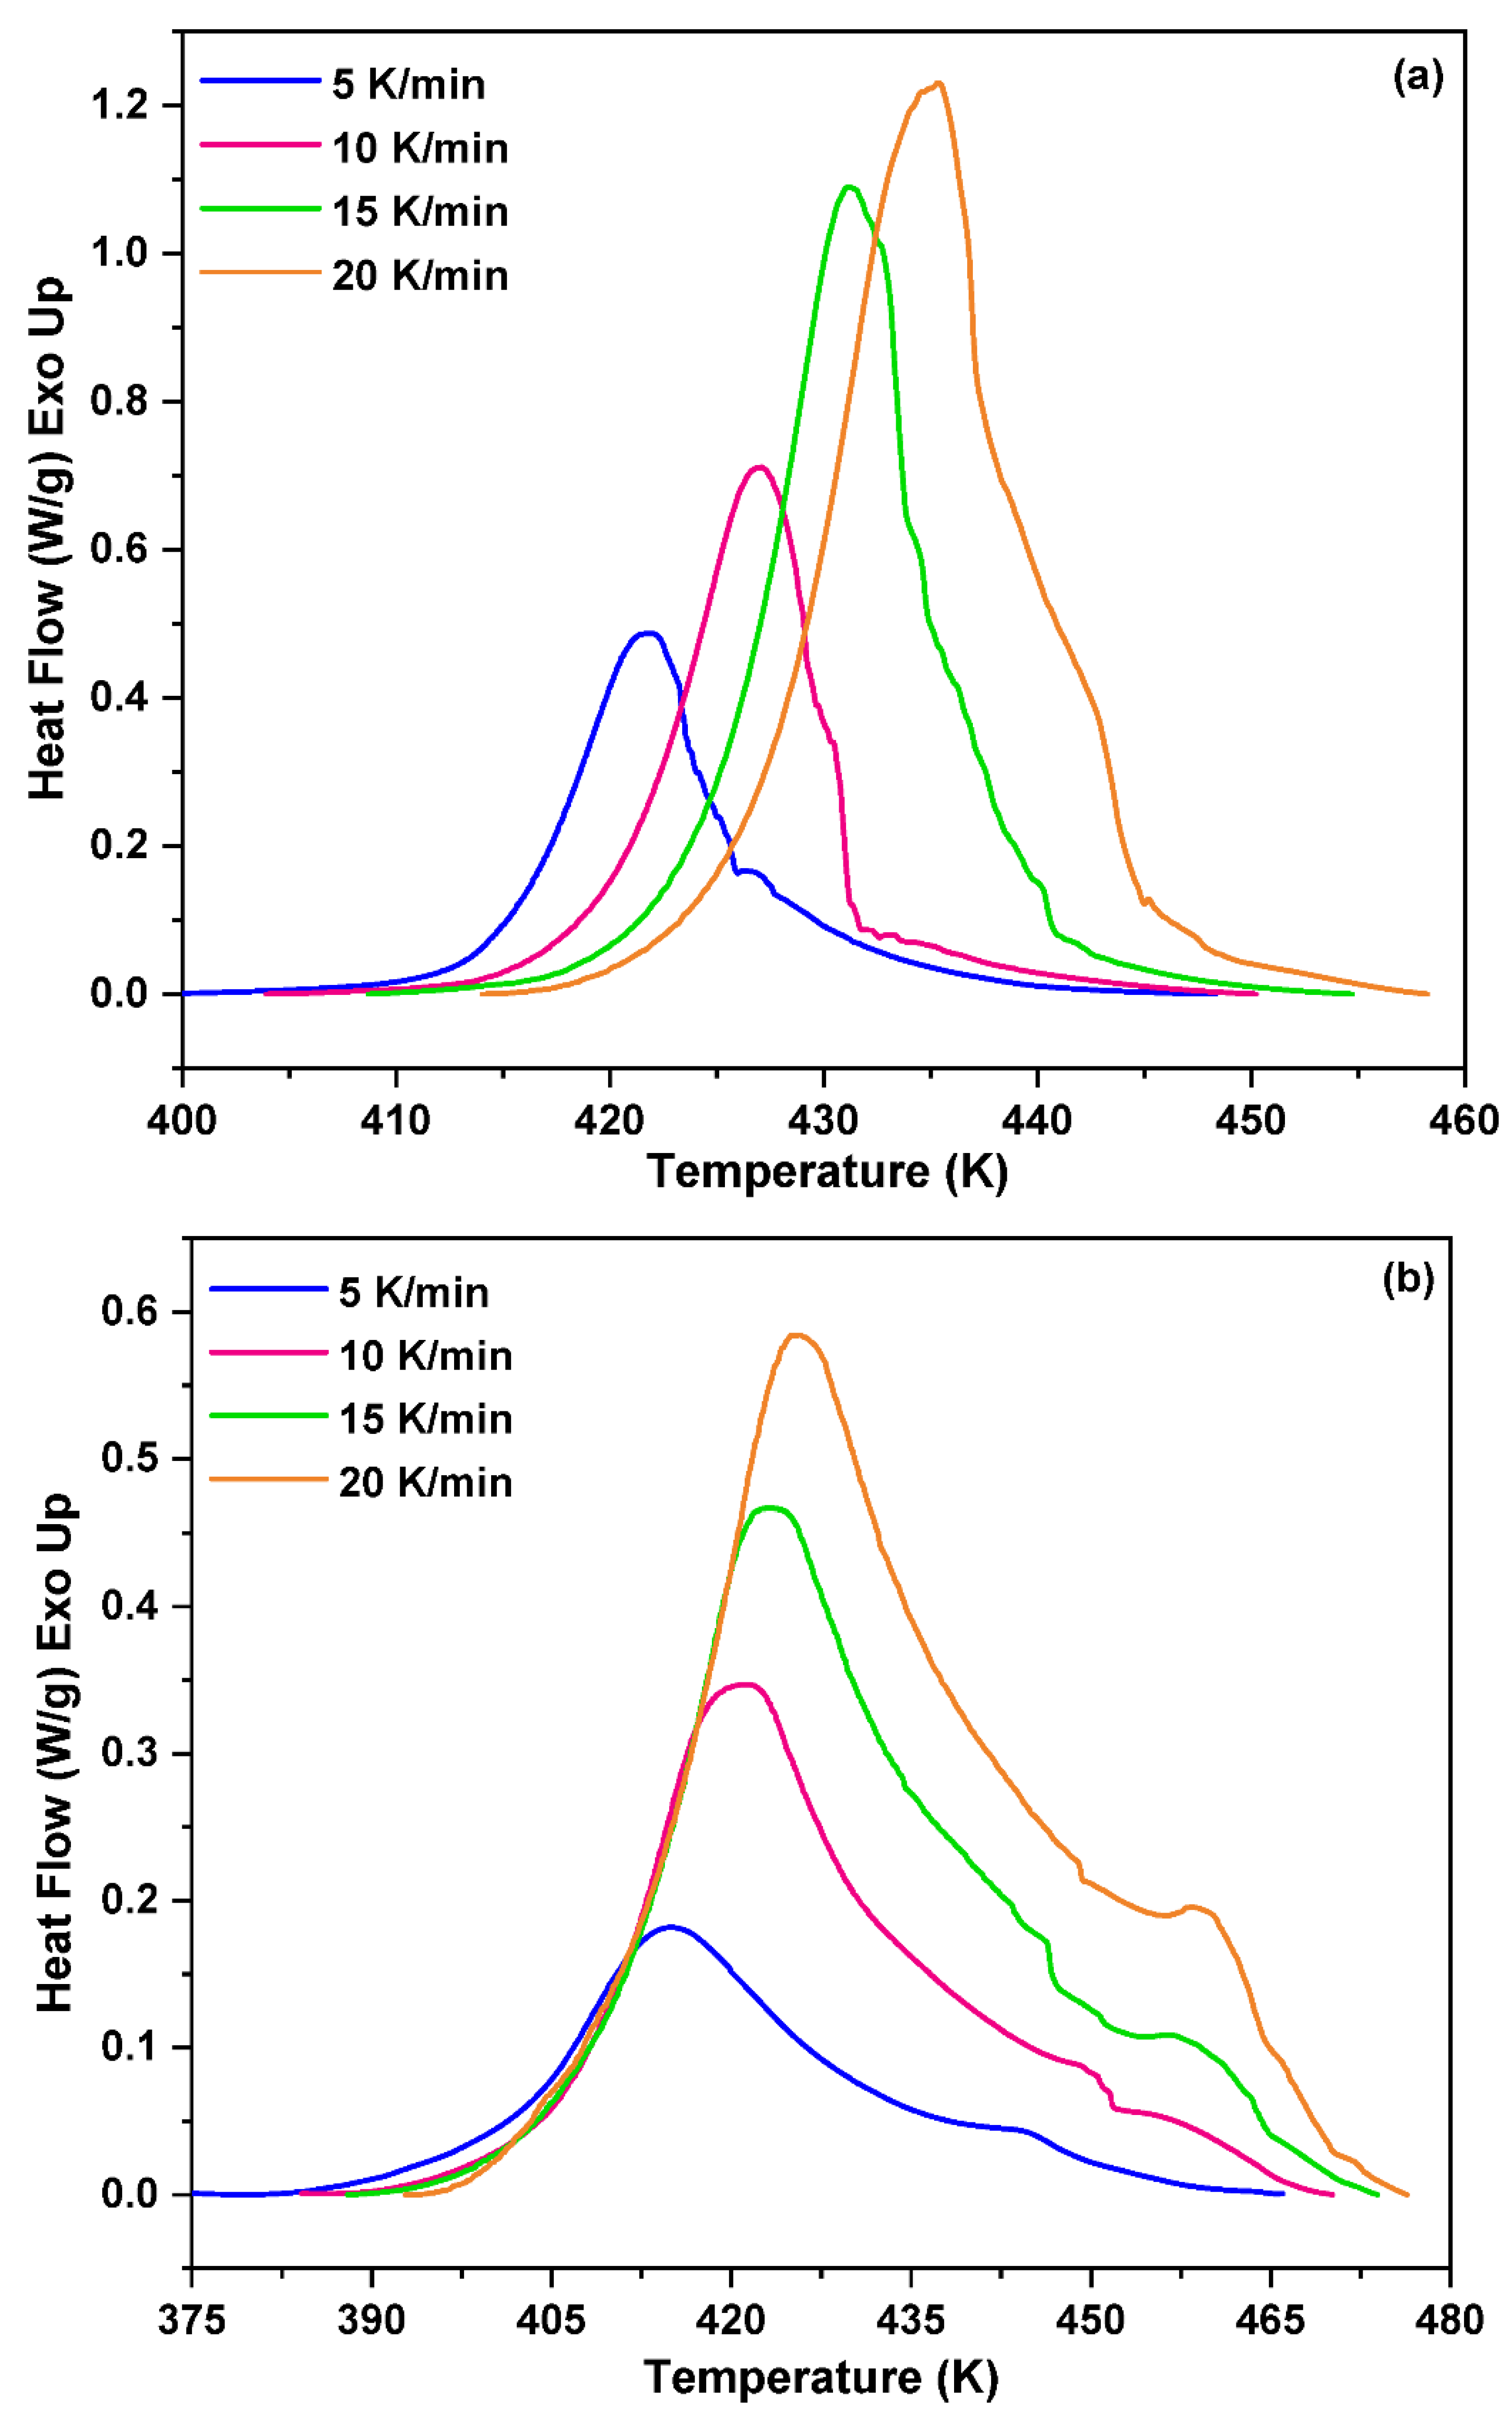
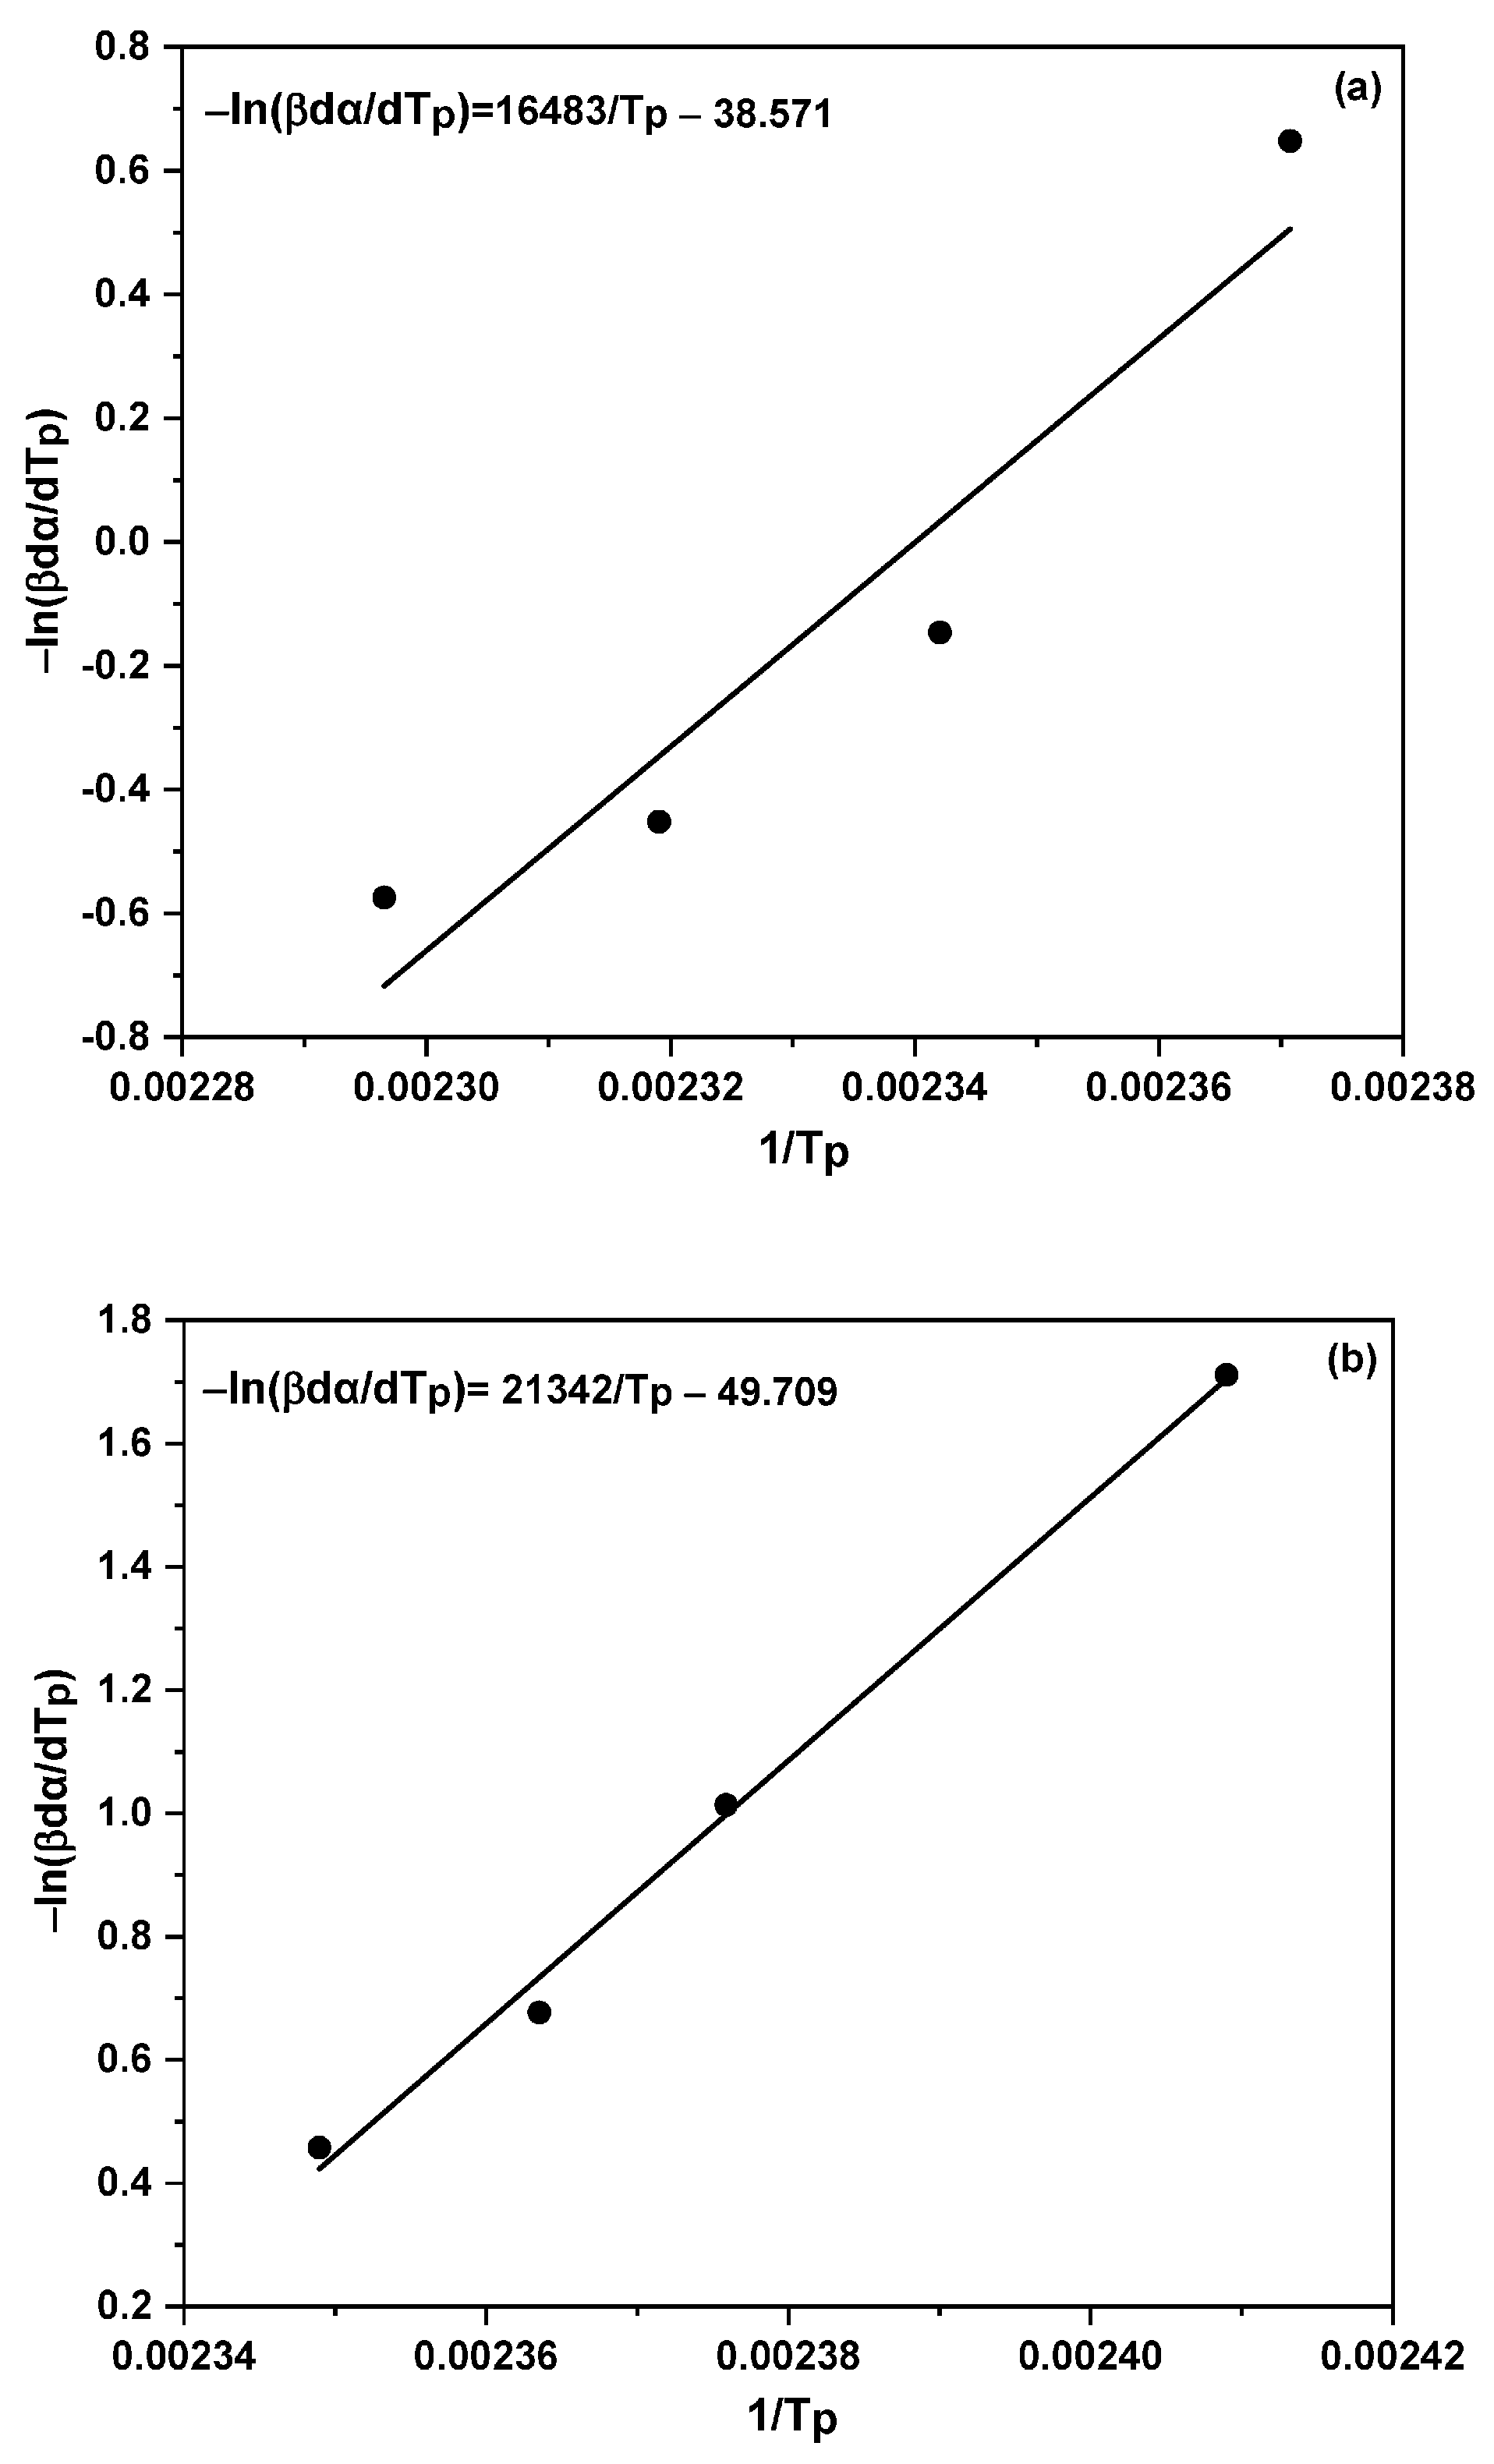
3.1. Non-Isothermal DSC Analysis of NPF/HMTA and BNPF/HMTA Resins
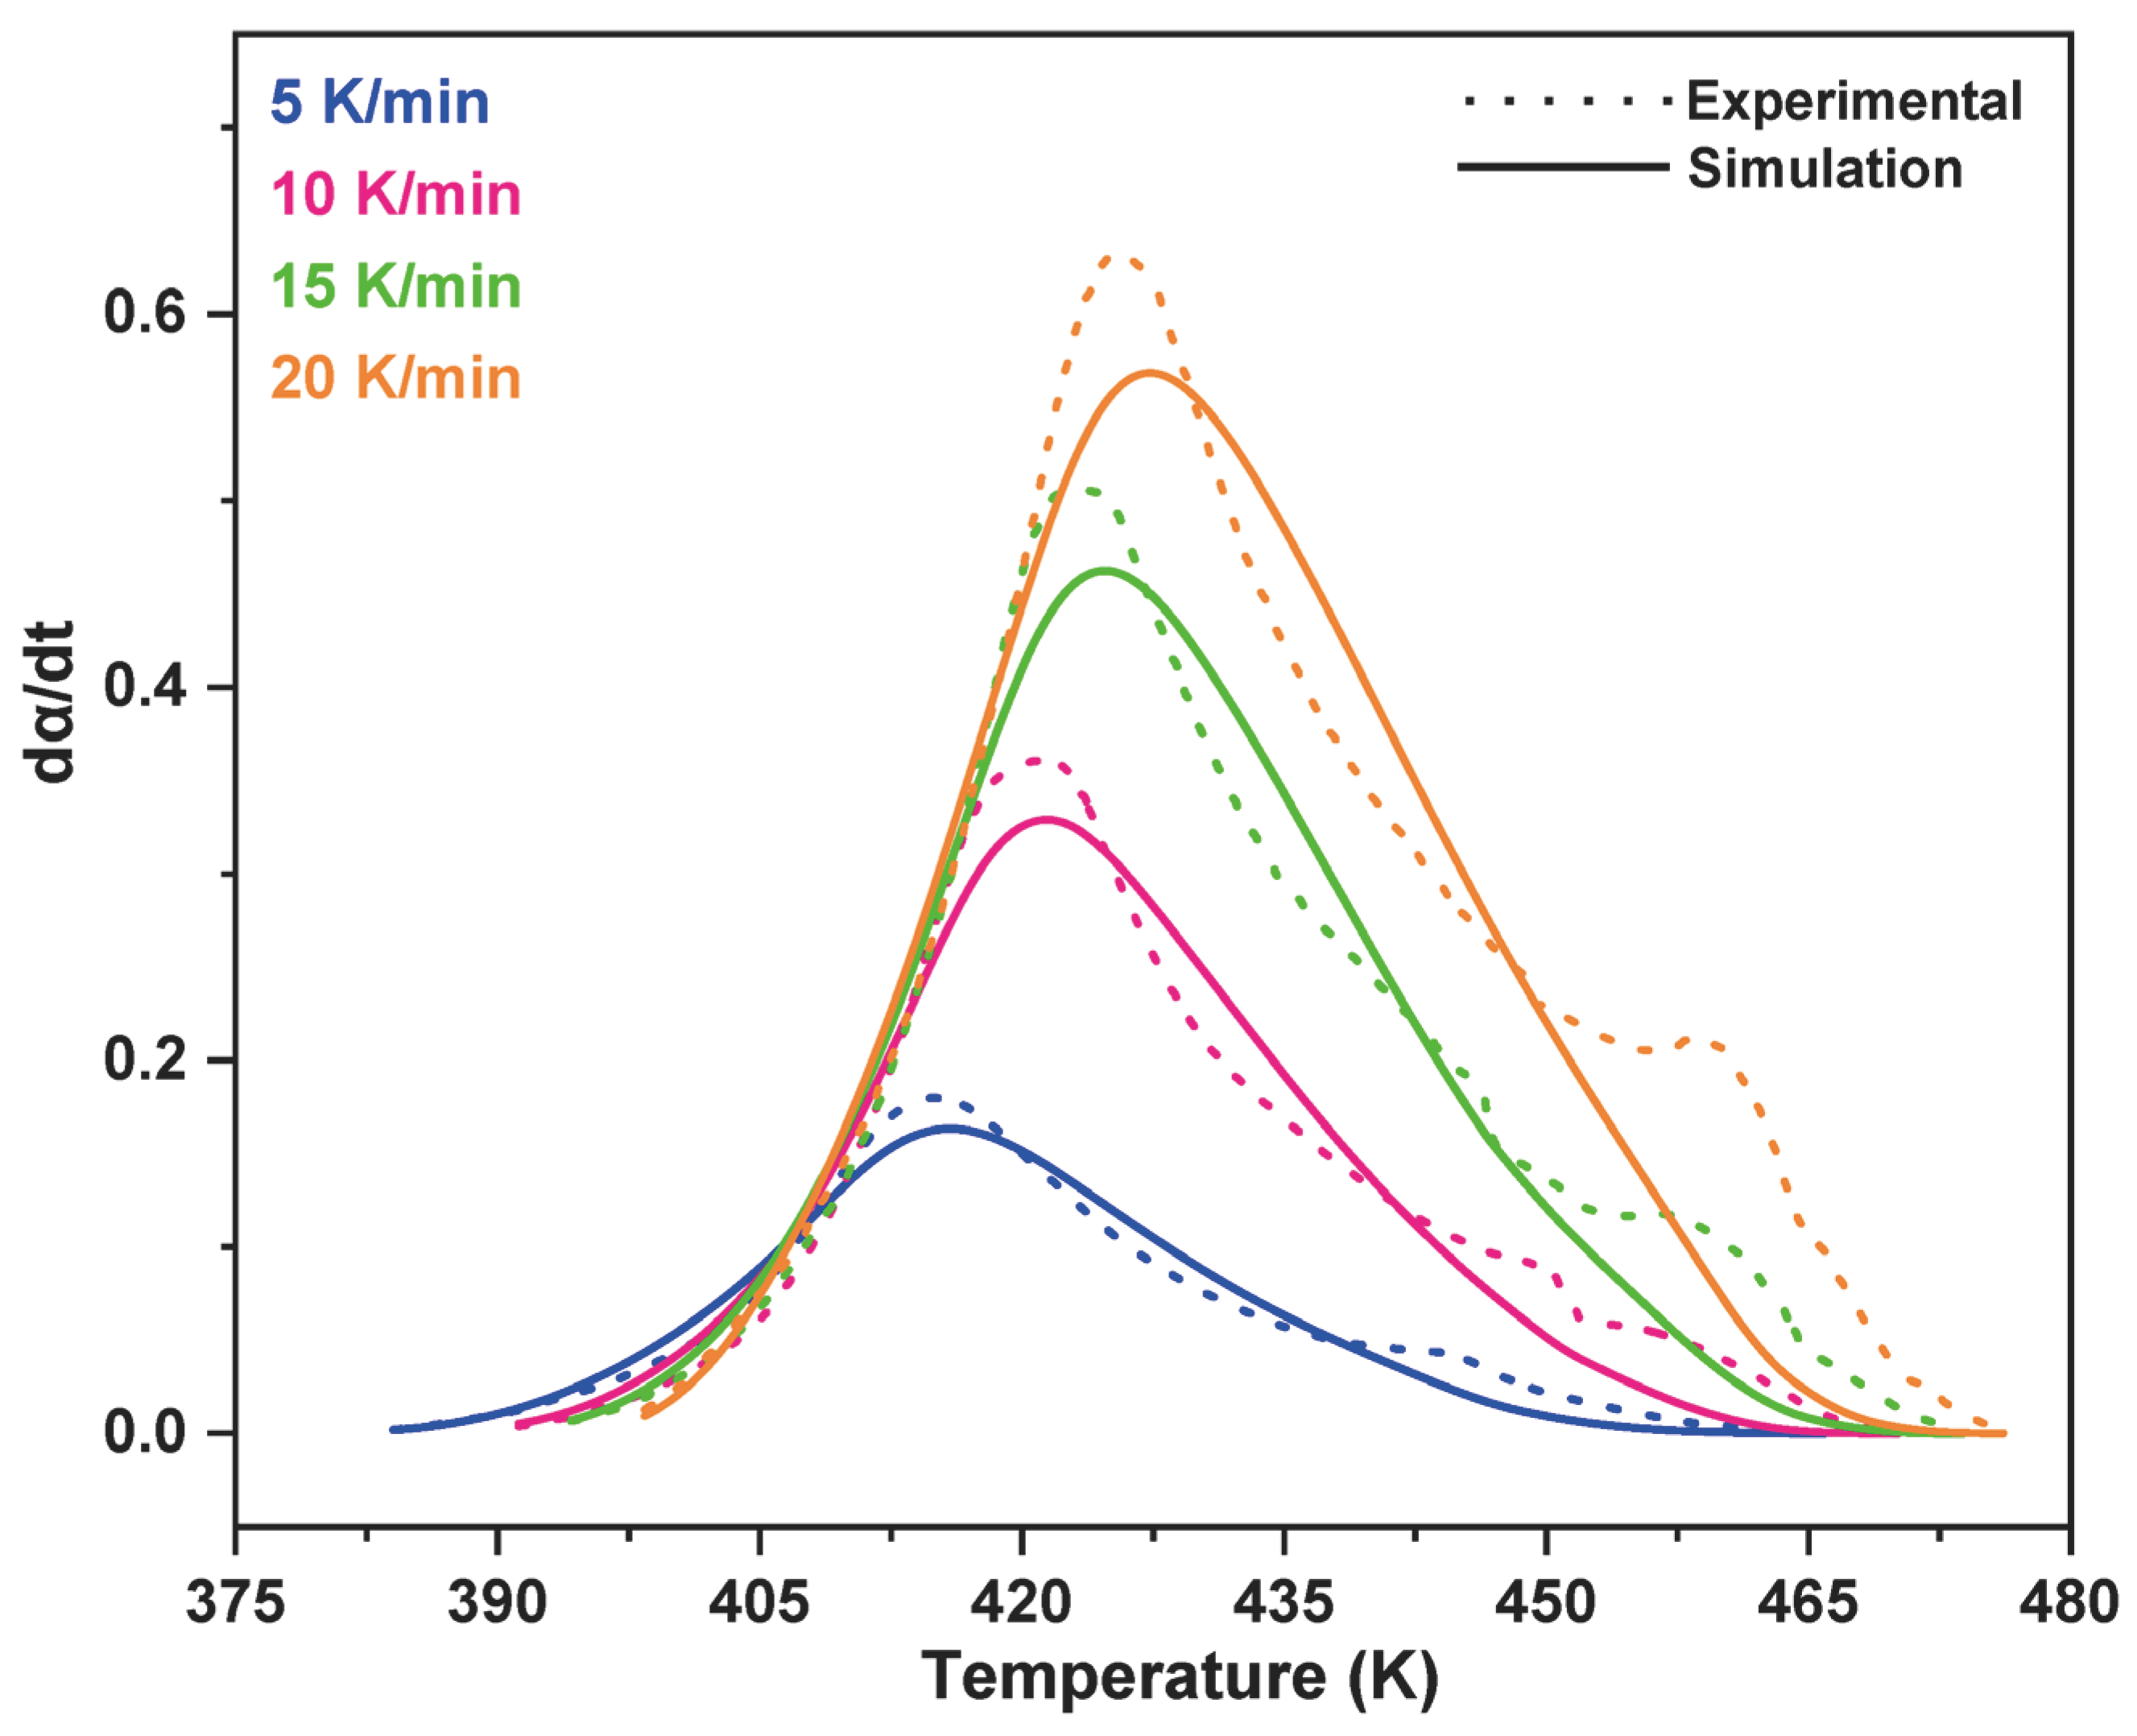
3.2. Model-Fitting Method
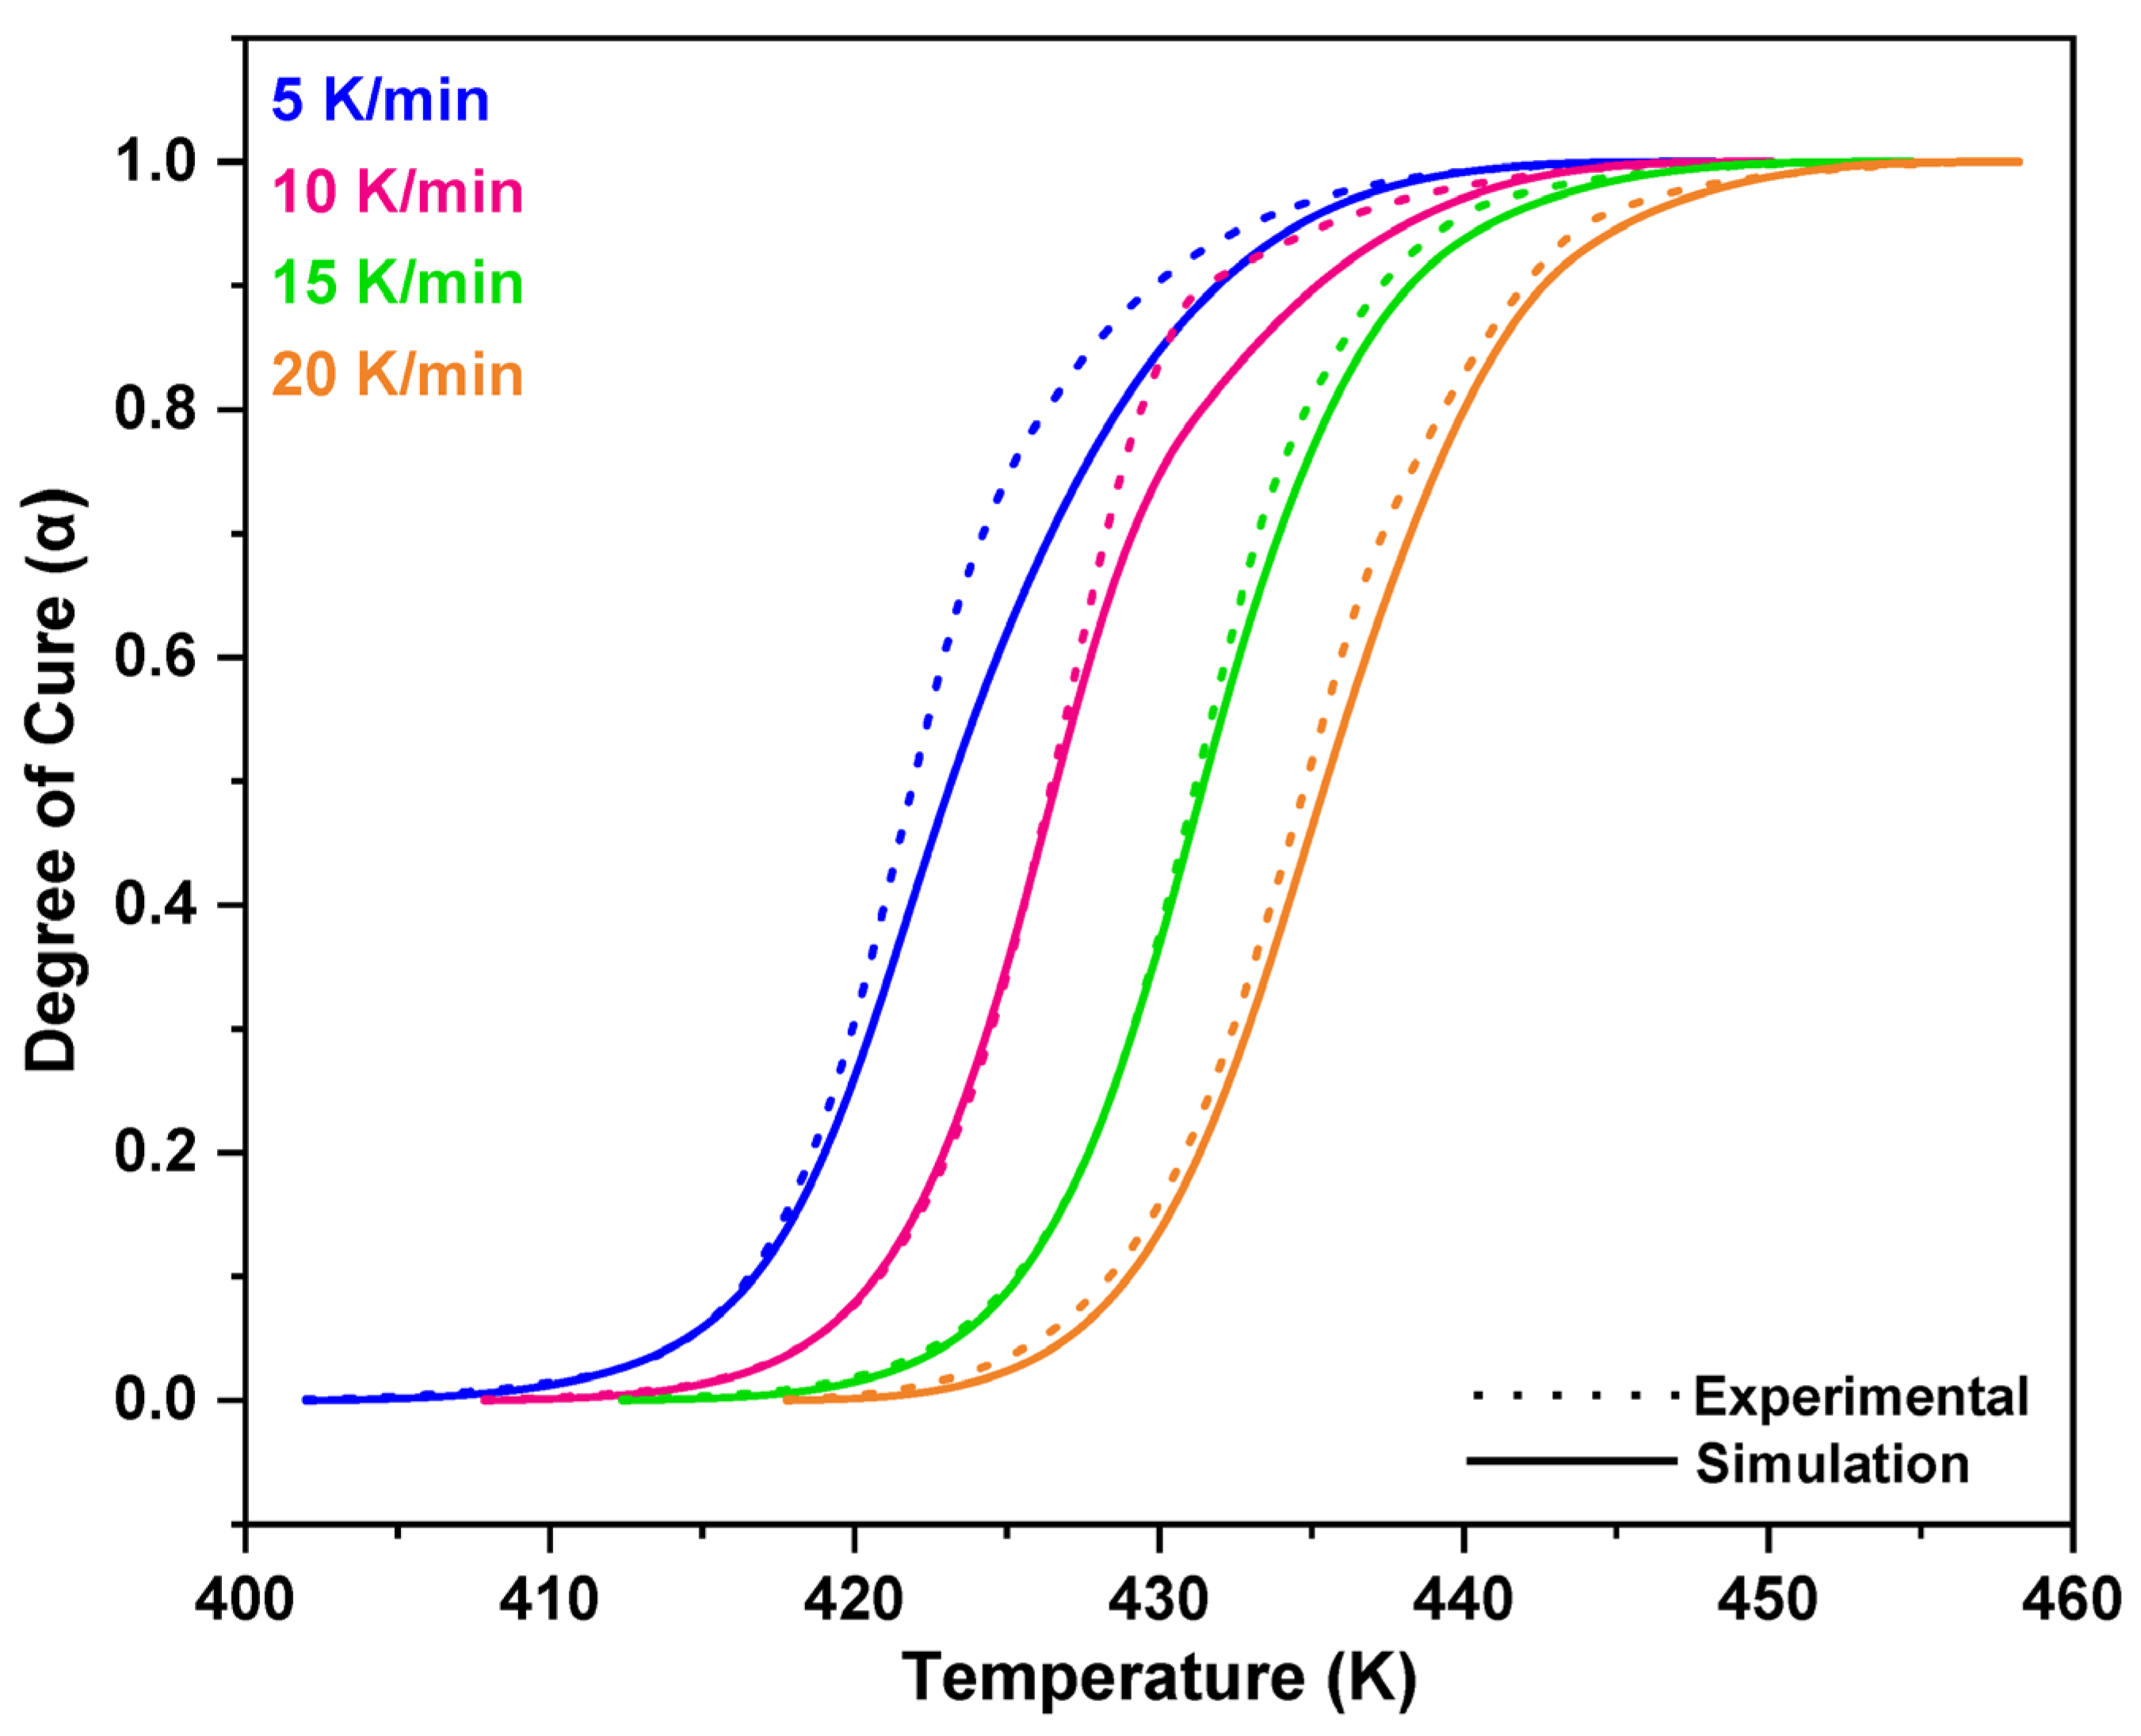
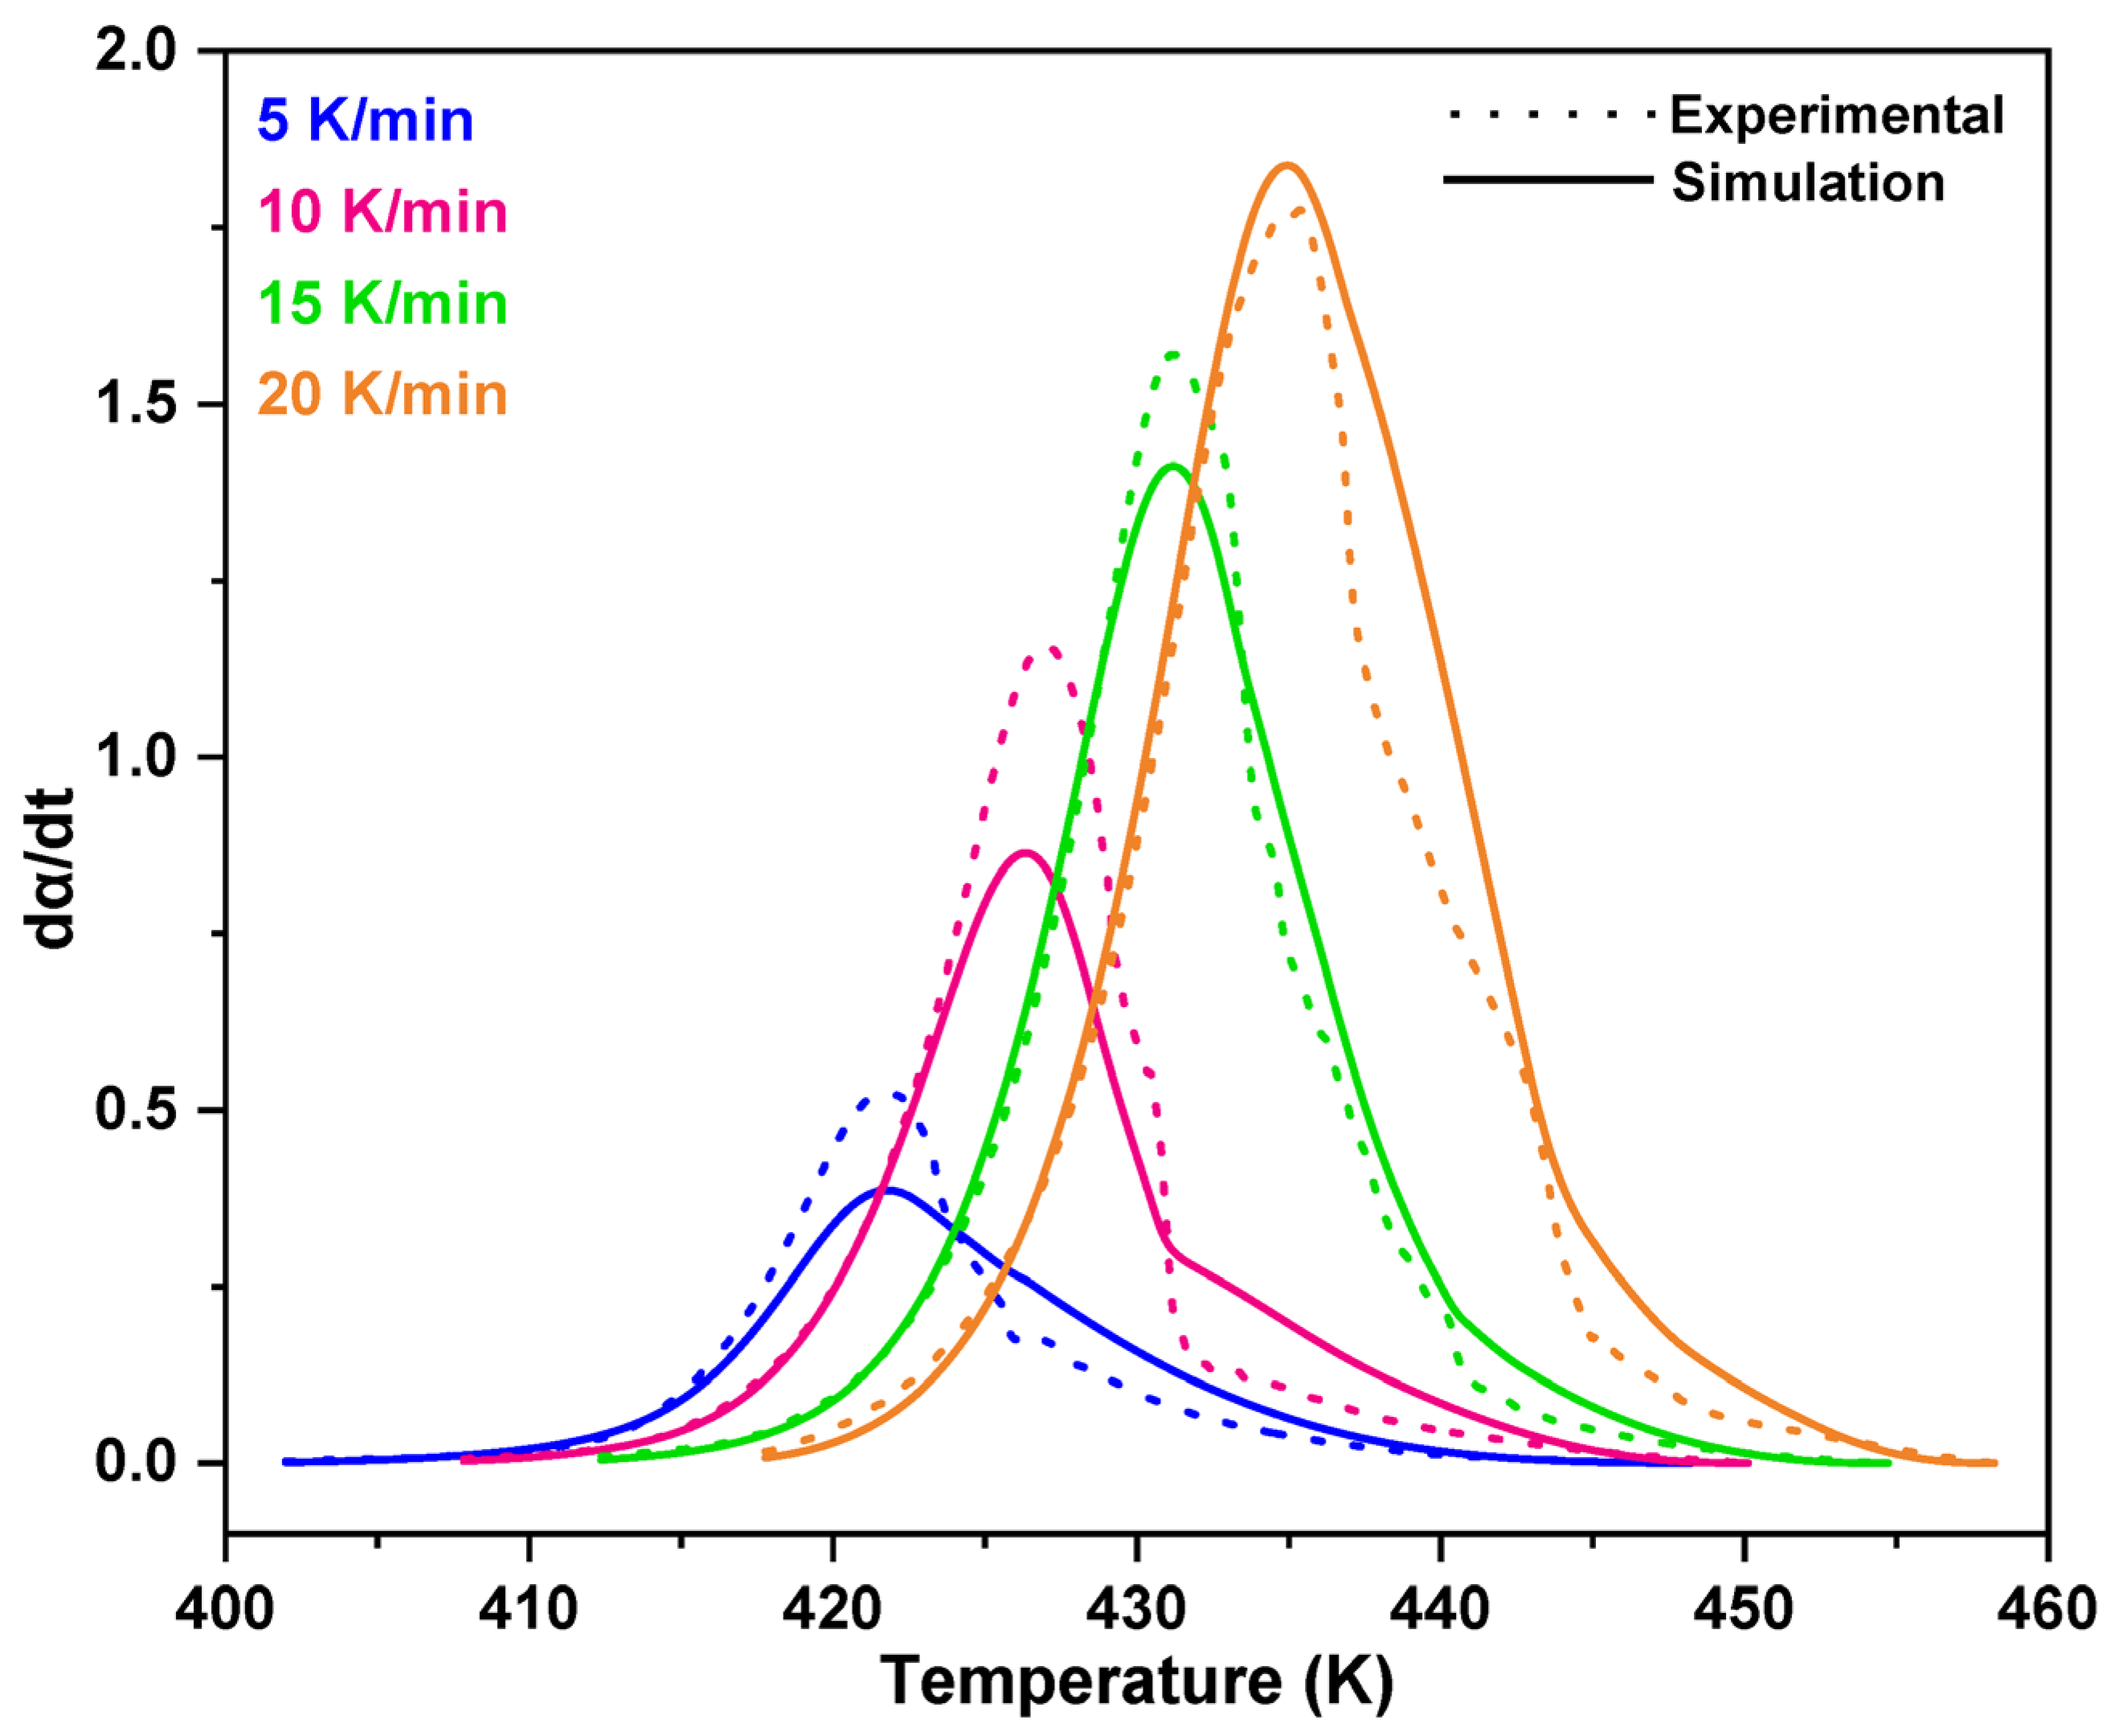
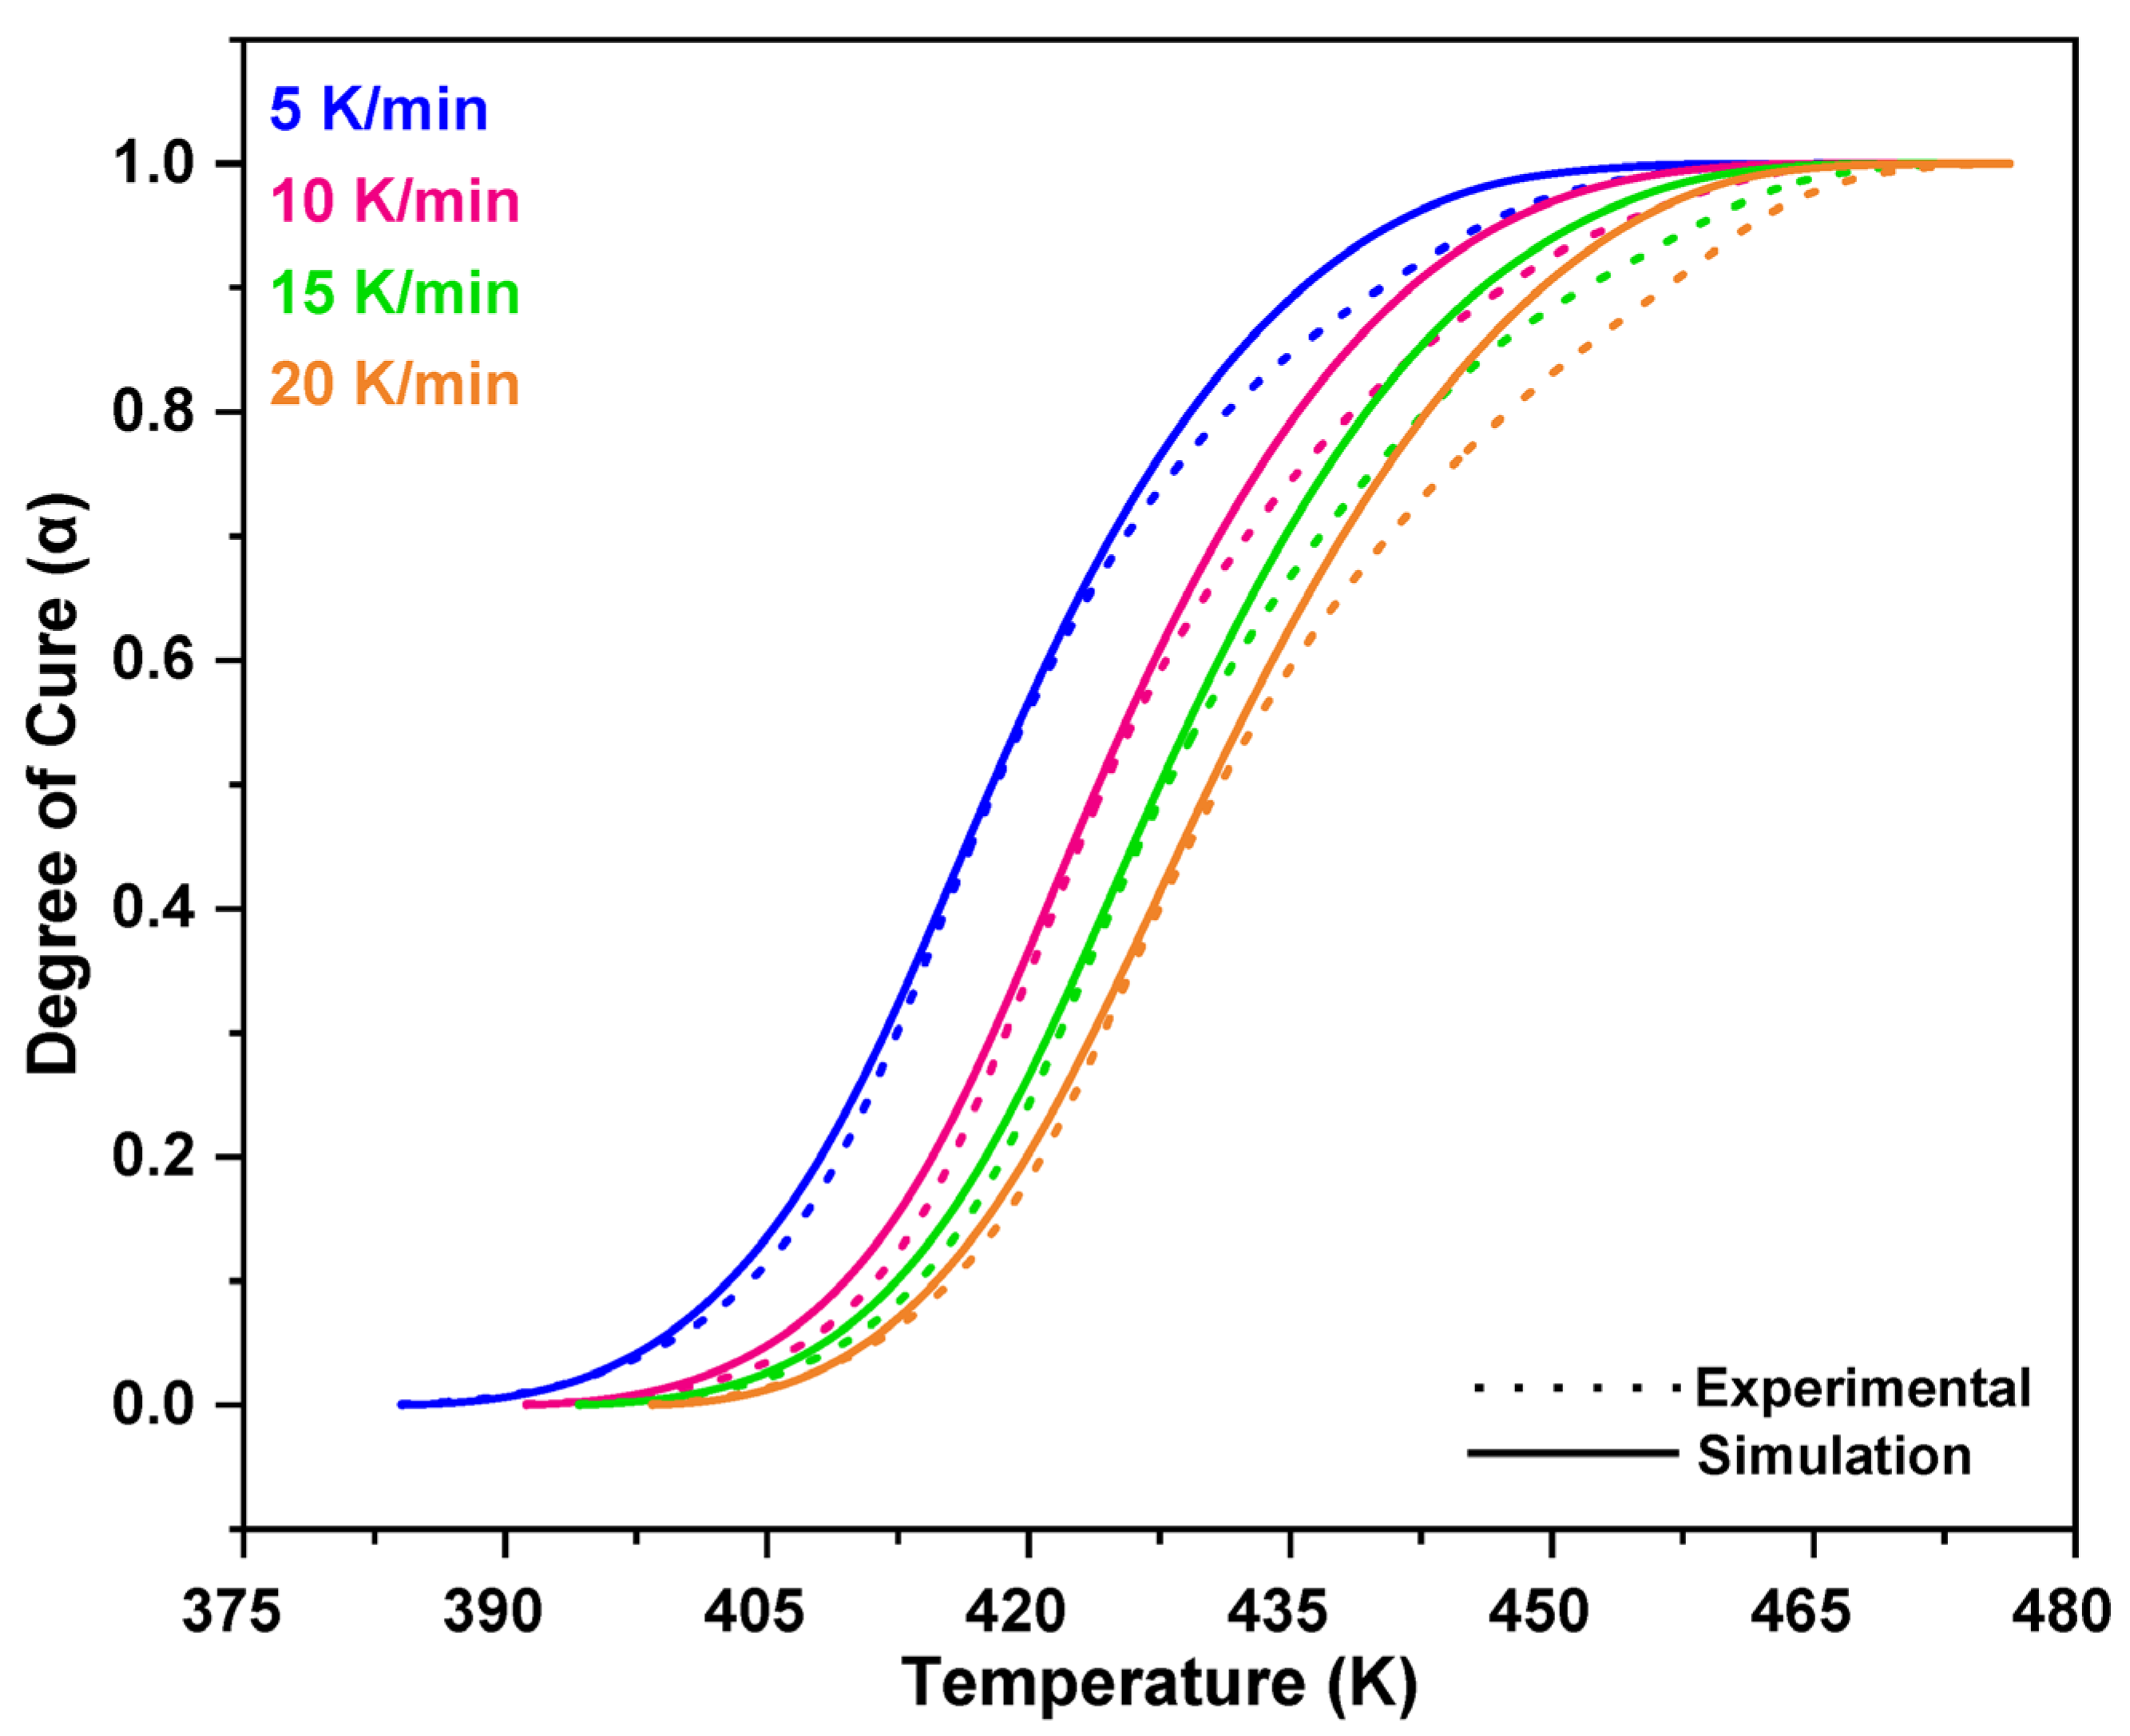
4. Conclusions
Supplementary Materials
Acknowledgments
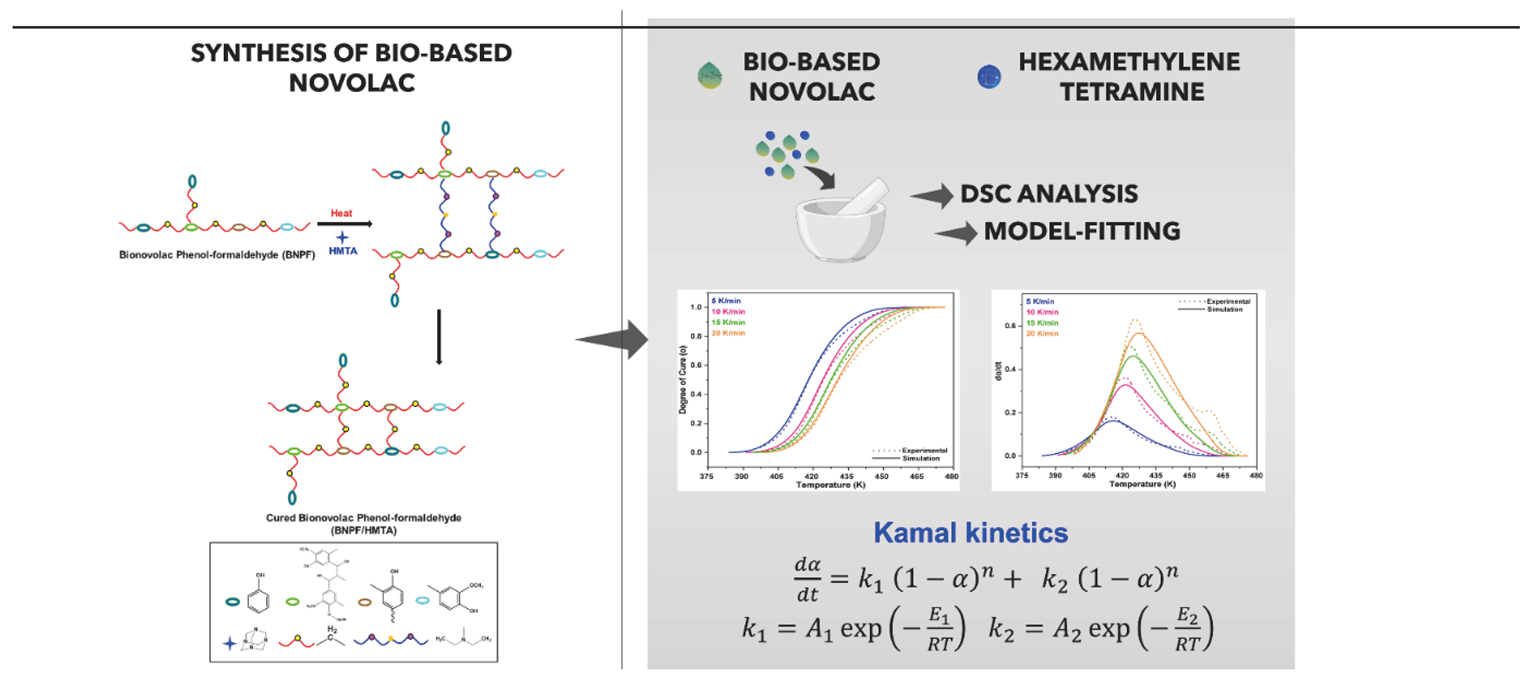
TOC
 |
References
- Zhang, Y.; Wang, F.; Duvigneau, J.; Wang, Y.; Wang, B.; Feng, X.; Mao, Z.; Vancso, G.J.; Sui, X. Highly Stable and Nonflammable Hydrated Salt-Paraffin Shape-Memory Gels for Sustainable Building Technology. ACS Sustain. Chem. Eng. 2021, 9, 15442–15450. [Google Scholar] [CrossRef]
- Ertelt, M.J.; Hilbig, H.; Grosse, C.U.; Lieleg, O. Small Pores, Big Impact—Controlling the Porosity Allows for Developing More Sustainable Construction Materials. ACS Sustain. Chem. Eng. 2021. [Google Scholar] [CrossRef]
- Yan, N.; Zhang, B.; Zhao, Y.; Farnood, R.R.; Shi, J. Application of Biobased Phenol Formaldehyde Novolac Resin Derived from Beetle Infested Lodgepole Pine Barks for Thermal Molding of Wood Composites. Ind. Eng. Chem. Res. 2017, 56, 6369–6377. [Google Scholar] [CrossRef]
- Milazzo, M.; Amoresano, A.; Pasquino, R.; Grizzuti, N.; Auriemma, F.; De Stefano, F.; Sin Xicola, A.; Iodice, V.; De Rosa, C. Curing Efficiency of Novolac-Type Phenol–Formaldehyde Resins from Viscoelastic Properties. Macromolecules 2021, 54, 11372–11383. [Google Scholar] [CrossRef]
- Zhang, X.; Solomon, D.H. Chemistry of Novolac/Furfuryl Alcohol Resins Cured with Hexamethylenetetramine: A Solid-State NMR Study. Chem. Mater. 1998, 10, 1833–1840. [Google Scholar] [CrossRef]
- De Medeiros, E.S.; Agnelli, J.A.M.; Joseph, K.; De Carvalho, L.H.; Mattoso, L.H.C. Curing Behavior of a Novolac-Type Phenolic Resin Analyzed by Differential Scanning Calorimetry. J. Appl. Polym. Sci. 2003, 90, 1678–1682. [Google Scholar] [CrossRef]
- Mahajan, J.S.; O’Dea, R.M.; Norris, J.B.; Korley, L.S.T.J.; Epps, T.H. Aromatics from Lignocellulosic Biomass: A Platform for High-Performance Thermosets. ACS Sustain. Chem. Eng. 2020, 8, 15072–15096. [Google Scholar] [CrossRef]
- Nolan Wilson, A.; Price, M.J.; Mukarakate, C.; Katahira, R.; Griffin, M.B.; Dorgan, J.R.; Olstad, J.; Magrini, K.A.; Nimlos, M.R. Integrated Biorefining: Coproduction of Renewable Resol Biopolymer for Aqueous Stream Valorization. ACS Sustain. Chem. Eng. 2017, 5, 6615–6625. [Google Scholar] [CrossRef]
- Bansode, A.; Barde, M.; Asafu-adjaye, O.; Patil, V.; Hinkle, J.; Via, B.K.; Adhikari, S.; Adamczyk, A.J.; Farag, R.; Elder, T.; Labb, N.; Auad, M.L. Synthesis of Biobased Novolac Phenol − Formaldehyde Wood Adhesives from Biore Fi Nery-Derived Lignocellulosic Biomass. ACS Sustain. Chem. Eng. 2021. [Google Scholar] [CrossRef]
- Asafu-Adjaye, O.A.; Street, J.; Bansode, A.; Auad, M.L.; Peresin, M.S.; Adhikari, S.; Liles, T.; Via, B.K. Fast Pyrolysis Bio-Oil-Based Epoxy as an Adhesive in Oriented Strand Board Production. Polymers 2022, 14, 1244. [Google Scholar] [CrossRef]
- Hager, I.; Golonka, A.; Putanowicz, R. 3D Printing of Buildings and Building Components as the Future of Sustainable Construction? Procedia Eng. 2016, 151, 292–299. [Google Scholar] [CrossRef]
- Trifol, J.; Jayaprakash, S.; Baniasadi, H.; Ajdary, R.; Kretzschmar, N.; Rojas, O.J.; Partanen, J.; Seppälä, J.V. 3D-Printed Thermoset Biocomposites Based on Forest Residues by Delayed Extrusion of Cold Masterbatch (DECMA). ACS Sustain. Chem. Eng. 2021, 9, 13979–13987. [Google Scholar] [CrossRef]
- Shahzad, A.; Lazoglu, I. Direct Ink Writing (DIW) of Structural and Functional Ceramics: Recent Achievements and Future Challenges. Compos. Part B Eng. 2021, 225. [Google Scholar] [CrossRef]
- Shen, L.; Wang, T.P.; Lee, T.H.; Forrester, M.; Becker, A.; Torres, S.; Pearson, C.; Cochran, E.W. 3D Printable All-Polymer Epoxy Composites. ACS Appl. Polym. Mater. 2021, 3, 5559–5567. [Google Scholar] [CrossRef]
- Wang, B.; Arias, K.F.; Zhang, Z.; Liu, Y.; Jiang, Z.; Sue, H.J.; Currie-Gregg, N.; Bouslog, S.; Pei, Z.; Wang, S. 3D Printing of In-Situ Curing Thermally Insulated Thermosets. Manuf. Lett. 2019, 21, 1–6. [Google Scholar] [CrossRef]
- Ziaee, M.; Johnson, J.W.; Yourdkhani, M. 3D Printing of Short-Carbon-Fiber-Reinforced Thermoset Polymer Composites via Frontal Polymerization. ACS Appl. Mater. Interfaces 2022. [Google Scholar] [CrossRef]
- Mariani, A.; Fiori, S.; Chekanov, Y.; Pojman, J.A. Frontal Ring-Opening Metathesis Polymerization of Dicyclopentadiene [5]. Macromolecules 2001, 34, 6539–6541. [Google Scholar] [CrossRef]
- Pojman, J.A. Frontal Polymerization; Elsevier B.V., 2012; Volume 4. [Google Scholar] [CrossRef]
- Goli, E.; Parikh, N.A.; Yourdkhani, M.; Hibbard, N.G.; Moore, J.S.; Sottos, N.R.; Geubelle, P.H. Frontal Polymerization of Unidirectional Carbon-Fiber-Reinforced Composites. Compos. Part A Appl. Sci. Manuf. 2020, 130, 105689. [Google Scholar] [CrossRef]
- Zheng, T.; Xi, H.; Wang, Z.; Zhang, X.; Wang, Y.; Qiao, Y.; Wang, P.; Li, Q.; Li, Z.; Ji, C.; Wang, X. The Curing Kinetics and Mechanical Properties of Epoxy Resin Composites Reinforced by PEEK Microparticles. Polym. Test. 2020, 91, 106781. [Google Scholar] [CrossRef]
- El-Thaher, N.; Mekonnen, T.; Mussone, P.; Bressler, D.; Choi, P. Nonisothermal DSC Study of Epoxy Resins Cured with Hydrolyzed Specified Risk Material. Ind. Eng. Chem. Res. 2013, 52, 8189–8199. [Google Scholar] [CrossRef]
- Chaiwan, P.; Kaewkittinarong, A.; Pumchusak, J. Nonisothermal Curing Kinetics of Solid Resole by Differential Scanning Calorimetry. Thermochim. Acta 2019, 675, 119–126. [Google Scholar] [CrossRef]
- Um, M.K.; Daniel, I.M.; Hwang, B.S. A Study of Cure Kinetics by the Use of Dynamic Differential Scanning Calorimetry. Compos. Sci. Technol. 2002, 62, 29–40. [Google Scholar] [CrossRef]
- Heinze, S.; Echtermeyer, A.T. A Practical Approach for Data Gathering for Polymer Cure Simulations. Appl. Sci. 2018, 8, 2227. [Google Scholar] [CrossRef]
- Chandran, M.S.; Krishna, M.; Rai, S.; Krupashankara, M.S.; Salini, K. Cure Kinetics and Activation Energy Studies of Modified Bismaleimide Resins. ISRN Polym. Sci. 2012, 2012, 1–8. [Google Scholar] [CrossRef]
- Ma, H.; Zhang, X.; Ju, F.; Tsai, S.B. A Study on Curing Kinetics of Nano-Phase Modified Epoxy Resin. Sci. Rep. 2018, 8, 1–15. [Google Scholar] [CrossRef]
- Yang, G.; Lee, J.K. Curing Kinetics and Mechanical Properties of Endo -Dicyclopentadiene Synthesized Using Different Grubbs’ Catalysts. Ind. Eng. Chem. Res. 2014, 53, 3001–3011. [Google Scholar] [CrossRef]
- Zhang, C.; Binienda, W.K.; Zeng, L.; Ye, X.; Chen, S. Kinetic Study of the Novolac Resin Curing Process Using Model Fitting and Model-Free Methods. Thermochim. Acta 2011, 523, 63–69. [Google Scholar] [CrossRef]
- Kim, P.; Weaver, S.; Noh, K.; Labbé, N. Characteristics of Bio-Oils Produced by an Intermediate Semipilot Scale Pyrolysis Auger Reactor Equipped with Multistage Condensers. Energy and Fuels 2014, 28, 6966–6973. [Google Scholar] [CrossRef]
- Thomas, R.; Sinturel, C.; Pionteck, J.; Puliyalil, H.; Thomas, S. In-Situ Cure and Cure Kinetic Analysis of a Liquid Rubber Modified Epoxy Resin. Ind. Eng. Chem. Res. 2012, 51, 12178–12191. [Google Scholar] [CrossRef]
- Patel, A.; Maiorana, A.; Yue, L.; Gross, R.A.; Manas-Zloczower, I. Curing Kinetics of Biobased Epoxies for Tailored Applications. Macromolecules 2016, 49, 5315–5324. [Google Scholar] [CrossRef]
- Perejón, A.; Sánchez-Jiménez, P.E.; Criado, J.M.; Pérez-Maqueda, L.A. Kinetic Analysis of Complex Solid-State Reactions. A New Deconvolution Procedure. J. Phys. Chem. B 2011, 115, 1780–1791. [Google Scholar] [CrossRef]
- Yang, G.; Yuan, Z.; Yang, Z.; Zhang, M. Nonisothermal Curing Kinetics of a Novel Polymer Containing Phenylsilylene and Propargyl-Hexafluorobisphenol a Units. J. Appl. Polym. Sci. 2013, 127, 3178–3185. [Google Scholar] [CrossRef]
- Wan, J.; Li, C.; Fan, H.; Li, B.G. Branched 1,6-Diaminohexane-Derived Aliphatic Polyamine as Curing Agent for Epoxy: Isothermal Cure, Network Structure, and Mechanical Properties. Ind. Eng. Chem. Res. 2017, 56, 4938–4948. [Google Scholar] [CrossRef]
- Mashouf Roudsari, G.; Mohanty, A.K.; Misra, M. Study of the Curing Kinetics of Epoxy Resins with Biobased Hardener and Epoxidized Soybean Oil. ACS Sustain. Chem. Eng. 2014, 2, 2111–2116. [Google Scholar] [CrossRef]
- Li, J.; Qiao, Y.; Zong, P.; Wang, C.; Tian, Y.; Qin, S. Thermogravimetric Analysis and Isoconversional Kinetic Study of Biomass Pyrolysis Derived from Land, Coastal Zone, and Marine. Energy and Fuels 2019, 33, 3299–3310. [Google Scholar] [CrossRef]
- Friedman, H.L. Kinetics of Thermal Degradation of Char-Forming Plastics from Thermogravimetry. Application to a Phenolic Plastic. J. Polym. Sci. Part C Polym. Symp. 2007, 6, 183–195. [Google Scholar] [CrossRef]
- Hao, H.; Chang, T.; Cui, L.; Sun, R.; Gao, R. Theoretical Study on the Mechanism of Hydrogen Donation and Transfer for Hydrogen-Donor Solvents during Direct Coal Liquefaction. Catalysts 2018, 8, 648. [Google Scholar] [CrossRef]
- Langtry, B.N. Identity And Spatio-Temporal Continuity. Australas. J. Philos. 1972, 50, 184–189. [Google Scholar] [CrossRef]
- Blaine, R.L.; Kissinger, H.E. Homer Kissinger and the Kissinger Equation. Thermochim. Acta 2012, 540, 1–6. [Google Scholar] [CrossRef]
- Vyazovkin, S. Evaluation of Activation Energy of Thermally Stimulated Solid-State Reactions under Arbitrary Variation of Temperature. J. Comput. Chem. 1997, 18, 393–402. [Google Scholar] [CrossRef]
- Hosseinpour, A.; Nazockdast, H.; Behzad, T.; Salimijazi, H.R. Investigation of the Cure Kinetics of an Epoxy Resin by Advanced Isoconversional and Model-Fitting Methods. AIP Conference Proceedings 2016. [Google Scholar] [CrossRef]
- Zhang, C.; Binienda, W.K.; Zeng, L.; Ye, X.; Chen, S. Kinetic Study of the Novolac Resin Curing Process Using Model Fitting and Model-Free Methods. Thermochim. Acta 2011, 523, 63–69. [Google Scholar] [CrossRef]
- Li, S.; Järvelä, P. Application of a Model-Free Isoconversional Method to the Cure of Phenolic Systems. J. Polym. Sci. Part B Polym. Phys. 2001, 39, 1525–1528. [Google Scholar] [CrossRef]
- Ma, S.; Fan, H.; Zhang, N.; Li, W.; Li, Y.; Li, Y.; Huang, D.; Zeng, L.; Shi, X.; Ran, X.; Xu, H. Investigation of a Low-Toxicity Energetic Binder for a Solid Propellant: Curing, Microstructures, and Performance. ACS Omega. 2020, 30538–30548. [Google Scholar] [CrossRef] [PubMed]
- Zhan, X.; Liu, H.; Zhang, J. Two Branched Silicone Resins with Different Reactive Groups: A Comparative Evaluation. Ind. Eng. Chem. Res. 2018, 57, 5606–5615. [Google Scholar] [CrossRef]
- Zhou, Z.; Si, Q.; Wan, L.; Kuo, S.W.; Zhou, C.; Xin, Z. Curing Kinetics of Main-Chain Benzoxazine Polymers Synthesized in Continuous Flow. Ind. Eng. Chem. Res. 2022, 61, 2947–2954. [Google Scholar] [CrossRef]
- Horadam, W.; Venkat, N.; Tran, T.; Bai, L.; Josyula, K.; Mehta, V. Leaching Studies on Novolac Resin-Coated Proppants-Performance, Stability, Product Safety, and Environmental Health Considerations. J. Appl. Polym. Sci. 2018, 135. [Google Scholar] [CrossRef]
- Domínguez, J.C.; Alonso, M.V.; Oliet, M.; Rojo, E.; Rodríguez, F. Kinetic Study of a Phenolic-Novolac Resin Curing Process by Rheological and DSC Analysis. Thermochim. Acta 2010, 498, 39–44. [Google Scholar] [CrossRef]
| Heating rate (ꞵ) (K/min) |
NPF/HMTA resin | BNPF/HMTA resin |
|---|---|---|
| TP (K) | TP (K) | |
| 5 | 421.81 | 415.11 |
| 10 | 426.97 | 420.90 |
| 15 | 431.21 | 423.10 |
| 20 | 435.44 | 425.72 |
| Resins | Ea (KJ/mol) | A (min-[1]) | n | m |
|---|---|---|---|---|
| NPF/HMTA | 137.00 | 1.982 × 10[17] | 1.2342 | 0.7658 |
| BNPF/HMTA | 1.195 E1=E2 |
A1=1.734 ×10-[8] A2=3.038 |
1.1948 | 0.8051 |
Disclaimer/Publisher’s Note: The statements, opinions and data contained in all publications are solely those of the individual author(s) and contributor(s) and not of MDPI and/or the editor(s). MDPI and/or the editor(s) disclaim responsibility for any injury to people or property resulting from any ideas, methods, instructions or products referred to in the content. |
© 2024 by the authors. Licensee MDPI, Basel, Switzerland. This article is an open access article distributed under the terms and conditions of the Creative Commons Attribution (CC BY) license (http://creativecommons.org/licenses/by/4.0/).


