Preprint
Article

Panmacular Micropulse Laser Treatment of Central Serous Chorioretinopathy: Two-Year Follow-Up of Morphological and Functional Parameters

Altmetrics

Downloads

92

Views

38

Comments

0

This version is not peer-reviewed

Submitted:

25 March 2024

Posted:

26 March 2024

You are already at the latest version

Alerts
Abstract
Aim: To evaluate the panmacular subthreshold micropulse laser treatment results among patients with central serous chorioretinopathy (CSC) and their correlation with functional and morphological parameters. Material and methods: The examined group included 10 non-treated and 41 treated patients with acute, recurrent, and chronic CSC (13 F, 38 M, mean age 44.11±6.5) and 14 healthy controls (6 F, 8 M, mean age 45±9.3). The BCVA examination, ophthalmoscopy, microp-erimetry, angio-OCT and OCT were performed. The medical history regarding chronic general disorders and known risk factors were recorded. Results: Complete resorption of SRF was obtained in 100% aCSC, 86.66% cCSC, and 63.63% r CSC. BCVA and RetSens significantly improved most of the patients treated in aCSC. The lowest BCVA and RetSens, but the largest pachyvessel and disease duration, were found in rCSC. A strong negative correlation between final BCVA and disease duration was found. No patient demonstrated laser lesions following treatment. Conclusions: The panmacular MPLT therapy leads to long-term enhancement of functional and morphological parameters in all CSC patients. The acute CSC patients showed the most significant improvement. The procedure is safe and could be considered a preferred treatment option for all active CSC cases. Timely treatment is crucial for beneficial outcomes.
Keywords: 
Subject: Medicine and Pharmacology  -   Ophthalmology

1. Introduction

Determining the optimal treatment for central serous chorioretinopathy (CSC) and its optimal timing remains an ongoing challenge. Typically, acute CSC is not treated due to its self-limiting nature. Many inconsistencies arise in the management of recurrent and chronic CSC. Laser treatment has been generally avoided because of the apprehension of side effects typical of conventional laser therapy. The exception is photodynamic therapy (PDT) for chronic CSC, which showed superior results to other treatments, such as MPLT, in the large PLACE trial [1]. However, it should be noted that according to the MPLT methodology used in this study, the laser was limited only to the area of the neurosensory retinal detachment, mirroring PDT therapy.
However, these two therapies have different modes of action. Numerous studies have demonstrated that subthreshold MPLT therapy can effectively stimulate RPE and Müller cells, improving the transretinal pump and eliminating subretinal fluid [2,3,4]. Therefore, it seems clear that maximizing the stimulation area can enhance therapeutic effects [4]. Thus, the principle of the panmacular MPLT protocol is based on the extension concept of obtaining a “mass effect” of cellular stimulation (within the major vascular arcades on the whole macular area) [4,5,6].
There is currently a need to reach a consensus on how to define and determine the duration of different types of CSC. Central Serous Chorioretinopathy International Group proposed a new classification for CSC [7]. However, the proposed timeframe to distinguish between simple and complex CSCs is still six months, which is questionable because the risk of RPE damage and permanent visual impairment is too high. Studies have confirmed the destructive effect of short-term subretinal fluid in patients with resolved acute CSC [8].
This lack of agreement leads to difficulties in establishing a specific timeframe for treatment, ultimately hindering the prevention of the negative consequences of chronic CSC. Additionally, a standardized treatment protocol for Micropulse Laser Therapy (MPLT) in CSC should be used to compare treatment outcomes with other trials in the future. While numerous reports in the literature have evaluated the efficacy of various treatment modalities for CSC, MPLT has often been confined to treating the area of neurosensory retinal detachment, prioritizing foveal preservation [1,9,10,11].
Recently, transfoveal MPLT therapy was introduced as a treatment for acute CSC, but different results were obtained [12,13].
Our study aimed to evaluate the efficacy and safety of panmacular MPLT therapy in long-term follow-up of patients with different CSC types compared to healthy volunteers and the observed untreated, spontaneously receding group. The secondary study aimed to determine the correlation between treatment results and functional and morphological parameters on multimodal imaging to identify prognostic factors for a positive outcome.

2. Materials and Methods

2.1. The study groups

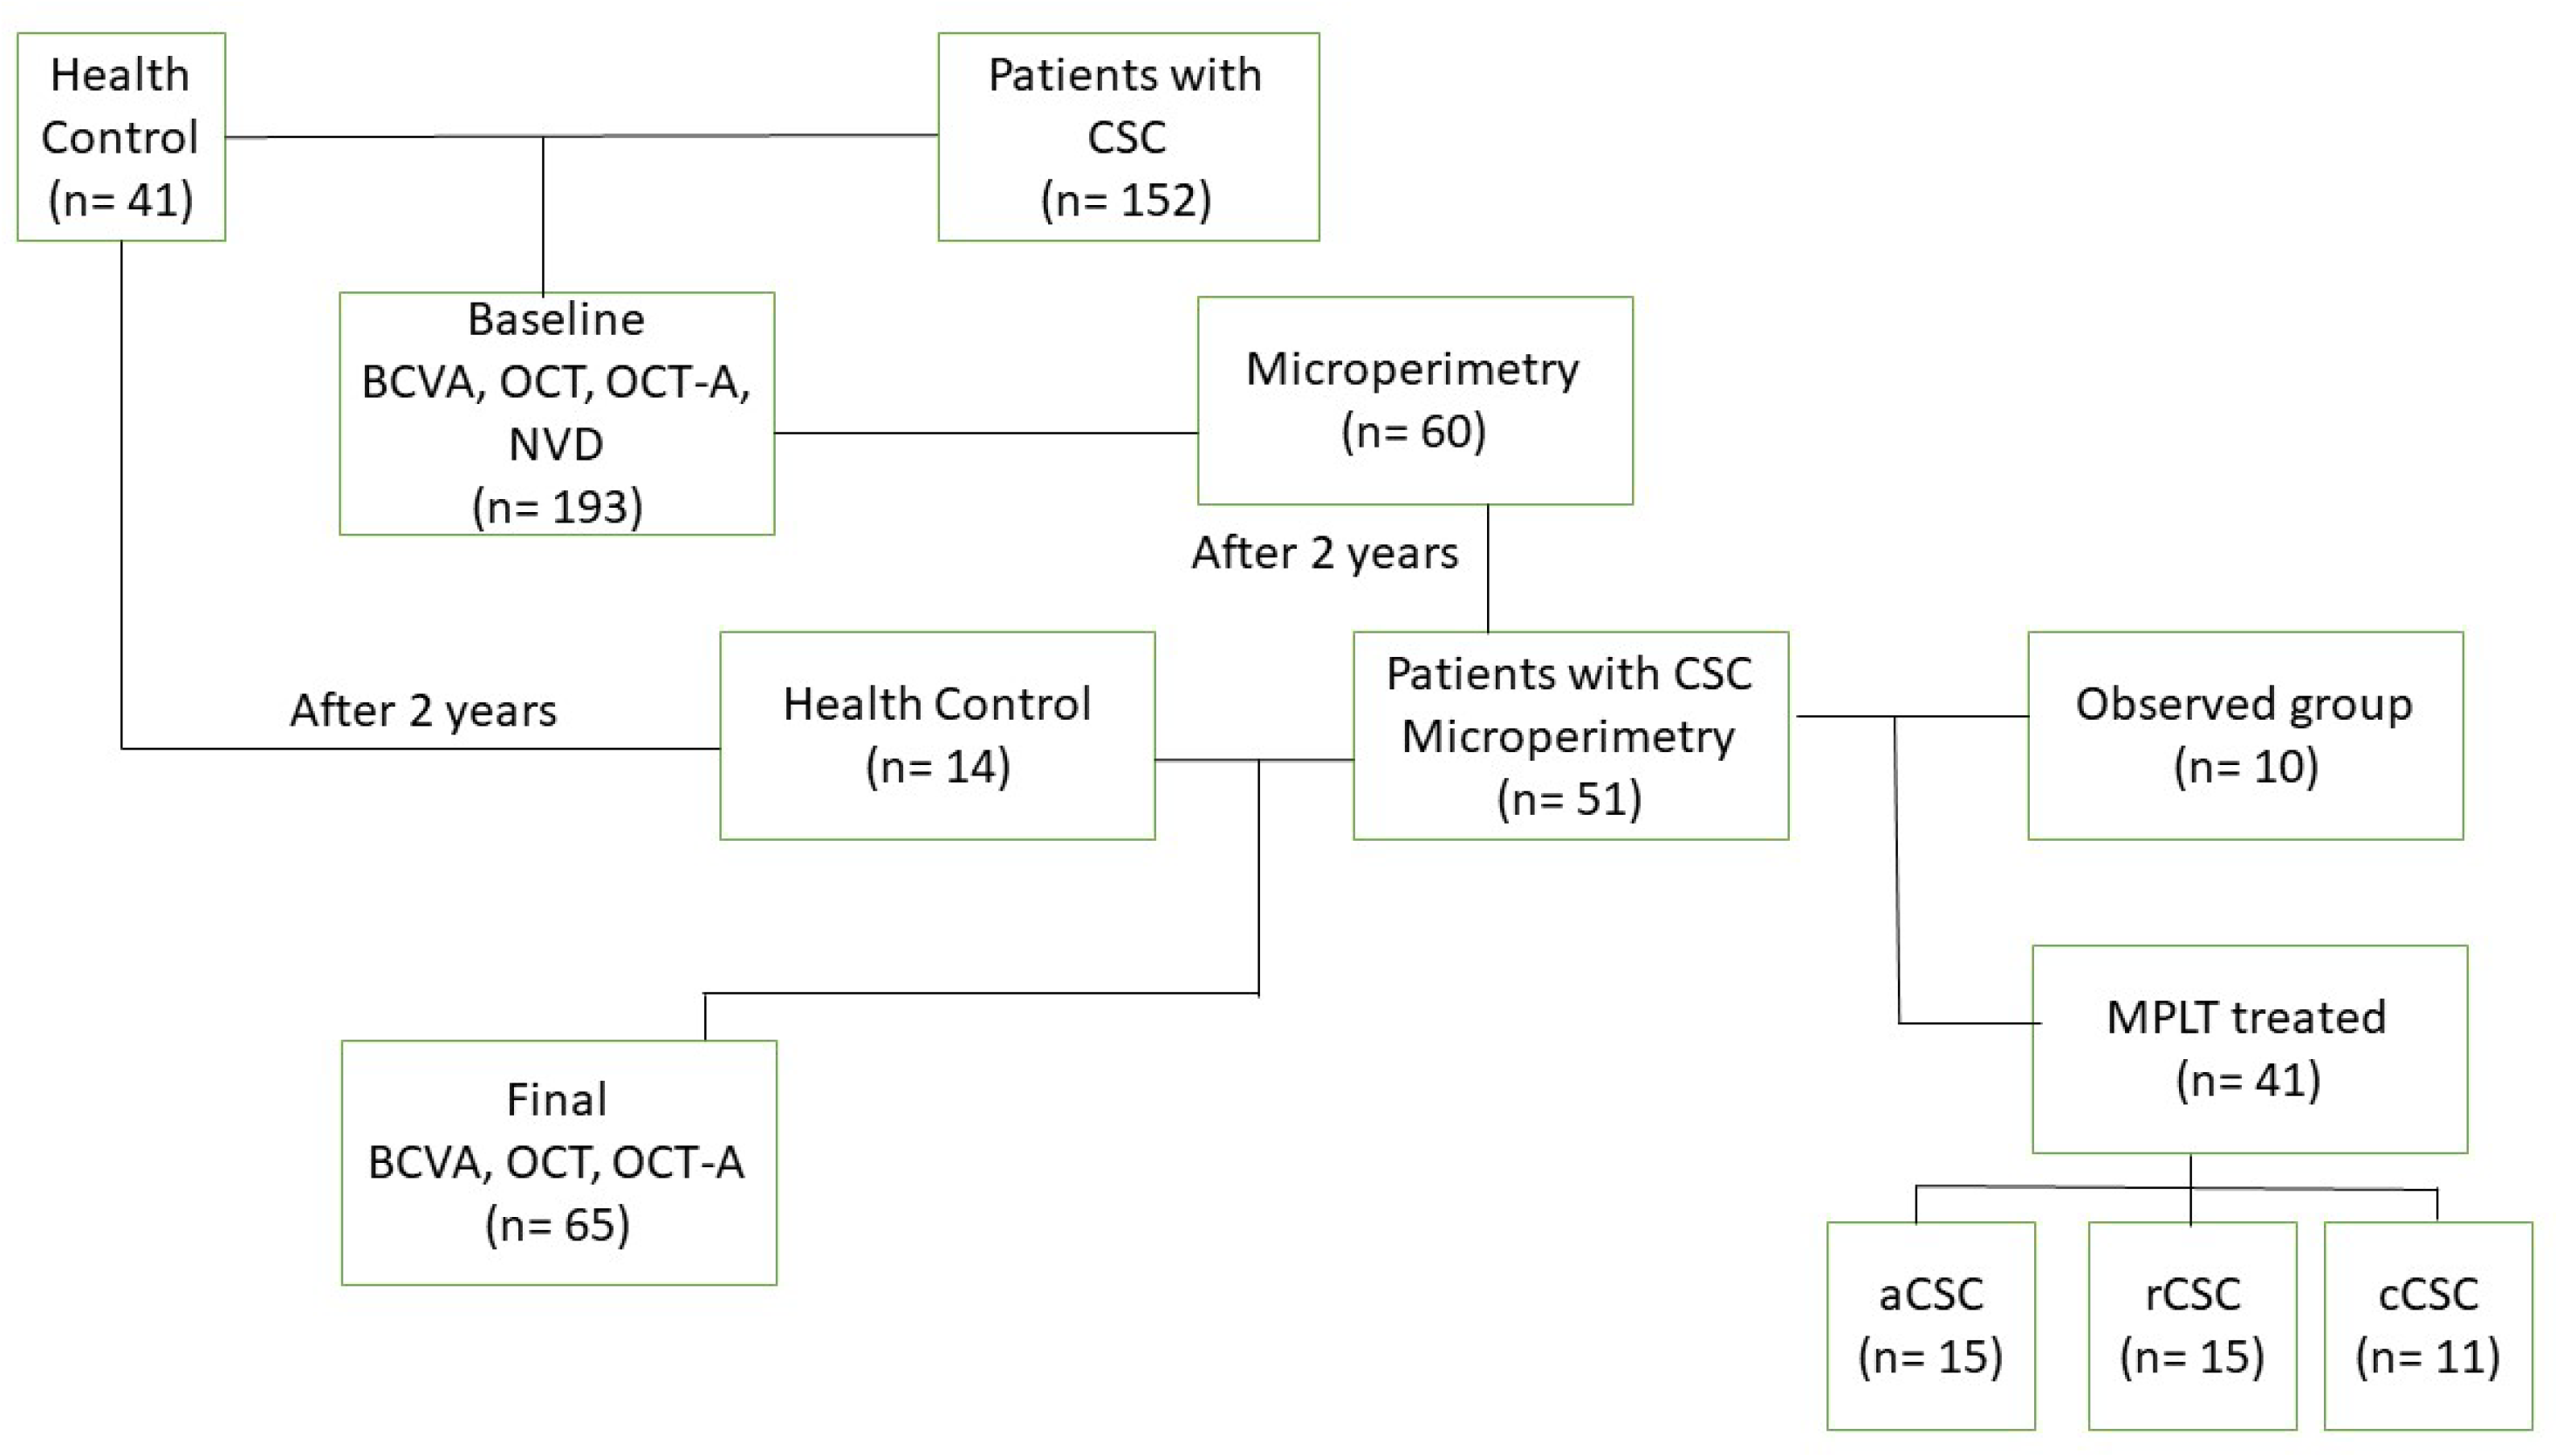
This retrospective study is based on 51 eyes of 51 patients treated with panmacular MPLT, extracted from 152 patients diagnosed with CSC at the Ophthalmology Department of Medical University, Lublin, between September 2018 and December 2023. Furthermore, 14 healthy subjects were selected from 41 healthy individuals matched by gender and age who underwent all the analyzed examinations after two years. All participants provided written informed consent before the procedure. The study adhered to the principles of the Declaration of Helsinki, and the design was approved by the local ethical committee at the Medical University of Lublin (KE-0254/291/2018). This study was conducted among pre-qualified patients for the nailfold videocapillaroscopy study, as outlined in the previous reports [14,15].
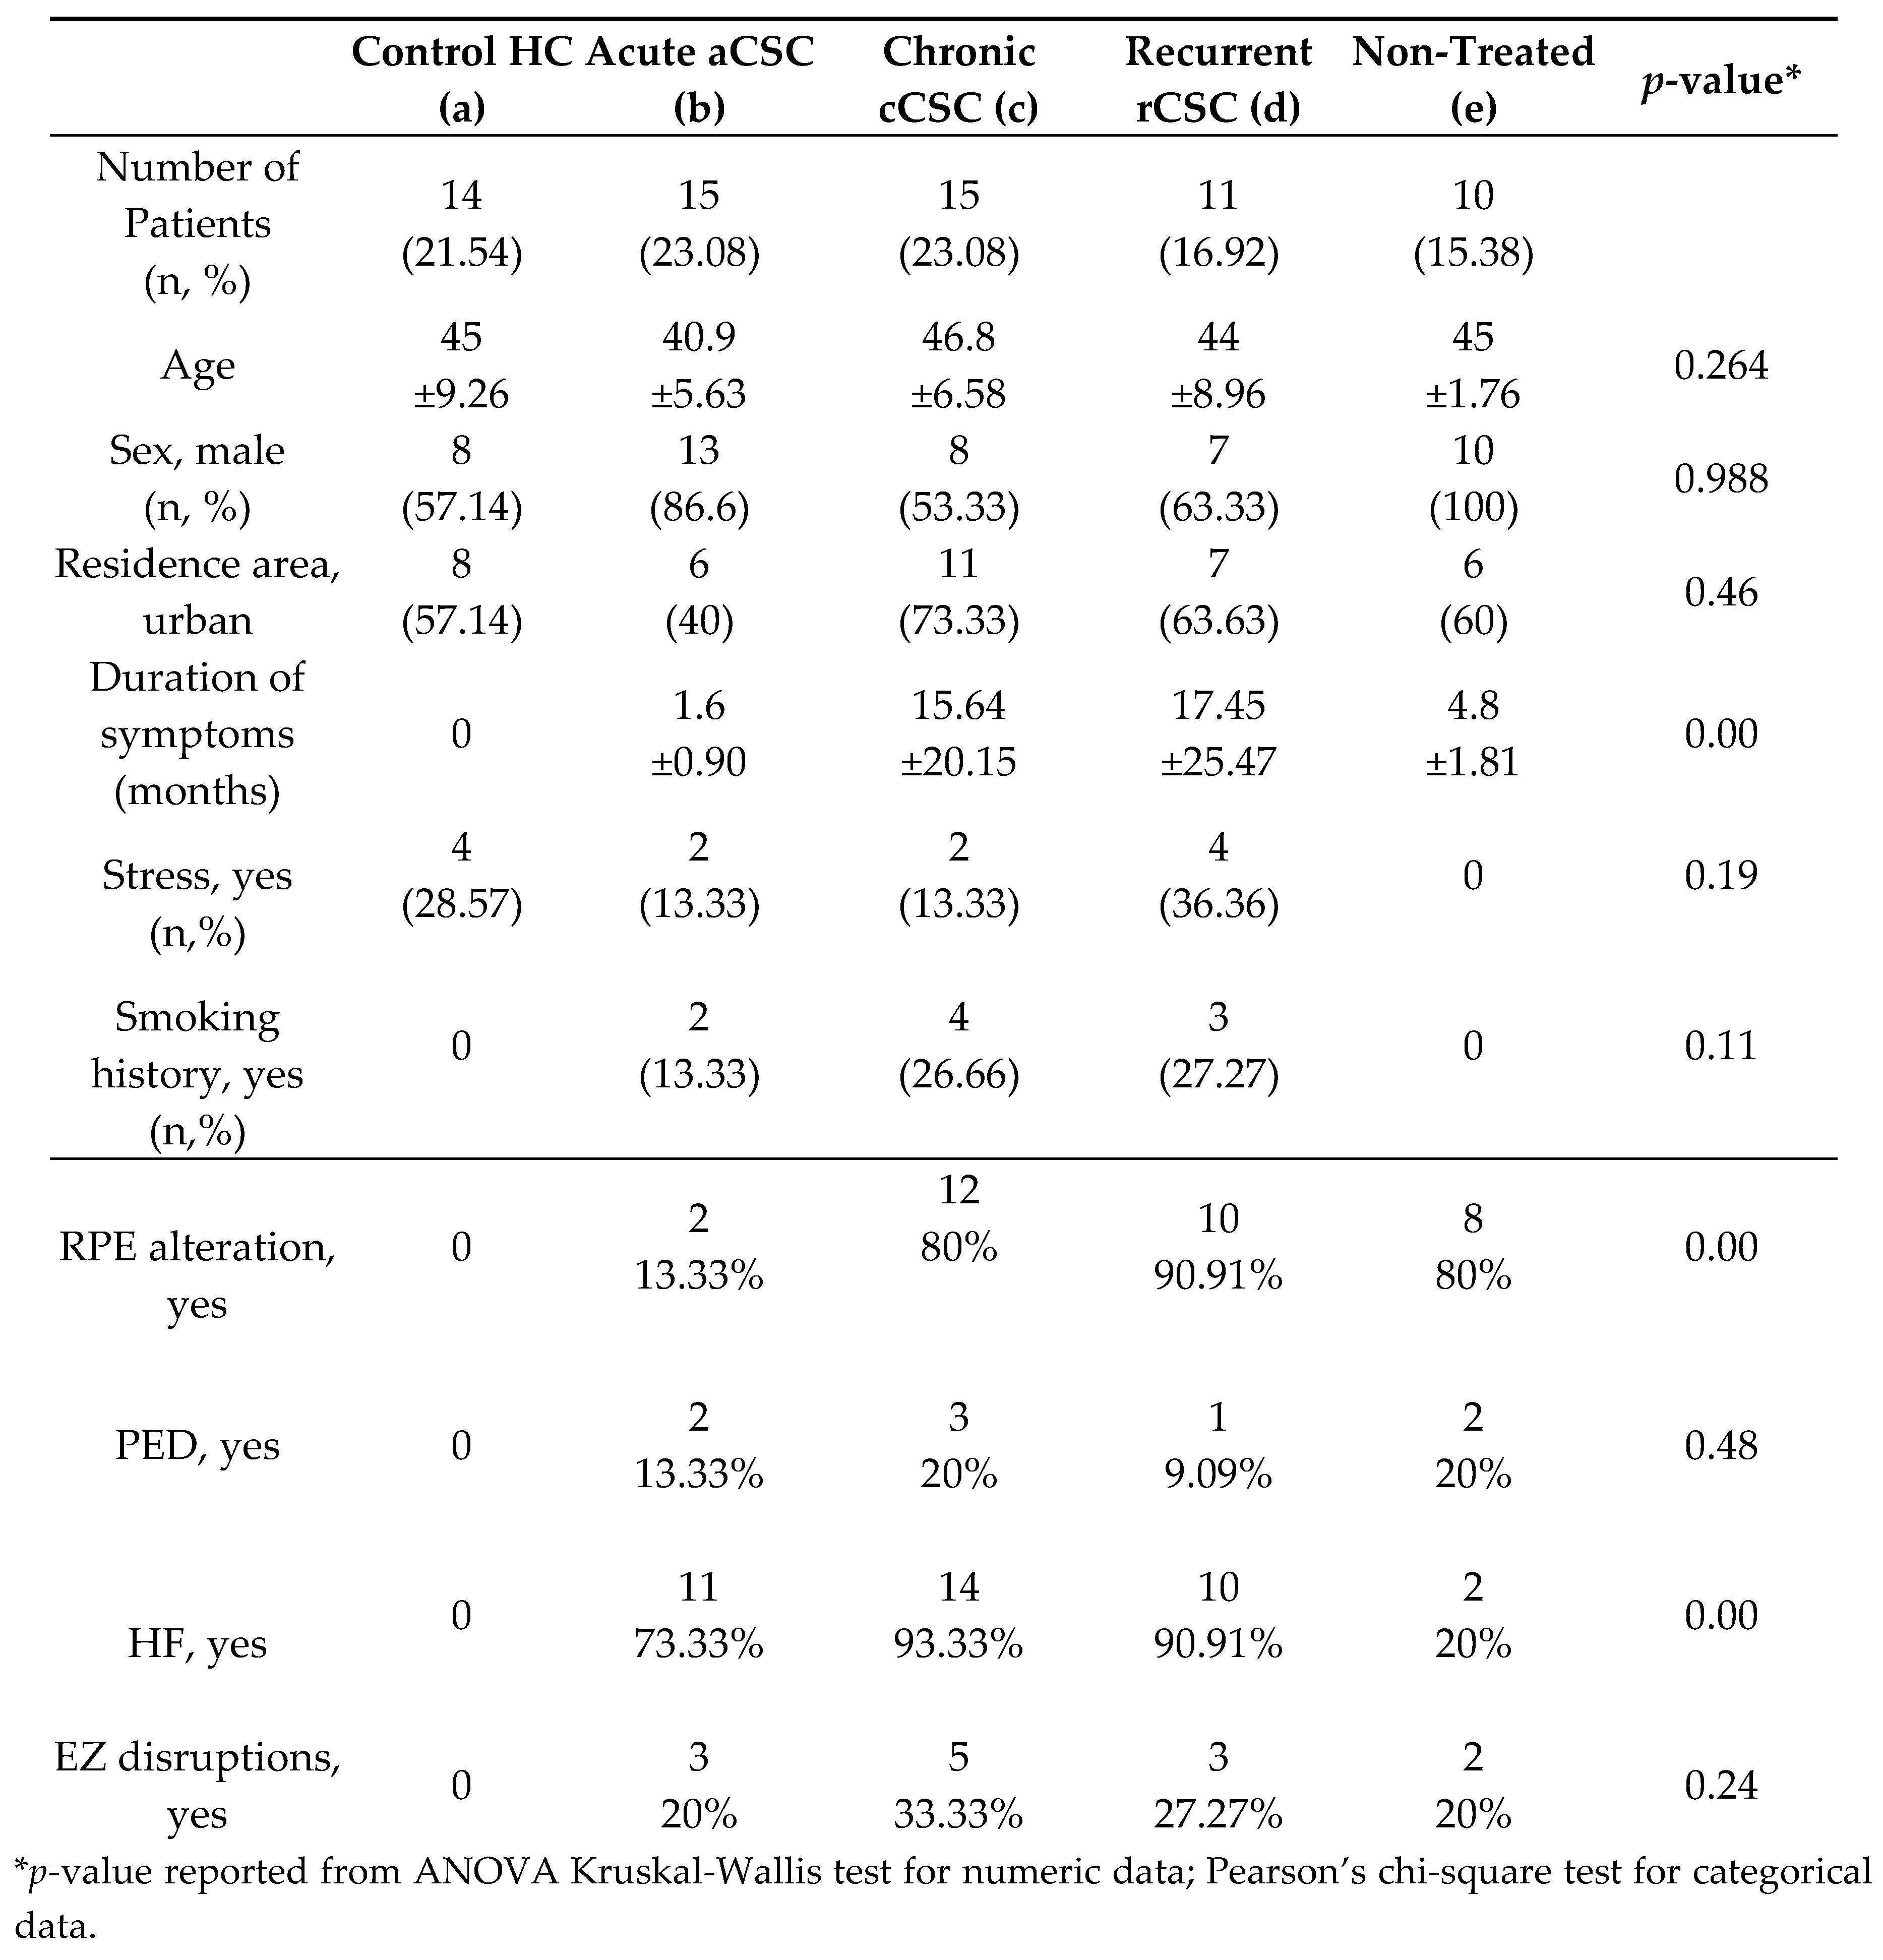
In this retrospective study, we enrolled 6 female and 45 male CSC patients, who underwent panmacular subthreshold micropulse 577 nm (IQ 577; IRIDEX, USA) laser treatment or were only monitored (observed group, n= 10). Based on clinical and multimodal imaging findings, they were divided into acute (aCSC), recurrent (rCSC), and chronic (cCSC) groups (mean age of aCSC 40.9 ± 5.63, rCSC 44 ± 8.96, cCSC 46.8 ± 6.58 and non-treated CSC 45 ± 1.76). The study design Flow Chart is presented in Figure 1.
Concerning age and sex there were no significant differences between the CSC and control groups (p=0.264, p=0.988, respectively).
The inclusion criteria for the CSC group were the presence of an active CSC in one eye, identified as a serous detachment of the neuroretina. This was confirmed through clinical and OCT examination. The fellow non-active eye was also evaluated.
Patients diagnosed with active CSC were categorized into subgroups utilizing criteria established by the Central Serous Chorioretinopathy International Group [7]. However, we modified the criteria by reducing the observation period from 6 to 3 months.
1. Acute CSC (aCSC): First known episode of SRF with a total area of RPE alteration ≤2 DA (disk area) and/or persistent SRF for less than 3 months.
2. Recurrent CSC (rCSC): Presence of SRF with history or sign of resolved episode with a total area of RPE alteration ≤2 DA and/or persistent SRF for less than 3 months.
3. Chronic CSC (cCSC): Presence of persistent SRF > 3 months, with outer retina atrophy including ONL thinning and/or ELM disruption and/or EZ attenuation and total area of RPE alteration > 2 DA or multifocal (including gravitational tract).
We reduced the time to three months to avoid damage to the RPE layer and photoreceptors. Treatment was started when SRF did not resolve, remained stable or increased within the first three months from the beginning of disease. In such cases, delaying treatment for the next three months posed a significant risk of permanent damage to the RPE.
The exclusion criteria from the CSC group were as follows: 1. General vascular and neoplastic disorders (e.g., peripheral artery disease, abdominal aortic aneurysm, carotid artery disease, pulmonary embolism, chronic venous insufficiency, anemia). 2. History of anti-cancer treatment. 3. Debilitating conditions such as chronic alcoholism or drug addiction. 4. Concurrent ocular and retinal disease affecting visual acuity, including diabetic retinopathy, age-related macular degeneration, vitreomacular disorders, presence of profound RPE atrophy in the fovea and cystic degeneration in the macula on structural OCT. 5. Myopia exceeding six diopters due to its significant impact on choroid thickness.
As described later, the health control (HC) group was examined to exclude any ocular diseases. That group included 6 female and 8 male (mean age 45 ± 9.26) healthy volunteers.

2.2. Ophtalmologic examination

All participants, including patients with CSC and healthy individuals, underwent an examination to assess their best corrected visual acuity (BCVA) and fundus ophthalmoscopy at the beginning of the study. Ultra-widefield colour and autofluorescence fundus photography were taken using Optos California (Optos, Inc., Marlborough, MA). Visual acuity was assessed using Snellen charts, which were placed at a distance of 5 meters in a room with standardized illumination. BCVA was measured with the best correction obtained through subjective refraction.
Spectral domain OCT and OCT-angiography (OCT-A) were conducted using Angio Retina QuickVue, Angio Retina, and Cross Line scans (Algorithm Version A2017,1,0,151, Optovue, Inc., Fremont, CA) following pupil dilation. The scans with the highest resolution were acquired in the central 3×3 and 6x6 mm areas, centered on the foveola. Qualitative features and quantitative measures of central retinal thickness (CRT), subfoveal subretinal fluid height (SRF), pigment epithelium detachment (PED), ellipsoid zone disruptions (EZ), alteration in retinal pigment epithelium (RPE), such as disruption or atrophy, and the presence of intraretinal hyperreflective foci (HF) were reviewed and analyzed in the OCT images of all subjects.
Central retinal thickness (CRT) was automatically measured in the central 1.0 mm circle of the EDTRS grid from the inner limiting membrane (ILM) to the outer boundary of the RPE, following a uniform method used in previous studies for result comparison.
SRF height was measured manually in the fovea as the distance between the top of the SRF and the RPE-Bruch’s membrane complex.
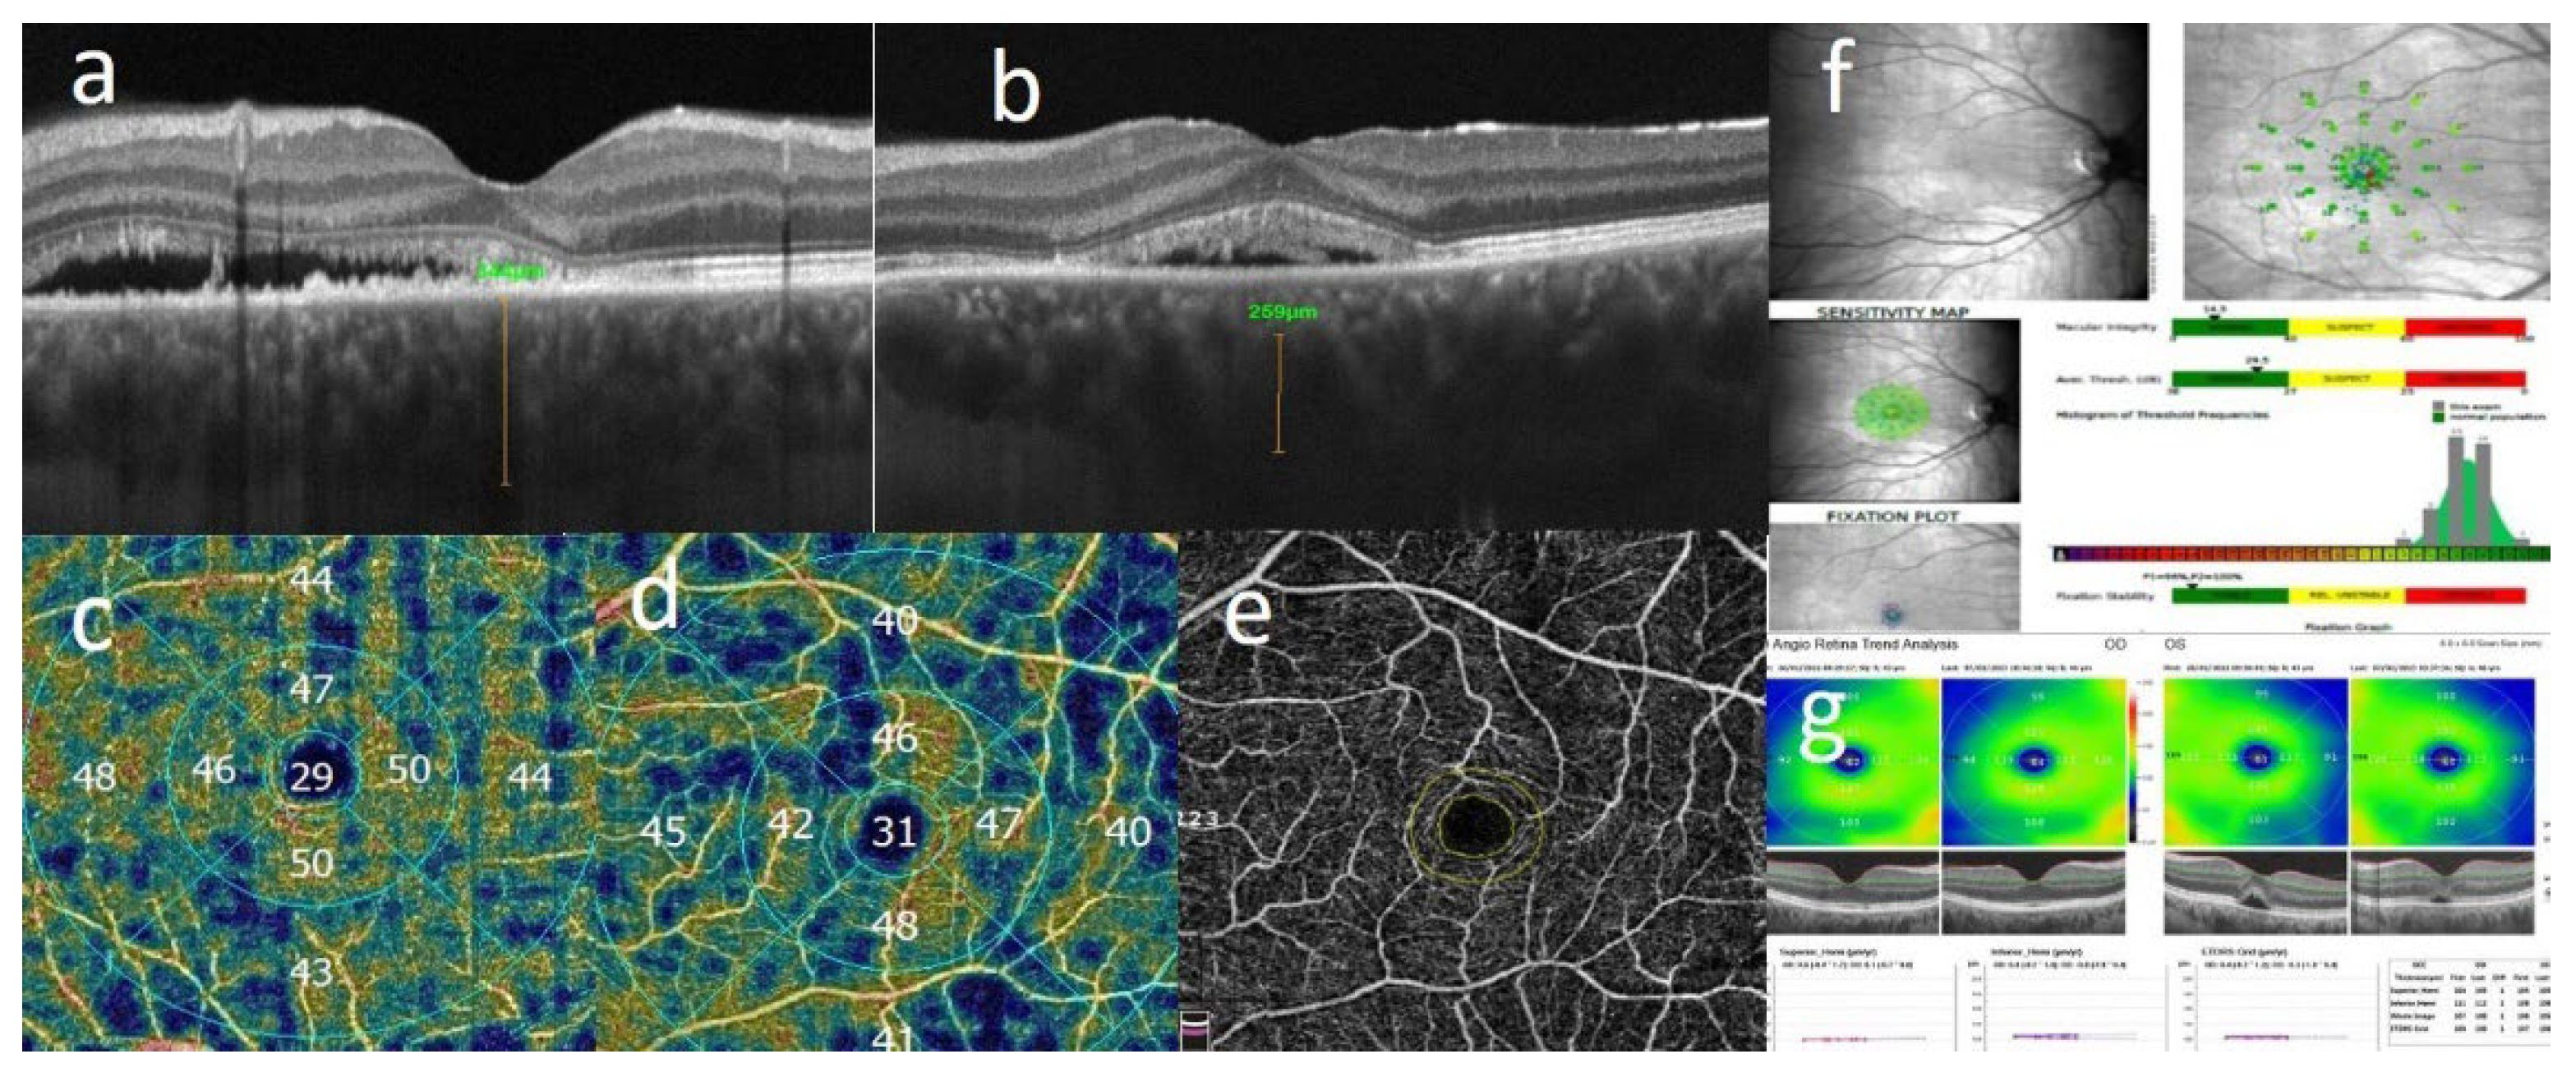
Central choroid thickness (CCT) was manually measured from the outer hyperreflective line corresponding to the RPE-Bruch’s membrane layer to the inner hyperreflective surface of the sclera under the foveal center (Figure 2a). The diameter of the largest visible hyperreflective lumen of the choroid venous (pachyvessel) found on a horizontal Cross-link scan was measured, following the method described by Yang et al. [16] (Figure 2b). These pachyvessels, as per Spaide et al., are formed by the intervortex venous anastomoses primarily located in the central macula in eyes with CSC [17].
The superficial capillary plexus (SVD) was automatically detected between the internal limiting membrane (ILM) and the inner plexiform layer (IPL). In contrast, the deep capillary plexus (DVD) was identified between the IPL and the outer plexiform layer (OPL). Superficial and deep vessel density (VD) were measured automatically using the AngioAnalytics software on the OptoVue system (Version 2017.1.0,151) (Figure 2c,d). Vessel density (VD) was defined as the proportion of the vessel area with blood flow over the total measured area.
The foveal avascular zone (FAZ) was evaluated using the software provided in the OptoVue system (Figure 2e). FAZ was defined as a region within the fovea centralis at the retina’s center devoid of retinal blood vessels.
Mean Retinal Sensitivity (RetSens) was measured by microperimetry using Macular Integrity Assessment microperimeter MAIA II and analyzed as an Average Threshold by analysis software (MAIA II; 2009, CenterVue, Padova, Italy) (Figure 2f).
GCC complex thickness was calculated automatically in superior, inferior hemisphere (SupHem and InfHem) and ETDRS Grid by software built in OptoVue system (Figure 2g).
Researchers evaluated well-established risk factors associated with CSC, such as smoking, stress, steroid use, xylometazoline, phosphodiesterase inhibitor intake, diabetes mellitus, autoimmune diseases, insomnia, and obstructive sleep apnea, through a comprehensive analysis of relevant reports.

2.3. 577 nm Panmacular Micropulse Laser Treatment

The surgeon and the patient collaboratively determined the treatment approach. If SRF persisted, and its height remained unchanged or increased after three months, MPLT utilizing a 577 nm laser (IQ 577; IRIDEX, USA) was performed by the same experienced surgeon on the entire macula within the major vascular arcades (panmacular protocol), including the fovea. The laser foci used had a diameter of 200 µm and were applied in a confluent manner. Consistent laser parameters were used in all eyes, with a duty cycle of 5%, 300 mW, and a duration of 200 ms.
BCVA, GCC, and RetSens were assessed at baseline and two-year follow-up visits. Additionally, CCT, pachyvessel diameter, FAZ, and measurements of the superficial and deep vascular retinal plexus were compared between CSC patients and healthy individuals. Fundus autofluorescence (FAF) was performed after each laser session to assess the safety of panmacular micropulse laser treatment.

2.4. Statistical analysis

Statistical analyses were performed using PQStat software (2021, PQStat v.1.8.2.208), while figures were generated using GraphPad Prism 8.4.3 (GraphPad Software, Inc., Sand Diego, CA, USA). Normality of data distribution was assessed using the Shapiro-Wilk test (p<0.05). Differences between sampling periods within the same object were assessed using the Wilcoxon matched-pairs signed rank test (p<0.05). In addition, the ANOVA Kruskal-Wallis test, followed by the Conover-Iman post-hoc test, was used to determine the significance of the differences between objects within the same period. Spearman’s correlation coefficients were calculated to evaluate the relationship between the parameters evaluated.

3. Results

Primary outcomes

3.1. The baseline characteristic of the groups

Demographic and clinical data of CSC and HC groups are presented in Table 1.

3.2. Resolution of SRF after panmacular MPLT laser treatment

After panmacular MPLT laser treatment, complete resolution of SRF was observed in all aCSC patients (100%), 13 out of 15 cCSC patients (86.66%), and 7 out of 11 rCSC patients (63.63%). In the aCSC group, the patients received an average of one laser treatment, ranging from one to three. On the other hand, the cCSC and rCSC groups had an average of 2.8 treatments, ranging from one to eight. Notably, nine aCSC patients, eight cCSC, and six rCSC required only a single laser treatment. However, five and four cases, required more than three laser sessions in the cCSC and rCSC groups.
Although one patient with cCSC and rCSC required eight laser treatments over two years, a complete fluid resolution was not achieved in these cases. In the case of the patient with rCSC, recurrence occurred during a period of significant personal stress, namely a divorce, while undergoing treatment for vitiligo of the skin. The patient with cCSC was engaged in shift work combined with physical exertion. It is important that both patients had CCT exceeding 450 µm and pachyvessel diameters exceeding 250 µm. Treatment maintained final BCVA at 1.0 and 0.8, and RetSen at 27.4 dB and 24.6 dB, respectively.

3.3. Functional parameters

3.3.1. BCVA- Best Corrected Visual Acuity

The improvement in BCVA in all treated patients was statistically significant. Patients with aCSC and rCSC, with thicker CCT and larger pachyvessel diameter, showed similar improvement in mean BCVA by 2.3 lines. In contrast, cCSC patients and non-treated CSC, who had thinner CCT, showed better improvement in mean BCVA by 2.6 lines. However, neither the baseline nor the final BCVA correlated with CCT at baseline or after the two-year follow-up. Conversely, baseline BCVA exhibited a negative correlation with pachyvessel diameter, but this relationship was not observed after the two-year follow-up period. However, baseline BCVA is a good predictor of final BCVA; the same applies to baseline RetSens and final RetSens. There was a strong association between them (Spearman rank 0.516).
In the baseline analysis, there were significant differences in BCVA between rCSC and non-treated CSC, aCSC and HC (mean 0.49±0.17 vs 0.72±0.23, p=0.02, and vs 0.74±0.24 p=0.004, or vs 1.0, p=0.000, respectively) (Figure 3a).
After two years, the differences in BCVA between the rCSC group and the non-treated and aCSC groups were even more significant (mean 0.71±0.3 vs 0.98±0.04, p=0.000 and vs 0.97±0.09, p=0.000). Moreover, a significant difference was observed between aCSC and cCSC (mean 0.97±0.09 vs 0.82±0.27, p=0.017) (Figure 3a). Additionally, cCSC had significantly lower BCVA than non-treated CSC (0.82±0.27 vs 0.98±0.04, p=0.043).
The worst BCVA was observed in rCSC patients at baseline and after two-years.
Over two years, the most significant change in BCVA occurred in the cCSC group (change from mean 0.56±0.28 to 0.82±0.27, p=0.003) and aCSC group (change from mean 0.74±0.24 to 0.97±0.09, p=0.004). In the other groups, the change in BCVA was less significant, except in the HC group, where it did not change (Figure 3a).

3.3.2. Microperimetry- Retinal Sensitivity (RetSens)

Retinal sensitivity also improved in all treated and untreated CSC patients after two years. However, the most significant improvement was observed in patients of the aCSC group, with an average increase of 5 dB. In comparison, cCSC and non-treated patients experienced an average improvement of 3.8 dB and 2.84 dB, respectively. On the other hand, the rCSC group showed only a marginal improvement of 1.7 dB, which was not statistically significant. Moreover, those patients had the lowest RetSens at baseline and after two years of follow-up but without statistical significance.
The baseline analysis indicated no significant difference in RetSens among the groups. However, the non-treated group showed the highest mean RetSens value, followed by aCSC, cCSC, and the lowest observed in rCSC (mean 25±3.66 dB, 23.19±3.06 dB, 22.34±5.77 dB, and 22.17±2.81 dB, respectively) (Figure 3b).
After two years, RetSens changed significantly for aCSC, cCSC and non-treated CSC (change from mean 23.19±3.06 to 28.37±2.09 dB with p=0.000, and 22.34±5.77 to 26.22±6.36 dB with p=0.014, and 25±3.66 to 28.12±1.8 dB with p=0.012, respectively). Moreover, a significant difference was noted between the rCSC group and both aCSC and non-treated CSC (mean 23.89±4.5 dB vs 28.37±2.09 dB, p=0.018 and vs 28.12±1.8 dB, p=0.034, respectively). Although the aCSC patients treated with panmacular MPLT demonstrated the highest mean RetSens than the other groups, this difference did not reach statistical significance. However, RetSens also changed the most for aCSC. Conversely, individuals with rCSC consistently exhibited the lowest values at baseline and after the two-year follow-up, with a minor change in RetSens that did not reach significance (Figure 3b).

3.4. Morphological parameters

3.4.1. CRT- Central Retinal Thickness

At baseline, the average CRT was significantly higher between aCSC and rCSC or non-treated CSC (mean 459.53±92.87 µm vs 356.82±120.26 µm, p=0.004 and vs 352.4±67.84 µm, p=0.006) (Figure 3c).
After two years, all patients had experienced a significant decrease in CRT compared to the baseline, including HC. The aCSC and cCSC groups showed the most substantial reduction in CRT (change from mean 459.53±92.87 µm to 260.53±42.45 µm and 403.4±140.37 µm to 217.8±40.78 µm, with p=0.000 for both). The change of CRT for rCSC and non-treated groups was relatively more minor (from mean 356.82±120.26 µm to 203.27±58.76 µm, p=0.002 and from 352.4±67.84 µm to 218.6±33.26 µm, p=0.004, respectively). The HC group observed the most minor change (from mean 268.43±13.35 µm to 271.64±12.26 µm, p=0.029) (Figure 3c).
After two years, analysis of the difference among the affected CSC groups revealed significantly thinner CRT for the cCSC, rCSC, and non-treated groups than aCSC (mean 217.8±40.78 µm, and 203.27±58.76 µm, and 218.6±33.26 µm vs 260.53±42.45 µm, p=0.002, p=0.001 and p=0.006, respectively) (Figure 3c).

3.4.2. GCC- Ganglion Cell Complex Thickness

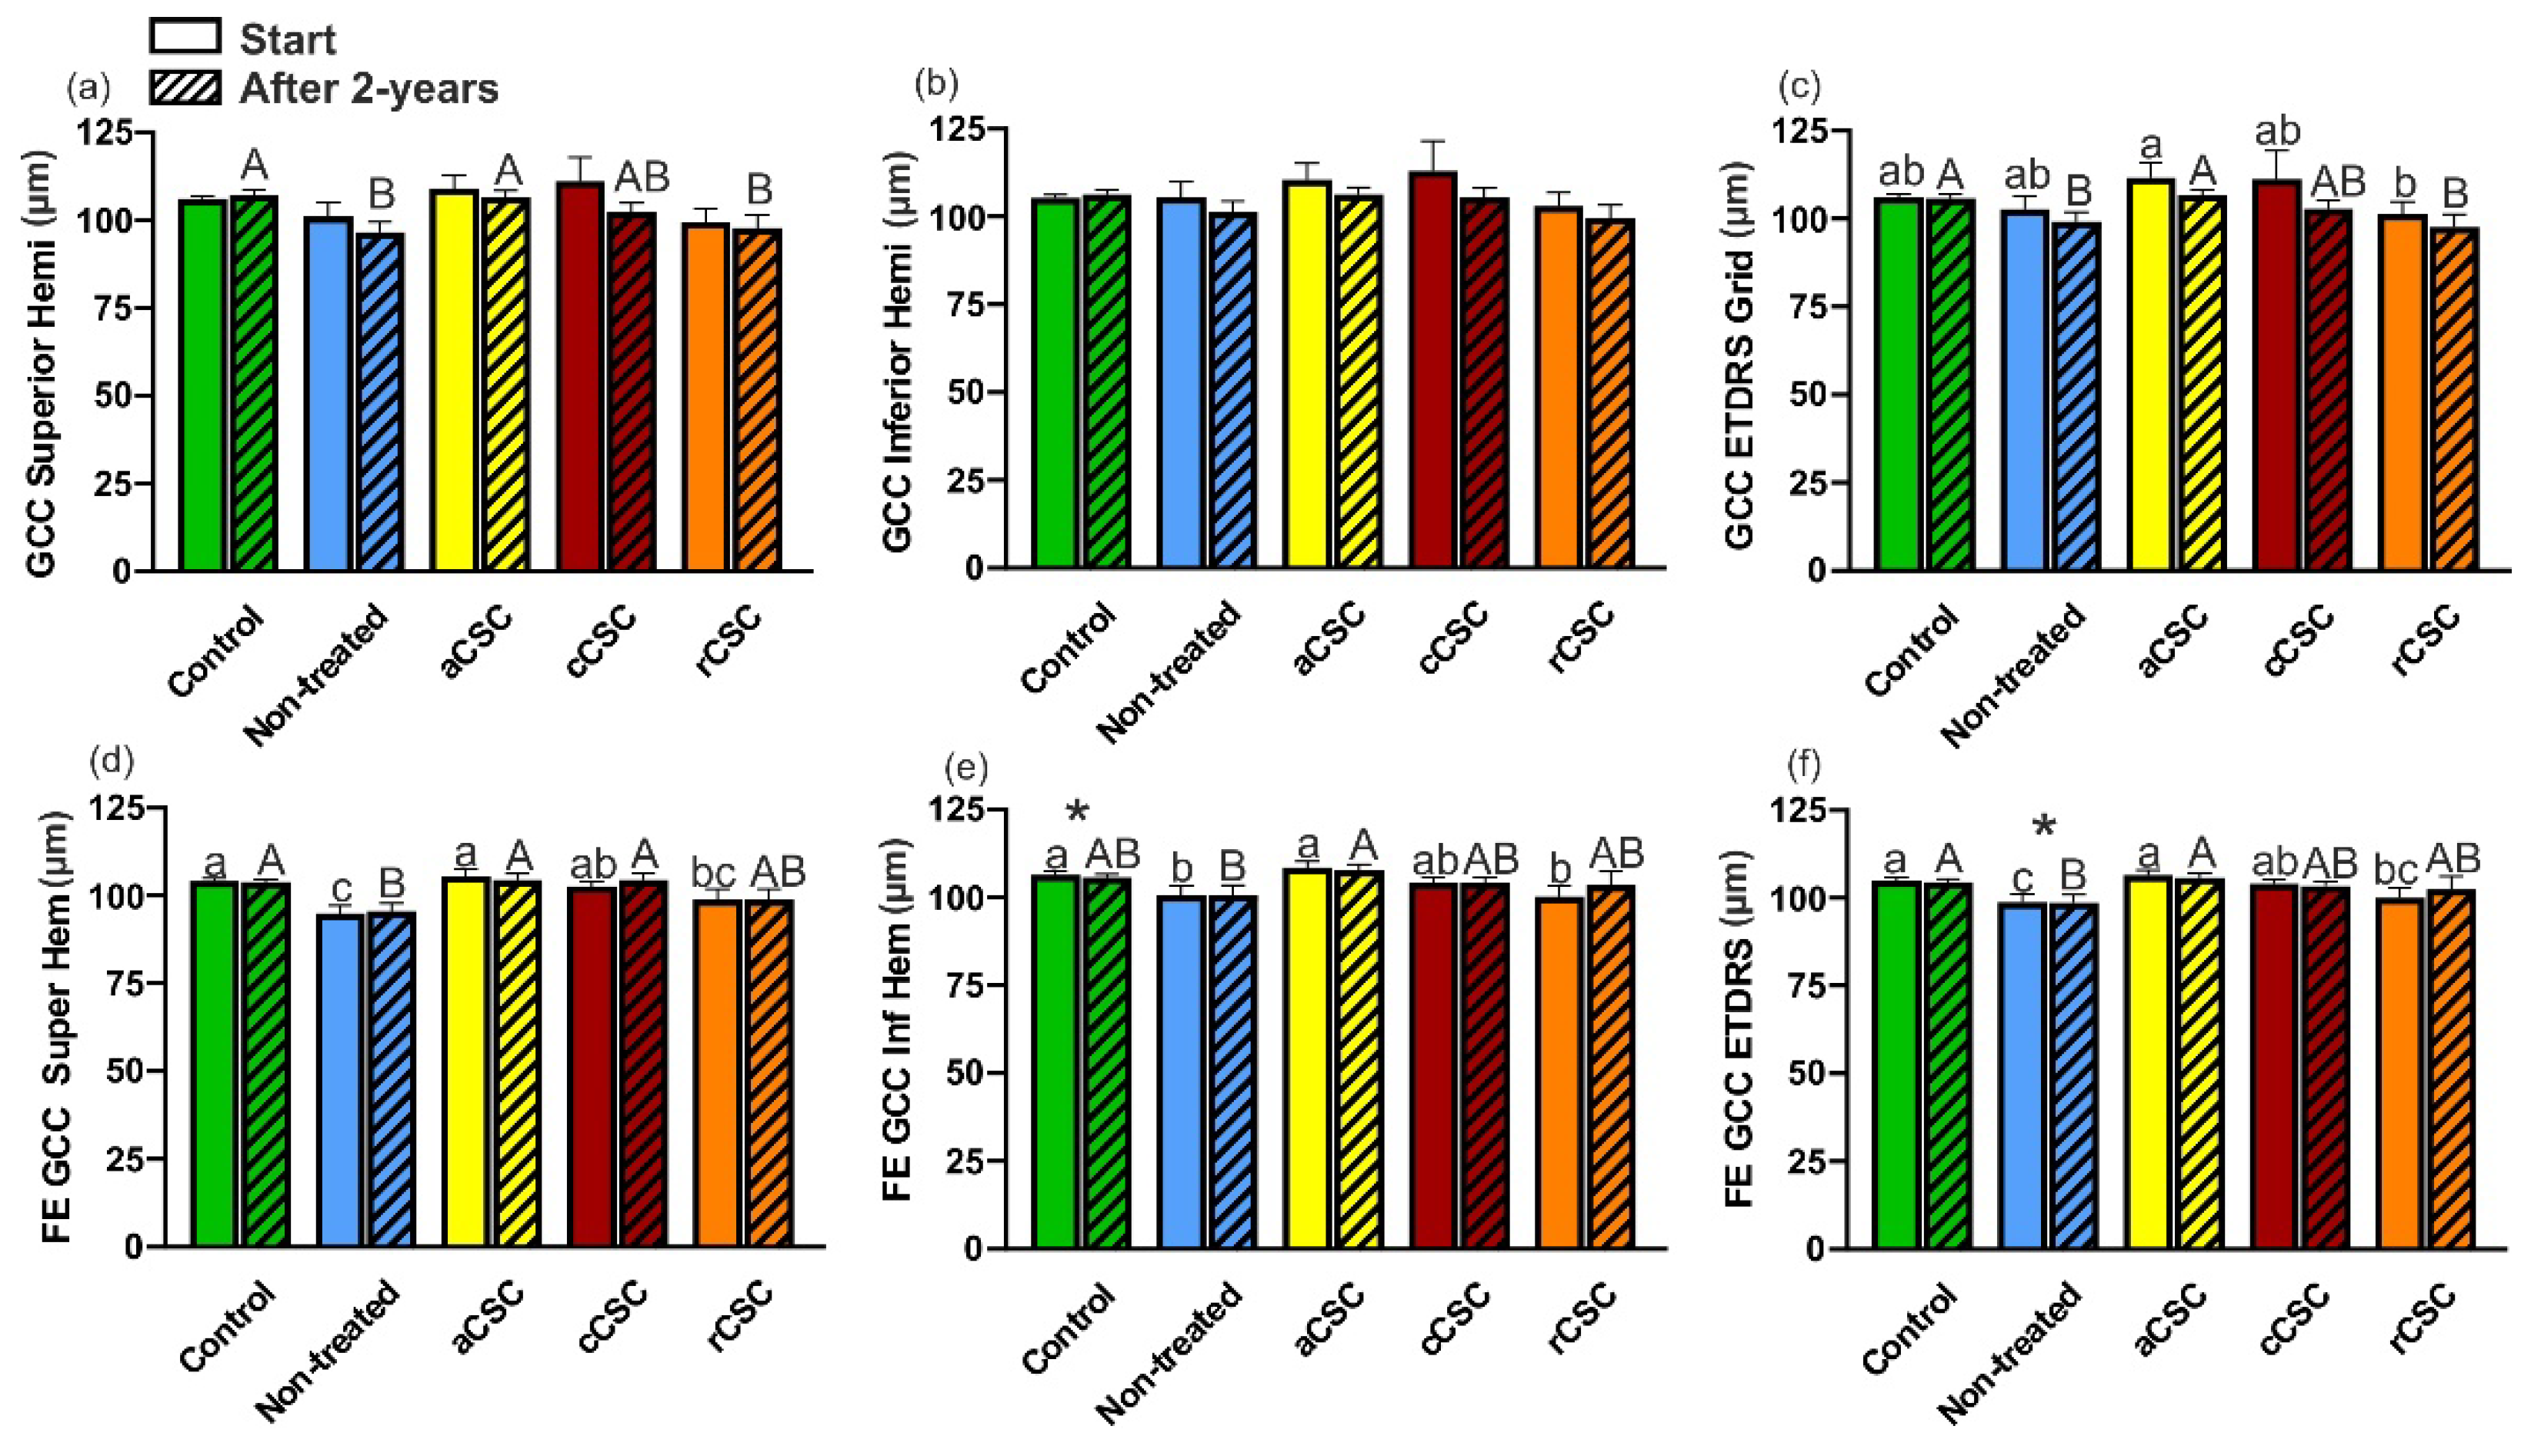
At baseline, GCC ETDRS Grid thickness analysis showed significant differences between aCSC and rCSC (mean 111.67±17.12 µm vs 101.45±11.5 µm, p=0.028) (Figure 4c).
Also, after two years, this difference of GCC ETDRS Grid was significant (mean 106.73±6.06 µm vs 97.64±12.13 µm, p= 0.018). Additionally, aCSC significantly differed from the non-treated group (mean 106.73±6.06 µm vs 105.93±3.97 µm, p=0.033) (Figure 4c). Furthermore, after two years, there was a significant difference in GCC SupHem between aCSC and non-treated CSC or rCSC (mean 106.47±7.44 µm vs 107.21±5.39 µm, p= 0.009 and vs 97.73±12.55, p= 0.035) (Figure 4a).
For fellow eye, significant differences occurred at baseline in superior and inferior hemispheres and ETDRS Grid areas between aCSC and non-treated CSC or rCSC (mean 105.6±7.68 µm vs 95.1±6.61 µm, p=0.000 and vs 98.91±9.96 µm, p=0.010 in SupHem, and mean 108.47±6.78 µm vs 100.6±8.55 µm, p=0.013 and vs 100.6±8.55 µm, p=0.006 in InfHem, and mean 106.53±5.46 µm vs 98.8±7.13 µm, p=0.005 and vs 98.8±7.13 µm, p=0.009 in ETDRS) (Figure 4d–f). Furthermore, cCSC significantly differed from non-treated in the GCC SupHem and ETDRS Grid (mean 102.8±5.2 µm vs 95.1±6.61 µm with p=0.006 and mean 104.13±4.96 µm vs 98.8±7.13 µm with p=0.046) (Figure 4d,f).
After two years, there were fewer significant differences for fellow eyes. Only aCSC significantly differed from non-treated CSC in the SupHem and ETDRS Grid (mean 104.53±6.65 µm vs 95.7±6.77 µm with p=0.005 and 105.8±5.49 µm vs 98.7±7.3 µm with p=0.015, respectively), and cCSC differed from non-treated CSC in SupHem (mean 104.53±7.28 µm vs 95.7±6.77 µm with p=0.008) (Figure 4d,f).
Interestingly, the lowest GCC values in all areas were consistently observed in the affected eyes of rCSC patients at baseline and after two years of follow-up. However, this difference did not reach statistical significance. In all observed groups, the change after two years was not significant for the affected and fellow eye.

3.4.3. CCT- Central Choroidal Thickness

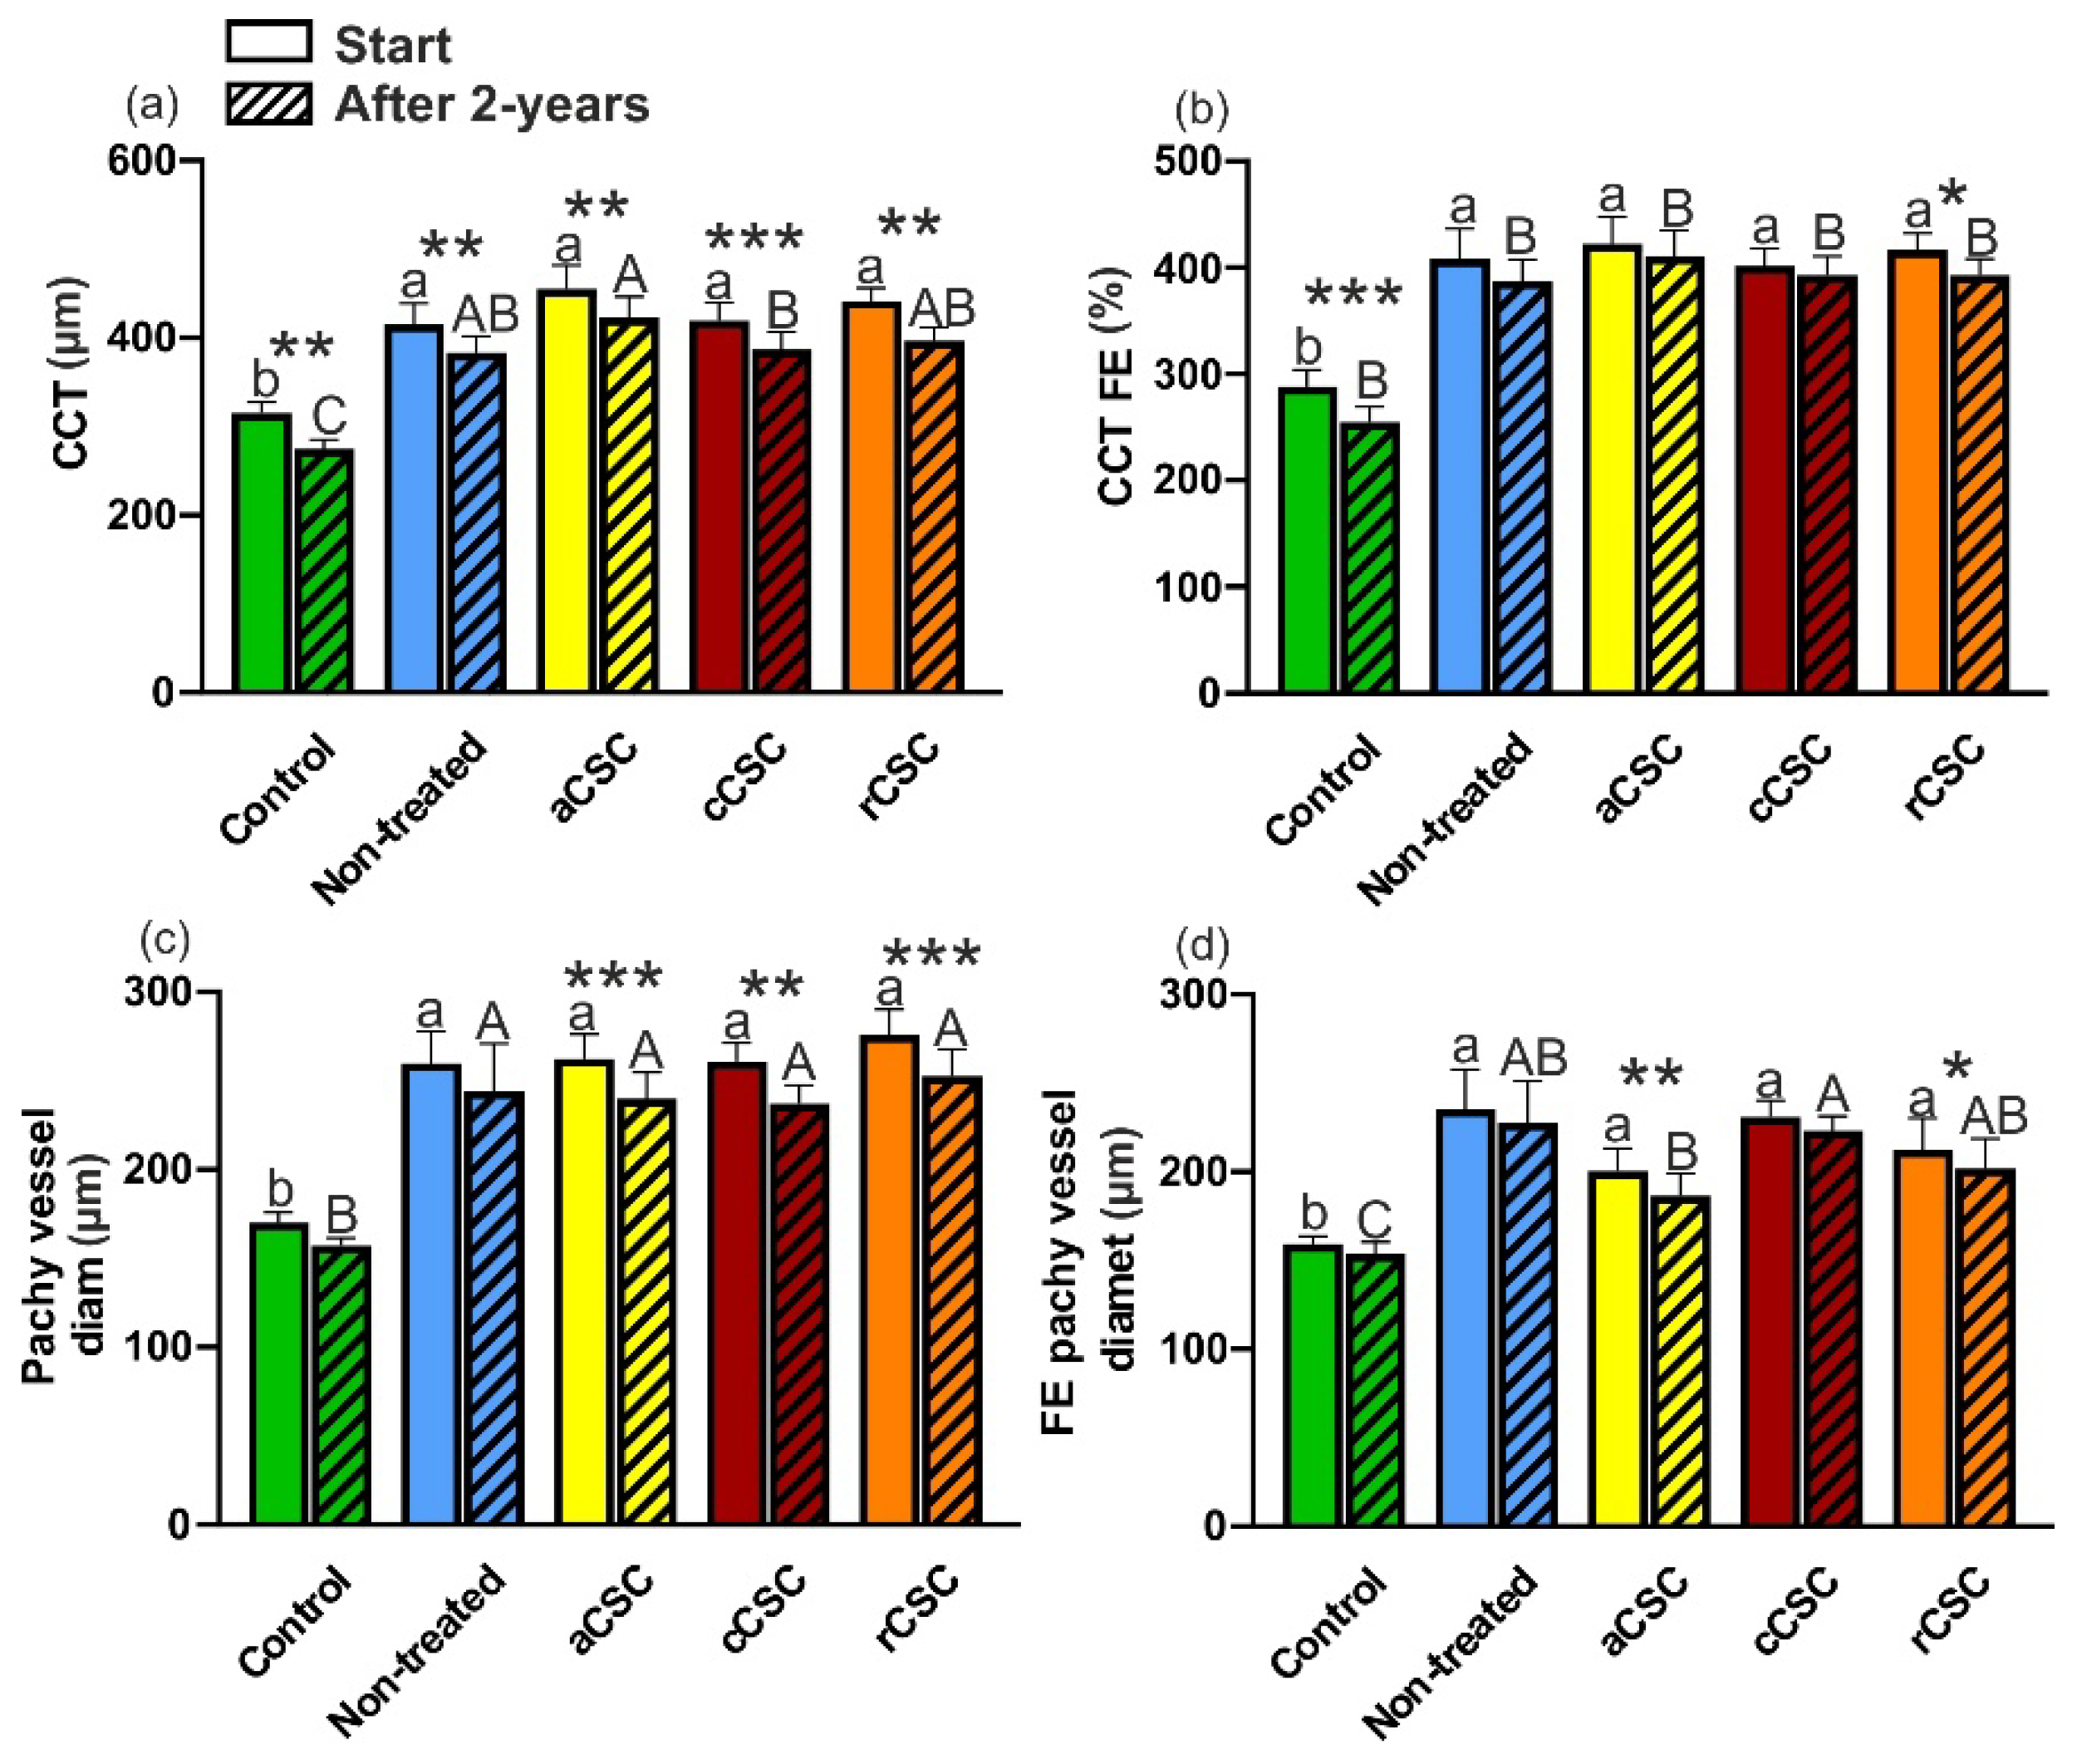
At the baseline, the average CCT was the thickest in aCSC, rCSC and non-treated CSC (mean 455.47±102.19 µm, 441.64±48.33 µm and 415.4±74 µm, respectively) (Figure 5a).
After two years, CCT decreased significantly in all groups. The most substantial change was found in cCSC and HC (change from mean 411.64±73.49 µm to 386.79±75.13 µm, p=0.000 and 315.14±45.88 µm to 274.93±38.59 µm, p=0.001, respectively). A minor difference was observed in aCSC and non-treated CSC (change from mean 455.47±102.19 µm to 422.8±91.55 µm, and 415.4±74 µm to 383.4±57.55 µm, p= 0.005 for both). Still, the thickest CCT was found in aCSC, followed by rCSC and non-treated CSC (mean 422.8±91.55 µm, 396.64±48.85 µm and 383.4±57.55 µm). Among patients there were significant differences between aCSC and cCSC (mean 422.8±91.55 µm vs 386.79±75.13, p= 0.046) (Figure 5a).
Considering the fellow eye, at the baseline, we found the thickest CCT in aCSC, followed by rCSC and non-treated CSC (mean 422.27±98.39 µm, 416.27±53.52 µm and 408.2±88.95 µm). After two years, the most significant change was noticed in cCSC and HC (change from mean 411.64±73.49 µm to 386.79±75.13 µm, p= 0.000 and 315.14±45.88 µm to 274.93±38.59 µm, p=0.001, respectively). There were no significant differences between groups at baseline or after two years.

3.4.4. Pachyvessel diameter

At baseline, all CSC patients had a significantly larger pachyvessel diameter than the HC group (Figure 5b). The largest diameter was found in rCSC patients, followed by aCSC, cCSC and non-treated patients, but without any statistical significance (mean 275.82±47.6 µm, 262.27±53.51 µm, 260.93±40.41 µm and 259.8±56.88 µm, respectively).
After two years, a significant change in pachyvessel diameter occurred in aCSC, rCSC and cCSC patients (change from mean 262.27±53.51 µm to 239.8±57.02 µm, p=0.000, and from 275.82±47.6 µm to 252.64±49.55 µm, p=0.000, and from 260.93±40.41 µm to 237.13±40.83 µm, p=0.007, respectively). In the untreated and HC groups, the change in diameter of the pachyvessel was insignificant. Still, the largest pachyvessel was found in rCSC (mean 252.64±49.55 µm). Among CSC patients, differences did not reach statistical significance (Figure 5b).
In the fellow eye, the diameter of the pachyvessel was smaller in all subjects compared to eyes with active CSC. Additionally, the most extensive pachyvessel diameter distribution differed among the groups compared to active CSC eyes. The non-treated CSC group had the largest pachyvessel diameter, followed by cCSC, rCSC, and finally aCSC (mean 235.4±70.41 µm, 230.93±36 µm, 212.27±59.57 µm, and 200.33±49.52 µm, respectively) (Figure 5c). Upon the two-year follow-up, a significant reduction in diameter was observed only in the aCSC and rCSC groups (change from mean 200.33±49.52 µm to 186.33±48.99 µm, p=0.005, and from 212.27±59.57 µm to 201.91±55.73 µm, p=0.038, respectively). Among patients, cCSC had significantly larger pachyvessel compared to aCSC (mean 223.07±31.86 vs 186.33±48.99 µm, p=0.034) (Figure 5c).
It is important to note that the aCSC and cCSC groups had a larger pachyvessel diameter than the non-treated group before the panmacular MPLT treatment. However, after two years, the diameter was smaller in the treated groups compared to the non-treated group, but that difference did not reach statistical significance.

3.4.5. Superficial and Deep Vascular Plexus

Superficial Vessel Density
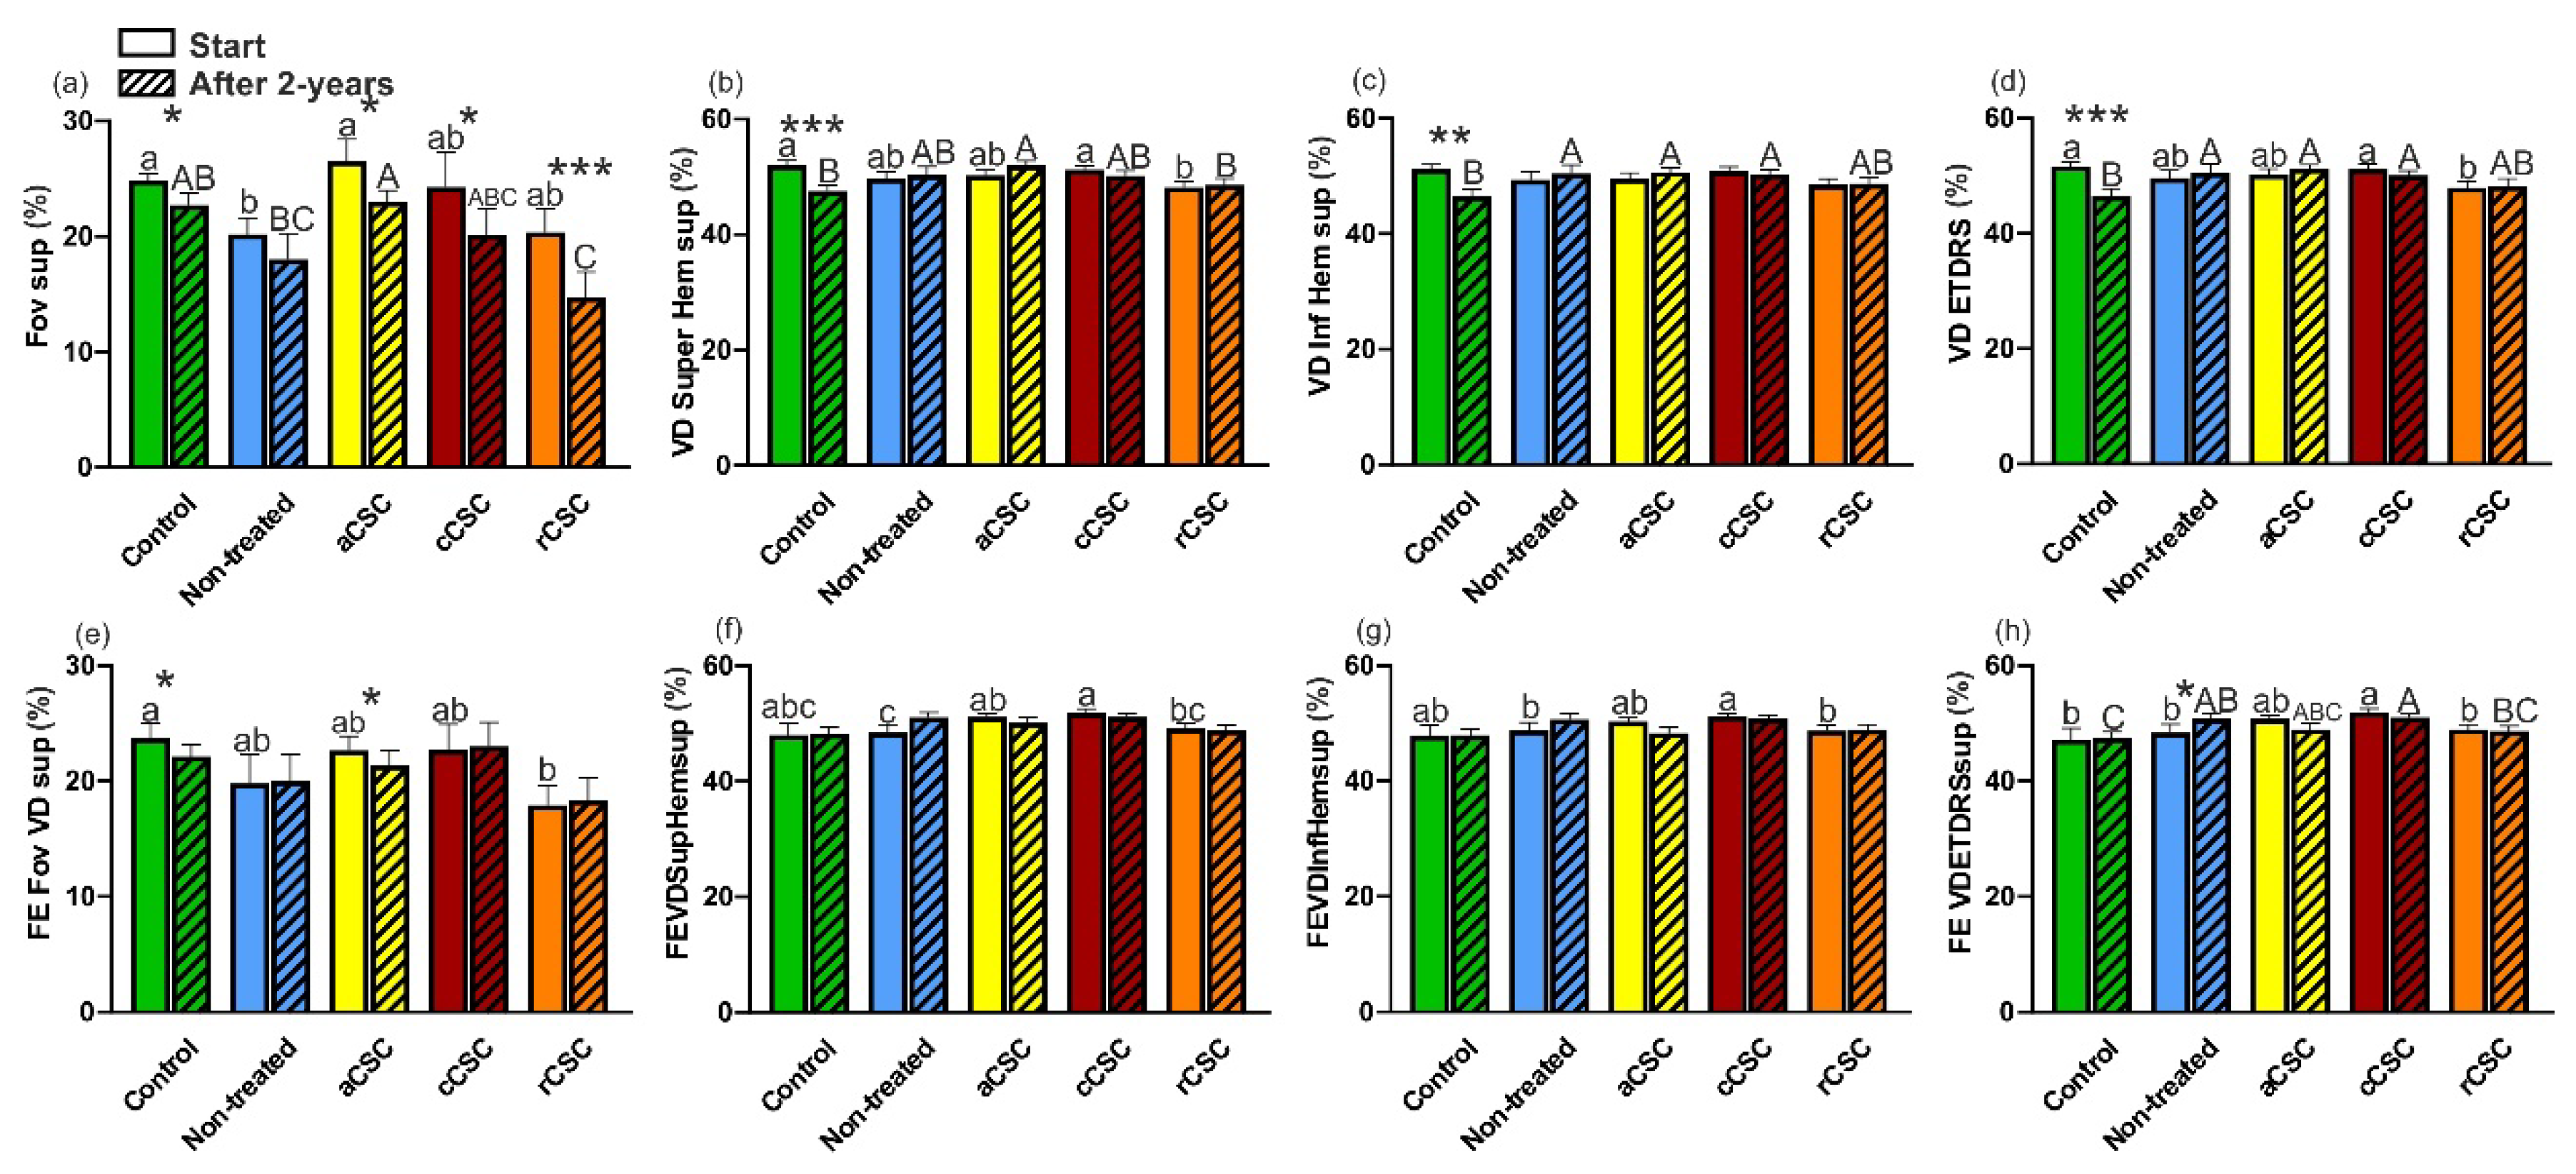
All groups had similar baseline superficial Fovea VD of the affected eye except aCSC which differed significantly from non-treated CSC (mean 26.53±7.3% vs 24.86±2.18%, p=0.031) (Figure 6a). Additionally, non-treated CSC differed significantly from HC (mean 20.2±4.44% vs 24.86±2.18%, p=0.020). However, after two years, VD significantly decreased in the Fovea in all groups, including HC, except non-treated CSC (change from mean 24.86±2.18% to 22.71±3.87%, p=0.022 in HC, from mean 26.53±7.3% to 23±3.82%, p= 0.010 in aCSC, from mean 24.27±11.6% to 20.13±8.62%, p=0.030 in cCSC, and from mean 20.36±6.62% to 14.73±7.21%, p=0.000 in rCSC). The non-treated CSC group had the lowest Fovea VD at baseline (mean 20.2±4.44%), but after two years, the rCSC group (mean 14.73±7.21%) had the lowest VD in the Fovea, but those differences did not reach statistical significance. After two years, aCSC significantly differed from rCSC and non-treated CSC (mean 23±3.82% vs 14.73±7.21%, p=0.002, and vs 18±7.18%, p=0.042, respectively) (Figure 6a).
In the affected eye, in any CSC group, VD of the SupHem, InfHem, and the ETDRS did not change significantly over two years (Figure 6b–d). However, cCSC initially significantly differed from rCSC in SupHem and ETDRS VD (51.2±3.04% vs 48.18±3.61%, p=0.042, and 51.17±3.31% vs 47.96±3.76%, p=0.022). Additionally rCSC had significantly minor VD compared to HC in SupHem and ETDRS (mean 48.18±3.61% vs 52.01±3%, p=0.008 in SupHem, and 47.96±3.76% vs 51.65±3.06%, p=0.017 in ETDRS).
After two years, there were significant differences between aCSC and rCSC or HC in the VD of the SupHem (mean 52.03±2.81% vs 48.59±3.75%, p=0.041 or 47.54±3.63%, p=0.003, respectively). Interestingly, over two years, HC showed a significant change in vessel density in the Fovea, SupHem, InfHem, and ETDRS. Moreover HC differed significantly from non-treated CSC, aCSC and cCSC in the InfHem and ETDRS (p=0.009, p=0.004 and p=0.017 in InfHem and p=0.013, p=0.002 and p=0.040 in ETDRS) (Figure 6c,d).
In the fellow eye, there was a significant difference in the Fovea VD between rCSC and HC at baseline (mean 17.91±5.68% vs 23.71±4.89%, p=0.021). Fovea VD decreased significantly over two years in aCSC and HC (change from mean 22.67±4.75% to 21.4±4.75%, p=0.04, and from mean 23.71±4.89% to 22.14±3.82%, p=0.02) (Figure 6e).
However, ETDRS VD increased significantly in non-treated CSC (change from mean 48.42±4.53% to 50.9±2.99%, p=0.036) (Figure 6h). In baseline analysis, cCSC differed significantly from non-treated CSC or rCSC in SupHem, InfHem and ETDRS (51.89±2.61% vs 48.46±4.33%, p=0.004 in SupHem, and 51.21±2.05% vs 48.78±4.2%, p=0.018 in InfHem, and 51.98±2.23% vs 48.42±4.53%, p=0.002 in ETDRS, or vs 49.19±2.58%, p=0.019 in SupHem, and vs 48.75±3.09%, p=0.029 in InfHem, and vs 48.96±2.89%, p=0.005 in ETDRS, respectively) (Figure 6f–h). In contrast, a significant difference was found between aCSC and non-treated CSC in SupHem (mean 51.17±2.31% vs 48.46±4.33%, p=0.046) at baseline (Figure 6f).
After two years, only cCSC differed significantly from rCSC in ETDRS among CSC patients (mean 51.01±2.3% vs 48.66±3.04%, p=0.048). Moreover cCSC and non-treated CSC differed significantly from HC (mean 51.01±2.3% vs 47.46±4.18%, p=0.010, and 50.9±2.99% vs 47.46±4.18%, p=0.020, respectively).
Deep Vessel Density
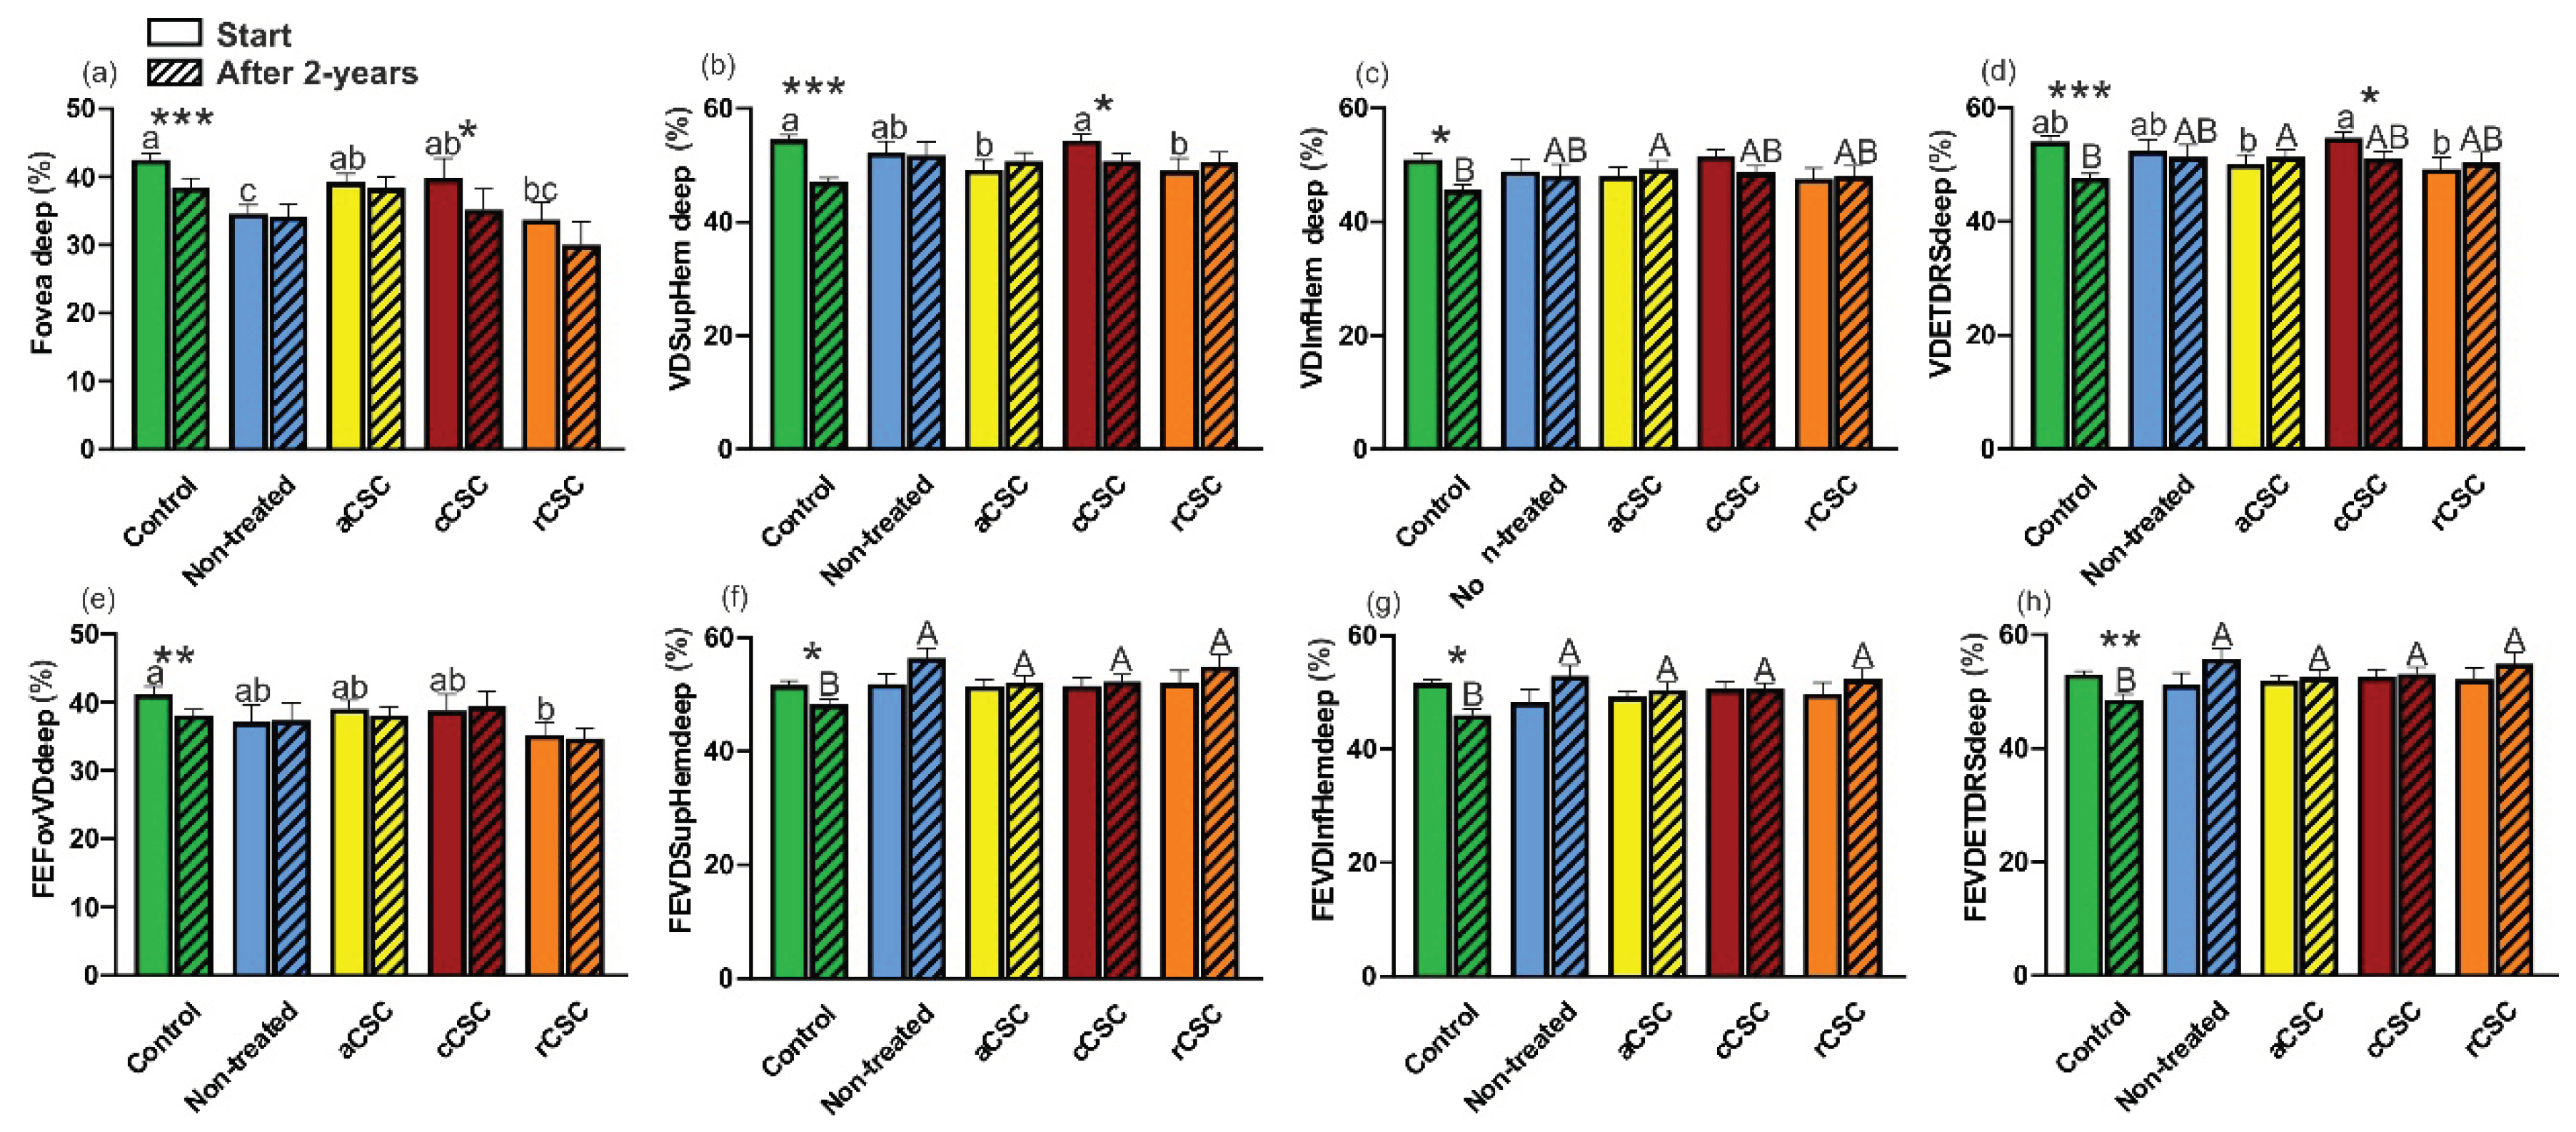
Significant decrease was observed in the deep plexus of the Fovea and SupHem over two years in both HC and cCSC patients (change from mean 42.5±3.5% to 38.43±5.2%, p= 0.000 and 39.87±11.13% to 35.2±11.68%, p=0.012 for the Fovea, and 54.55±3.06% to 47.12±2.72%, p= 0.001 or from 54.43±4.09% to 50.73±5.1%, p= 0.036 for the SupHem, respectively) (Figure 7a,b).
At baseline analysis of the Fovea, non-treated CSC differed significantly from HC, aCSC and cCSC (mean 34.6±4.14% vs 42.5±3.5%, p=0.001, or vs 39.22±4.96%, p=0.047, or vs 39.87±11.13%, p=0.032, respectively) (Figure 7a). Additionally, rCSC differed significantly from HC (mean 33.73±8.58% vs 42.5±3.5%, p=0.002) (Figure 7a). Moreover, the lowest vessel density was observed in rCSC (Figure 7a).
During the baseline analysis, significant differences were noted between aCSC and cCSC in SupHem and ETDRS (mean 49.24±6.47% vs 54.43±4.09%, p=0.011 and 50.15±6.29% vs 54.75±4.01%, p=0.028, respectively) (Figure 7b,d). Similarly, cCSC showed significant differences from rCSC in SupHem and ETDRS (mean 54.43±4.09% vs 49.05±7.18%, p= 0.025 and 54.75±4.01% vs 49.22±6.88%, p=0.021, respectively) (Figure 7b,d). However, after the two-year follow-up, only aCSC differed significantly from HC in the InfHem and ETDRS (mean 49.35±5.8% vs 45.55±3.64%, p=0.036 and 51.35±5.12% vs 47.66±2.89%, p=0.049) (Figure 7c,d).
Significant decrease in vessel density during two years were observed in the Fovea, SupHem and ETDRS for HC and cCSC (HC: change from mean 42.5±3.5% to 38.43±5.2%, p=0.000 in the Fovea, and from 54.55±3.06% to 47.12±2.72%, p=0.000 in the SupHem, and from 54.05±3.69% to 47.66±2.89%, p=0.000 in the ETDRS, or cCSC from 39.87±11.13% to 35.2±11.68%, p=0.012 in the Fovea, and from 54.43±4.09% to 50.73±5.1%, p=0.036 in the SupHem, and from 54.75±4.01% to 51.07±4.89%, p=0.020 in the ETDRS) (Figure 7b,d).
In fellow eyes, no significant differences were identified between CSC groups during the baseline assessment and the two-year follow-up in the Fovea (Figure 7e). Notably, vessel density of the Fovea, SupHem, InfHem, and ETDRS showed significant decreases solely in the HC group (transition from mean 41.21±4.19% to 38.14±3.11%, p=0.002 in Fovea, 51.7±2.78% to 48.29±3.48%, p=0.018 in SupHem, 51.64±2.25% to 46.02±3.98%, p=, 0.004 in InfHem, and 53.06±2.18% to 48.56±3.58%, p=0.009 in ETDRS, respectively). At baseline rCSC differed significantly from HC in the Fovea (mean 34.73±5.1% vs 38.14±3.11%, p=0.017) (Figure 7e). After two years, all CSC groups showed significantly greater vessel density compared to HC in the SupHem, InfHem and ETDRS (Figure 7f–h). There were no differences among CSC patients.

3.4.6. FAZ

FAZ analysis revealed no statistically significant variances between the groups for affected and fellow eye at the baseline or after the two-year follow-up. Furthermore, neither group observed any significant alterations over the two-year duration. However, at baseline and after two years, only the rCSC group had significantly larger FAZ compared to HC for the affected and fellow eye (mean 0.3±0.15 µm vs 0.2±0.04 µm, p=0.046 and 0.36±0.19 µm vs 0.21±0.06 µm, p=0.011 for the affected eye, and 0.3±0.1 µm vs 0.21±0.05 µm, p=0.004 and 0.3±0.1 µm vs 0.21±0.05 µm, p=0.002 for the fellow eye).
Secondary outcomes

3.5. Correlations between BCVA and morphological and functional parameters.

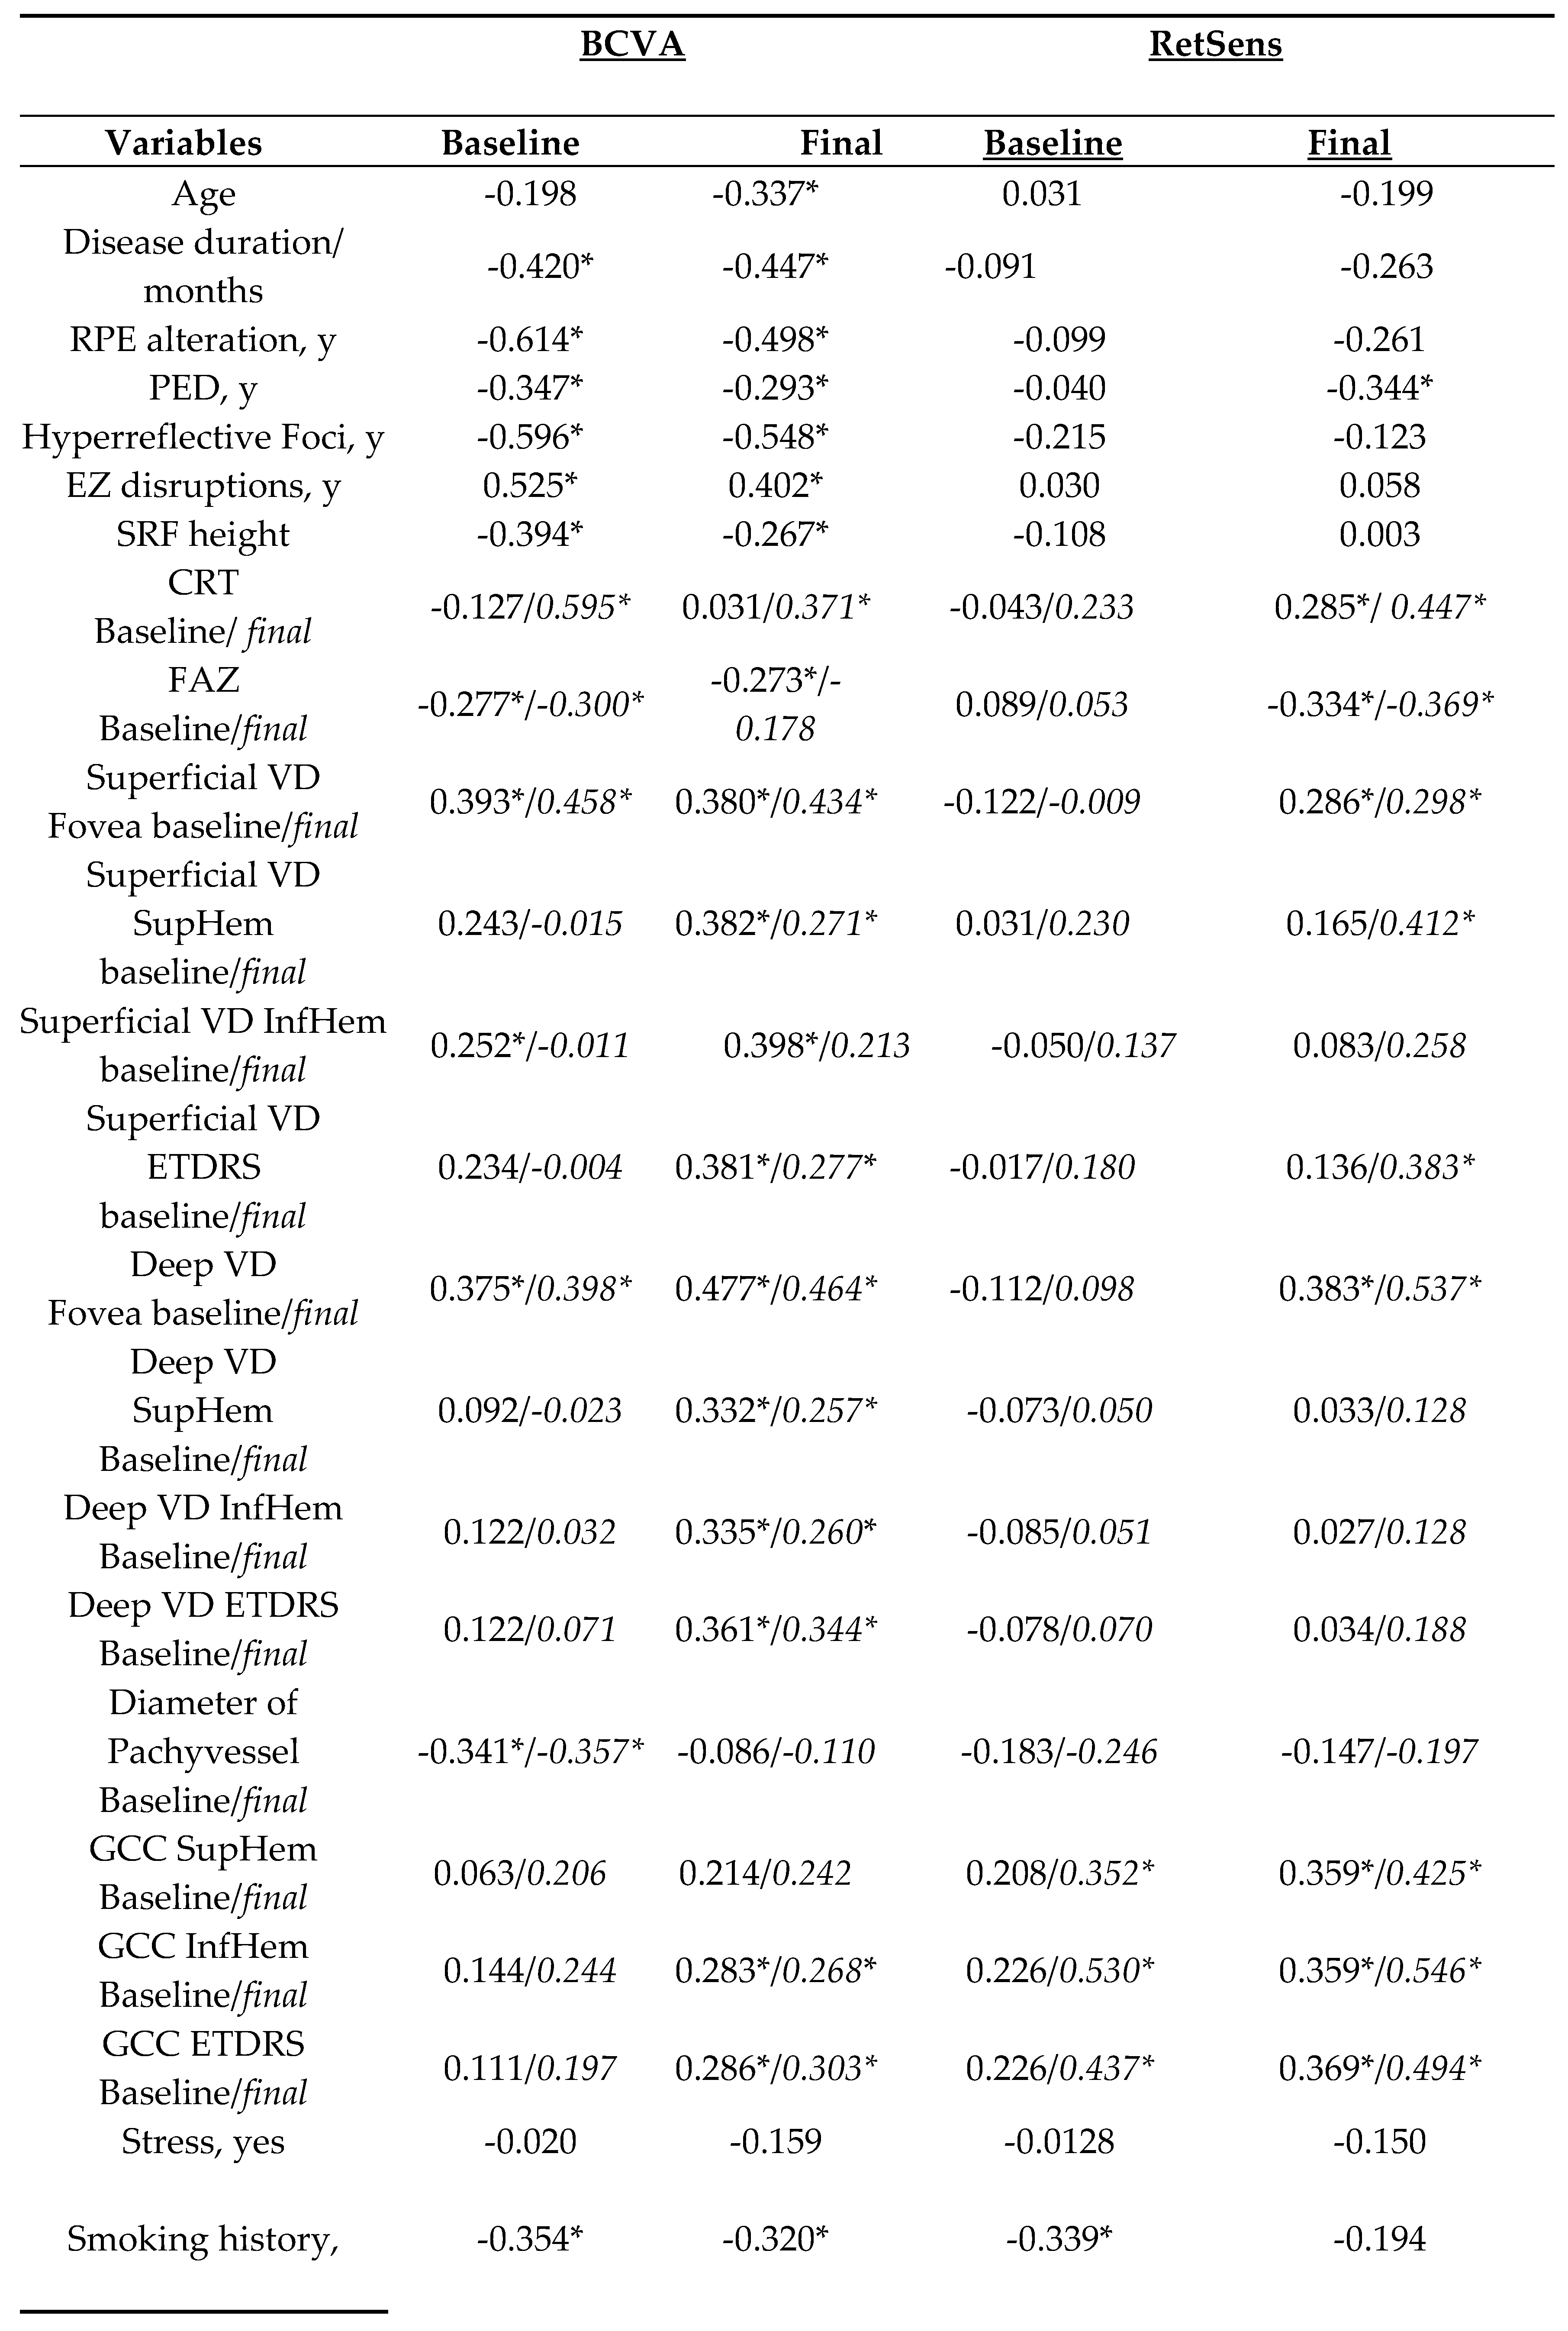
Baseline and final BCVA correlated negatively with patient-reported disease duration, RPE alteration, PED, Hyperreflective Foci, EZ disruptions, SRF height, FAZ and smoking reported by patients (Table 2). Moreover, a positive correlation was observed with RetSens and superficial or deep VD of the Fovea at baseline and after two years of the affected eye and fellow eye (Table 2).
Baseline BCVA correlated negatively with diameter of the pachyvessel at baseline and after two years (Table 2).
Final BCVA after two years further correlated negatively with the patient’s age and positively with GCC thickness of InfHem and ETDRS Grid baseline and after two years. Positive correlations were also found with CRT, superficial VD of the Fovea, SupHem, InfHem and ETDRS, and with the entire examined deep plexus after two years of the affected eye (Table 2).

3.6. Correlation between RetSens and Morphological Parameters

Baseline RetSens correlated negatively with smoking (Table 2).
After two years, RetSens showed a positive correlation with the final entire GCC complex of the affected eye and InfHem and ETDRS GCC of the fellow eye (Table 2). Final RetSens correlated positively with deep and superficial VD of the Fovea and CRT at baseline and after two years (Table 2). There were also negative correlation with PED and FAZ at baseline and after two years (Table 2). Notably, the final RetSens was also positively correlated with GCC of the InfHem of the fellow eye at baseline. Additionally, after two years, a positive correlation was found with the superficial VD of the SupHem and ETDRS of the affected eye (Table 2).

4. Discussion

Our study revealed that panmacular MPLT 577 nm laser treatment was safe and effective for almost all CSC cases. Patients who received this treatment experienced significant and long-lasting improvements in their visual acuity and average retinal sensitivity across all the studied groups, consistent with prior studies [9,12]. Furthermore, the therapy reduced CCT and pachyvessel diameter. A similar decrease in CCT thickness in aCSC treated with MPLT was reported earlier [9,18]. However, our study is the first to monitor pachyvessel diameter during MPLT treatment. Notably, the treatment was completely safe, as no damage to the RPE after the laser procedure was found at fundus autofluorescence (FAF), consistent with prior studies [4,9,12,13,18,19,20].
SRF was entirely resolved in all patients with aCS and most patients with cCSC and rCSC. Gawęcki et al. found similar results in acute CSC [12]. They ultimately reduced SRF in 81.25% of CSC cases, lasting an average of 3.4±2.3 months. However, laser therapy was performed according to the SCOT map under the oedema. Similarly, Kiraly et al. limited laser therapy to the area of the neurosensory retinal detachment. However, in these cases, total SRF resolution was achieved only in 48.4% of CSC cases lasting three months [13]. The treatment significantly improved mean BCVA, especially in patients with a complete reduction of SRF, during the six-month follow-up period [12], [13]. After a two-year follow-up, we also found that the treatment was the most effective for patients suffering from acute CSC. In our assessment, the panmacular application of the MPLT laser seems to harness MPLT’s known effects more comprehensively, particularly in stimulating RPE and Müller cells. In our study, among the CSC groups, those with acute CSC demonstrated complete SRF resorption and the most significant enhancement, achieving BCVA levels comparable to those in the non-treated group and better RetSens at the two-year follow-up. For them and cCSC patients, the change in BCVA was the most significant.
Conversely, patients with rCSC exhibited the slightest improvement in BCVA and RetSens. However, this group initially presented the worst visual acuity and retinal sensitivity. Moreover, their baseline pachyvessel diameter was the largest, persisting even after the two-year follow-up. Interestingly, while CCT was greatest in patients with aCSC at baseline, the rCSC group closely followed, displaying a CCT larger than that of the non-treated and cCSC groups. Although the change in mean CCT in rCSC patients was most remarkable after treatment, their CCT was still greater than that of the cCSC and non-treated CSC groups after two years.
After treatment, all CSC groups showed significant reductions in pachyvessel diameter. In contrast, the non-treated CSC group showed a minor change at the healthy control level that was not statistically significant.
Retinal sensitivity also improved in all treated and untreated CSC patients after two years. However, the most significant improvement was observed in patients of the aCSC group, followed by cCSC and non-treated patients. Only the rCSC group showed a marginal improvement. Moreover, those patients had the lowest RetSens at baseline and after two years of follow-up but without statistical significance. Li et al. observed similar but significant differences in retinal sensitivity between rCSC and aCSC [21]. Similarly, Go et al. reported that retinal light sensitivity is more major in treated aCSC patients than in non-treated ones [18].
The final BCVA depended on the GCC complex’s thickness measured at baseline and after two years for the inferior hemisphere and ETDRS Grid. The mean GCC complex thickness of the ETDRS Grid was lowest in the rCSC group at baseline and after two years.
Moreover, baseline BCVA was negatively correlated with pachyvessel diameter, the largest in the rCSC group before and after panmacular MPLT treatment. However, the difference between the groups was insignificant for the affected and fellow eyes, either at baseline or after two years.
Additionally, baseline and final BCVA was negatively correlated with the affected eye’s baseline and final FAZ and the fellow eye’s baseline FAZ. However, the FAZ was similar between all CSC groups. Moreover, baseline and final FAZ was also strongly correlated with final RetSens. Furthermore, the final BCVA was found to have a positive correlation with the density of vessels in the superficial and deep retinal plexus at the beginning of the study and after two years in the affected eye. Notably, a significant difference was noted between cCSC and rCSC groups in the superior hemisphere of the superficial plexus, pointing to a weaker vascular network in rCSC.
Patients with recurrent CSC exhibited the lowest initial and final BCVA and RetSens, prompting the question: Why is this the case?
Traditionally, it was thought that the duration of the disease process was the primary risk factor, leading to damage to RPE cells and photoreceptors. Indeed, our analysis has shown a clear negative correlation between the initial or final BCVA and disease duration. We found that the disease duration tends to be longer in patients with rCSC than cCSC, which may seem unexpected. It is important to note that previous studies often grouped rCSC patients with the cCSC group, which could have distorted the results.
The poorer outcomes observed in rCSC patients compared to cCSC may be attributed to the widest pachyvessels in these patients. It is established that atrophy and thinning of the choriocapillaris occur over large choroidal vessels, leading to RPE damage and SRF accumulation [22]. Compression of the choriocapillaris may cause a reduction of vascular flow area, while Sattler’s and Haller’s layers reveal increased blood flow [22].
After analyzing the data, we recommend prompt treatment for rCSC patients. In the two-year follow-up, the disease’s progression appears to be considerably more severe in such cases. We strongly concur with Gawęcki et al. that timely intervention in all CSC cases may help prevent permanent visual acuity reduction and lead to beneficial outcomes [12].
Among the parameters examined, RPE alterations and EZ disruptions were most commonly noted in the cCSC group despite exhibiting superior BCVA and RetSens compared to rCSC at baseline and after two years. Notably, when analyzing disease duration from the initial known episode in the rCSC group, this parameter was more prolonged than in the cCSC group. The presence of RPE alteration is still closely related to the definition of the chronic form of CSC, in which these changes may be more extensive, including retinal atrophy. However, in our study, cCSC patients had better baseline BCVA and RetSens than rCSC patients. Moreover, despite the chronicity of the process, they achieved a significantly better RetSens, which we did not observe in the rCSC group. Additionally, in rCSC group the improvement in RetSens was not statistically significant.
Thus, the disease duration appears to exert the most significant influence on the final BCVA. These observations align with findings from other studies [12,20]. Therefore, minimizing disease duration is crucial, primarily through simple and safe methods like subthreshold MPLT.
In our opinion, subthreshold panmacular MPLT is the most straightforward, safest, and least invasive choice of the current therapeutic options. The safety was confirmed by our and prior studies [4,5,6].
There are some limitations of the study. Although the number of participants in the study group was relatively small, significant differences were observed between patients who received panmacular MPLT treatment and those who did not. Further studies with more participants and consistent treatment regimens should be conducted to confirm these findings. Since our study was a retrospective case series, we know that a randomized controlled trial is necessary in the future to confirm the effects of the MPLT therapy.
Although a two-year follow-up period provides valuable insights, extending it may supply additional information regarding the course of the disease, the recurrence rate, and the need for further treatment.

5. Conclusions

The panmacular MPLT treatment leads to long-term enhancement of functional and morphological parameters in all patients with CSC. The acute CSC patients showed the most significant improvement compared to those with chronic and recurrent CSC. The procedure is safe and could be considered a preferred treatment option for all active CSC cases. Timely treatment is crucial for beneficial outcomes.

Author Contributions

“Conceptualization, ML. and SD.; methodology, ML.; software, ML and SD.; validation, ML and SD; formal analysis, ML., and SD.; investigation, ML.; resources, ML.; data curation, ML and SD.; writing—original draft preparation, ML; writing—review and editing, ML. and SD; visualization, ML, and SD.; supervision, ML and SD.; project administration, ML and SD.; funding acquisition, SD. All authors have read and agreed to the published version of the manuscript” Comparison of Nailfold Videocapillaroscopy with Retinal and Choroidal Vascular Parameters in Patients with Central Serous Chorioretinopathy”.

Funding

“This research received no external funding.”

Conflicts of Interest

“The authors declare no conflict of interest.”

References

  1. van Dijk, E.H.C.; Fauser, S.; Breukink, M.B.; Blanco-Garavito, R.; Groenewoud, J.M.M.; Keunen, J.E.E.; Peters, P.J.H.; Dijkman, G.; Souied, E.H.; MacLaren, R.E.; et al. Half-Dose Photodynamic Therapy versus High-Density Subthreshold Micropulse Laser Treatment in Patients with Chronic Central Serous Chorioretinopathy: The PLACE Trial. Ophthalmology 2018, 125, 1547–1555. [Google Scholar] [CrossRef] [PubMed]
  2. Midena, E.; Bini, S.; Martini, F.; Enrica, C.; Pilotto, E.; Micera, A.; Esposito, G.; Vujosevic, S. CHANGES OF AQUEOUS HUMOR MÜLLER CELLS’ BIOMARKERS IN HUMAN PATIENTS AFFECTED BY DIABETIC MACULAR EDEMA AFTER SUBTHRESHOLD MICROPULSE LASER TREATMENT. Retina Phila. Pa 2020, 40, 126–134. [Google Scholar] [CrossRef] [PubMed]
  3. De Cillà, S.; Vezzola, D.; Farruggio, S.; Vujosevic, S.; Clemente, N.; Raina, G.; Mary, D.; Casini, G.; Rossetti, L.; Avagliano, L.; et al. The Subthreshold Micropulse Laser Treatment of the Retina Restores the Oxidant/Antioxidant Balance and Counteracts Programmed Forms of Cell Death in the Mice Eyes. Acta Ophthalmol. (Copenh.) 2019, 97, e559–e567. [Google Scholar] [CrossRef] [PubMed]
  4. Frizziero, L.; Calciati, A.; Midena, G.; Torresin, T.; Parrozzani, R.; Pilotto, E.; Midena, E. Subthreshold Micropulse Laser Modulates Retinal Neuroinflammatory Biomarkers in Diabetic Macular Edema. J. Clin. Med. 2021, 10, 3134. [Google Scholar] [CrossRef]
  5. Luttrull, J.K.; Sinclair, S.H.; Elmann, S.; Chang, D.B.; Kent, D. Slowed Progression of Age-Related Geographic Atrophy Following Subthreshold Laser. Clin. Ophthalmol. Auckl. NZ 2020, 14, 2983–2993. [Google Scholar] [CrossRef]
  6. Luttrull, J.K. Subthreshold Diode Micropulse Laser (SDM) for Persistent Macular Thickening and Limited Visual Acuity After Epiretinal Membrane Peeling. Clin. Ophthalmol. Auckl. NZ 2020, 14, 1177–1188. [Google Scholar] [CrossRef]
  7. Chhablani, J.; Cohen, F.B.; Aymard, P.; Beydoun, T.; Bousquet, E.; Cohen, F.B.; Daruich-Matet, A.; Matet, A.; Zhao, M.; Chhablani, J.; et al. Multimodal Imaging-Based Central Serous Chorioretinopathy Classification. Ophthalmol. Retina 2020, 4, 1043–1046. [Google Scholar] [CrossRef]
  8. Gawęcki, M.; Jaszczuk, A.; Grzybowski, A. Short Term Presence of Subretinal Fluid in Central Serous Chorioretinopathy Affects Retinal Thickness and Function. J. Clin. Med. 2020, 9, 3429. [Google Scholar] [CrossRef]
  9. Long, H.; Liu, M.; Hu, Q.; Li, X. 577 Nm Subthreshold Micropulse Laser Treatment for Acute Central Serous Chorioretinopathy: A Comparative Study. BMC Ophthalmol. 2022, 22, 105. [Google Scholar] [CrossRef]
  10. van Dijk, E.H.C.; Feenstra, H.M.A.; Bjerager, J.; Grauslund, J.; Boon, C.J.F.; Subhi, Y. Comparative Efficacy of Treatments for Chronic Central Serous Chorioretinopathy: A Systematic Review with Network Meta-Analyses. Acta Ophthalmol. (Copenh.) 2023, 101, 140–159. [Google Scholar] [CrossRef]
  11. Gawęcki, M. Micropulse Laser Treatment of Retinal Diseases. J. Clin. Med. 2019, 8, 242. [Google Scholar] [CrossRef] [PubMed]
  12. Gawęcki, M.; Jaszczuk-Maciejewska, A.; Jurska-Jaśko, A.; Kneba, M.; Grzybowski, A. Transfoveal Micropulse Laser Treatment of Central Serous Chorioretinopathy within Six Months of Disease Onset. J. Clin. Med. 2019, 8, 1398. [Google Scholar] [CrossRef]
  13. Kiraly, P.; Habjan, M.Š.; Smrekar, J.; Mekjavić, P.J. Functional Outcomes and Safety Profile of Trans-Foveal Subthreshold Micropulse Laser in Persistent Central Serous Chorioretinopathy. Life 2023, 13, 1194. [Google Scholar] [CrossRef]
  14. Latalska, M.; Bartosińska, J.; Dresler, S.; Toro, M.D.; Krasowska, D.; Rejdak, R. Comparison of Nailfold Videocapillaroscopy with Retinal and Choroidal Vascular Parameters in Patients with Central Serous Chorioretinopathy. J. Clin. Med. 2023, 12, 4817. [Google Scholar] [CrossRef]
  15. Latalska, M.; Bartosińska, J.; Kosior-Jarecka, E.; Krasowska, D.; Mackiewicz, J. Nailfold Videocapillaroscopy in Patients with Central Serous Chorioretinopathy and Its Relationship to Morphological and Functional Findings. J. Clin. Med. 2020, 9, 3891. [Google Scholar] [CrossRef]
  16. Yang, L.; Jonas, J.B.; Wei, W. Choroidal Vessel Diameter in Central Serous Chorioretinopathy. Acta Ophthalmol. (Copenh.) 2013, 91, e358–e362. [Google Scholar] [CrossRef]
  17. Spaide, R.F.; Gemmy Cheung, C.M.; Matsumoto, H.; Kishi, S.; Boon, C.J.F.; van Dijk, E.H.C.; Mauget-Faysse, M.; Behar-Cohen, F.; Hartnett, M.E.; Sivaprasad, S.; et al. Venous Overload Choroidopathy: A Hypothetical Framework for Central Serous Chorioretinopathy and Allied Disorders. Prog. Retin. Eye Res. 2022, 86, 100973. [Google Scholar] [CrossRef] [PubMed]
  18. Guo, J.-J.; Li, X.-J.; Wan, J.-J. Efficacy and Safety of Subthreshold Micropulse Laser in the Treatment of Acute Central Serous Chorioretinopathy. Int. J. Ophthalmol. 2023, 16, 921–927. [Google Scholar] [CrossRef] [PubMed]
  19. Luttrull, J.K. LOW-INTENSITY/HIGH-DENSITY SUBTHRESHOLD DIODE MICROPULSE LASER FOR CENTRAL SEROUS CHORIORETINOPATHY. Retina Phila. Pa 2016, 36, 1658–1663. [Google Scholar] [CrossRef]
  20. Arora, S.; Sridharan, P.; Arora, T.; Chhabra, M.; Ghosh, B. Subthreshold Diode Micropulse Laser versus Observation in Acute Central Serous Chorioretinopathy. Clin. Exp. Optom. 2019, 102, 79–85. [Google Scholar] [CrossRef]
  21. Li, H.; Chen, L.; Wu, M.; Zheng, B. Analysis of Retinal Sensitivity between Acute and Recurrent Central Serous Chorioretinopathy by Microperimetry. Photodiagnosis Photodyn. Ther. 2023, 42, 103576. [Google Scholar] [CrossRef] [PubMed]
  22. Lejoyeux, R.; Benillouche, J.; Ong, J.; Errera, M.-H.; Rossi, E.A.; Singh, S.R.; Dansingani, K.K.; da Silva, S.; Sinha, D.; Sahel, J.-A.; et al. Choriocapillaris: Fundamentals and Advancements. Prog. Retin. Eye Res. 2022, 87, 100997. [Google Scholar] [CrossRef] [PubMed]
Figure 1. Study design Flow Chart. CSC- central serous chorioretinopathy, OCT- optical coherence tomography, BCVA- best corrected visual acuity, OCT-A- optical coherence tomography-angiography, MPLT- micropulse laser treatment, aCSC- acuteCSC, rCSC- recurrent CSC, cCSC-chronicCSC.
Preprints 102234 g001
Figure 2. Multimodal imaging features: a- CCT (Central Choroidal Thickness), b- Diameter of Pachyvessel, c- Vessel Density of Superficial Plexus, d-Vessel Density of Deep Plexus, e- FAZ (Foveal Avascular Zone), f- microperimetri, g- GCC analysis.
Preprints 102234 g002
Figure 3. Comparison of BCVA (a), RetSens (b) and CRT (c) at baseline and after two years. BCVA- best corrected visual acuity, RetSens- retinal sensitivity, CRT- central retinal thickness, aCSC- acute CSC, cCSC- chronic CSC, rCSC- recurrent CSC. Data are mean ±SE; values followed by different letters are significantly different (p<0.05, Conover-Iman post-hoc test). Lower case letters indicate differences between objects at the beginning of the observations, while upper case letters indicate differences between objects after 2 years. *, ** and *** indicate significant differences at the 0.05, 0.01 and 0.001 level of the Wilcoxon matched-pairs signed rank test between the observation periods of the given objects.
Preprints 102234 g003
Figure 4. Comparison of GCC at baseline and after two years. GCC- ganglion cell complex, Hemi-hemisphere, aCSC- acute CSC, cCSC- chronic CSC, rCSC- recurrent CSC. Data are mean ±SE; values followed by different letters are significantly different (p<0.05, Conover-Iman post-hoc test). Lower case letters indicate differences between objects at the beginning of the observations, while upper case letters indicate differences between objects after 2 years. *, ** and *** indicate significant differences at the 0.05, 0.01 and 0.001 level of the Wilcoxon matched-pairs signed rank test between the observation periods of the given objects.
Preprints 102234 g004
Figure 5. Comparison of CCT (a), diameter of choriocapillary of affected eye (b) and fellow eye (c). CCT- central choroid thickness, aCSC- acute CSC, cCSC- chronic CSC, rCSC- recurrent CSC. Data are mean ±SE; values followed by different letters are significantly different (p<0.05, Conover-Iman post-hoc test). Lower case letters indicate differences between objects at the beginning of the observations, while upper case letters indicate differences between objects after 2 years. *, ** and *** indicate significant differences at the 0.05, 0.01 and 0.001 level of the Wilcoxon matched-pairs signed rank test between the observation periods of the given objects.
Preprints 102234 g005
Figure 6. Comparison of vessel density of superficial plexus at baseline and after two years of affected (a-d) and fellow eye (e-h). Fov- fovea, Super Hem- superior hemisphere, Inf Hem- inferior hemisphere, aCSC- acute CSC, cCSC- chronic CSC, rCSC- recurrent CSC. Data are mean ±SE; values followed by different letters are significantly different (p<0.05, Conover-Iman post-hoc test). Lower case letters indicate differences between objects at the beginning of the observations, while upper case letters indicate differences between objects after 2 years. *, ** and *** indicate significant differences at the 0.05, 0.01 and 0.001 level of the Wilcoxon matched-pairs signed rank test between the observation periods of the given objects.
Preprints 102234 g006
Figure 7. Compariosn of vessel density (VD) of deep plexus at baseline and after two years of affected (a-d) and fellow eye (e-h). Fov- fovea, Super Hem- superior hemisphere, Inf Hem- inferior hemisphere, aCSC- acute CSC, cCSC- chronic CSC, rCSC- recurrent CSC. Data are mean ±SE; values followed by different letters are significantly different (p<0.05, Conover-Iman post-hoc test). Lower case letters indicate differences between objects at the beginning of the observations, while upper case letters indicate differences between objects after 2 years. *, ** and *** indicate significant differences at the 0.05, 0.01 and 0.001 level of the Wilcoxon matched-pairs signed rank test between the observation periods of the given objects.
Preprints 102234 g007
Table 1. Baseline demographics and clinical data of central serous chorioretinopathy (CSC) patients and healthy controls (HC).
Preprints 102234 g008
Table 2. Spearman correlation between BCVA or RetSens and analyzed parameters (R Spearman, p<0.05*).
Preprints 102234 g009
Disclaimer/Publisher’s Note: The statements, opinions and data contained in all publications are solely those of the individual author(s) and contributor(s) and not of MDPI and/or the editor(s). MDPI and/or the editor(s) disclaim responsibility for any injury to people or property resulting from any ideas, methods, instructions or products referred to in the content.
Copyright: This open access article is published under a Creative Commons CC BY 4.0 license, which permit the free download, distribution, and reuse, provided that the author and preprint are cited in any reuse.
Prerpints.org logo

Preprints.org is a free preprint server supported by MDPI in Basel, Switzerland.

Subscribe

© 2024 MDPI (Basel, Switzerland) unless otherwise stated