Submitted:
25 March 2024
Posted:
26 March 2024
You are already at the latest version
Abstract
The main inhibitory neurotransmitter in the mammalian brain is 4-aminobutyric acid (GABA). Phthalimide acts as a sodium channel antagonist, one of the finest targets for treating epilepsy is the sodium channel and JNK kinase activity is inhibited to treat epilepsy. a novel compound with multiple targets of action for the treatment of epilepsy also anti-oxidant activity has been designed. The compounds are designed in two series aldehydes and aniline. Docking of all the designed compounds has been done with the suitable protein GABA-AT, sodium channel, JNK protein, and anti-oxidant from protein bank. QSAR was done for constructing many linear regression models. In combination with the developed Docking and QSAR outcomes, ADMET has been performed for the active compounds. The result shows that 11 of the compounds have excellent binding energy in docking with all the receptors and also have good QSAR results and follow the ADMET. The structural understanding of human GABA-AT inhibition was obtained from molecular dynamics simulation studies for compound no. 11 at 5 nanoseconds. Synthesis and pharmacological activity also suggest that the designed compound no.11 be considered the best Novel Compound.
Keywords:
Docking
; GABA-AT
; QSAR
; Epilepsy
; Molecular Dynamics
; synthesis and in vivo
Introduction
A huge percentage of individuals globally, both men and women, suffer from epilepsy, a serious neurological illness. Only 60–70% of people with epilepsy respond to current treatments in terms of symptoms. This number is increased by about 2,50,000 new cases each year. Brain tumours, severe head traumas, prenatal insults, developmental abnormalities, and cerebrovascular illnesses are some of the causes of epilepsy [1]. Many people can receive medicinal treatment for their epilepsy. Seizure safety is frequently followed by numerous gastrointestinal diseases, gingival hyperplasia, ataxia, hirsutism, and megaloblastic anaemia, even though 70–80 percent of epileptics are controlled by drug [2] Generalized epileptic seizures begin in both cerebral hemispheres simultaneously, while seizures in focus begin one or more specific regions of one or both hemispheres, most frequently the temporal lobe. With generalized seizures, consciousness is always impaired or lost [3]. According to characteristics with different seizures, etiology, age of start, and electroencephalogram, the forms of the epileptic syndrome in patients are further categorized [4]. If the origin or etiology of epilepsy is unknown, it can either be idiopathic (with a likely genetic foundation) or symptomatic (acquired). Below are several illustrations of epilepsy models [5]
In view of the above reports, Computer-aided drug design (CADD) methodologies like the development of new drugs frequently utilize pharmacophore, molecular docking, and quantitative structure-activity relationship studies (QSAR) [6]. To demonstrate the relationship between the investigated Compounds and the amino acids contained in the pocket of the GABA-AT, neuronal sodium channel, JNK, and antioxidant. GABA-AT is a type of Inhibitory Neurotransmitter where the sodium channel is one of the most effective epileptic treatment targets. voltage-gated sodium channels in neurons (NVSC) are essential for the production and transmission of the neuronal action potential and that of other excitable cells. [7]
(QSAR) models, which relate a compound's chemical properties to its bioactivities toward a targeted macromolecule, are a crucial step in preclinical drug development. The physicochemical and structural characteristics of a library or dataset, which were typically acquired through biological data of one or more in vitro tests, were used to calculate the general QSAR models. [8] These statistical simulations can serve as starting points for further optimization since they contain essential details about structural characteristics and biological activities. A QSAR model was created in this study to forecast the anticonvulsant effects of N, N-phthaloyl GABA derivatives. [9] Because creating and perfecting a novel drug candidate is a difficult process, computational drug development using molecular dynamics simulations helps speed up this process. The most accurate quantitative structure-activity connection model, and examining a novel class of N,N-phthaloyl GABA derivatives with promising bioactivity using the lead compounds with GABA-AT inhibitor. The developed compounds were put through ADMET using pkCSM. [10] and the top binding complex's stability was confirmed using Gromacs molecular dynamics simulations. Additionally, dynamics modeling studies that included the estimation of the supporting binding affinity with binding free energy evaluated the complex's stability and interactions.
Material and Methods
Synthetic Chemistry
Materials-
The chemicals employed in this investigation were of the highest purity analytical grade, and they were purchased from reliable commercial sources in India. All Chemicals & Reagents used were procured from Agencies such as Rankem, Spectrochem, TCI, C.D.H., All solvents of A.R were used. Silica gel GF254 of Rankem were used for thin-layer Chromatography studies.
Melting Point Apparatus (HICON), melting point of all synthesized Compounds were monitored by Open Glass-Capillary tube method and are uncorrected. FTIR Fourier Transformed Infra-Red (IR) spectra of newly synthesized compounds were recorded using KBr disc on BRUKER Model FTIR Alpha. 1H NMR spectrum was recorded on (Model: AVANCE III HD 400MHz) BRUKER spectrometer in CDCl3 was used. Using internal references as tetramethyl silane.
Schemes
This series has been selected on the basis of In-silico docking-related observation.
The present research work includes the Synthesis of two Series of compounds.
Scheme I: Synthesis of hydrazides substituted derivatives
Scheme 2: Synthesis of N-aryl substituted derivatives
Series 1: Synthesis of hydrazides substituted Derivatives (Compounds 1-10)
N, N-phthaloyl GABA in equimolar amounts (0.03 mol), and Hydrazine Hydrate (99-100%) (0.03 mol) in the Presence of DCC (0.03 mol) were condensed in Dichloromethane, by agitating in ice-cold temperatures (0-3 OC) for 6-8 hrs. N, N-phthaloyl GABA hydrazide in equimolar concentrations (0.03 mol), and various Substituted ketones and aldehydes (0.03 mol) were refluxed in the presence of glacial acetic acid (0.06 mol) in ethanol around 6-8 hrs.
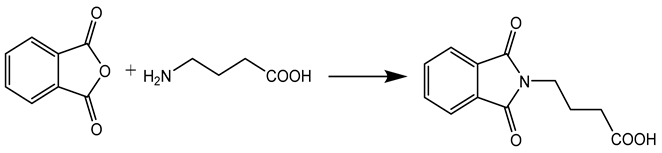
Step-1 Synthesis N, N-phthaloyl GABA
GABA, N-protection was accomplished by the reaction of GABA (0.05 mol) with phthalic acid anhydride (0.05 mol), with concomitant removal of water through an apparatus called Dean-Stark. (Figure 1)
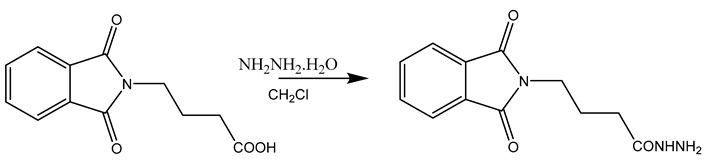
Step-2 Synthesis of N, N-phthaloyl GABA hydrazide
N, N-phthaloyl GABA in equimolar amounts (0.03 mol), and hydrazine hydrate (99-100%) (0.03 mol) in the presence of DCC (0.03 mol) were condensed in dichloromethane, by agitating in ice-cold temperatures (0-3 OC) around 6-8 hrs. (Table 3.2)
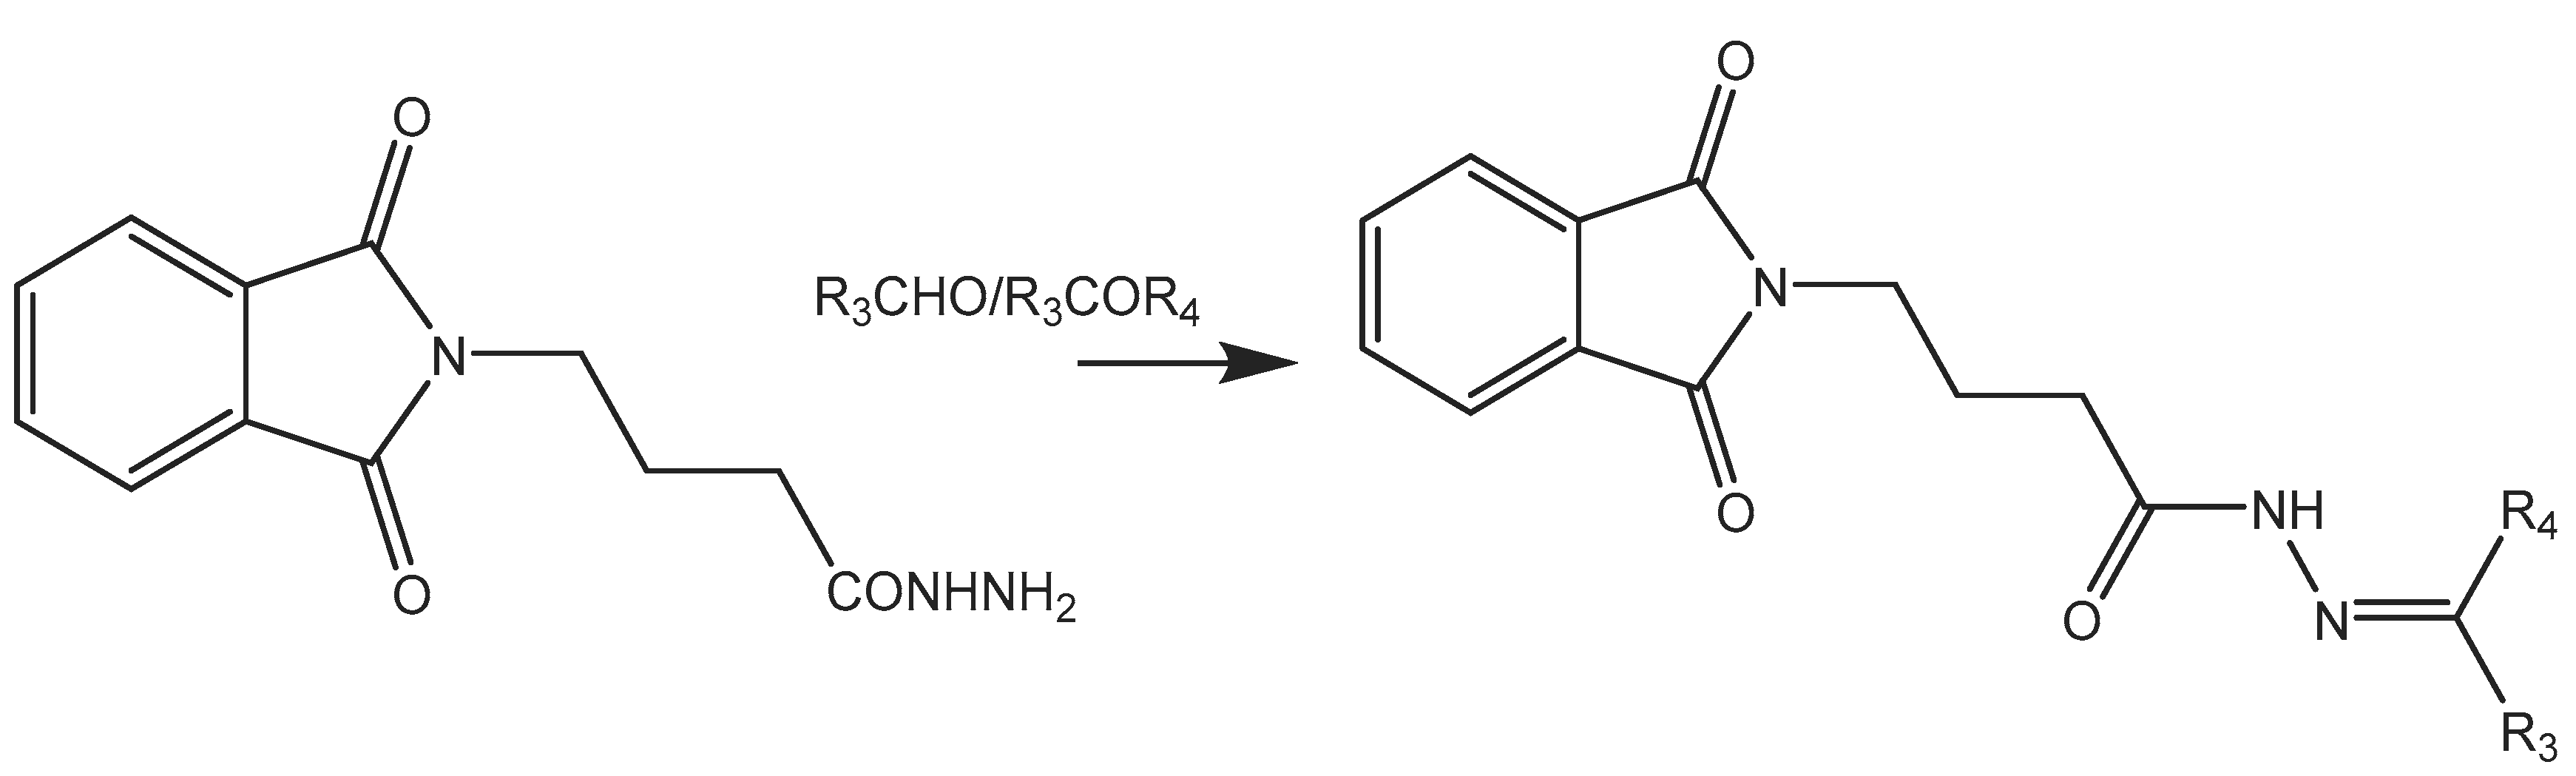
Step-3 (E)-N'-(2-chlorobenzylidene)-4-(1,3-dioxoisoindolin-2-yl) butane hydrazide
N, N-phthaloyl GABA hydrazide in equimolar concentrations (0.03 mol), and various Substituted ketones and aldehydes (0.03 mol) were Refluxed in Glacial acetic acid (0.06 mol) in ethanol around 6-8 hrs.
Scheme 2.
Synthesis of N-aryl substituted Derivatives.
GABA, N-protection was done by the condensation of GABA (0.05 mol) with phthalic acid anhydride (0.05 mol), with concomitant removal of water. In dichloromethane, with presence of DCC (0.03 mol) equimolar amounts of substituted anilines (0.03 mol) and N, N-phthaloyl GABA (0.03 mol) were mixed together, in ice bath at 0-3 OC around 6 to 8 h.
Step-1 Synthesis N, N-phthaloyl GABA
GABA, N-protection was done by the condensation of GABA (0.05 mol) with phthalic acid anhydride (0.05 mol), with concomitant removal of water. through an apparatus called Dean-Stark. (Figure 1)

Step-2 Synthesis of N-aryl substituted Derivatives (Compounds 11-18)
In dichloromethane, with presence of DCC (0.03 mol) equimolar amounts of substituted anilines (0.03 mol) and N, N-phthaloyl GABA (0.03 mol) were mixed together, in ice bath at 0-3 OC around 6 to 8 h.
Molecular Modelling
The inhibitors' chemical structures presented in Table 1 were created using ChemDraw software (version 15.1). From the various energy-minimized conformers, we selected the global minimum conformer for use in docking calculations. Subsequently, we transferred the resulting geometry into the AutoDock program package (version 4.2), the Arthur J. Olson Chemometrics Group developed [11]. Docking of N-phenyl substituent structure is shown in Table 1 and Table 2. Figure 1 and Figure 2
Figure 1.
Scheme 1 (Aldehyde).
Molecular Docking Studies
We utilized AutoDock version 4.2 to estimate the affinities and interactions of GABA-AT inhibitors. The initial 3D structure of GABA-AT, with a PDB ID of 1OHV and Using the Protein Data Bank, a resolution of 1.82 was attained (www.rcsb.org). To identify docking parameters that would aid in docking the designed compounds, we conducted a redocking procedure of the co-crystallized ligand to 1OHV [12].
The ligand structures were created using ChemDraw 15.1 and underwent energy minimization utilizing the MMFF94 force field. We used Open Babel version 2.4.1 to perform the necessary file format conversions. In the case of protein preparation, to create the PDBQT file, we geometrically inserted polar hydrogens and gave Kollman's united atom charges. Ligand preparation involved the addition of Gasteiger charges, as well as the inclusion of polar hydrogens. Torsions within the ligands were identified, and this process resulted in the generation of a PDBQT file. The Autogrid option was utilized to define the active site, with a grid size set to 60*60*60 points and a spacing of 0.375 Å. The energy map was calculated using a dielectric constant distance-dependent function. The active binding site of the enzyme was enclosed by the grid box, ligand rotation and translation. The Lamarckian genetic algorithm was used to explore the possible ligand conformational poses, and all other parameters were left at their default values.
QSAR Modelling Studies
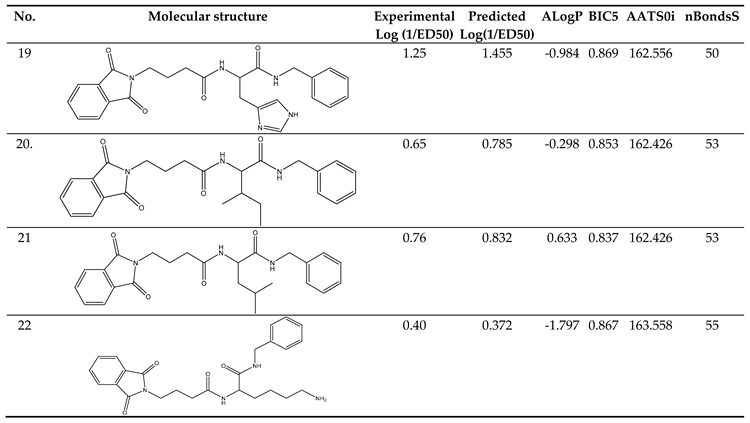
"QSAR" (Quantitative Structure-Activity Relationship) permits the development of numerous by using ordinary least squares, linear regression models in combination with the developed Molecular Docking model. These models are exactly examined and subjected to comprehensive validation following the approach. We utilized a dataset comprising 11 compounds (as detailed in Table 1) with N-phenyl substituent derivatives and their respective human GABA-AT inhibitory values, sourced from previously reported literature. The ED50 values were converted to their corresponding Log(1/ED50) values, and used as the dependent variable. [13,14].
Dataset Collection
The study collected molecular structures and anticonvulsant activity values for N,N-phthaloyl GABA derivatives in the MES (Maximal Electroshock) test from the literature sources. These activity values represent the ED50 (Effective Dose for 50% response) measured in milligrams per kilogram (mg Kg−1). The activity was converted from ED50 (mg kg1) to ED50 (mol Kg1) and subsequently to Log (1/ED50) i.e. In order to facilitate comparisons between compounds and let its distribution approximate the normal distribution, pLog (1/ED50) was created. [15]
Descriptors Calculation and Molecular Structure Optimization
The dataset's molecular structures were improved using the Spartan 14 density function theory B3LYP/631G quantum mechanical approach. PaDEL-Descriptors was used to import the optimized structures [16], It assigned each molecule a total of 1875 molecular descriptors. The computed descriptors, along with their respective Each molecule's activity data were arranged in a matrix style with dimensions n×m. In this context, "n" represents the count of molecules, and "m" signifies the number of descriptors utilized in the dataset. [17]
Dataset Division and Pretreatment
Within the Dataset matrix, columns containing constant or nearly constant values were eliminated. Additionally, the descriptor pool was cleared of any column with a variance of less than 0.001. The dataset was put through a correlation analysis, and any time a pair of descriptors showed a correlation greater than 0.8, one of them was eliminated. The pre-processed dataset matrix was then input into Modified K-medoid where the data was split into test and training sets. [18]
Selection of Optimal Descriptors
The study employed the Genetic Function Algorithm (GFA) found in GeneticAlgorithm1.4 to identify the optimal mixture of descriptors that most effectively elucidate the variance in the examined compounds' activity values. A popular empirical search strategy known as GFA can find precise or approximative answers to a variety of optimization and search issues. It offers several advantages, including the ability to generate multiple models, utilizes a lack-of-fit function to mitigate overfitting, and grants users’ control over the equation's complexity. [19,20]
Model Validation and Construction
GFA selected the optimal descriptor combinations from the Descriptor pool for both the test and training sets. Subsequently, the anticonvulsant activities corresponding to these combinations were added as the final column in their respective spreadsheets. Then, for the purpose of calculating various internal and external validation parameters, these spreadsheets were imported into MLRplusValidation1.3. [21]
Acute Oral Toxicity:
The OECD 423 guideline Acute oral toxicity was followed in Wistar male rats. Animals were dosed with Single oral dose of 500 mg/kg body weight of all three synthesized compounds and observed for mortality. To observe the toxic effects of synthesised compounds, a histopathological examination of the visceral organs including the kidney, spleen, and liver was carried out. Mice were observed for adverse effects like tremors, convulsions, salivation, and diarrhoea. (Table 4.1).

Table 4.1.
Groups for Acute oral toxicity (OECD Guideline 423) Dose 500mg/kg.
| S.no | Group | Animal |
|---|---|---|
| 1 | 1 | 03 |
| 2 | 2 | 03 |
| 3 | 3 | 03 |
| 4 | Control | 03 |
Total no. of animal- 12.
Anti-Convulsant Activity of Novel Phthalimide-GABA Analogs
Evaluation of the synthesized compounds for anti-convulsant activity was done [22], at doses of 30 mg/kg, 100 mg/kg, and 300 mg/kg and vehicle (0.05 percent methyl cellulose) described in (Table 4.2., 4.3., 4.4. and 4.5.).
Table 4.2.
Evaluation of Anticonvulsant activity by PTZ method.
| S. No | Dose Group (mg/kg Body weight) | No. of Animals | |
|---|---|---|---|
| 1 | Control | 06 | |
| 2 | Standard (Sodium Valproate 4mg/kg) | 06 | |
| 3 | PTZ (85mg/kg) treated subcutaneous | 06 | |
| 4 | SCH1-1 | 30 mg/kg | 06 |
| 100 mg/kg | 06 | ||
| 300 mg/kg | 06 | ||
| 5 | SCH1-2 | 30 mg/kg | 06 |
| 100 mg/kg | 06 | ||
| 300 mg/kg | 06 | ||
| 6 | SCH1-3 | 30 mg/kg | 06 |
| 100 mg/kg | 06 | ||
| 300 mg/kg | 06 | ||
Pentylenetetrazol Induced Seizures:
Animals were treated with the 1% of pentylenetetrazol solution for inducing seizure via subcutaneous route in the neck region of each animal of all 12 groups.
Subcutaneous Pentylenetetrazol Model
Subcutaneous Pentylenetetrazol (s.c. PTZ) is a frequently used model for the regular screening and discovery of novel anticonvulsant medications. The convulsant effects of this tetrazole derivative have been demonstrated in mice and rats.
It is thought to have an antagonistic action on GABA-AT receptors. PTZ can be administered subcutaneously. The scPTZ Test Detects the ability of synthesized compounds to raise the seizure threshold of an animal.
The test chemicals were injected intraperitoneally at various concentrations as a pre-treatment for the animals. The mice were injected subcutaneously in the neck region of mice with pentylenetetrazol (85 mg/kg). The animals were kept in segregated cages for up to two hours to monitor the occurrence or non-occurrence of seizures.
To prevent any errors, a seizure, spasm, or convulsion of the tonic-clonic or myoclonic kind was carefully monitored. (Kaushik et.al,2021) [78]
3. Results and Discussion
Molecular Modelling
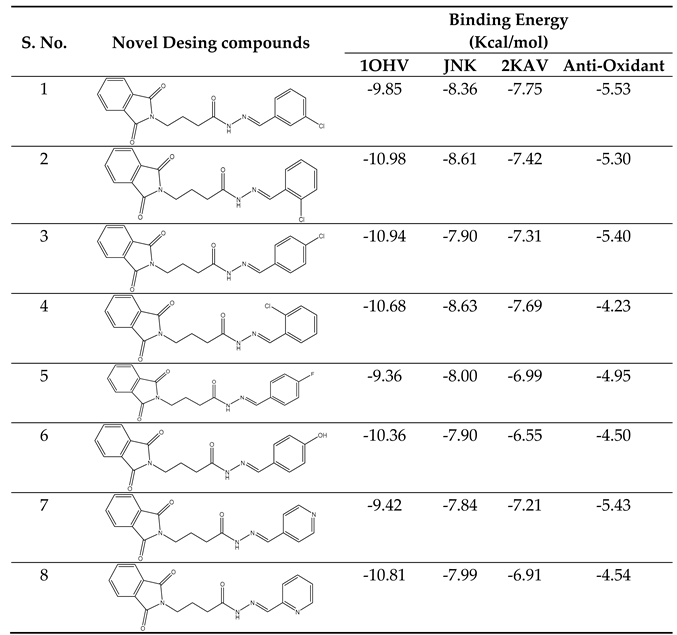
The computational study involved the docking of all datasets, as described, within the open pore's active region of GABA-AT, sodium channel, JNK, and Anti-Oxidant. Following the process detailed in the new section, we determined the predicted binding energies of the active site of these inhibitors, as presented in Table 2. The computation of these energies for binding and docking was carried out using AutoDock4.
Our docking results show that compounds 2, 3, 4, 6, 8, 10, 11, 15, and 18 have binding energies that are, respectively -10.98, -10.94, 10.68, -10.36, 10.81, -10.43, -11.14, -10.00 and -10.51 kcal/mol. These values indicate that these compounds are more potent than phenytoin, which has a binding energy of -5.83 kcal/mol, serving as a Reference drug. Our docking studies interaction patterns of compound 2 between GABA-AT, sodium channel, JNK, and Anti-Oxidant with N-Phenyl Phthalimide derivatives (Figure 3, Figure 4, Figure 5 and Figure 6) with their 2D and 3D interaction. Compound 2 primarily cooperated with NaV1.2 domain IV-S6, as depicted in Figure 4. The N-Phenyl Phthalimide derivatives, on the other hand, demonstrated a predominant contact with domain II-S6. This interaction involved the formation of hydrogen bonds and additional hydrophobic interactions, primarily within the inner pore of the channel, with domains I, II, IV, and sometimes with domain III, as illustrated in Figure 4.
Molecular modelling further revealed specific hydrogen bonding interactions in compound 11. For instance, the oxygen atom in the NO2 group established hydrogen bonds with LYS 329 (Figure 7) and also the OH group with the PHE 189 and ASP298 by docking with GABA-AT. Similar hydrogen bonds were created between the GLU1788 and the NH atom in compound 11 (Figure 8) while docking with Sodithe um Channel. Additionally, according to a docking prediction shown in Figure 9, a hydrogen bond between the oxygen atom of the compound 11 group and the hydrogen atom of the MET149 group could possibly form inside the active site with JNK receptor.
As seen in Figure 10, the N-phenyl ring of LEU 149 and the aromatic ring of compound 11 effectively interacted via a Hydrogen bonding interaction in the domain with Anti-oxidant Receptor.
Despite the promising Predicated binding energies outlined in Table 3, the investigated substances' activities.
QSAR Studies
Dataset Structure
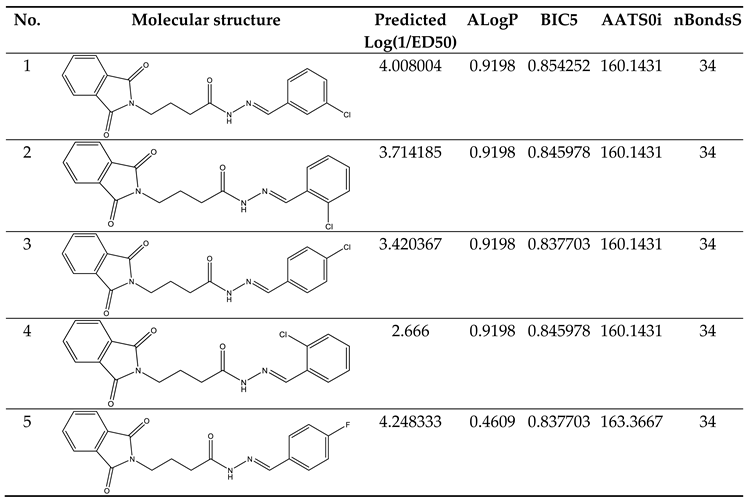
The dataset comprised a total of 11 molecules, and the application of the Modified-K-Medoids1.2 algorithm in our study resulted in the creation of training. The compounds and associated activity values for the compounds in the dataset have been described in Table 4.
QSAR Model and Quality
log(1/ED50) = -7.729580459276E+001 + 6.560669055769E-001*(ALogP) + 3.550876766065E+001*(BIC5) + 3.502318382876E-001*(AATS0i) + -1.682439496376E-001*(nBondsS)
Values in parenthesis in Eq. (1) represent standard deviation. The ratio of training set compounds to model descriptors, expressed as a Topliss ratio [23]. This demonstrated that the model followed the general semi-empirical QSAR rule [24]. These indicated that the model had no multi-co-linearity issues and that descriptors had made a major contribution to the model at a 95 percent level. Moreover, in the plots depicting the predicted versus experimenting with the data from the test set and the training set, the correlation coefficient (r2) values exceeded 0.6 (refer to Figure 11). This finding suggests that there is a linear link the values of the Predicted and experimental activity. The model created for the study seems to have good quality based on the results so far [25,26].
External and Internal Validation
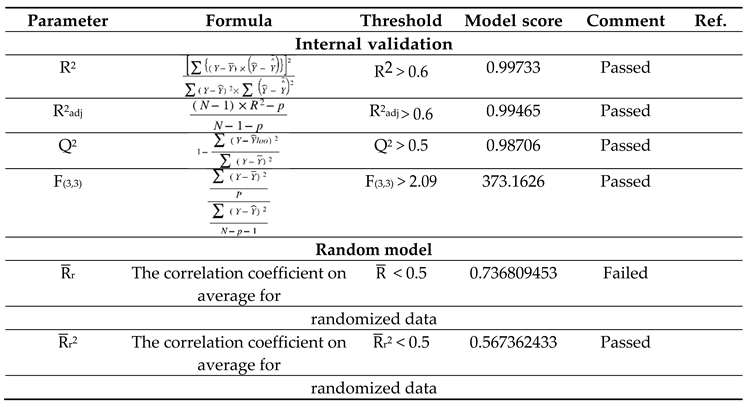
The study's validation model was displayed in Table 5 validation parameters. Q2, R2, R2 adj, R2 cross-validated, and R2 predicted for test set for MLR determination. R2 pred, the Y-randomization parameters, and the correlation coefficient between the test set's predicted activity and actual activity. [27] R2 were greater than 0.5. Model's F3,3 was significantly higher than the calculated F-value for 3, 3 degrees of freedom at the 95% level of significance (373.162). These results demonstrated that the proposed model was highly capable of internal and external prediction, that it is not a random event, and that it can explain the variation in molecular activity levels of the dataset with 95% accuracy. [28,29] The model complied with all of the mean absolute error (MAE) specifications for a predictive model proposed by Roy et al. [30] (Table 5). Due to its robustness, dependability, and applicability to forecast anticonvulsant action for both known and hypothetical compounds, the study's presented model had good internal and external as well as internal prediction abilities. With the help of Prediction Reliability Indicator 1.0, compounds designed were tested for prediction power some molecules predicted good anticonvulsant activity using the default setting (Table 6). Hence, the designed compounds 2, and compound 11 were found to be good predicted anticonvulsant activity.
In this context, the variables are defined as follows:
- Y represents the training set's observed activity value.
- Ȳ stands for the average of the training set's observed activity values.
- Predicted activity for training is consistent with the predicted activity levels for the training set.
- loo represents using leave-one-out cross-validation, the training set's expected activity.
Clarification of Descriptors
The Descriptors included in the models carried specific physical and chemical significance. For instance, one of the descriptors, ALogP, represents the Ghose-Crippen-Viswanadhan octanol-water partition coefficient. This coefficient was incorporated into the model based on an assessment N-octanol-water partition coefficient calculation method. Data from 12,908 chemical compounds were used in the neural network ensemble study that was used to build this approach. The number of hydrogen and other atoms, as well as atom and bond-type E-state indices, were all taken into consideration while calculating ALogP. [31]
BIC5 was another descriptor in the model. This descriptor exhibited a negative contribution to the anticonvulsant activity, showing that a decrease in its value increases the tested compounds' anticonvulsant efficacy. This particular descriptor quantifies the Bond Information Content index. [32]
AATS0i was the model's additional descriptor. It contributed negatively to the anticonvulsant activity, This indicates that decreasing its value enhances the anticonvulsant activity of the compounds being investigated.
nBondsS was another descriptor in the model. It made a negative contribution to the anticonvulsant activity, demonstrating that a decrease in its value improves the tested compounds' anticonvulsant effect. This descriptor is associated with the detection of the number of single bonds. [33]
Prediction of ADMET by Computational Analysis
With the use of the pkCSM server [34], substances' pharmacokinetic characteristics were identified. In order to ensure that the ADMET parameters fell within their expected ranges, the parameters were computed. Table 7 displayed the ADMET characteristics of docked molecules.
Absorption
In the (Table 7) High Caco-2 permeability was predicted for the chosen compounds 12, 13 and 16. Intestinal absorption patterns for all the compounds were predicted to be excellent. The finding suggests that the compounds have good skin permeability values Table 7.
Distribution
All the Compounds has demonstrated good dispersion volume. A substance with log BB > 0.3 has high blood-brain barrier membrane permeability and can easily cross it, whereas a molecule with log BB -1 will find it challenging to do so. Crossing the blood-brain barrier was anticipated for each of the chosen compounds shown in Table 7. The findings indicate that the ADMET toxicity test did not reveal any toxicity for any of the chosen compounds. The results for the ADMET properties that were anticipated were fairly positive, and more in-depth research will undoubtedly be useful in forecasting the fate of the compounds.
Table 7.
Prediction of ADMET.
| Model Name | Predicted Value Compound 2 | Predicted Value Compound 11 | Standard value |
|---|---|---|---|
| Distribution | |||
| Caco2 Permeability | 1.106 | 0.972 | >0.90 |
| Skin Permeability | -3.105 | -3.17 | < -2.5 |
| Intestinal absorption (human) | 92.774% | 90.873% | Poor absorption If less 30% |
| Distribution | |||
| VDss(human) | -0.123 | 0.148 | Minimum if Less - 0.15 |
| BBB Permeability | -0.317 | -0.26 | > 0.45 |
| Toxicity | |||
| Oral Rat Acute Toxicity (LD50) | 2.567 | 2.312 | Numeric (mol/kg) |
| Oral Rat Chronic Toxicity (LOAEL) | 1.226 | 1.583 | Numeric (mol/kg bw/day) |
Computational Investigations of Molecular Dynamics
The molecular docking analyses provided insights into the intricate binding modes between the protein and the inhibitor. However, to assess even the slightest discrepancies, molecular dynamics simulations become essential. [35,36] Leveraging the most favourable interactions and energetically stable docked conformation obtained from Auto Dock results, we conducted an in-depth exploration of compound 11 within a solvent system. As a reference compound, we selected phenytoin, a GABA-AT inhibitor.
For the molecular dynamics simulation, we identified the best active conformation based on hydrogen bond interactions, root mean square deviation (RMSD), and energy values. A 5 nanosecond (ns) simulation was conducted to evaluate the stability of the protein-inhibitor complex, followed by a comprehensive analysis of the simulation results. [37]
Analysis of Compound 11_1OHV Complex Simulation.
The protein's backbone atom's RMSD value increased in relation to its initial position to 0.136nm for first 0.371ns and decreased to 0.0.114nm at 1.76ns and reached maximum of 0.162nm at 4.102ns in the trajectory. RMSD number for the ligand with protein for its initial position increased to 0.118 nm for first 0.242ns and decreased to 0.059nm at 1.676ns and reached maximum of 0.171nm at 0.371ns in the trajectory. (Figure 12)
RMSF “root mean square fluctuation” of the Ligand produced an average at about 0.049nm and maximum at 0.114nm an appropriate foundation for further inquiry is established during the simulation. (Figure 13)
2D structural analysis of MDS Examination of the compound 11 MD presented hydrogen bonds, Carbon and Pi-sigma interactions. within hydrogen bonds the stable regions Ser, Lys, Asp, Gly, Arg, Gln. The compound 11 and the residues Gly, Gln, and Ser interact via carbon and pi-donor hydrogen bonds (Figure 14 bottom). The amino acid residues Ser, Lys, Asp, Gly, Arg, and Gln exhibited notable interactions within the binding site, and they were deemed crucial for maintaining the stability of compound 11 within the cavity. Compound no. 11 consistently formed hydrogen bonds at a high frequency during the entire simulation. In particular, it was observed that Lys 329 played a significant role in facilitating the adoption of an active conformation by compound no.11.
Conformational Change Analysis by Post-Docking
Molecular Docking
In order to examine residue interactions, hydrogen bonds, and binding energy values, molecular docking studies were conducted on the above conformations. The original GABA-AT structure, as found in the protein database (www.rcsb.org) with the PDB structure 10HV, served as the starting point. For protein preparation, polar hydrogens were added while applying Kollman's united atomic charges. Polar hydrogens were added and Gasteiger charges were assigned in the case of the ligand file. To facilitate the molecular docking process, the Autogrid feature was utilized, enabling the selection of an active site and the customization of the grid size to 60 × 60 × 60 points with a spacing of 0.375 Å. Due to this configuration, the energy map could be calculated using a distance-dependent dielectric constant function.
The active binding site for the enzyme is shown in the designated grid box, providing ample space for ligand rotation and translation. To explore various ligand conformation poses within the active site of GABA-AT, orientations were employed using the Lamarckian genetic algorithm. The docking performance utilized default parameters, with the addition of specific metal parameters as required. The search algorithm analysis was employed to generate ligand poses within the GABA-AT binding site, considering both roto-translational movement and the ligand's internal degrees of freedom. With the help of the Discovery Studio non-bonding interaction visualizer, the best positions were selected based on binding affinity. To assess the accuracy of RMSD from the docking simulation values between the reference and predicted structures were calculated. This analysis helped confirm whether or not the docking simulation was able to accurately identify docking poses.
Simulations of Molecular Dynamics
Simulations of molecular dynamics were conducted using Gromacs 2023 to explore the conformational changes in the protein-ligand complex within a solvent system. For the simulation, the complex was positioned in the centre of an orthorhombic cubic box, and TIP3P water molecules were added to fill the box, with additional buffer space between the box edges and protein atoms to facilitate dynamic simulations.
To account for boundary conditions, the box volume was adjusted based on the type of complex, and To balance the system, counter ions such as Na+ and Cl- were injected at random.
The simulations were carried out under the Berendsen NVT ensemble, maintaining a temperature of 10 K initially to restrain heavy atoms in the solute. Then, under the isothermal isotropic ensemble, At 300 K and 1 atm, simulations of molecular dynamics were run with a thermostat relaxation time of 10 ps (NPT). To control temperature and pressure during MD simulations, By using the Martyna-Tobias-Klein barostat method and the Nose-Hoover thermostat, conditions were kept at 300 K and 1 atm, respectively.
Throughout the MD simulations, trajectory frames were collected and analyzed using simulation interaction diagrams to assess fluctuations and gain insights into the system's behaviour.
Synthesis
In this work, a series of N,N-phthaloyl GABA was produced and its anticonvulsant effectiveness was assessed. The N,N-phthaloyl GABA was prepared in the manner shown in Scheme. 1-(2-chlorophenyl)-4-(1,3-dioxoisoindolin-2-yl)butanamide that has been substituted. After condensation with aniline and aldehyde in dichloromethane, the 4-(1,3-dioxoisoindolin-2-yl)butanoic acid derivatives produced substituted N,N-phthaloyl GABA. It then further reacted with the appropriate aldehydes, resulting in the production of phthalimide derivatives, namely N'-(2-chlorobenzylidene)-4-(1,3-dioxoisoindolin-2-yl)butanehydrazide. We performed thorough characterizations of every chemical we synthesised using spectral, analytical, and physical analysis. infrared (IR) spectra showed signals from amide bonds between 3300 and 3200 cm-1, a C=N peak between 1620 and 1590 cm-1, and NH stretching vibrations at 3450 cm-1. Further information was also revealed by the 1H-NMR spectra, which showed N-H signals in the form of a singlet at 3324 ppm and 8.35 ppm, indicating the conformation of these molecules (Table 8)
Compound 11:
N-(2-chlorophenyl)-4-(1,3-dioxoisoindolin-2-yl) butanamide, white flaky crystal, m.p:208-210℃, % yield: 70, Rf:0.62, [(CHCl3: MeOH) (9:1), Molecular Formula: C16H18ClN, Mol. wt: 259.77 g/mol, IR: 3269 (NH Stretch), 2925(C-H Stretch Aromatic), 1712 (C=O Stretch), 1530 (C=C Aromatic), 1292 (CN stretch) 717 (C-Cl Stretch), 1H NMR: (CDCL3, 400MHz, δppm); 8.28(s, 1H, CONH), 7.04-7.74 (m, 8H, Aryl-H), 3.85-3.88 (t, 3H, CH2), 3.76-3.79 (t, 1H, CH2), 2.15-2.21 (m, 2H, CH2).
Pharmacological Activity
The test compounds were administered intraperitoneally to mice at doses of 30, 100, and 300 mg/kg. The assessment of anticonvulsant activity was conducted 30 minutes and 4 hours after drug administration.
Anti-Convulsant Activity of Active Synthesized Compounds:
Latency in Development of Seizures
In this study, subcutaneous injection of pentylenetetrazol (ScPTZ, 80mg/kg) was administered to develop convulsions in mice. Results obtained from the study indicated that Compound 1 (Sch1-1) at the doses of 30mg/kg, 100mg/kg, and 300mg/kg increases the latency to develop seizures significantly in dose dependent manner in mice in compared to standard i.e. Sodium valproate and PTZ. Compound 2(Sch-1-3) at the doses of 30mg/kg, 100mg/kg showed significant increase in latency in development of seizures but at 300mg/kg latency was decreased compared to 30 and 100mg/kg yet it is much better compared to standard drug Sodium Valproate and PTZ. Compound 3 (Sch1-6) At 30mg/kg and 100mg/kg exhibited quite similar latency in development of seizures and at the dose of 300mg/kg the latency was reduced compared to initial two doses ie. 30mg/kg, and 100mg/kg but these results were found to be better in comparison to standard group of Sodium Valproate and PTZ (Figure 19).
Table 9.
Latency in the Development of Seizures (time Second) (Data represented below as mean±SEM).
| Control | Sodium valproate | PTZ | Compound 1 (30mg) | Compound 2 (30mg) | Compound 3 (30mg) | Compound 1 (100mg) | Compound 2 (100mg) | Compound 3 (100mg) | Compound 1 (300mg) | Compound 2 (300mg) | Compound 3 (300mg) |
|---|---|---|---|---|---|---|---|---|---|---|---|
| 0 | 30±50.199 | 12.3±21.058 | 132.6±70.47 | 212.16±241.94 | 181.5±208.91 | 454.8±356.59** | 836.1±79.5*** | 186±207.36 | 283.16±311.0 | 93±146.171 | 132±1111.864 |
Histopathology Study
Histopathology result for kidney, spleen and Liver of group 1,2,3 and 4 (control) are shown in Figure 19, Figure 20 and Figure 21 at 45X. for acute oral toxicity.
Acute oral Toxicity Report
Histopathology Study for Anticonvulsant Activity
Conclusion
Theoretically predicted active compounds were crafted based on the analysis of nonbonding interactions within the enzyme's active site, favouring hydrogen bonding interactions with Lys329, Ser 1689, Lys 93, and Leu149. Among these compounds, 2 and 11 exhibited favourable binding energy values, aligning well with predictions from both the QSAR model and molecular docking. The QSAR model revealed a significant correlation with GABA-AT inhibition. Structural findings suggest that N, N-phthaloyl GABA derivatives, when substituted with a 2-chloroaniline chain at the R2 position of the triazole ring, demonstrate improved predicted bioactivity. While theoretical ADMET predictions of the selected compounds require further experimental validation, compounds 2 and 11, which displayed strong interactions, have undergone molecular dynamics simulations for additional investigation.
The molecular dynamics (MD) simulation of compound no.11 highest-scoring, complex with 1OHV demonstrated robust hydrogen bond interactions with key residues in the active site, namely Lys780, Asp749, and Arg643. An analysis of hydrogen bonding, root-mean-square deviation (RMSD), root-mean-square fluctuation (RMSF), and radius of gyration (RoG) for compound 11 indicated a stable behavior of the complex, suggesting its potential as a human GABA-AT inhibitor.
Consequently, compound no. 11, being the top-performing candidate with strong pharmacological activity, holds promise as a novel compound for epilepsy treatment.
Author Contributions
Rajan kumar kurmi contributed to the concept, design, in-silico work and writing of the article for intellectual content. Snigdha Srivastava has help in writing the manuscript. Reema Sinha and Pallavi M Lavhale have provided technical & scientific support. Anurag Agrawal and Sandeep Kumar Bansal have revised the final manuscript.
Funding
All the Funding has been provided by Ram-eesh institute of vocational and technical education, Greater Noida
Data Availability Statement
All the Data will be available on request
Conflicts of Interest
There is no Competing interests
Ethical Approval
AAll the animal in the research were approved by IAEC of Ram-eesh Institute of vocational and technical education, Greater Noida.
References
- Idris A, Ayeni N, Sallau M. Synthesis and anticonvulsant studies of N-Benzyl-3-[(Chlorophenyl) Amino] propanamides. ChemSearch Journal [Internet]. 2015 Apr 23 [cited 2023 May 7];2(1–2):53–8. Available from: https://www.ajol.info/index.php/csj/article/view/116154.
- Brodie MJ. Antiepileptic drug therapy the story so far. Seizure. 2010 Dec 1;19(10):650–5. [CrossRef]
- Cogent Chemistry. 2016 [cited 2023 May 7]; Available from: https://www.tandfonline.com/action/journalInformation?journalCode=oach20.
- Miloushev VZ, Levine JA, Arbing MA, Hunt JF, Pitt GS, Palmer AG. Solution Structure of the NaV1.2 C-terminal EF-hand Domain. Journal of Biological Chemistry. 2009 Mar 6;284(10):6446–54.
- Ghidini E, Delcanale M, De Fanti R, Rizzi A, Mazzuferi M, Rodi D, et al. Synthesis and anticonvulsant activity of a class of 2-amino 3-hydroxypropanamide and 2-aminoacetamide derivatives. Bioorg Med Chem. 2006 May 15;14(10):3263–74. [CrossRef]
- Ferreira LG, Dos Santos RN, Oliva G, Andricopulo AD. Molecular Docking and Structure-Based Drug Design Strategies. Molecules 2015, Vol 20, Pages 13384-13421 [Internet]. 2015 Jul 22 [cited 2023 Sep 26];20(7):13384–421. Available from: https://www.mdpi.com/1420-3049/20/7/13384/htm.
- Arthur DE, Uzairu A, Mamza P, Abechi SE, Shallangwa G. Insilco study on the toxicity of anti-cancer compounds tested against MOLT-4 and p388 cell lines using GA-MLR technique. Beni Suef Univ J Basic Appl Sci. 2016 Dec 1;5(4):320–33. [CrossRef]
- Abdulfatai U, Uzairu A, Uba S. Quantitative structure activity relationship study of anticonvulsant activity of α_substituted acetamido-N-benzylacetamide derivatives. Cogent Chem [Internet]. 2016 Dec 31 [cited 2023 Sep 26];2(1):1166538. Available from: https://www.tandfonline.com/doi/abs/10.1080/23312009.2016.1166538.
- Kitchen DB, Decornez H, Furr JR, Bajorath J. Docking and scoring in virtual screening for drug discovery: methods and applications. Nature Reviews Drug Discovery 2004 3:11 [Internet]. 2004 Nov [cited 2023 Sep 26];3(11):935–49. Available from: https://www.nature.com/articles/nrd1549.
- Pires DEV, Blundell TL, Ascher DB. pkCSM: Predicting small-molecule pharmacokinetic and toxicity properties using graph-based signatures. J Med Chem [Internet]. 2015 May 14 [cited 2023 Jun 11];58(9):4066–72. Available from: http://structure.bioc.cam.ac.uk/.
- Autin L, Johnson G, Hake J, Olson A, Sanner M. UPy: A ubiquitous CG python API with biological-modeling applications. IEEE Comput Graph Appl [Internet]. 2012 [cited 2023 Sep 26];32(5):50–61. Available from: https://www.researchgate.net/scientific-contributions/Arthur-J-Olson-39888415.
- Storici P, De Biase D, Bossa F, Bruno S, Mozzarelli A, Peneff C, et al. Structures of γ-Aminobutyric Acid (GABA) Aminotransferase, a Pyridoxal 5′-Phosphate, and [2Fe-2S] Cluster-containing Enzyme, Complexed with γ-Ethynyl-GABA and with the Antiepilepsy Drug Vigabatrin. Journal of Biological Chemistry [Internet]. 2004 Jan 2 [cited 2023 Sep 27];279(1):363–73. Available from: http://www.jbc.org/article/S0021925818528246/fulltext.
- Tropsha A. Best Practices for QSAR Model Development, Validation, and Exploitation. Mol Inform [Internet]. 2010 Jul 12 [cited 2023 Sep 27];29(6–7):476–88. Available from: https://onlinelibrary.wiley.com/doi/full/10.1002/minf.201000061.
- Ghidini E, Delcanale M, De Fanti R, Rizzi A, Mazzuferi M, Rodi D, et al. Synthesis and anticonvulsant activity of a class of 2-amino 3-hydroxypropanamide and 2-aminoacetamide derivatives. Bioorg Med Chem. 2006 May 15;14(10):3263–74. [CrossRef]
- Tropsha A. Best Practices for QSAR Model Development, Validation, and Exploitation. Mol Inform [Internet]. 2010 Jul 12 [cited 2023 Jun 11];29(6–7):476–88. Available from: https://onlinelibrary.wiley.com/doi/full/10.1002/minf.201000061.
- Yap CW. PaDEL-descriptor: An open source software to calculate molecular descriptors and fingerprints. J Comput Chem [Internet]. 2011 May 1 [cited 2023 Jun 11];32(7):1466–74. Available from: https://onlinelibrary.wiley.com/doi/full/10.1002/jcc.21707.
- Yap CW. PaDEL-descriptor: An open source software to calculate molecular descriptors and fingerprints. J Comput Chem [Internet]. 2011 May 1 [cited 2023 Sep 27];32(7):1466–74. Available from: https://onlinelibrary.wiley.com/doi/full/10.1002/jcc.21707.
- Ambure P, Aher RB, Gajewicz A, Puzyn T, Roy K. “NanoBRIDGES” software: Open access tools to perform QSAR and nano-QSAR modeling. Chemometrics and Intelligent Laboratory Systems. 2015 Oct 15;147:1–13.
- Arthur DE, Uzairu A, Mamza P, Abechi SE, Shallangwa G. Insilco study on the toxicity of anti-cancer compounds tested against MOLT-4 and p388 cell lines using GA-MLR technique. Beni Suef Univ J Basic Appl Sci. 2016 Dec 1;5(4):320–33. [CrossRef]
- Rogers D, Hopfinger AJ. Application of Genetic Function Approximation to Quantitative Structure-Activity Relationships and Quantitative Structure-Property Relationships. J Chem Inf Comput Sci [Internet]. 1994 Jul 1 [cited 2023 Sep 27];34(4):854–66. Available from: https://pubs.acs.org/doi/abs/10.1021/ci00020a020.
- (PDF) QSAR Model for Prediction of some Non-Nucleoside inhibitors of Dengue virus serotype 4 NS5 Using GFA-MLR Approach [Internet]. [cited 2023 Sep 27]. Available from: https://www.researchgate.net/publication/346658792_QSAR_Model_for_Prediction_of_some_Non-Nucleoside_inhibitors_of_Dengue_virus_serotype_4_NS5_Using_GFA-MLR_Approach.
- Ragavendran JV, Sriram D, Patel SK, Reddy IV, Bharathwajan N, Stables J, et al. Design and synthesis of anticonvulsants from a combined phthalimide–GABA–anilide and hydrazone pharmacophore. Eur J Med Chem [Internet]. 2007 [cited 2023 Jun 19];42(2):146–51. Available from: https://www.academia.edu/23542822/Design_and_synthesis_of_anticonvulsants_from_a_combined_phthalimide_GABA_anilide_and_hydrazone_pharmacophore.
- Topliss JG, Costello RJ. Chance Correlations in Structure-Activity Studies Using Multiple Regression Analysis. J Med Chem [Internet]. 1972 Oct 1 [cited 2023 Jun 11];15(10):1066–8. Available from: https://pubs.acs.org/doi/abs/10.1021/jm00280a017.
- Van Damme S, Bultinck P. A new computer program for QSAR-analysis: ARTE-QSAR. J Comput Chem [Internet]. 2007 Aug 1 [cited 2023 Jun 11];28(11):1924–8. Available from: https://onlinelibrary.wiley.com/doi/full/10.1002/jcc.20664.
- Arthur DE, Uzairu A, Mamza P, Abechi SE, Shallangwa G. Insilco study on the toxicity of anti-cancer compounds tested against MOLT-4 and p388 cell lines using GA-MLR technique. Beni Suef Univ J Basic Appl Sci. 2016 Dec 1;5(4):320–33. [CrossRef]
- Tropsha A. Best Practices for QSAR Model Development, Validation, and Exploitation. Mol Inform [Internet]. 2010 Jul 12 [cited 2023 Jun 11];29(6–7):476–88. Available from: https://onlinelibrary.wiley.com/doi/full/10.1002/minf.201000061.
- Roy K. On some aspects of validation of predictive quantitative structure–activity relationship models. http://dx.doi.org/101517/174604412121567 [Internet]. 2007 Dec [cited 2023 Jun 11];2(12):1567–77. Available from: https://www.tandfonline.com/doi/abs/10.1517/17460441.2.12.1567.
- Tropsha A. Best Practices for QSAR Model Development, Validation, and Exploitation. Mol Inform [Internet]. 2010 Jul 12 [cited 2023 Sep 27];29(6–7):476–88. Available from: https://onlinelibrary.wiley.com/doi/full/10.1002/minf.201000061.
- Arthur DE, Uzairu A, Mamza P, Abechi SE, Shallangwa G. Insilco study on the toxicity of anti-cancer compounds tested against MOLT-4 and p388 cell lines using GA-MLR technique. Beni Suef Univ J Basic Appl Sci. 2016 Dec 1;5(4):320–33. [CrossRef]
- Roy K, Das RN, Ambure P, Aher RB. Be aware of error measures. Further studies on validation of predictive QSAR models. Chemometrics and Intelligent Laboratory Systems. 2016 Mar 15;152:18–33. [CrossRef]
- Plante J, Werner S. JPlogP: An improved logP predictor trained using predicted data. J Cheminform [Internet]. 2018 Dec 14 [cited 2023 Sep 27];10(1):1–10. Available from: https://jcheminf.biomedcentral.com/articles/10.1186/s13321-018-0316-5.
- Danishuddin, Khan AU. Descriptors and their selection methods in QSAR analysis: paradigm for drug design. Drug Discov Today [Internet]. 2016 Aug 1 [cited 2023 Sep 27];21(8):1291–302. Available from: https://pubmed.ncbi.nlm.nih.gov/27326911/.
- Danishuddin, Khan AU. Descriptors and their selection methods in QSAR analysis: paradigm for drug design. Drug Discov Today. 2016 Aug 1;21(8):1291–302. [CrossRef]
- Pires DEV, Blundell TL, Ascher DB. pkCSM: Predicting Small-Molecule Pharmacokinetic and Toxicity Properties Using Graph-Based Signatures. J Med Chem [Internet]. 2015 May 14 [cited 2023 Sep 27];58(9):4066–72. Available from: https://pubmed.ncbi.nlm.nih.gov/25860834/.
- Bracht F, De Alencastro RB. Dynamical study, hydrogen bond analysis, and constant pH simulations of the beta carbonic anhydrase of Methanobacterium thermoautotrophicum. J Biomol Struct Dyn [Internet]. 2016 [cited 2023 Sep 27];34(2):259–71. Available from: https://pubmed.ncbi.nlm.nih.gov/25874810/.
- Bailey AG, Lowe CP. Milch shake: An Efficient Method for Constraint Dynamics Applied to Alkanes. J Comput Chem. 2009 Nov 30;30(15):2485–93. [CrossRef]
- Berendsen HJC, Postma JPM, Van Gunsteren WF, Dinola A, Haak JR. Molecular dynamics with coupling to an external bath. Journal of Chemical Physics [Internet]. 1984 [cited 2023 Sep 27];81(8):3684–90. Available from: https://research.rug.nl/en/publications/molecular-dynamics-with-coupling-to-an-external-bath.
Figure 2.
Scheme 2 (Anilines).
Figure 2.
Scheme 2 (Anilines).
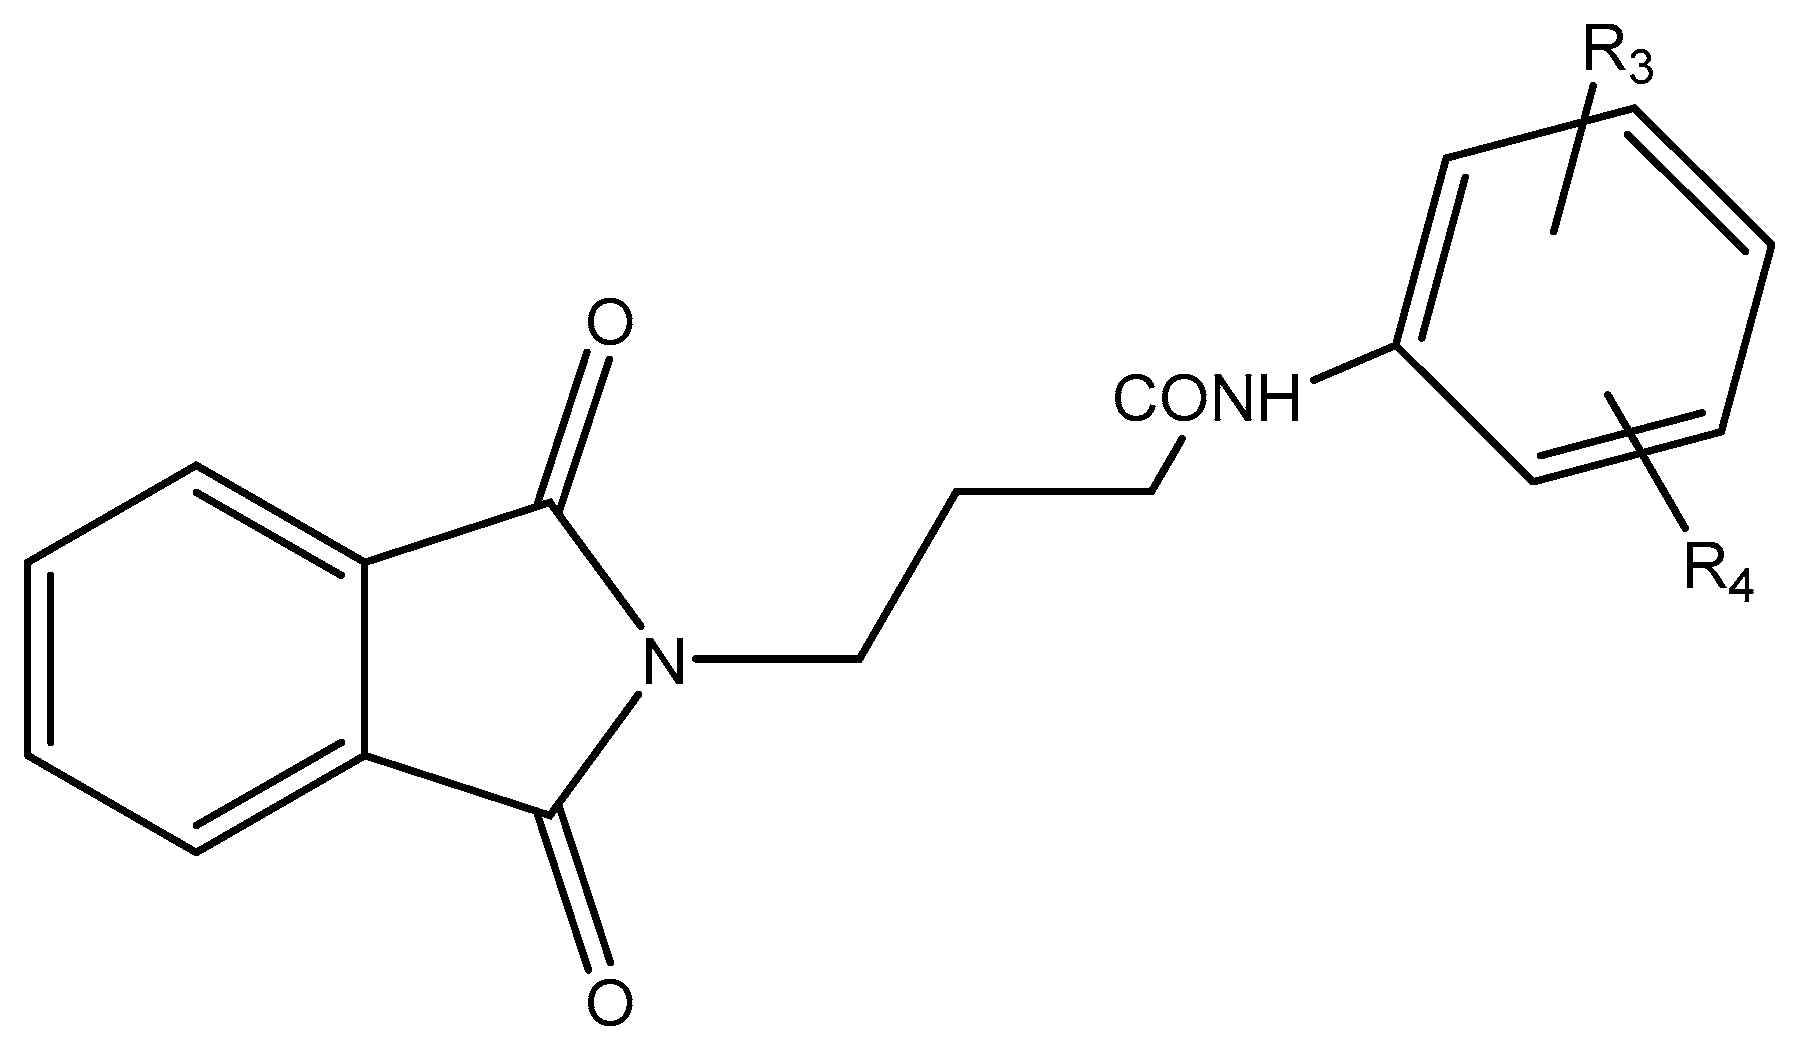
Figure 3.
Docking of Compound 2 with anti-epileptic protein (1OHV) responsible of inhibition GABA-AT protein. (a) shows the 3D interaction of protein and Compound 2, (b) shows the 2D interaction of protein and Compound 2.
Figure 3.
Docking of Compound 2 with anti-epileptic protein (1OHV) responsible of inhibition GABA-AT protein. (a) shows the 3D interaction of protein and Compound 2, (b) shows the 2D interaction of protein and Compound 2.
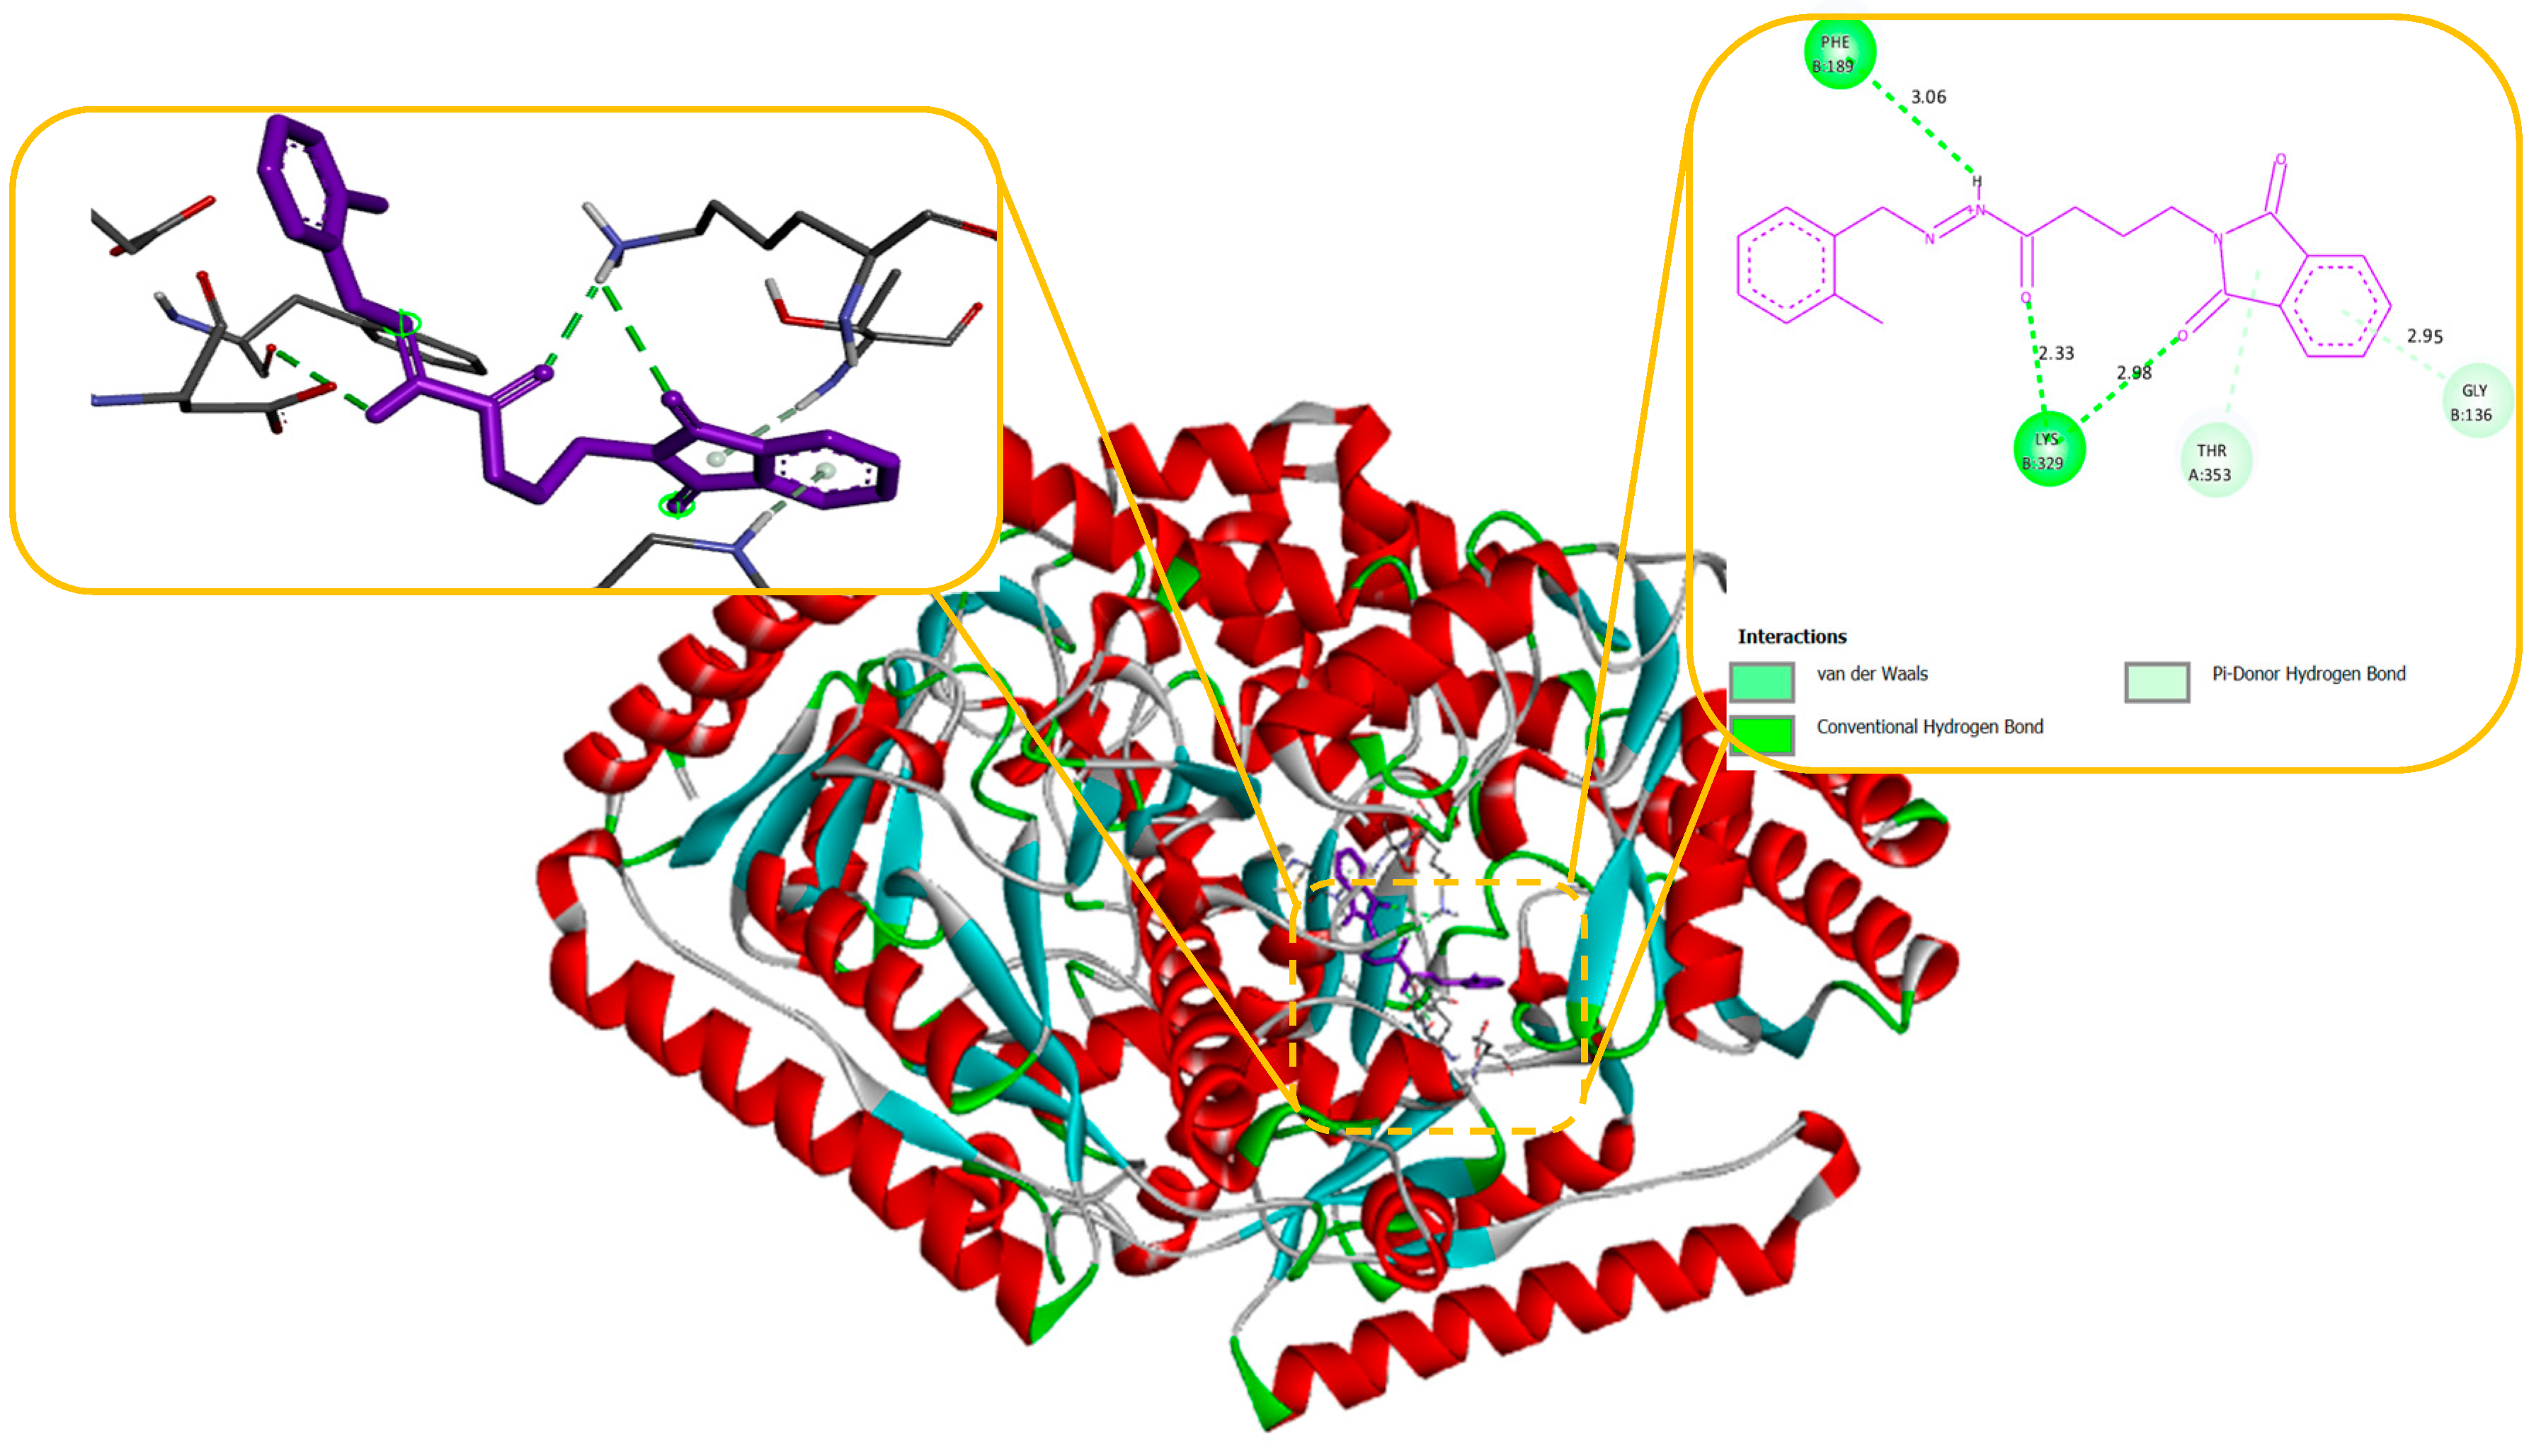
Figure 4.
Docking of Compound no. 2 with Sodium channel protein (2KAV) responsible of inhibition Na Channel in protein. (a) shows the 3D interaction of protein and Compound 2, (b) shows the 2D interaction of protein and Compound 2.
Figure 4.
Docking of Compound no. 2 with Sodium channel protein (2KAV) responsible of inhibition Na Channel in protein. (a) shows the 3D interaction of protein and Compound 2, (b) shows the 2D interaction of protein and Compound 2.
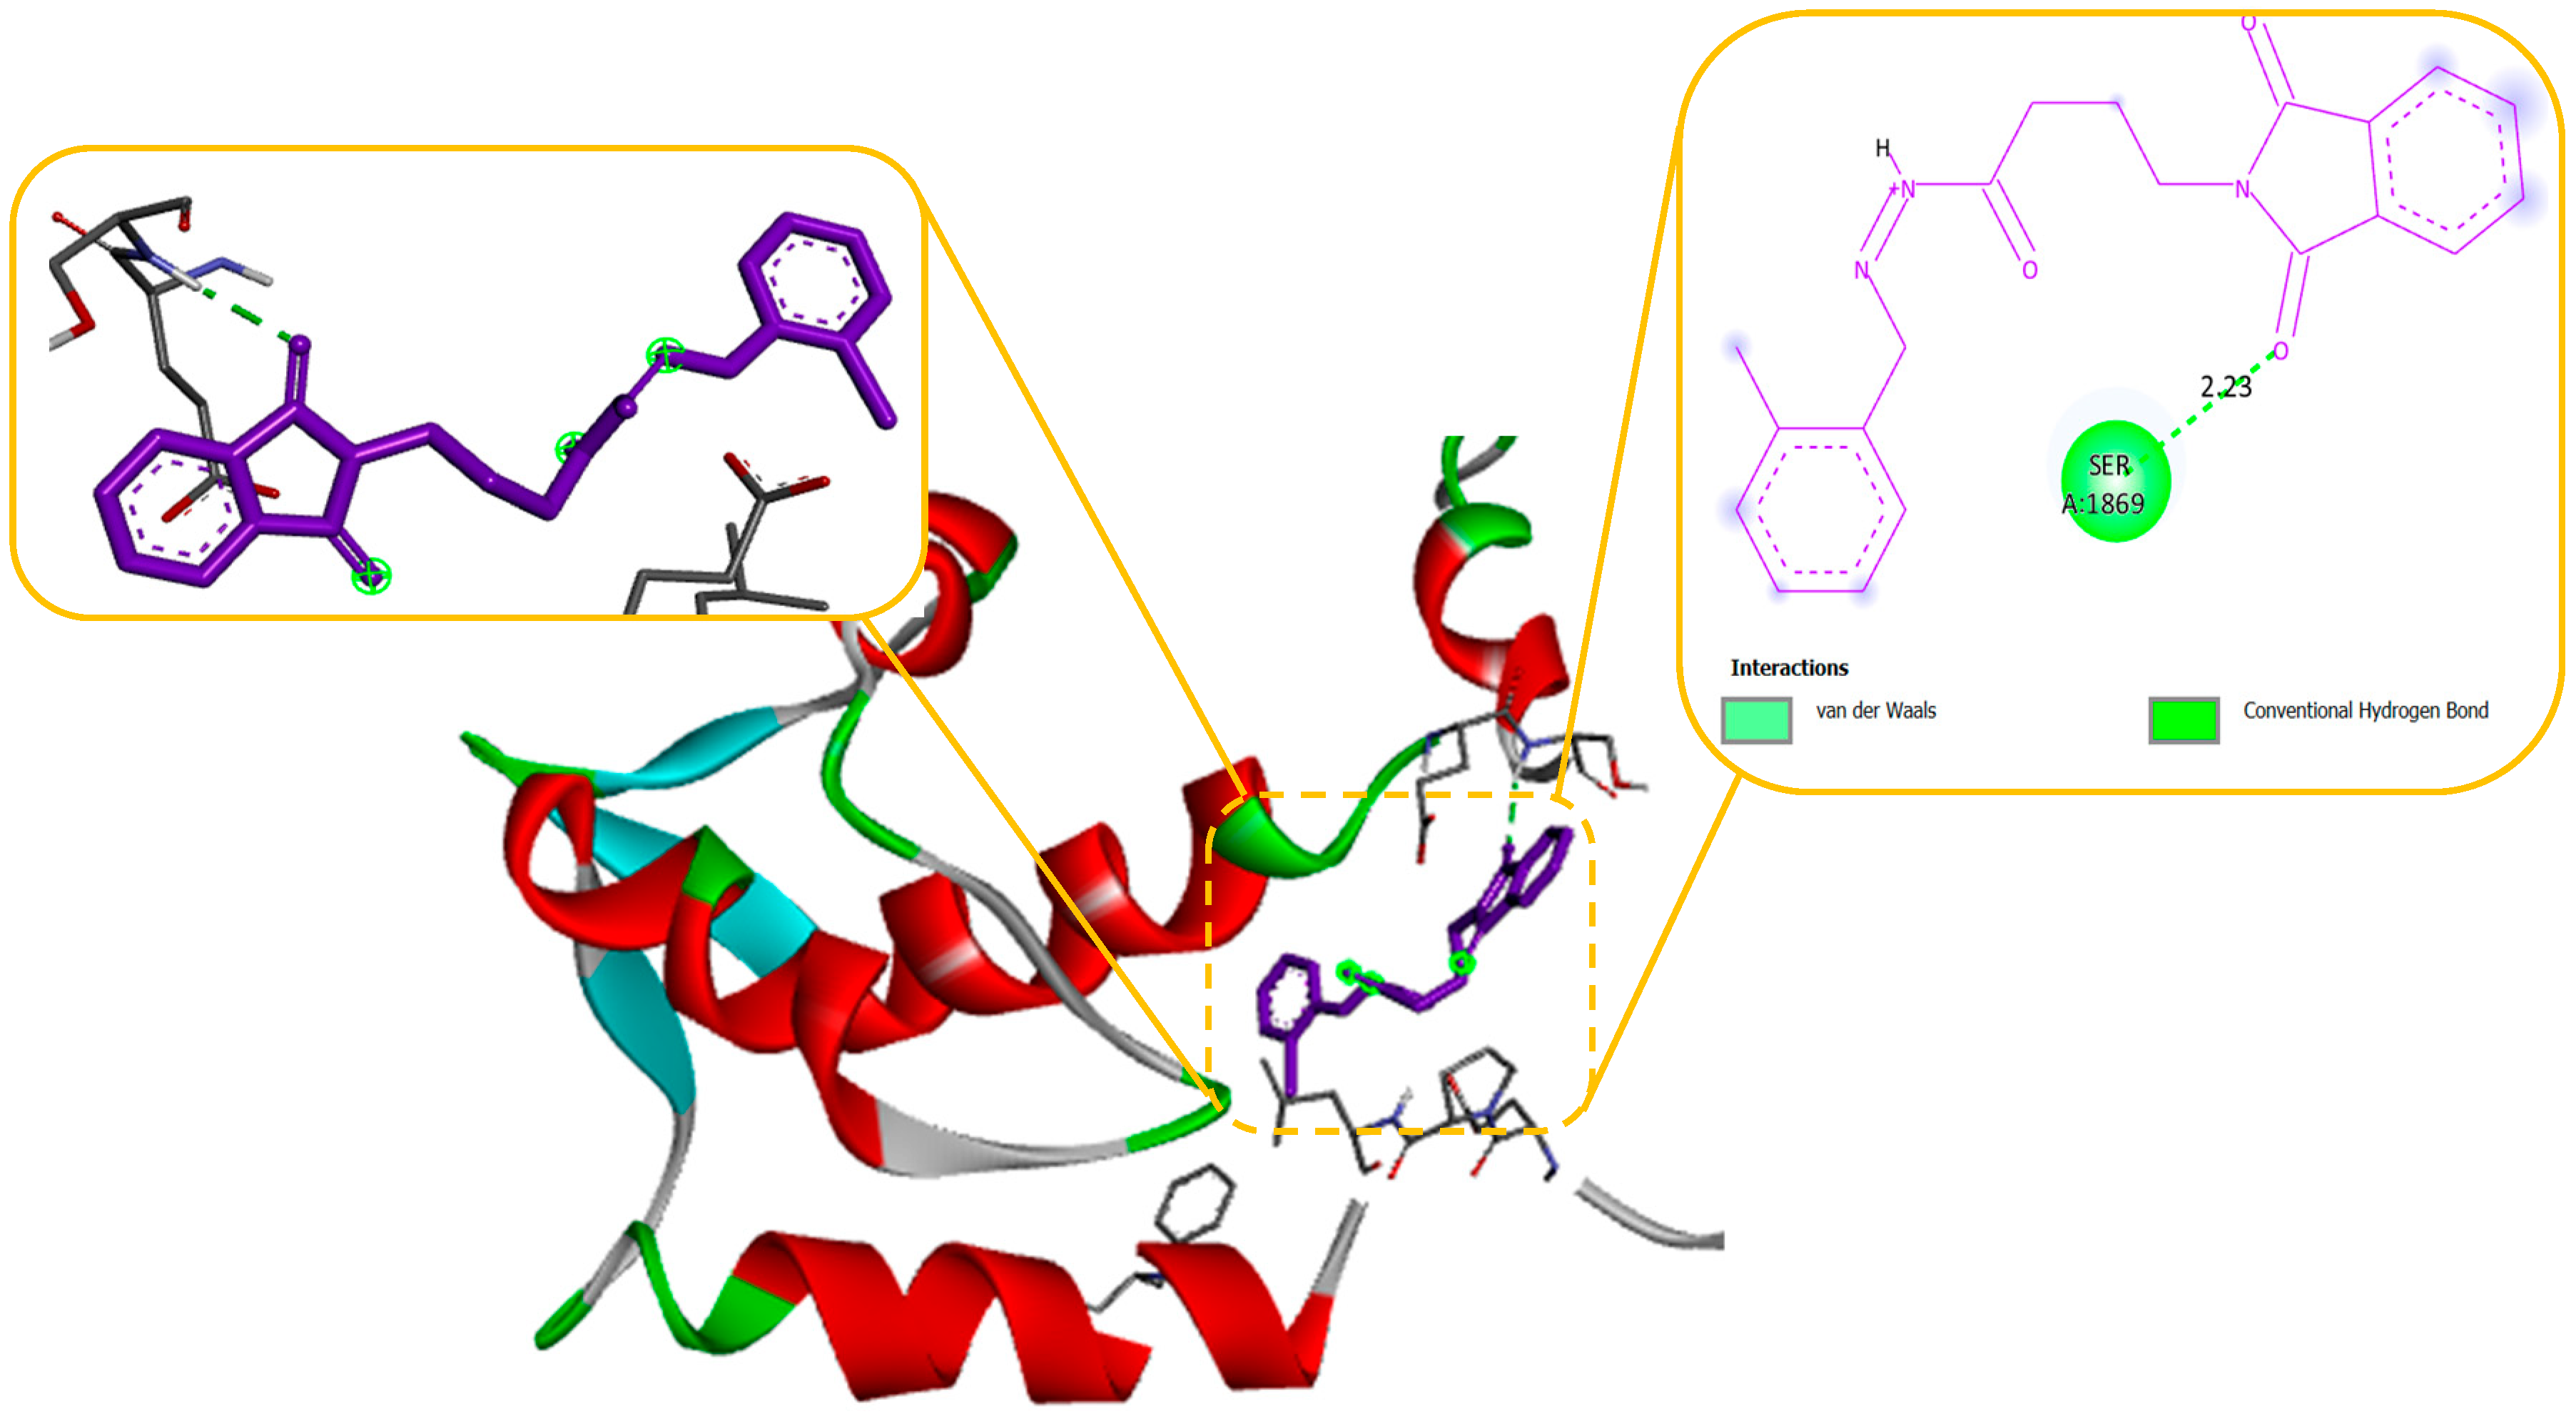
Figure 5.
Docking of Compound 2 with JNK protein (2WAJ) responsible for inhibition of JNK Channel in protein. (a) shows the 3D interaction of protein and Compound 2, (b) shows the 2D interaction of protein and Compound 2.
Figure 5.
Docking of Compound 2 with JNK protein (2WAJ) responsible for inhibition of JNK Channel in protein. (a) shows the 3D interaction of protein and Compound 2, (b) shows the 2D interaction of protein and Compound 2.
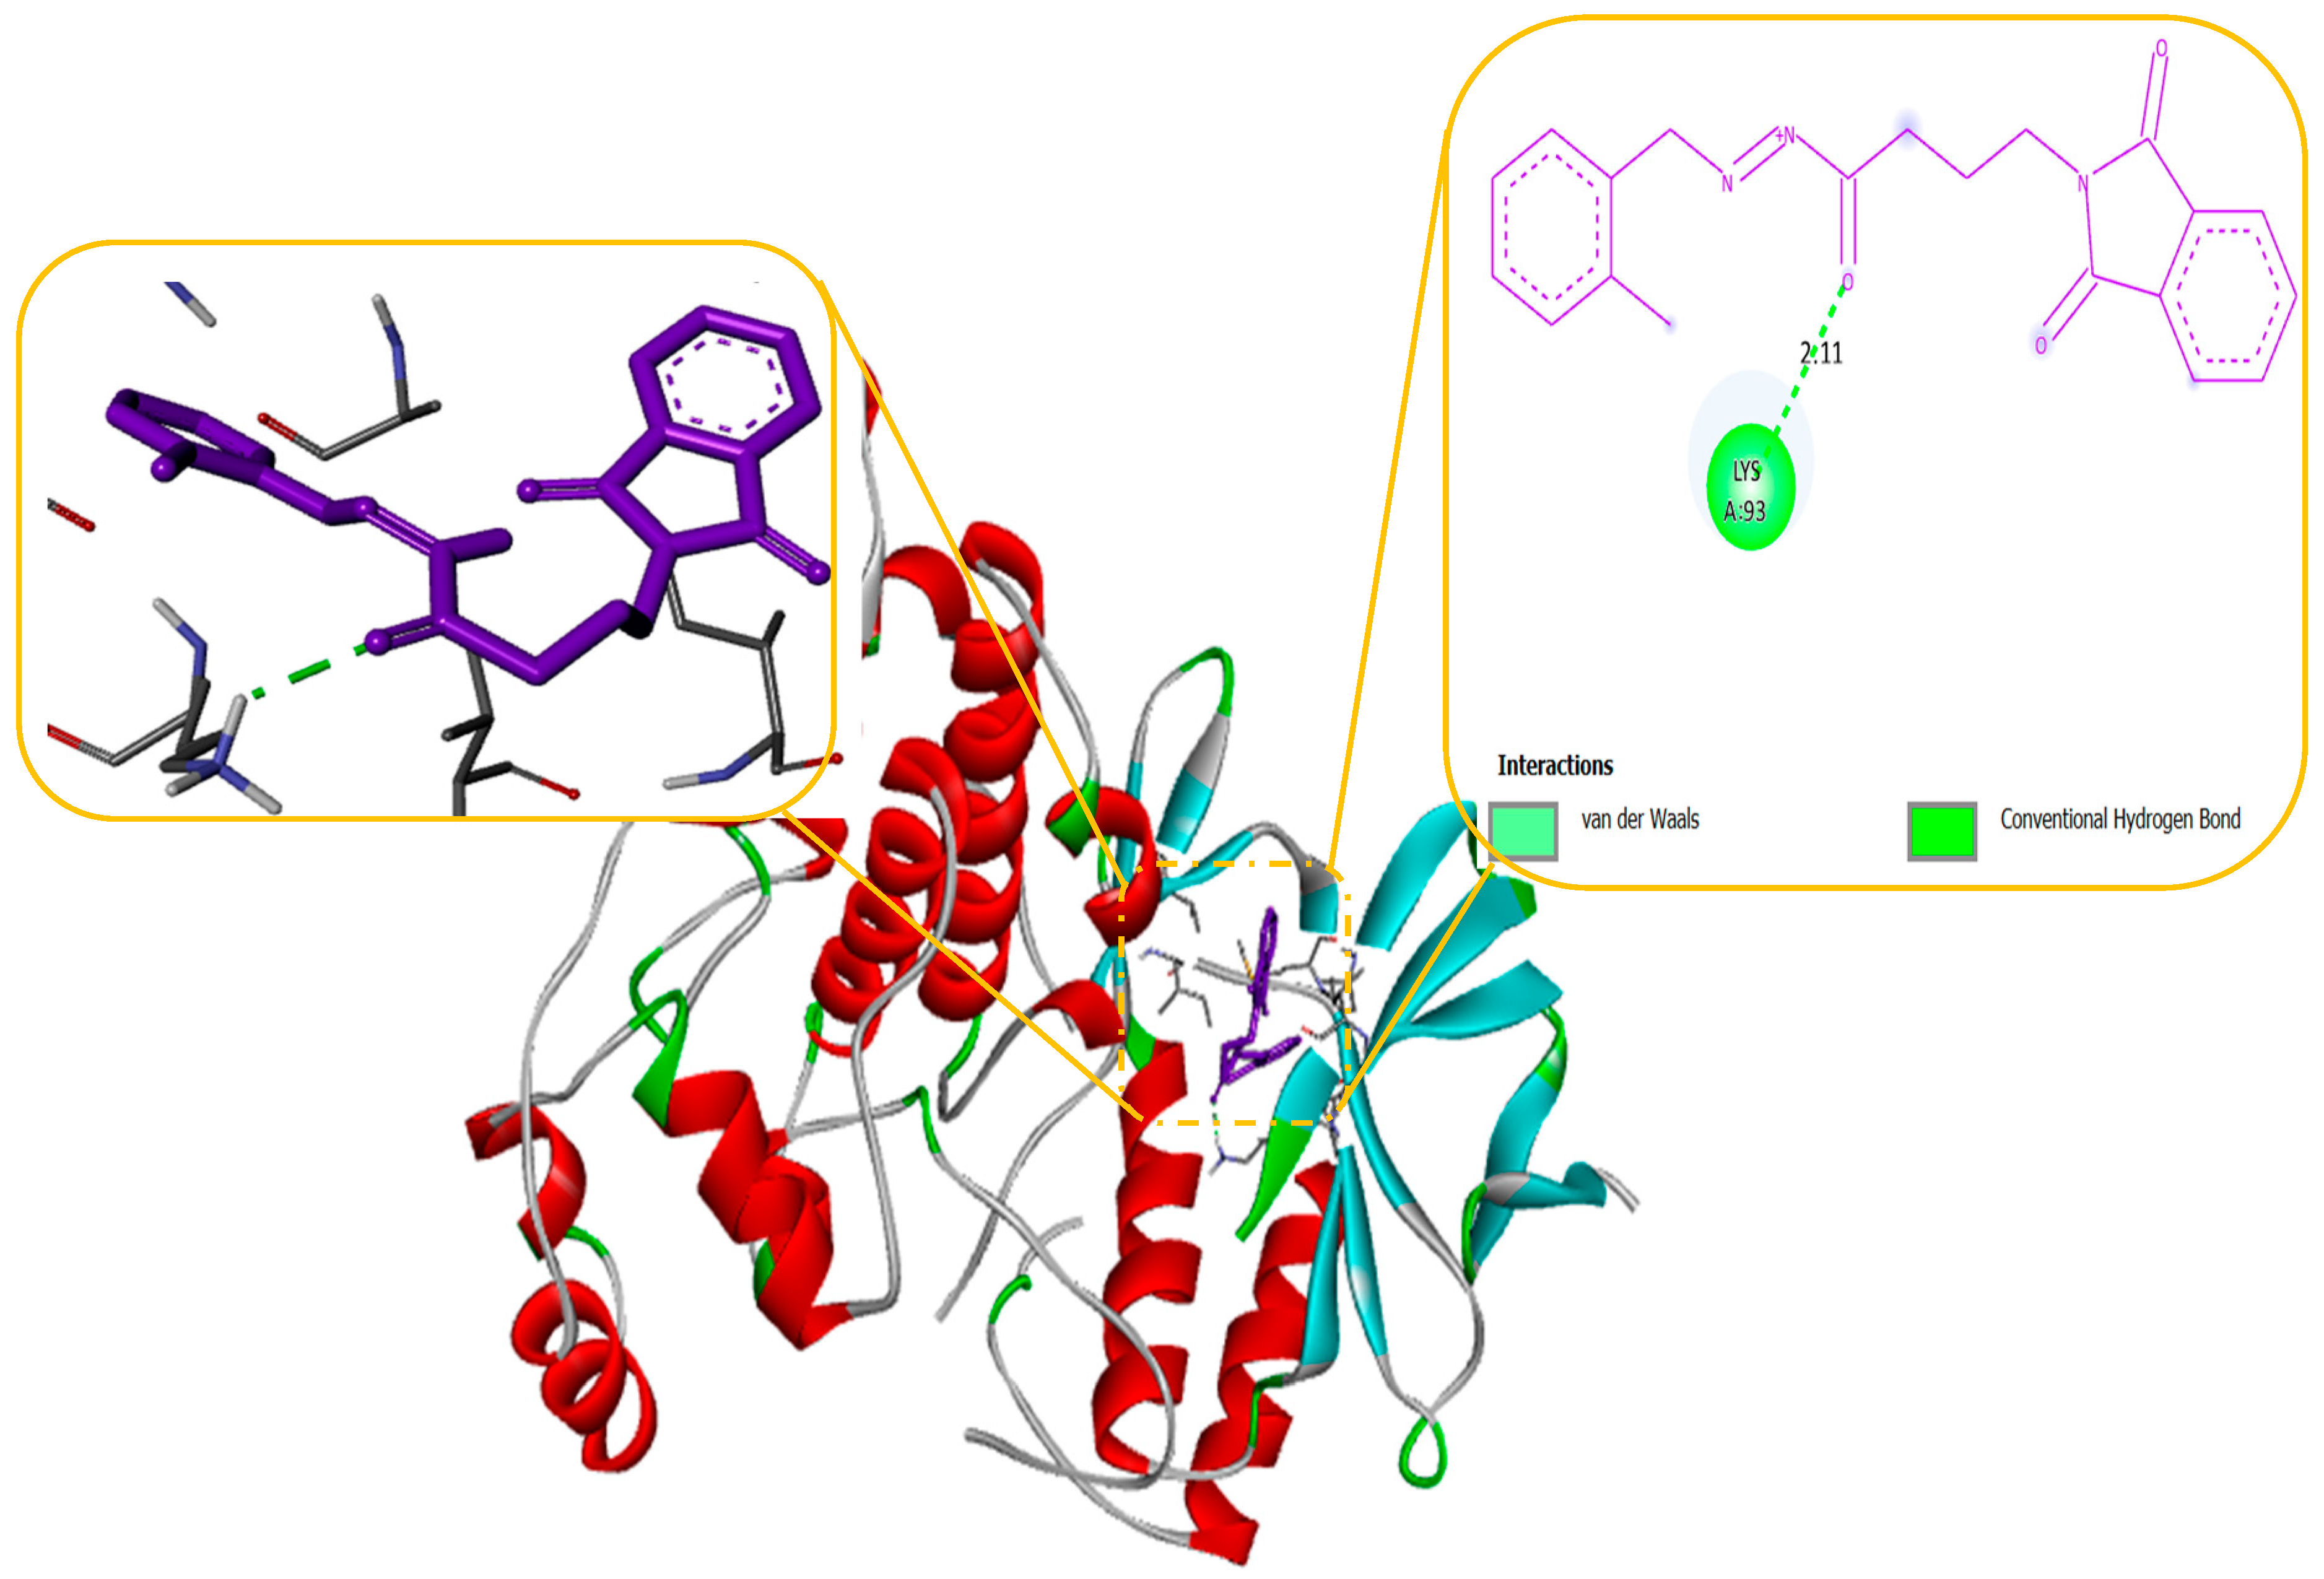
Figure 6.
Docking of Compound no. 2 with Anti-oxidant protein (1HDZ) responsible for inhibition of Anti-oxidant in protein. (a) shows the 3D interaction of protein and Compound 2, (b) shows the 2D interaction of protein and Compound 2.
Figure 6.
Docking of Compound no. 2 with Anti-oxidant protein (1HDZ) responsible for inhibition of Anti-oxidant in protein. (a) shows the 3D interaction of protein and Compound 2, (b) shows the 2D interaction of protein and Compound 2.
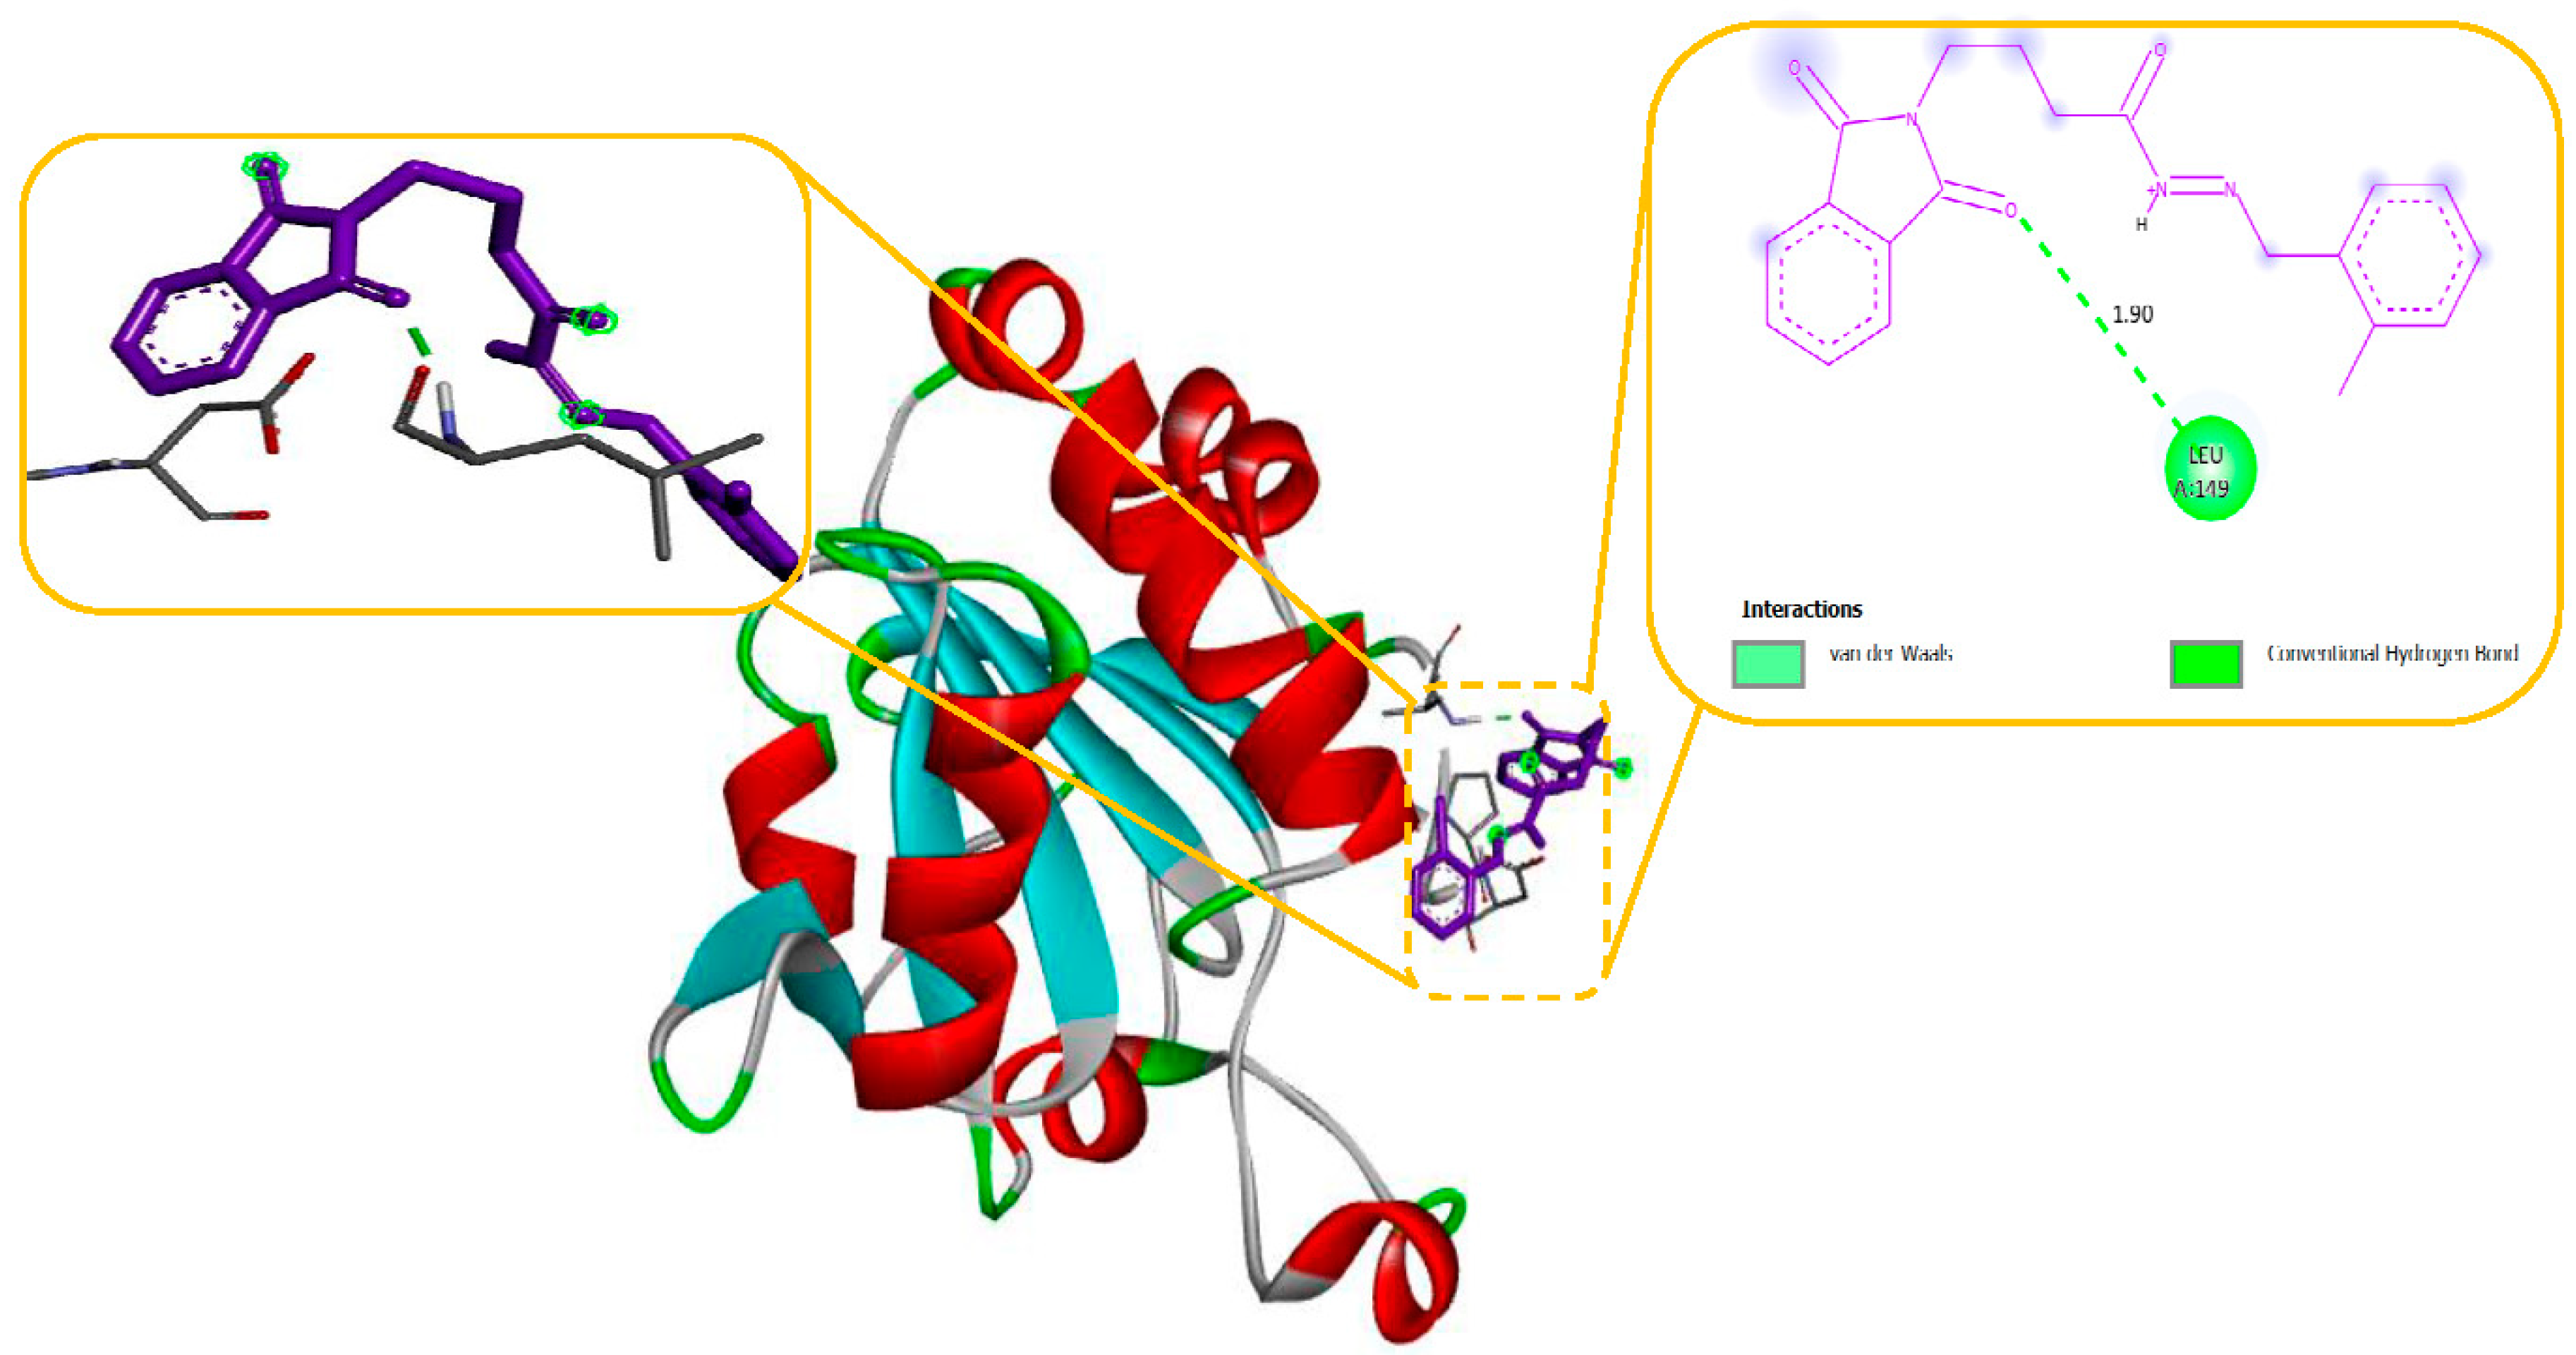
Figure 8.
Docking of Compound no. 11 with Sodium channel protein (2KAV) responsible of inhibition Na Channel in protein. (a) shows the 3D interaction of protein and Compound 2, (b) shows the 2D interaction of protein and Compound 2.
Figure 8.
Docking of Compound no. 11 with Sodium channel protein (2KAV) responsible of inhibition Na Channel in protein. (a) shows the 3D interaction of protein and Compound 2, (b) shows the 2D interaction of protein and Compound 2.
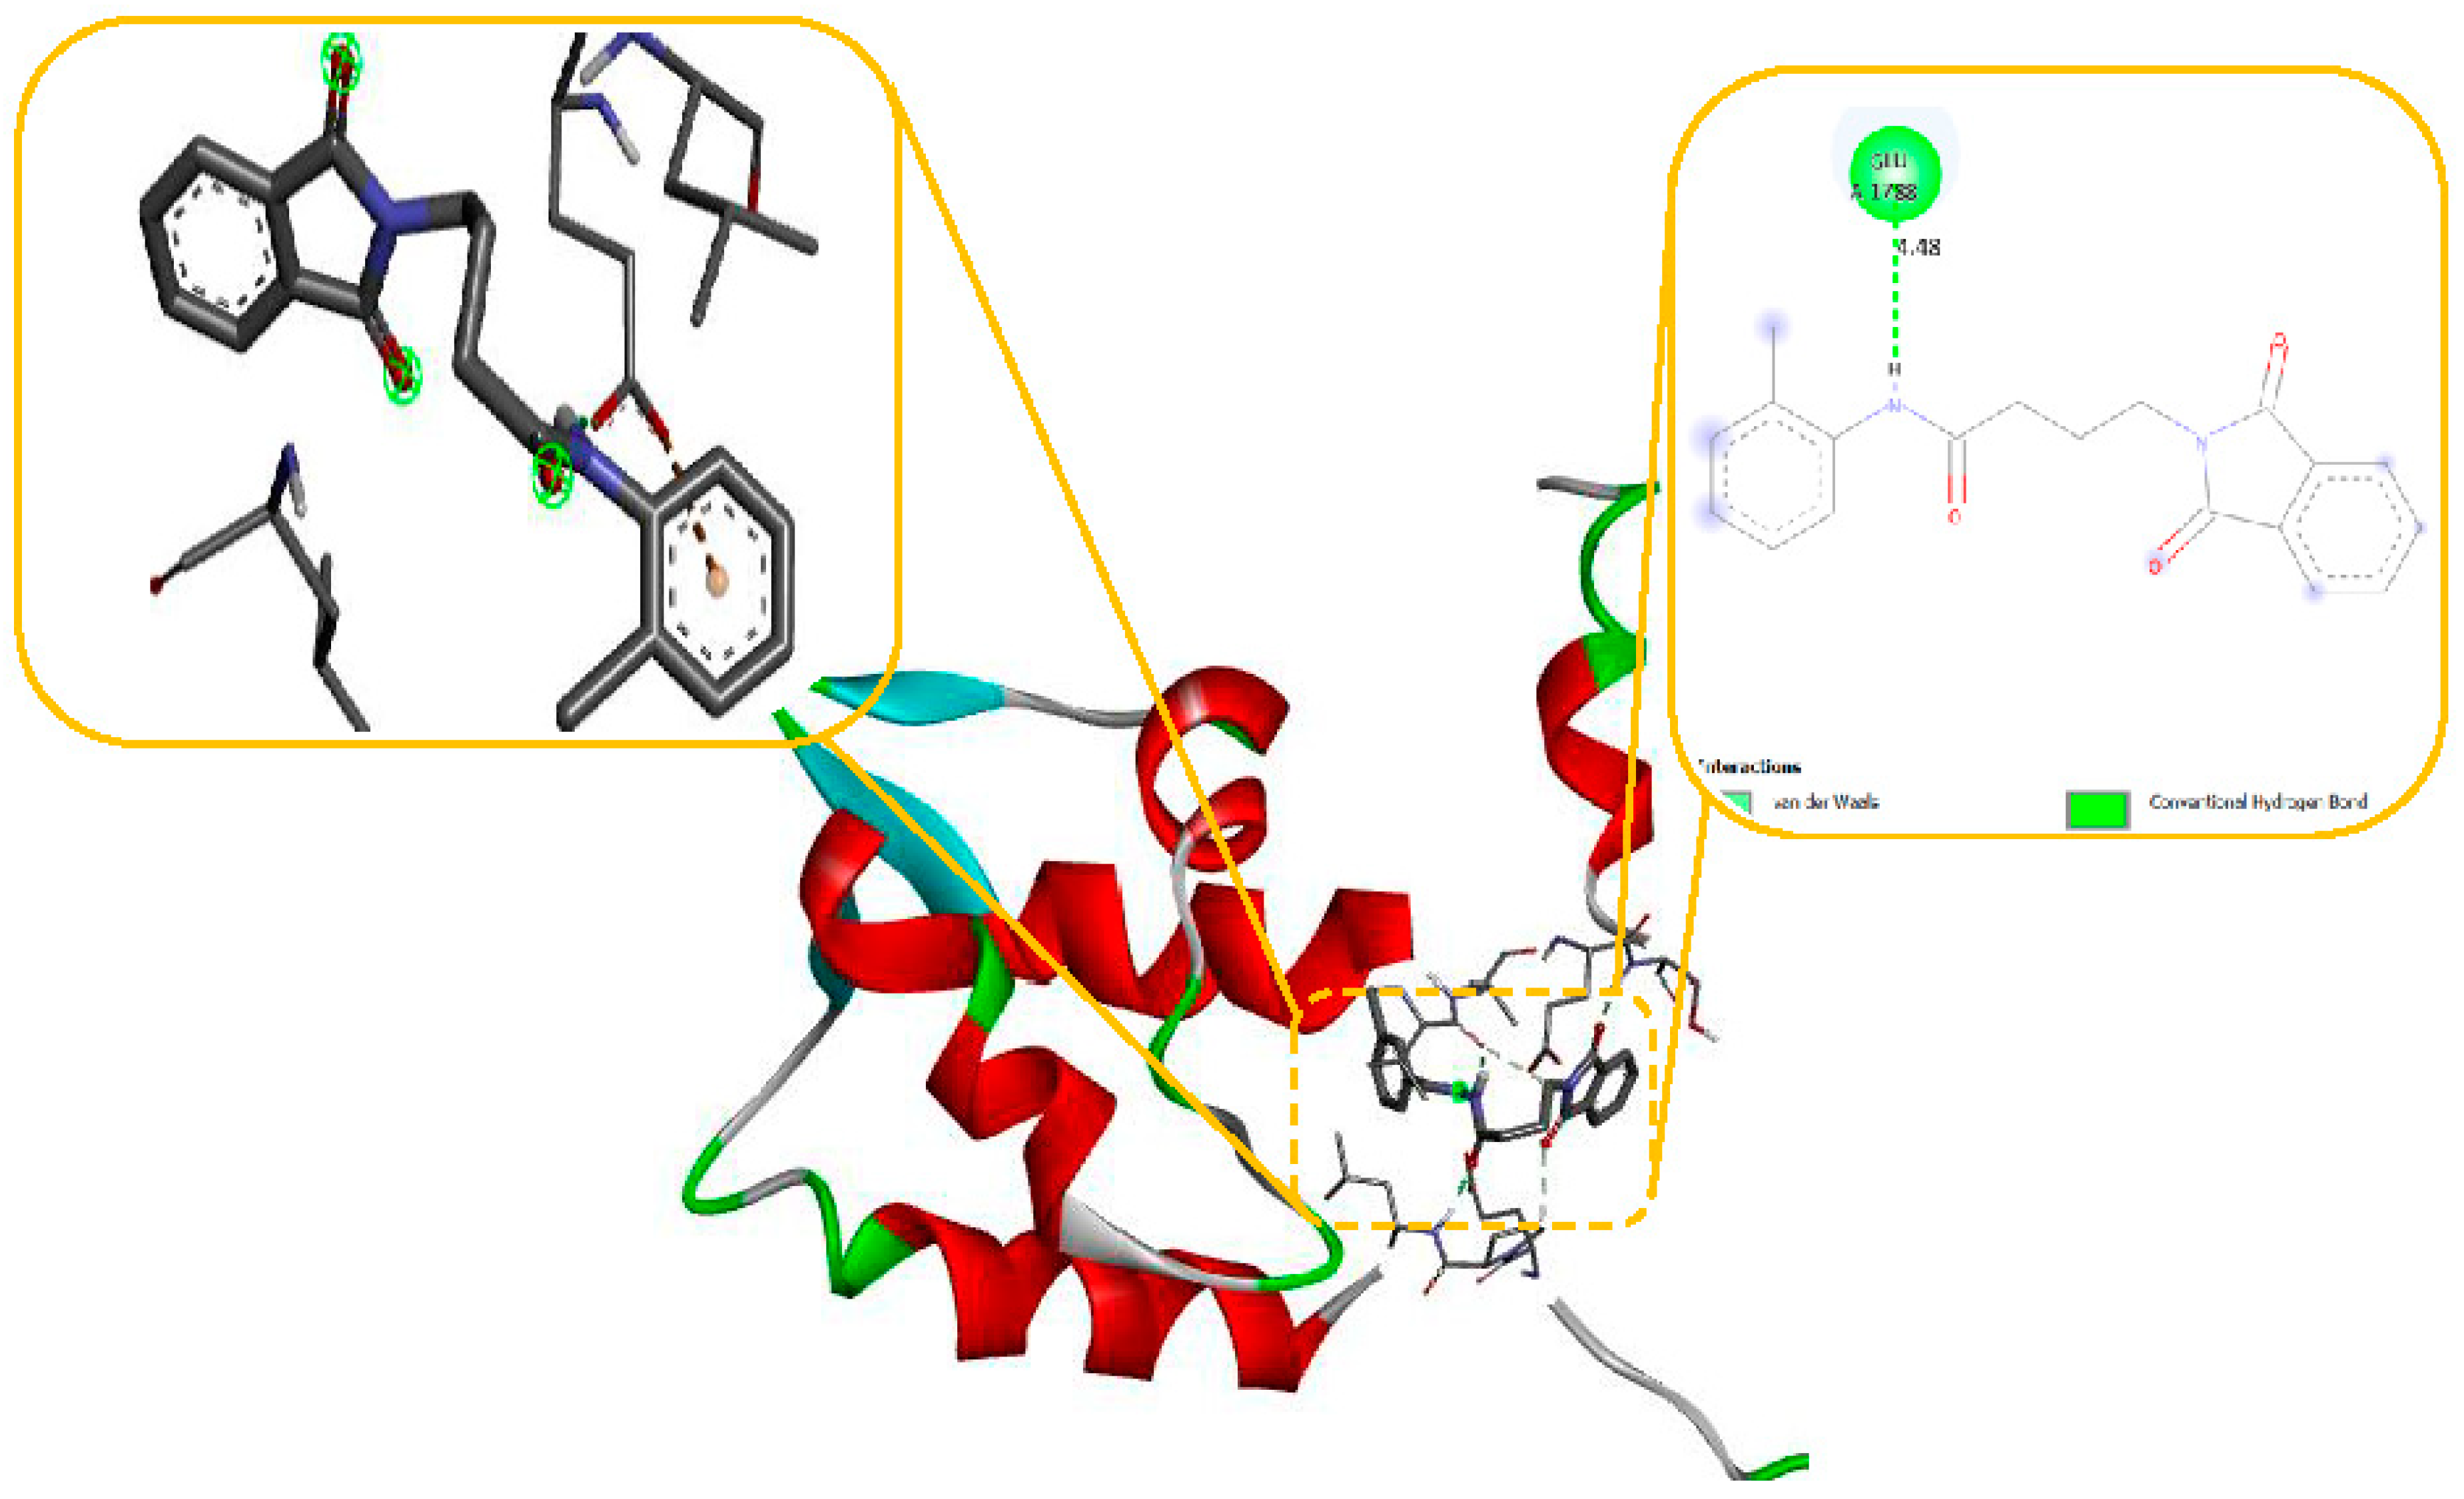
Figure 9.
Docking of Compound 11 with JNK protein (2WAJ) responsible for inhibition of JNK Channel in protein. (a) shows the 3D interaction of protein and Compound 2, (b) shows the 2D interaction of protein and Compound 2.
Figure 9.
Docking of Compound 11 with JNK protein (2WAJ) responsible for inhibition of JNK Channel in protein. (a) shows the 3D interaction of protein and Compound 2, (b) shows the 2D interaction of protein and Compound 2.
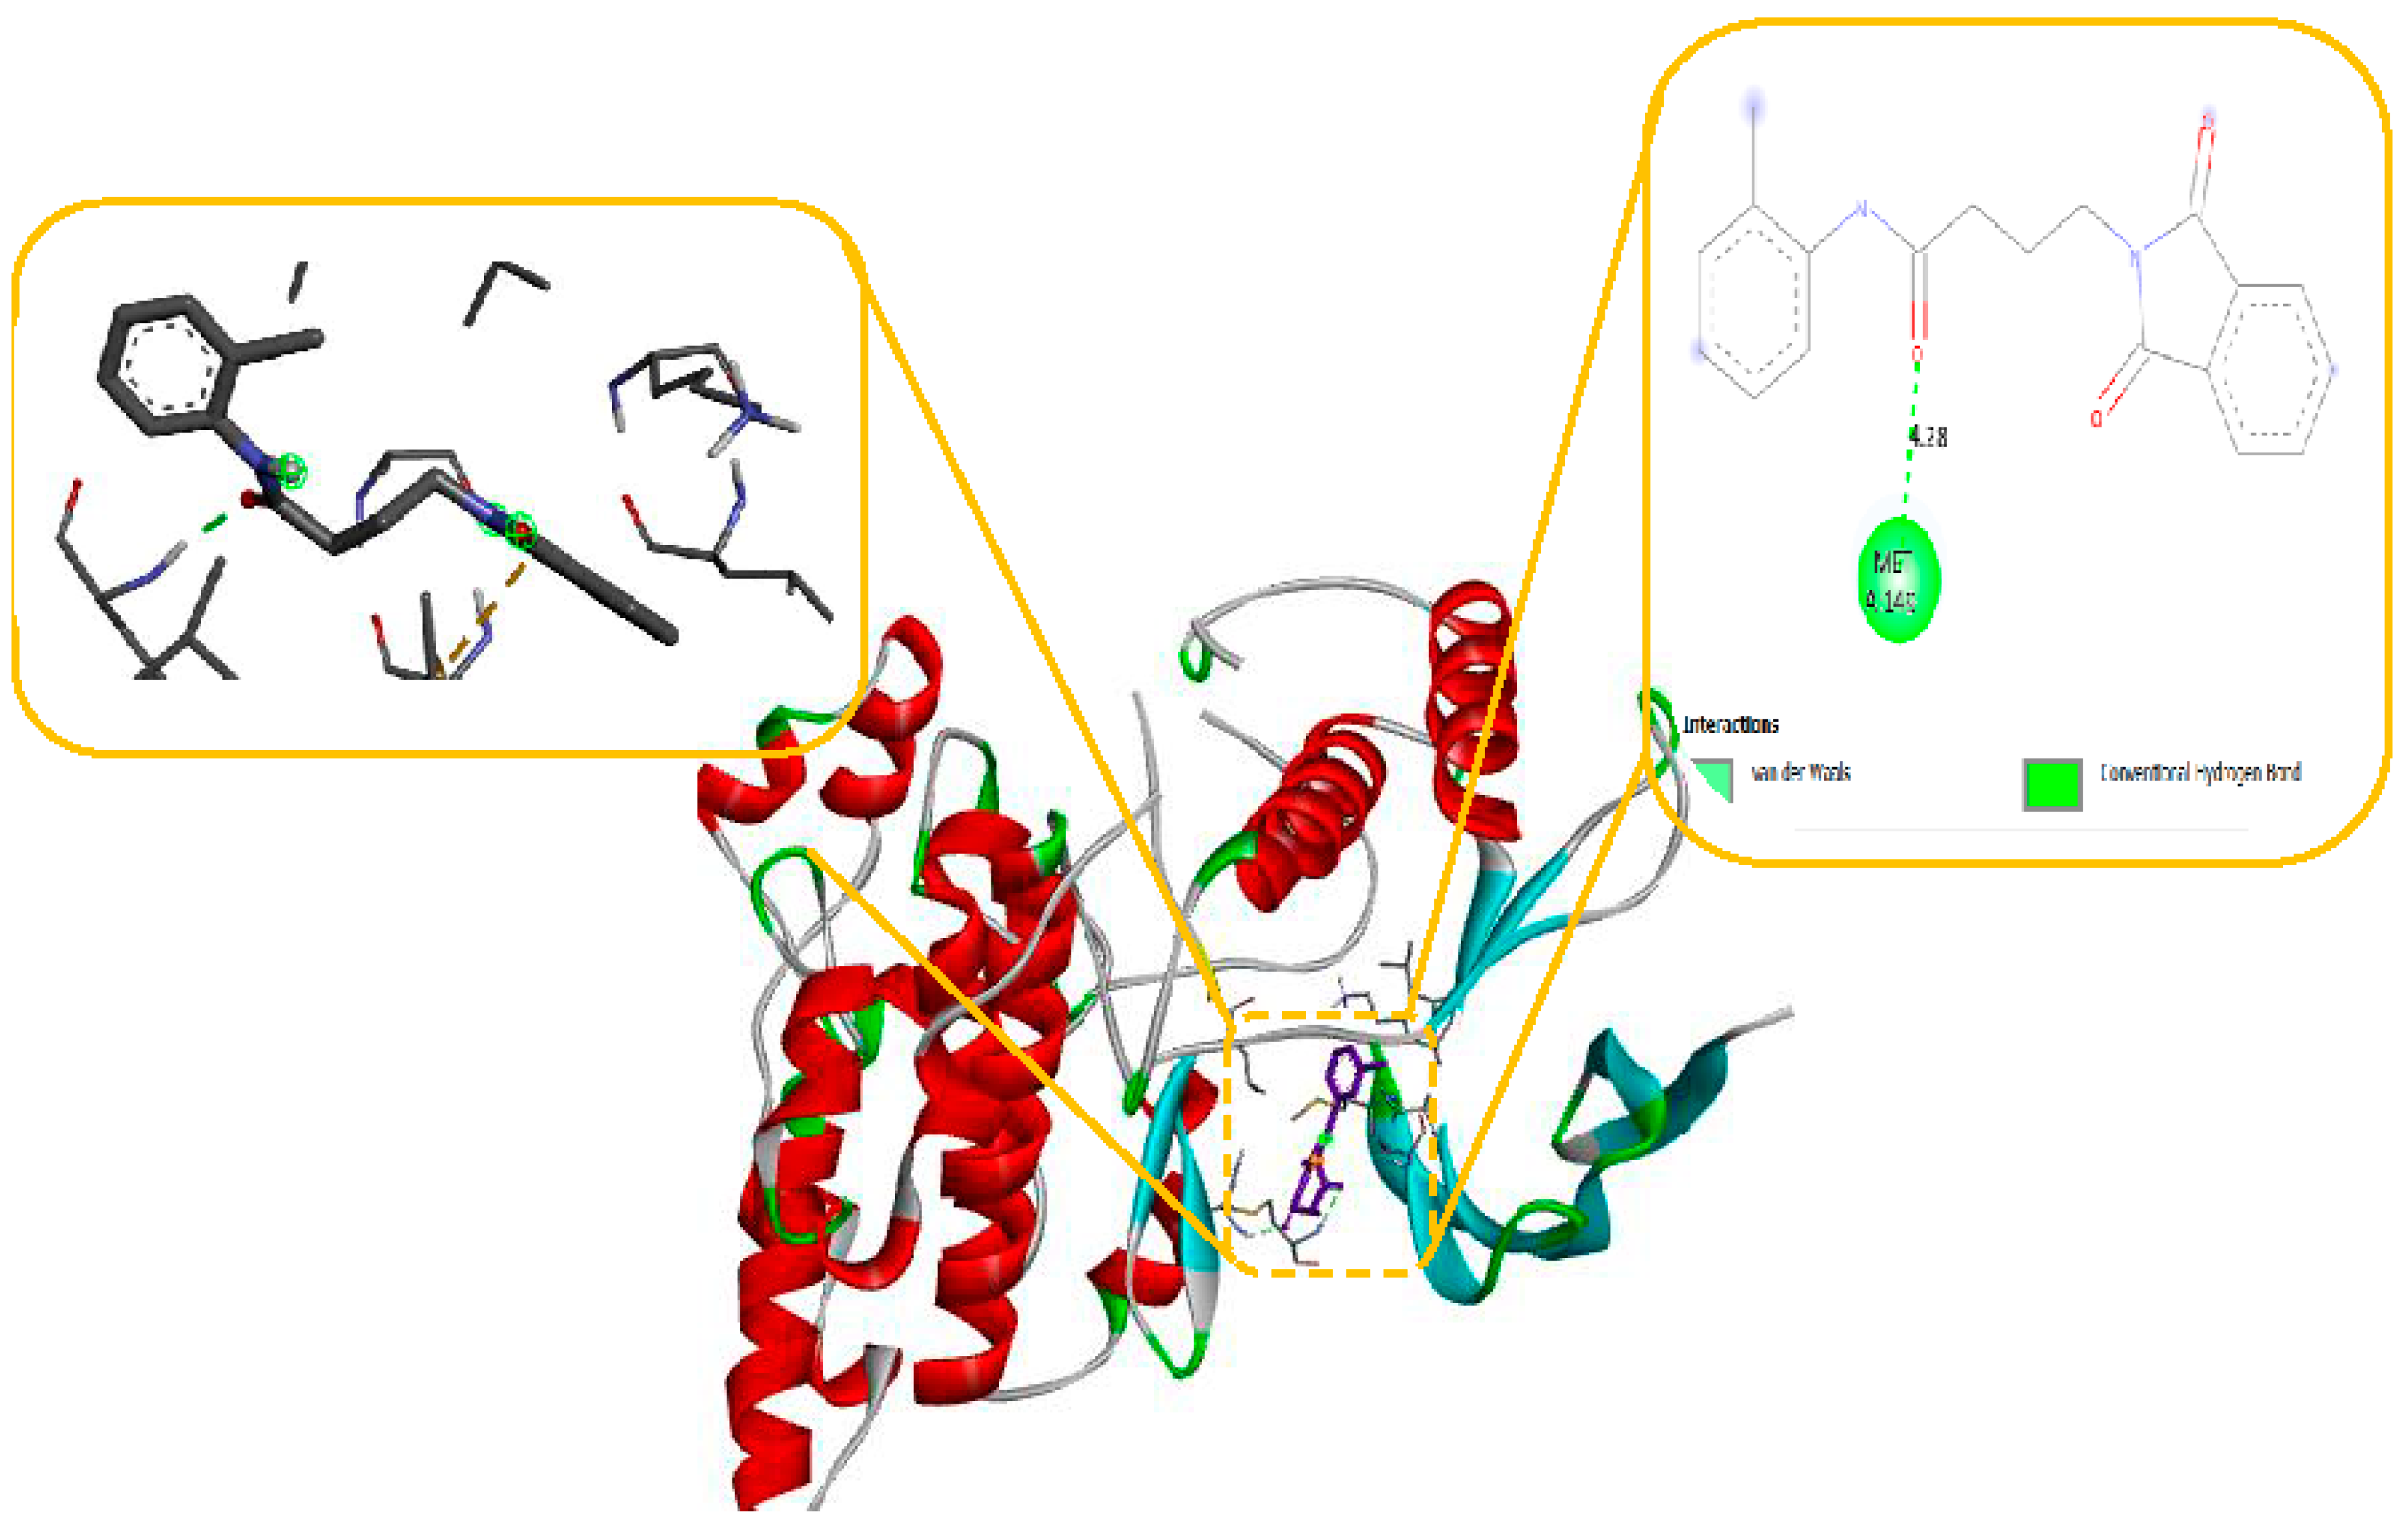
Figure 10.
Docking of Compound no. 11 with Anti-oxidant protein (1HDZ) responsible for inhibition of Anti-oxidant in protein. (a) shows the 3D interaction of protein and Compound 2, (b) shows the 2D interaction of protein and Compound 2.
Figure 10.
Docking of Compound no. 11 with Anti-oxidant protein (1HDZ) responsible for inhibition of Anti-oxidant in protein. (a) shows the 3D interaction of protein and Compound 2, (b) shows the 2D interaction of protein and Compound 2.
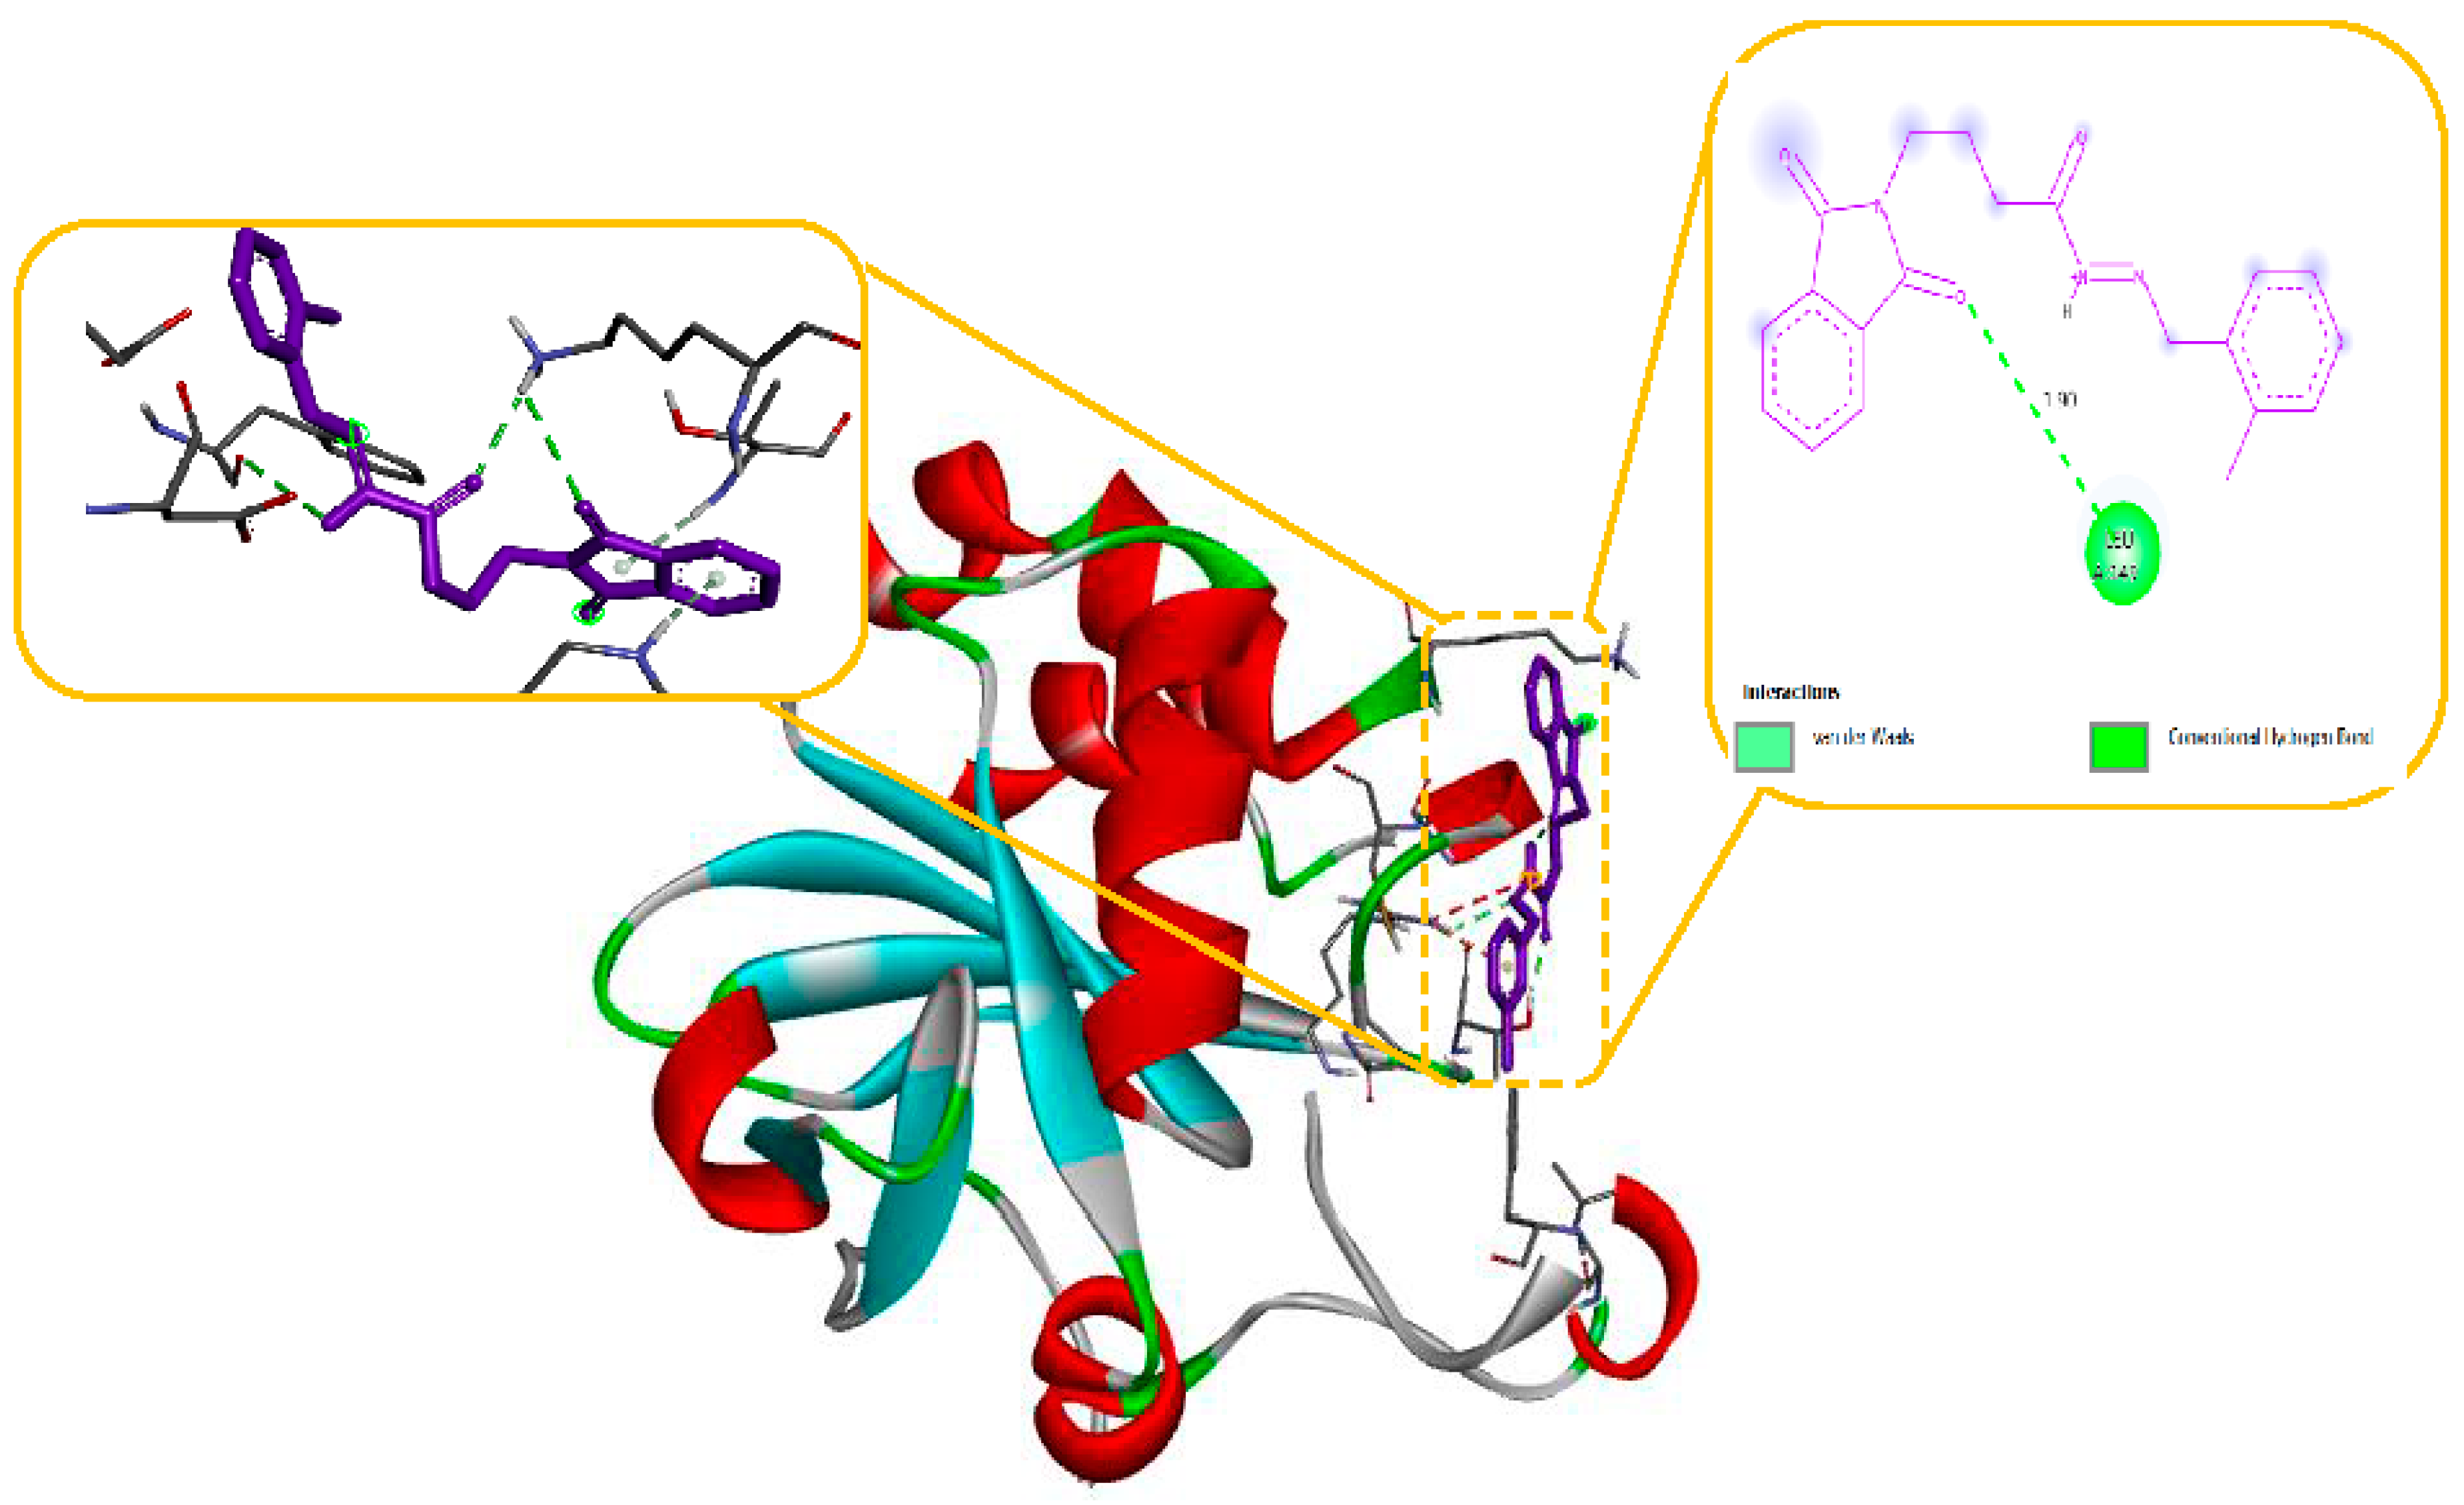
Figure 11.
linear link the values of the Predicted and experimental activity.
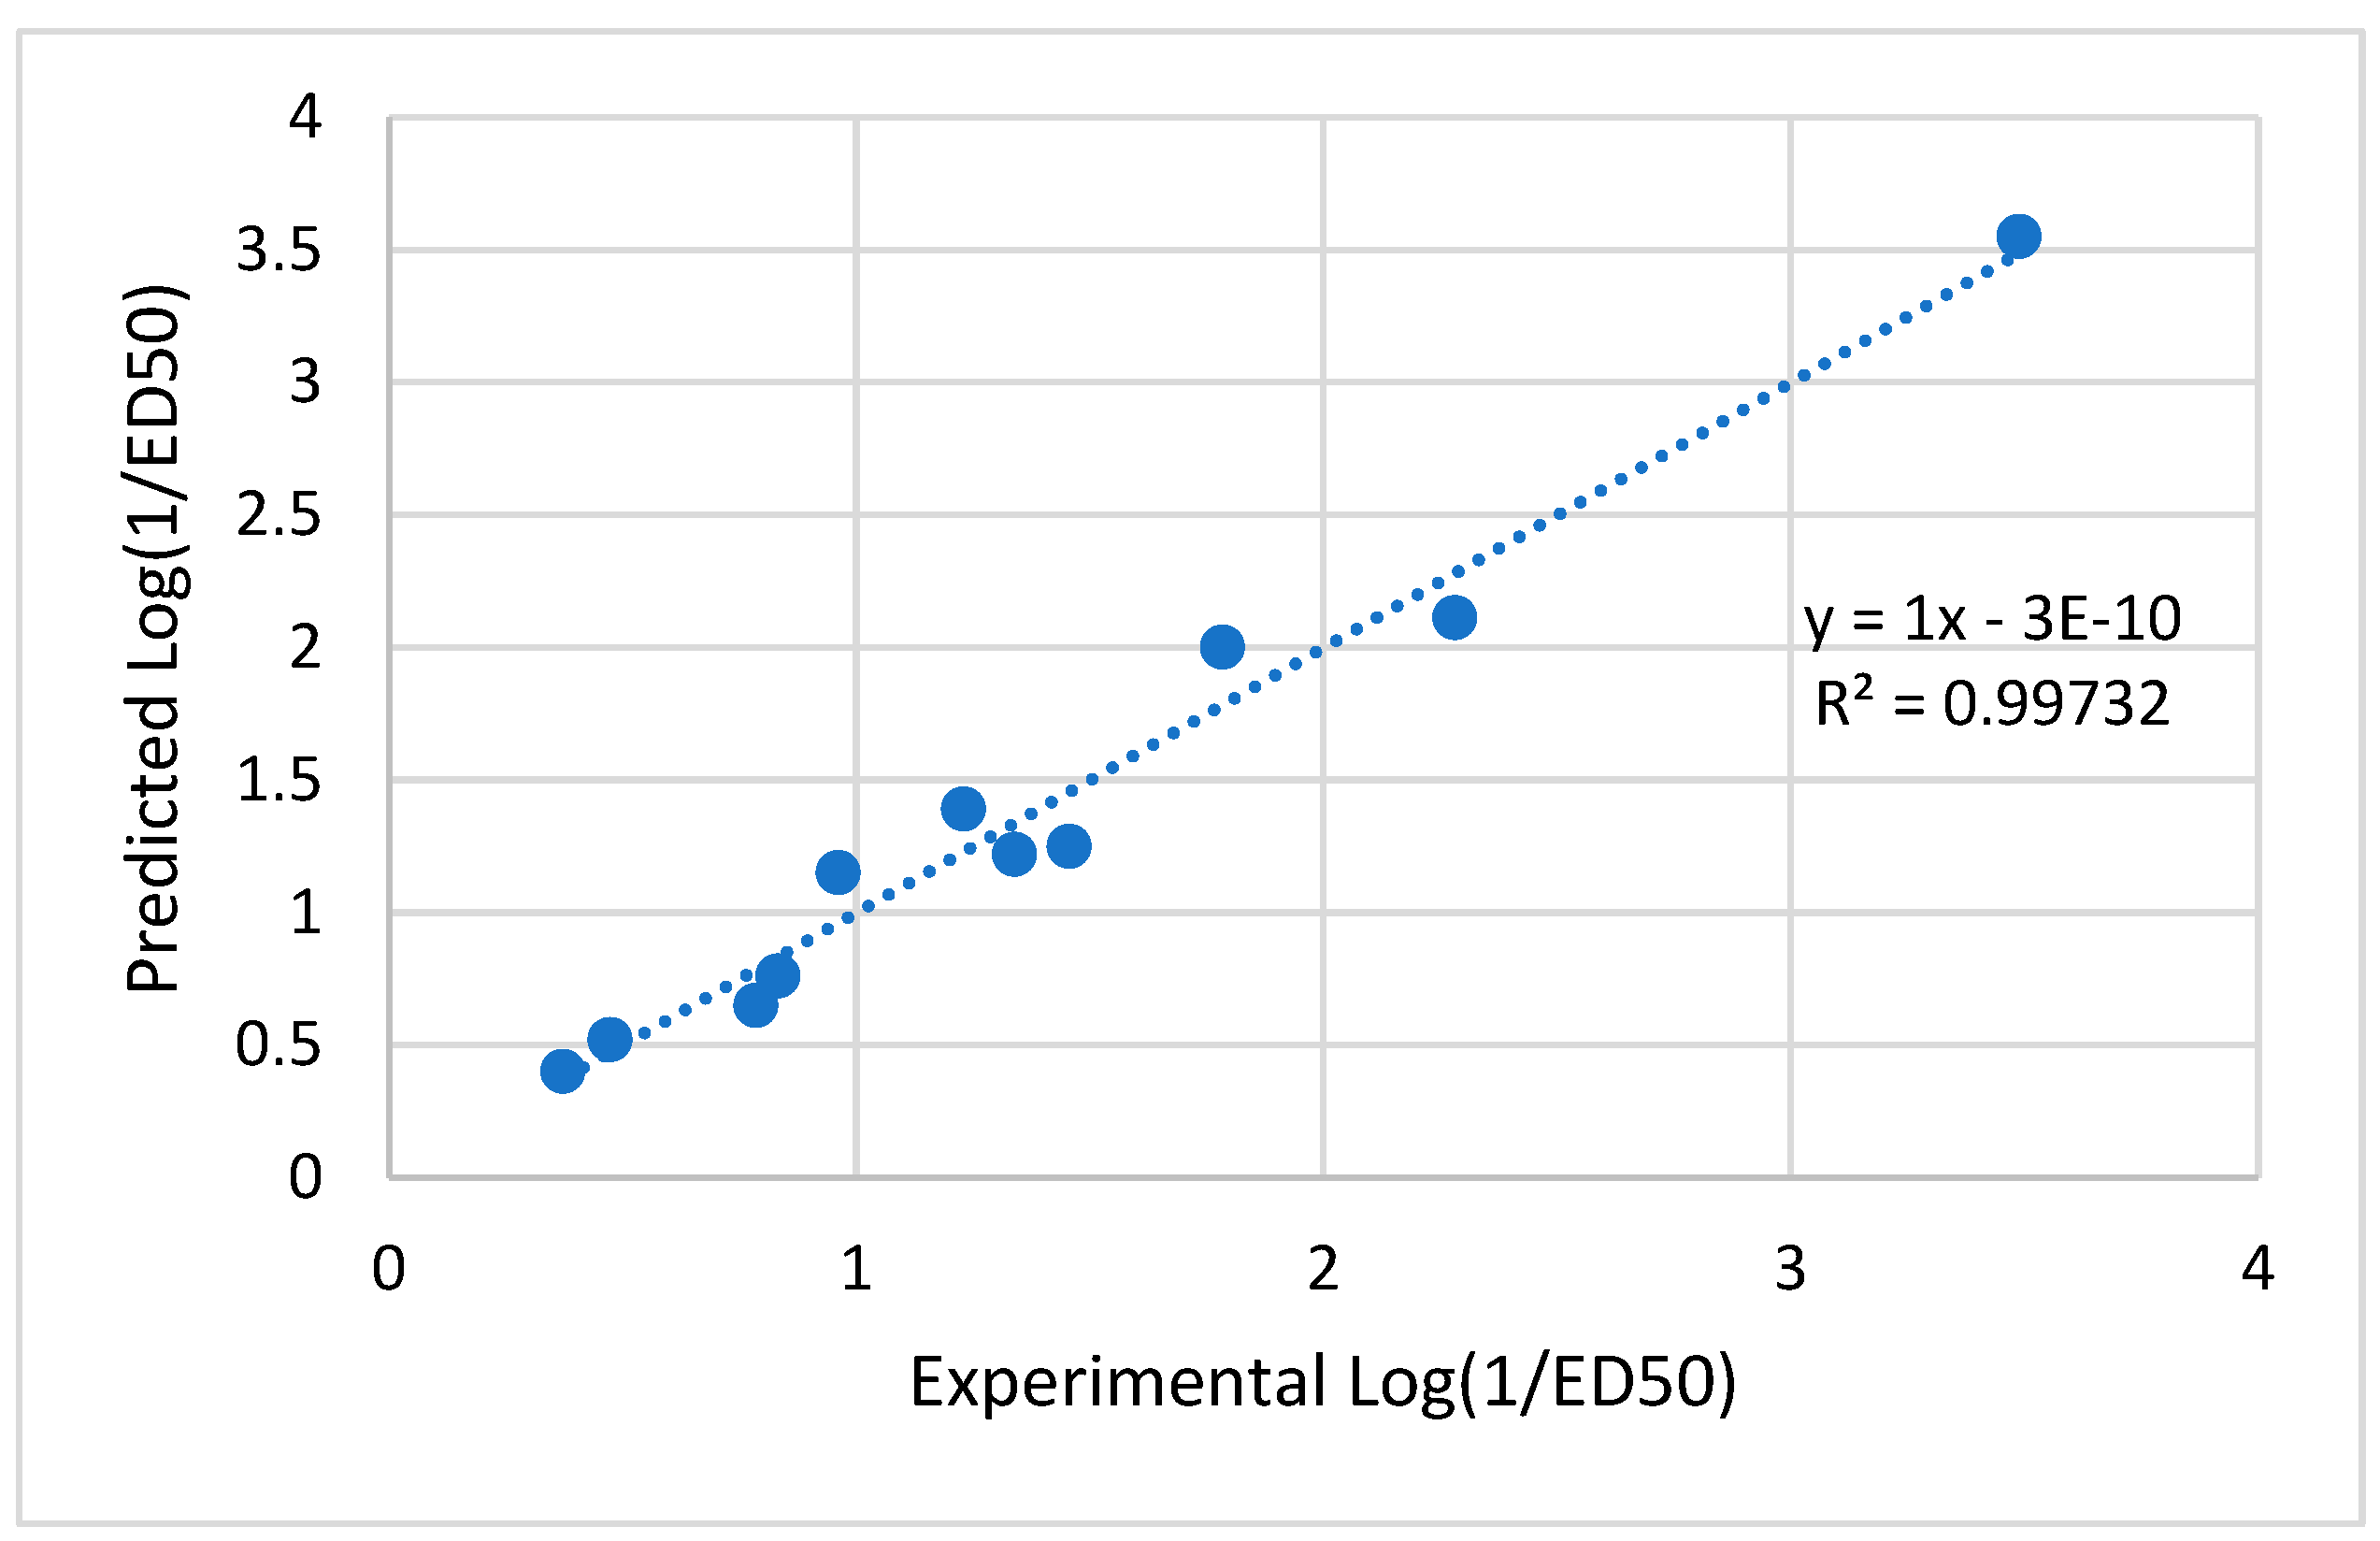
Figure 12.
Protein 1OHV's root mean square deviation (RMSD) from the initial complexes during compound 11's 5ns MD trajectory. Red graph pack for protein and backbone and black peck is for protein and ligand. .
Figure 12.
Protein 1OHV's root mean square deviation (RMSD) from the initial complexes during compound 11's 5ns MD trajectory. Red graph pack for protein and backbone and black peck is for protein and ligand. .
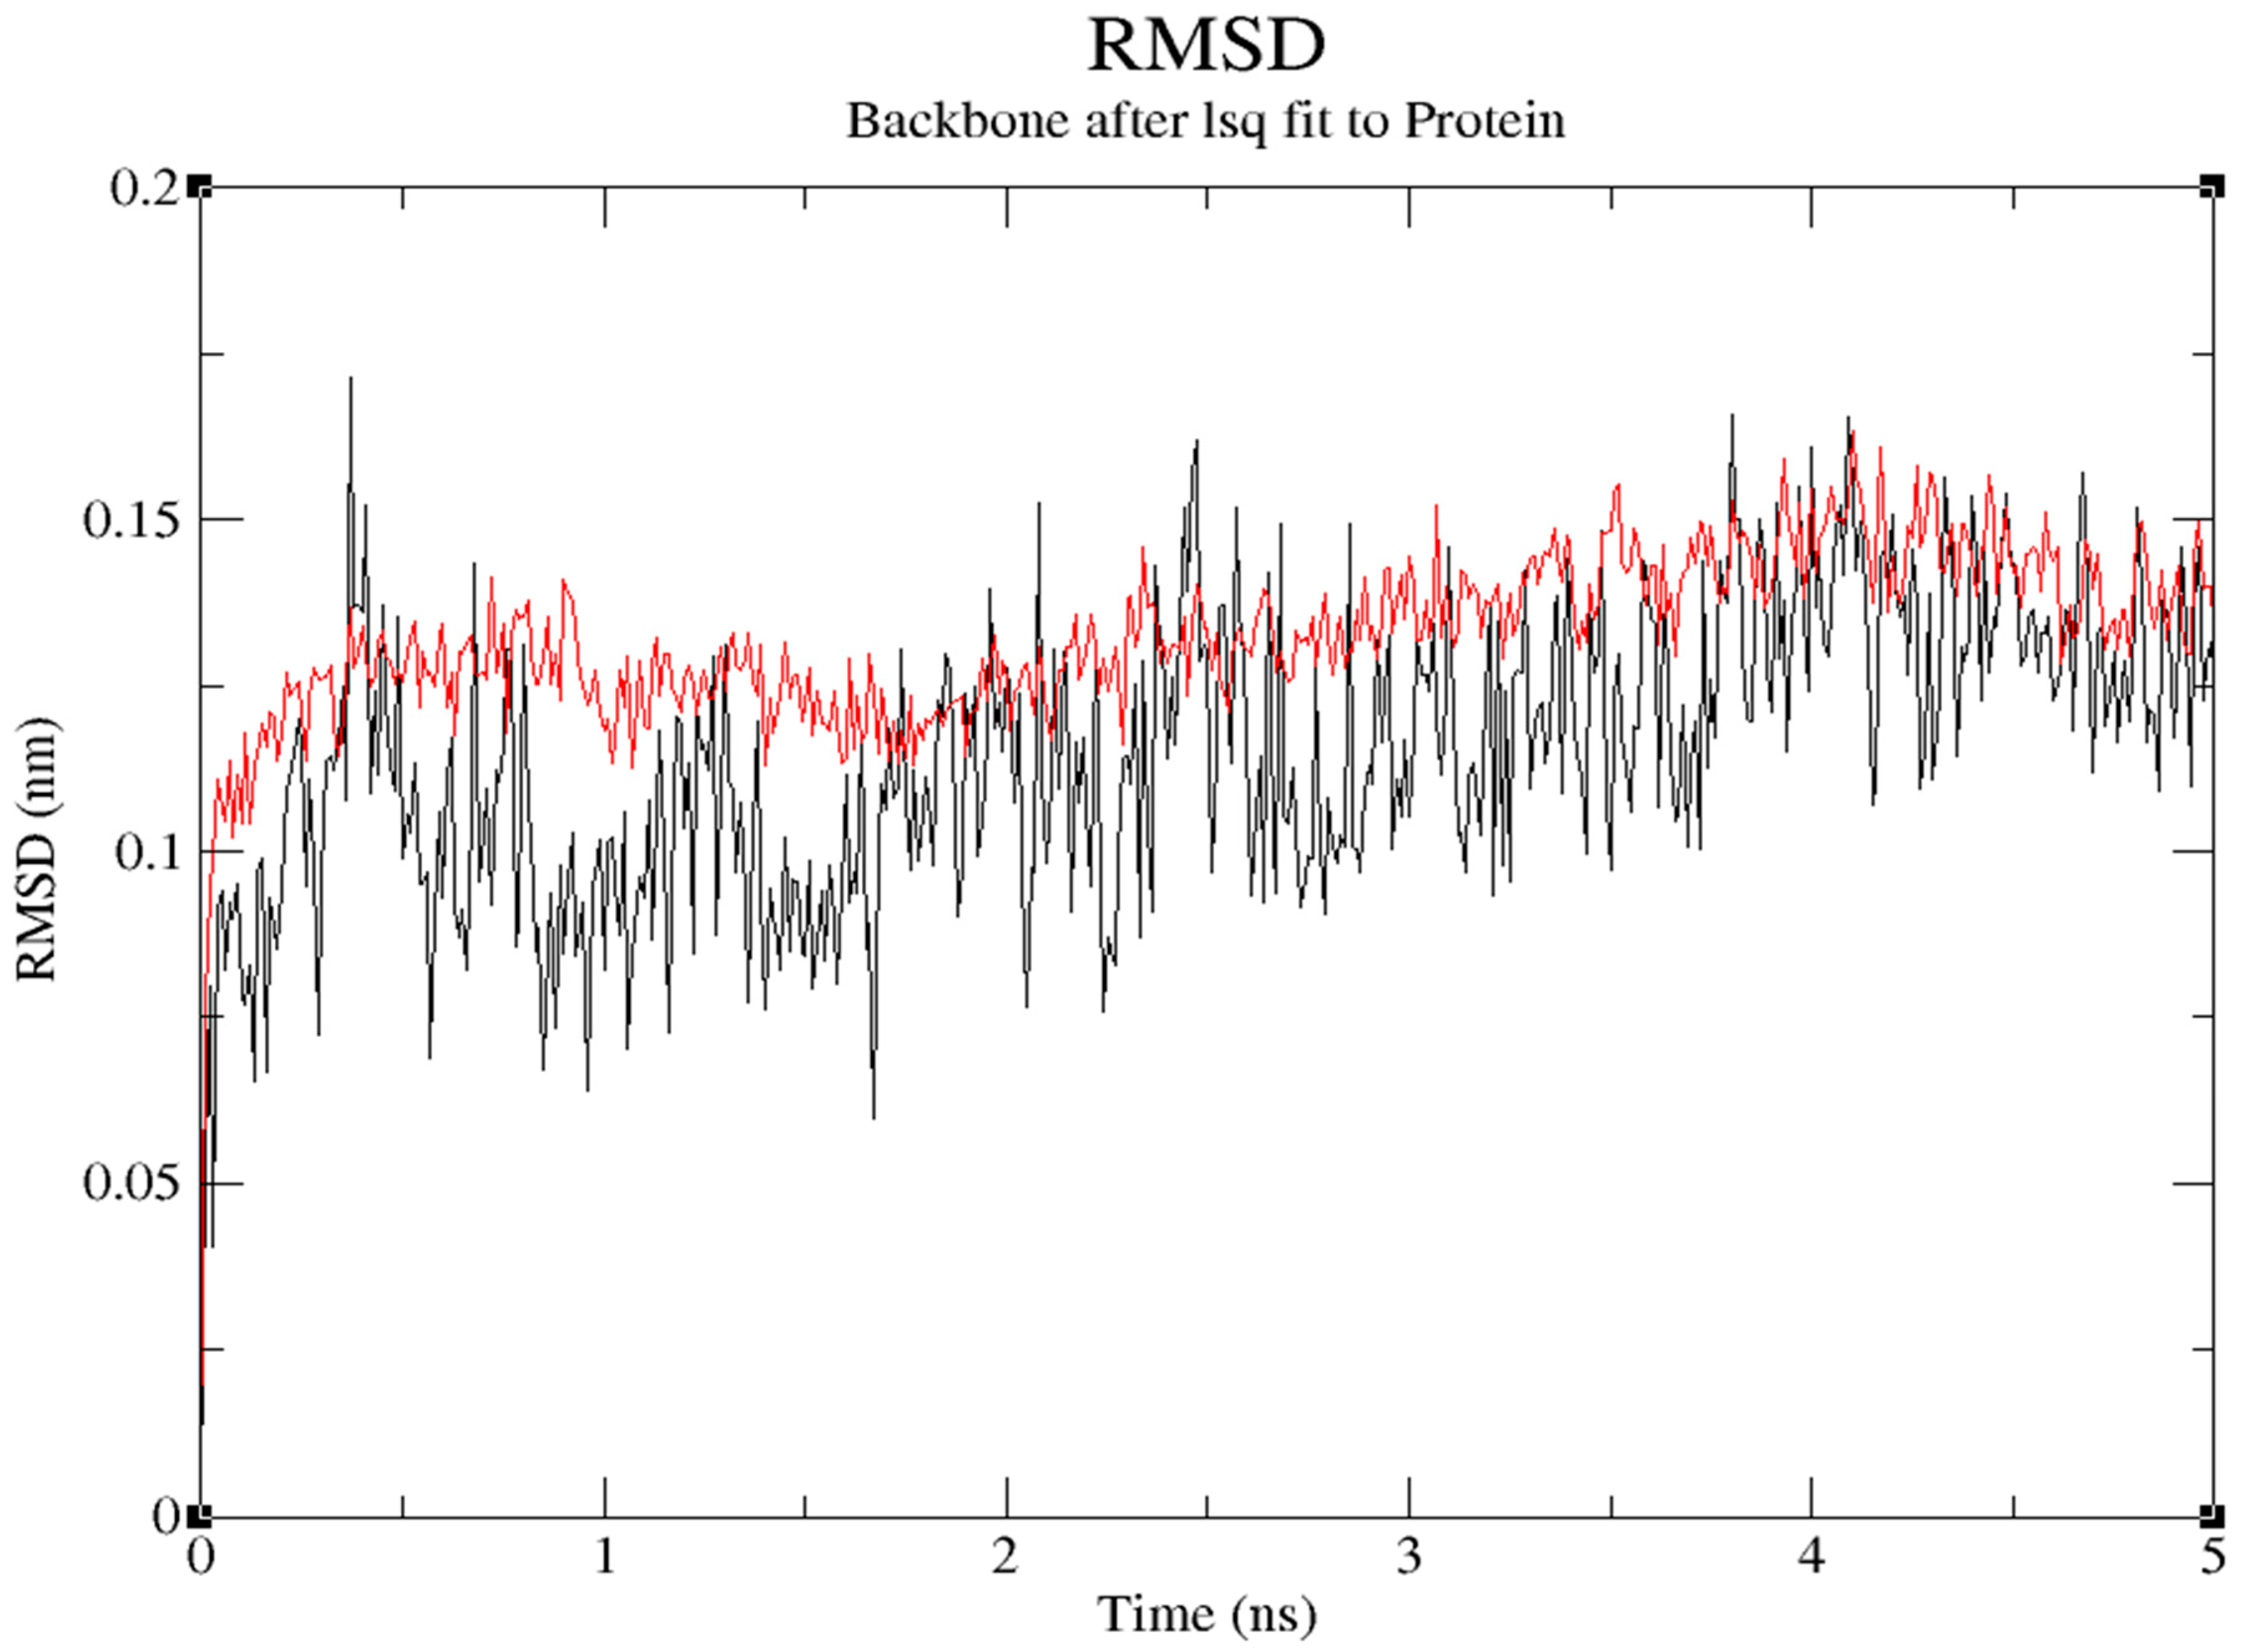
Figure 13.
RMSF of Ligand.
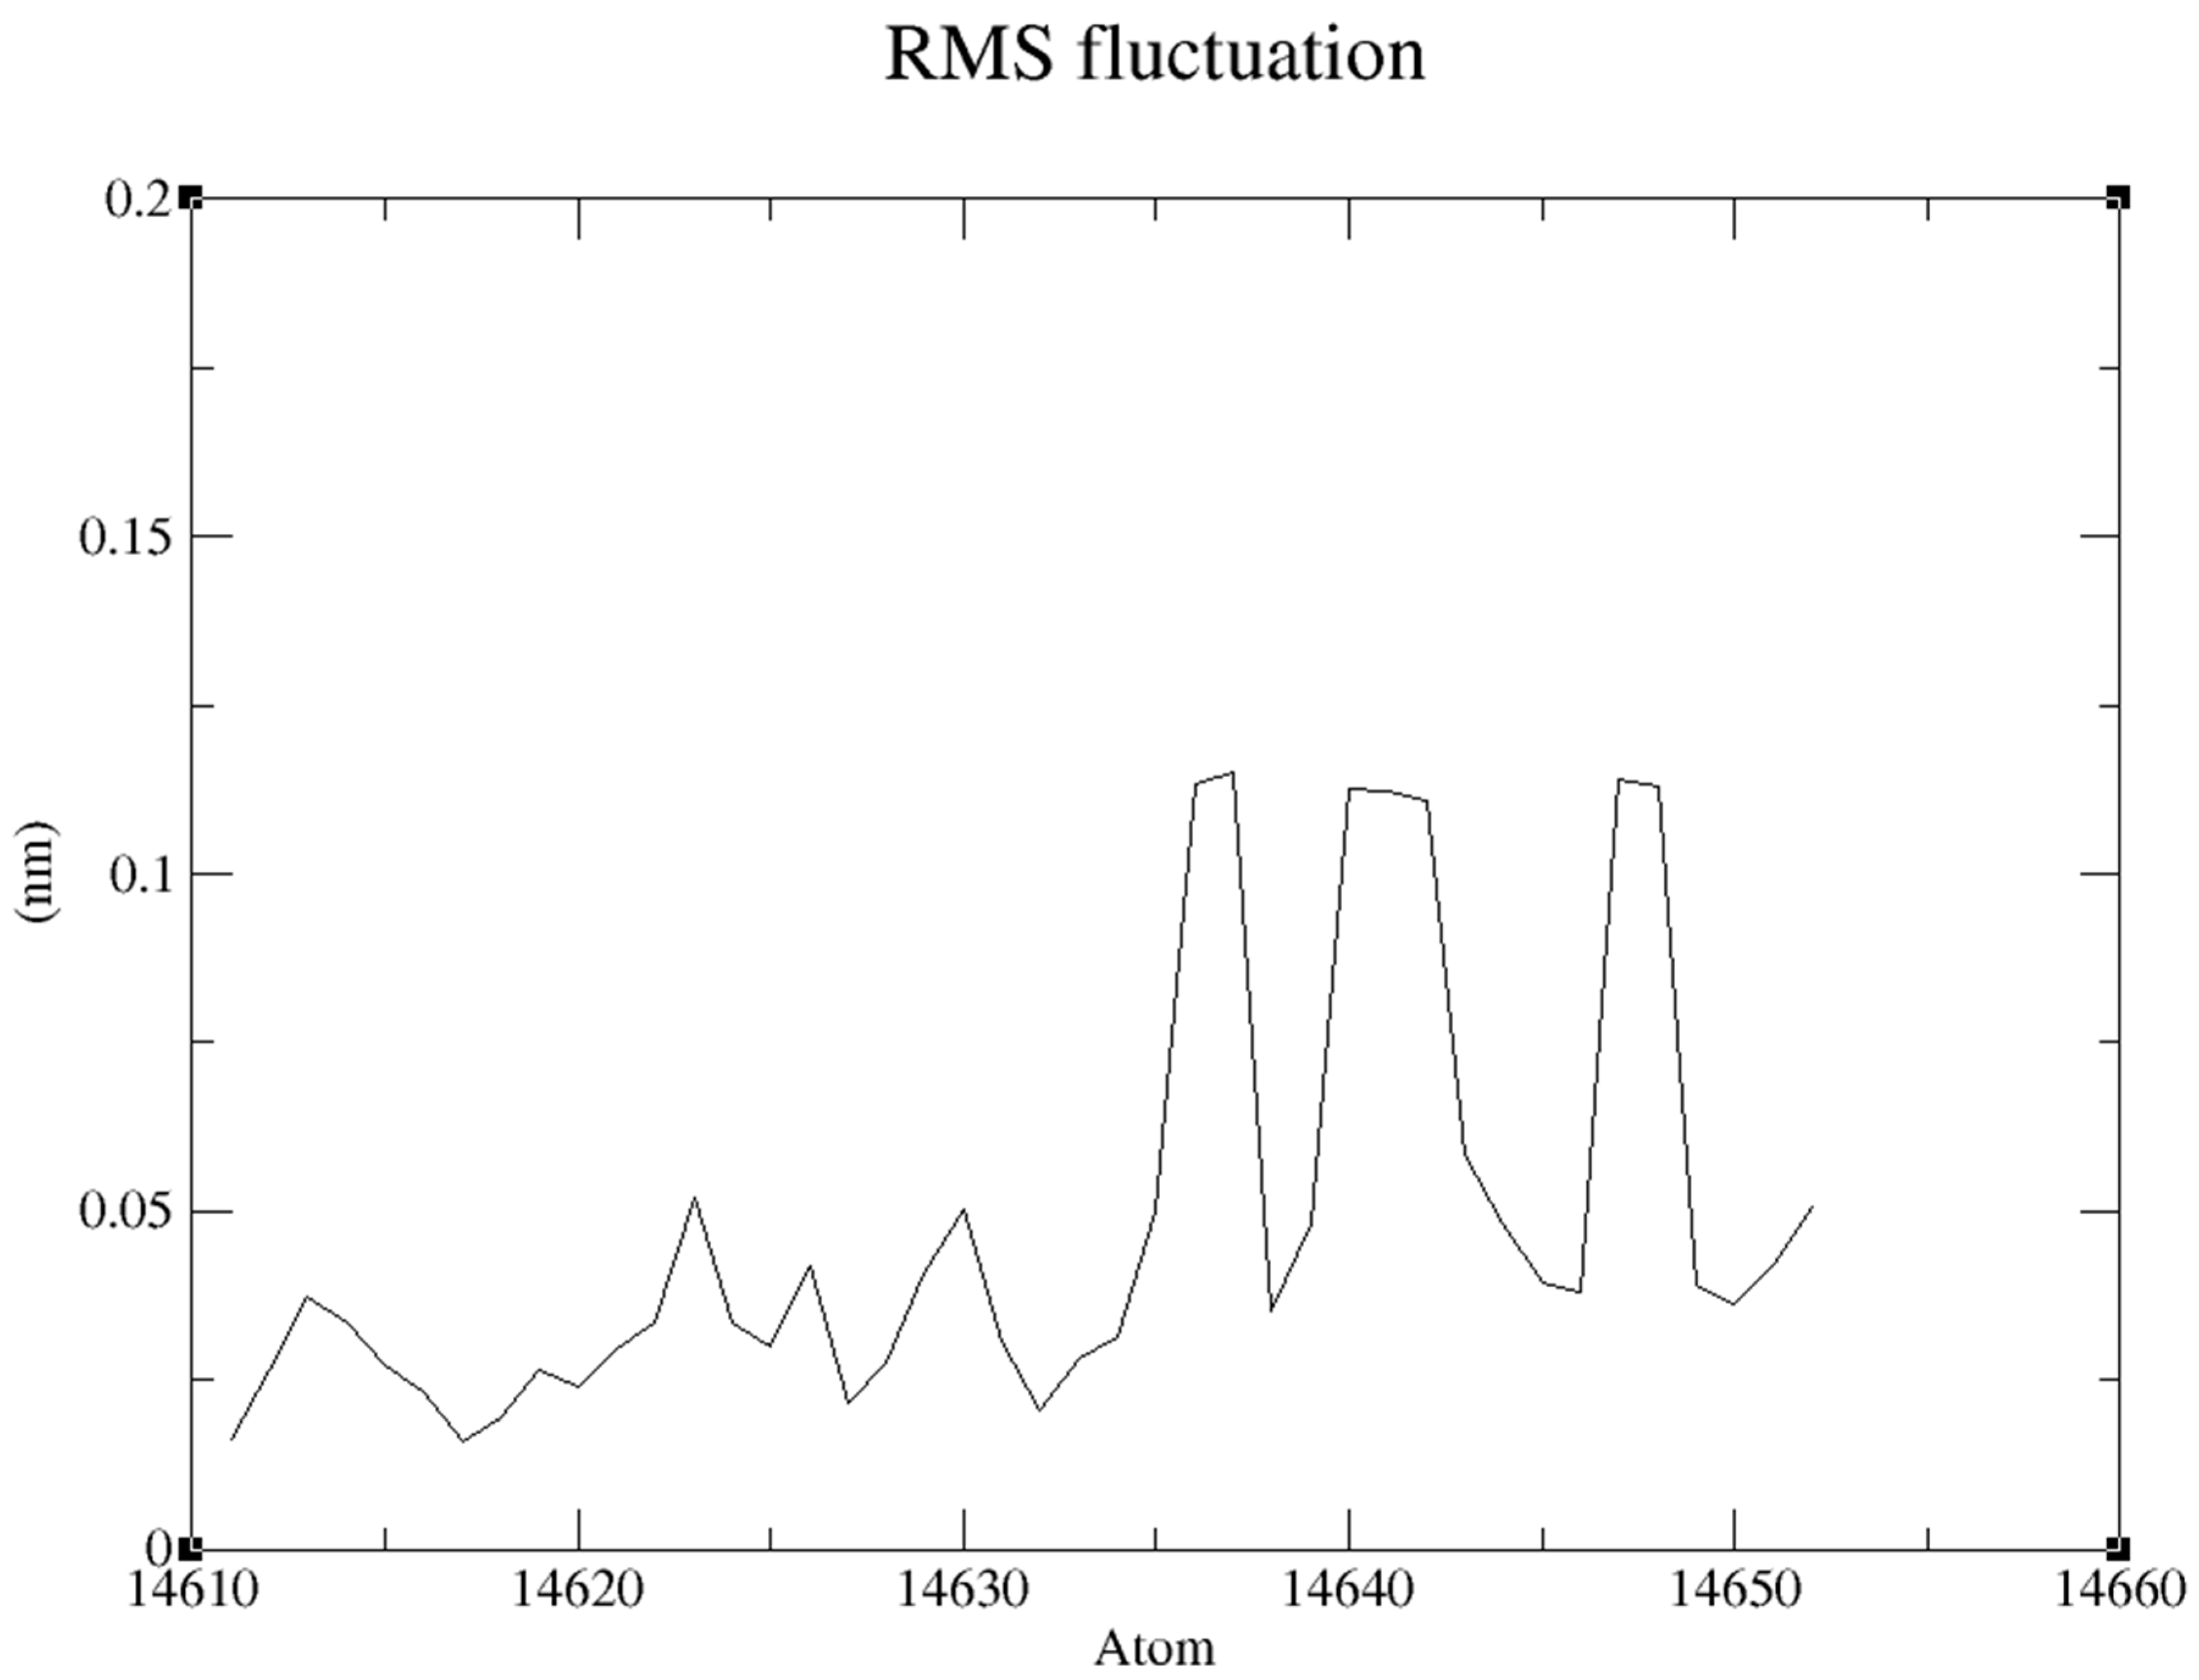
Figure 14.
Two-dimensional diagram of Compound 11 with 1OHV interaction 5 ns MD simulation.
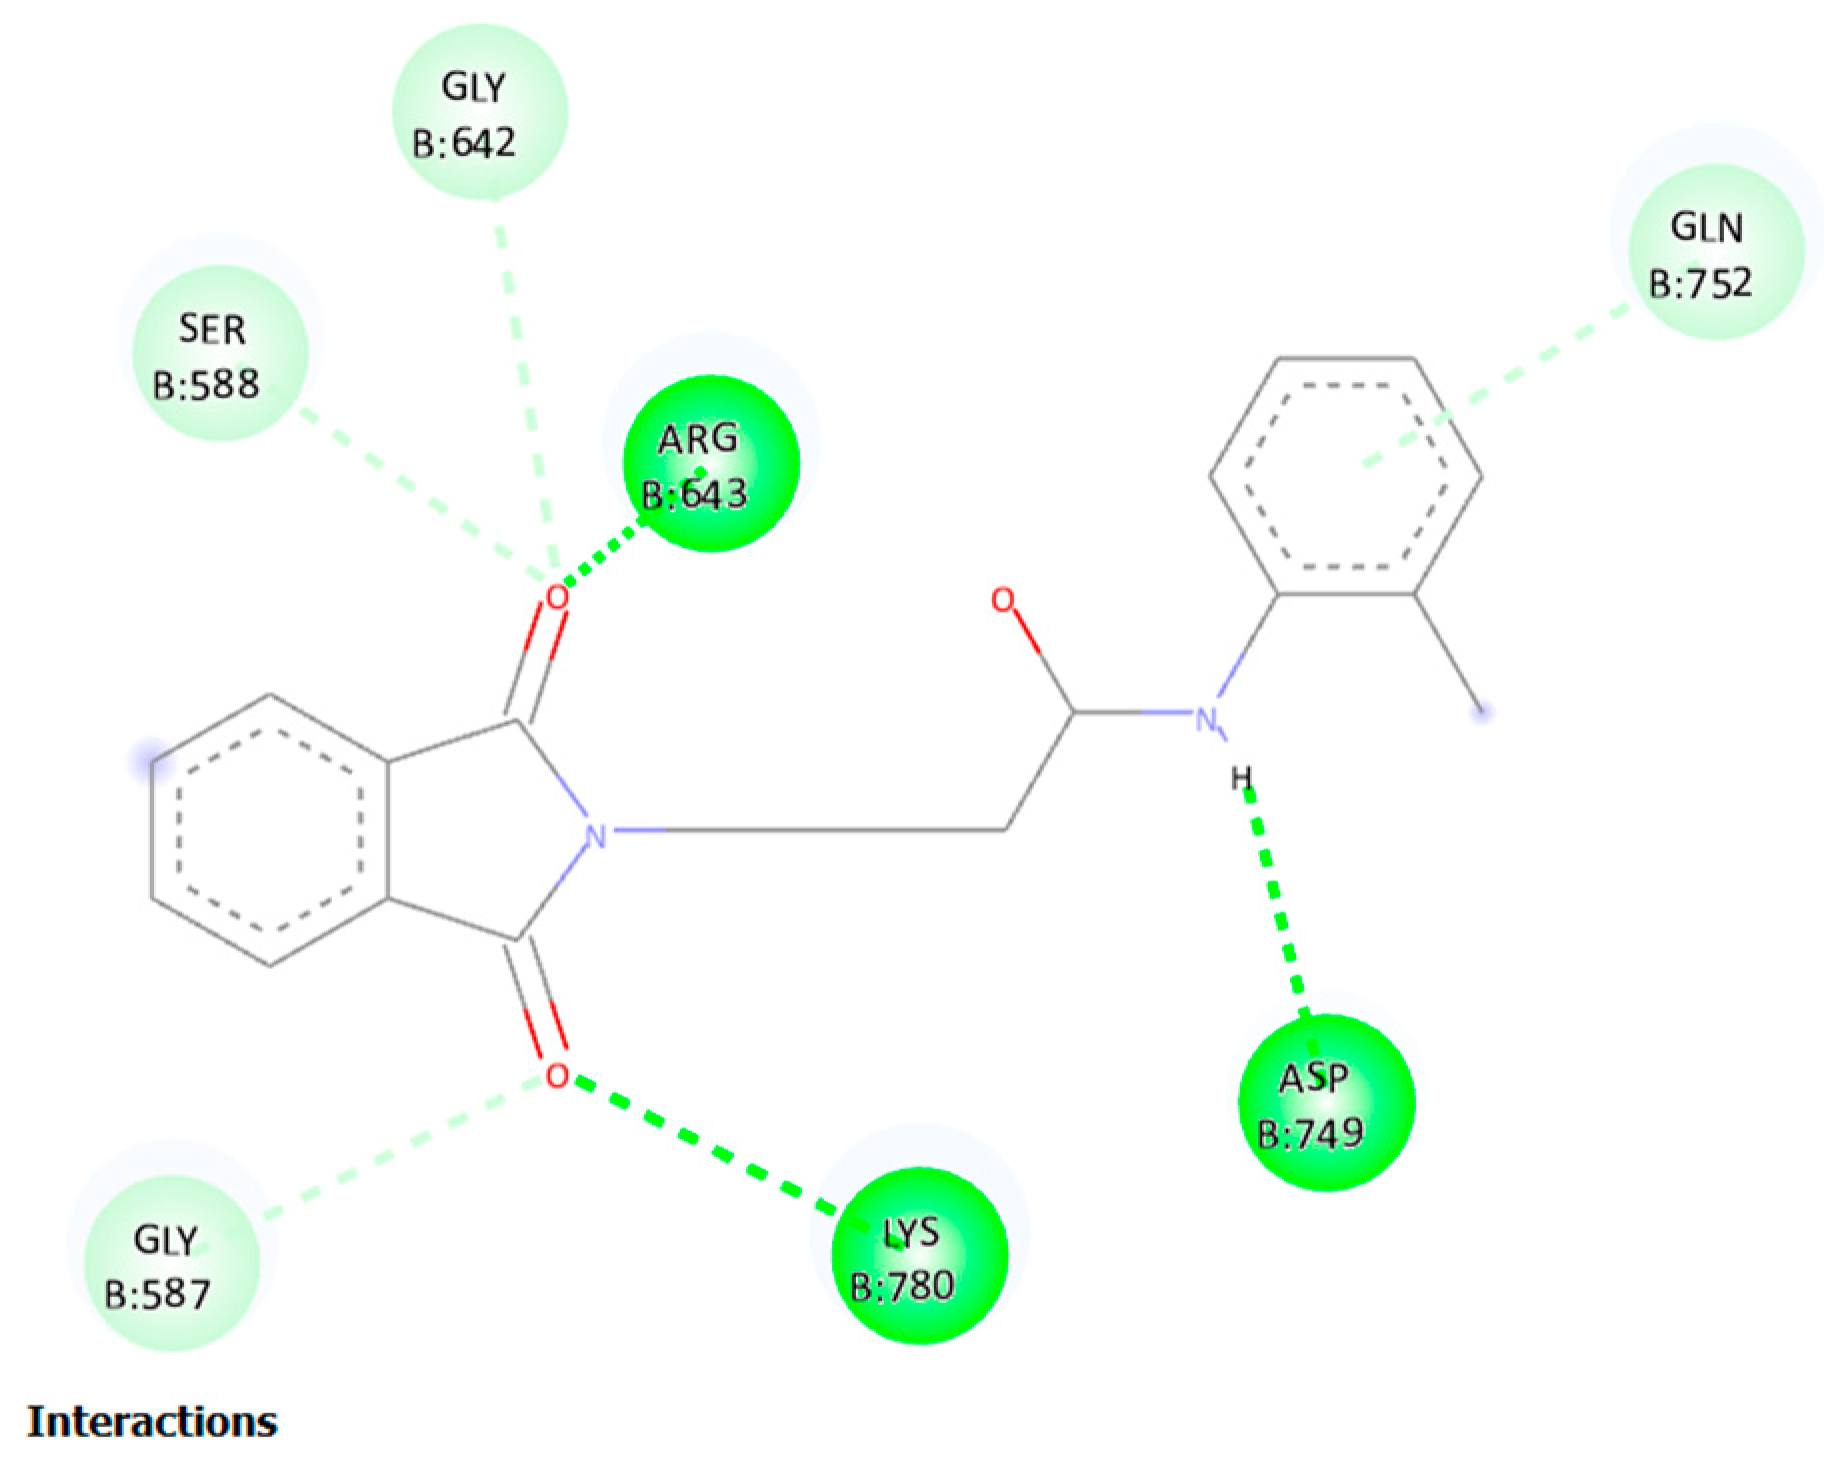
Figure 16.
Radius of Gyration of 1OHV protein during 5 ns MD, representing hardness of protein for interaction with compounds.
Figure 16.
Radius of Gyration of 1OHV protein during 5 ns MD, representing hardness of protein for interaction with compounds.
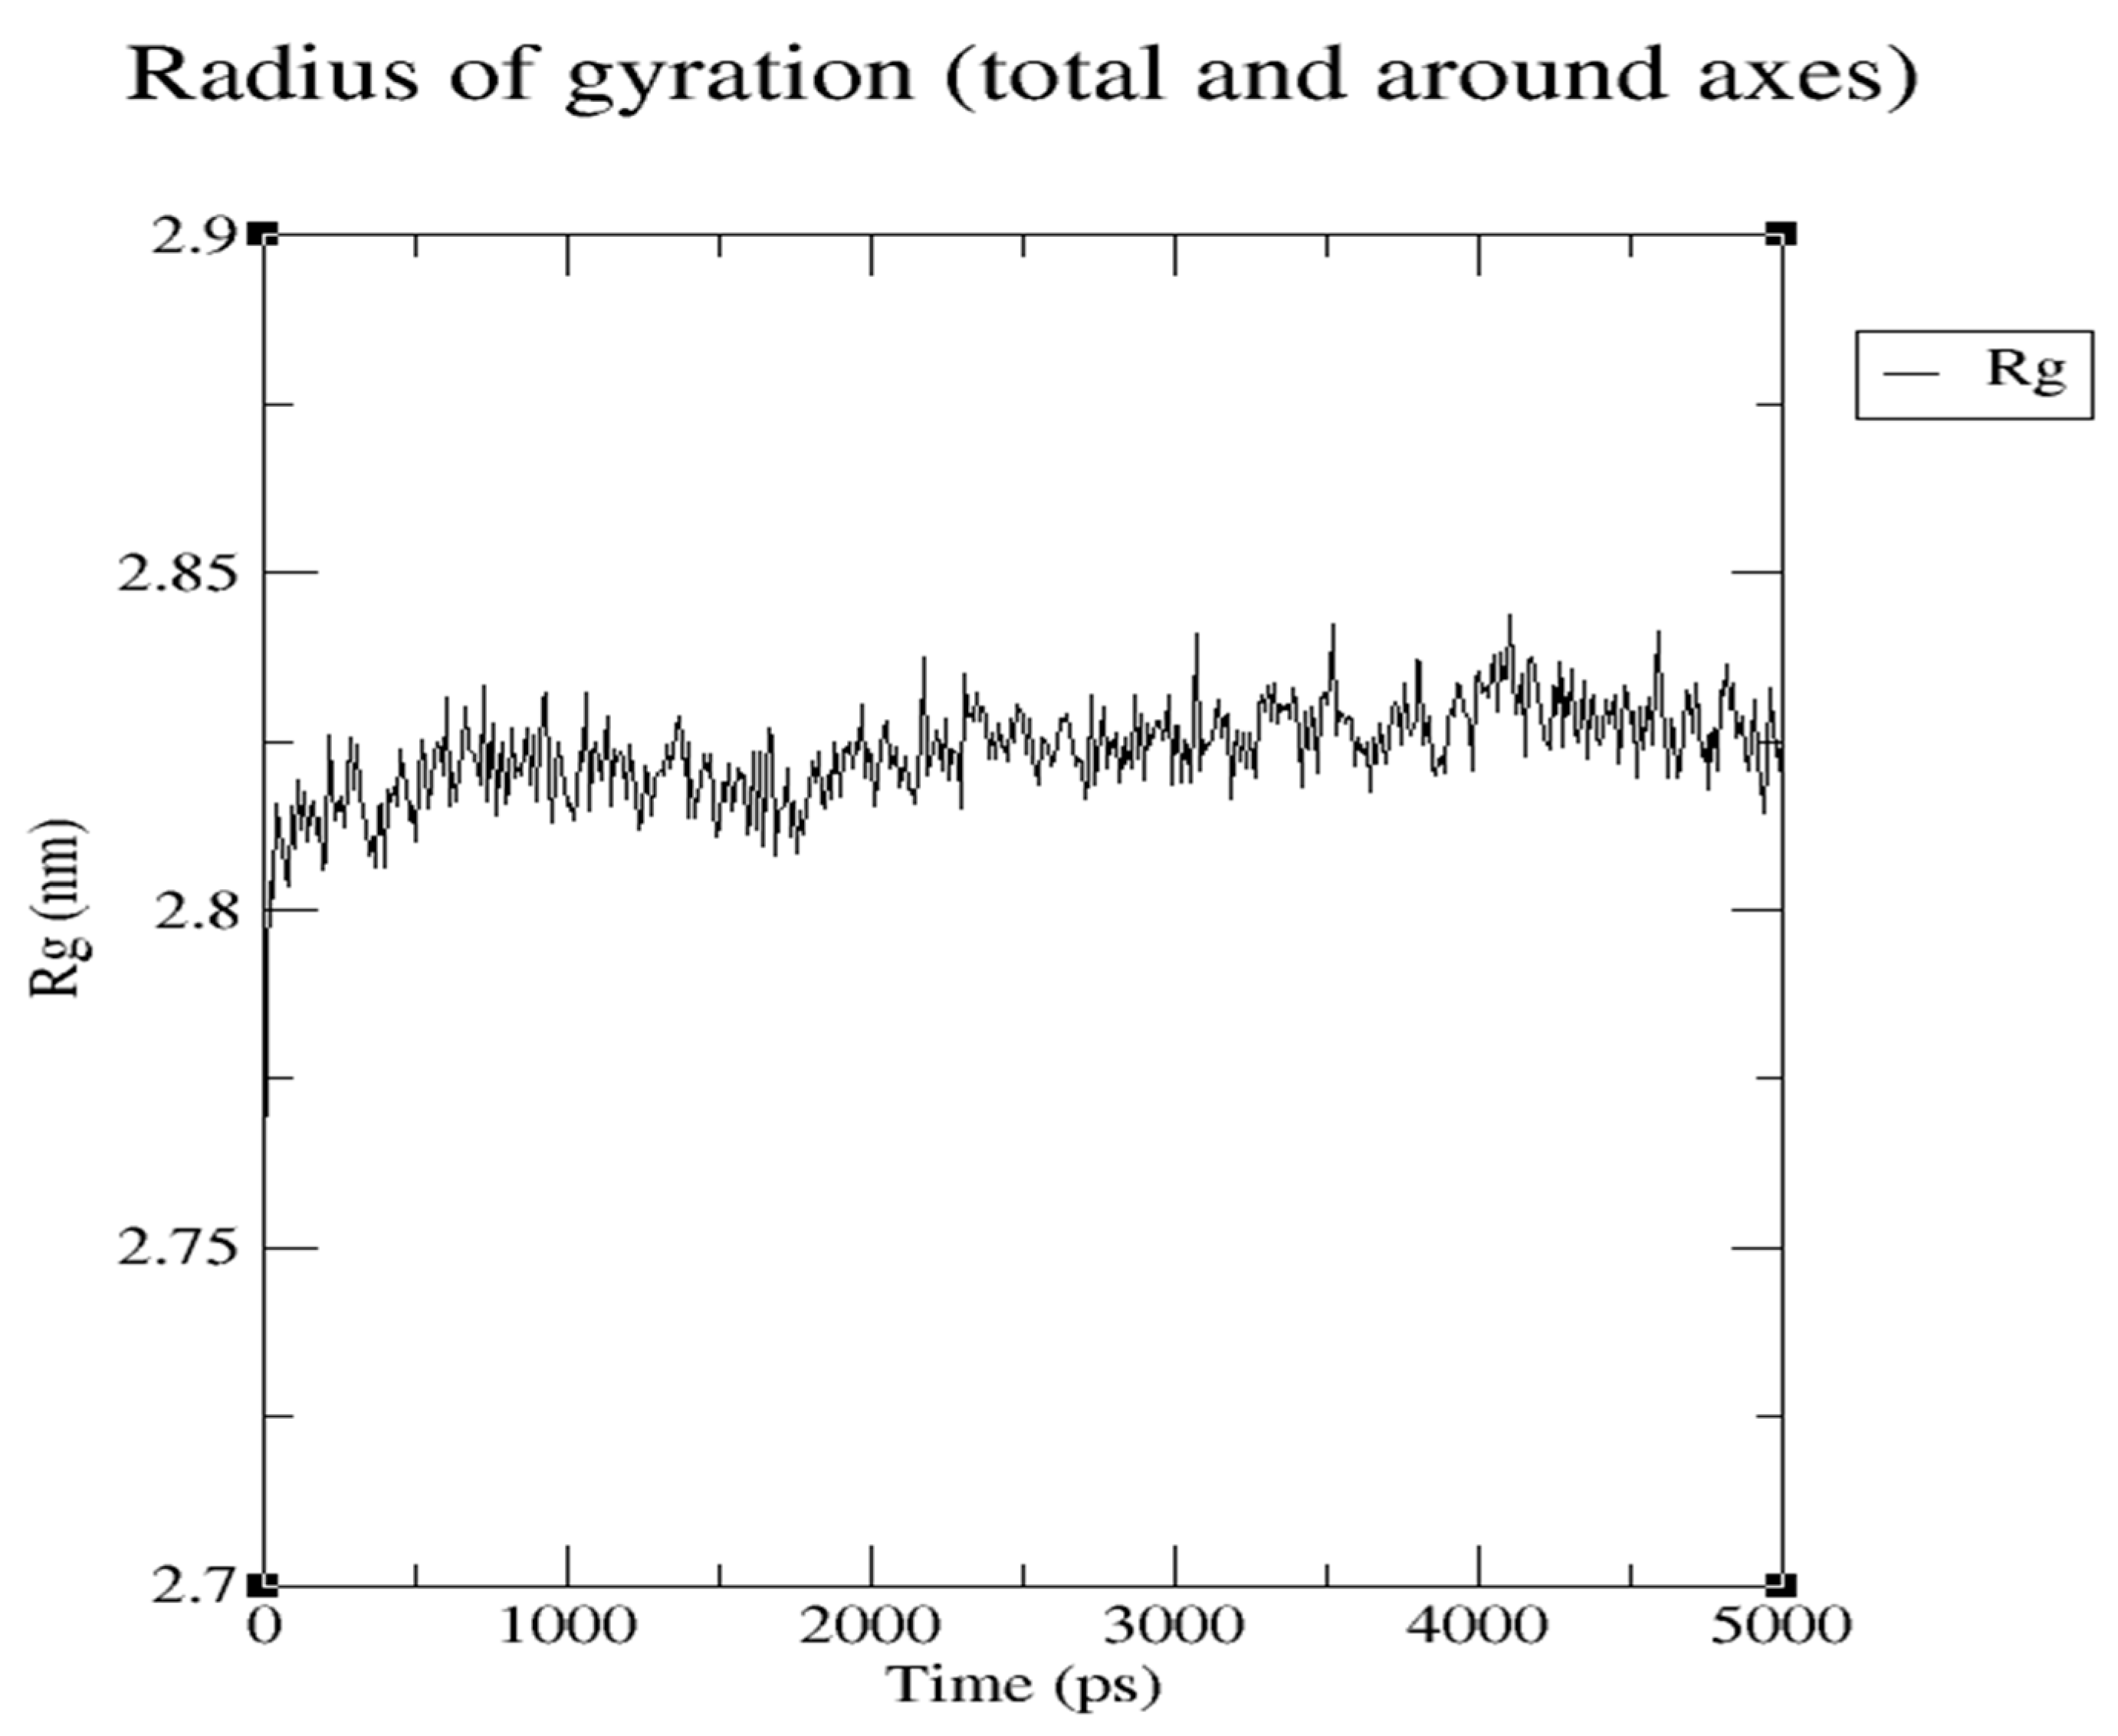
Figure 17.
Radius of Gyration of Ligand during 5 ns MD, representing hardness of Ligand for interaction with Protein.
Figure 17.
Radius of Gyration of Ligand during 5 ns MD, representing hardness of Ligand for interaction with Protein.
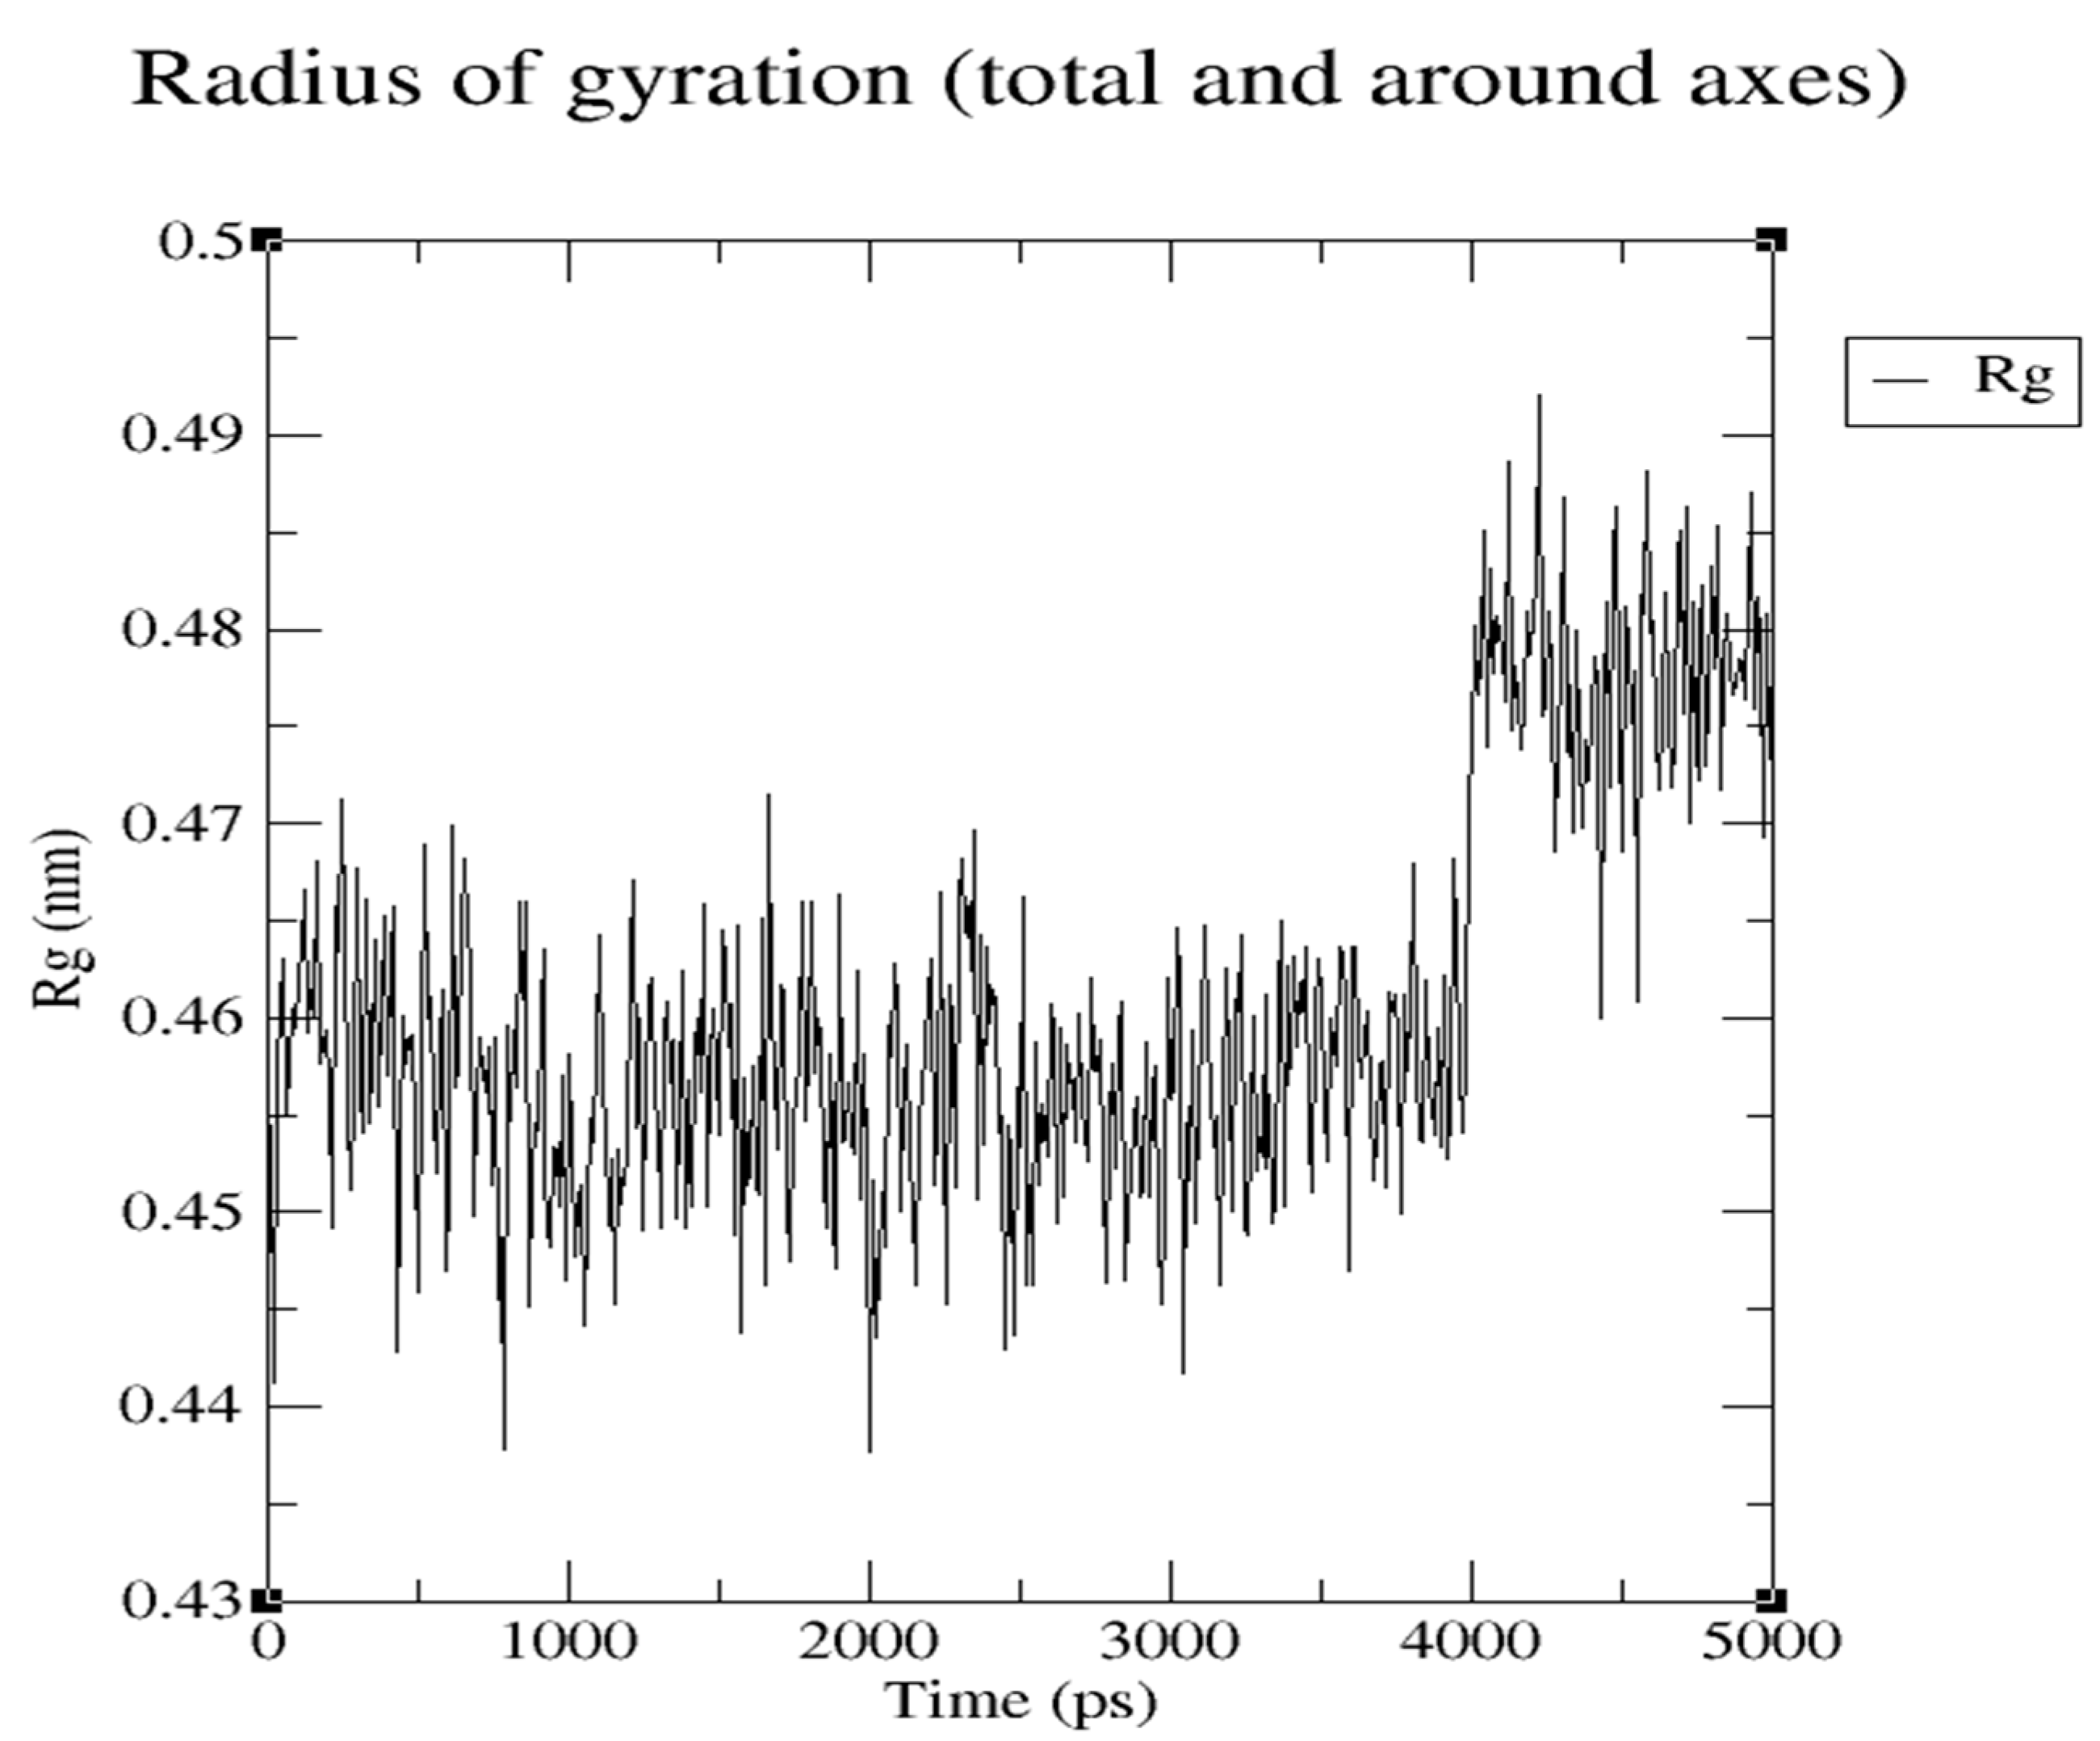
Figure 19.
Latency in the Development of Seizures was found to be significant ***(p > 0.05) when compared to all groups except control group. ** (p>0.05) when compared to all groups except control and compound 2 at 100mg/kg.
Figure 19.
Latency in the Development of Seizures was found to be significant ***(p > 0.05) when compared to all groups except control group. ** (p>0.05) when compared to all groups except control and compound 2 at 100mg/kg.
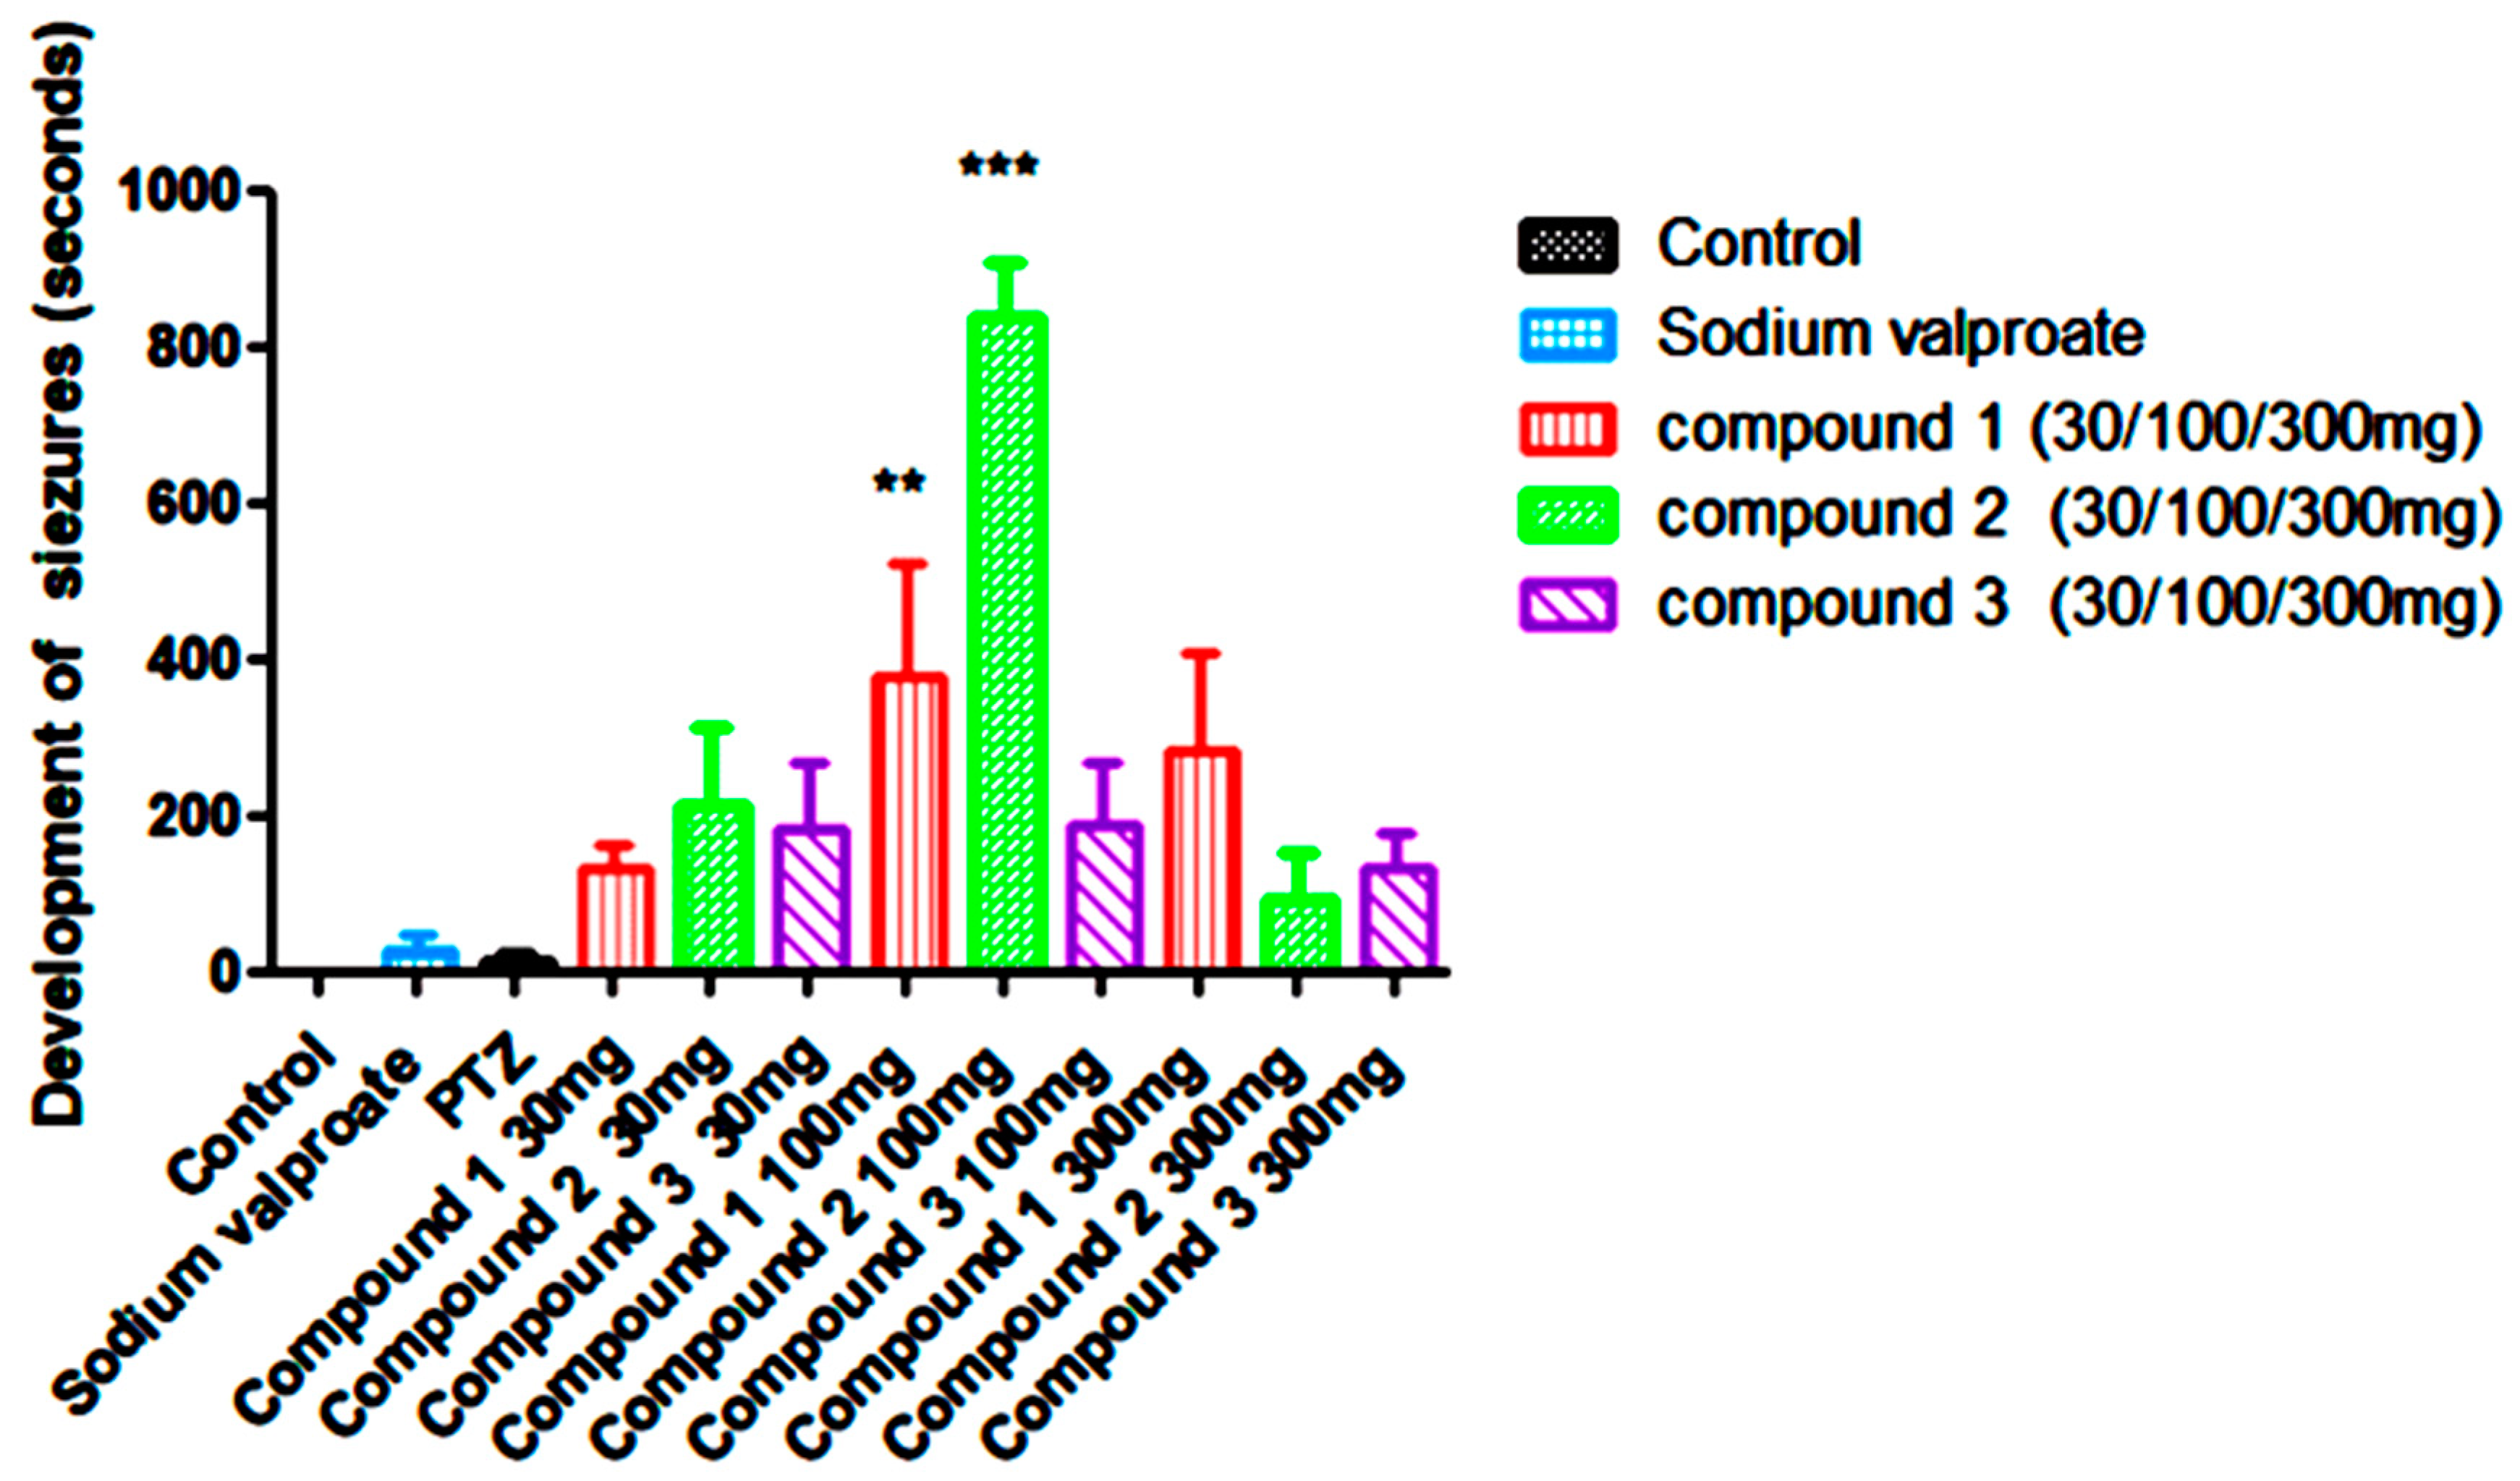
Figure 20.
Hematoxylin and eosin (H&E) stained kidney sections reveal the following: A) A normal glomerulus alongside a glomerulus exhibiting atrophy at 45X magnification. B) Glomerulus atrophy and degenerative changes in renal tubules around the renal corpuscle at 45X magnification. C) Interstitial hemorrhage observed at 45X magnification.
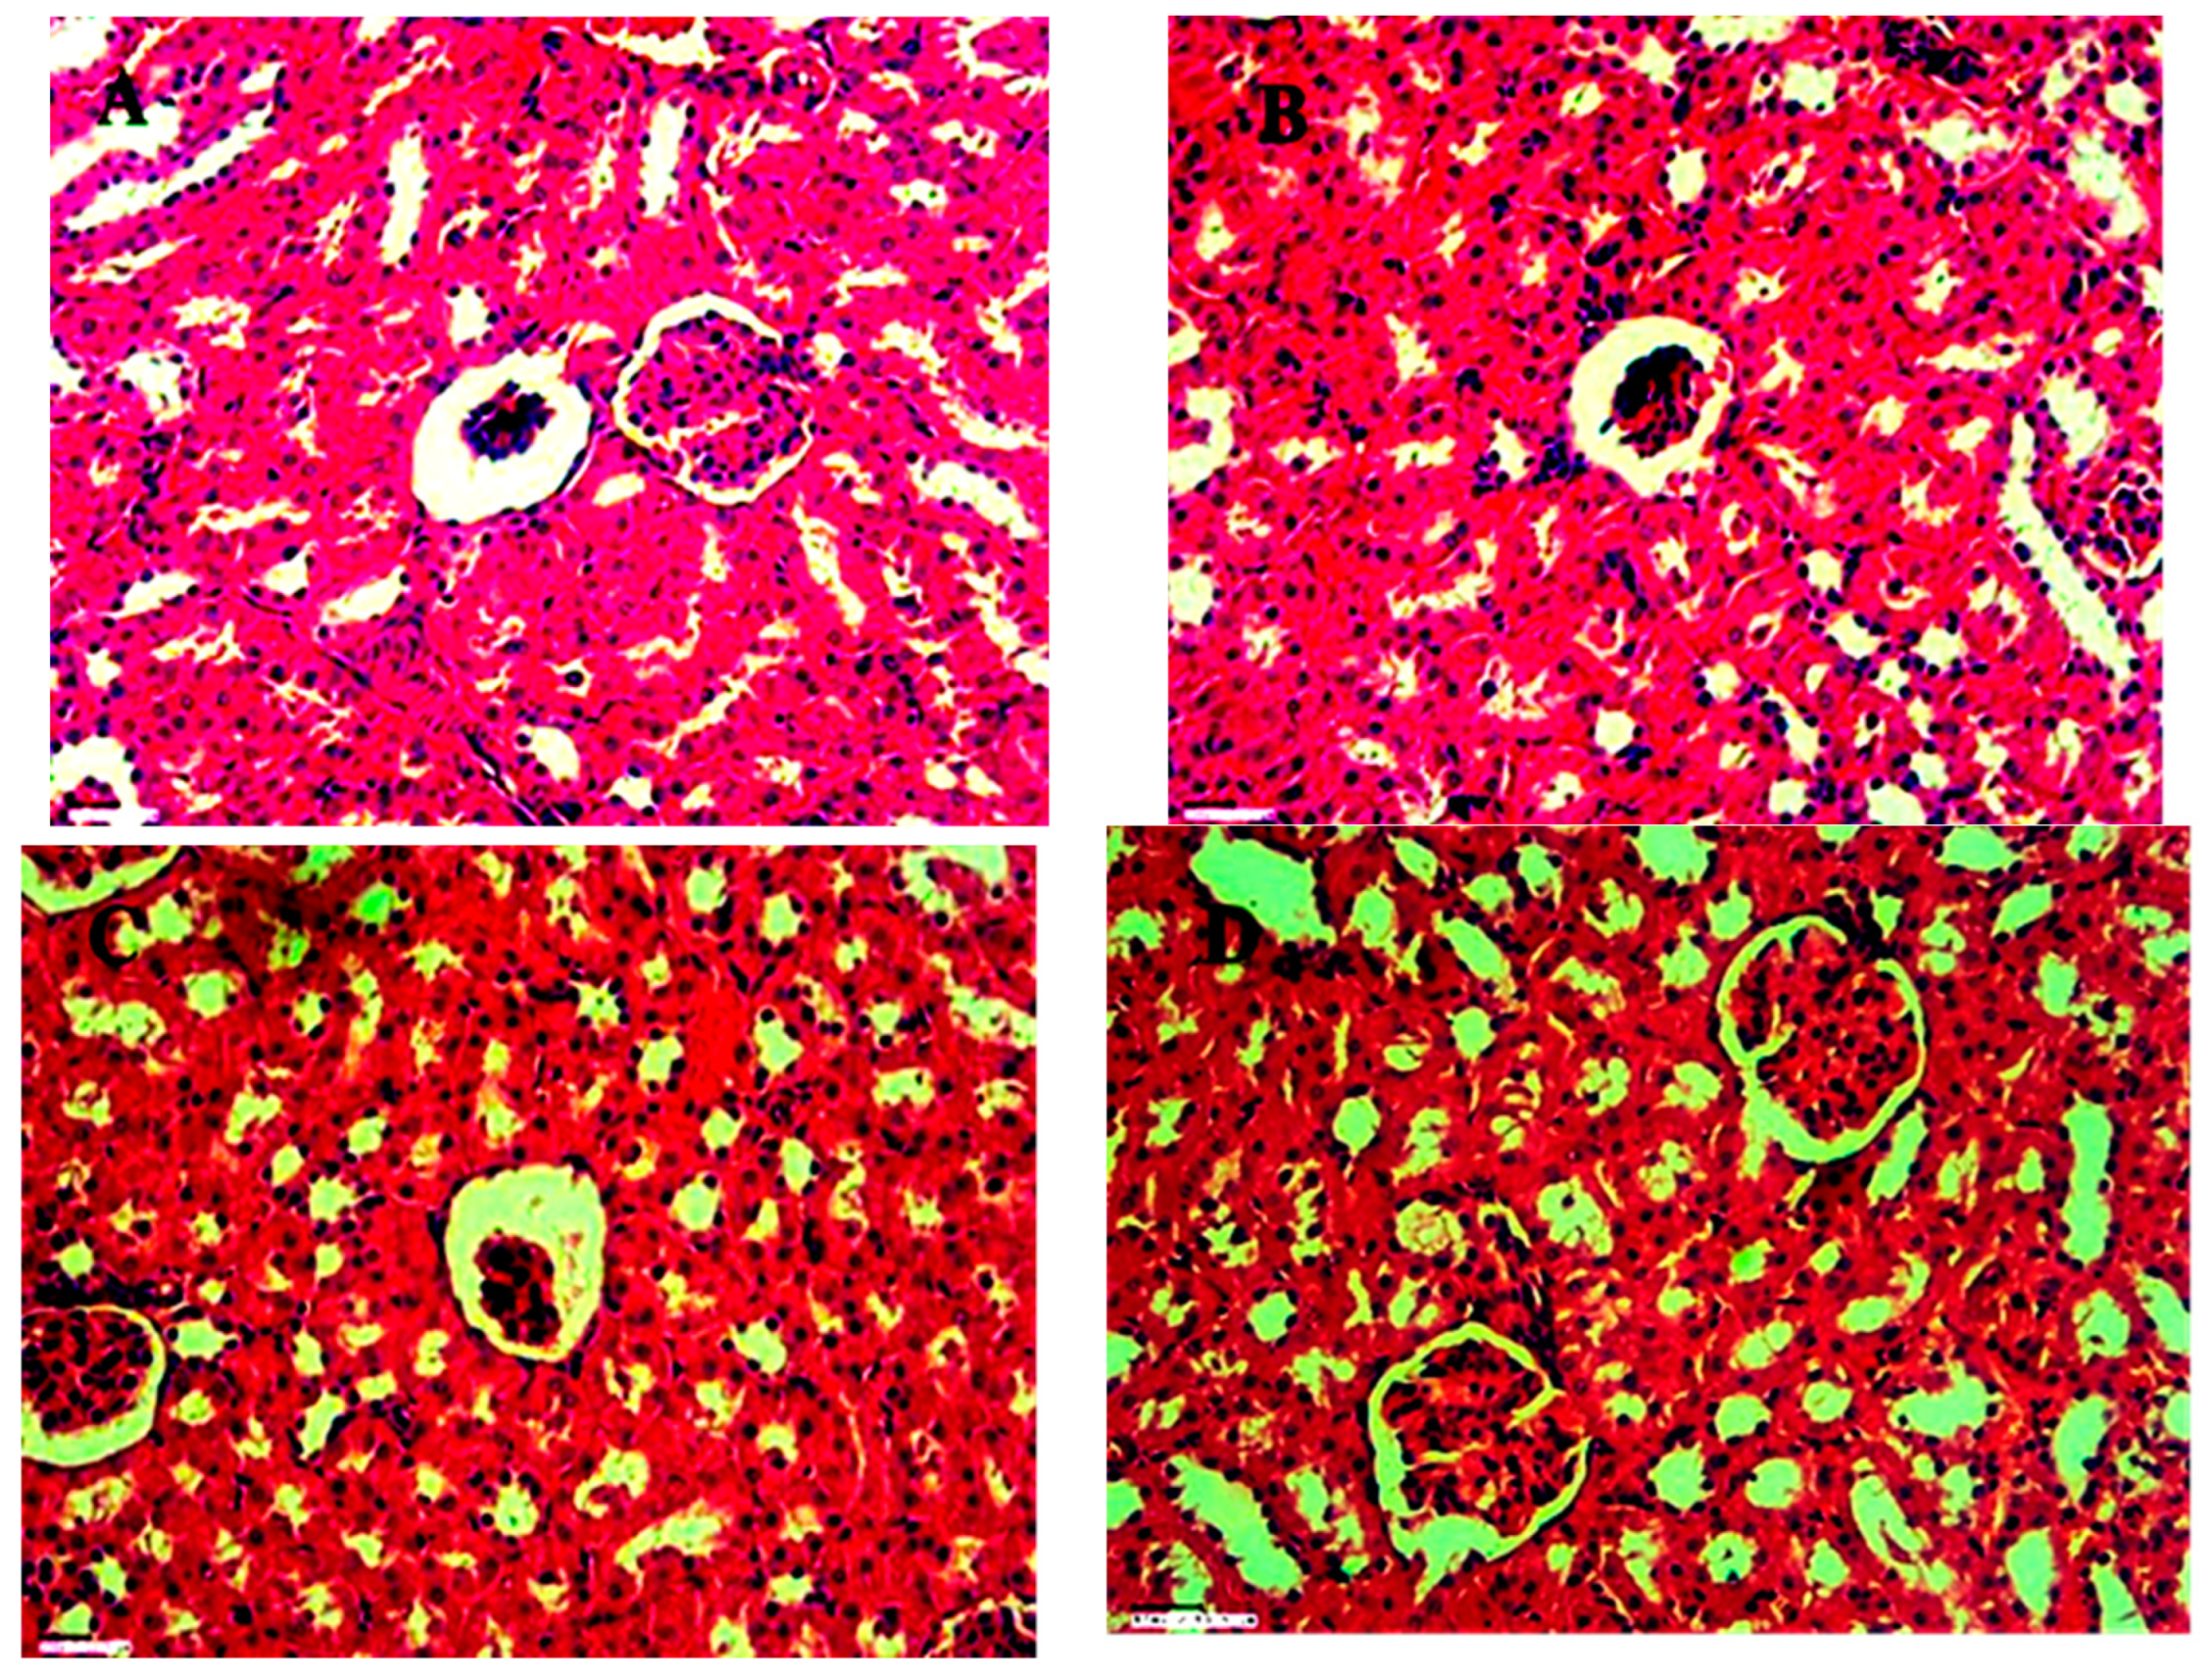
Figure 21.
An H&E stained spleen section exhibits the following: A) Normal red pulp at 45X magnification. B) Normal red pulp at 45X magnification. C) In the control group, degenerative alterations are observed in hepatocytes around the central vein at 45X magnification.
Figure 21.
An H&E stained spleen section exhibits the following: A) Normal red pulp at 45X magnification. B) Normal red pulp at 45X magnification. C) In the control group, degenerative alterations are observed in hepatocytes around the central vein at 45X magnification.
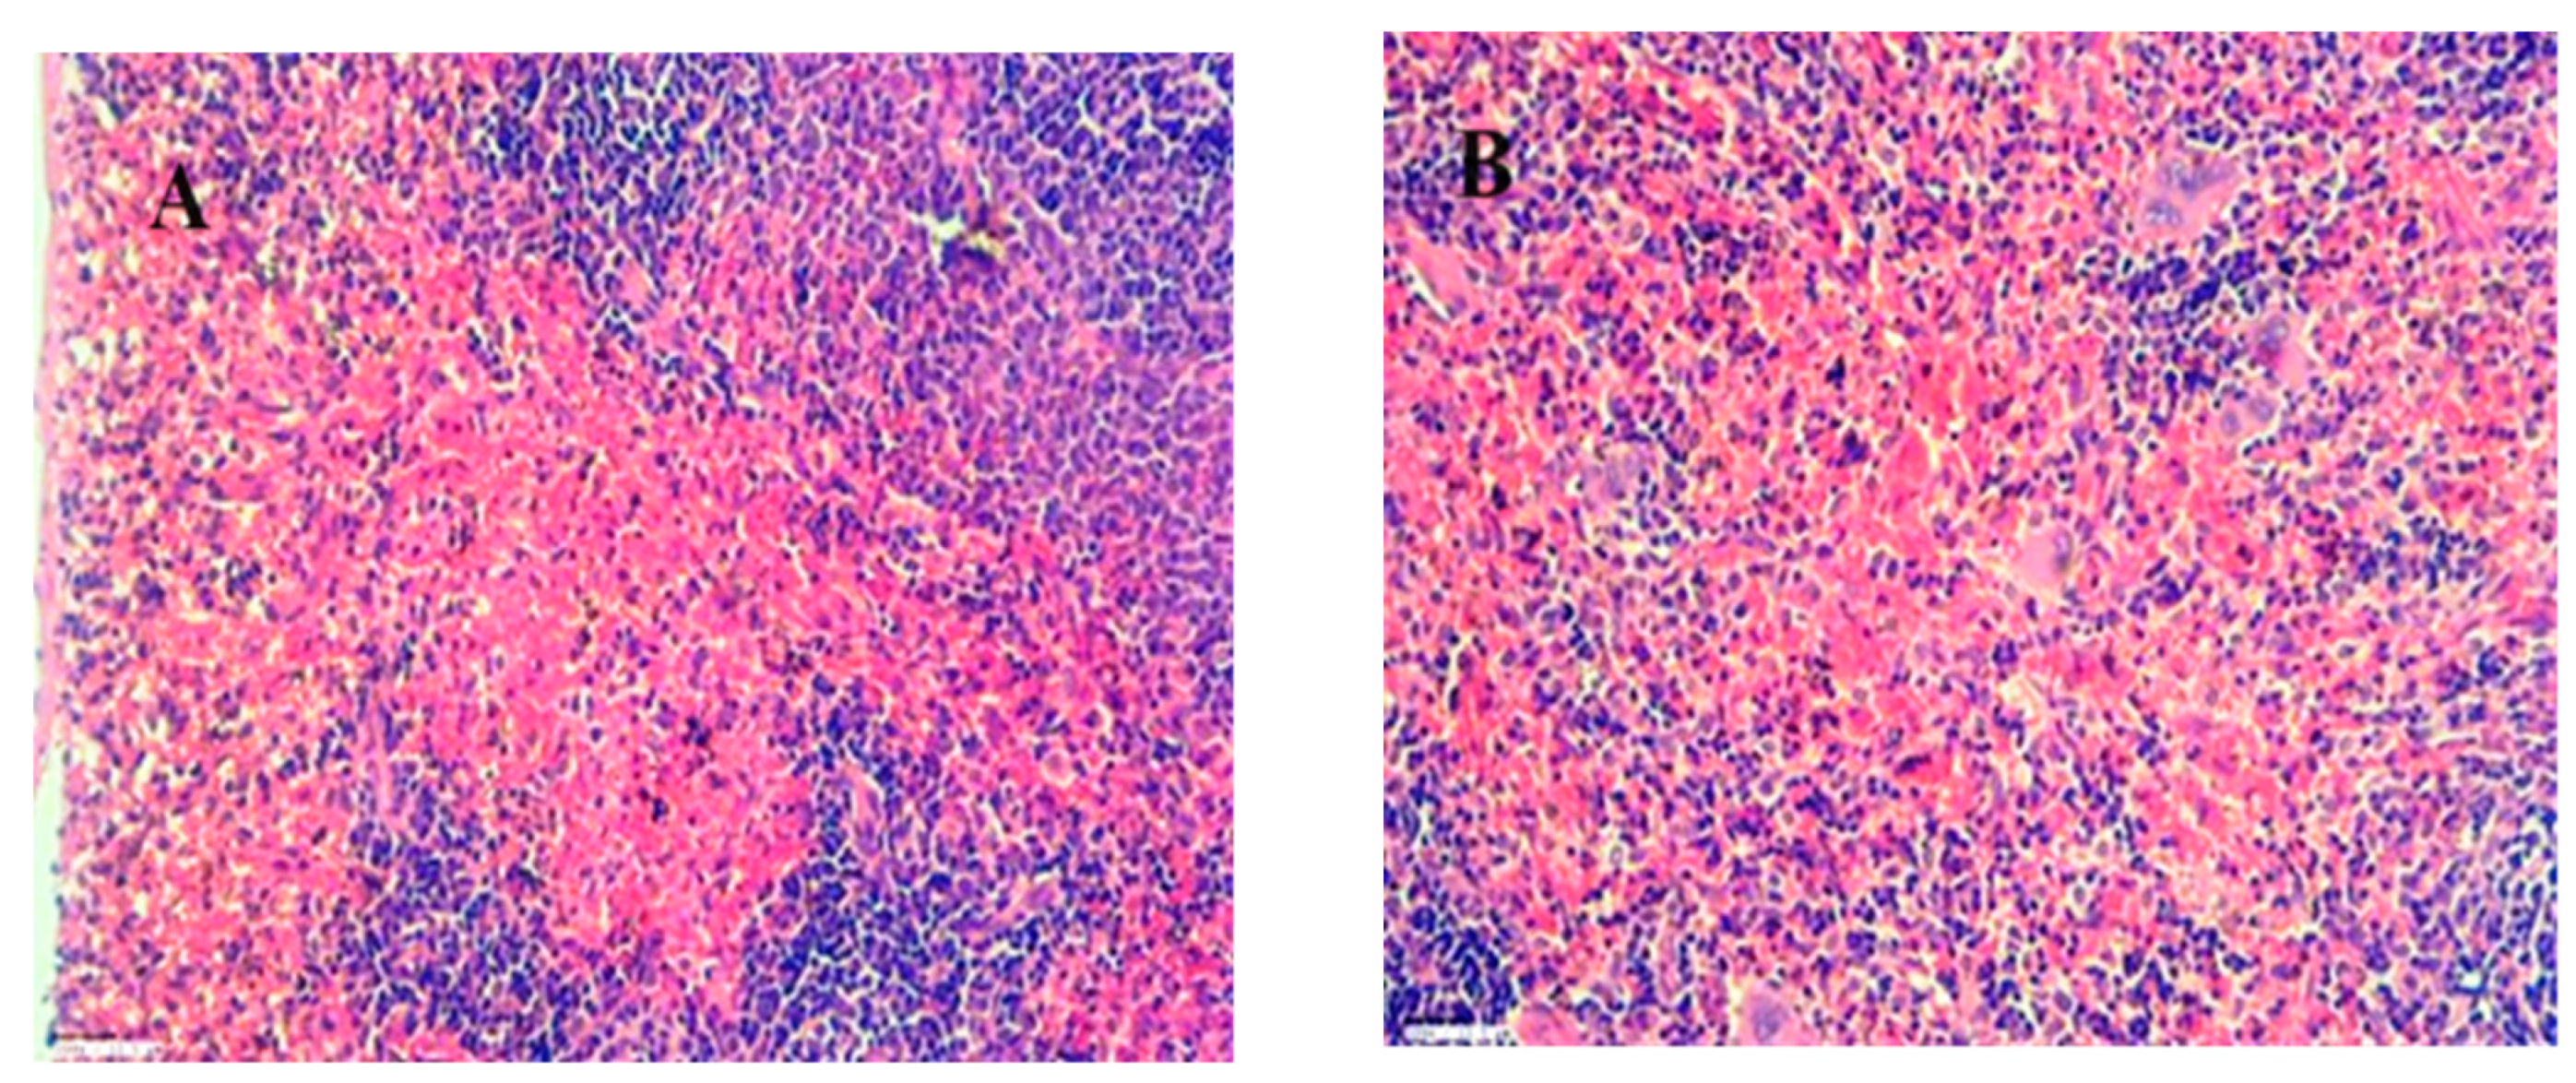
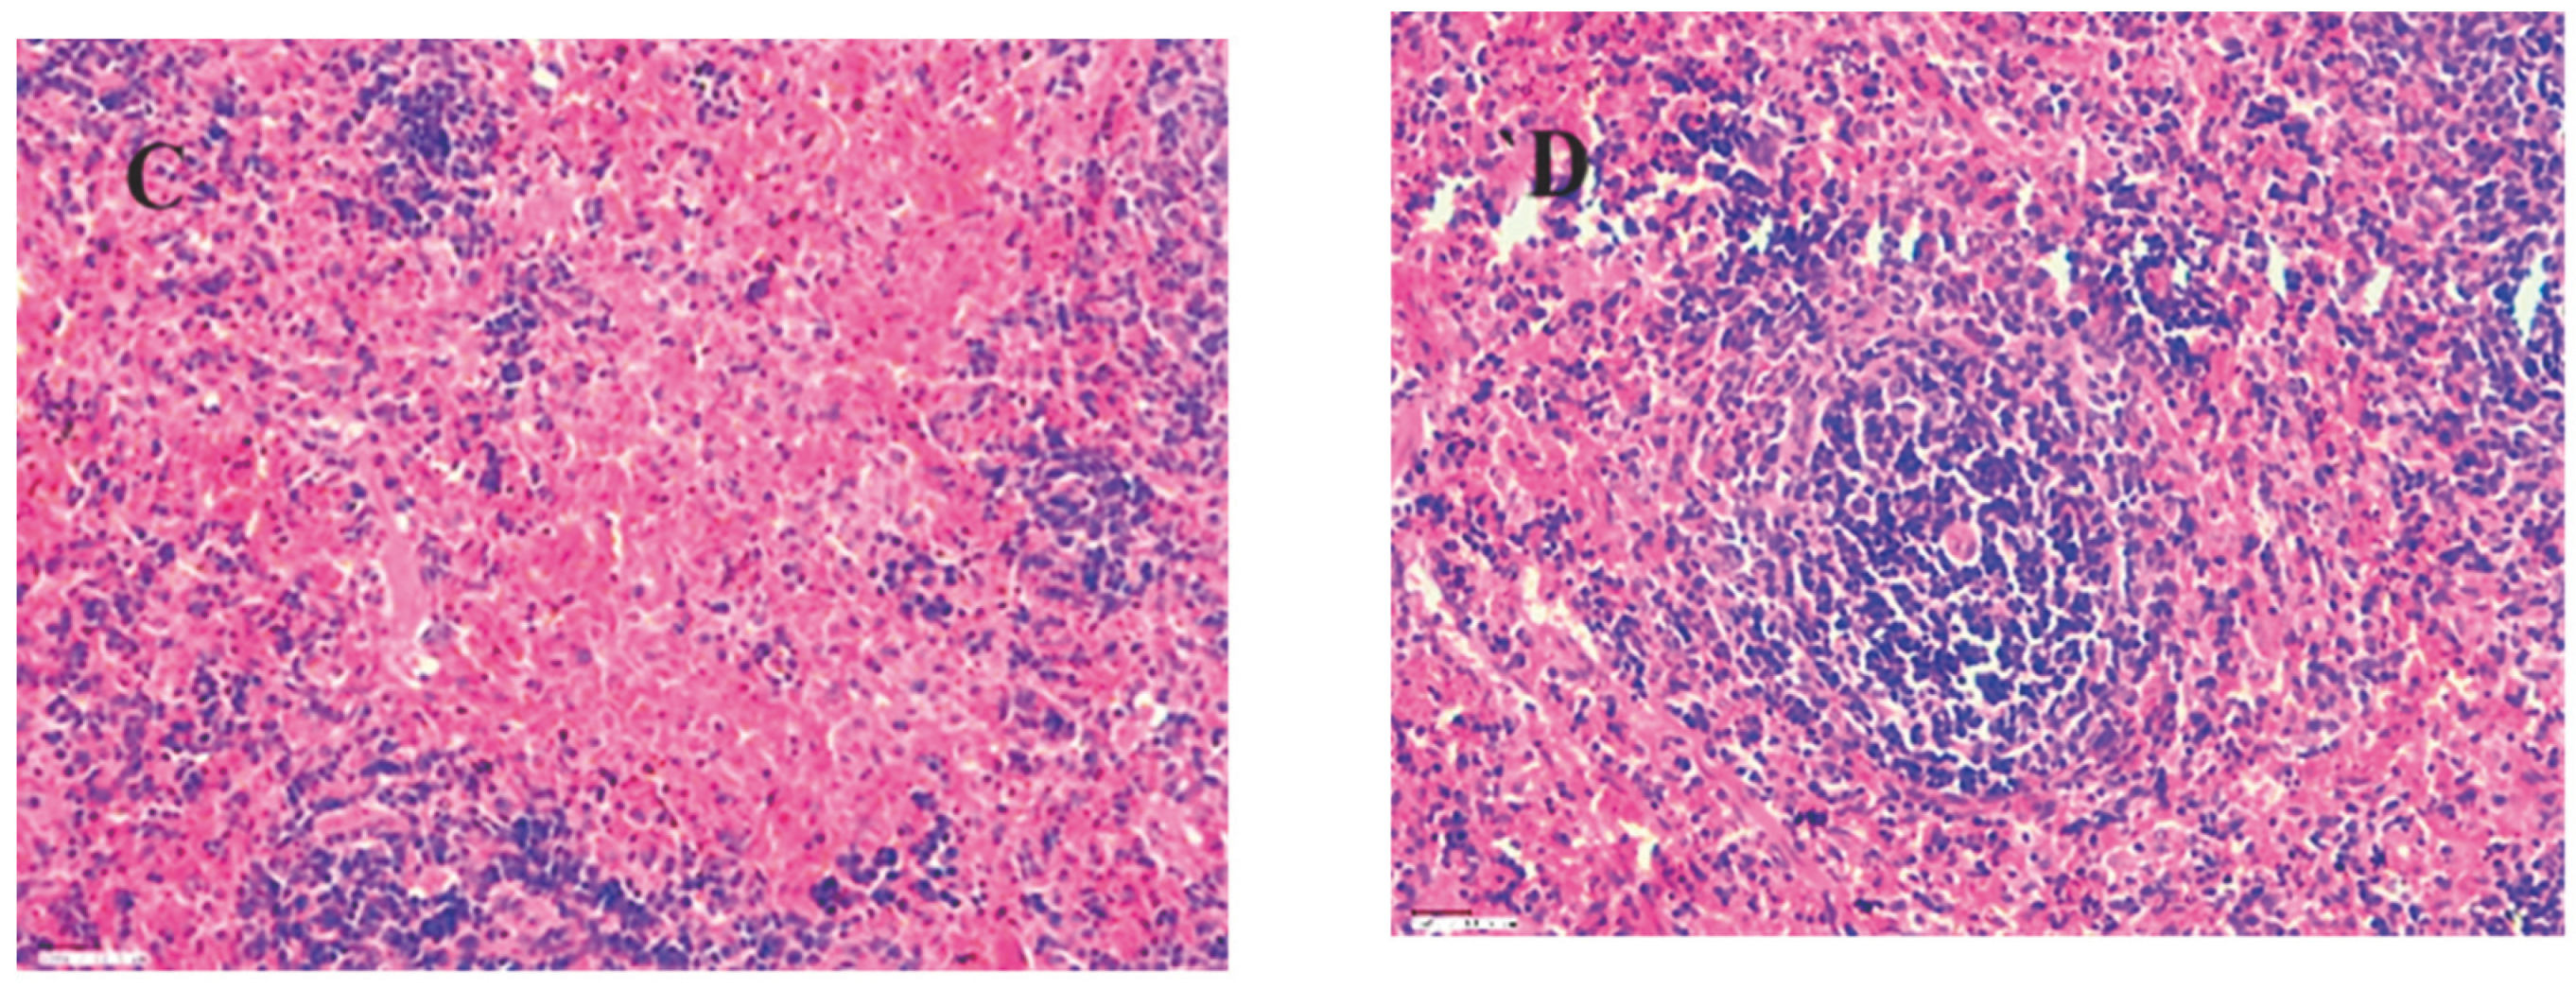
Figure 22.
In an H&E stained liver section, the following features are evident: a) At 45X magnification, there is an infiltration of inflammatory cells both in the periportal region and within the parenchyma. b) At 45X magnification, hepatocytes display hydropic degeneration and necrosis, accompanied by an infiltrate of inflammatory cells. c) A focal region of hepatocyte necrosis is observed at 45X magnification.
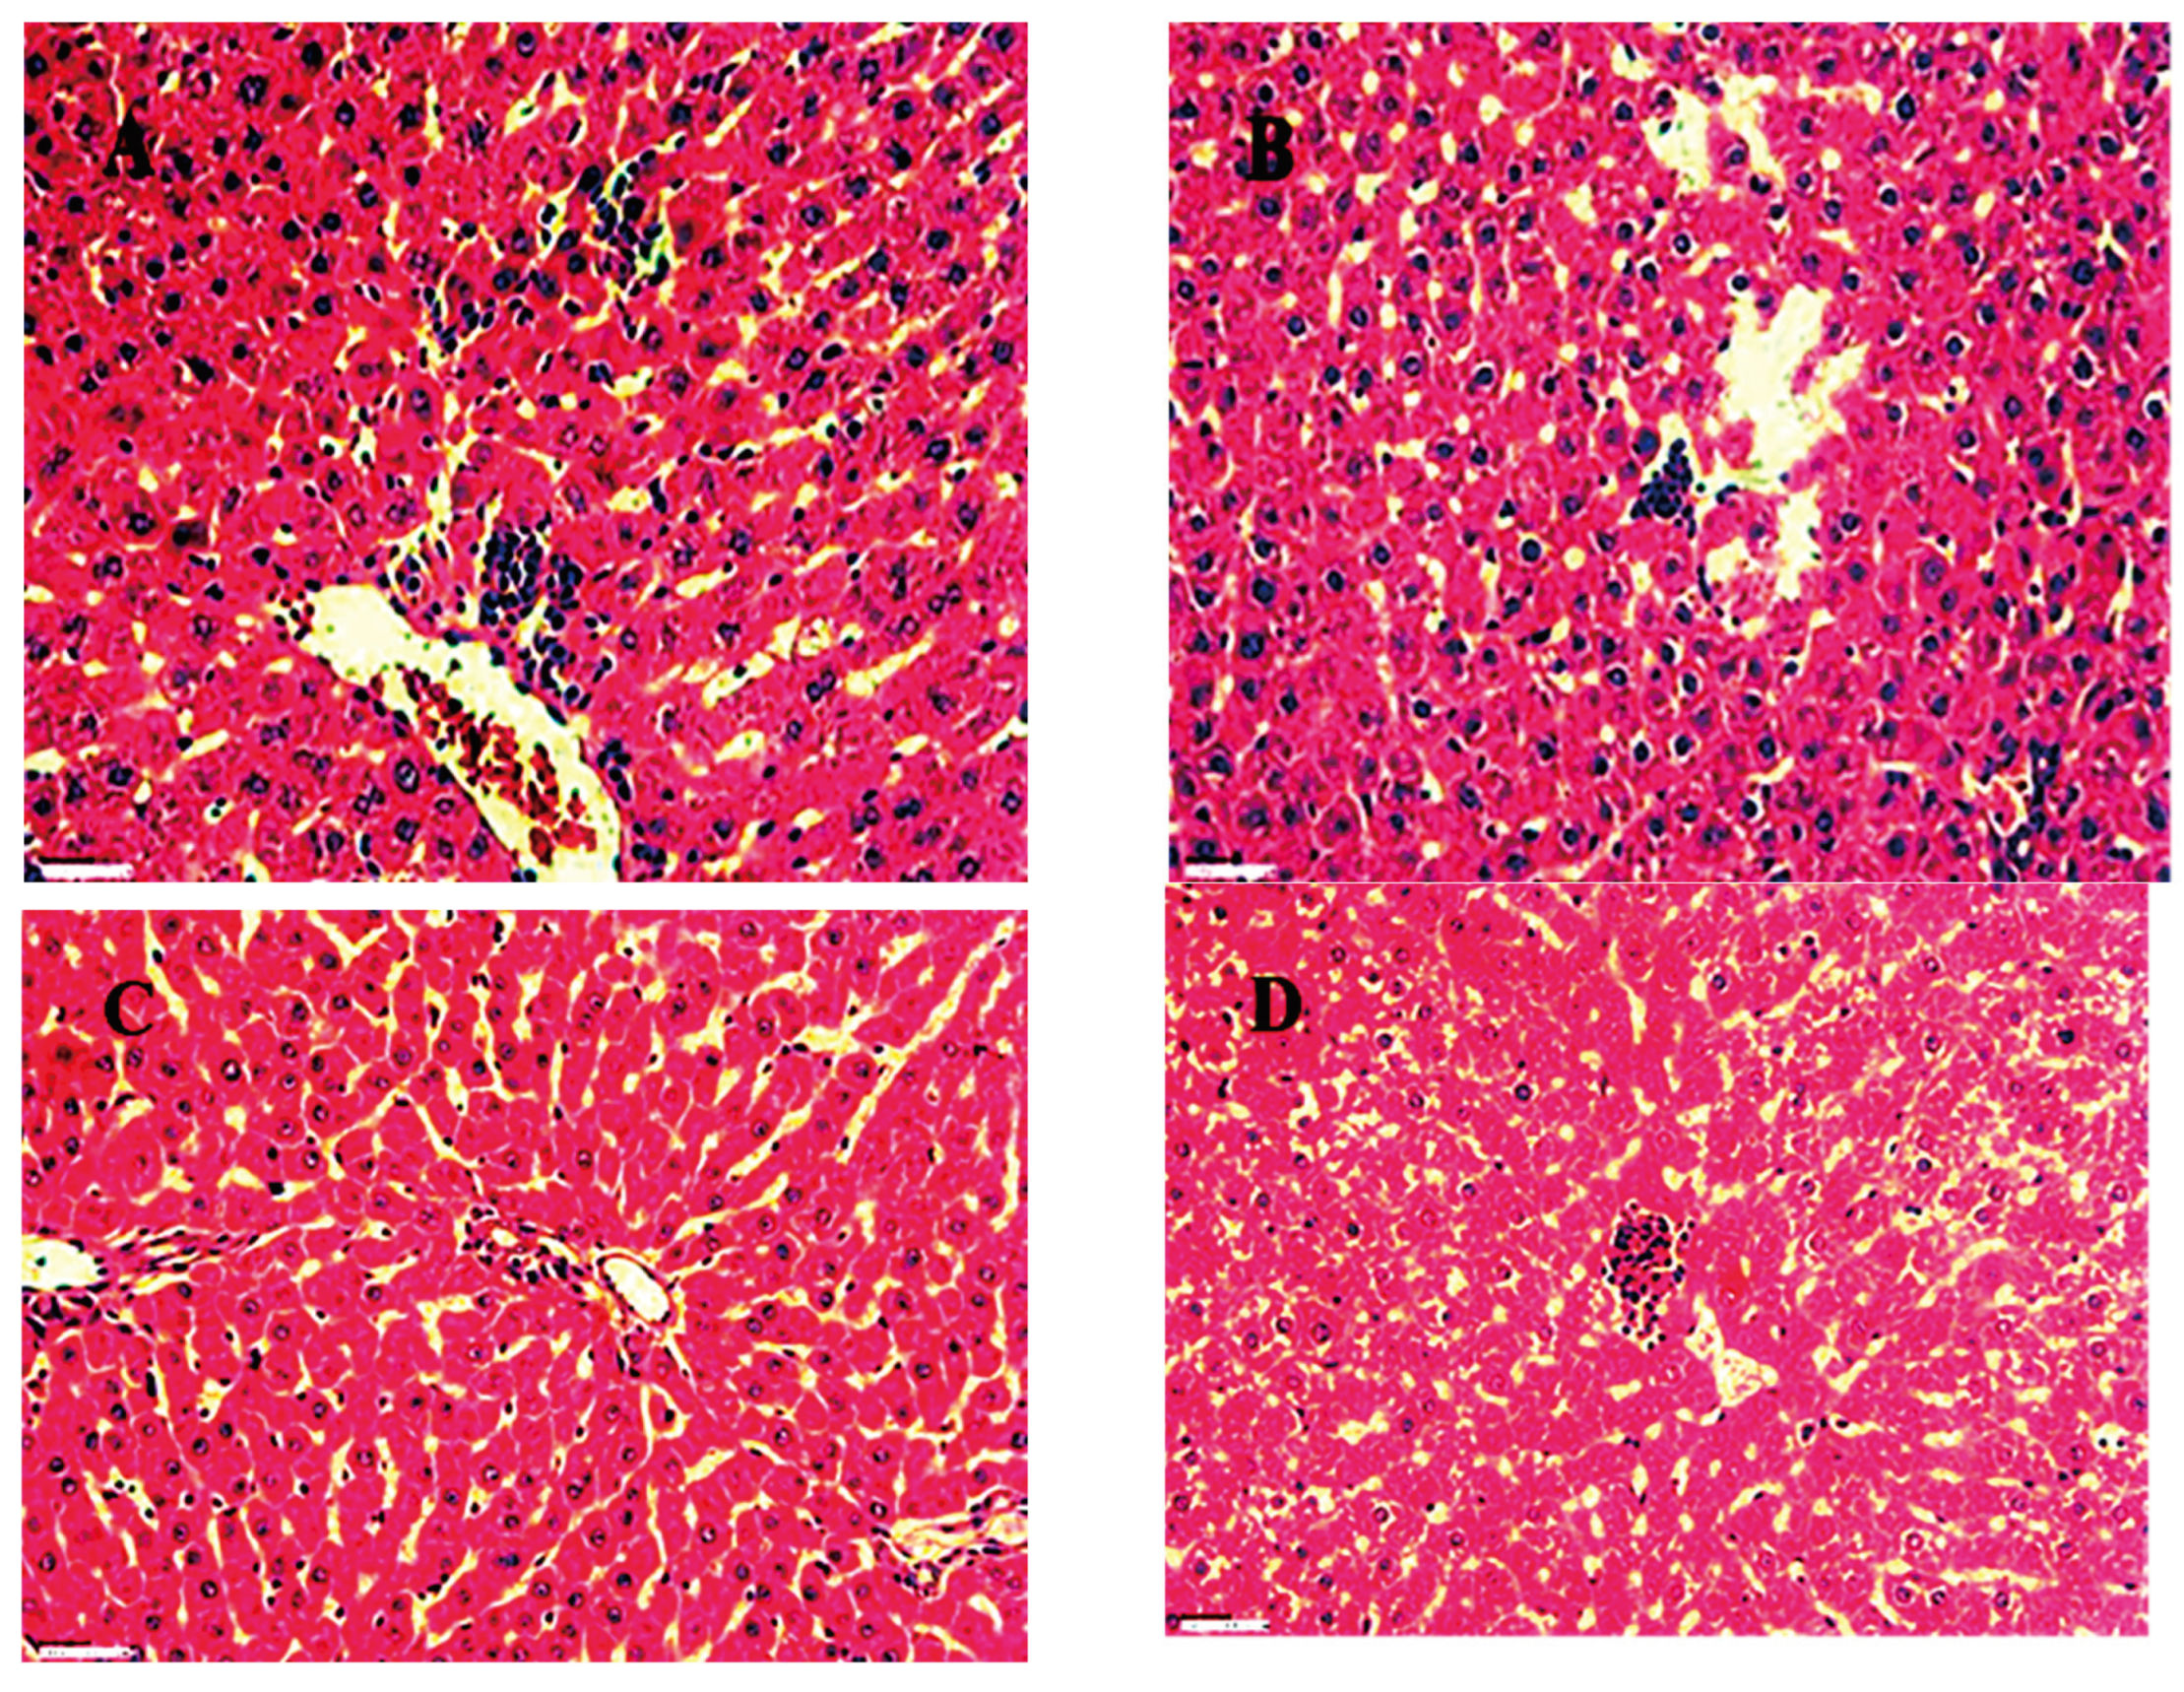
Figure 23.
H&E stained section of Brain A) (Control) Normal hippocampal region 45X, B) (Standard) Normal intact neurons and neurons with pyknotic nuclei 45X, C) (PTZ) Normal hippocampal region 45X, D ) (No 2) Normal hippocampal region 45X.
Figure 23.
H&E stained section of Brain A) (Control) Normal hippocampal region 45X, B) (Standard) Normal intact neurons and neurons with pyknotic nuclei 45X, C) (PTZ) Normal hippocampal region 45X, D ) (No 2) Normal hippocampal region 45X.
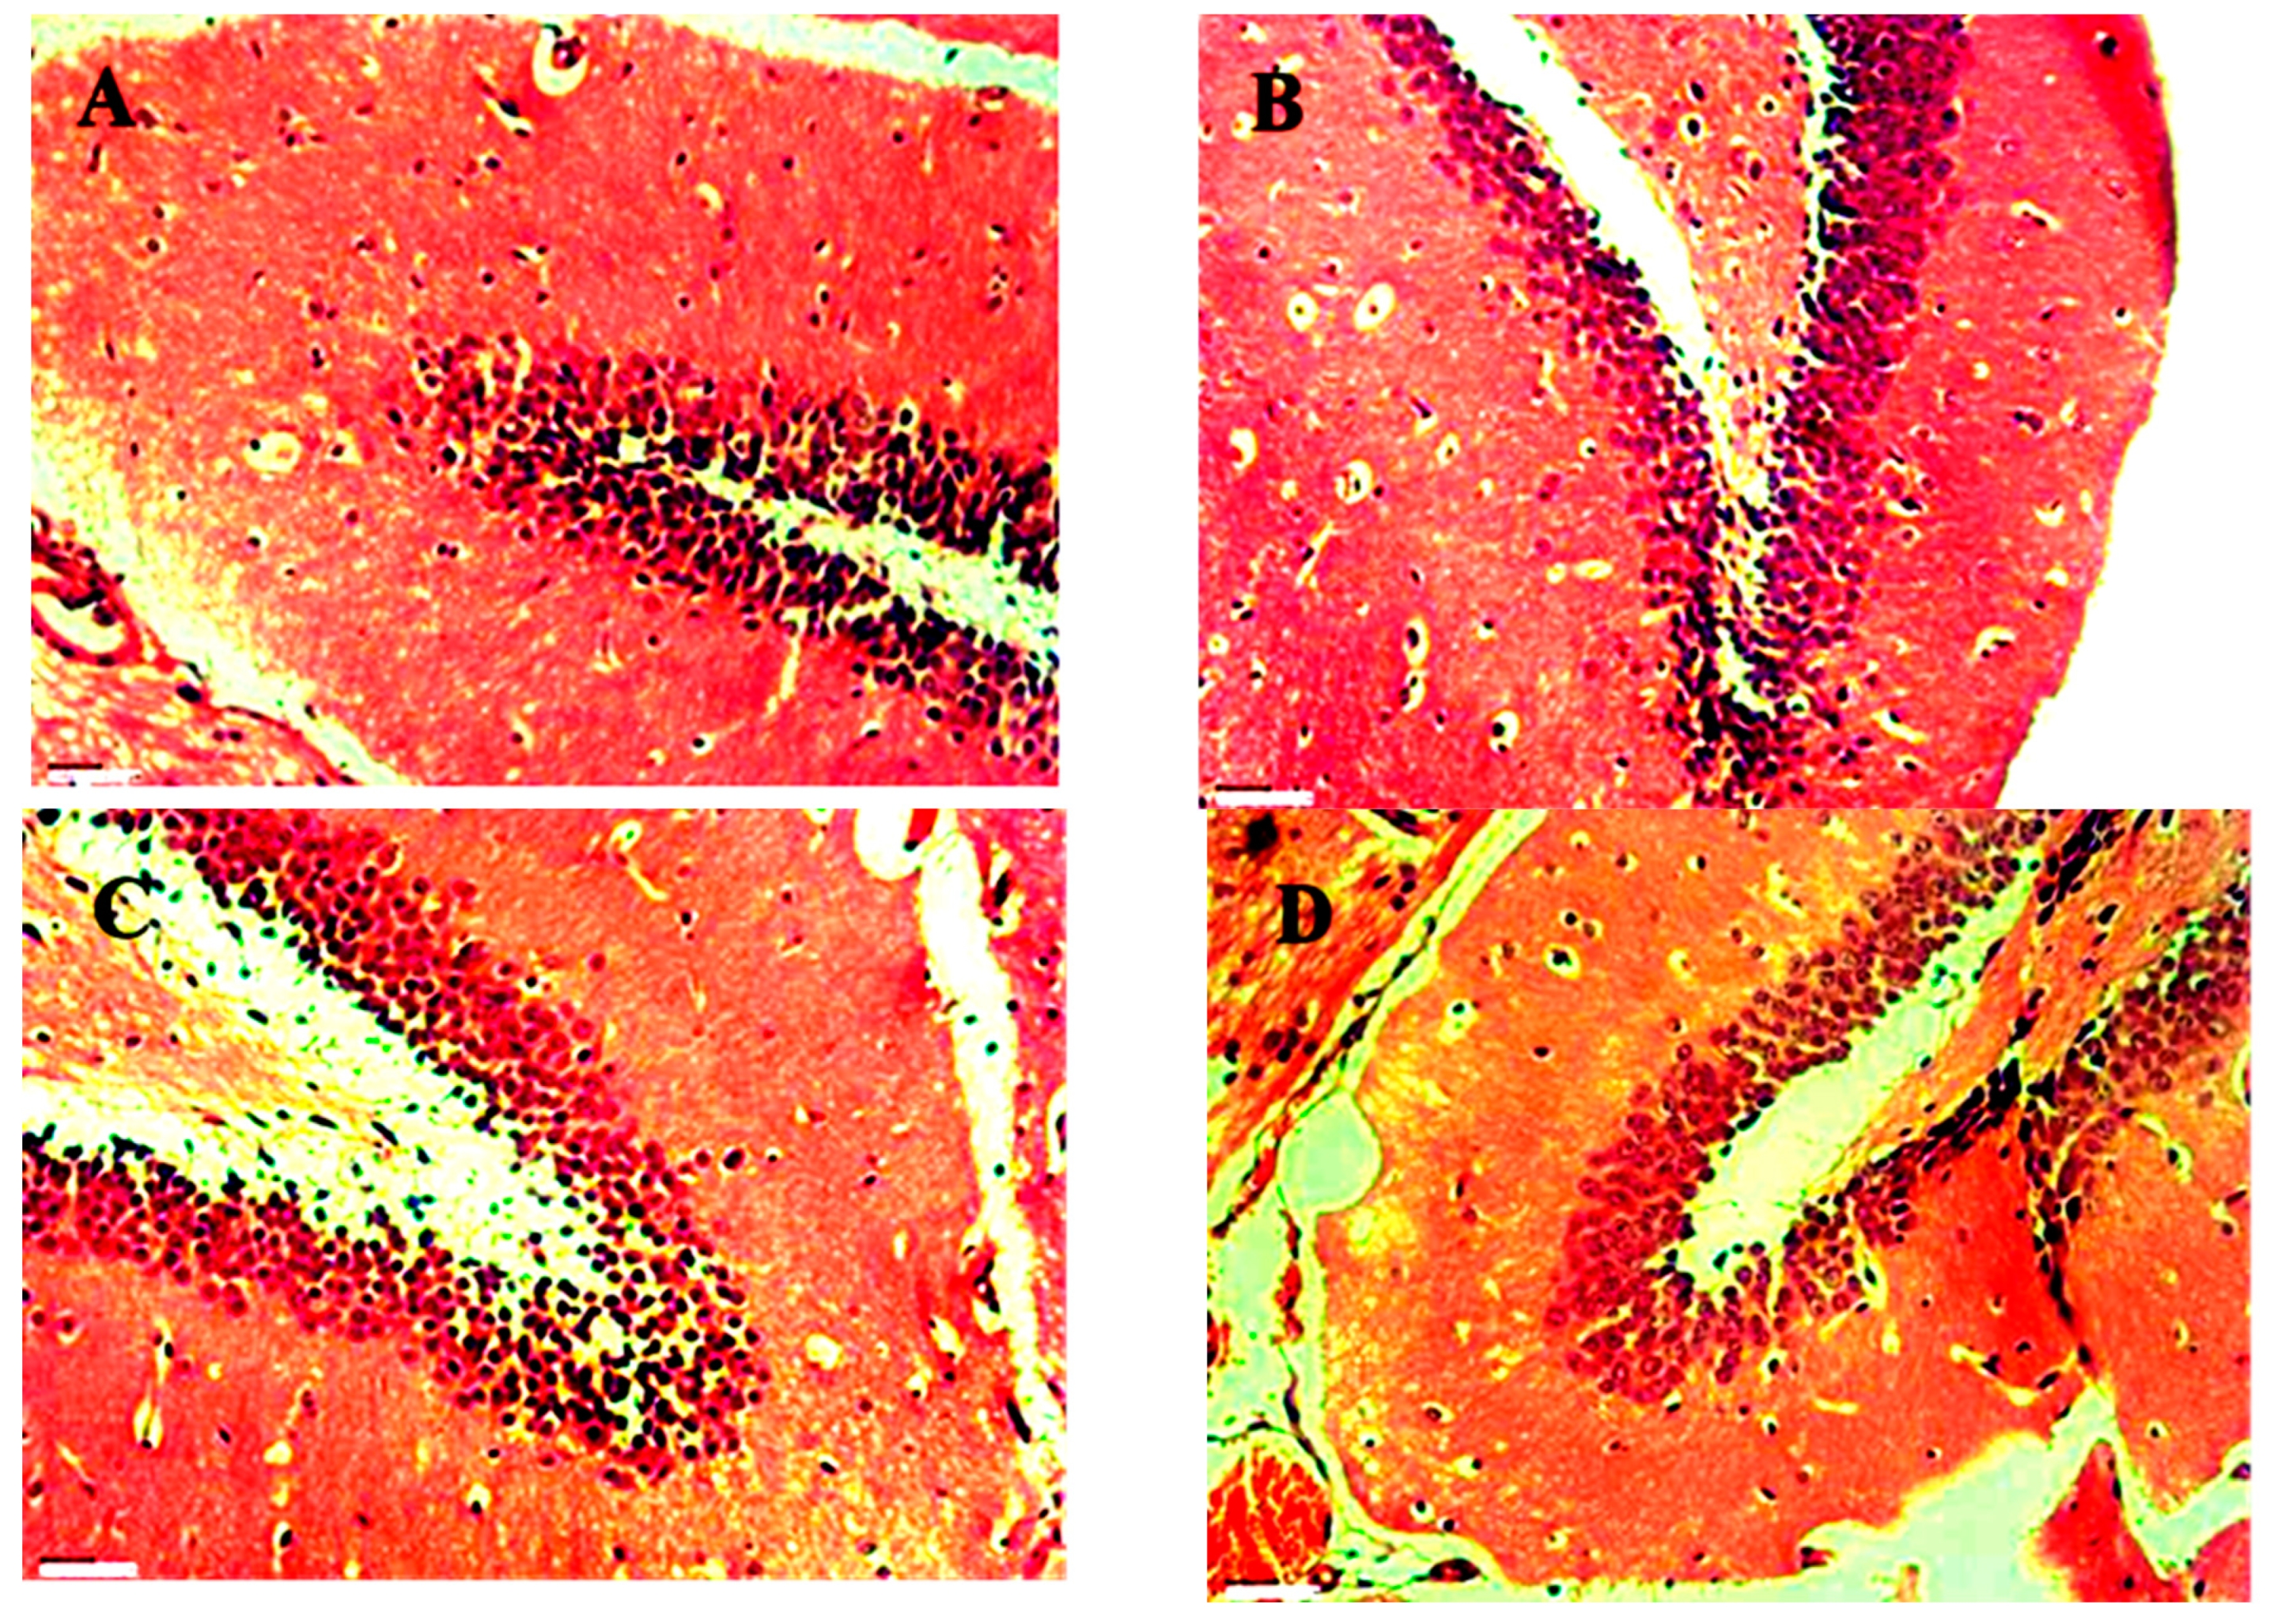
Table 1.
Scheme 1 (Aldehyde).
| Compounds | R1 | R2 |
|---|---|---|
| 1 | H | 2-Cl |
| 2 | H | 3-Cl |
| 3 | H | 4-Cl |
| 4 | H | 5-Cl |
| 5 | H | 4-Fl |
| 6 | H | 4-OH |
| 7 | H | 4-(NH2)C5H4N |
| 8 | H | 2-(NH2)C5H4N |
| 9 | H | 5-Fl |
| 10 | H | C5H5N |
Table 2.
Scheme 2 (Anilines).
Table 2.
Scheme 2 (Anilines).
| Compounds | R3 | R4 |
|---|---|---|
| 11 | H | 2-Cl |
| 12 | H | 4-Br |
| 13 | H | 2-F |
| 14 | H | 4-F |
| 15 | H | 2-(NH2)C5H4N |
| 16 | H | 3-Cl,4-F |
| 17 | H | 2-Br |
| 18 | H | 2-CH3, 3-NO2 |
Table 3.
Predicated binding energies at different Receptor.
 |
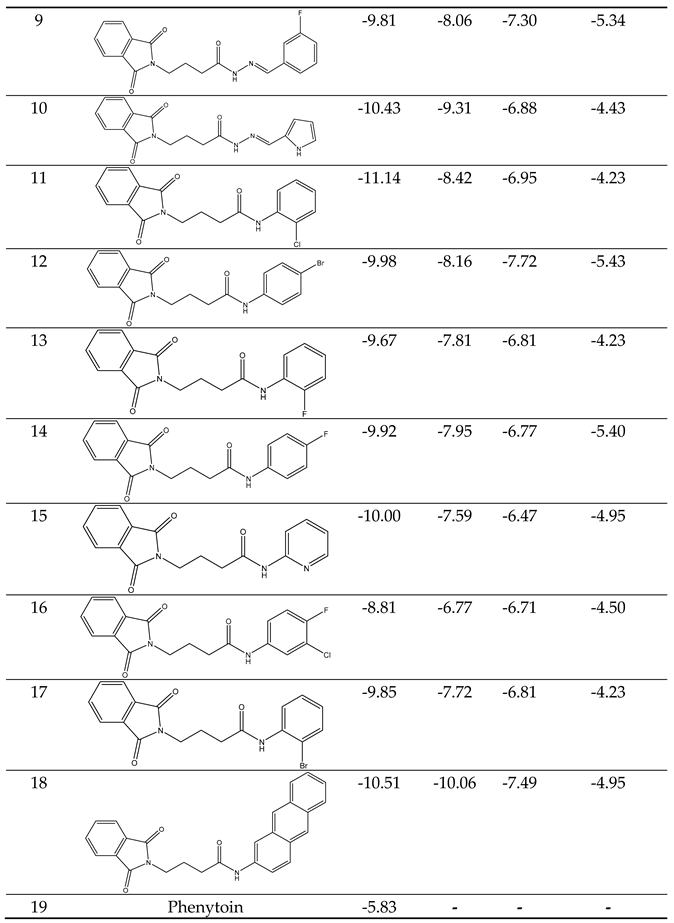 |
Table 4.
Training Set Creation.
 |
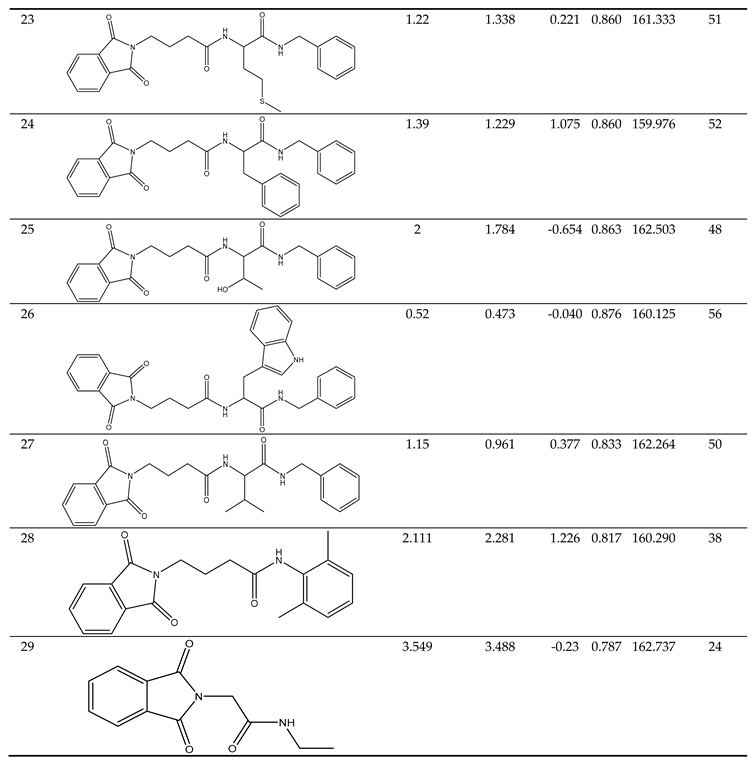 |
Table 5.
Parameters of model validation and their threshold values.
 |
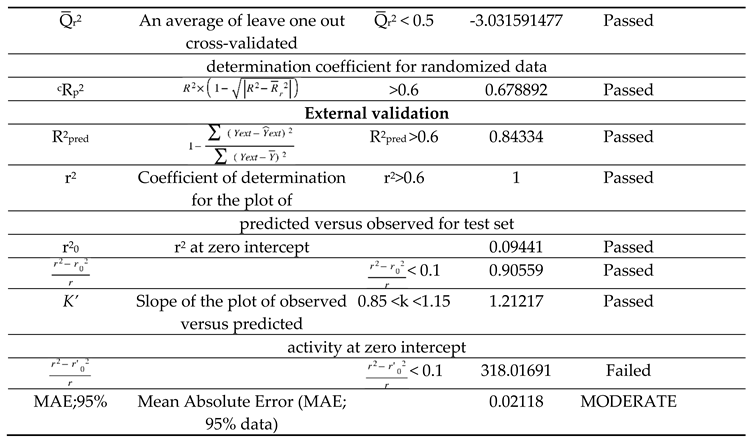 |
Table 6.
Predicting the biological activity of designed compounds.
 |
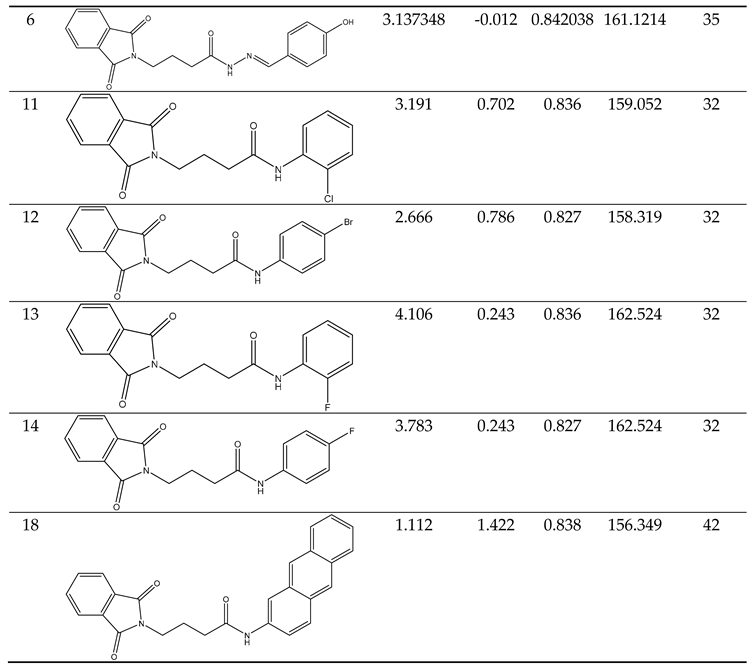 |
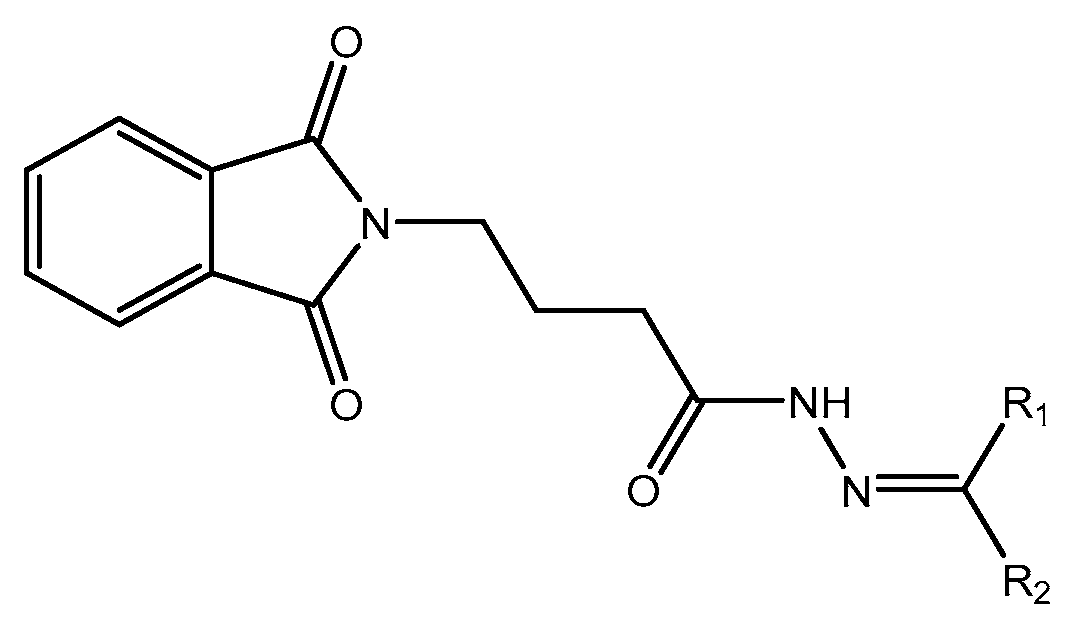
Table 8.
list of novel compounds.
| S.no | Structure | R1 | R2 | R3 |
|---|---|---|---|---|
| 11. | 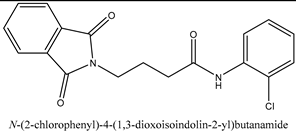 |
H | Cl | - |
Disclaimer/Publisher’s Note: The statements, opinions and data contained in all publications are solely those of the individual author(s) and contributor(s) and not of MDPI and/or the editor(s). MDPI and/or the editor(s) disclaim responsibility for any injury to people or property resulting from any ideas, methods, instructions or products referred to in the content. |
© 2024 by the authors. Licensee MDPI, Basel, Switzerland. This article is an open access article distributed under the terms and conditions of the Creative Commons Attribution (CC BY) license (http://creativecommons.org/licenses/by/4.0/).
Copyright: This open access article is published under a Creative Commons CC BY 4.0 license, which permit the free download, distribution, and reuse, provided that the author and preprint are cited in any reuse.


