1. Introduction
The demand for energy is increasing day after day. There are currently several renewable energy sources, including hydroelectricity, geothermal energy, biomass energy, wind energy and photovoltaic solar energy. This last source of energy is the subject of this study. The main advantage of these renewable energies is that they reduce pollution. This is because they do not produce greenhouse gases such as carbon dioxide and nitrogen oxides, which are thought to be responsible for global warming of the earth's surface. A part of our research focuses on simulation [
1] aimed to optimize the performance of photovoltaic panels.
Photovoltaic modules lose their efficiency due to a number of factors, including the influence of external factors such as temperature, wind, humidity and dust accumulation, as well as the characteristics of the photovoltaic system, such as the angle of inclination, altitude and orientation. One of the main factors affecting the performance and capacity of photovoltaic panels is dust [
2]. The deposition of dust on the surface of PV modules and high temperatures are major constraints related to the conditions of photovoltaic systems in the Saharan environment. In fact, the Saharan environment is characterized by frequent and permanent sandstorms. However, the opinions are different on the significant impact on the production of photovoltaic modules. The accumulation of dust on the surface of solar photovoltaic modules results in a reduction in short-circuit current (I sc) and output power, compared with the same parameters for clean modules. The average rate of performance degradation of solar modules exposed to dust is 6.24%, 11.8% and 18.74% for exposure periods of one day, one week and one month, respectively [
3]. Studies show that light transmission varies according to the type of dust. Laboratory experiments are carried out using various instruments such as microscopes, spectrophotometers, I-V photovoltaic module analyzers and data loggers equipped with thermocouples. The results obtained show that fluctuations in physical parameters such as grain size and type, light transmission level and the temperature of the glass lead to changes in the performance of the photovoltaic (PV) panel [
4]. The presence of dust results in a 21.57% decrease in photovoltaic module output power for dusty panels compared to clean panels. In addition, a lower reliability of dusty panels compared to their clean counterparts was observed, mainly due to the loss of output power caused by the effect of dust. These results clearly highlight the importance of proper maintenance and service of photovoltaic modules to prevent their degradation due to dust deposits [
5]. The efficiency of photovoltaic cells decreases by around 0.5% as the temperature of the solar panels rises. To achieve acceptable efficiency, affordable cooling systems are needed, offering potential benefits such as improved electricity production and use of the extracted heat for domestic or industrial purposes. The "Ground-Coupled Central Panel Cooling System" (GC-CPCS), presented in the study, represents an innovation with its centred approach, the use of a ground-coupled heat exchanger [
6].
The aim of cooling the photovoltaic module is to lower its surface temperature during operation, which helps to increase the rate of dissipation of the heat generated by photovoltaic modules [
7], [
8], [
9]. In addition, adequate cooling can extend the life of photovoltaic panels. In the studies carried out in this context, humid grass (dry grass with water) was used to cool the back surface of the PV panel, while a mass ratio of water was used to cool the front surface of the panel. Perforated pipes are placed on either side of the front surface of the panel to allow water to be distributed from the reservoir. The experiment resulted in a decrease of temperature by 21.23 degrees Fahrenheit. The power output of the panel increased by 28.6% and the average efficiency of the cooled PV module was 34.96% [
10]. However, the implementation of a microcontroller-based thermally controlled water spray system using an Arduino board improved the efficiency of the solar cell by up to 16.65% [
11]. In addition, the use of a cooling system for the PVT includes a special arrangement of copper tubes placed at its end, making it possible to increase the percentage volume and volume flow rate of the nanoparticles, thereby improving energy efficiency. Furthermore, by adding 1% nanoparticles, the energy yield is increased by 0.45% at a volume flow rate of 0.5 l/min [
12]. In parallel, active cooling of the photovoltaic panel is also underway, generally requiring the use of devices such as a pump to circulate water or forced air to remove heat, compared with the passive cooling technique. This essentially consists of installing fins on the back of the photovoltaic panels to improve heat transfer by natural convection and radiation [
13]. In addition, cooling techniques are studied and compared in order to select the most effective approach for the performance of photovoltaic systems [
14], [
15], [
16], [
17], [
18]. All researchers have concluded that the temperature of the photovoltaic module is an important parameter that strongly influences its efficiency [
19], [
20], [
21], [
22]. Furthermore, the most effective approach for improving the performance of photovoltaic systems [
23], [
24], [
25]. The conclusion was that such an evaporative cooling system could reduce the module temperature by 10ºC for 5 minutes. It is obvious that these studies do not take into account the nature of the water used to cool these panels.
In our daily lives, we use water for drinking, washing up, showering, cooking and many other purposes, but water is not only used for domestic purposes, it is also used in industry and agriculture. It has many applications: water can be used to cool substances, in production processes, for transporting and processing raw materials, for boiling or cooking, for rinsing, for transporting products, and it can also be used to cool photovoltaic panels and clean PV modules of sales dust.
In this study, we will analyze the effect of temperature, solar irradiation and wind dust, as well as analyzing the water used to cool and clean the photovoltaic panels (limescale deposits and saddles on the top of the panels). The main advantage of this study is to avoid any loss of yield from photovoltaic panels, particularly in dry regions, which are characterised by high temperatures above 25°C throughout the year. In general, the drinking water treatment process is optimized by analyzing all the water treatment units, and some solutions are given to maximize water treatment performance without compromising water quality standards. Some solutions and practical methods are applied to the water treatment plant located in central Morocco (Meknes) [
26]. A new methodology has been developed to monitor and control the quality of drinking water: the conventional approach using natural coagulants (DS) and (PS). This has resulted in a significant reduction in turbidity to less than 5 NTU. Moreover, in some cases, the residual turbidity of the water was less than 0.1 NTU [
27]. We will begin this study with a brief presentation of the study area: its geographical context, its hydrological and hydrogeological context, and its climatological context, in which we will describe the water resources, the temperature and the wind. This is followed by a description of the equipment and the method used, then a presentation of the results with a discussion, and finally a conclusion.
2. Materials and Methods
2.1. Geographic Context of the Study Area
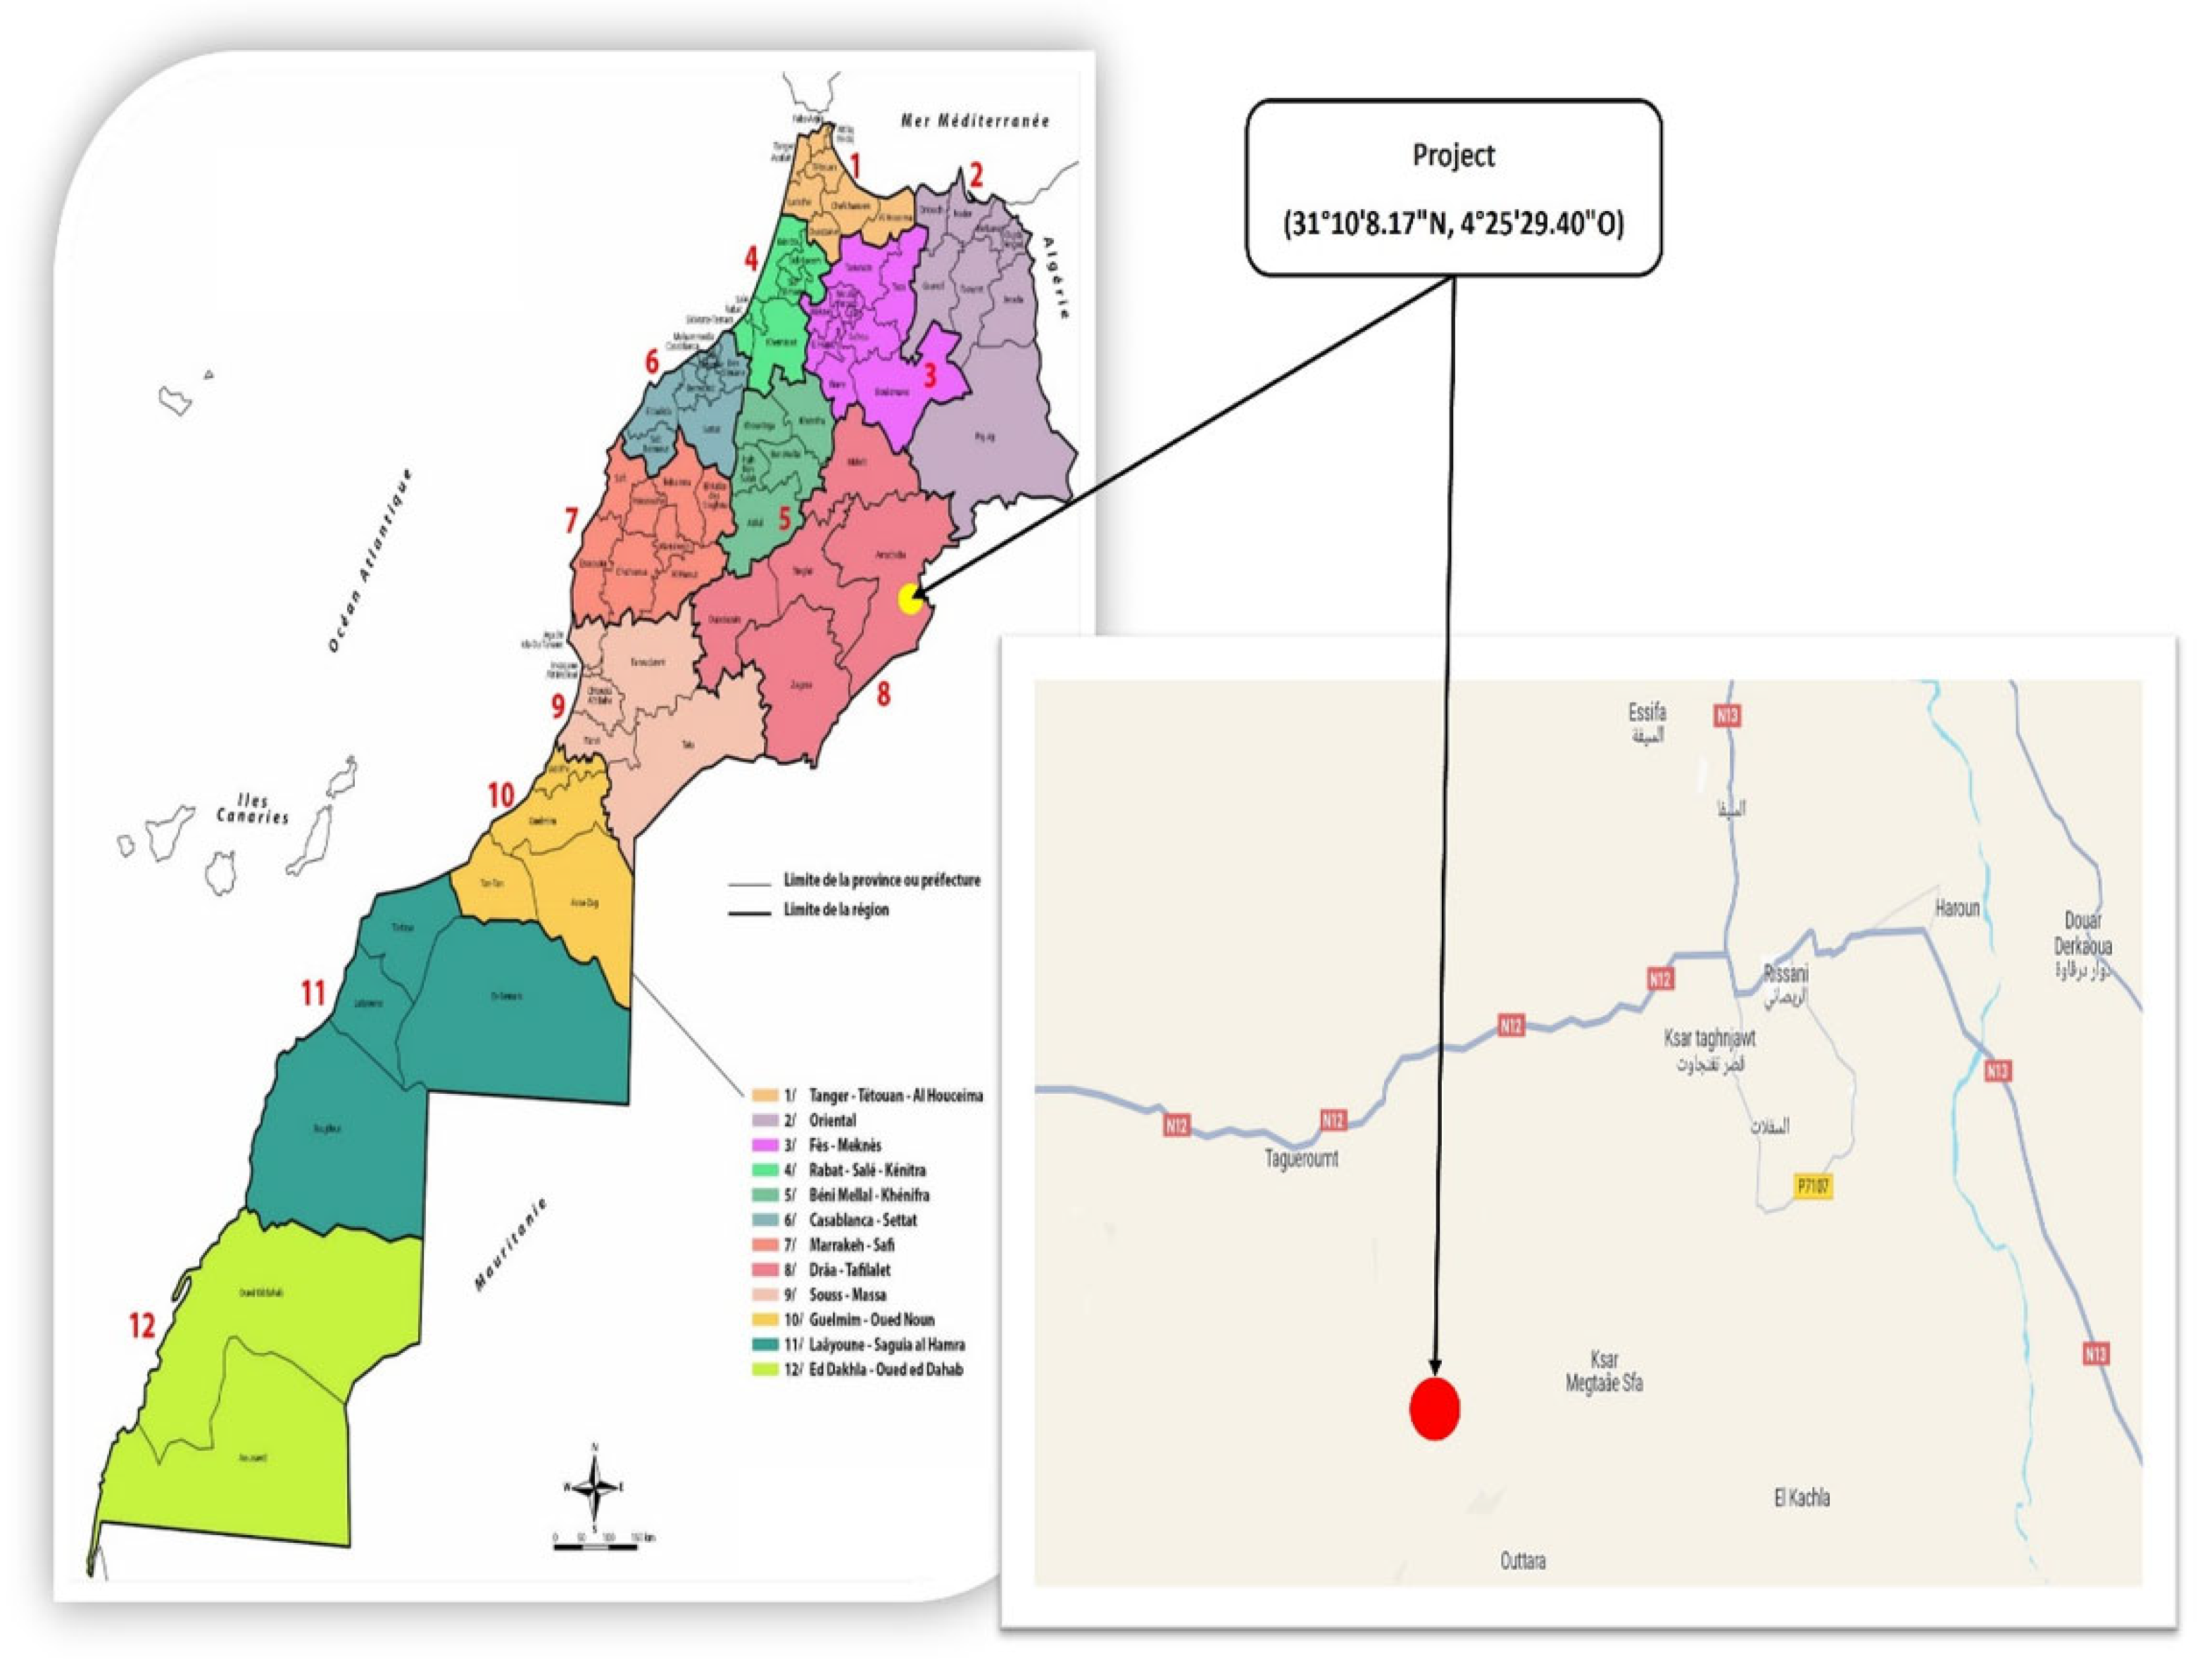
The city of Sijilmassa, nowadays called Rissani, is located in the plain of Tafilalet in the extreme south-east of Morocco. It covers approximately 8.44% of Morocco's surface area (around 60,000 km2). The plain stretches longitudinally between latitudes 30° and 30° 31', and is crossed by the ZIZ and the Ghéris valleys, which provide the irrigation of the oasis vegetation and the supply of groundwater. Ksar Tabht El khir is a village of Amazigh origin located precisely (31°10'8.17 "N, 4°25'29.40 "W) 22 km from the centre of Rissani.
Figure 1.
Location map of the study area.
Figure 1.
Location map of the study area.
2.2. Hydrological and Hydrogeological Context
2.2.1. Water Surfaces
The Tafilalet plain is considered to be a practically closed endoreic basin, where all the surface and groundwater of the Ziz-Ghéris basin converge.
2.2.2. The Gheris Watershed
The Ghéris watershed is characterized by its arid climate, which becomes Saharan towards the south. It extends well into the High Atlas to the north, providing its tributaries from the High Atlas with a relatively abundant supply of perennial water, which enables the oases and palm groves of southern Morocco to exist. It is located between latitudinal lines 30°45' and 31°30' North, and longitudinal lines 5° and 5°15' West. The valleys Ghéris is characterized by periods of low flow and a few very violent floods of short duration and very irregular occurrence.
2.2.3. The Ziz Watershed
The Ziz watershed was one of the first watersheds in southern Morocco to benefit from hydraulic development, with the Hassan Addakhil dam, and the exploitation of groundwater, including surface and deep water tables. It is limited to the south by the Guir watershed, to the west by the Gheris watershed, and in the north by the Moulouya watershed, with a total area of some 13,185 km2. This watershed presents a typical Saharan regime, with a permanent flow in the upper reaches. The Oued Ziz has a higher flow due to autumn and spring flooding. One of the biggest floods in the catchment area was in 2008, which caused enormous material damage, especially in the tourist region of Merzouga. The peak flow of this flood reached 2,600 m3/s [
28]. We can conclude that water is the best and least expensive source of cooling for the panels in this region, and can be used after cooling to irrigate the plants around the solar panels.
2.3. Climatological Context
Morocco has an average annual irradiation of over 2000 W/m2, making it an ideal location for solar applications. The solar irradiation data used in this study comes from the Meteonorm Global Meteorological Database. The study site is located near the town of Rissani.
2.3.1. Temperature
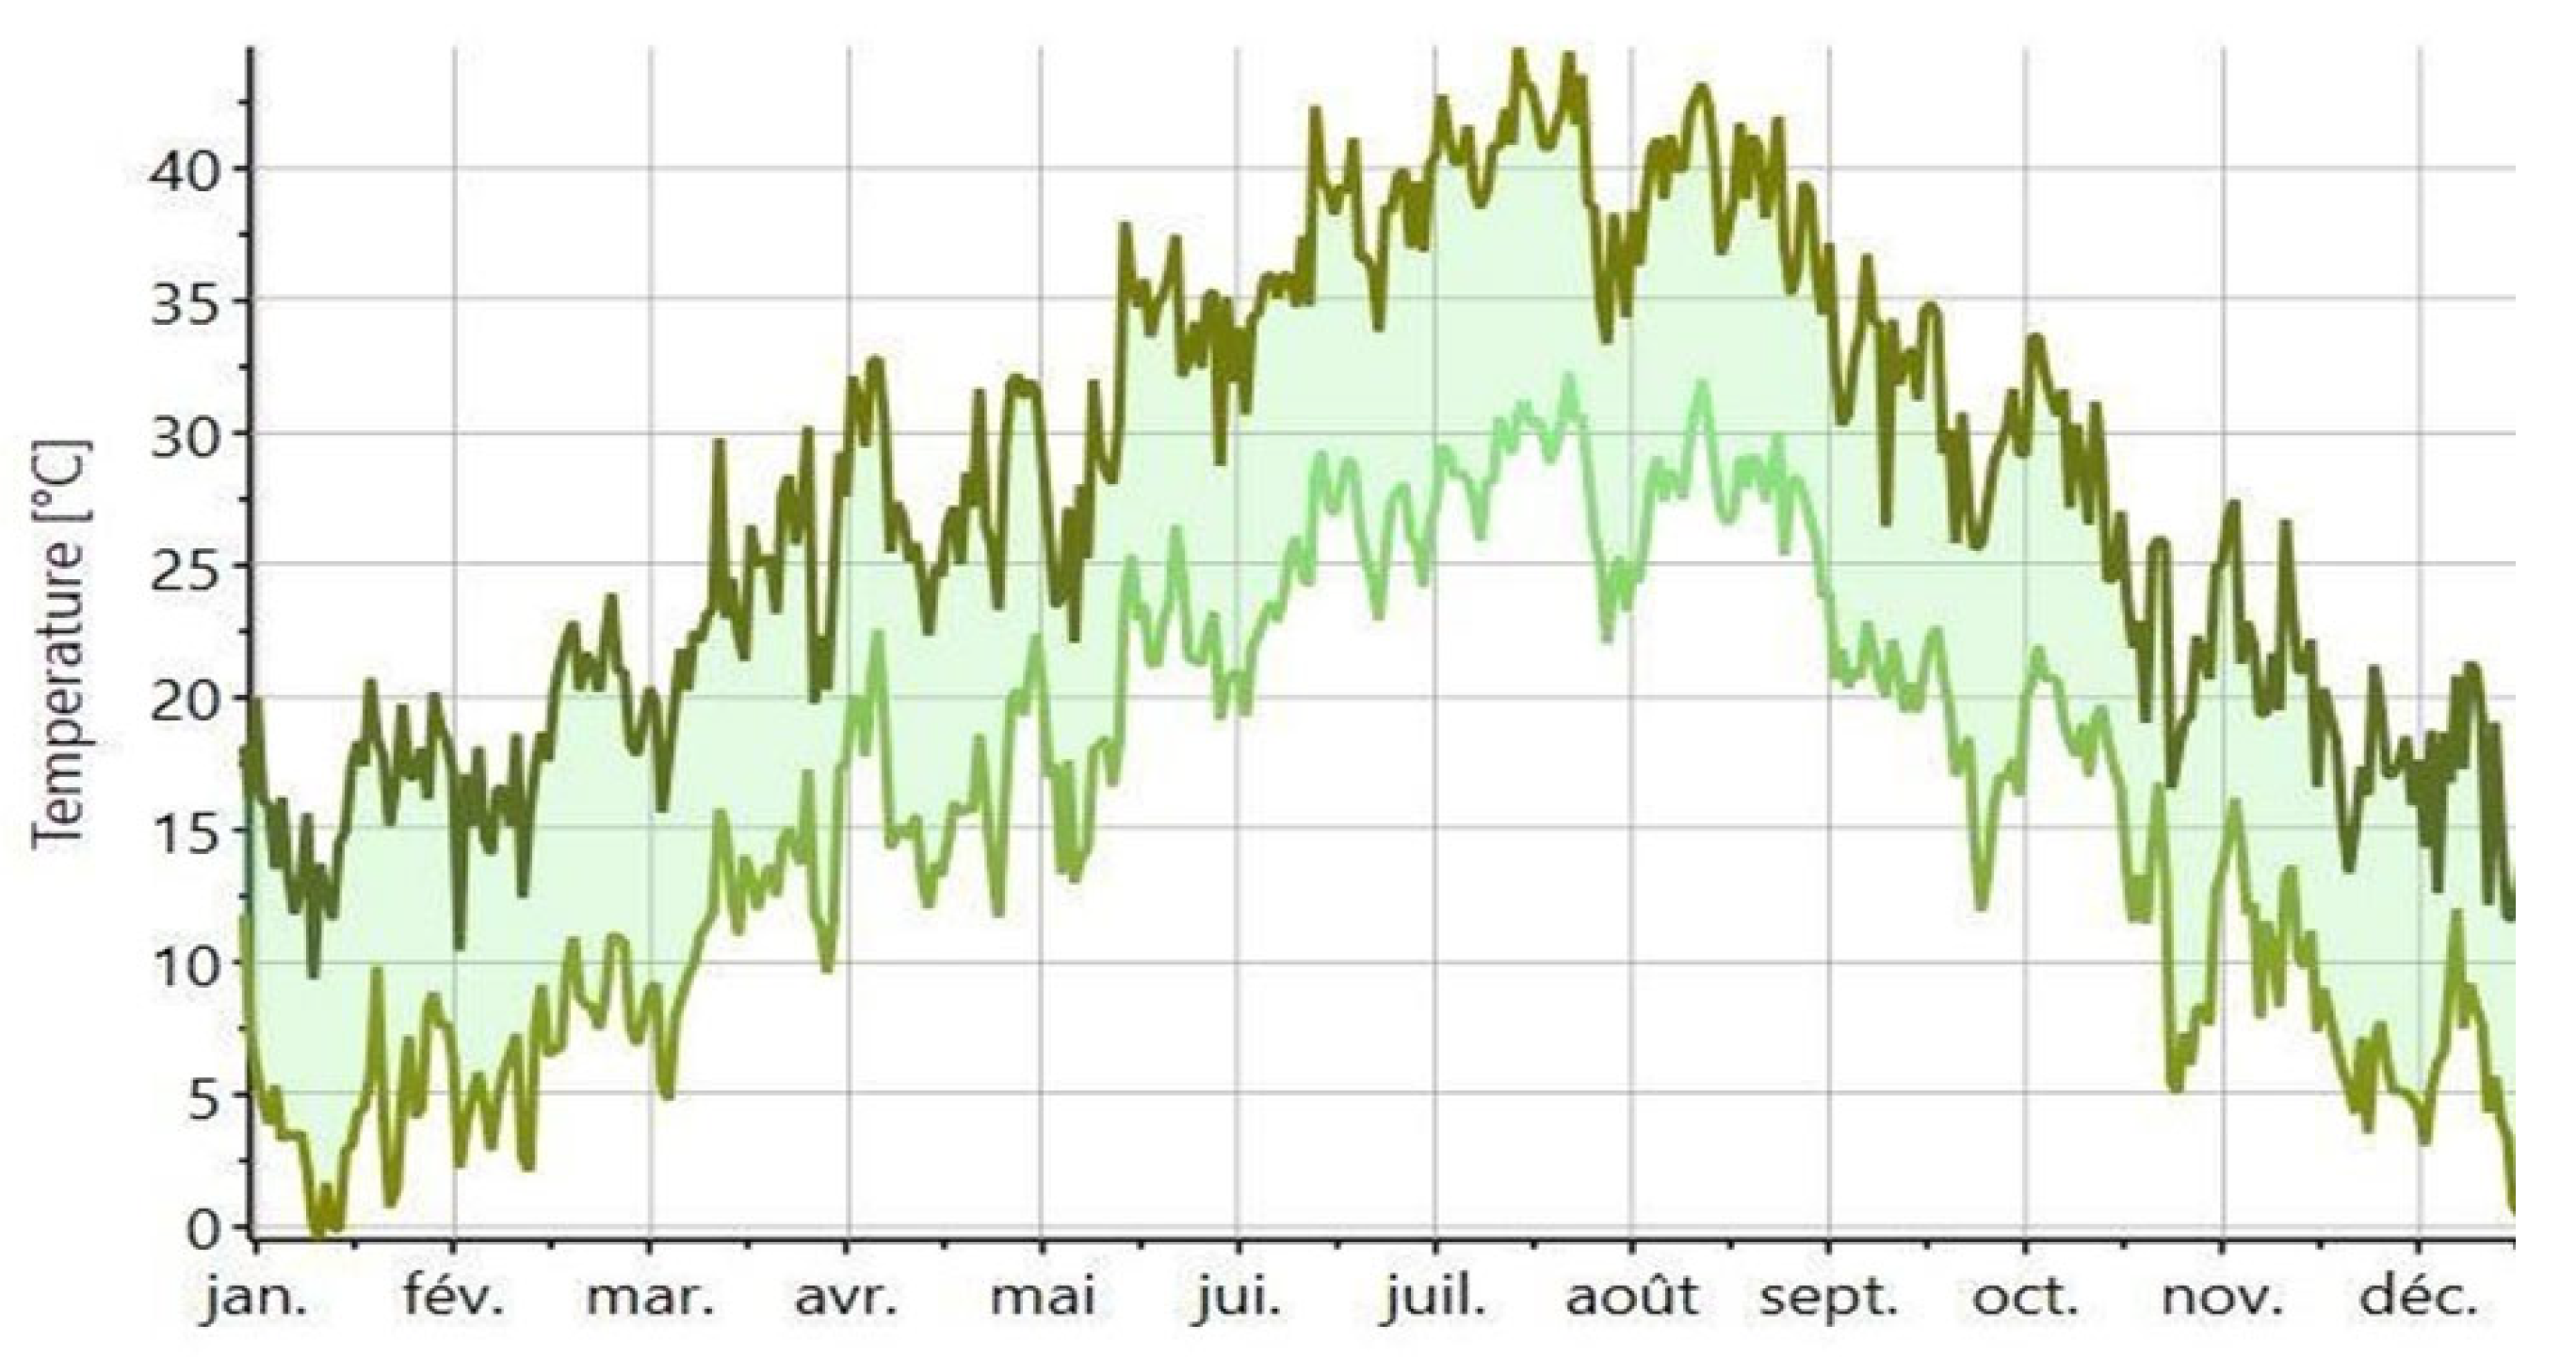
The study area is characterised by very low temperatures in summer and very high temperatures in winter, as shown in
Figure 2:
From the analysis of this figure, we can see that cooling is essential when the temperature rises above 25°C, from mid-March to early November, which means 8 months of cooling on average. Moreover, in June, July and August, we have to cool the panels all day long, from sunrise to sunset.
2.3.2. Relative Humidity
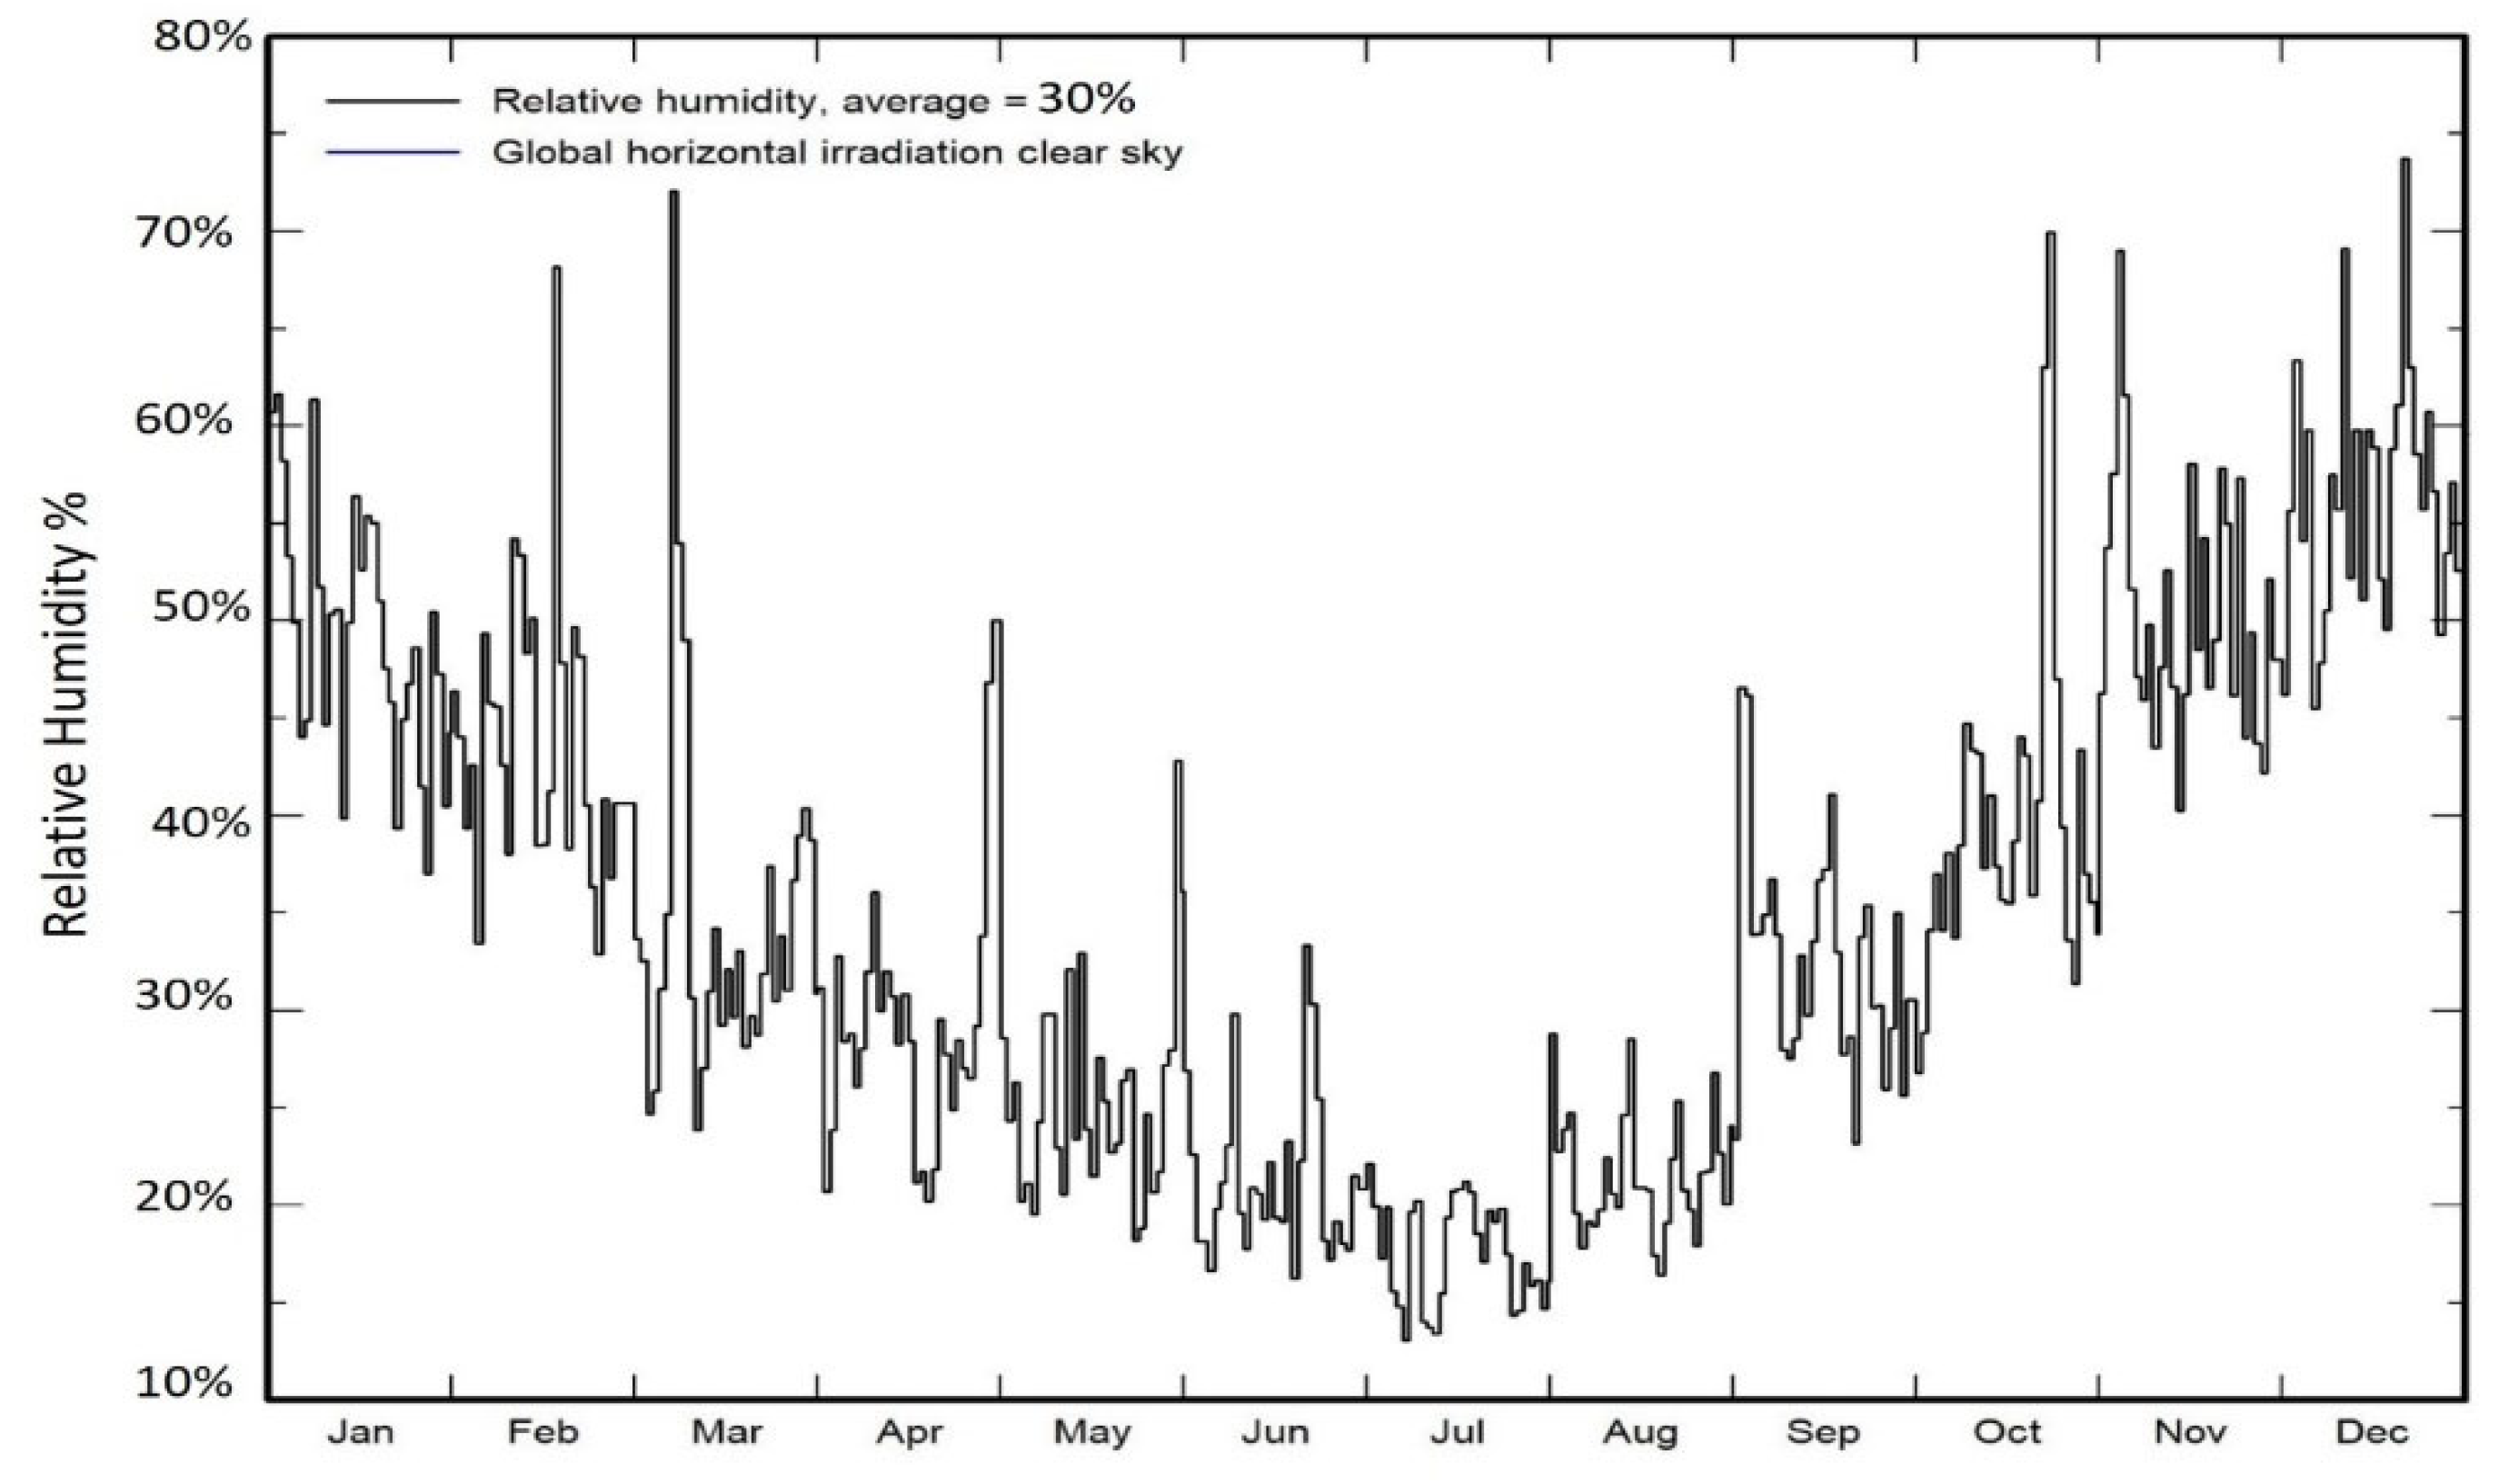
Relative humidity is an important indicator of whether a climate is dry or humid. It expresses the ratio between the quantity of water vapour present in the air and the maximum quantity that the air can contain at a given temperature. The
Figure 3 shows the variation in relative humidity throughout the year 2021 in the study area.
We can see that relative humidity varies between its minimum value in July: 5% and its maximum value in December: 57%. The mean value is 30% Dry climate.
2.3.3. The Wind
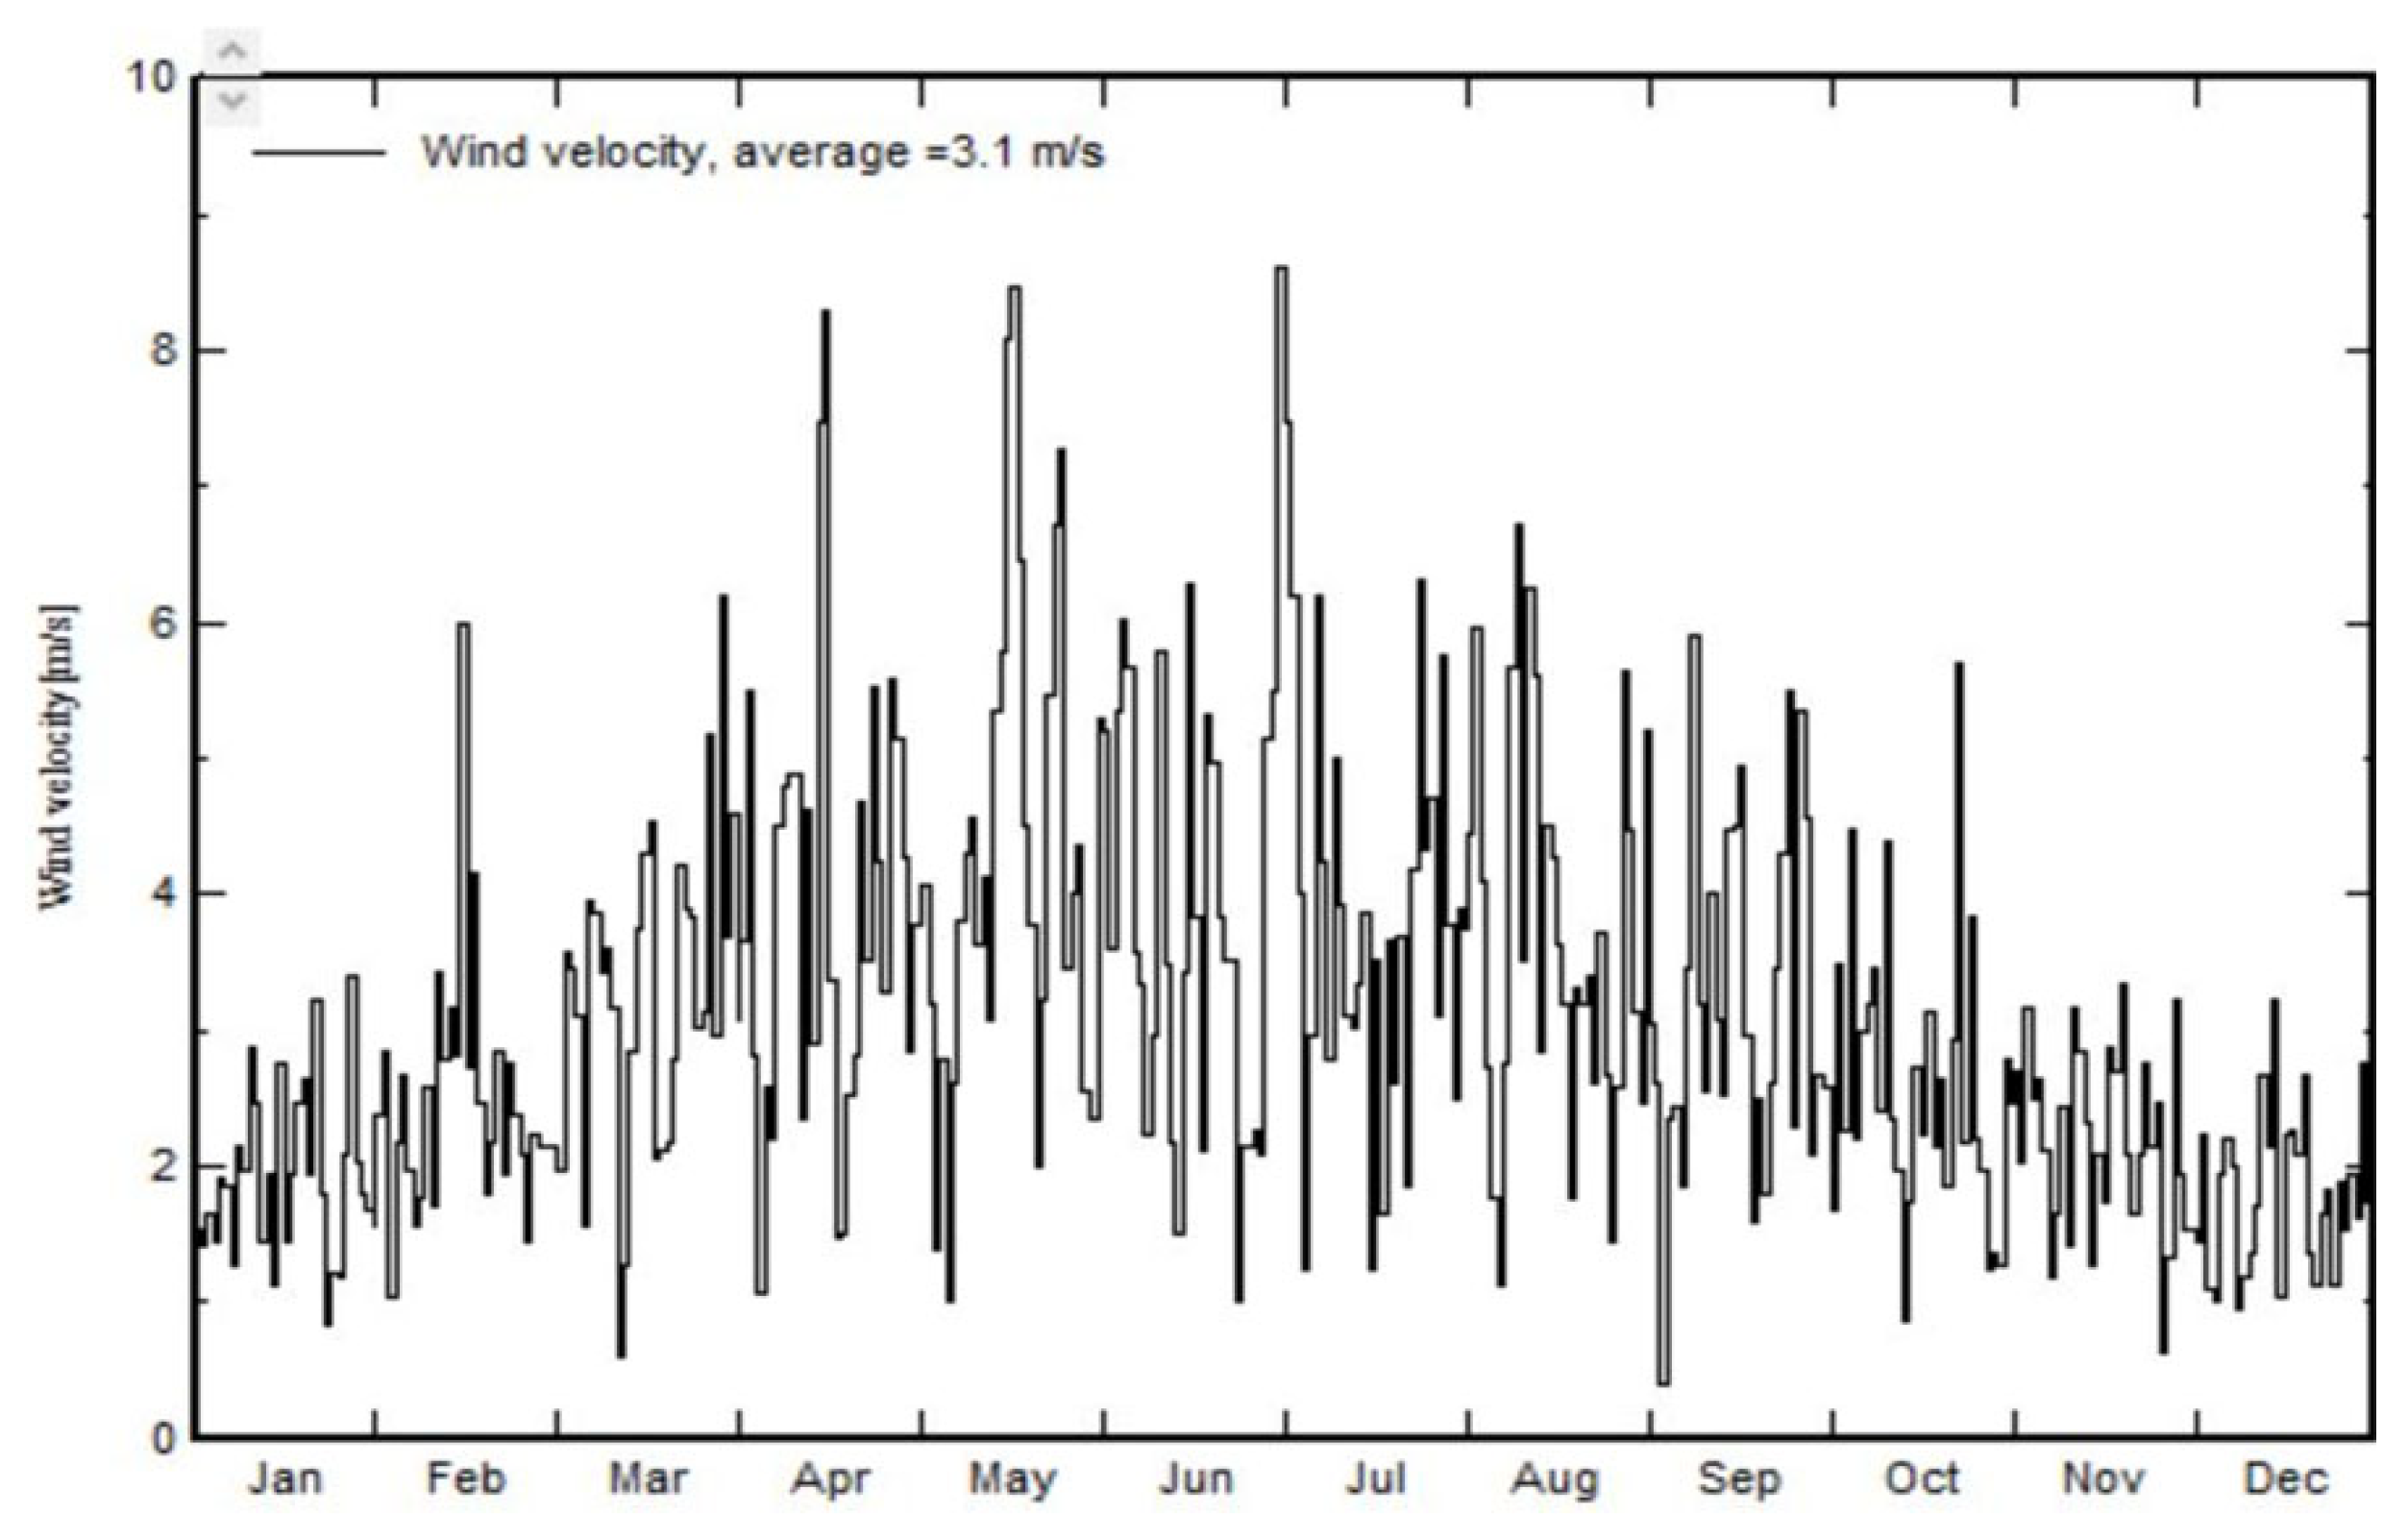
The wind is another parameter that affects the efficiency of solar panels. The average wind speed is 3.1 m/s, which varies between its minimum value of 1.9 m/s in January and December, and its maximum value of 4.4 m/s in May;
Figure 4 shows the wind speed in this area.
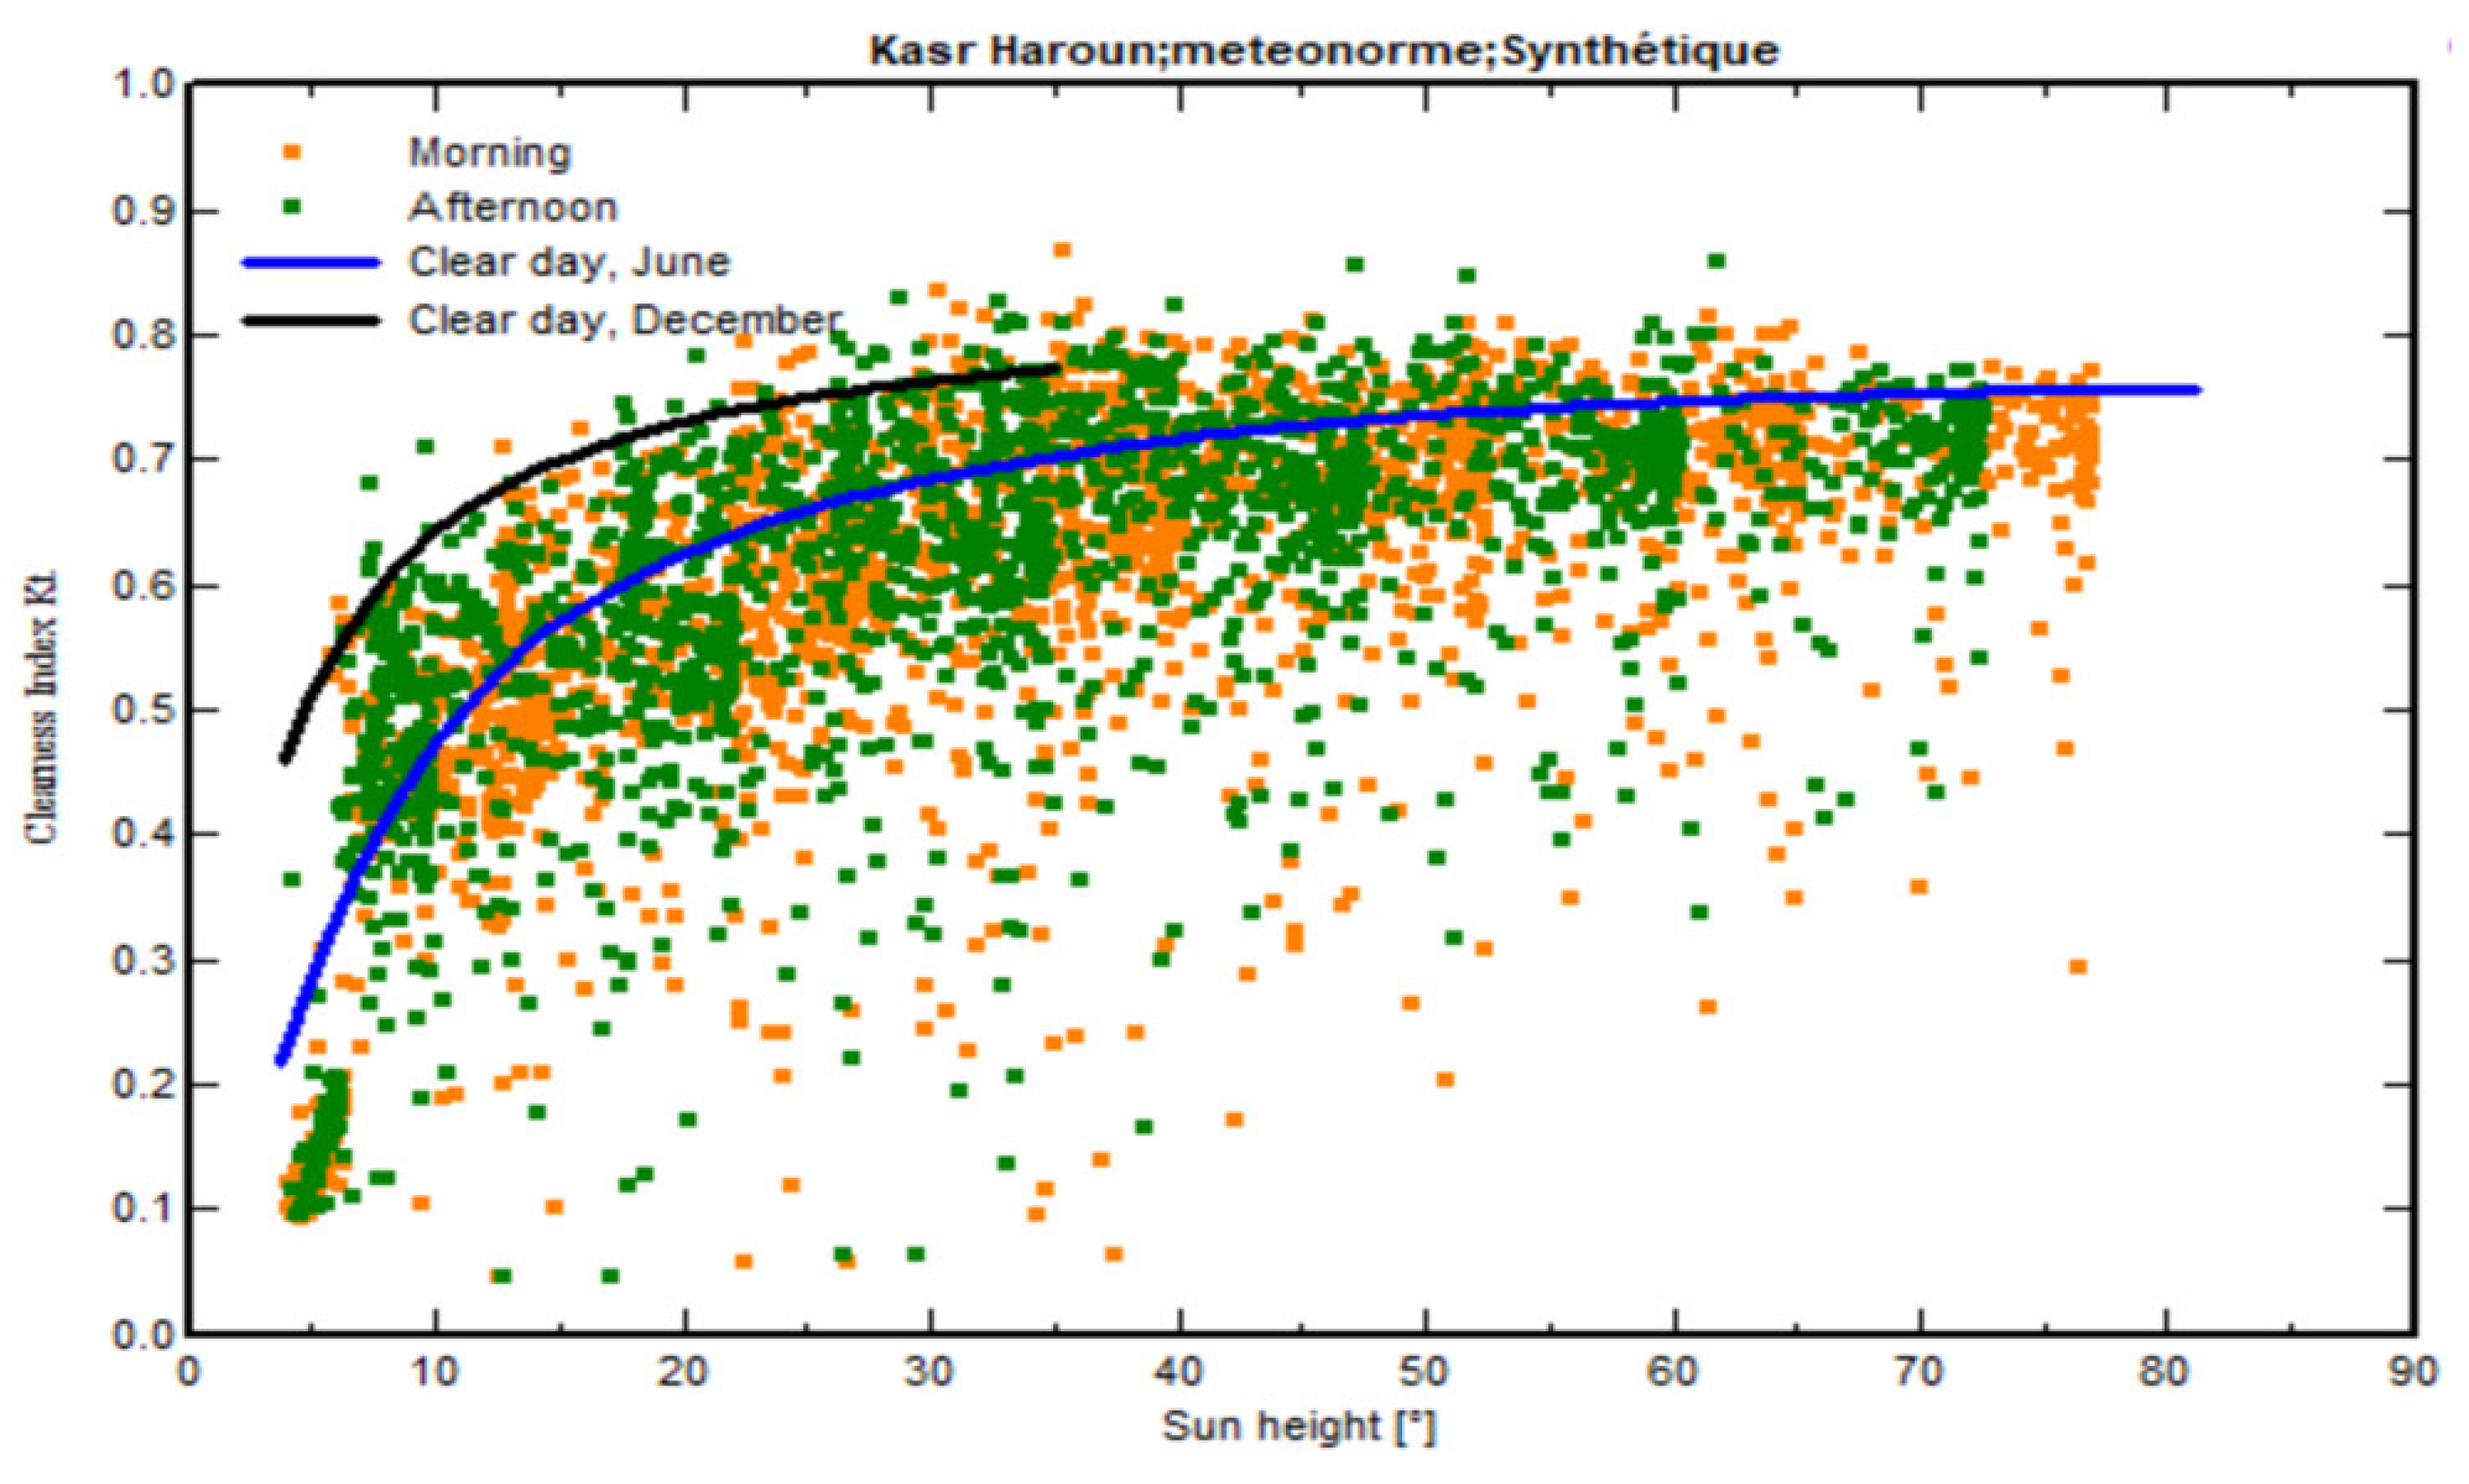
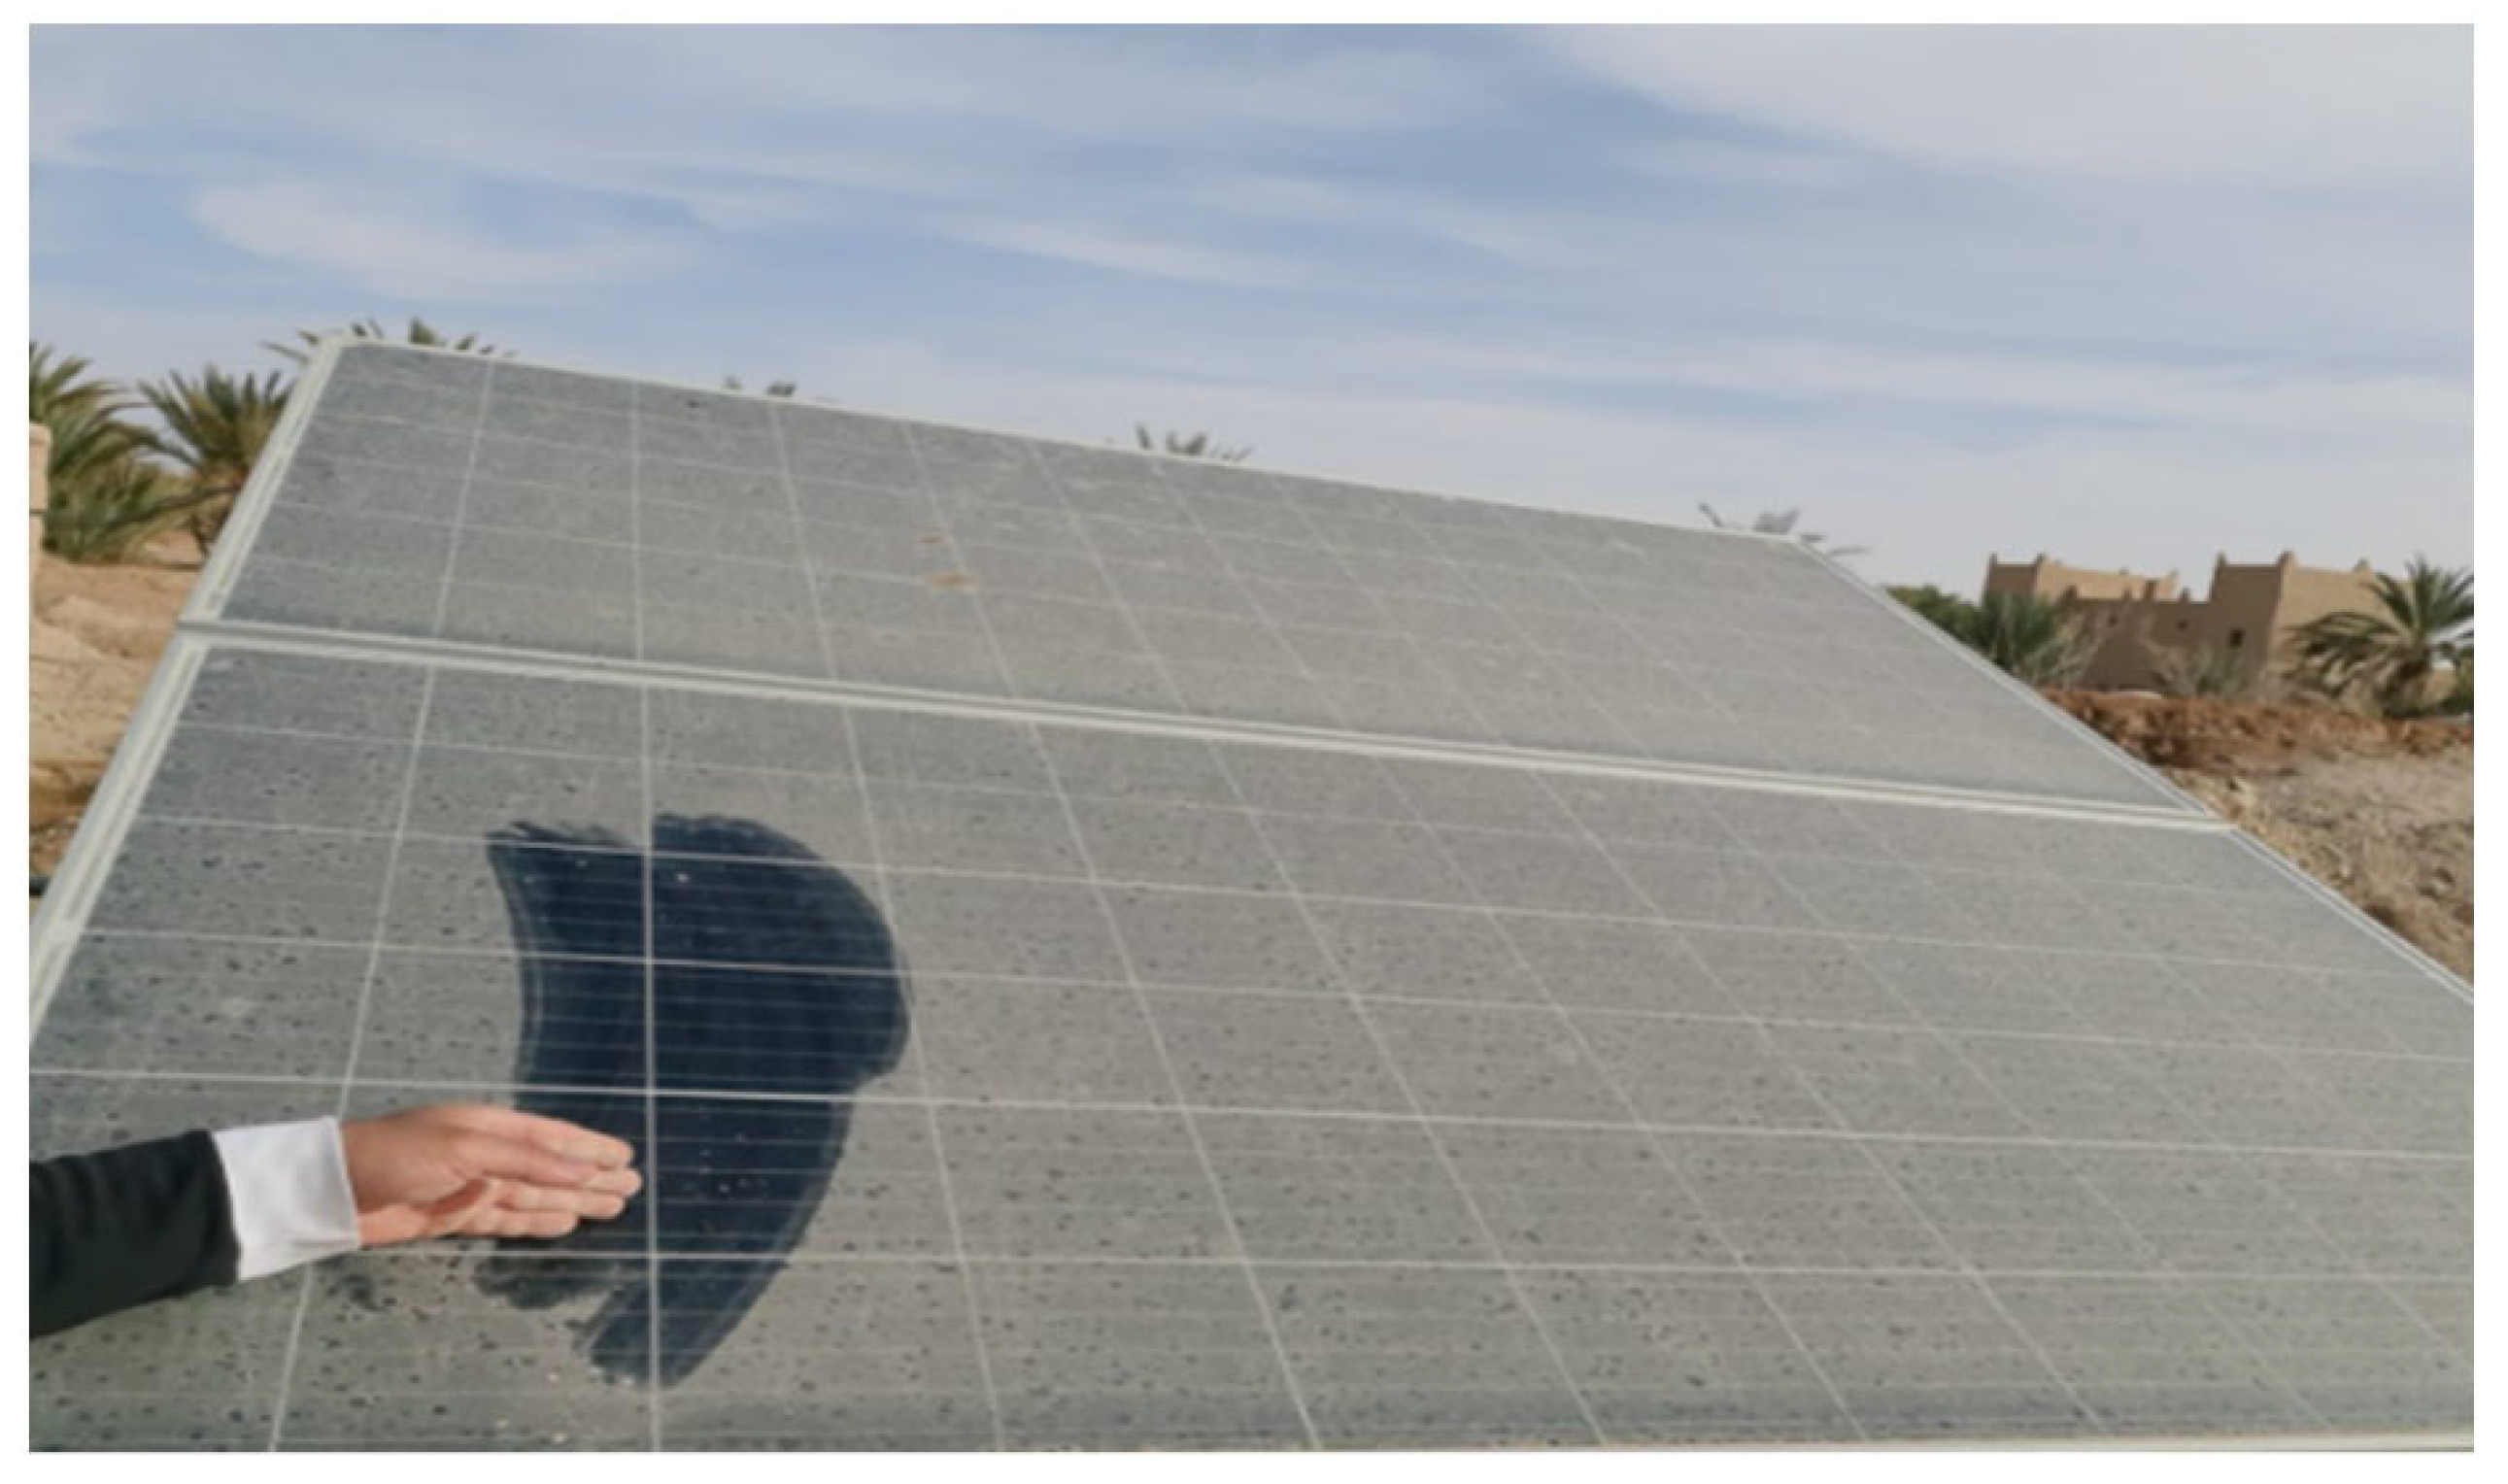
The wind at this site contains dust, which can affect the efficiency of the solar panels, as shown in
Figure 5.
2.3.4. Solar Irradiation
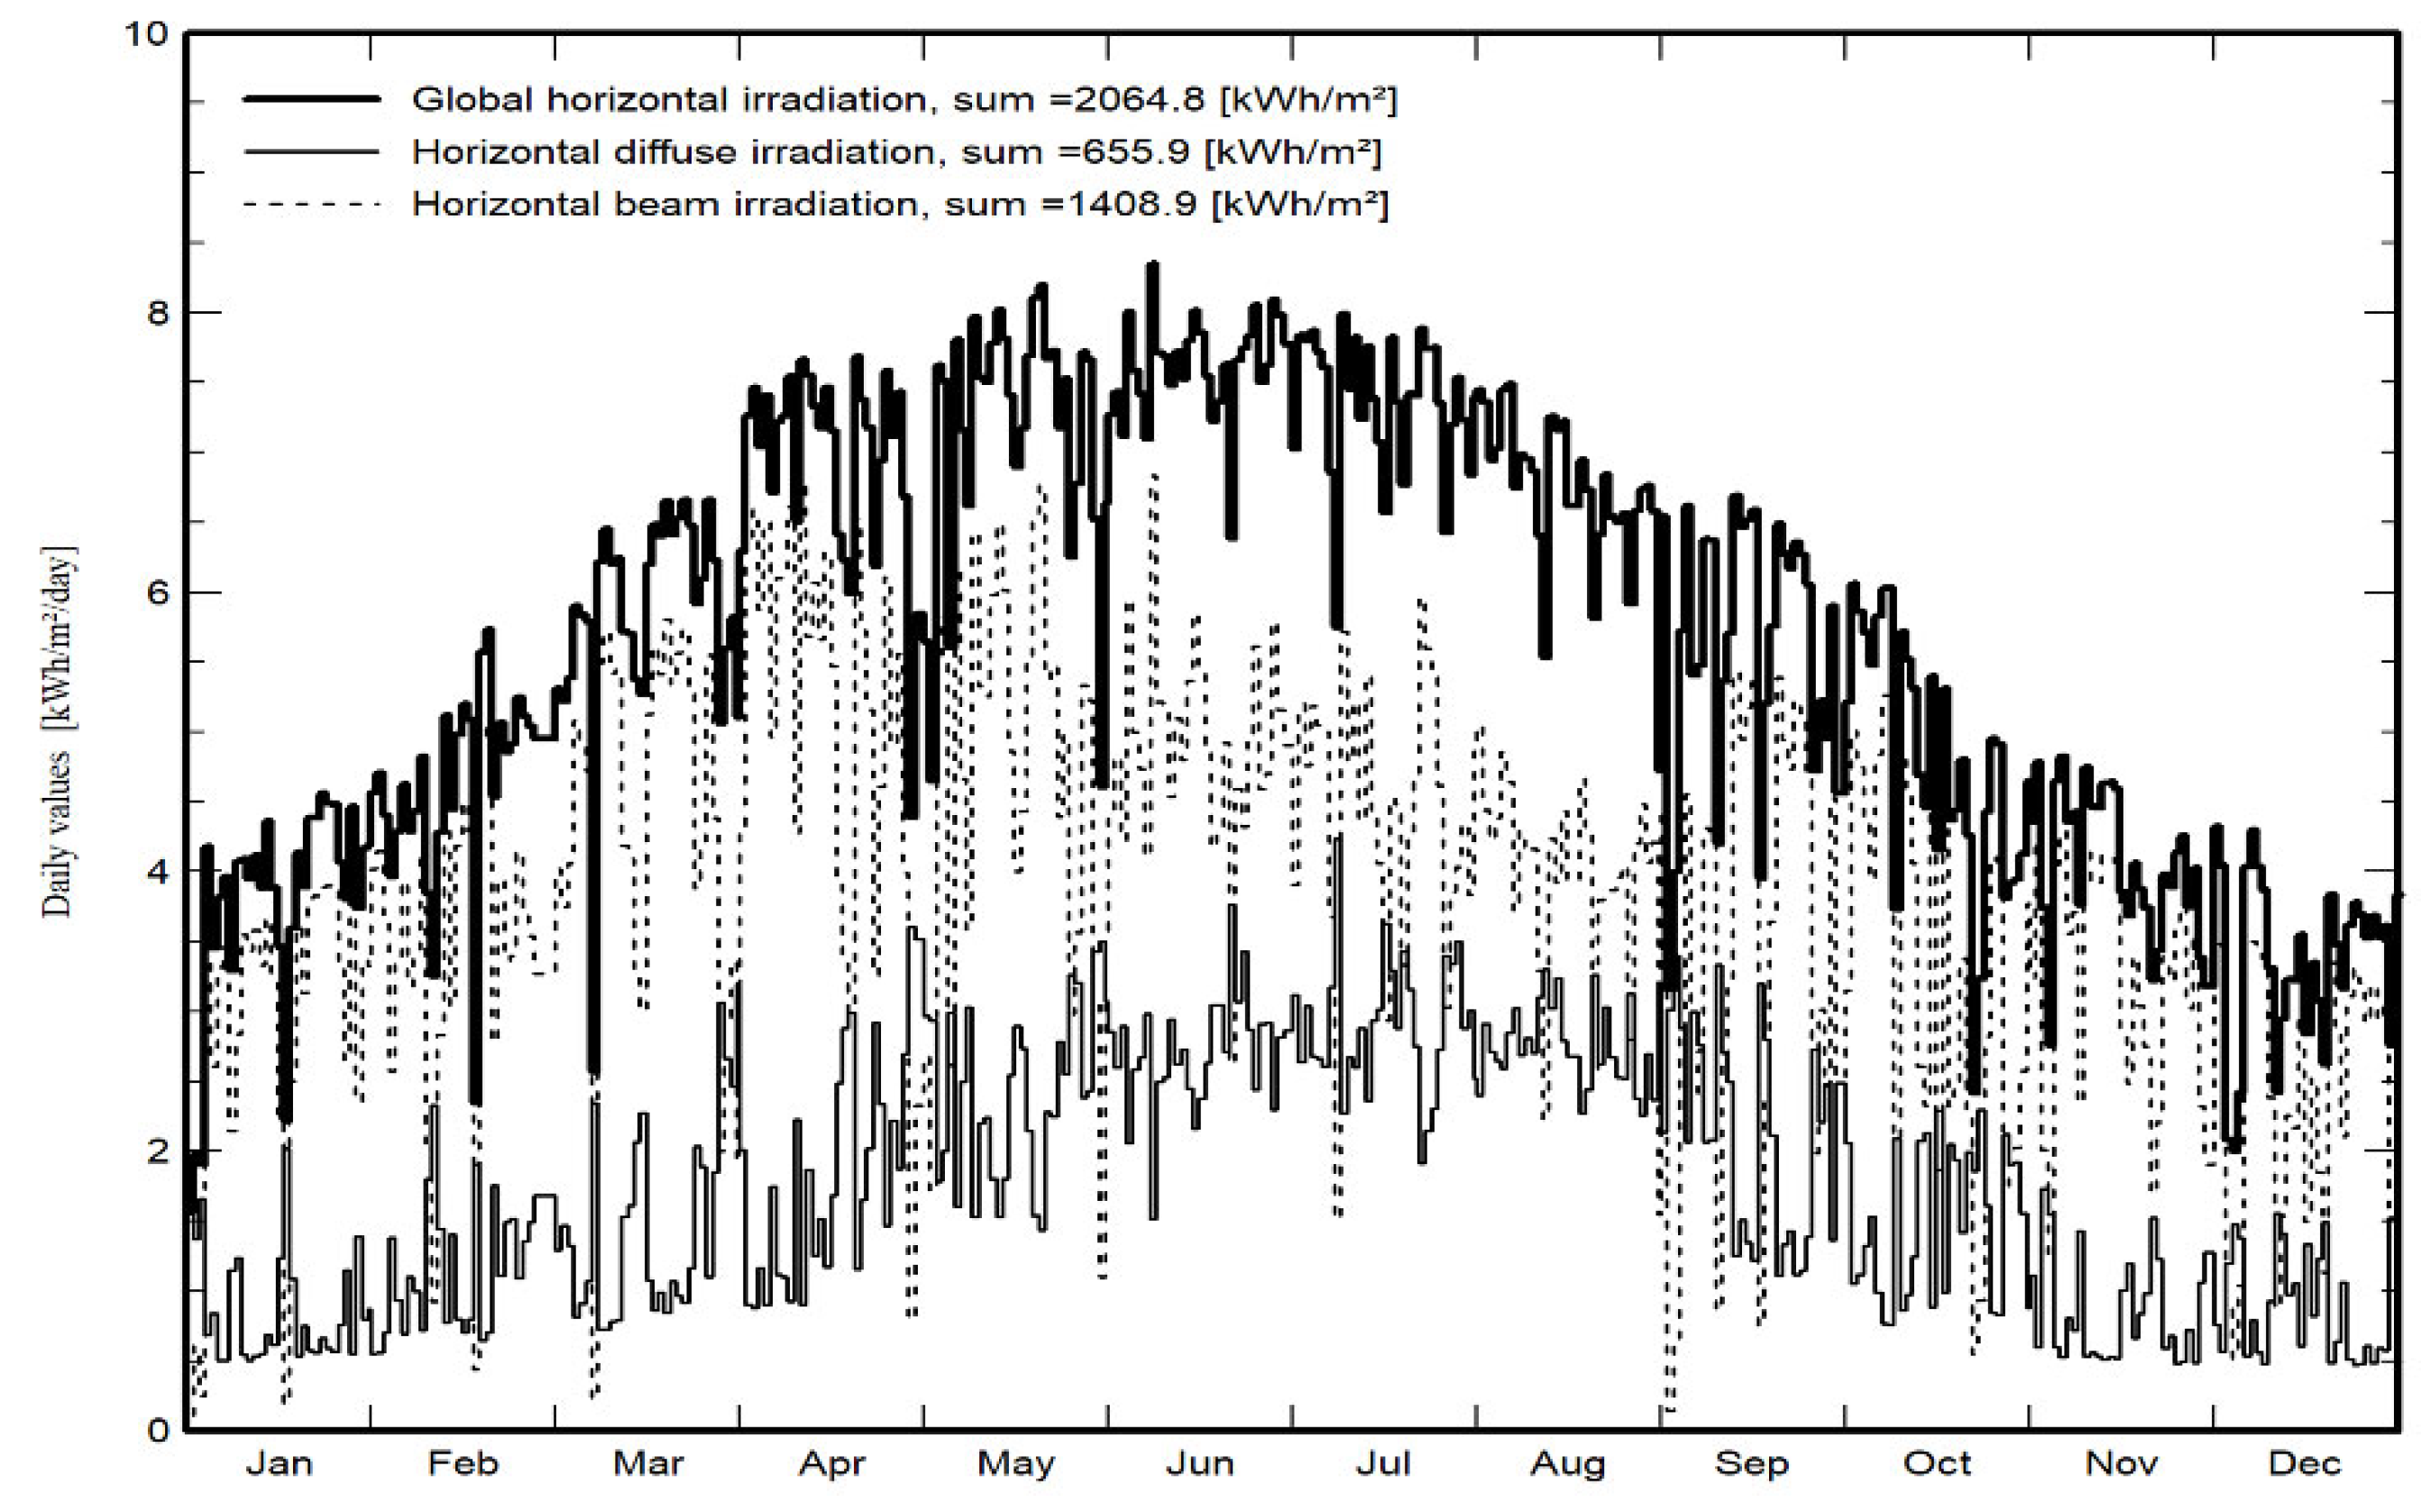
The principal source of the Earth's natural energy is solar radiation. This has a crucial influence on a multitude of phenomena, both natural and unnatural, as well as on various aspects of human life and society. The climate is an obvious example, but the impact extends to many areas such as plant growth, human health, building design and energy production. The following diagram in
Figure 6 shows the variation in solar irradiance.
2.3.4.1. Impact of Dust and Scale on Solar Irradiance
The presence of dust on the glass surface has a significant impact on the transmission of solar radiation. Not only does it seriously hamper transmission, but it also leads to significant diffuse reflection of solar radiation, caused by the dust on the surface.
2.3.4.2. Effect of Scale Deposits in Dust on Transmission
The dust contains a significant quantity of calcium and magnesium oxides. When dust on the surface of photovoltaic modules comes into contact with precipitation, a small quantity of calcium and magnesium ions dissolve in the rainwater and settle back onto the glass surface of the photovoltaic modules. If this accumulation is not cleaned in time, a hard layer of calcium and magnesium gradually forms on the surface of the photovoltaic modules. Once formed, this scale is difficult to remove, seriously affecting the energy production capacity of the modules and can even cause hot spots and other problems in the photovoltaic cells.
Figure 7 illustrates the phenomenon of dust deposition on the photovoltaic panels in the study area.
2.4. Moroccan Drinking Water Treatment Standard
Drinking water is that which meets the criteria of "NM 03.7.001: Quality of human drinking water" as approved by the joint order of the Minister of Industry, Trade and Economic Promotion, the Minister of Infrastructure and Transport and the Minister of Health No. 221-06 of 3 Muharram 427 (2 February 2006) or any equivalent standard that replaces it. Human drinking water is composed of the following elements:
•All water intended for drinking, whatever the method of production and distribution Water used for the preparation, packaging, storage and/or conservation of foodstuffs intended for the public [
29].
A number of thermal installations require cleaning and/or cooling with water and photovoltaic panels in particular. This water must meet certain quality criteria to ensure that the photovoltaic panels function properly:
•Total dissolved solids (TDS) refer to the amount of organic and inorganic substances contained in a given liquid. These after the Standard (N.M 03.7.001 ONSSA-MAROC). Are provided in
Table 1.
•Conductivity is the opposite of resistivity, and it refers to the ability of the material to allow current to flow when a potential difference is applied.
2.5. Collects Ground Water for Cooling Purposes
Before installing the cooling and cleaning system for photovoltaic panels, which is designed to increase their yield, it is crucial to assess the quality of the water used to clean and cool the panels. For this reason, we carried out an analysis of the water used to cool the photovoltaic panels in order to assess the likelihood of the deposition of salts and residues that contribute to the wear and tear of the solar panels and limit the penetration of solar radiation.
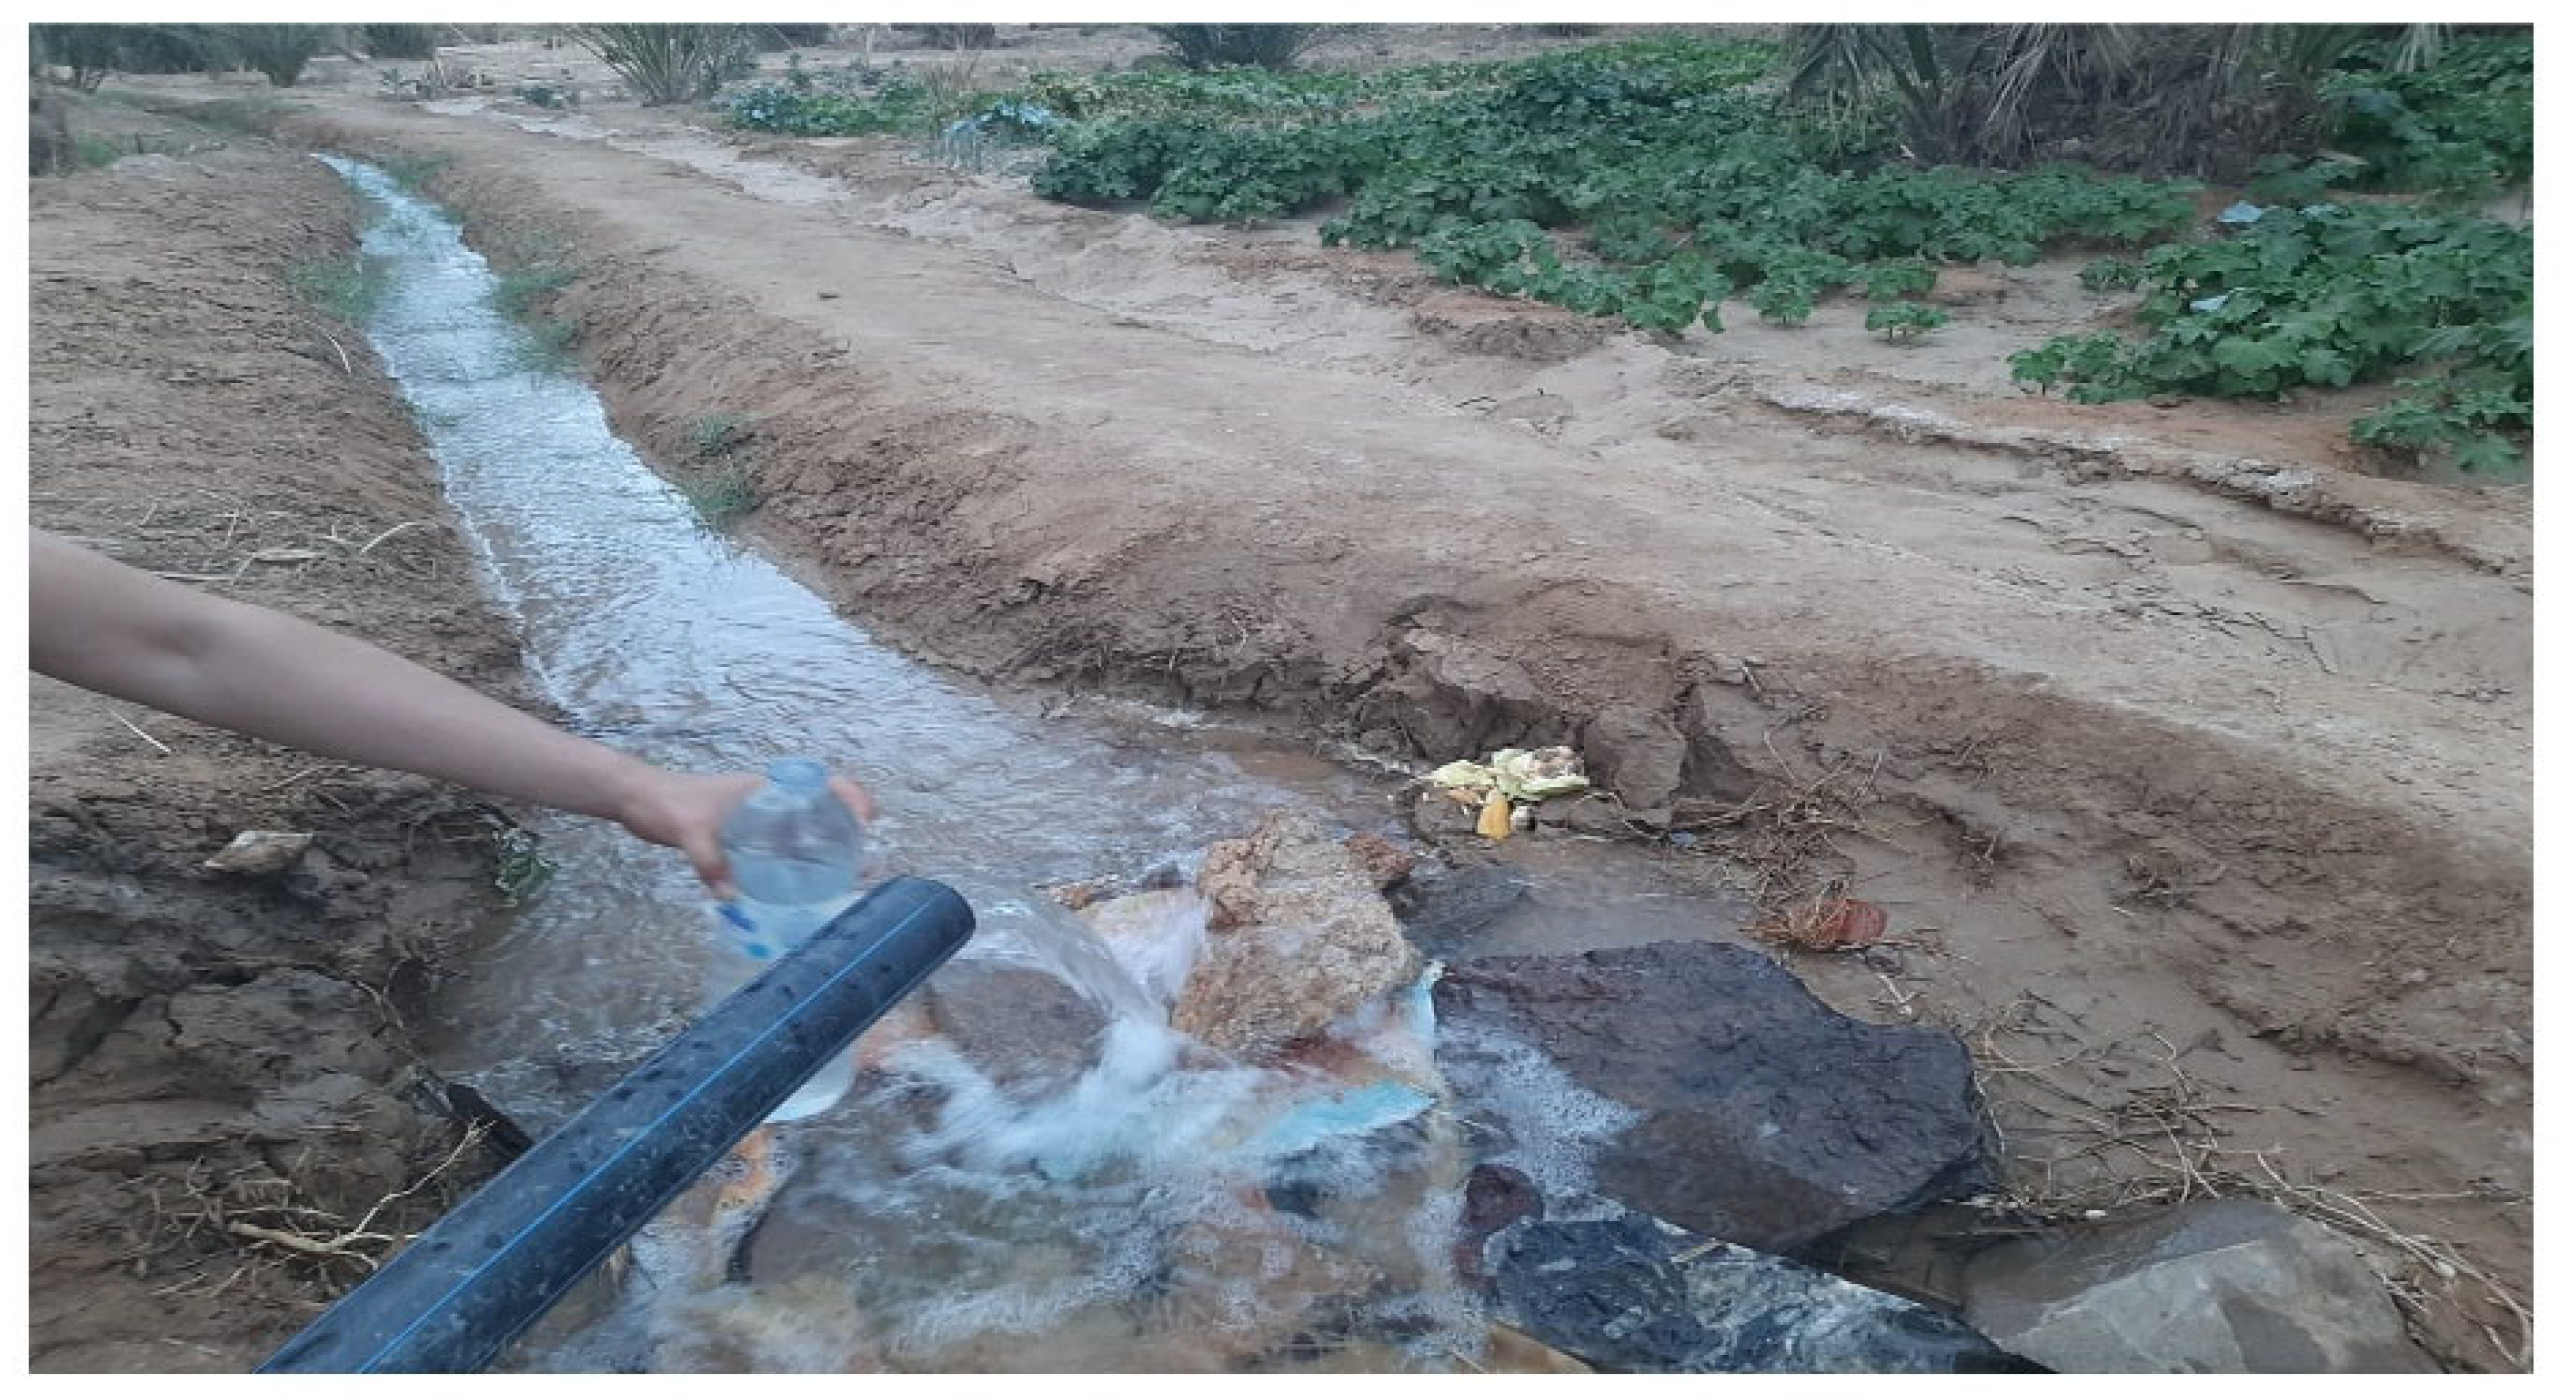
We took a sample of water from the well as shown in
Figure 8.
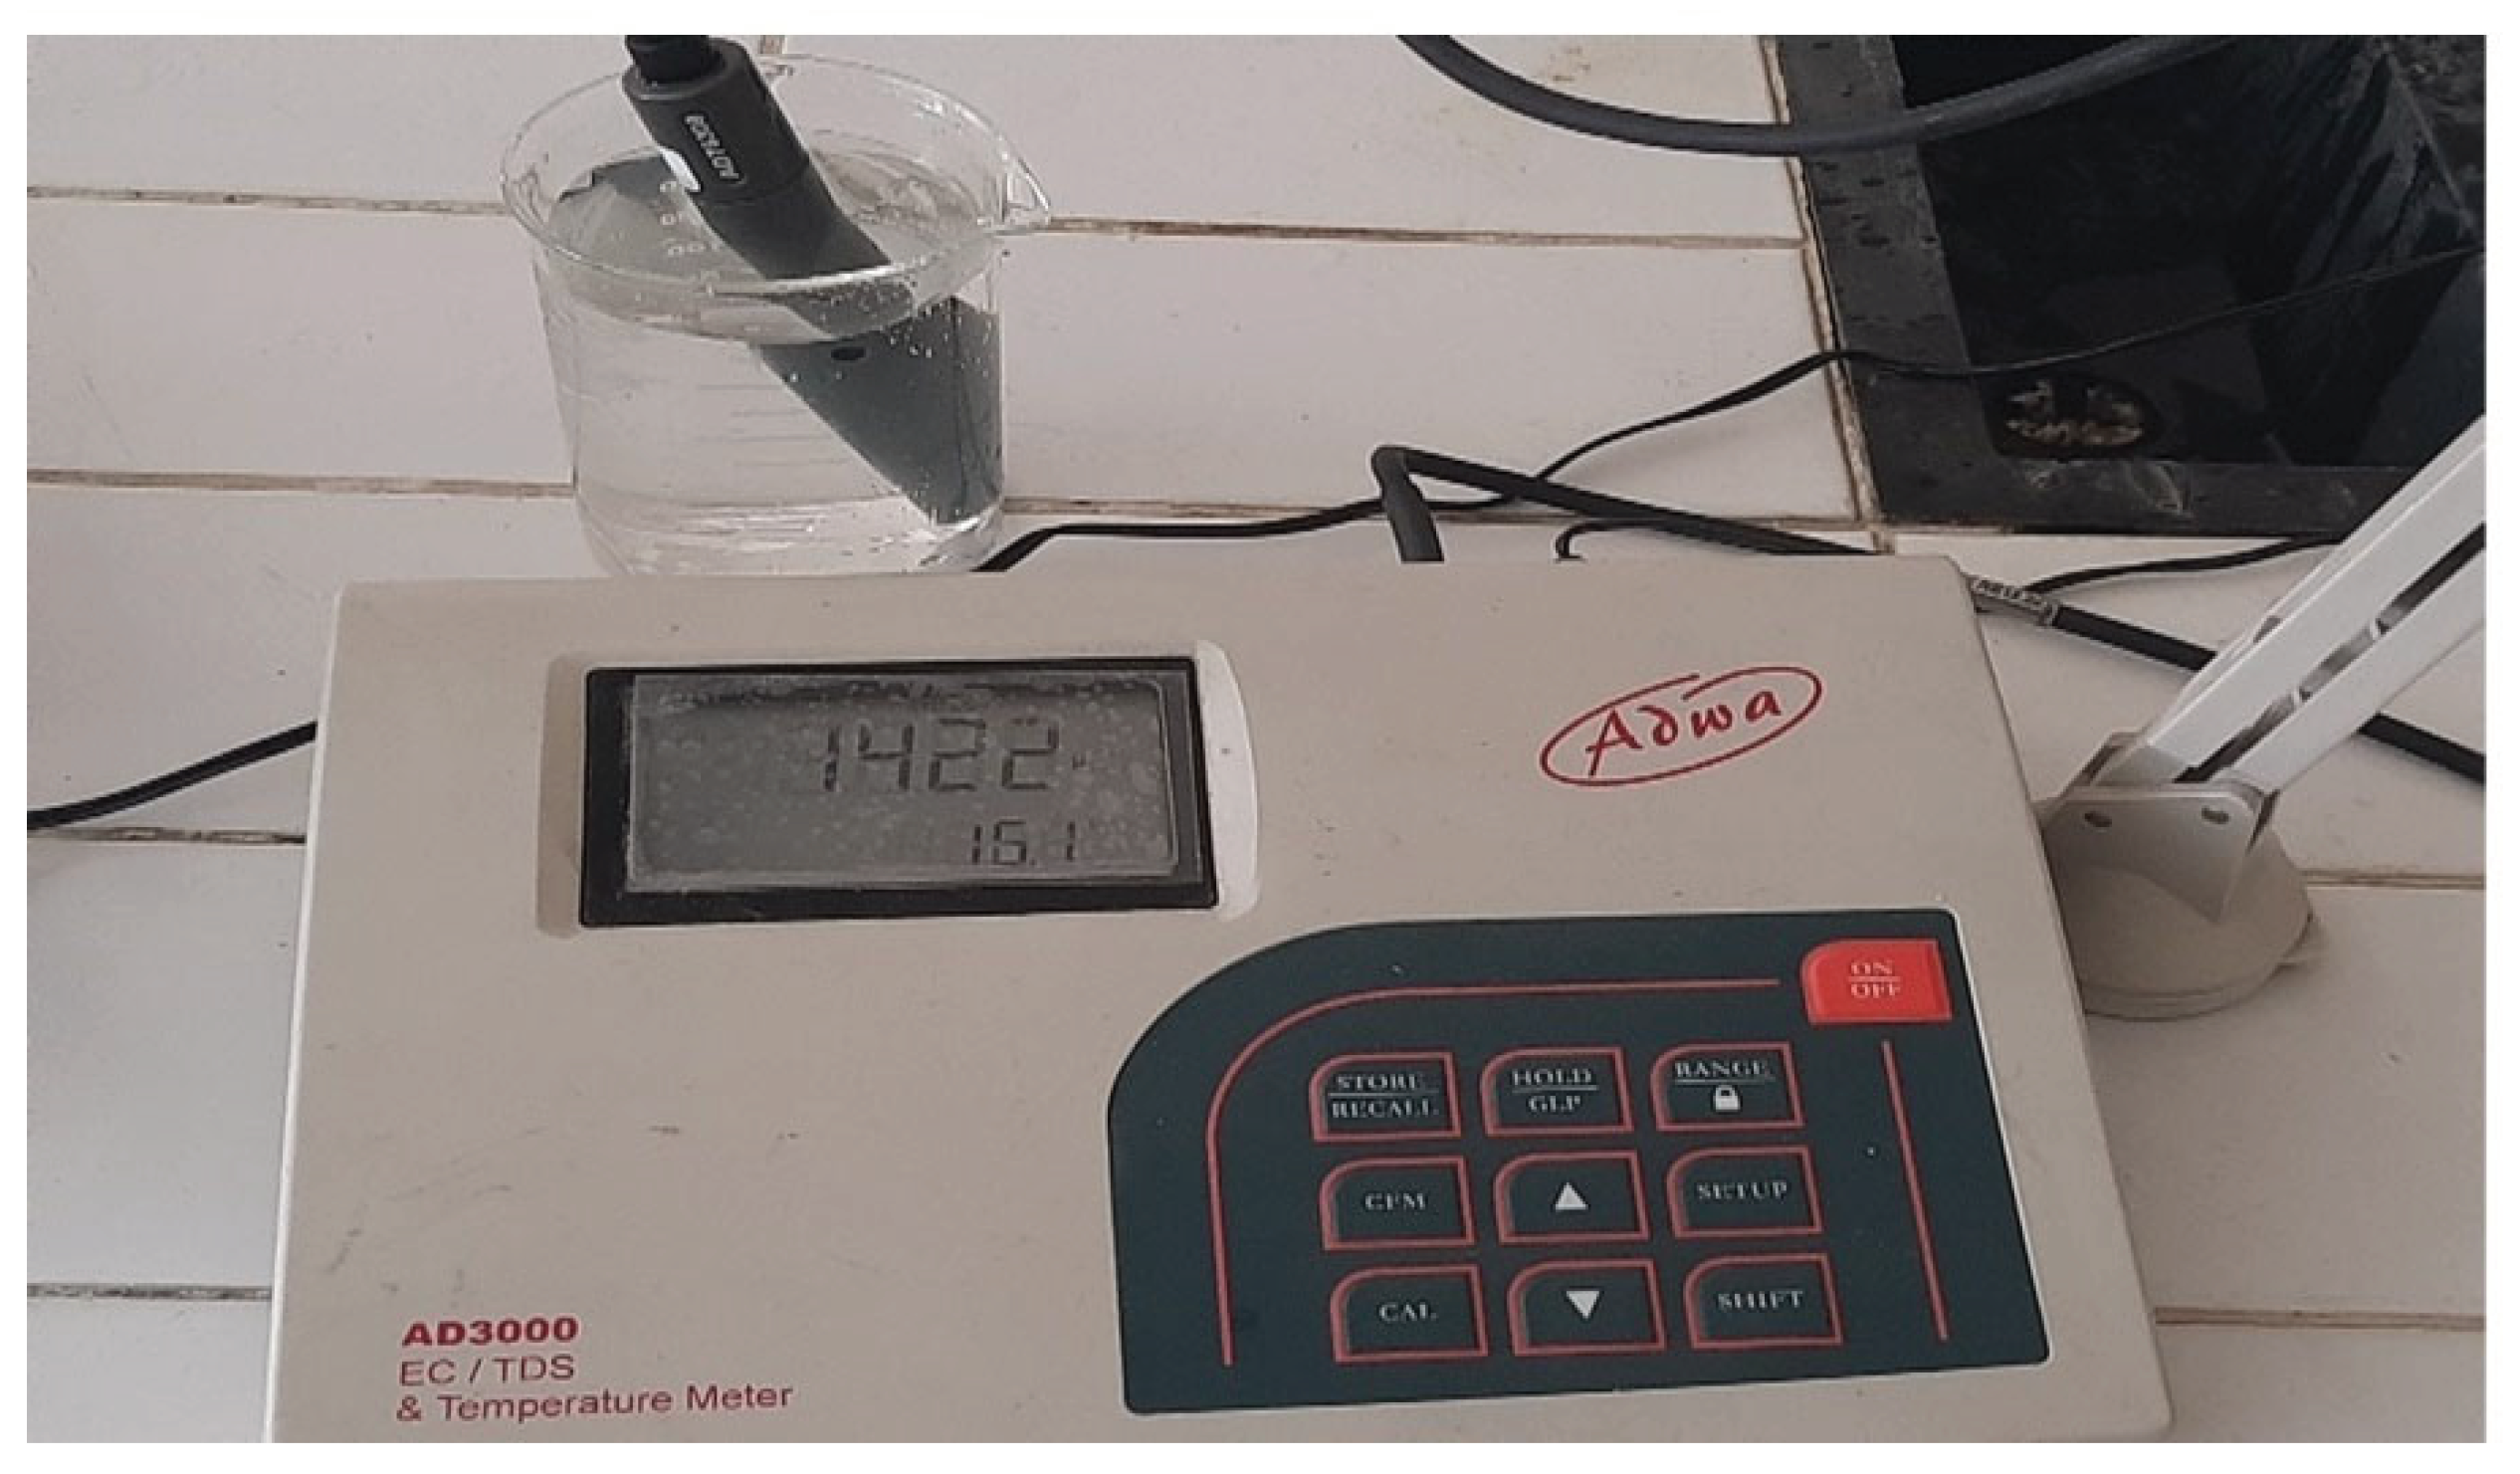
The sample taken is stored in accordance with current standards (at a temperature of 4°C), then transported to the laboratory. Conductivity, pH and TDS measurements are carried out using an ADWA AD 3000 EC/TDS & Temperature meter. And Hanna Instruments HI-2210 pH Meter.
3. Results and Discussion
3.1. Simulation Parameter
In this study, we use a specific photovoltaic module, the PV Module: EGE-400W-72M, whose parameters are summarized in
Table 2.
The performance of the PV module depends on the behavior it exhibits under variations in the atmospheric conditions such as irradiance and temperature.
3.2. Effect of Solar Irradiation on Energy Production
After simulating our model in the Matlab-Simulink Environment, we evaluate the effect of variations in solar irradiation on power quality.
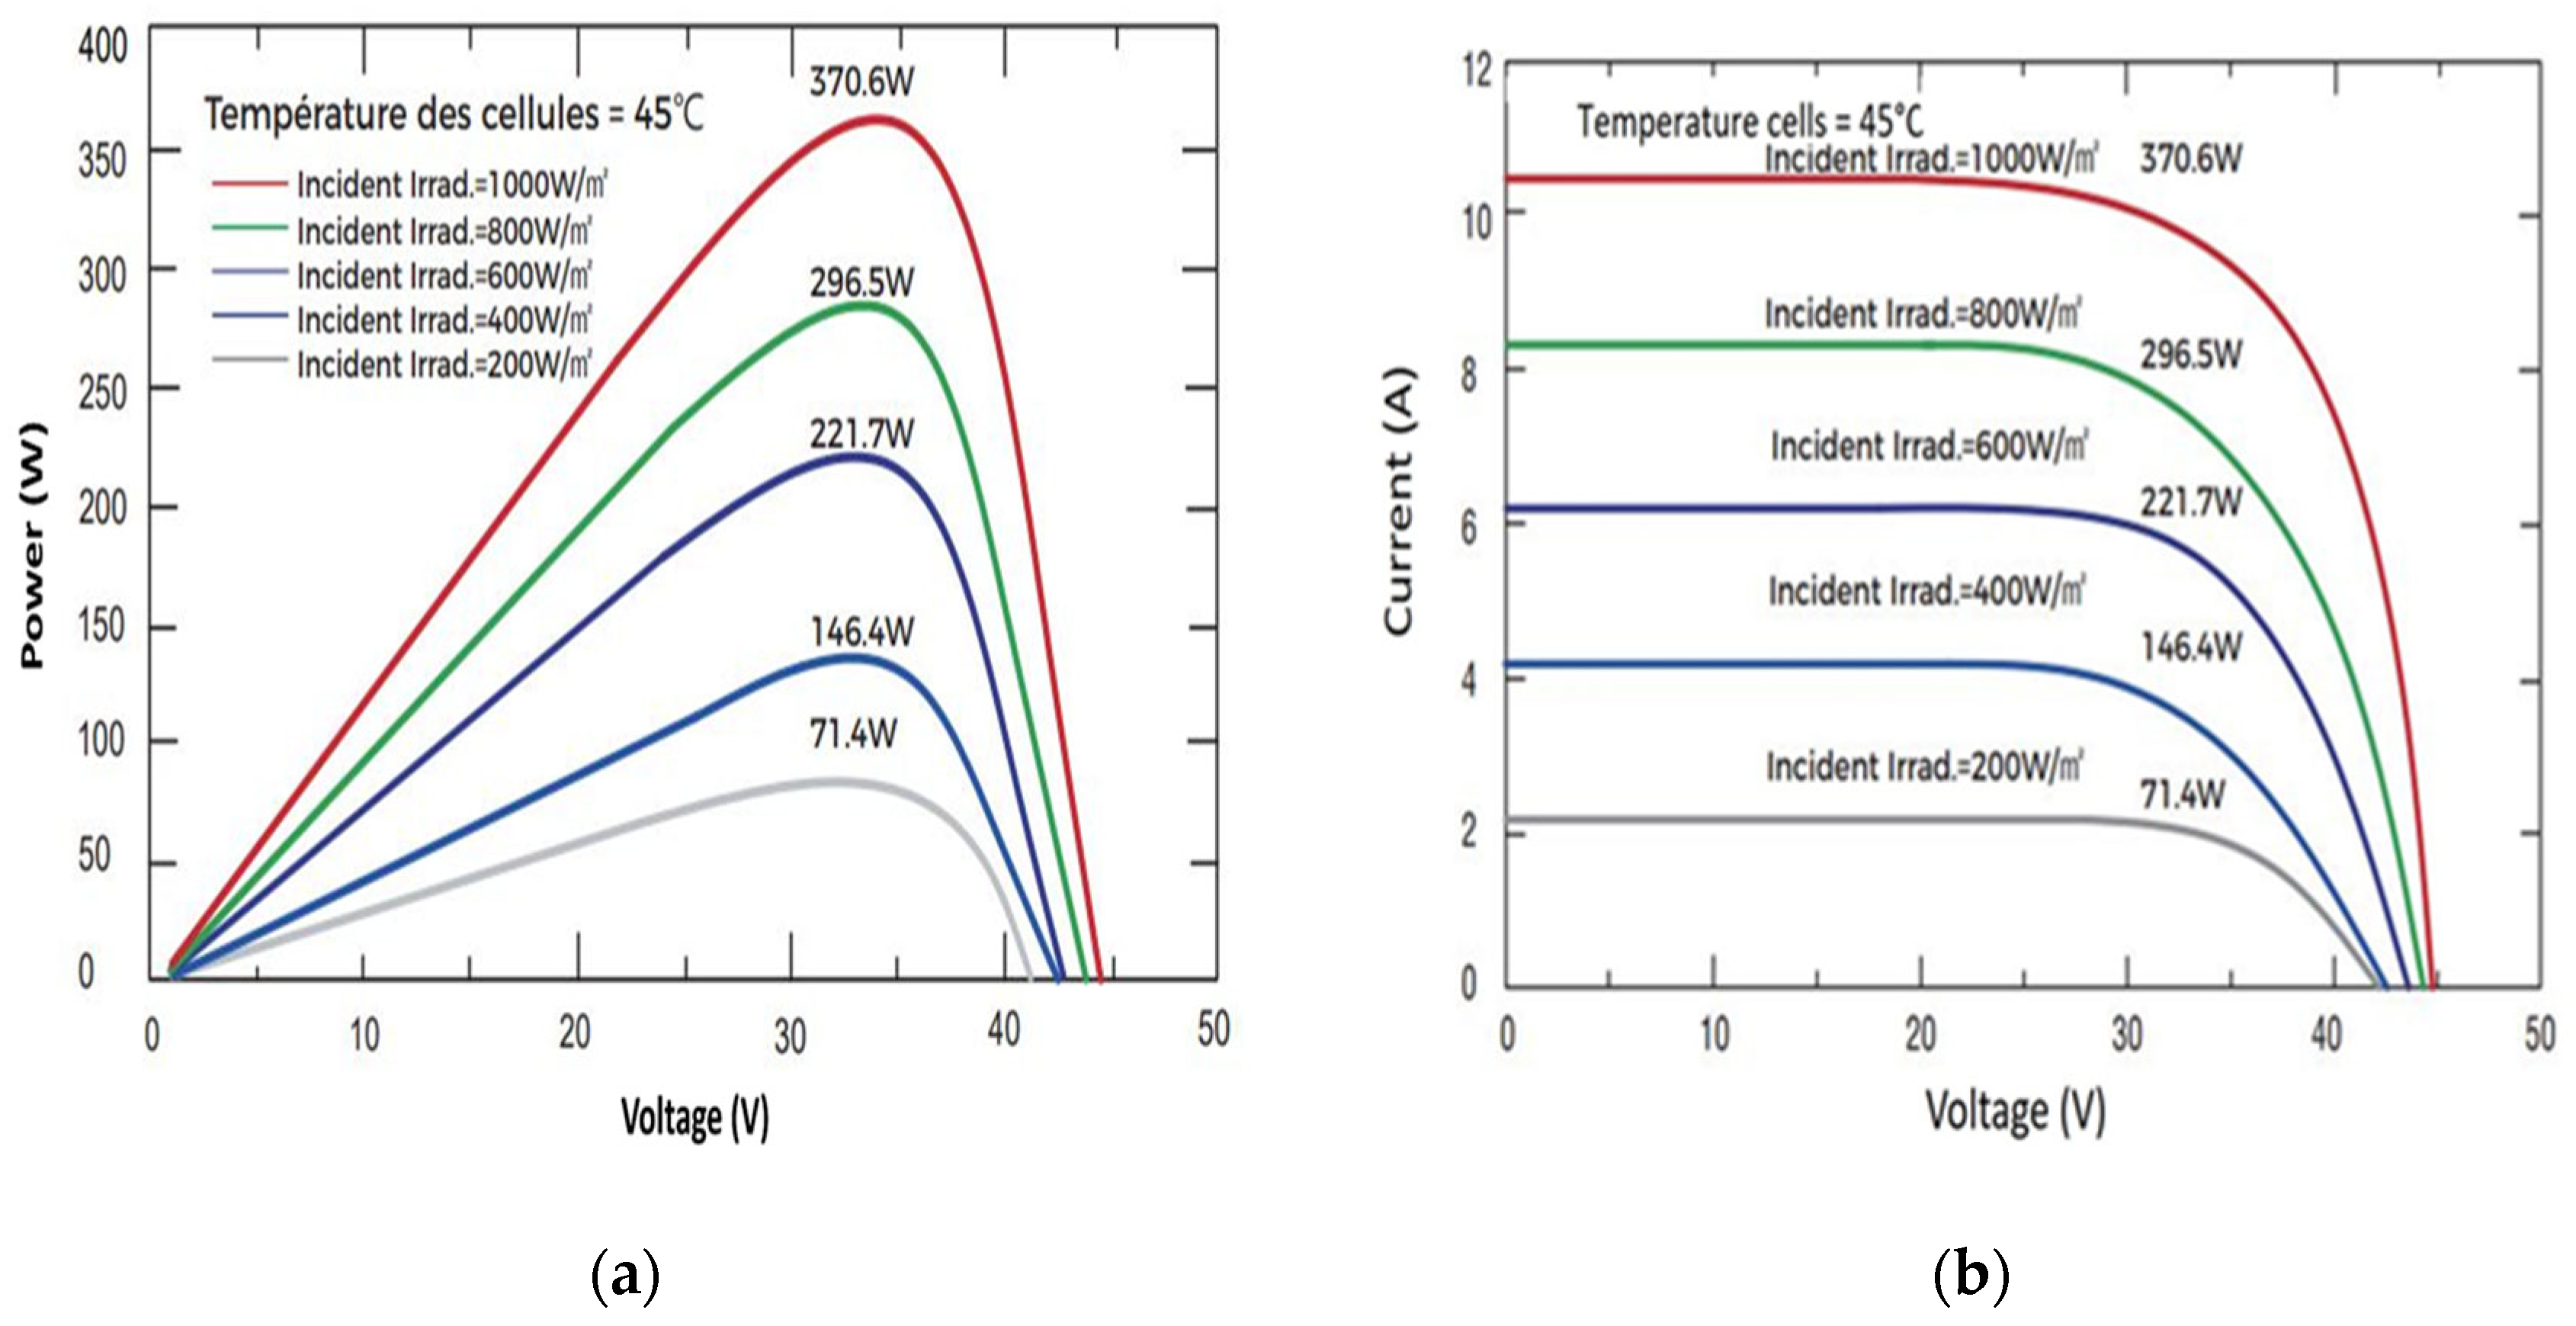
Figure 9(a) illustrates the impact of variations in incident radiation on power and voltage, while
Figure 9(b) shows the influence of these variations on current and voltage. It can be seen that the optimum current is strongly influenced by illuminance, while the optimum voltage varies very little with illuminance and decreases slightly with temperature. As a first approximation, we consider that optimal operation of the PV array corresponds roughly to operation at constant optimal voltage. It should be noted that maximum power is very sensitive to irradiance, although maximum power decreases slightly with temperature, especially at high irradiance.
3.3. The Effect of Dust and Limestone on the Temperature of Photovoltaic Modules
The dust and scale present on the surface of the tempered glass absorbs a portion of the solar irradiation, transforming it into thermal energy, thus raising the operating temperatures of the photovoltaic modules. At the same time, the dust and scale also act as an isolating cover on the module surface, affecting the thermal dissipation of the module and exacerbating the effect of thermal temperature. Since photovoltaic modules are the key components of the photovoltaic power generation system, their photoelectric conversion efficiency is inversely proportional to temperature. As a result, photovoltaic efficiency decreases with increasing temperature. Since dust and scale, by absorbing thermal energy, can increase the internal temperature of the solar panel, photovoltaic efficiency can decrease accordingly.
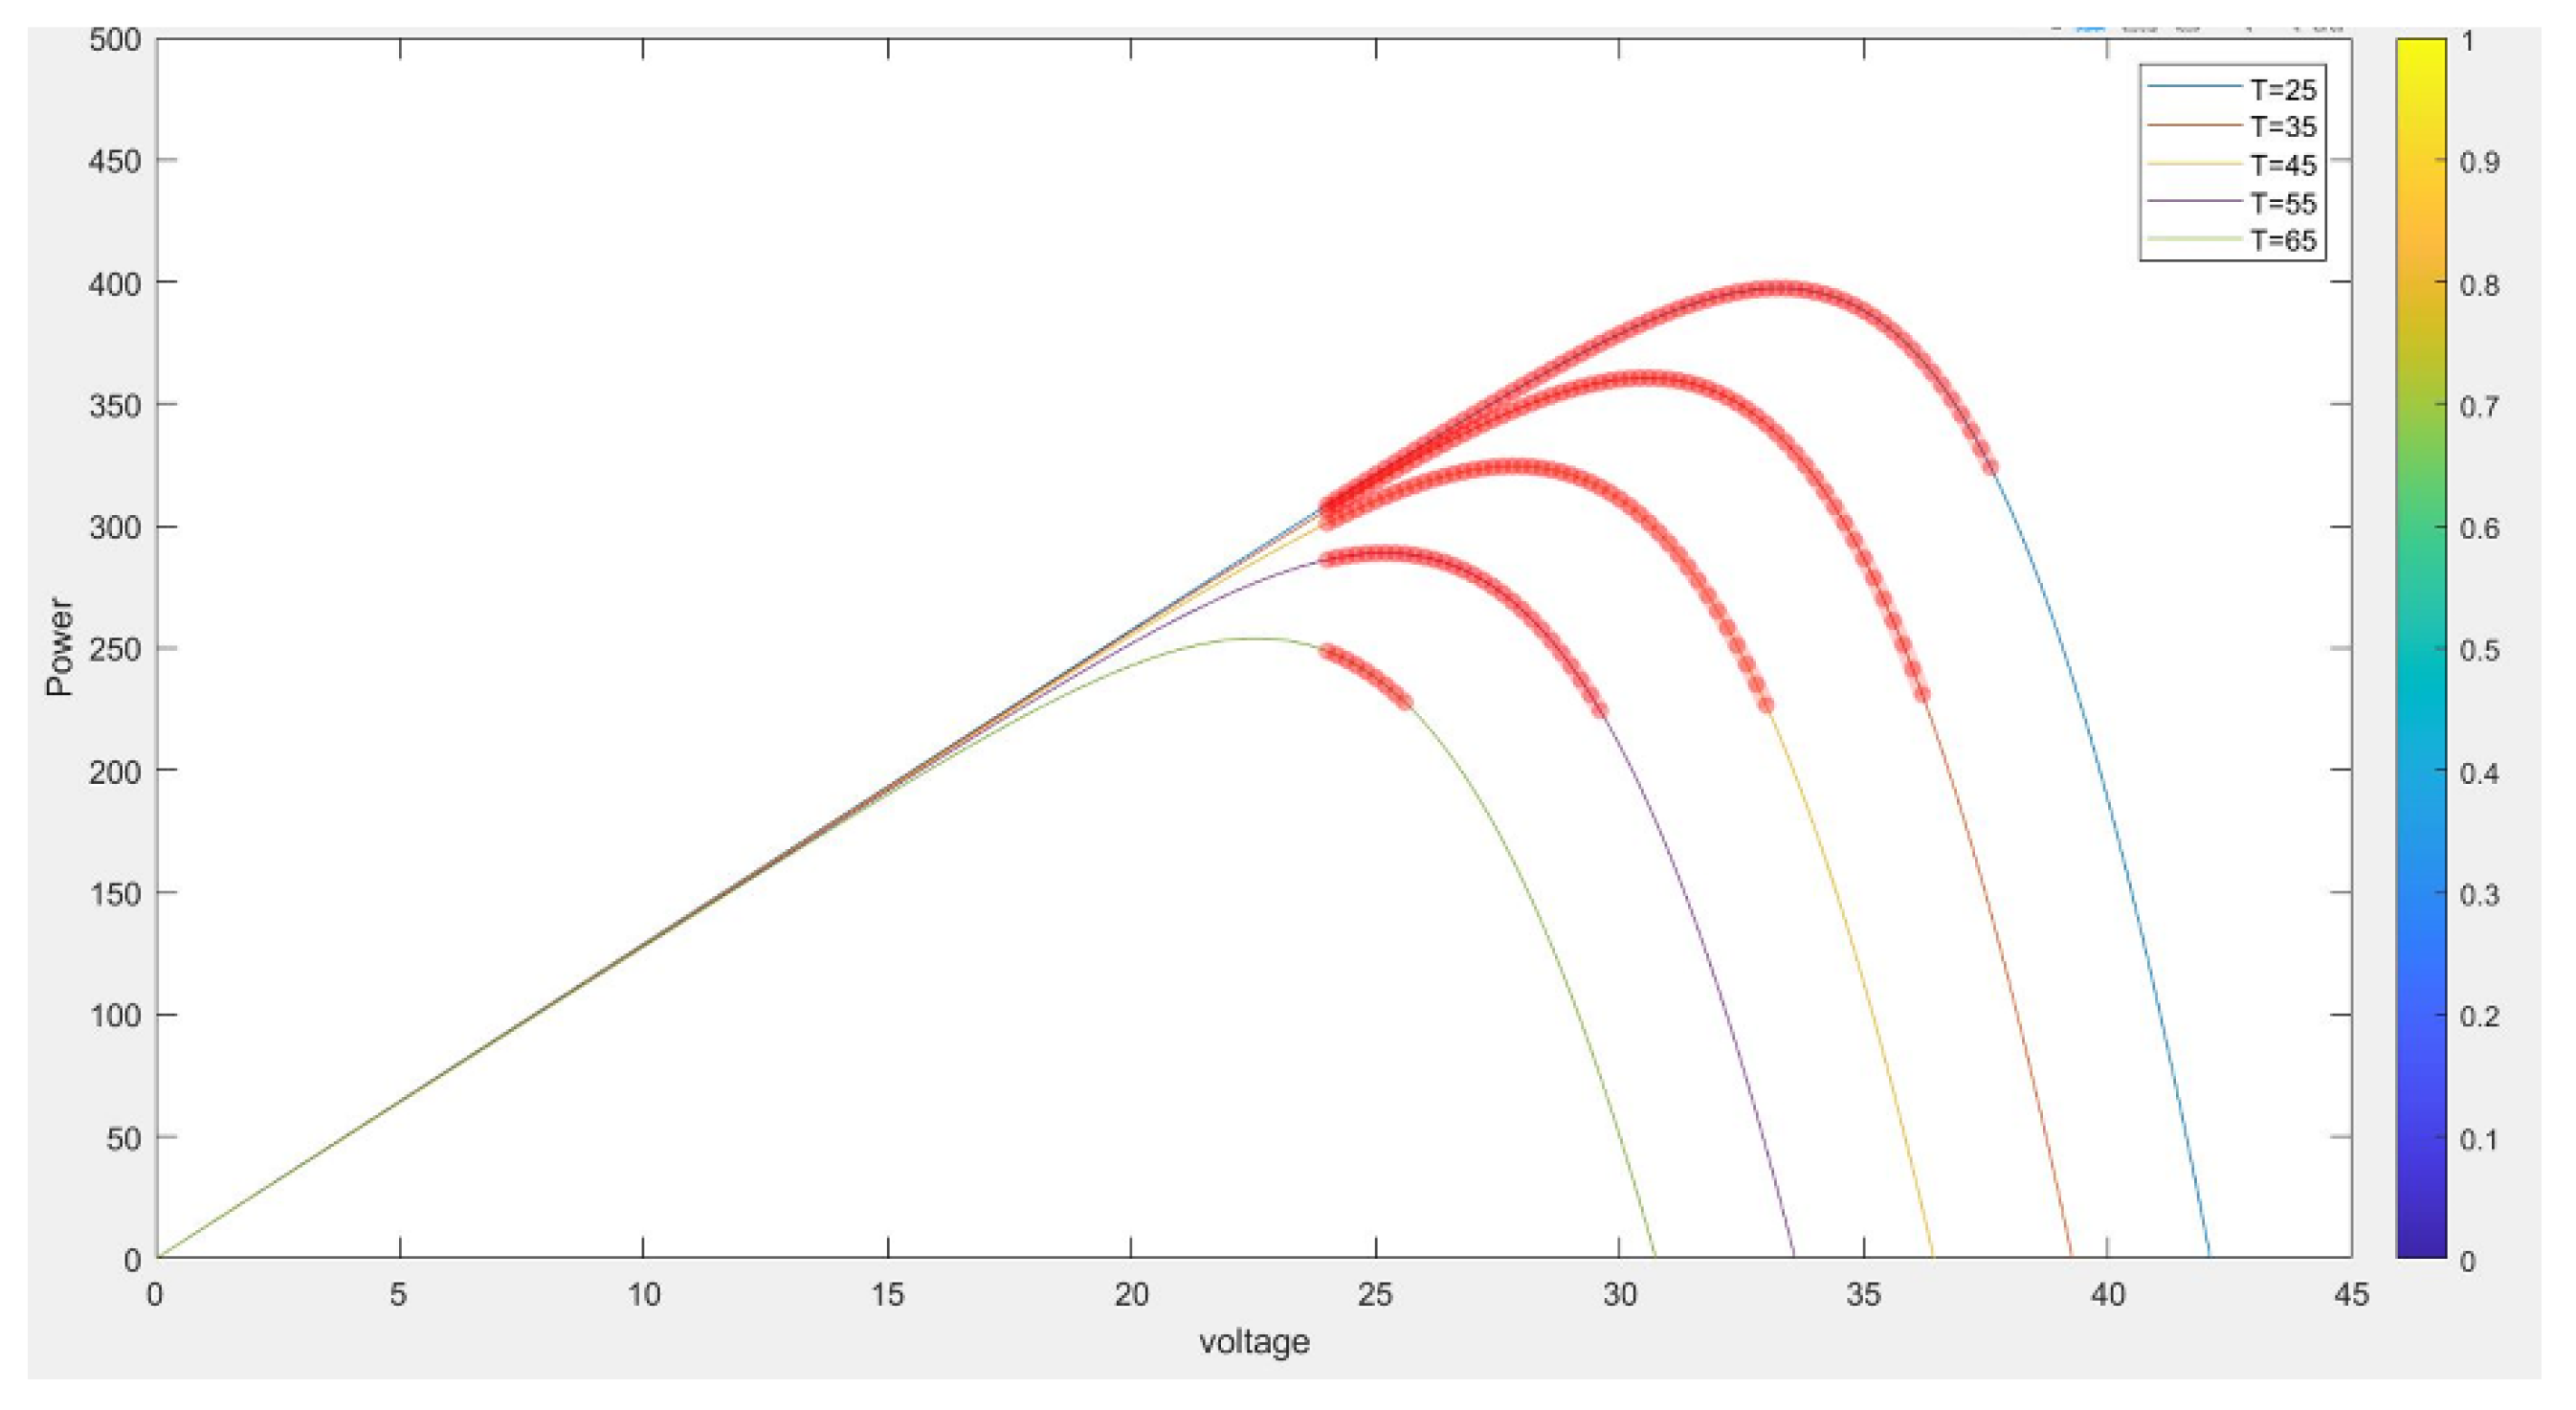
Figure 9, showing the impact of dust and scale on photovoltaic energy production.
Figure 10.
Impact of temperature on photovoltaic energy production.
Figure 10.
Impact of temperature on photovoltaic energy production.
As a result of the effect of wind dust, the voltage and power of the panels decreases as the temperature rises. For this reason, it is necessary to install a cooling and cleaning system for the photovoltaic panels, using water to lower the temperature and clean the PV module from wind dust. However, this water must meet certain quality criteria.
3.4. Quality of Water
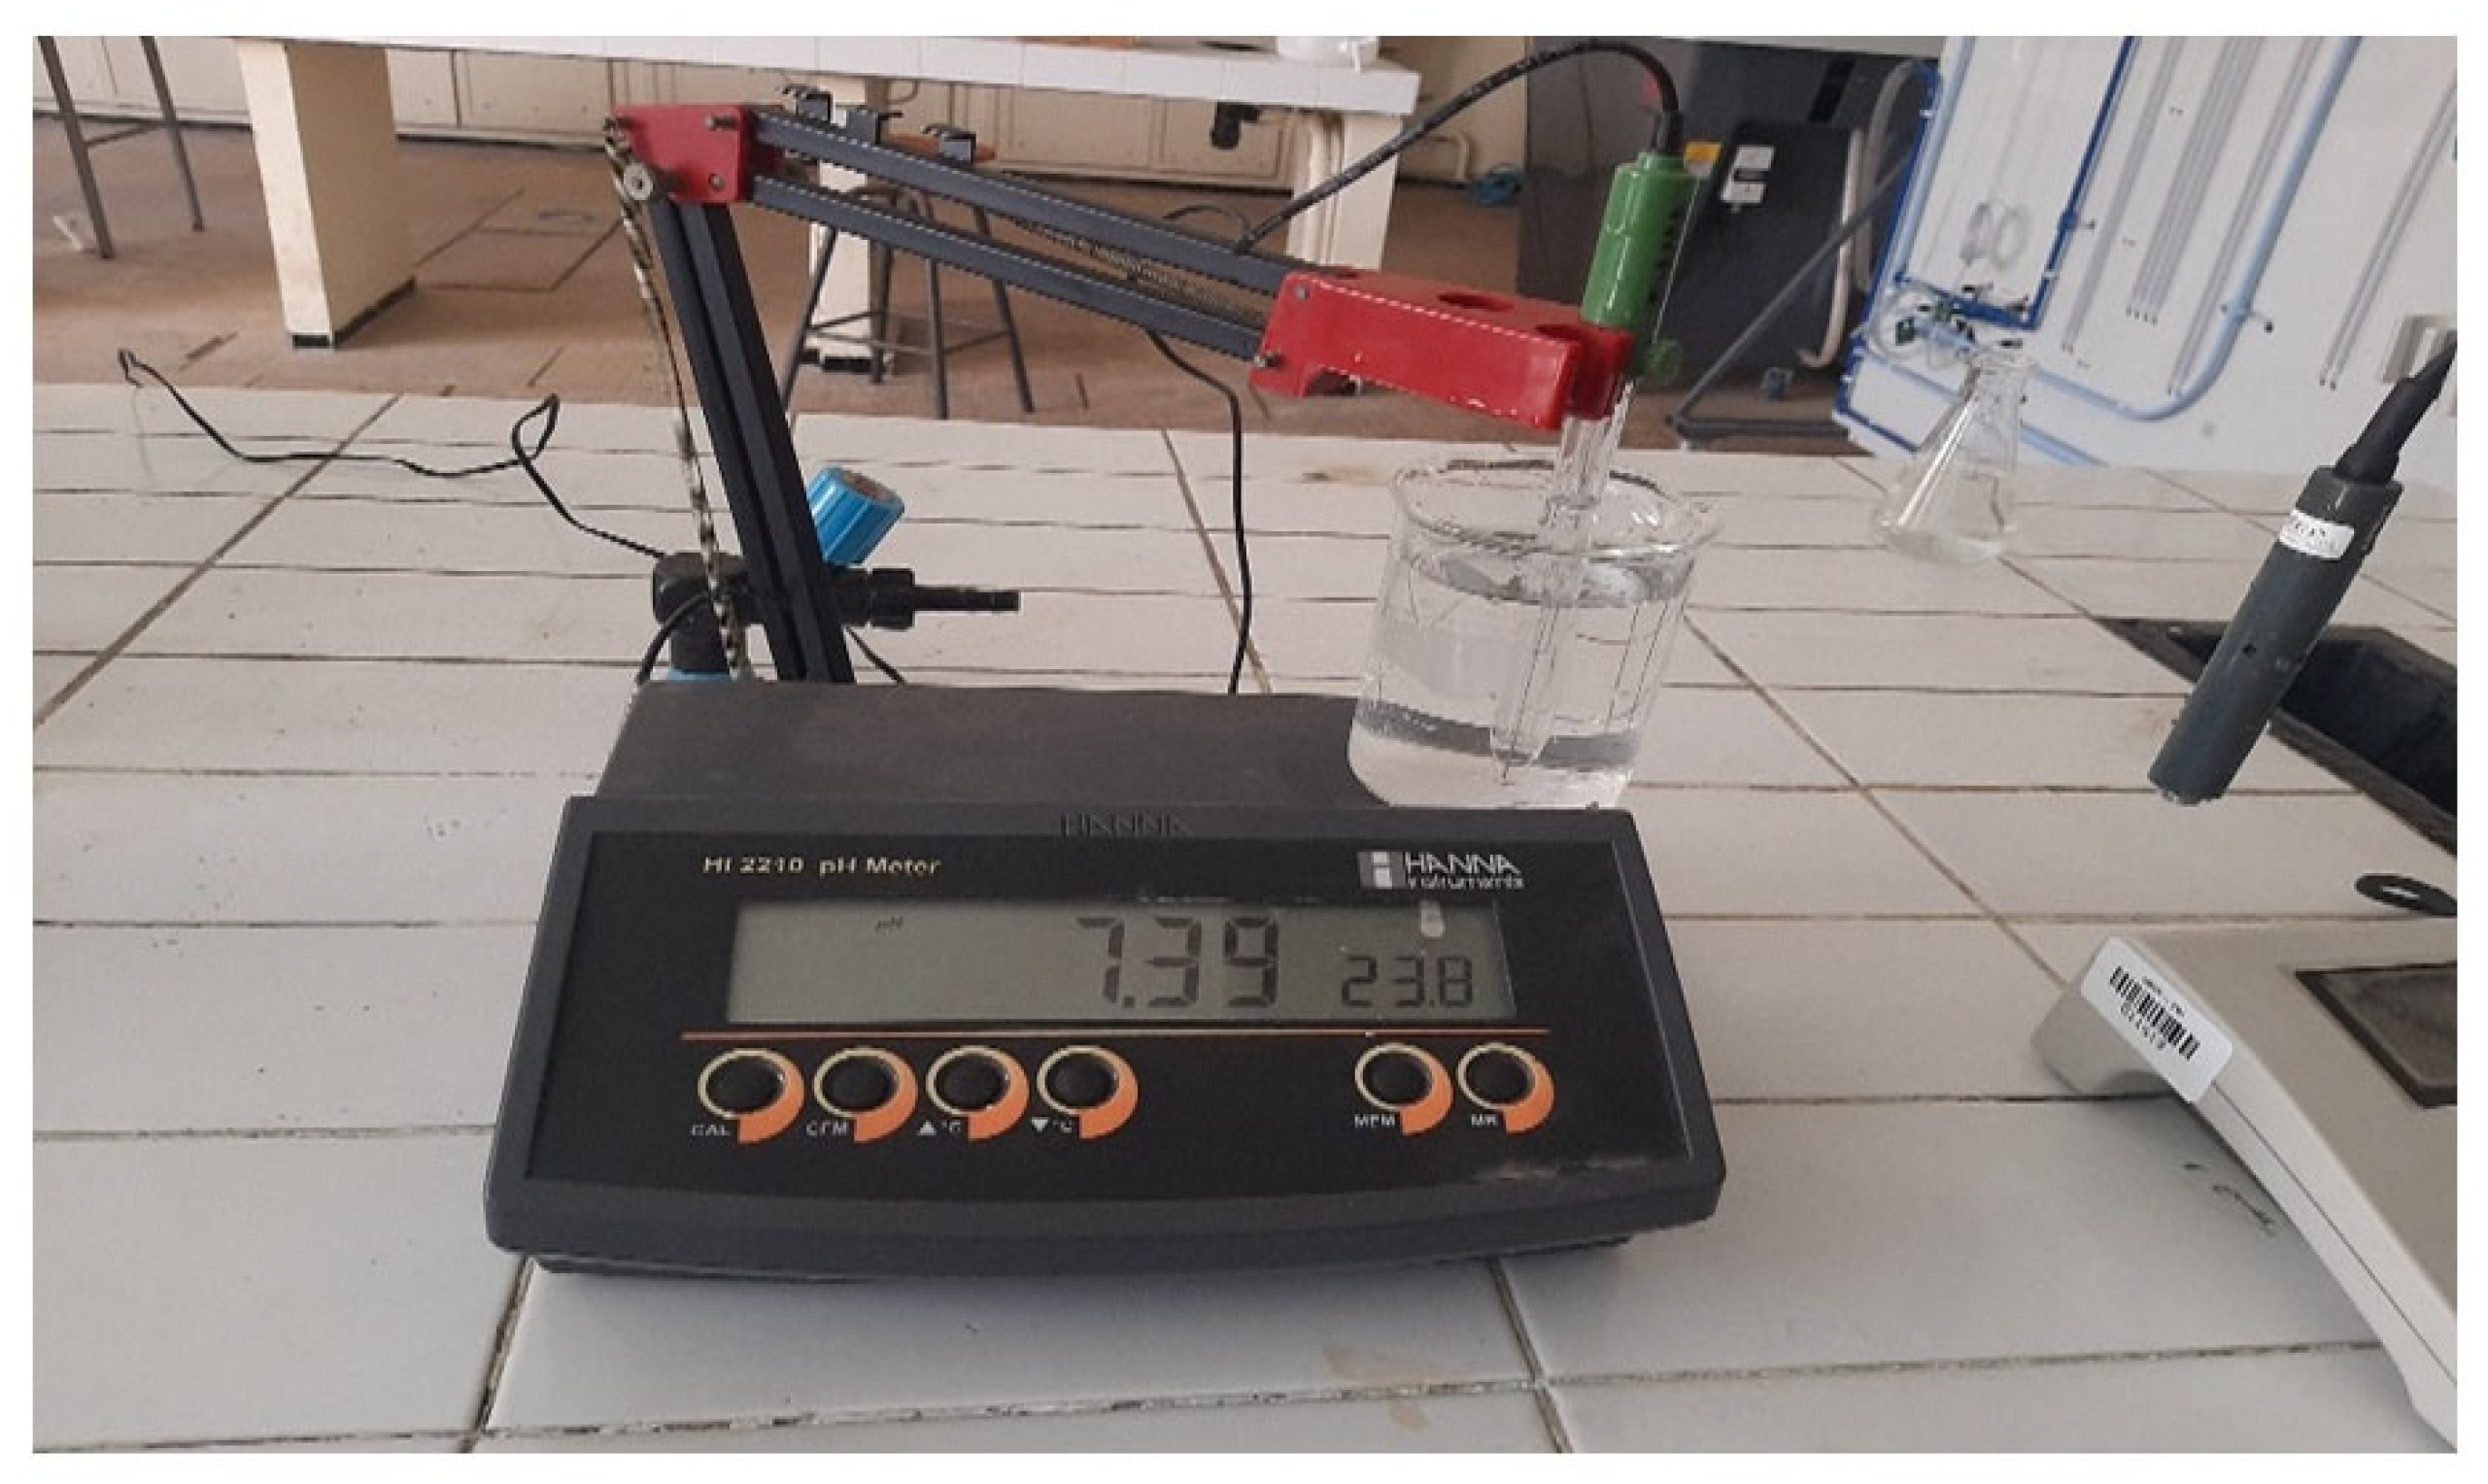
After collecting the water from the well in a bottle washed with distilled water, we perform a quality analysis in laboratories such as these after the results obtained:
Figure 11.
Measurement pH of cooling water.
Figure 11.
Measurement pH of cooling water.
Figure 12.
Measurement of conductivity of water used to cool panels.
Figure 12.
Measurement of conductivity of water used to cool panels.
Table 3.
Value measured (pH, Conductivity and TDS).
Table 3.
Value measured (pH, Conductivity and TDS).
| pH |
Conductivity (µS/cm) |
TDS (mg/L) |
| 7,39 |
1422 |
1500 |
From the results in the table, we can observe that the conductivity value is good (1.4 mS/cm), an indicator of favorable saline conditions for operation. In addition, the pH and TDS values are also acceptable, which will not cause deposits of solid substances on the photovoltaic panels and are subsequently valid for cooling and cleaning the photovoltaic panels and therefore do not affect the performance.
4. Conclusions
In this study, we have examined the impact of temperature, solar irradiation and dust on photovoltaic energy production, suggesting the implementation of a cooling and cleaning system using water. However, this water must meet specific quality criteria to avoid any power complications (deposition of salts, limescale, dust). A climatological and hydrological analysis of the study area was carried out to assess temperature, wind conditions, relative humidity, solar irradiation and water availability in the region.
An experimental test on the combined effect of temperature, solar irradiation and dust on photovoltaic panels was carried out using Matlab-Simulink. As a result, the installation of a cooling and cleaning system for photovoltaic modules in this region is considered essential. The period required to lower the temperature of the photovoltaic panels by spraying water down to their operating temperature was determined. The findings of this study lead to the conclusion that:
1. Significant variation in light levels has a major influence on power quality.
2. The power of photovoltaic panels decreases as the ambient temperature rises.
3. It is imperative to assess the quality of the groundwater and surface water used to cool and clean the PV modules in order to avoid any loss of yield.
4. Groundwater in this area (Daraa Tafilalet region in Morocco) is very suitable for cooling and cleaning PV modules.
5. It is necessary to install a cooling and cleaning system for PV modules in this region. In addition, in high temperature and dusty areas in general.
Author Contributions
Ali Ait Ali: The owner of the idea and the original project, he is the principal author. Youssef Ouhassan: Preparation of samples, layout and correction of the article. Mohcine Abouyaakoub: Data collection. Mbarek CHAHBOUN: Laboratory analysis of samples. Hicham Hihi: supervisor, reviewer and approver of article. All authors have read and agreed to the published version of the manuscript.
Funding
This research has not received any external funding.
Data Availability Statement
The data used to support the findings of this study are available the principal author upon request.
Acknowledgments
This work is supported by Kasr Haroun Rissani Association.
Conflicts of Interest
No potential conflict of interest was reported by the authors.
References
- ALAOUI, M. , et al., High Power PV Array Emulator Based on State Feedback Controller Under Uniform and Non-Uniform Insolation. Transactions on Electrical and Electronic Materials 2023, 24, 54–64. [Google Scholar] [CrossRef]
- Nezami Savojbolaghi, M. , et al., The Impact of Dust Deposition on PV Panels’ Efficiency and Mitigation Solutions: Review Article. Energies 2023, 16, 8022. [Google Scholar] [CrossRef]
- Saidan, M. , et al., Experimental study on the effect of dust deposition on solar photovoltaic panels in desert environment. Renewable Energy 2016, 92, 499–505. [Google Scholar] [CrossRef]
- Abderrezek, M. and M. Fathi, Experimental study of the dust effect on photovoltaic panels’ energy yield. Solar Energy 2017, 142, 308–320. [Google Scholar] [CrossRef]
- Lasfar, S. , et al., Study of the influence of dust deposits on photovoltaic solar panels: Case of Nouakchott. Energy for Sustainable Development 2021, 63, 7–15. [Google Scholar] [CrossRef]
- Sahay, A. , et al., A review of solar photovoltaic panel cooling systems with special reference to Ground coupled central panel cooling system (GC-CPCS). Renewable and Sustainable Energy Reviews 2015, 42. [Google Scholar] [CrossRef]
- Skoplaki, E. and J.A. Palyvos, On the temperature dependence of photovoltaic module electrical performance: A review of efficiency/power correlation. Solar Energy 2009, 83, 614–624. [Google Scholar] [CrossRef]
- Klugmann-Radziemska, E. and E. Klugmann, Thermally affected parameters of the current–voltage characteristics of silicon photocell. Energy Conversion and Management - ENERG CONV MANAGE 2002, 43, 1889–1900. [Google Scholar] [CrossRef]
- Han, X., Y. Wang, and L. Zhu, The performance and long-term stability of silicon concentrator solar cells immersed in dielectric liquids. Energy Conversion and Management 2013, 66, 189–198. [Google Scholar] [CrossRef]
- Panda, S. and M. Gupta, Experimental Investigation on Front Surface Cooling and Back Surface Cooling for Photovoltaic Panels. International Journal of Early Childhood Special Education 2022, 14, 2688–2700. [Google Scholar]
- Laseinde, O.T. and M. Ramere, Efficiency Improvement in polycrystalline solar panel using thermal control water spraying cooling. Procedia Computer Science 2021, 180, 239–248. [Google Scholar] [CrossRef]
- Tian, M.-W. , et al., Energy, exergy and economics study of a solar/thermal panel cooled by nanofluid. Case Studies in Thermal Engineering 2021, 28, 101481. [Google Scholar] [CrossRef]
- Sheik, M. , et al., A Comprehensive Review on Various Cooling Techniques to Decrease an Operating Temperature of Solar Photovoltaic Panels. Energy Nexus 2022, 8, 100161. [Google Scholar] [CrossRef]
- Gomaa, M.R. , et al., Performance enhancement of grid-tied PV system through proposed design cooling techniques: An experimental study and comparative analysis. Solar Energy 2020, 211, 1110–1127. [Google Scholar] [CrossRef]
- Jafari Khoushehmehr, R. , et al., Enhanced photovoltaic panel energy by minichannel cooler and natural geothermal system. International Journal of Energy Research 2021, 45. [Google Scholar]
- Ali, A., K. Abdalrahman, and S. Wahid, STUDYING THE INFLUENCE OF DIFFERENT COOLING TECHNIQUES ON PHOTOVOLTAIC-CELLS PERFORMANCE. Journal of Modern Research 2019, 1, 13–18. [Google Scholar] [CrossRef]
- Grubišić-Čabo, F., S. Nižetić, and T. Giuseppe Marco, Photovoltaic panels: A review of the cooling techniques. Transactions of FAMENA 2016, 40, 63–74. [Google Scholar]
- Abu-Rahmeh, T.M. , Efficiency of Photovoltaic Modules Using Different Cooling Methods: A Comparative Study. Journal of Power and Energy Engineering 2017, 5, 32. [Google Scholar] [CrossRef]
- Popovici, C.G. , et al., Efficiency improvement of photovoltaic panels by using air cooled heat sinks. Energy procedia 2016, 85, 425–432. [Google Scholar] [CrossRef]
- Royne, A., C. J. Dey, and D.R. Mills, Cooling of photovoltaic cells under concentrated illumination: a critical review. Solar energy materials and solar cells 2005, 86, 451–483. [Google Scholar] [CrossRef]
- Firoozzadeh, M., A. Shiravi, and M. Shafiee, An experimental study on cooling the photovoltaic modules by fins to improve power generation: economic assessment. Iranian (Iranica) Journal of Energy & Environment 2019, 10, 80–84. [Google Scholar]
- Jidhesh, P., et al., Experimental thermodynamic performance analysis of semi-transparent photovoltaic-thermal hybrid collectors using nanofluids. Proceedings of the Institution of Mechanical Engineers, Part E: Journal of Process Mechanical Engineering 2021, 235, 1639–1651. [CrossRef]
- Chow, T.T. , et al., Hybrid photovoltaic and thermal solar-collector designed for natural circulation of water. Applied Energy 2006, 83, 199–210. [Google Scholar]
- Moharram, K.A. , et al., Enhancing the performance of photovoltaic panels by water cooling. Ain Shams Engineering Journal 2013, 4, 869–877. [Google Scholar] [CrossRef]
- Alami, A.H. , Effects of evaporative cooling on efficiency of photovoltaic modules. Energy Conversion and Management 2014, 77, 668–679. [Google Scholar] [CrossRef]
- Farhaoui, M. and M. Derraz, Review on Optimization of Drinking Water Treatment Process. Journal of Water Resource and Protection 2016, 08, 777–786. [Google Scholar] [CrossRef]
- Al-Sameraiy, M. , A Novel Water Pretreatment Approach for Turbidity Removal Using Date Seeds and Pollen Sheath. Journal of Water Resource and Protection 2012, 04, 79–92. [Google Scholar] [CrossRef]
- Ministry of Equipment and Water Morocco; Available from:http://www.equipement.gov.ma.
- The National Office of Food Safety Morocco; Available from: https://www.onssa.gov.ma.
|
Disclaimer/Publisher’s Note: The statements, opinions and data contained in all publications are solely those of the individual author(s) and contributor(s) and not of MDPI and/or the editor(s). MDPI and/or the editor(s) disclaim responsibility for any injury to people or property resulting from any ideas, methods, instructions or products referred to in the content. |
© 2024 by the authors. Licensee MDPI, Basel, Switzerland. This article is an open access article distributed under the terms and conditions of the Creative Commons Attribution (CC BY) license (http://creativecommons.org/licenses/by/4.0/).
