Submitted:
20 March 2024
Posted:
21 March 2024
You are already at the latest version
Abstract
(1) Background: Ectopic pregnancy (EP) is when fertilized ovum implanted outside of uterine cavity. The incidence was 1.5% to 2.0% of all pregnancies [1, 2]. EP decreases fertility ability [3]. This study focused on the pregnancy rate after EP and various parameters influencing pregnancy. (2) Methods: The data was extracted from National Health Insurance Research Database (NHIRD) during 2000-2013. The study group enrolled women with one EP history. Those who did not have EP was put into the control group. Chi-square/Fisher exact test was performed on category variable and t-test was used on continue variables. (3) Results: The EP group had a higher cumulative rate of conceive, 41.55% than control group, 37.14% and 1.16 times higher risk in developing pregnancy (P<0.001). The conceiving rate was lower than the control group in the first 5 years, but higher than the control group in the 10th to 14th years. (4) Conclusions: The fecundability after EP is lower at the beginning, but regained after long term follow.
Keywords:
Ectopic pregnancy
; pregnancy
; pregnancy rate
; fecundability
1. Introduction
Ectopic pregnancy (EP) is defined as the implantation of a fertilized ovum outside of the uterus with 95% occurred in the fallopian tube at the first trimester [4]. The diagnosis of ectopic pregnancy relied on the clinical presentation of patient, pregnancy test, quantitative measurement of beta human chorionic gonadotropin levels (beta-hCG) via blood test, ultrasound visualization of embryo in the adnexa outside of the uterine cavity or even diagnostic laparoscopy. Early diagnosis was crucial as ectopic pregnancy contributed to 9% of pregnancy related death [5]. In addition to its implications for mobility and mortality, EP also deteriorate one’s psychological health. Risk factor of EP mainly due to tubal damage either caused by infection or surgery, genital infection, age, cigarette consumption, intrauterine device placement, previous miscarriage and infertility [6]. Management of EP included medical, surgery or observation, largely depend on the location of ectopic pregnancy, gestation age, willing of fertility preservation and patient’s condition [3].
The incidence of EP was estimated 1.5% to 2.0% of all pregnancies [1,2]. A study revealed that majority of EP cases were primigravida (14/45, 31.3%) and had no risk of EP (20/45, 44.44%) [7]. Since EP is a common and serious condition influencing women in reproductive age which might cause subsequent infertility [3], we should put more attention on EP patients especially in Taiwan as birth rate have rapidly declined below replacement levels. According to Central Intelligence Agency (CIA) of United States, the crude birth rate in Taiwan was 7.3 births per 1,000 total population in 2023, ranking 9th from the bottom globally [8].
Advances in medical diagnostics have shifted physicians concerns away from immediate health of these EP women towards preservation of fertility [2]. However, there is currently a lack of comprehensive analysis regarding fertility rates after ectopic pregnancy. To address this problem, we elucidate the presence of various parameters influencing pregnancy after EP through population-based study by analyzing into the data from Taiwan National Health Insurance Research Database (NHIRD). It is a powerful tool to help researchers to do study on the epidemiology of Taiwan. The present study investigated conceiving condition after EP and relative variables such as age, economic condition, comorbidities, seasons, residence area and its urbanization level and where they seek for medical help.
2. Materials and Methods
2.1. Data Extraction
The data was extracted from National Health Insurance Research Database (NHIRD) to elucidate the factors influence the conception rate after ectopic pregnancy. The database was from National health insurance (NHI) which was established in 1995 in Taiwan. The insurance had wide coverage of Taiwan population, kept on increasing from 93% to 100% from 1996 to 2023 [9]. The number of individuals included was big enough to represent the population living in Taiwan. The diagnosis of one’s disease was based on the International Classification of Disease, Ninth Revision, and Clinical Modification (ICD-9-CM).
2.2. Study Design
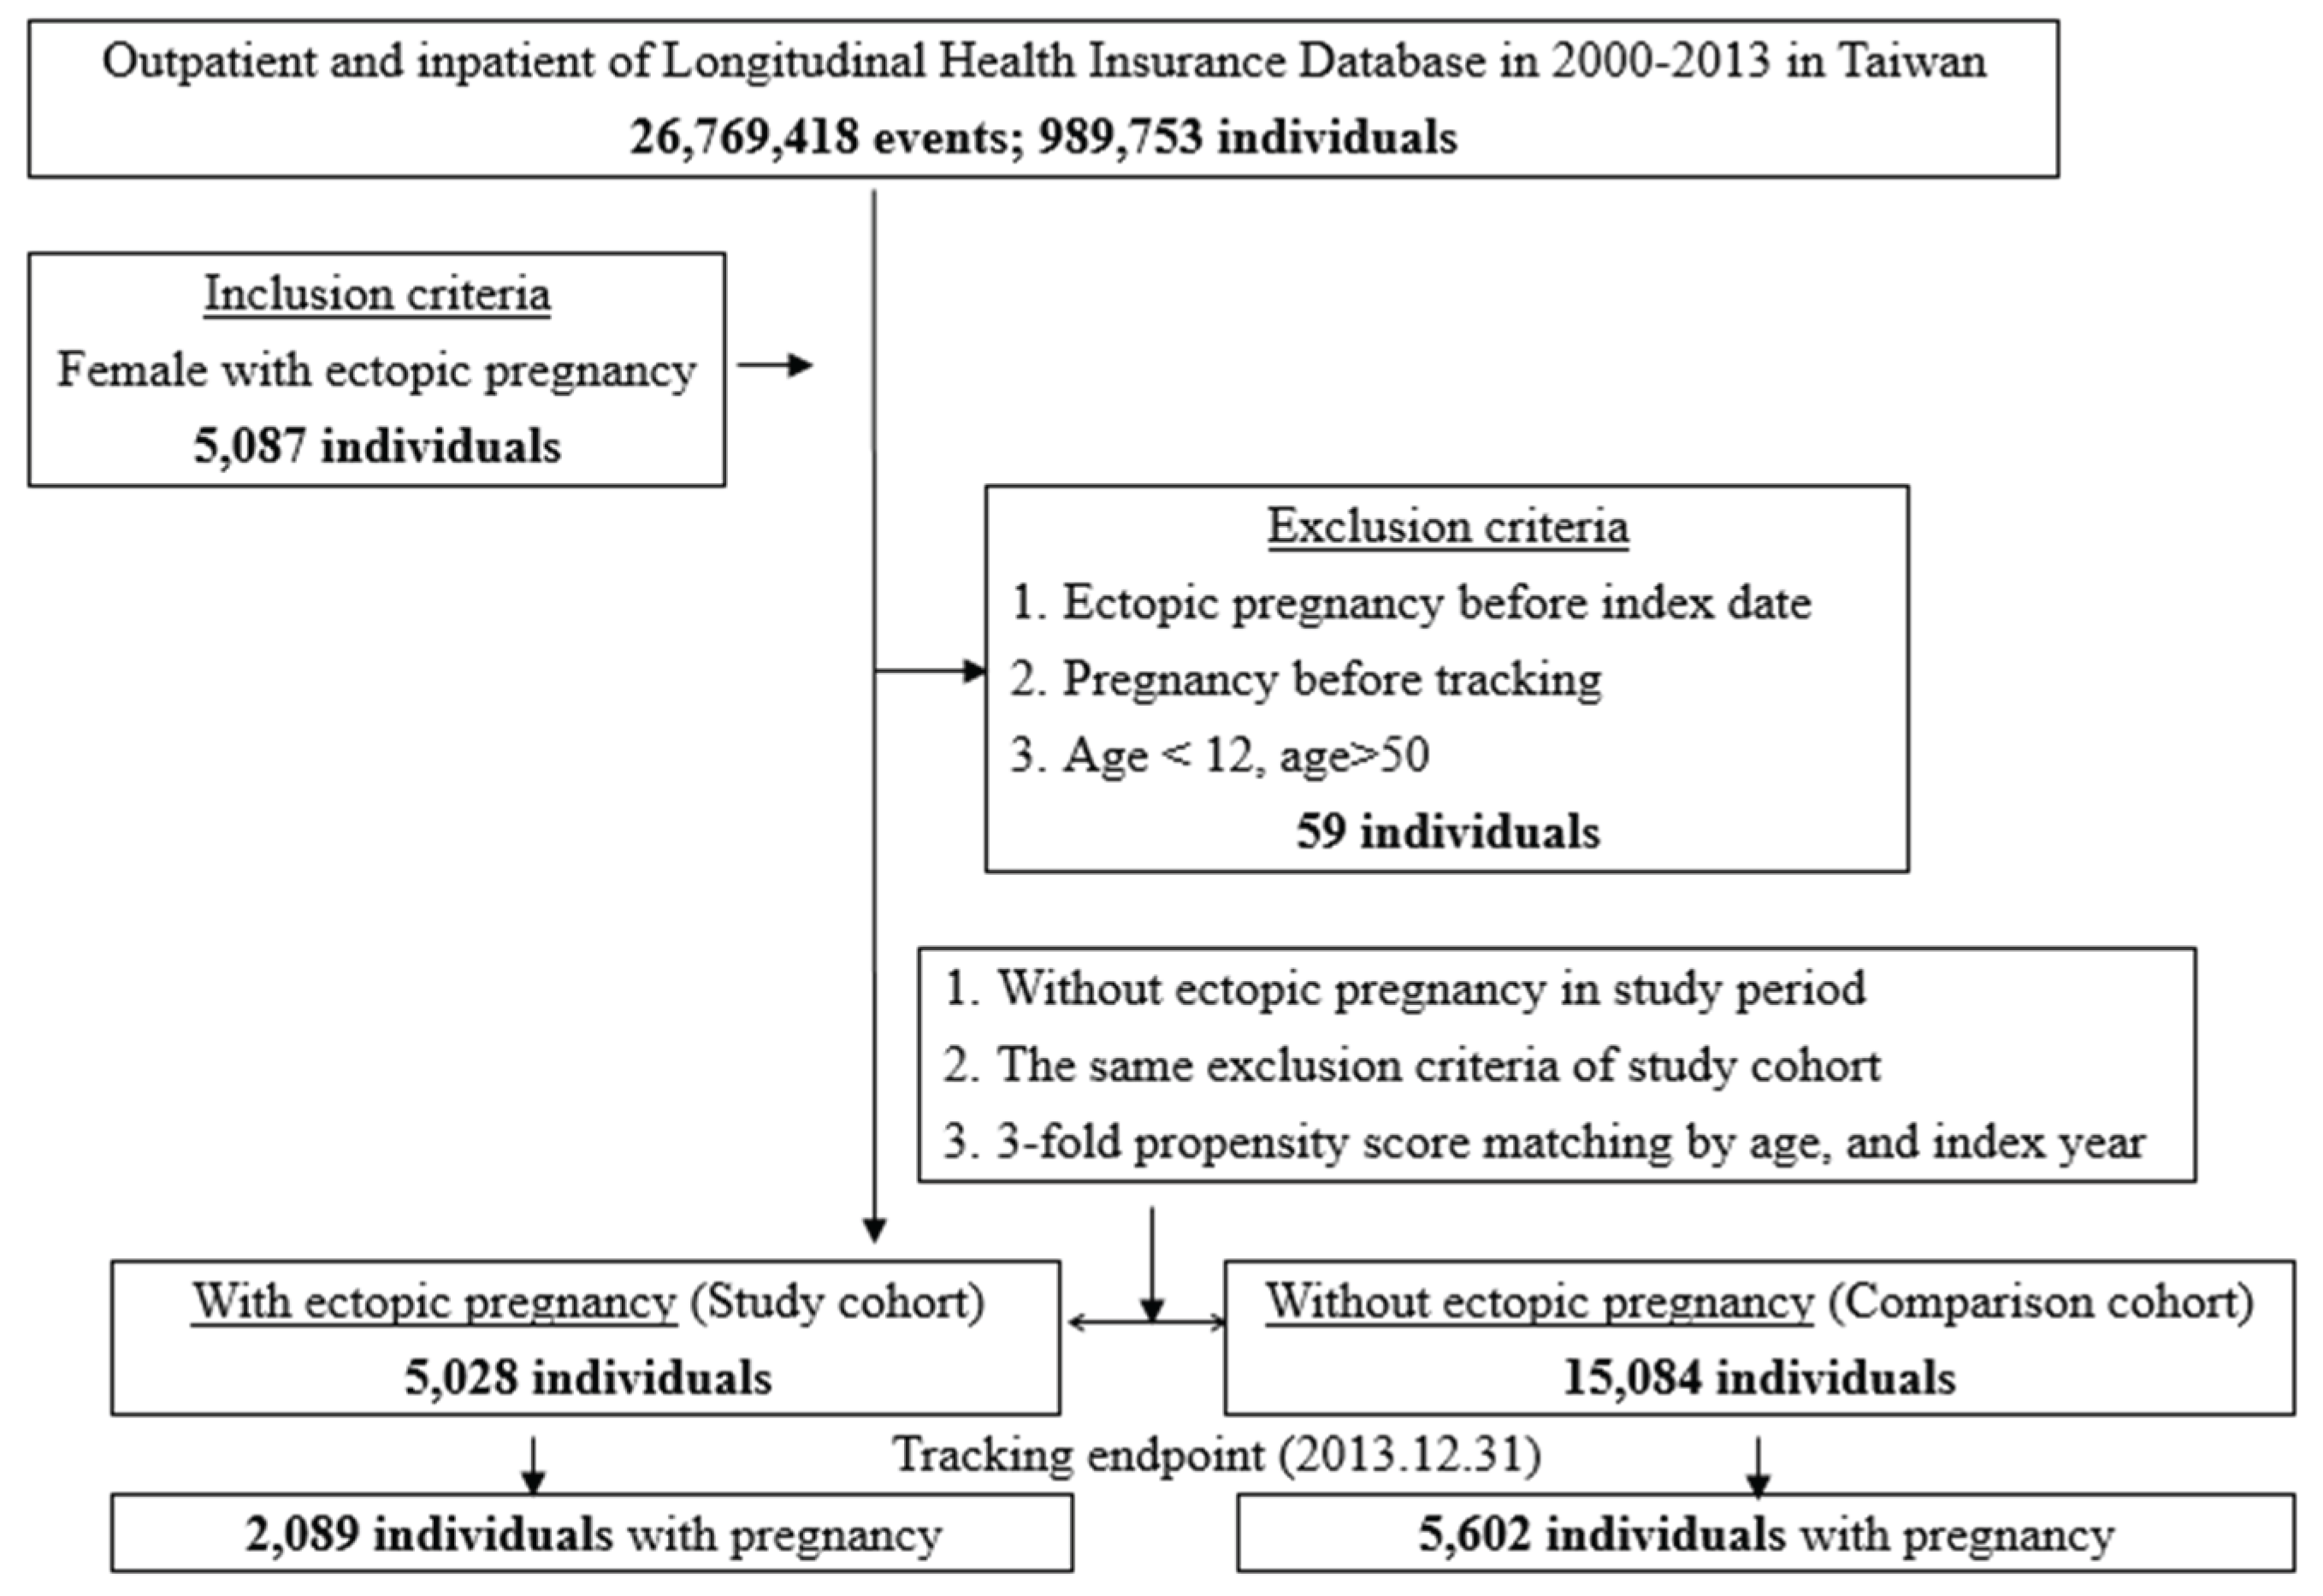
This retrospective study included 989,753 individuals recorded from outpatient and inpatient databases from 2000 to 2013 in Taiwan. 5,087 females with ectopic pregnancy were included into our study by searching ICD-9-CM codes 633.0-633.2, 633.8-633.9. Exclusion criteria was as follows: ectopic pregnancy before the index date, pregnancy before tracking and age <12 or age >50. 59 individuals were further excluded from the study.
The control group was defined as patients who visited a doctor without ectopic pregnancy problems. The same exclusion criteria were applied in both groups. The study employed Propensity score matching (PSM) technique to construct the control group by matching the age and index year. Thus, the number of control group was set as three times more than the experiment groups, a ratio of 1:3, which means that a total of 15,084 individuals were brought into the study.
Figure 1.
The flowchart of study sample selection from National Health Insurance Research Database in Taiwan.
Figure 1.
The flowchart of study sample selection from National Health Insurance Research Database in Taiwan.
2.3. Statistical Analysis
The analysis was performed using SPSS software (SPSS, Inc., Chicago, II, USA). To further describe the details between ectopic pregnant women and its control group, we listed various variables such as age, insurance premiums ($ NT), presence of complications such as anemia as well as shock, seasons, residence area and its urbanization level, and last but not least the level of care. The insurance premium reflected one’s income indirectly. The higher the income, the higher the insurance premium they paid. Chi-square/Fisher exact test was performed on the category variable and t-test was used on continuing variables.
3. Results
The characteristics of the study population are summarized in Table 1. This study had included total of 20,112 participants, comprising 5,028 patients with ectopic pregnancy (EP) and 15, 084 individuals without EP, and analysis of demographic characteristics was done in Table 2. Patients with EP had a higher cumulative incidence rate of conception, 41.55% (2,089/5028 individuals) than control group, 37.14% (5,602/15,084 individuals). The majority of the study population had an average age of 33.73±8.12 years. There are higher percentage of patients between the age of 30-39 in the EP group than in the control group, (49.6% V.S. 43.27%; p<0.001). Furthermore, EP patients had a higher cumulative incidence rate of anemia compared to the control group (0.91% V.S. 0.43%, p<0.001). The incidence rate of shock was the same between two groups. Besides, the number of visits to their physician was distributed equally among seasons (23.95%, 25.7%, 25.99% and 24.36%, p=0.306). Patients in both groups predominantly resided in Northern Taiwan and in urbanization level 2 area of Taiwan. The EP group tended to seek treatment at local hospitals (40.27% vs. 36.79%, p<0.001).
Cox regression analysis of the factor of intrauterine pregnancy was performed after adjusting variables listed in the table 2. The analysis revealed EP patients had a 1.16 times higher risk in developing pregnancy than patients without EP (P<0.001). The population who aged between 20-29 year-old had a significantly higher pregnancy rate than age 12-19 year-old. The patient had higher income, who paid >35,000NT insurance premium per year, had 1.621 folds pregnancy rate than people who came from the lower income group (P<0.001). The relation of pregnancy to anemia, shock and season do not reach significant value in the study. A lower conception rate was observed in patients who lived in Southern Taiwan (0.94-fold, p=0.035) when compared to Northern Taiwan. By comparing to people who live in the lowest urbanization area, a relatively higher incidence of pregnancy was observed in residents who lived in most prosperous city, urbanization level 1 (1.136 folds, p=0.001), but patients in urbanization level 3 scored the lowest pregnancy rate (0.852-fold, p=0.002). Patients who visited the local hospital had the highest pregnancy rate than those treated in hospital centers (0.715-fold, p<0.001) and regional hospitals (0.749-fold, p<0.001).
Table 3 presents the factors of pregnancy in populations with or without previous ectopic pregnancy. Our study showed that patients who suffered from ectopic pregnancy had significant conceiving rate by 1.16 fold (95% CI 1.103-1.220, P<0.001) compared to those without this problem. The difference of pregnancy rate between previous ectopic women and without EP women was described as follows: whose age fall between 12-19 years old and >=30 years old, pay lower insurance premium (<35000NT), without complications like anemia and shock, pay a visit in all seasons except summer, all of the urbanization level and choice of medical facilities..
To assess the long-term trends, a 14-year follow-up was conducted using Cox regression analysis, as shown in Table 4. The pregnancy rate of both groups was recalculated each year. In the first 5 years, the pregnancy rate of EP group was lower than who did not experience EP, ranging from 0.36-0.921 fold. However, when tracking to a longer duration, the patients with EP regained their fecundability. They had a much higher intrauterine pregnancy rate, and the value reached a significant difference level at the 10th to 14th years which is 1.075-1.16 than the control group.
4. Discussion
The investigation of the epidemiology of ectopic pregnancy (EP) holds particular significance, especially in regions like Taiwan, where the crude birth rate ranks 9th from the bottom worldwide [8]. Previous research found that the intrauterine second pregnancy rate was lower while comparing women whose first pregnancy was EP or intrauterine (40.5% vs. 54.5%) [10]. This study is the first to focus specifically on the future pregnancy rates among nulligravida individuals with and without a history of EP.
In this study, the cumulative pregnancy rate in EP group was 41.55% and had a 1.16 times higher intrauterine pregnancy than those without EP. These findings are consistent with a Canadian study that reported a similar pregnancy rate of 40.5% after EP [10]. In contrast, a Turkish study indicated a notably higher pregnancy rate after EP, reaching 83.2% (84/101) [11]. These results suggest that individuals with a history of EP may possess a greater potential for childbirth overall.. In the current study, we provided a 14-year-data to further describe these phenomena with more detail. The statistic showed that the annual pregnancy rate of EP patients was initially lower and surpassed the control group at the 9th years. This might be due to EP women may just facing surgery like salpingectomy, medical treatment like MTX, which may lead a huge impact physically and psychologically. Similar condition was revealed in previous study that 3.64% of EP patient required repeat operation for recurrent ectopic pregnancy [12]. A study found that women with EP history has the lowest delivery rate (69%) compared to women without EP history [13]. The result indicated the fertility might be compromised by the EP history [13]. However, our study showed as time pass on, the EP mother regained their pregnancy ability. Furthermore, Line Lund Karus et al. [14] found the daughters from mothers with EP history had 1.5-fold (95% CI 1.2-1.9) risk of EP. It might be the result of similar lifestyles in mother and daughter such as smoking, alcohol consumption, sexual and contraceptive choices.
In our study, we chose to analyze the age range of 12-50, considering that most females begin to develop secondary sexual characteristics during their teenage years, and they may face post-menopausal issues after the age of 45. We found the majority of EP occurred older than 30 year-old (65.51%) which is compatible with the study conducted by Melanie Chouinard et al. in 2019 [10]. The advanced age is one of the risk of EP [6]. Since the age of women attempting first pregnancy got elder, the incidence of EP become higher [13]. Among all patients, those between 20-29 years old had the highest pregnant potential (adjusted HR 1.589, 95% CI 1.299-1.945, P<0.001). However, when compared between two groups, EP patients only showed their superiority in conception rate between 12-19 years old (adjusted HR 1.798, 95% CI 1.176-2.750, P=0.007), 30-39 years old (adjusted HR 1.303, 95% CI 1.209-1.405, P<0.001) and >=45 years old (adjusted HR 1.986, 95% CI 1.308-3.016, P=0.001). Although there was no statistical significance when comparing the two 20-29 years old groups, both the EP group and control group demonstrated the highest pregnancy rates in the 20-29 years age bracket.
Additionally, our study revealed that anemia was more prevalent among EP patients. Interestingly, EP mothers who did not experience complications such as anemia and shock exhibited higher pregnancy rates compared to those without a history of EP.
Analyzing into the residence area of EP patients also provided the government an insight to where the money should be subsidized in, the researchers and private sectors to find their potential populations. For example, the majority of EP patients mostly came from Northern Taiwan, the more urbanized area (urbanization level 1 and 2) in Taiwan and with economically disadvantage. The distribution of urbanized level and economic status were similar to previous study [10]. The relapse rate of EP was up to 10% [15]. Some preventive measure or medical care can be enforced in those area in order to eliminate the medical cost and the pain of EP mothers.
Our study showed that EP patient were more likely to be treated in local hospitals than the control group (40.27% V.S. 36.79%). When came to pregnancy rate, local hospital gained the highest score. This might be attributed to the referral of difficult cases to hospital centers..
Furthermore, our study also highlighted that the higher income population had much higher pregnancy rate. However, when we take EP into consideration, better pregnancy rate was found in people we paid less than 35,000NT. The reason may be caused by the majority population to use assisted reproductive technology (ART) lies in the higher income group. The average cost of in-vitro fertilization (IVF) was estimated 3,817 USD per cycle in 2002 [16], which is 32% of per capita income (PCI) of Taiwan in the same year (11,914 USD) [17]. The government began to subside 3,333 USD to IVF treatment since July, 2021. With the improvement of IVF technique and IVF treatment affordability, the role of ART in EP population becomes increasingly significant. The study conducted by Yamei Xue et al. found there was no difference in pregnancy rate, live birth rate, miscarriage rate and ectopic rate in IVF patients regarding of EP history [18]. Same result was found, He Cai et al. revealed no statistically difference in live birth rate and recurrent EP rate comparing patient with EP, intrauterine pregnancy or never had conceived [19].
However, it's important to note several limitations in our study. We did not compare pregnancy condition of the EP patient by the treatment they received, such as observation, medical treatment with MTX, surgical treatment or surgery for a failed MTX treatment. A studies in 1993 told us that further reproductive performance largely depend on how previous ectopic pregnancy was managed: 43 patients of EP after laparoscopic procedures, intrauterine pregnancy rates hit 79% among women without tubal damage, but 42% with damage [20]. However, recent studies showed that the ability to achieve a new pregnancy, time to a new pregnancy and prognosis of pregnancy was not associated with treatment methods [21,22,23]. The change may be caused by advancement of diagnosis of EP, improvement of surgical skill and better ART technique [6,13,24].
Neonatal outcomes were not studied in our research. A population-based retrospective cohort study of 1,117,571 pregnant women in Canada found the subsequent intrauterine pregnancy after EP had 1.27 times risk of preterm birth (95% CI, 1.18–1.37), 1.20 times the risk of low birth weight (95% CI, 1.10–1.31), 1.21 times the risk of placental abruption (95% CI, 1.04–1.41), and 1.45 times the risk of placenta previa (95% CI, 1.10–1.91) compared to women whose first pregnancy was intrauterine [10]. Closer monitoring during prenatal stage benefits both mother and neonates.
We could not distinct the willing to have a child or not in our study. A study showed 208 of 298 patients (67.7%) with history of EP and did attempt to conceive was pregnant which was higher than our study [25]. Although the pregnancy rate increased after excluding people who did not desire an offspring, it shall not influence the result while comparing between our study and control groups.
Current study did not put marital status, sexual preference and infertility (both male and female) into consideration. Further research is needed to understand the influence of these factors.
5. Conclusions
This study showed that ectopic pregnancy patients were the population who had distinct pregnancy rate in the future. This study analyzed into various variable of EP patients to provide a glance into mode of life of these population such as where they tend to live, more likely to seek for medical help, income, complication they might face. After that, we further associated those variables to pregnancy rate by intra and inter-group comparison. The result of current study showed that ectopic pregnancy patients who regained and had better pregnancy rate 10 years after the event.
Author Contributions
Conceptualization, Y.L.L.; methodology, C.W.C.; software, C.W.C; resources, C.C.C.; writing—original draft preparation, C.H.Y. and Y.L.L.; writing—review and editing, C.H.Y. and Y.L.L.; supervision, G.J.W. All authors have read and agreed to the published version of the manuscript.
Funding
This study was supported by the Tri-Service General Hospital Research Foundation (TSGH_A_113013).
Institutional Review Board Statement
This study was conducted according to the Code of Ethics of the World Medical Association (Declaration of Helsinki). This study was approved by the Institutional Review Board (IRB No. C202405034) of the Tri-Service General Hospital (TSGH).
Informed Consent Statement
Patient consent was waived because the data was extracted from a national health insurance database.
Acknowledgments
Special thanks to Dr. Eric Lee and Dr. Tom Chang who worked with me in Tri-Service General Hospital.
Conflicts of Interest
The authors declare no conflicts of interest.
References
- Grimes, D.A. The morbidity and mortality of pregnancy: still risky business. Am J Obstet Gynecol. 1994, 170, 1489–1494. [Google Scholar] [PubMed]
- Chang, J.; Elam-Evans, L.D.; Berg, C.J.; Herndon, J.; Flowers, L.; Seed, A.K.; Syverson, C.J. Pregnancy-related mortality surveillance—United States, 1991—1999. MMWR Surveill Summ. 2003, 52, 1–8. [Google Scholar] [PubMed]
- Ehrenberg-Buchner, S.; Sandadi, S.; Moawad, N.S.; Pinkerton, J.S.; Hurd, W.W. Ectopic pregnancy: role of laparoscopic treatment. Clin Obstet Gynecol. 2009, 52, 372–9. [Google Scholar] [CrossRef] [PubMed]
- Bouyer, J.; Fernandez, J.C.; Pouly, J.L; Job-Spira, N. Sites of ectopic pregnancy: a 10 year population-base study of 1800 cases. Hum Reprod. 2002, 17, 3224–30. [Google Scholar] [CrossRef]
- Barash, J.H. , Buchanan, E. M., Hillson, C. Diagnosis and management of ectopic pregnancy. Am Fam Physician. 2014, 90, 34–40. [Google Scholar]
- Farquhar, C. M Ectopic pregnancy. Lancet. 2005, 366, 583–91. [Google Scholar] [CrossRef]
- Islam, A.; Fawad, A.; Shah, A.A.; Jadoon, H.; Sarwar, I.; Abbasi, A.U.N. Analysis of two years cases of ectopic pregnancy. 2017, 29, 65-67.
- The world factbook. Available online: https://www.cia.gov/the-world-factbook/field/birth-rate/ (accessed on 12th Jan, 2024).
- National health insurance administration, ministry of health and welfare. Available online: https://www.nhi.gov.tw/Content_List.aspx?n= 34D1C9E227F442B7&topn=4864A82710DE35ED (accessed on 12th Jan, 2024).
- Chouinard, M.; Mayrand, M.H.; Ayoub, A.; Healy-Profitos, J.; Auger, N. Ectopic pregnancy and outcomes of future intrauterine pregnancy. Fertil Steril. 2019, 112, 112–119. [Google Scholar] [CrossRef]
- Duz, S.A. Fertility outcomes after medical and surgical management of tubal ectopic pregnancy. Acta Clin Croat. 2022, 60, 347–353. [Google Scholar]
- Hsu, M.I.; Tang, C.H.; Hsu, P.Y.; Huang, Y.T.; Long, C.Y.; Huang, K.H; Wu, M.P. Primary and repeated surgeries for ectopic pregnancies and distribution by patient age, surgeon age, and hospital levels: an 11-year nationwide population-based descriptive study in Taiwan. J Minim Invasive Gynecol. 2012, 19, 598–605. [Google Scholar] [CrossRef]
- Karhus, L.L.; Egerup, P.; Skovlund, C.W.; Lidegaard, Ø. Long-term reproductive outcomes in women whose first pregnancy is ectopic: a national controlled follow-up study. Hum Reprod. 2013, 28, 241–246. [Google Scholar] [CrossRef]
- Karhus, L.L.; Egerup, P.; Skovlund, C.W.; Lidegaard, Ø. Impact of ectopic pregnancy for reproductive prognosis in next generation. Acta Obstet Gynecol Scand. 2014, 93, 416–419. [Google Scholar] [CrossRef] [PubMed]
- Seeber, B.E.; Barnart, K.T. Suspected ectopic pregnancy. Obstet Gynecol. 2006, 107, 399–413. [Google Scholar] [CrossRef] [PubMed]
- Collins, J.A. An international survey of the health economics of IVF and ICSI. Hum Reprod Update. 2002, 8, 265–277. [Google Scholar] [CrossRef] [PubMed]
- Directorate-General of Budget, Accounting and Statistics Executive Yuan. Available online: http://ebook.dgbas.gov.tw/public/data/352913302353.pdf (accessed on 12th Jan, 2024).
- Xue, Y.; Tong, X.; Zhang, H.; Zhang, S. Pregnancy outcomes following in vitro fertilization treatment in women with previous recurrent ectopic pregnancy. PLoS One. 2022, 17, e0272949. [Google Scholar] [CrossRef] [PubMed]
- Cai, H.; Mol, B.W.; Li, P.; Liu, X.; Watrelot, A.; Shi, J. Tubal factor infertility with prior ectopic pregnancy: a double whammy? A retrospective cohort study of 2,892 women. Fertil Steril. 2020, 113, 1032–1038. [Google Scholar] [PubMed]
- Silva, P.D.; Scaper, A.M.; Rooney, B. Reproductive outcome after 143 laparoscopic procedures for ectopic pregnancy. Obstet Gynecol. 1993, 81, 710–715. [Google Scholar] [PubMed]
- Hsu, J.Y.; Chen, L.; Gumer, A.R.; Tergas, A.I.; Hou, J.Y.; Burke, W.M.; Ananth, C.V.; Hershman, D.L.; Wright, J.D. Disparities in the management of ectopic pregnancy. Am J Obstet Gynecol. 2017, 217, 49.e1–49e10. [Google Scholar] [CrossRef] [PubMed]
- Bhattacharya, S.; McLernon, D.J.; Lee, A.J.; Bhattacharya, S. Reproductive outcomes following ectopic pregnancy: register-based retrospective cohort study. PLoS Med. 2012, 9, e1001243. [Google Scholar] [CrossRef]
- Wise, L.A.; Mikkelsen, E.M.; Sørensen, H.T.; Rothman, K.J.; Hahn, K.A.; Riis, A.H.; Hatch, E.E. Prospective study of time to pregnancy and adverse birth outcomes. Fertil Steril. 2015, 103, 1065–1073e2. [Google Scholar] [CrossRef]
- Barnhart, K.T. Clinical practice. Ectopic pregnancy. N Engl J Med. 2009, 361, 379–387. [Google Scholar] [CrossRef]
- Fernandez, H.; Capmas, P.; Lucot, J.P.; Resch, B.; Panel, P.; Bouyer, J. Fertility after ectopic pregnancy: the DEMETER randomized trial. Hum Reprod. 2013, 28, 1247–1253. [Google Scholar] [CrossRef]

Table 1.
Characteristics of study.
| Ectopic pregnancy | Total | With | Without | P | |||
|---|---|---|---|---|---|---|---|
| Variables | n | % | n | % | n | % | |
| Total | 20,112 | 5,028 | 25.00 | 15,084 | 75.00 | ||
| Pregancy | <0.001 | ||||||
| Without | 12,421 | 61.76 | 2,939 | 58.45 | 9,482 | 62.86 | |
| With | 7,691 | 38.24 | 2,089 | 41.55 | 5,602 | 37.14 | |
| Age (years) | 33.73±8.12 | 33.17±7.09 | 33.91±8.43 | <0.001 | |||
| Age group (years) | <0.001 | ||||||
| 12-19 | 434 | 2.16 | 95 | 1.89 | 339 | 2.25 | |
| 20-29 | 6,647 | 33.05 | 1,639 | 32.60 | 5,008 | 33.20 | |
| 30-39 | 9,021 | 44.85 | 2,494 | 49.60 | 6,527 | 43.27 | |
| ≧40 | 4,010 | 19.94 | 800 | 15.91 | 3,210 | 21.28 | |
| Insured premium (NT$) | 0.828 | ||||||
| <18,000 | 18,000 | 89.50 | 4,498 | 89.46 | 13,502 | 89.51 | |
| 18,000-34,999 | 1,569 | 7.80 | 399 | 7.94 | 1,170 | 7.76 | |
| ≧35,000 | 543 | 2.70 | 131 | 2.61 | 412 | 2.73 | |
| Anemia | <0.001 | ||||||
| Without | 20,001 | 99.45 | 4,982 | 99.09 | 15,019 | 99.57 | |
| With | 111 | 0.55 | 46 | 0.91 | 65 | 0.43 | |
| Shock | 0.407 | ||||||
| Without | 20,016 | 99.52 | 5,008 | 99.60 | 15,008 | 99.50 | |
| With | 96 | 0.48 | 20 | 0.40 | 76 | 0.50 | |
| Season | 0.306 | ||||||
| Spring | 4,816 | 23.95 | 1,207 | 24.01 | 3,609 | 23.93 | |
| Summer | 5,169 | 25.70 | 1,246 | 24.78 | 3,923 | 26.01 | |
| Autumn | 5,227 | 25.99 | 1,315 | 26.15 | 3,912 | 25.93 | |
| Winter | 4,900 | 24.36 | 1,260 | 25.06 | 3,640 | 24.13 | |
| Location | 0.019 | ||||||
| Northern Taiwan | 8,715 | 43.33 | 2,252 | 44.79 | 6,463 | 42.85 | |
| Middle Taiwan | 5,352 | 26.61 | 1,297 | 25.80 | 4,055 | 26.88 | |
| Southern Taiwan | 4,945 | 24.59 | 1,194 | 23.75 | 3,751 | 24.87 | |
| Eastern Taiwan | 1,029 | 5.12 | 274 | 5.45 | 755 | 5.01 | |
| Outlets islands | 71 | 0.35 | 11 | 0.22 | 60 | 0.40 | |
| Urbanization level | <0.001 | ||||||
| 1 (The highest) | 7,614 | 37.86 | 1,970 | 39.18 | 5,644 | 37.42 | |
| 2 | 8,558 | 42.55 | 2,180 | 43.36 | 6,378 | 42.28 | |
| 3 | 1,568 | 7.80 | 371 | 7.38 | 1,197 | 7.94 | |
| 4 (The lowest) | 2,372 | 11.79 | 507 | 10.08 | 1,865 | 12.36 | |
| Level of care | <0.001 | ||||||
| Hospital center | 6,219 | 30.92 | 1,468 | 29.20 | 4,751 | 31.50 | |
| Regional hospital | 6,319 | 31.42 | 1,535 | 30.53 | 4,784 | 31.72 | |
| Local hospital | 7,574 | 37.66 | 2,025 | 40.27 | 5,549 | 36.79 | |
| P: Chi-square/Fisher exact test on category variables and t-test on continue variables | |||||||
Table 2.
Factors of pregnancy by using Cox regression.
| Variables | Crude HR | 95% CI | 95% CI | P | Adjusted HR | 95% CI | 95% CI | P |
|---|---|---|---|---|---|---|---|---|
| Ectopic pregnancy | ||||||||
| Without | Reference | Reference | ||||||
| With | 1.265 | 1.203 | 1.331 | <0.001 | 1.160 | 1.103 | 1.220 | <0.001 |
| Age group (years) | ||||||||
| 12-19 | Reference | Reference | ||||||
| 20-29 | 1.662 | 1.359 | 2.033 | <0.001 | 1.589 | 1.299 | 1.945 | <0.001 |
| 30-39 | 0.597 | 0.569 | 0.853 | <0.001 | 0.689 | 0.563 | 0.844 | <0.001 |
| ≧40 | 0.017 | 0.013 | 0.023 | <0.001 | 0.018 | 0.014 | 0.024 | <0.001 |
| Insured premium (NT$) | ||||||||
| <18,000 | Reference | Reference | ||||||
| 18,000-34,999 | 0.828 | 0.650 | 1.055 | 0.127 | 0.961 | 0.820 | 1.126 | 0.622 |
| ≧35,000 | 0.818 | 0.609 | 1.083 | 0.157 | 1.621 | 1.272 | 2.067 | <0.001 |
| Anemia | ||||||||
| Without | Reference | Reference | ||||||
| With | 0.982 | 0.714 | 1.351 | 0.912 | 0.973 | 0.707 | 1.339 | 0.866 |
| Shock | ||||||||
| Without | Reference | Reference | ||||||
| With | 0.000 | - | - | 0.774 | 0.000 | - | - | 0.691 |
| Season | ||||||||
| Spring | Reference | Reference | ||||||
| Summer | 0.966 | 0.906 | 1.031 | 0.301 | 0.974 | 0.912 | 1.039 | 0.418 |
| Autumn | 0.977 | 0.917 | 1.041 | 0.471 | 1.003 | 0.942 | 1.069 | 0.917 |
| Winter | 1.044 | 0.978 | 1.114 | 0.189 | 0.981 | 0.920 | 1.047 | 0.565 |
| Location | ||||||||
| Northern Taiwan | Reference | Multicollinearity with urbanization level | ||||||
| Middle Taiwan | 0.981 | 0.929 | 1.036 | 0.490 | Multicollinearity with urbanization level | |||
| Southern Taiwan | 0.941 | 0.889 | 0.996 | 0.035 | Multicollinearity with urbanization level | |||
| Eastern Taiwan | 0.905 | 0.815 | 1.004 | 0.059 | Multicollinearity with urbanization level | |||
| Outlets islands | 1.328 | 0.937 | 1.880 | 0.111 | Multicollinearity with urbanization level | |||
| Urbanization level | ||||||||
| 1 (The highest) | 1.044 | 0.969 | 1.125 | 0.255 | 1.136 | 1.050 | 1.228 | 0.001 |
| 2 | 1.077 | 1.001 | 1.158 | 0.046 | 1.031 | 0.958 | 1.110 | 0.413 |
| 3 | 0.991 | 0.896 | 1.096 | 0.857 | 0.852 | 0.770 | 0.943 | 0.002 |
| 4 (The lowest) | Reference | Reference | ||||||
| Level of care | ||||||||
| Hospital center | 0.469 | 0.443 | 0.497 | <0.001 | 0.715 | 0.673 | 0.760 | <0.001 |
| Regional hospital | 0.513 | 0.487 | 0.541 | <0.001 | 0.749 | 0.710 | 0.790 | <0.001 |
| Local hospital | Reference | Reference | ||||||
| HR= hazard ratio, CI = confidence interval, Adjusted HR: Adjusted variables listed in the table | ||||||||
Table 3.
Factors of pregnancy stratified by variables listed in the table by using Cox regression.
| Ectopic pregnancy | With | Without | With vs. Without | ||||||||
|---|---|---|---|---|---|---|---|---|---|---|---|
| Strarified | Event | PYs | Rate (per 105 PYs) | Event | PYs | Rate (per 105 PYs) | Ratio | Adjusted HR | 95% CI | 95% CI | P |
| Total | 2,089 | 49,353.69 | 4,232.71 | 5,602 | 178,041.29 | 3,146.46 | 1.345 | 1.160 | 1.103 | 1.220 | <0.001 |
| Age group (years) | |||||||||||
| 12-19 | 41 | 422.70 | 9,699.49 | 56 | 1,149.21 | 4,872.93 | 1.990 | 1.798 | 1.176 | 2.750 | 0.007 |
| 20-29 | 1,033 | 9,903.66 | 10,430.48 | 3,155 | 32,214.43 | 9,793.75 | 1.065 | 1.028 | 0.957 | 1.103 | 0.450 |
| 30-39 | 982 | 19,797.57 | 4,960.21 | 2,322 | 62,651.24 | 3,706.23 | 1.338 | 1.303 | 1.209 | 1.405 | <0.001 |
| ≧40 | 33 | 19,229.76 | 171.61 | 69 | 82,026.41 | 84.12 | 2.040 | 1.986 | 1.308 | 3.016 | 0.001 |
| Insured premium (NT$) | |||||||||||
| <18,000 | 2,019 | 47,750.86 | 4,228.20 | 5,450 | 173,269.24 | 3,145.39 | 1.344 | 1.153 | 1.095 | 1.214 | <0.001 |
| 18,000-34,999 | 49 | 1,206.55 | 4,061.15 | 107 | 3,585.47 | 2,984.26 | 1.361 | 1.574 | 1.099 | 2.254 | 0.013 |
| ≧35,000 | 21 | 396.28 | 5,299.29 | 45 | 1,186.58 | 3,792.43 | 1.397 | 0.937 | 0.525 | 1.673 | 0.826 |
| Anemia | |||||||||||
| Without | 2,074 | 49,028.66 | 4,230.18 | 5,570 | 177,213.40 | 3,143.10 | 1.346 | 1.157 | 1.100 | 1.218 | <0.001 |
| With | 15 | 325.03 | 4,615.02 | 32 | 827.89 | 3,865.24 | 1.194 | 1.539 | 0.703 | 3.369 | 0.281 |
| Shock | |||||||||||
| Without | 2,089 | 49,151.33 | 4,250.14 | 5,602 | 177,050.14 | 3,164.08 | 1.343 | 1.160 | 1.103 | 1.220 | <0.001 |
| With | 0 | 202.36 | 0.00 | 0 | 991.15 | 0.00 | - | - | - | - | - |
| Season | |||||||||||
| Spring | 463 | 11,424.42 | 4,052.72 | 1,301 | 40,184.78 | 3,237.54 | 1.252 | 1.117 | 1.004 | 1.243 | 0.043 |
| Summer | 498 | 11,961.81 | 4,163.25 | 1,405 | 46,093.50 | 3,048.15 | 1.366 | 1.086 | 0.980 | 1.204 | 0.117 |
| Autumn | 595 | 13,710.05 | 4,339.88 | 1,517 | 50,167.17 | 3,023.89 | 1.435 | 1.241 | 1.128 | 1.366 | <0.001 |
| Winter | 533 | 12,257.42 | 4,348.39 | 1,379 | 41,595.84 | 3,315.24 | 1.312 | 1.187 | 1.073 | 1.314 | 0.001 |
| Urbanization level | |||||||||||
| 1 (The highest) | 725 | 18,016.60 | 4,024.07 | 1,957 | 61,005.16 | 3,207.93 | 1.254 | 1.096 | 1.008 | 1.195 | 0.035 |
| 2 | 950 | 21,881.68 | 4,341.53 | 2,492 | 77,532.01 | 3,214.16 | 1.351 | 1.181 | 1.095 | 1.273 | <0.001 |
| 3 | 173 | 4,374.48 | 3,954.76 | 469 | 15,865.11 | 2,956.17 | 1.338 | 1.232 | 1.033 | 1.470 | 0.020 |
| 4 (The lowest) | 241 | 5,080.93 | 4,743.23 | 684 | 23,639.00 | 2,893.52 | 1.639 | 1.196 | 1.031 | 1.388 | 0.019 |
| Level of care | |||||||||||
| Hospital center | 428 | 15,301.51 | 2,797.11 | 1,277 | 57,203.35 | 2,232.39 | 1.253 | 1.106 | 0.991 | 1.235 | 0.072 |
| Regional hospital | 568 | 17,620.83 | 3,223.46 | 1,555 | 65,240.51 | 2,383.49 | 1.352 | 1.172 | 1.064 | 1.291 | 0.001 |
| Local hospital | 1,093 | 16,431.35 | 6,651.92 | 2,770 | 55,597.43 | 4,982.24 | 1.335 | 1.192 | 1.111 | 1.280 | <0.001 |
| PYs = Person-years; Adjusted HR = Adjusted Hazard ratio: Adjusted for the variables listed in Table 3.; CI = confidence interval | |||||||||||
Table 4.
Adjusted HR of pregnancy by using Cox regression among different tracking years.
| Ectopic pregnancy (With vs. Without) | Adjusted HR | 95% CI | 95% CI | P |
|---|---|---|---|---|
| In the tracking of X year(s) | ||||
| 1 | 0.360 | 0.317 | 0.409 | <0.001 |
| 2 | 0.674 | 0.627 | 0.724 | <0.001 |
| 3 | 0.789 | 0.741 | 0.840 | <0.001 |
| 4 | 0.886 | 0.816 | 0.918 | <0.001 |
| 5 | 0.921 | 0.871 | 0.975 | 0.004 |
| 6 | 0.975 | 0.923 | 1.031 | 0.376 |
| 7 | 0.983 | 0.932 | 1.037 | 0.531 |
| 8 | 1.020 | 0.967 | 1.076 | 0.463 |
| 9 | 1.042 | 0.989 | 1.099 | 0.124 |
| 10 | 1.075 | 1.021 | 1.132 | 0.006 |
| 11 | 1.113 | 1.057 | 1.172 | <0.001 |
| 12 | 1.129 | 1.072 | 1.198 | <0.001 |
| 13 | 1.148 | 1.091 | 1.208 | <0.001 |
| 14 (Total) | 1.160 | 1.103 | 1.220 | <0.001 |
| HR= hazard ratio, CI = confidence interval, Adjusted HR: Adjusted variables listed in Table 2. | ||||
Disclaimer/Publisher’s Note: The statements, opinions and data contained in all publications are solely those of the individual author(s) and contributor(s) and not of MDPI and/or the editor(s). MDPI and/or the editor(s) disclaim responsibility for any injury to people or property resulting from any ideas, methods, instructions or products referred to in the content. |
© 2024 by the authors. Licensee MDPI, Basel, Switzerland. This article is an open access article distributed under the terms and conditions of the Creative Commons Attribution (CC BY) license (http://creativecommons.org/licenses/by/4.0/).
Copyright: This open access article is published under a Creative Commons CC BY 4.0 license, which permit the free download, distribution, and reuse, provided that the author and preprint are cited in any reuse.


