Submitted:
04 March 2024
Posted:
05 March 2024
You are already at the latest version
Abstract
This study examined the impact of differences in fruit load of olive trees on the rate of stem refilling. The experiment was conducted in a commercial olive orchard over the consecutive years of 2021 and 2022, during which the biennial bearing cycle of olive trees resulted in minimal fruit production in 2021 and maximal production in 2022. The rate of stem refilling was determined by quantifying the differences in water volume traversing the apex and base of the principal branches of experimental trees using sap flow sensors. Concurrent measurements of tree water status were also conducted using psychrometers, while soil moisture content dynamics were continuously recorded. Results indicate that alternate bearing significantly influences the stem refilling process, while soil moisture availability also plays a pivotal role. Water reserves were more intensively utilized during the year of full production (“ON” year) primarily to fulfill the water demands of developing fruits. This replenishment occurred in various periods during the day, including early morning, afternoon, and night, when stomatal conductance measurements indicated stomatal closure. The study suggests a more intense replenishment of reserves during the night in "ON" year trees, irrespective of soil moisture, water vapor pressure deficit, or phenological fruit development stage.
Keywords:
nocturnal sap flow
; replenishment of internal reserves
; alternate bearing
; olive tree water relations
1. Introduction
While the effect of climate change on diurnal temperature, predominantly during summer months, has been thoroughly discussed, little attention has been paid to the proportional increase in nocturnal temperatures. Indeed, previous research revealed that the nocturnal temperature increase rate is approximately 1.4 times greater than the corresponding diurnal temperature increase [1], resulting in the concomitant increase in nighttime vapor pressure deficit (VPD). These changes in VPD have been correlated with increase in nocturnal plant water losses, which in turn could significantly reduce water use efficiency (WUE) in cultivated species [2,3]. In this frame, several scientific results suggest incomplete stomatal closure and increased sap flow velocity values during the night in olive trees [4], grapevine [5,6], tomatoes [2], sunflower [7], and bean [8]. However, it is not yet well understood why stomata remain open during the night even though CO2 fixation via photosynthesis is suspended, and additionally, there is no need to reduce leaf temperature through transpiration fluxes [9]. Specific experiments support that stomata remain open to facilitate the absorption and translocation of water and dissolved inorganic nutrients from the soil to various plant parts [10]. Other studies suggest that maintaining stomatal conductance throughout the night serves the purpose of supplying dissolved oxygen to woody tissues [11] while preventing cell turgor loss [12]. On the other hand, the observed increased values of nocturnal sap flow do not necessarily imply water losses through transpiration, as a significant part of the up-streamed amounts of water can be used to refill the water reserves of the plant tissues predominately those in the sapwood where the most considerable amounts of water are known to be stored [13]; a process commonly referred as ‘stem refilling’ [11,14]. The water reserves are utilized to fulfill the transpirational requirements of plants during the day and are replenished during the night period [15]. The stem refilling process is controlled by complex ecophysiological mechanisms that alter hydrodynamic parameters [15], reducing the risk of embolism within the conducting xylem [16] which is an essential mechanism that allows plants to adapt to various environmental conditions. The study of this mechanism has been well-documented in forest species [17,18,19,20]. However, limited research has been conducted on the dynamics of stem refilling in cultivated species, such as olive trees. In addition to its well-known high resistance and capacity to produce fruit under arid conditions [21], this species is characterized by differentiated fruit production between two consecutive years owing to the phenomenon of alternate bearing, i.e., the production of a substantial fruit load in one year (commonly termed in the literature as "ON" year), followed by a subsequent year characterized by a diminished fruit load ("OFF" year) [22]. This characteristic essentially affects the olive species' water relations and consequently influences water resource utilization [23,24]. Beyond the fruit load, the phenological growth stage also exerts a considerable impact on the water relations of olive trees, with a more pronounced effect during the "ON" year. Specifically, during the phenological growth stage of 'pit hardening,' olive trees exhibit resistance to water deficit without detrimental effects on yield [25,26]. Conversely, in the subsequent phenological growth stage ("second phase of rapid fruit growth"), there is an elevated demand for water [27].
Hence, the objective of this study is (a) to systematically observe and document the alteration of water status during the night in olive trees subjected to varying fruit loads, and (b) to comparatively assess the impact of alternate fruit bearing on the dynamics of stem refilling process.
2. Materials and Methods
2.1. Experimental Orchard
The experiment was carried out in the region of Aetoloakarnania, in an irrigated commercial olive grove cultivated with the "Kalamon" (Olea europaea L.) table variety, during two growing seasons, i.e., 2021 and 2022. Due to alternate fruit bearing, the yield varied significantly between the two years. In particular, in 2021 (year of reduced fruit load or "OFF" year) the yield was limited to 3.43 tons/hectare, while in the year 2022 (year of full fruit load or "ON" year), the maximum amount was produced reaching 20.4 tons/hectare.
2.2. Phenological Growth Stage
The starting point for determining subsequent phenological stages was the phenological growth stage of full bloom. This stage was determined macroscopically on the field, and the degree of flower opening was recorded [28]. The starting time and duration of the 'pit hardening' phenological stage during the "ON" year (2022) were estimated according to Rapoport et al., 2013; in particular, the delimitation of this stage, which lasts about 50 days, was based on the detection of the increase in the rate of pit hardening, characterized by the point at which the longitudinal and transverse dimensions of the endocarp showed negligible changes. In each sampling, the transverse and longitudinal dimension of hardened endocarps was measured using a precision digital caliper on 25 olive fruits per tree from 2 adjacent trees, in which measurements of ecophysiological parameters were also carried out, as described below. After the completion of the phenological stage of 'pit hardening', the 'second phase of rapid fruit growth' followed, the duration of which proceeds to the end of the experimental period.
2.3. Climatic Data and Soil Moisture Content Measurement
The continuous monitoring of critical microclimatic parameters was undertaken utilizing a meteorological station installed within the experimental plot. The parameters that were measured hourly encompassed solar radiation, precipitation, relative humidity, air temperature, and wind speed at a height of 2 meters above the ground surface. Hourly values of vapor pressure deficit (VPD) were calculated as the difference between saturation vapor pressure (es) and actual vapor pressure (ea) according to Allen et al. [30], as follows:
Hourly values of saturation vapor pressure (es) were calculated with the following equation (eq. 2) according to Allen et al., 1998.
where:
es = hourly value of saturation vapor pressure (kPa)
T = hourly air temperature value (°C)
The hourly values of actual vapor pressure (ea) were calculated with the equation 3 [30]:
where:
ea = hourly value of actual vapor pressure (kPa)
T = hourly value of air temperature (°C)
RH = hourly value of relative humidity (%)
The continuous monitoring of soil moisture dynamics was performed using capacitance probe system (EnviroSCAN, Sentek Sensor Technologies, Stepney, Australia) positioned within the experimental plot at a depth of 100 cm. Hourly measurements were conducted, and the resulting data were stored in data logger [31].
2.4. Measurement of Ecophysiological Parameters
2.4.1. Leaf Area Index, Sap Flow and Gas Exchange
Leaf area index (LAI) measurements were conducted using a LAI-2000 Plant Canopy Analyzer (LI-COR Biosciences, Lincoln, NE, USA) as described in Kokkotos et al. [32]. The maximum values of LAI were recorded at 50–80 cm from the trunk, while the minimum values at the center of the canopy [22]. This variation can be attributed to the open-shape canopy structure resulting from pruning practices.
Sap flow velocity was assessed on the trunk and branches of two representative olive trees employing the Heat Ratio Method (HRM) by ICT International in Armidale, NSW, Australia, a methodology well described in previous studies [33]. Specifically, one sensor set was positioned at the apex of each central branch, representing crown sap flow by integrating measurements from all three branches of each tree. Additionally, four sensor sets were installed on the trunk of each tree, precisely at the junctions with the branches at an azimuthal angle of 90°. This experimental configuration, i.e., utilizing an extended number of sensors instead of multiple sample trees, is considered optimal for obtaining reliable results and cover the azimuthal variability when measuring sap flow in mature olive trees [34]. Comparable experiments by Moreno et al. [35], Fuentes et al. [36], López-Bernal et al. [37], and Hernandez-Santana et al. [38] also adopted a similar approach with an equivalent number of sample trees.
To determine nocturnal stomatal conductance (gs night), measurements were conducted using a portable infrared gas analyzer system (LCPro+, ADC, Bioscientific Ltd., Hoddesdon, UK) on ten fully grown and healthy leaves at specified intervals, i.e., 4, 14, 39, and 60 days after irrigation (DAI).
2.4.2. Water Potential
The stem water potential was measured automatically and continuously with psychrometers (PSY1, ICT International, Pty., Armidale NSW, Australia) following thorough calibration according to the manufacturer's guidelines. The sensors were installed on one of the three primary branches of each tree, specifically the branch oriented towards the northeast. Measurements were conducted at 30-minute intervals. These recordings served a dual purpose: firstly, to assess the water status of the tree throughout the two experimental years under varying fruit loads, and secondly, to monitor and assess the replenishment of stem water storage [15]. In order to monitor and evaluate the replenishment of the stem water storage, the difference between the water potential at dusk (Ψdusk) and the pre-dawn water potential (ΨPD) was calculated and compared in the two experimental years. The period from dusk to pre-dawn represents the nocturnal period and, in this work, is characterized by values of solar radiation <1μmol/m2s [39].
2.5. Stem Water Storage
In order to determine stem water storage, the difference in sap flow volume, measured at the top and the base of the stem, was calculated, following the methodology described by Goldstein et al. [17] and Zeppel et al. [19]. Positive values of this difference represent the utilization of internal water storage, whereas negative values indicate the replenishment of internal reserves.
2.6. Statistical Analysis
The statistical analysis was conducted using the IBM SPSS Statistics software (Version 27). Statistically significant differences of means were assessed through the Student's t-test, at a confidence level of 95%, while previously testing for normal distribution. In case of violation of the aforementioned, a non-parametric test was used (Mann-Whitney U test). The standard error was employed as a metric to estimate the statistical spread.
3. Results
3.1. Bioclimatic Context
The statistical analysis of the microclimatic data indicates statistically significant higher values of temperature during the "OFF" year compared to the “ON” year (p-value=0.03, at a significance level of a=0.05). Furthermore, the nocturnal period was comparatively drier, as it is shown in Figure 1, with the average vapor pressure deficit (VPD) value during the night being 0.83 kPa in 2022 and 1.06 kPa in 2021 (Table 1). In each experimental year, the highest nocturnal VPD values (i.e., values ≥2 kPa) were recorded from DOY 213 to DOY 227. Subsequently, the VPD values ranged from 0.5 kPa to 1.4 kPa during the experimental period which is considered typical for the Mediterranean region.
Regarding leaf area index (LAI), no statistically significant differences were observed between the two study years. This outcome can be ascribed to the local farmer's cultivation practice, which involves avoiding tree pruning after an "OFF" year to preserve annual shoots for fruit-bearing in the subsequent year. Specifically, the LAI values were 2.80 during the "OFF" year and 2.82 during the "ON" year. As far as the phenological development stage is concerned, the phase of "pit hardening" was extended until DOY 239, followed by the "second phase of rapid fruit development".
Soil moisture content exhibited no statistically significant variation between the two years of experimentation, exhibiting maximum values immediately after irrigations on DOY 206 in 2022 and DOY 210 in 2021. Notably, over the two experimental years, soil moisture remained consistently at nearly identical (minimum) levels (Figure 2). Moreover, no significant rainfall was observed during experimentation period, except for 2021, when a minor precipitation (2.4 mm) occurred. This precipitation did not impact soil moisture content or any other plants’ ecophysiological parameters, such as water potential, stomatal conductivity, and sap flow.
3.2. Sap Flow during the Nocturnal Period
A comparative analysis between the two experimental years (2021-“OFF” and 2022-“ON”) reveals comperatively higher 24-hour integral of sap flow values during the “ON” year (Figure 3). Additionally, significantly higher sap flow values were consistently observed during the nocturnal period (Figure 4). In particular, the average nocturnal sap flow value was 12.31 liters in the “ON” year, compared to 5.33 liters in the “OFF” year (Table 2).
3.3. Assessment of Replenishment and Depletion of Internal Storage
Data concerning the utilization of water reserves revealed that, under high soil moisture content, the depletion of internal water storage in trees during the "ON" year occurred for a period of 8 to 10 hours (Figure 5A). As available soil moisture decreased the utilization of internal storage also decreased to 7 to 8 hours (Figure 5B) reaching minimal values (Figure 5C), (utilization of internal storage for merely one hour) at the end of the experimental period (Figure 5D).
The temporal extent of internal water storage utilization during the daytime in "OFF" year trees, exhibited a different pattern. In particular, under sufficient soil moisture (Figure 5A) as well as after a decline of soil moisture occurring 14 days after irrigation (Figure 5B), the internal water reserves utilized for 4 to 5 hours, predominantly during the afternoon. Similarly, the duration of internal water reserves utilization remained relatively constant, although reduced in duration, under conditions of minimal soil moisture (Figure 5C and 5D), ranging from 2 to 3 hours.
Contrastingly, in the nocturnal phase, the differences in sap flow measurements resulted in negative values in both experimental years ("ON" and "OFF"), indicating the replenishment of internal water reserves (Figure 5A, 5B, 5C, 5D). This replenishment of internal water reserves during the night, can predominantly be attributed to the absence of water losses, due to the reduction in stomatal conductance values occuring during the nighttime. Indeed, measurements of stomatal conductance performed during the night (gs night) indicated the closure of the stomata both in the "ON" and "OFF" experimental years.
Apart from the nocturnal phase, negative values of the difference in sap flow measurements on the apex and the base of the branches were evident during the early morning and afternoon periods of the "ON" year. The average duration of these negative values exhibited a relatively increasing trend from the beginning of the experimental period, characterized by conditions of sufficient soil moisture (Figure 5A) until the point when soil moisture reached minimum levels (Figure 5C). Only in the last phase of the experimental period (Figure 5D), negative values of the difference were observed consistently throughout the 24-hour duration. Conversely, in the "OFF" year, negative values of the difference were consistently maintained from predawn until the early afternoon hours (approximately 17:00) throughout the entire experimental period (Figure 5A, 5B, 5C, 5D).
The comparative variation in the difference between the water potential at dusk (Ψdusk) and the water potential at pre-dawn (ΨPD) is demonstrated in Figure 6. At the beginning of the experimental period, the difference between Ψdusk and ΨPD was negative in both experimental years (2021-2022), primarily attributed to the increase of the ΨPD value. However, in the context of the "ON" year, this difference exhibits a continuous decline, and towards the conclusion of the experimental period, it takes positive values owing to a reduction in water potential during the night.
4. Discussion
The sap flow values of olive trees under full fruit load (2022, denoted as the "ON" year) were statistically significantly higher compared to those in the "OFF" year, under similar soil moisture conditions, throughout the experimental period (Figure 3). Furthermore, considerably higher sap flow values during the night were observed in the "ON" year, despite the fact that water vapor pressure deficit values exhibited significantly lower values compared to the "OFF" year. This is not in consistent with results reported in the literature [15,19,36,39,40] where a relatively high correlation between nocturnal sap flow (SF) and vapor pressure deficit (VPD) has been documented. It is noteworthy that, in all these cases, this positive correlation occurred provided that leaf stomata remained relatively open during the night period. However, this was not evident in our results where the results of the performed measurements of stomatal conductance imply that the stomata remained closed during the night. This obviously suggests that any variation in VPD value could not affect nocturnal sap flow significantly, or in other words, nocturnal sap flow values seem to be independent of changes in VPD. On the other hand, the above-mentioned lack of nocturnal water losses, are in line with expectations for a xerophytic species, such as olive, which is well known for its remarkable capacity to tightly regulate water losses in order to withstand drought conditions [41,42,43]. This is also supported by the well-known unique leaf anatomical features of olive trees, characterized by a thick waxy cuticle and small sunken stomata covered by trichomes on the lower leaf surface [44,45]. In addition to the prevention of water losses, nocturnal stomatal closure is also justified by the absence of solar radiation at night which renders the fixation of CO2 through photosynthesis unfeasible as well as the diminished necessity for leaf cooling via transpiration during the night renders [9]. In contrast, examples of relatively high water loss during the night, either through stomata or via the leaf cuticle, have been documented in other plant species such as eucalyptus [19], olive [4], almond [36], and grapevine [5,6].
As far as the “OFF” year is concerned, the results of the present study suggest that the utilization or replenishment of internal water reserves is a dynamic process [17] strongly affected by soil water availability and environmental factors. Indeed, trees exhibited a minor decrease of the duration of internal water reserve replenishment which ranged from 12 hours at the onset (Figure 5A) to 8 hours at the end of the drying cycle (Figure 5D). This decrease could be attributed either to the continuously reduced soil moisture levels and/or to the typical transition to more favorable environmental conditions i.e., lower VPD values occurred at the end of the drought cycle, which in turn facilitate more rapid replenishment. Furthermore, in the "OFF" year the replenishment of internal water reserves during the daytime (Figure 5) potentially accounts for the comparatively less intense replenishment observed during the nocturnal period, as evidenced by the statistically significantly lower nighttime sap flow values (Figure 4). However, this finding contradicts the results reported by Phillips et al., 2010 [39], who argued that a relatively higher ratio of young-to-old leaves results in a significant increase in nighttime sap flow. In the current context, during the "OFF" year (2021), due to the phenomenon of alternate bearing, more young shoots and consequently, more young leaves, were developed during the experimental period compared to the subsequent year ("ON"-2022). Nevertheless, as previously outlined, sap flow values during the "OFF" year were comparatively lower than those observed during the "ON" year under full fruit load.
Of particular interest is also the observed variation in the dynamics of replenishing internal water reserves during the “ON” year (2022). Specifically, in the initial days following irrigation (Figure 5A) the utilization of internal water reserves occurred throughout the entire daylight period, from 09:00 to 19:00 obviously due to the high transpirational water losses. Conversely, during the early morning and late afternoon, respectively, when microclimatic conditions favor transpiration less, an observable effort for replenishment of internal reserves is apparent, which is most likely facilitated by the sufficient amounts of soil moisture. Subsequently, as the water status of the plants undergoes a gradual decline, a milder replenishment of the internal water reserves occurs (Figure 5C and D). This could be attributed to two pivotal factors: a) the gradual decrease of soil moisture reserves within the active root zone, which accordingly reduce the absorption rate of water from the plants, and b) the specific phenological growth stage of the crop, that corresponds to the 'second phase of rapid fruit growth' and fruit maturity. During this phenological stage, fruits, which are considered the primary consumers of water and nutrients [22,46,47,48], are consistently supplied with water, causing a statistically significant increase of nocturnal sap flow values (Figure 4). The latter emphasizes the significance of fruit presence as a crucial factor influencing the replenishment rate of internal water reserves in olive trees due to the alteration of the sink: source ratio [46,49].
According to Phillips et al., 2010 [39], the nocturnal replenishment of internal water reserves exhibits an inverse relationship with ΨPD, a correlation consistent with the results of the present study. Specifically, during the "ON" year, there is an increased dynamic in replenishing plant’s internal water reserves during the night, which obviously resulted in lower values of ΨPD compared to Ψdusk (Figure 6). The convergence of water potential values between pre-dawn and dusk during the "ON" year (Figure 6) indicates or provide evidence that water potential does not reach equilibrium between the root system and the crown overnight. This observation highlights the olive trees' capacity to actively regulate the stem water potential gradient, thus facilitating the supply of water and mineral nutrients to the fruits [10] while minimizing water losses, by decreasing stomatal conductance during the night. Conversely, in the "OFF" year, the reduced fruit load seems to diminish the necessity for graduating water potential at night. With minimal fruit load, the demand for water supply to the fruits is correspondingly reduced, facilitating the replenishment of internal reserves, even in the daytime. This capability enables olive trees to prevent water column breaks and embolism formation in the xylem vessels, even under low water potential values [50]. This is in accordance with the present study's findings, where consistently higher values of ΨPD compared to Ψdusk were evident throughout the experimental period (Figure 6).
5. Conclusions
This investigation examined the dynamics of replenishing internal water reserves in olive trees under varying fruit loads. The study results reveal that this process is responsive to soil moisture conditions but is primarily influenced by fruit load. The regulation of fruit water supply was mediated by the gradient of stem water potential values during the nocturnal period. This modulation in water potential promoted a significantly heightened rate of nocturnal sap flow, consistently more pronounced in plants with full fruit load, irrespective of soil moisture or water vapor pressure deficit.
Author Contributions
Conceptualization, E.K., A.Z.; methodology, E.K., A.Z. and A.P.; validation, E.K., A.Z. and A.P.; curation, E.K. and A.Z.; writing—original draft preparation, E.K.; writing—review and editing, E.K., A.Z. and A.P.; visualization, E.K., A.Z., A.P., and V.T.; supervision, A.Z, A.P. All authors have read and agreed to the published version of the manuscript.
Funding
This research received no external funding.
Data Availability Statement
Data are available upon request to the corresponding author.
Conflicts of Interest
The authors declare no conflicts of interest.
References
- Sillmann, J.; Kharin, V.V.; Zwiers, F.W.; Zhang, X.; Bronaugh, D. Climate Extremes Indices in the CMIP5 Multimodel Ensemble: Part 2. Future Climate Projections. Journal of Geophysical Research: Atmospheres 2013, 118, 2473–2493. [Google Scholar] [CrossRef]
- Caird, M.A.; Richards, J.H.; Hsiao, T.C. Significant Transpirational Water Loss Occurs throughout the Night in Field-Grown Tomato. Functional Plant Biology 2007, 34, 172–177. [Google Scholar] [CrossRef]
- Sadok, W.; Jagadish, S.V.K. The Hidden Costs of Nighttime Warming on Yields. Trends Plant Sci 2020, 25, 644–651. [Google Scholar] [CrossRef]
- Brito, C.; Dinis, L.-T.; Ferreira, H.; Moutinho-Pereira, J.; Correia, C. The Role of Nighttime Water Balance on Olea Europaea Plants Subjected to Contrasting Water Regimes. J Plant Physiol 2018, 226, 56–63. [Google Scholar] [CrossRef]
- Escalona, J.M.; Fuentes, S.; Tomás, M.; Martorell, S.; Flexas, J.; Medrano, H. Responses of Leaf Night Transpiration to Drought Stress in Vitis Vinifera L. Agric Water Manag 2013, 118, 50–58. [Google Scholar] [CrossRef]
- Dayer, S.; Herrera, J.C.; Dai, Z.; Burlett, R.; Lamarque, L.J.; Delzon, S.; Bortolami, G.; Cochard, H.; Gambetta, G.A. Nighttime Transpiration Represents a Negligible Part of Water Loss and Does Not Increase the Risk of Water Stress in Grapevine. Plant Cell Environ 2021, 44, 387–398. [Google Scholar] [CrossRef] [PubMed]
- Howard, A.R.; Donovan, L.A. Helianthus Nighttime Conductance and Transpiration Respond to Soil Water But Not Nutrient Availability. Plant Physiol 2007, 143, 145–155. [Google Scholar] [CrossRef] [PubMed]
- de Dios, V.R.; Roy, J.; Ferrio, J.P.; Alday, J.G.; Landais, D.; Milcu, A.; Gessler, A. Processes Driving Nocturnal Transpiration and Implications for Estimating Land Evapotranspiration. Sci Rep 2015, 5, 10975. [Google Scholar] [CrossRef]
- Caird, M.A.; Richards, J.H.; Donovan, L.A. Nighttime Stomatal Conductance and Transpiration in C3 and C4 Plants. Plant Physiol 2007, 143, 4–10. [Google Scholar] [CrossRef] [PubMed]
- Scholz, F.G.; Bucci, S.J.; Goldstein, G.; Meinzer, F.C.; Franco, A.C.; Miralles-Wilhelm, F. Removal of Nutrient Limitations by Long-Term Fertilization Decreases Nocturnal Water Loss in Savanna Trees. Tree Physiol 2007, 27, 551–559. [Google Scholar] [CrossRef] [PubMed]
- Daley, M.J.; Phillips, N.G. Interspecific Variation in Nighttime Transpiration and Stomatal Conductance in a Mixed New England Deciduous Forest. Tree Physiol 2006, 26, 411–419. [Google Scholar] [CrossRef]
- Donovan, L.; Linton, M.; Richards, J. Predawn Plant Water Potential Does Not Necessarily Equilibrate with Soil Water Potential under Well-Watered Conditions. Oecologia 2001, 129, 328–335. [Google Scholar] [CrossRef]
- Kozlowski, T.; Pallardy, S. Transpiration and Plant Water Balance. In Physiology of Woody Plants; Kozlowski, T.T., Pallardy, S.G., Eds.; Academic Press: San Diego, California, USA, 1997; pp. 294–296. [Google Scholar]
- Huang, C.-W.; Domec, J.-C.; Ward, E.J.; Duman, T.; Manoli, G.; Parolari, A.J.; Katul, G.G. The Effect of Plant Water Storage on Water Fluxes within the Coupled Soil–Plant System. New Phytologist 2017, 213, 1093–1106. [Google Scholar] [CrossRef]
- Fang, W.; Lu, N.; Zhang, Y.; Jiao, L.; Fu, B. Responses of Nighttime Sap Flow to Atmospheric and Soil Dryness and Its Potential Roles for Shrubs on the Loess Plateau of China. Journal of Plant Ecology 2018, 11, 717–729. [Google Scholar] [CrossRef]
- Mitchell, P.J.; Veneklaas, E.J.; Lambers, H.; Burgess, S.S.O. Using Multiple Trait Associations to Define Hydraulic Functional Types in Plant Communities of South-Western Australia. Oecologia 2008, 158, 385–397. [Google Scholar] [CrossRef]
- Goldstein, G.; Andrade, J.L.; Meinzer, F.C.; Holbrook, N.M.; Cavelier, J.; Jackson, P.; Celis, A. Stem Water Storage and Diurnal Patterns of Water Use in Tropical Forest Canopy Trees. Plant Cell Environ 1998, 21, 397–406. [Google Scholar] [CrossRef]
- Steppe, K.; Lemeur, R. An Experimental System for Analysis of the Dynamic Sap-Flow Characteristics in Young Trees: Results of a Beech Tree. CSIRO Publishing 2004, 31, 83–92. [Google Scholar] [CrossRef]
- Zeppel, M.; Tissue, D.; Taylor, D.; Macinnis-Ng, C.; Eamus, D. Rates of Nocturnal Transpiration in Two Evergreen Temperate Woodland Species with Differing Water-Use Strategies. Tree Physiol 2010, 30, 988–1000. [Google Scholar] [CrossRef] [PubMed]
- Yu, T.; Feng, Q.; Si, J.; Mitchell, P.J.; Forster, M.A.; Zhang, X.; Zhao, C. Depressed Hydraulic Redistribution of Roots More by Stem Refilling than by Nocturnal Transpiration for Populus Euphratica Oliv. in Situ Measurement. Ecol Evol 2018, 8, 2607–2616. [Google Scholar] [CrossRef] [PubMed]
- Moriana, A.; Orgaz, F.; Pastor, M.; Fereres, E. Yield Responses of a Mature Olive Orchard to Water Deficits. Journal of the American Society for Horticultural Science jashs 2003, 128, 425–431. [Google Scholar] [CrossRef]
- Kokkotos, E.; Zotos, A.; Patakas, A. The Ecophysiological Response of Olive Trees under Different Fruit Loads. Life 2024, 14, 128. [Google Scholar] [CrossRef] [PubMed]
- Naor, A.; Schneider, D.; Ben-Gal, A.; Zipori, I.; Dag, A.; Kerem, Z.; Birger, R.; Peres, M.; Gal, Y. The Effects of Crop Load and Irrigation Rate in the Oil Accumulation Stage on Oil Yield and Water Relations of “Koroneiki” Olives. Irrig Sci 2013, 31, 781–791. [Google Scholar] [CrossRef]
- Bustan, A.; Dag, A.; Yermiyahu, U.; Erel, R.; Presnov, E.; Agam, N.; Kool, D.; Iwema, J.; Zipori, I.; Ben-Gal, A. Fruit Load Governs Transpiration of Olive Trees. Tree Physiol 2016, 36, 380–391. [Google Scholar] [CrossRef] [PubMed]
- Goldhamer, D.A. Regulated Deficit Irrigation for California Canning Olives. Acta Hortic 1999, 369–372. [Google Scholar] [CrossRef]
- Dell’Amico, J.; Moriana, A.; Corell, M.; Girón, I.F.; Morales, D.; Torrecillas, A.; Moreno, F. Low Water Stress Conditions in Table Olive Trees (Olea Europaea L.) during Pit Hardening Produced a Different Response of Fruit and Leaf Water Relations. Agric Water Manag 2012, 114, 11–17. [Google Scholar] [CrossRef]
- Steduto, P.; Hsiao, T.C.; Fereres, E.; Raes, D. Crop Yield Response to Water; FAO, 2012; ISBN 9789251072745. [Google Scholar]
- Oteros, J.; García-Mozo, H.; Vázquez, L.; Mestre, A.; Domínguez-Vilches, E.; Galán, C. Modelling Olive Phenological Response to Weather and Topography. Agric Ecosyst Environ 2013, 179, 62–68. [Google Scholar] [CrossRef]
- Rapoport, H.F.; Pérez-López, D.; Hammami, S.B.M.; Agüera, J.; Moriana, A. Fruit Pit Hardening: Physical Measurement during Olive Fruit Growth. Annals of Applied Biology 2013, 163, 200–208. [Google Scholar] [CrossRef]
- Allen, R.G.; Pereira, L.S.; Raes, D.; Smith, M. FAO Irrigation and Drainage Paper No. 56 - Crop Evapotranspiration, 1998.
- Kokkotos, E.; Zotos, A.; Patakas, A. Evaluation of Water Stress Coefficient Ks in Different Olive Orchards. Agronomy 2020, 10, 11. [Google Scholar] [CrossRef]
- Kokkotos, E.; Zotos, A.; Tsirogiannis, G.; Patakas, A. Prediction of Olive Tree Water Requirements under Limited Soil Water Availability, Based on Sap Flow Estimations. Agronomy 2021, 11. [Google Scholar] [CrossRef]
- Burgess, S.S.O.; Adams, M.A.; Turner, N.C.; Beverly, C.R.; Ong, C.K.; Khan, A.A.H.; Bleby, T.M. An Improved Heat Pulse Method to Measure Low and Reverse Rates of Sap Flow in Woody Plants. Tree Physiol 2001, 21, 589–598. [Google Scholar] [CrossRef]
- Nadezhdina, N.; Nadezhdin, V.; Ferreira, M.I.; Pitacco, A. Variability with Xylem Depth in Sap Flow in Trunks and Branches of Mature Olive Trees. Tree Physiol 2007, 27, 105–113. [Google Scholar] [CrossRef]
- Moreno, F.; Fernández, J.E.; Clothier, B.E.; Green, S.R. Transpiration and Root Water Uptake by Olive Trees. Plant Soil 1996, 184, 85–96. [Google Scholar] [CrossRef]
- Fuentes, S.; Mahadevan, M.; Bonada, M.; Skewes, M.A.; Cox, J.W. Night-Time Sap Flow Is Parabolically Linked to Midday Water Potential for Field-Grown Almond Trees. Irrig Sci 2013, 31, 1265–1276. [Google Scholar] [CrossRef]
- López-Bernal, Á.; García-Tejera, O.; Vega, V.A.; Hidalgo, J.C.; Testi, L.; Orgaz, F.; Villalobos, F.J. Using Sap Flow Measurements to Estimate Net Assimilation in Olive Trees under Different Irrigation Regimes. Irrig Sci 2015, 33, 357–366. [Google Scholar] [CrossRef]
- Hernandez-Santana, V.; Fernández, J.E.; Rodriguez-Dominguez, C.M.; Romero, R.; Diaz-Espejo, A. The Dynamics of Radial Sap Flux Density Reflects Changes in Stomatal Conductance in Response to Soil and Air Water Deficit. Agric For Meteorol 2016, 218–219, 92–101. [Google Scholar] [CrossRef]
- Phillips, N.G.; Lewis, J.D.; Logan, B.A.; Tissue, D.T. Inter- and Intra-Specific Variation in Nocturnal Water Transport in Eucalyptus. Tree Physiol 2010, 30, 586–596. [Google Scholar] [CrossRef] [PubMed]
- Fisher, J.B.; Baldocchi, D.D.; Misson, L.; Dawson, T.E.; Goldstein, A.H. What the Towers Don’t See at Night: Nocturnal Sap Flow in Trees and Shrubs at Two AmeriFlux Sites in California. Tree Physiol 2007, 27, 597–610. [Google Scholar] [CrossRef]
- Fernández, J.E. Understanding Olive Adaptation to Abiotic Stresses as a Tool to Increase Crop Performance. Environ Exp Bot 2014, 103, 158–179. [Google Scholar] [CrossRef]
- Connor, D.J. Adaptation of Olive (Olea Europaea L.) to Water-Limited Environments. Aust J Agric Res 2005, 56, 1181–1189. [Google Scholar] [CrossRef]
- Connor, D.J.; Fereres, E. The Physiology of Adaptation and Yield Expression in Olive. In Horticultural Reviews; 2005; Vol. 31, pp. 155–229. ISBN 9780470650882. [Google Scholar]
- Chartzoulakis, K.; Patakas, A.; Bosabalidis, A.M. Changes in Water Relations, Photosynthesis and Leaf Anatomy Induced by Intermittent Drought in Two Olive Cultivars. Environ Exp Bot 1999, 42, 113–120. [Google Scholar] [CrossRef]
- Bacelar, E.A.; Correia, C.M.; Moutinho-Pereira, J.M.; Gonçalves, B.C.; Lopes, J.I.; Torres-Pereira, J.M.G. Sclerophylly and Leaf Anatomical Traits of Five Field-Grown Olive Cultivars Growing under Drought Conditions. Tree Physiol 2004, 24, 233–239. [Google Scholar] [CrossRef] [PubMed]
- Blanke, M.M. Regulatory Mechanisms in Source Sink Relationships in Plants-a Review. In Proceedings of the International Symposium on Source-Sink Relationships in Plants; Ron’zhina, E.S., Blanke, M., Eds.; ISHS, Acta Horticulturae 835, 2007; pp. 13–20.
- Haouari, A.; Van Labeke, M.-C.; Steppe, K.; Mariem, F. Ben; Braham, M.; Chaieb, M. Fruit Thinning Affects Photosynthetic Activity, Carbohydrate Levels, and Shoot and Fruit Development of Olive Trees Grown under Semiarid Conditions. Functional Plant Biology 2013, 40, 1179–1186. [Google Scholar] [CrossRef] [PubMed]
- Rosati, A.; Paoletti, A.; Al Hariri, R.; Morelli, A.; Famiani, F. Resource Investments in Reproductive Growth Proportionately Limit Investments in Whole-Tree Vegetative Growth in Young Olive Trees with Varying Crop Loads. Tree Physiol 2018, 38, 1267–1277. [Google Scholar] [CrossRef] [PubMed]
- Trentacoste, E.R.; Sadras, V.O.; Puertas, C.M. Effects of the Source:Sink Ratio on the Phenotypic Plasticity of Stem Water Potential in Olive (Olea Europaea L.). J Exp Bot 2011, 62, 3535–3543. [Google Scholar] [CrossRef]
- Diaz-Espejo, A.; Fernández, J.E.; Torres-Ruiz, J.M.; Rodriguez-Dominguez, C.M.; Perez-Martin, A.; Hernandez-Santana, V. Chapter 18 - The Olive Tree Under Water Stress: Fitting the Pieces of Response Mechanisms in the Crop Performance Puzzle. In Water Scarcity and Sustainable Agriculture in Semiarid Environment; García Tejero, I.F., Durán Zuazo, V.H., Eds.; Academic Press, 2018; pp. 439–479. ISBN 978-0-12-813164-0. [Google Scholar]
Figure 1.
Comparison of average water vapor pressure deficit values during the night for the two years. (Asterisk indicates statistically significant differences (p<0.05) at a=0.05).
Figure 1.
Comparison of average water vapor pressure deficit values during the night for the two years. (Asterisk indicates statistically significant differences (p<0.05) at a=0.05).
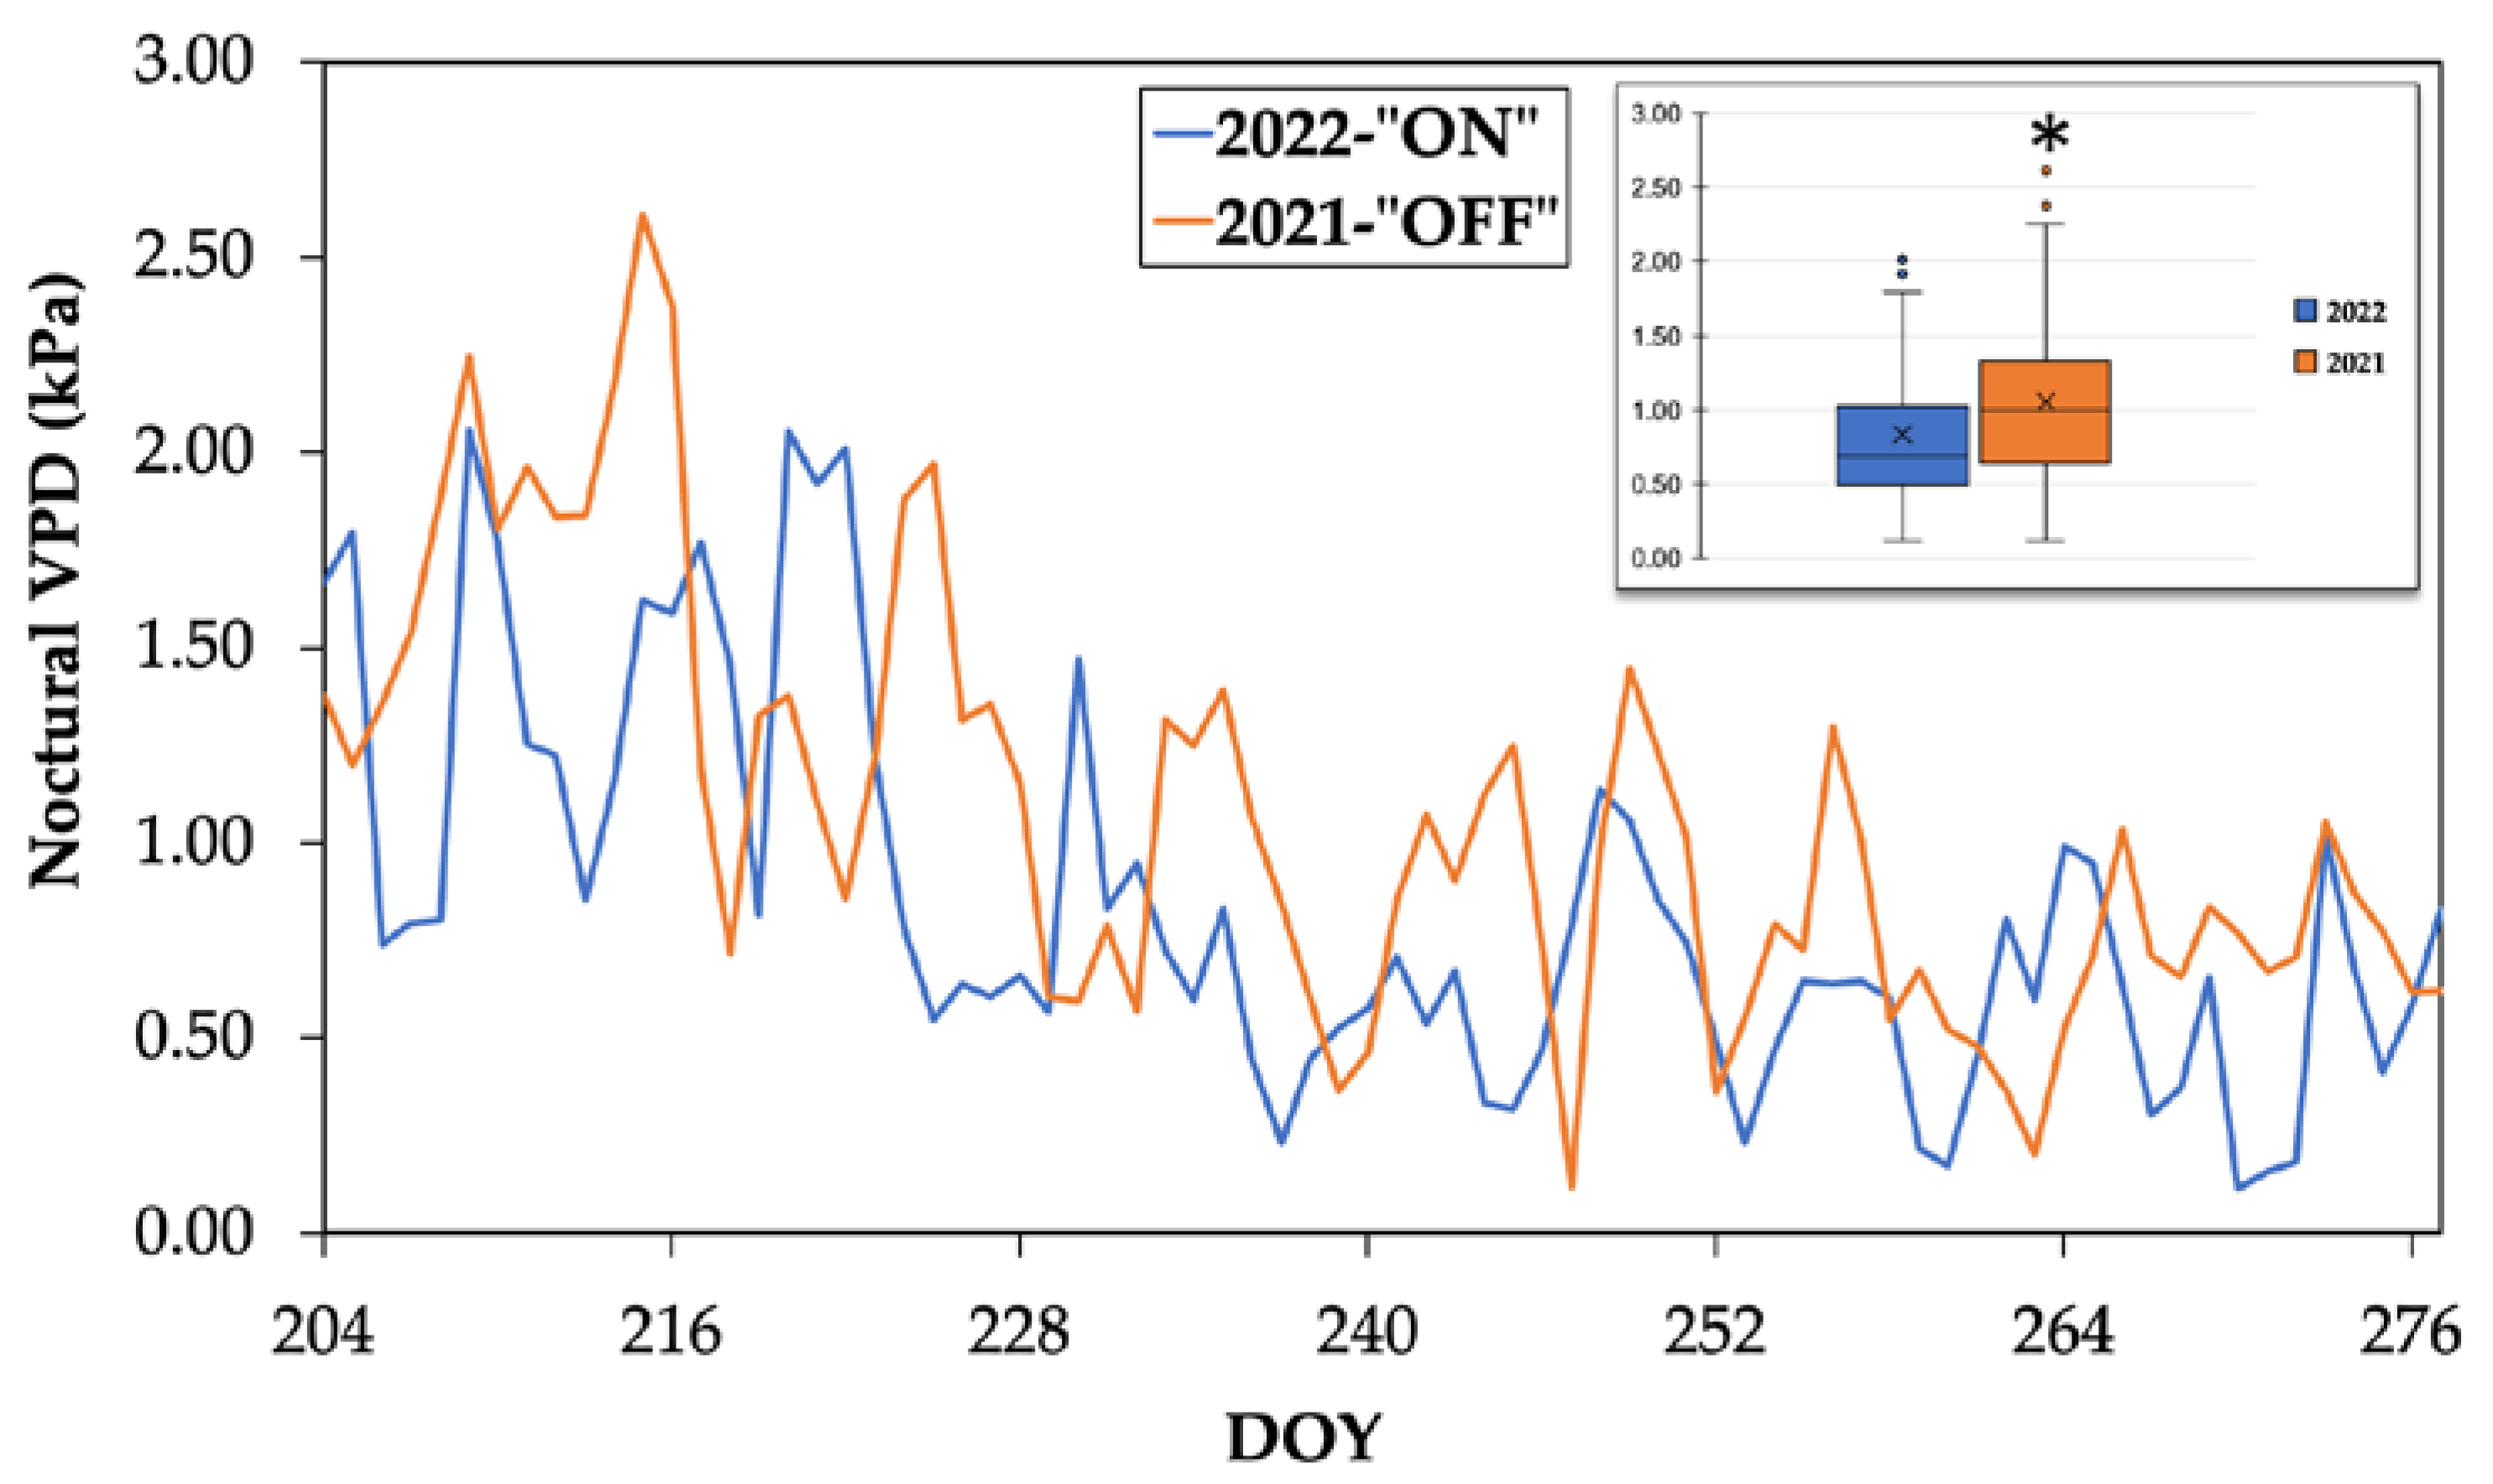
Figure 2.
Soil moisture content, irrigation and rainfall amount during the two experimental years.
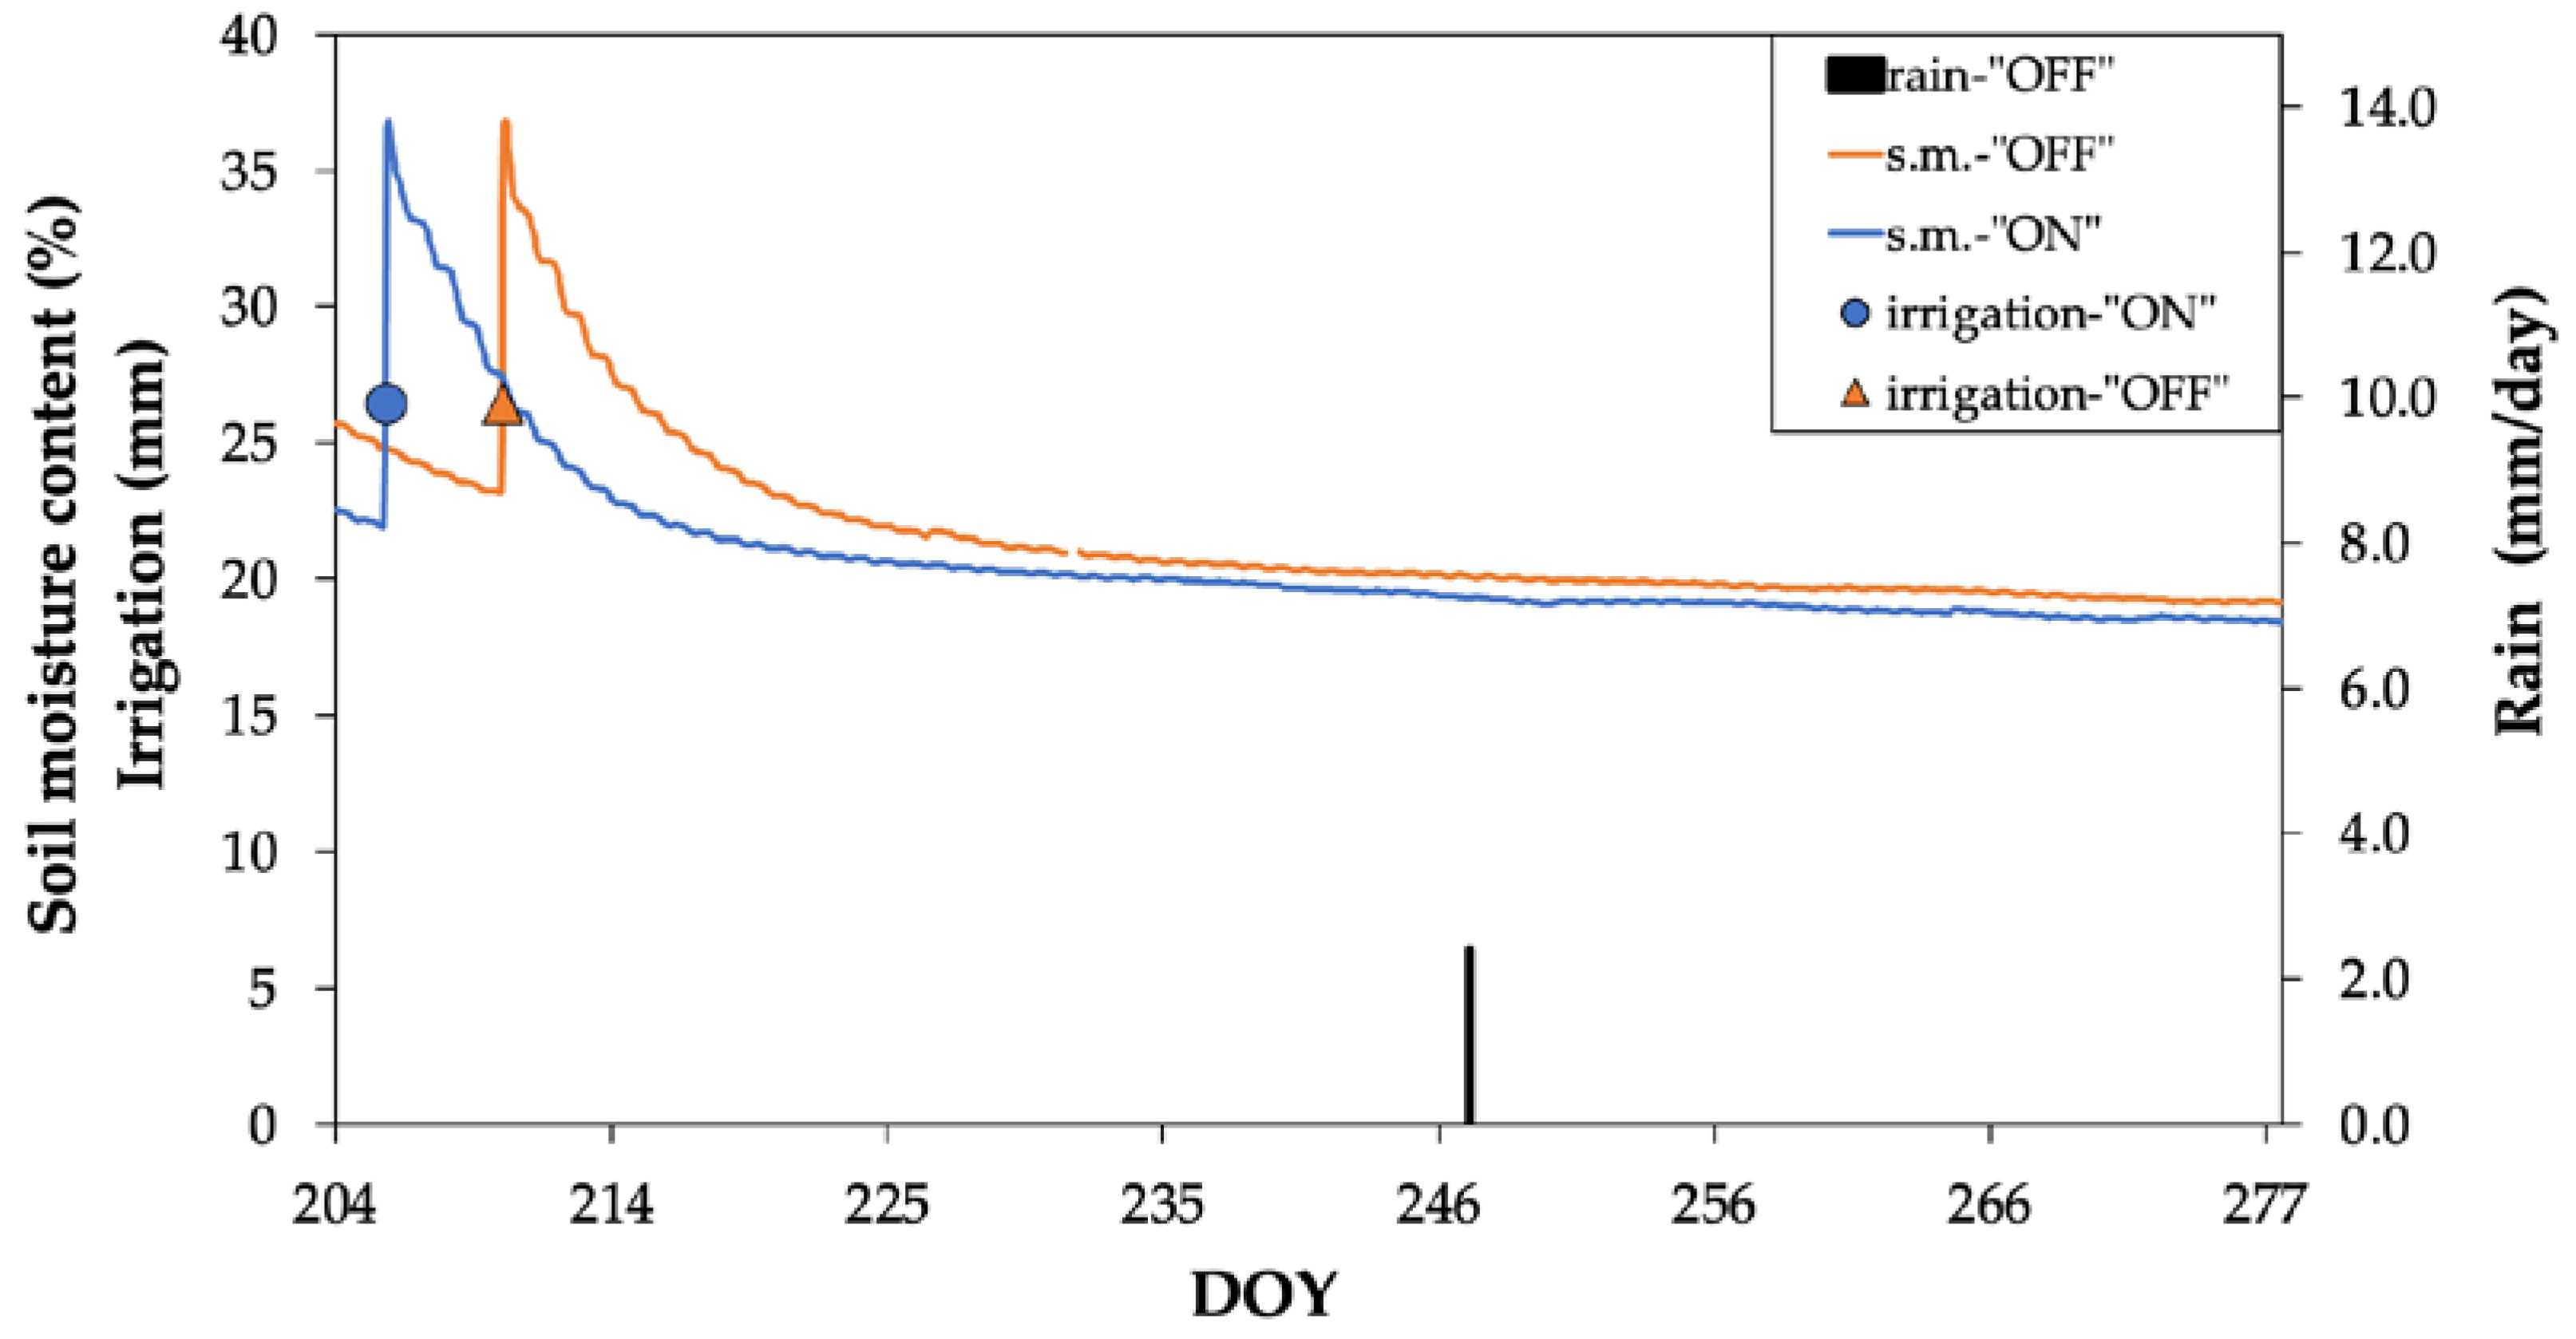
Figure 3.
Sap flow (24-h integral) dynamics during the two experimental years.
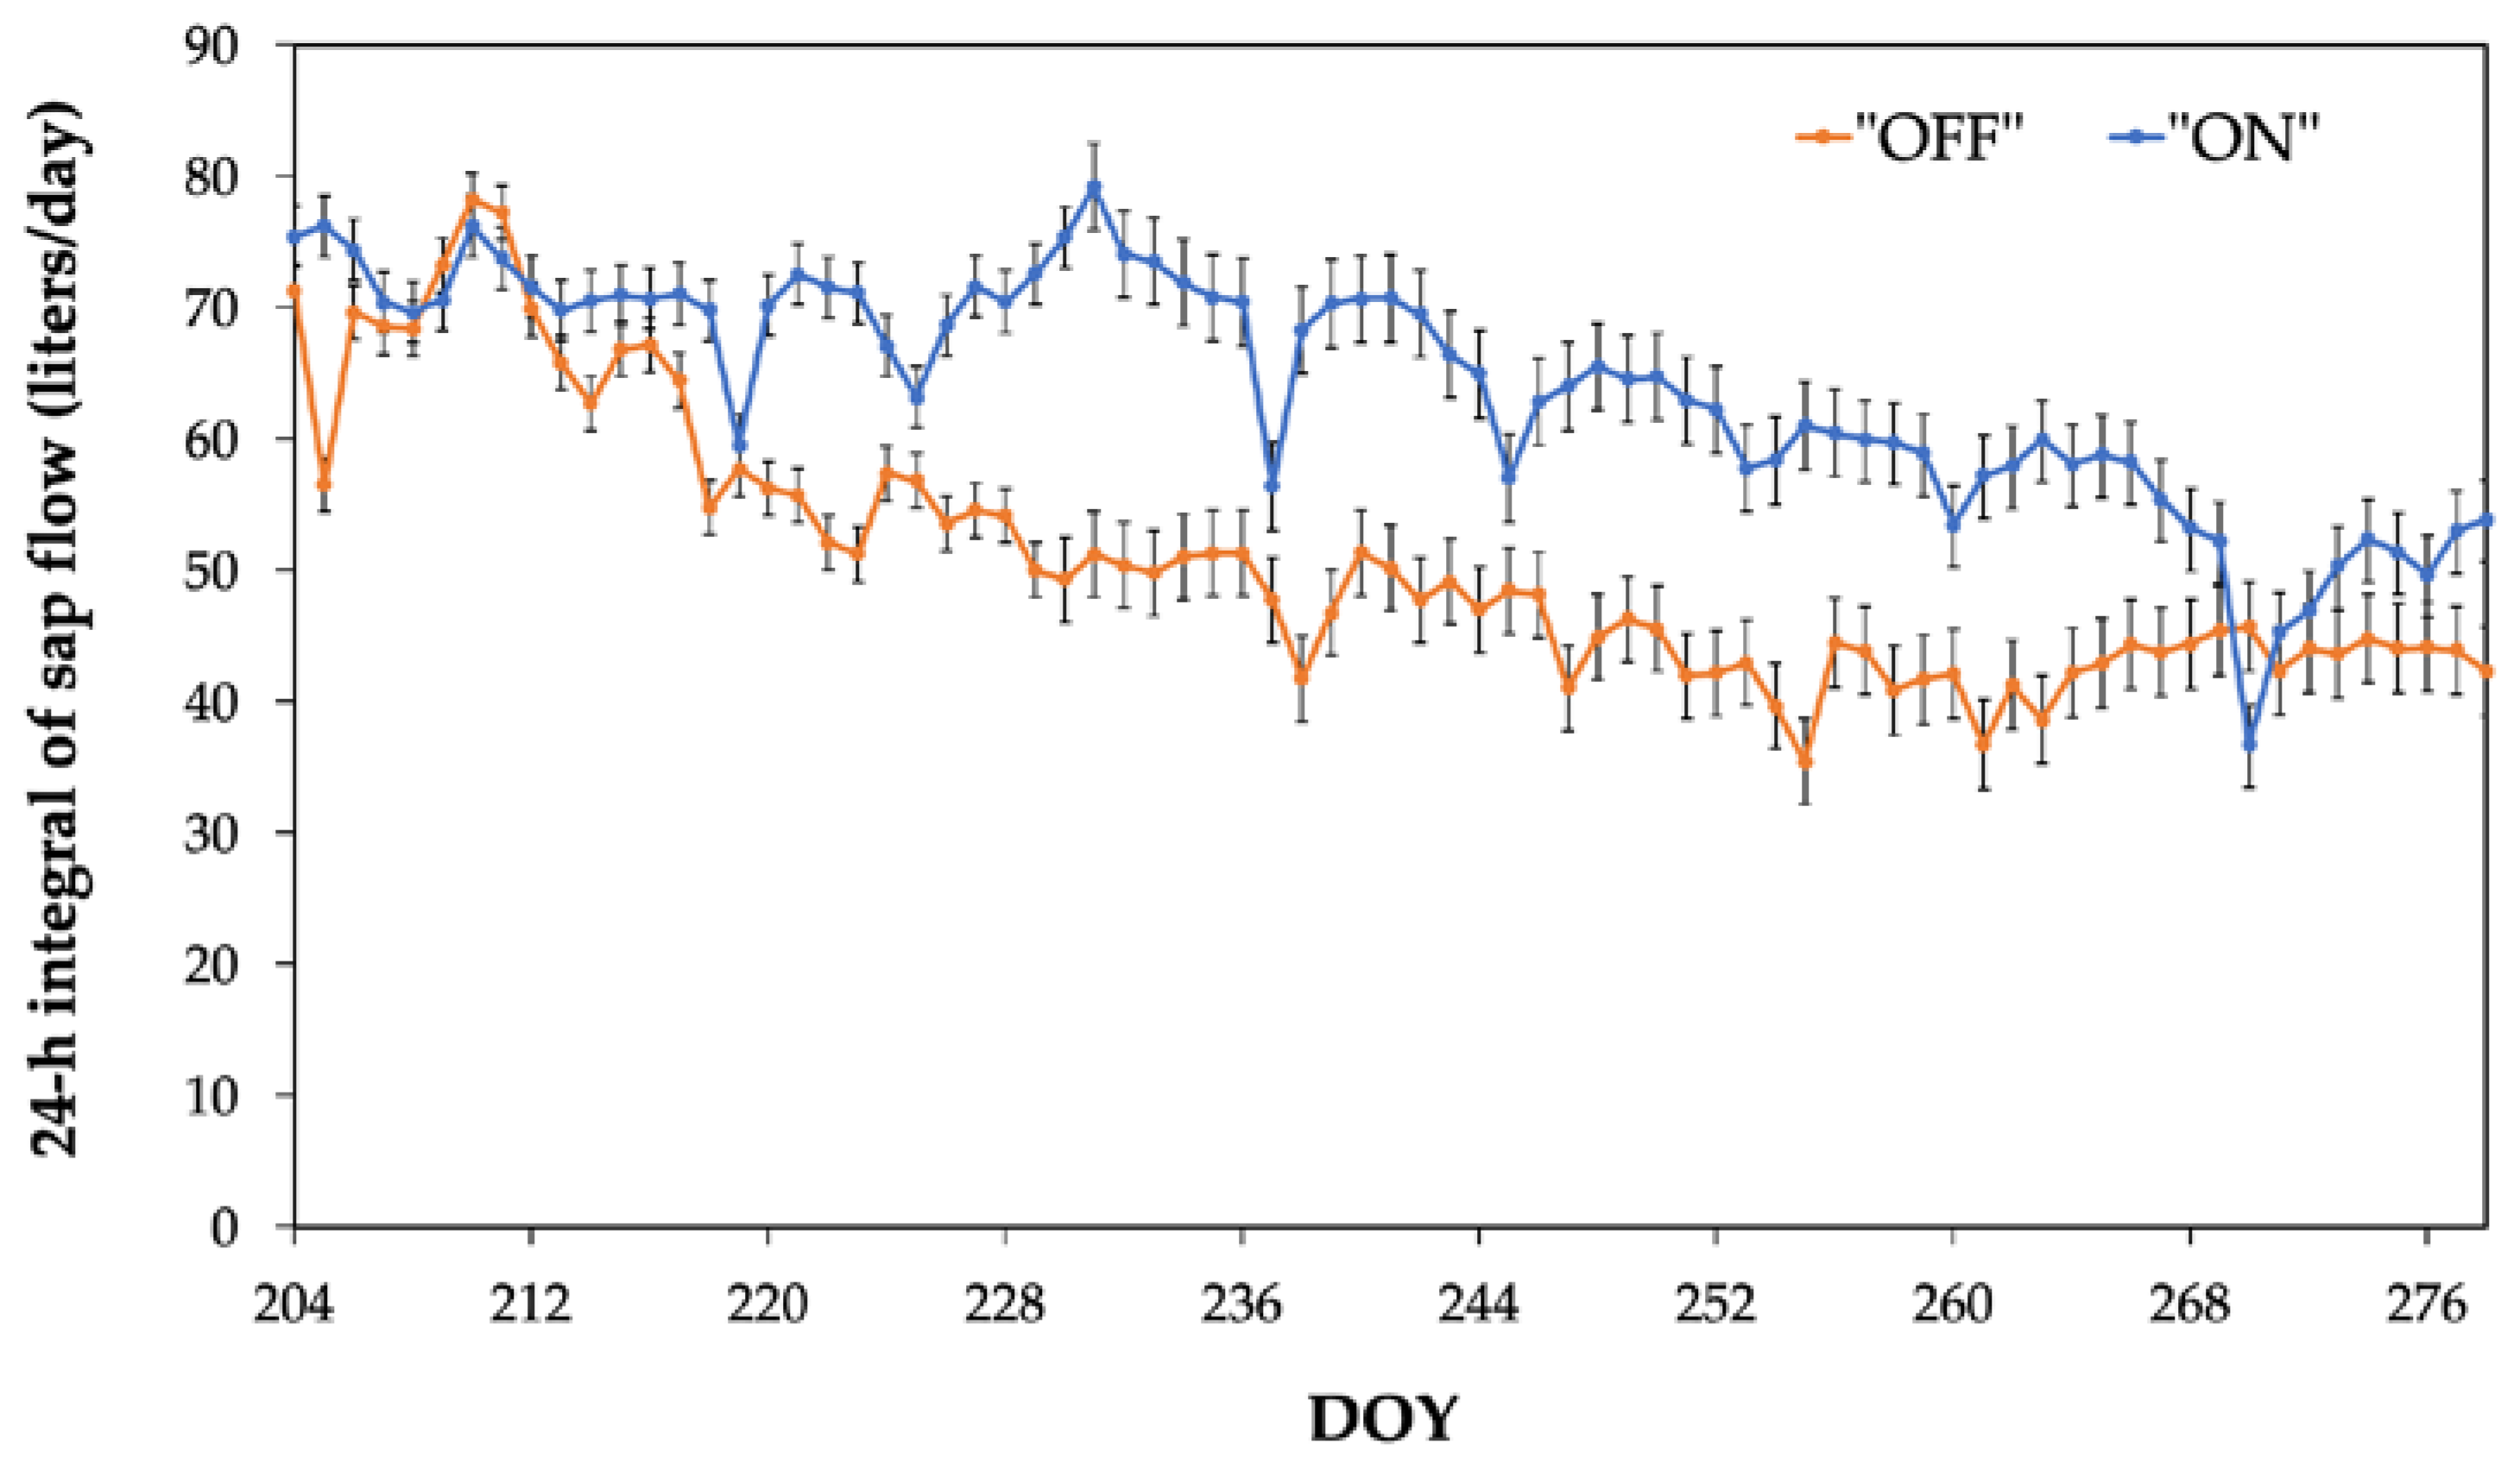
Figure 4.
Comparative variation of nocturnal sap flow over the course of the two experimental years.
Figure 4.
Comparative variation of nocturnal sap flow over the course of the two experimental years.
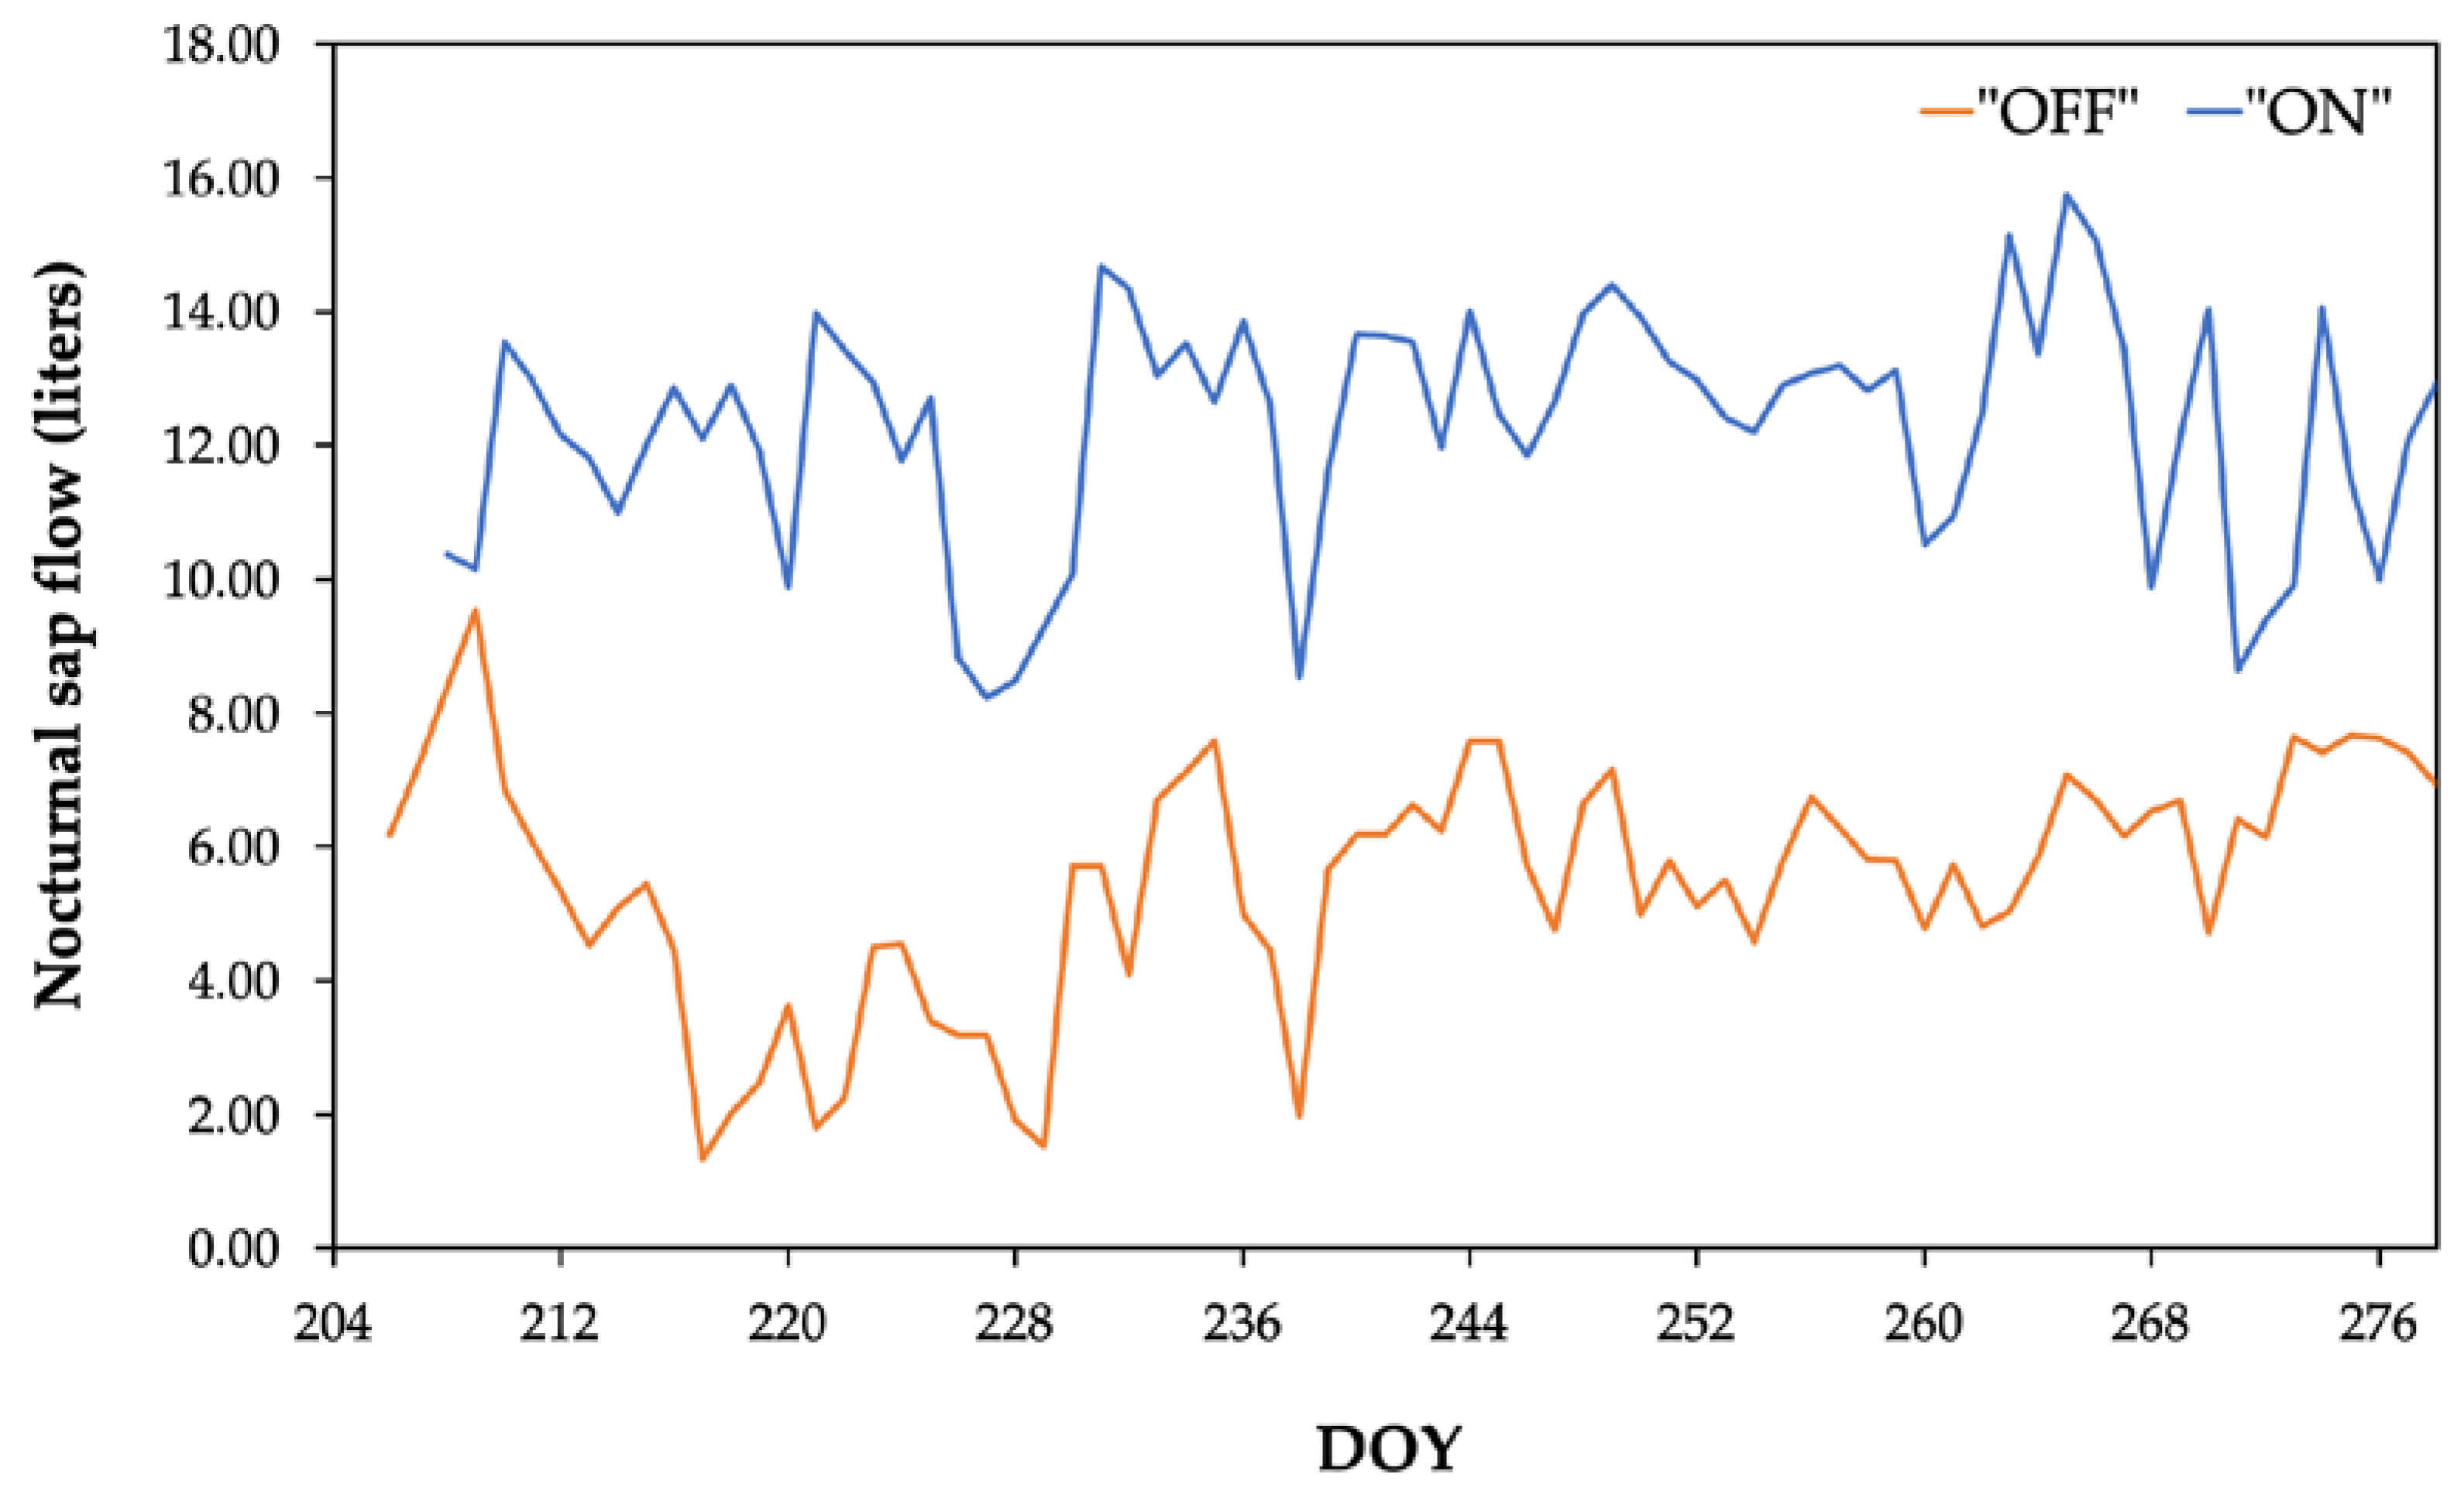
Figure 5.
Alteration in the 'crown−base' difference as measured by the sap flows during the two experimental years. Four (4) indicative cases are presented: (A) 4 days after irrigations (DAI), (B) 14 DAI, (C) 39 DAI, and (D) 60 DAI.
Figure 5.
Alteration in the 'crown−base' difference as measured by the sap flows during the two experimental years. Four (4) indicative cases are presented: (A) 4 days after irrigations (DAI), (B) 14 DAI, (C) 39 DAI, and (D) 60 DAI.
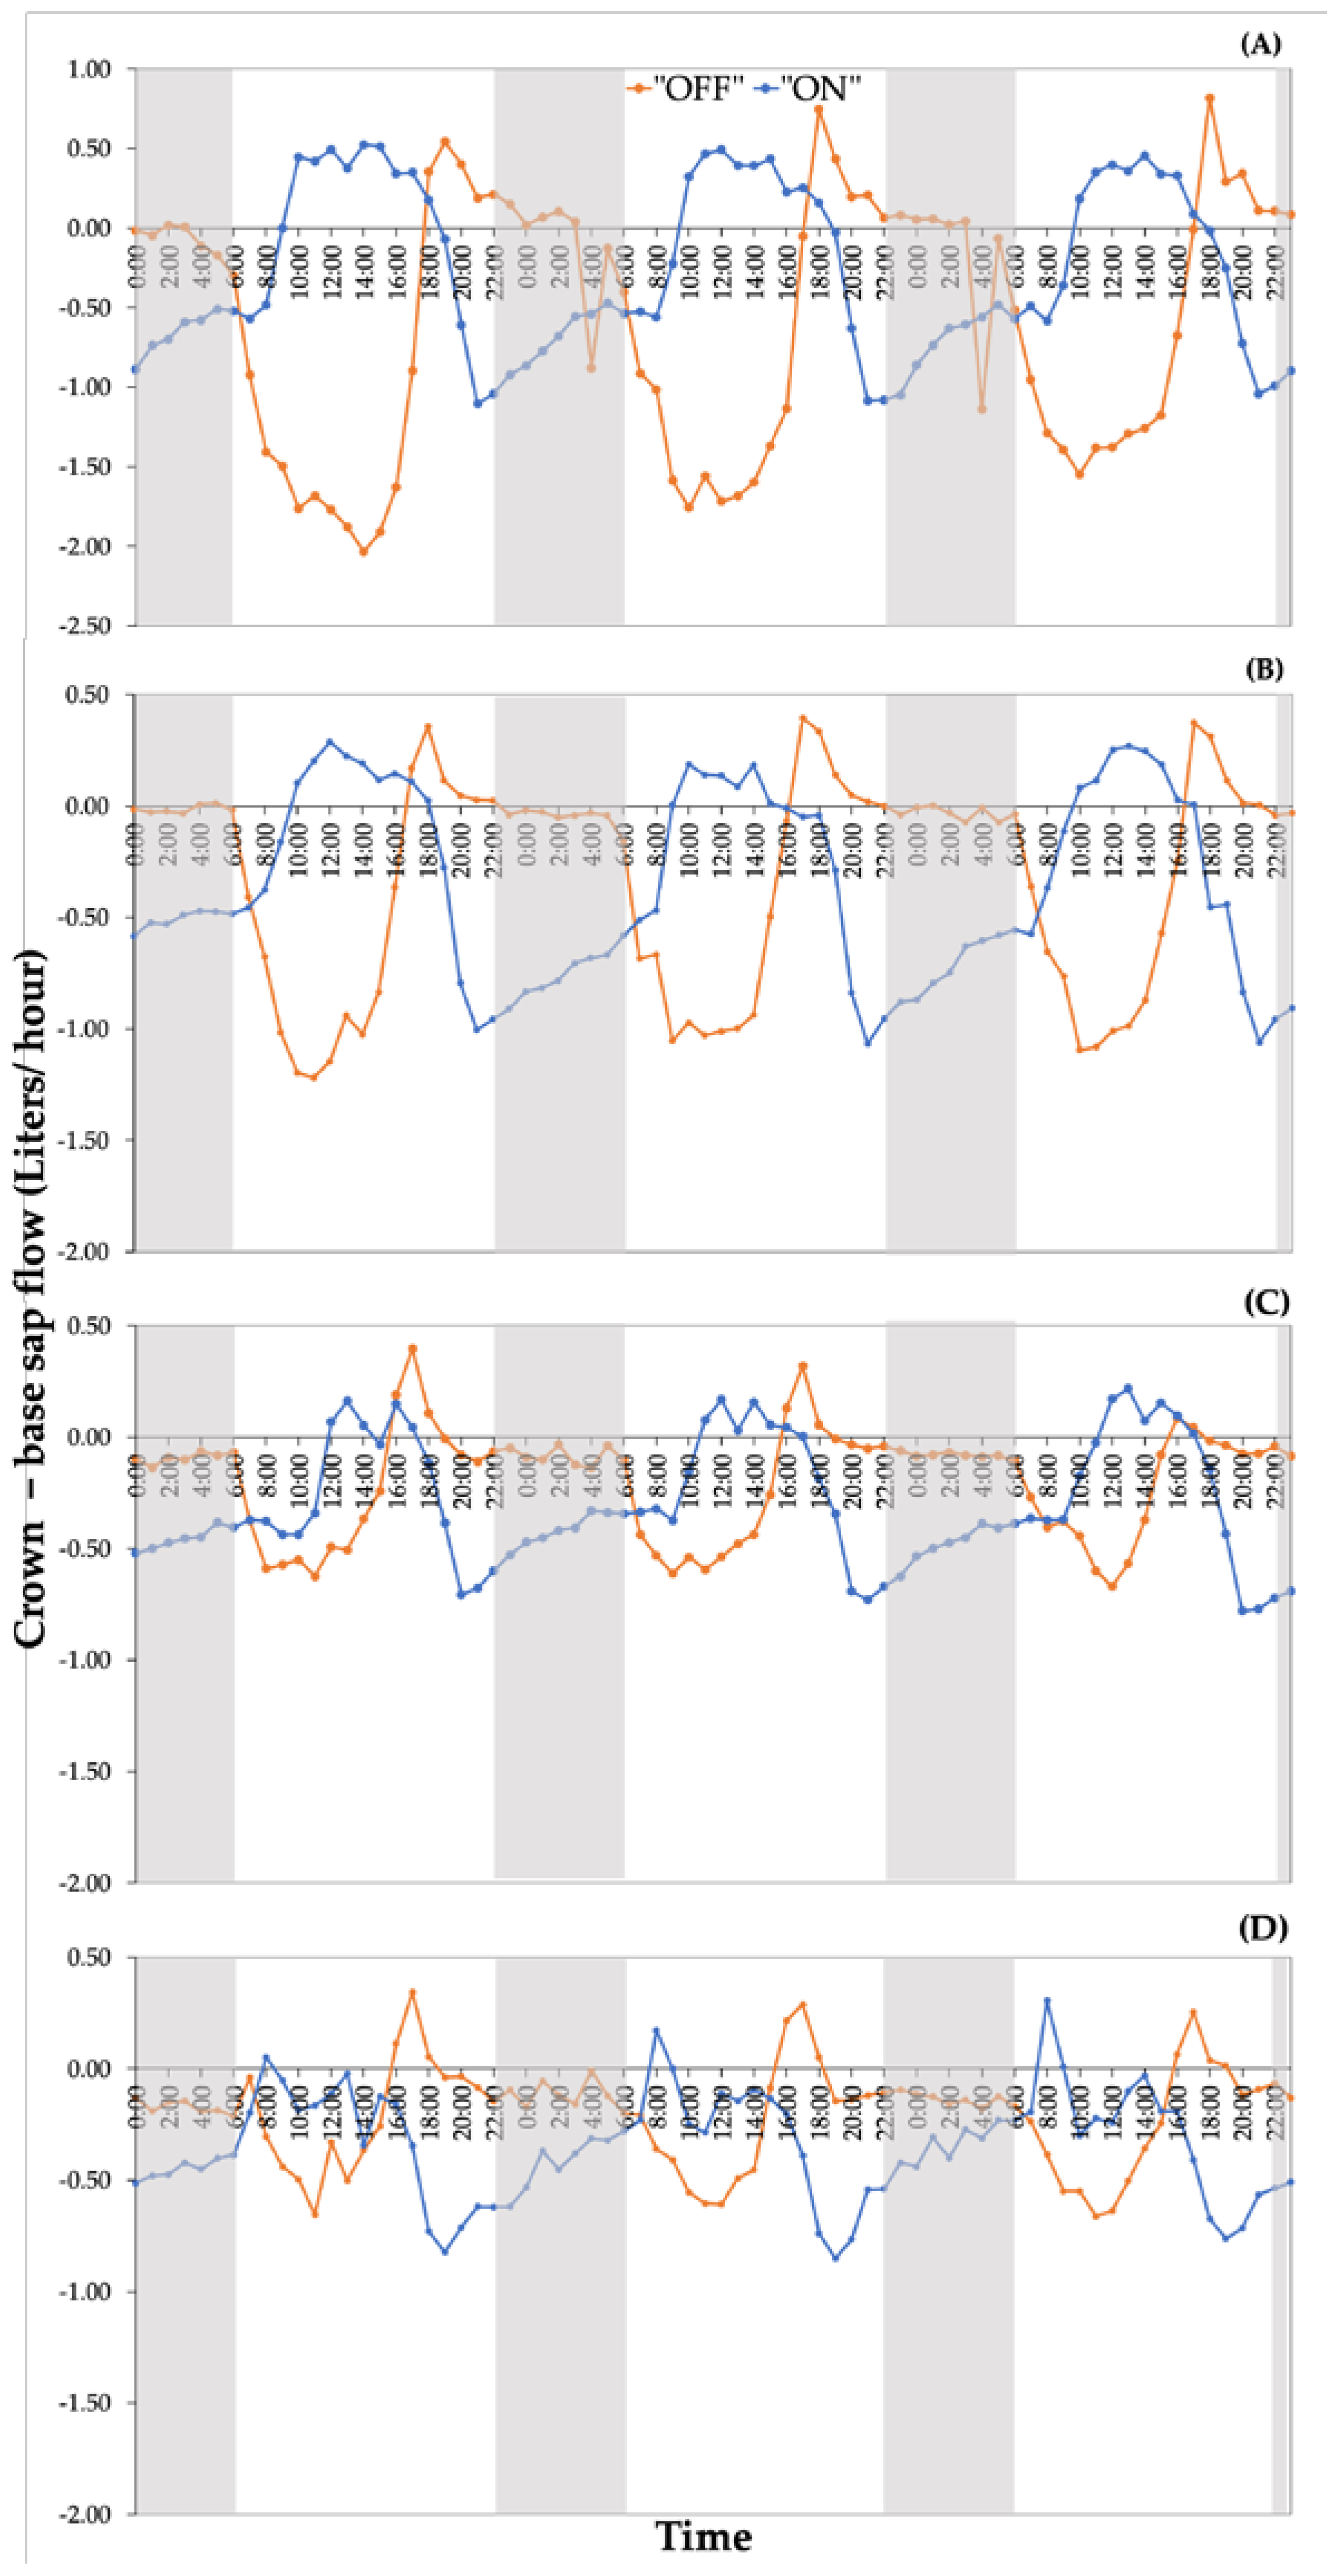
Figure 6.
Comparison of the variation in the difference between the water potential measured at dusk (Ψdusk) and pre-dawn (ΨPD). The arrow indicates the span of the ‘pit hardening’ phenological stage during the experimental period.
Figure 6.
Comparison of the variation in the difference between the water potential measured at dusk (Ψdusk) and pre-dawn (ΨPD). The arrow indicates the span of the ‘pit hardening’ phenological stage during the experimental period.
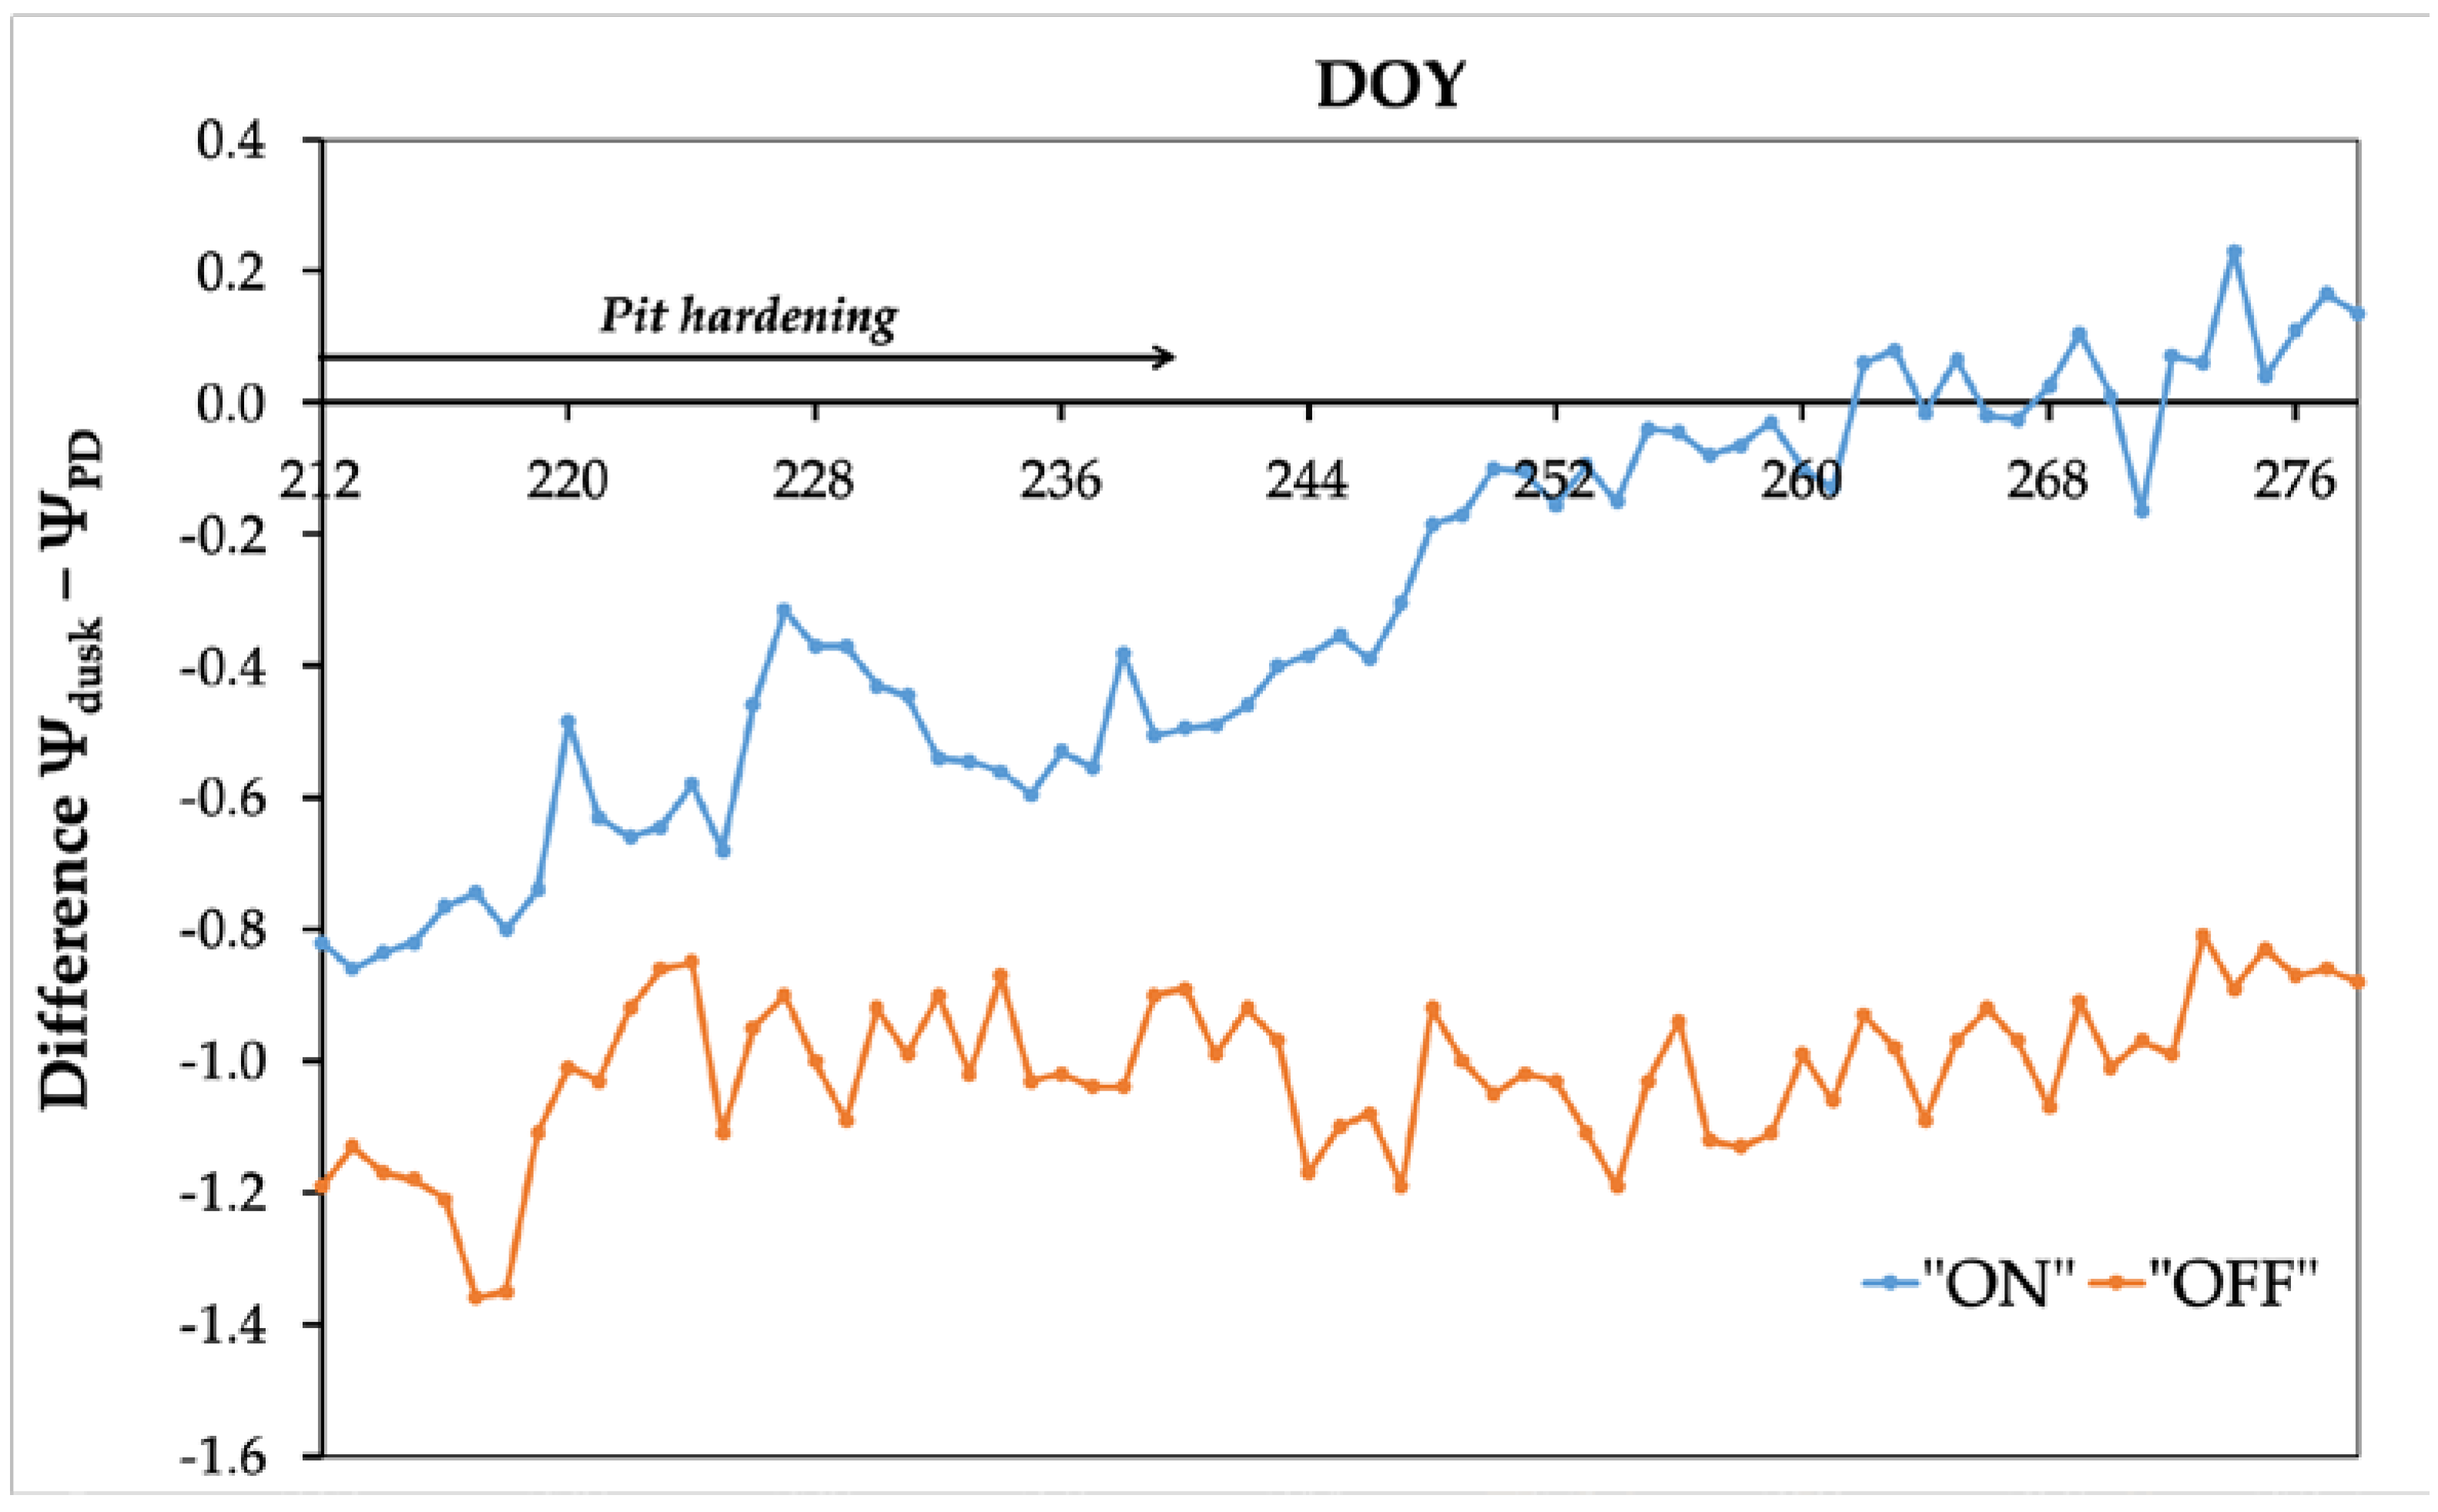

Table 1.
Values of water vapor pressure deficit during the two experimental years.
| Experimental year | Average VPD during the experimental period | Minimum VPD value | Maximum VPD value |
|---|---|---|---|
| 2021- “OFF” | 1.06±0.53 a | 0.12 | 2.61 |
| 2022- “ON” | 0.83±0.49 b | 0.11 | 2.06 |
a, b Different letters indicate statistically significant difference at a=0.05 significance level.
Table 2.
Values of water vapor pressure deficit during the two experimental years.
| Experimental year | Average SFnight during the experimental period (Liter) | Minimum SFnight value (Liter) | Maximum SFnight value (Liter) |
|---|---|---|---|
| 2021- “OFF” | 5.33±1.70 a | 1.33 | 7.67 |
| 2022- “ON” | 12.31±1.76 b | 8.23 | 15.75 |
a, b Different letters indicate statistically significant difference at a=0.05 significance level.
Disclaimer/Publisher’s Note: The statements, opinions and data contained in all publications are solely those of the individual author(s) and contributor(s) and not of MDPI and/or the editor(s). MDPI and/or the editor(s) disclaim responsibility for any injury to people or property resulting from any ideas, methods, instructions or products referred to in the content. |
© 2024 by the authors. Licensee MDPI, Basel, Switzerland. This article is an open access article distributed under the terms and conditions of the Creative Commons Attribution (CC BY) license (http://creativecommons.org/licenses/by/4.0/).
Copyright: This open access article is published under a Creative Commons CC BY 4.0 license, which permit the free download, distribution, and reuse, provided that the author and preprint are cited in any reuse.


