

Submitted:
04 March 2024
Posted:
05 March 2024
You are already at the latest version
Abstract
In the following article, we estimate the Renunciation of Healthcare Services-RHS in Italian regions in the context of the Environmental, Social and Governance-ESG model during the period 2004-2022. The data were acquired from the ISTAT-BES dataset. The data were analyzed using the following econometric techniques: Panel Data with Fixed Effects, Panel Data with Random Effects, Pooled Ordinary Least Squares-OLS, Weighted Least Square-WLS,. Results show that RHS tends to growth with the E-Component, is negatively associated to the S-Component, and positively associate with the G-Component within the ESG model. Furthermore, a clusterization with the unsupervised k-Means algorithm is presented and the results are discussed with a confrontation between optimal and suboptimal k values optimized with the Silhouette Coefficient. Finally, a confrontation among eight different machine-learning algorithms is performed to predict the future value of RHS. Outcomes show that the Simple Regression Tree is the best predictive algorithm and that the level of RHS is predicted to growth on average of 4.4% for the Italian regions. Results are critically discussed.
Keywords:
Analysis of Health Care Markets
; Health Behaviours
; Health Insurance
; Public and Private
; Health and Inequality
; Health and Economic Development
; Government Policy
; Regulation
; Public Health
1. Introduction
In the following article we take into consideration the issue of giving up healthcare services in the Italian regions in light of the Environment, Social and Governance-ESG principles. The choice of the variable analysed, i.e. RHS, appears to be particularly relevant in a country like Italy characterized by a huge gap between the southern regions and the central-northern regions. This economic gap also translates from a healthcare point of view into a smaller and less efficient offer of services to the population. The RHS variable is able to capture both of these effects: on the one hand it represents the lower income endowment of the population of southern Italy and on the other hand it represents the lower endowment of health infrastructure in Southern Italy compared to Central-Northern Italy. Therefore, since both public institutions and private organizations are increasingly affected by the ESG phenomenon, we asked ourselves whether the relationship between RHS and the ESG model. Our analysis presents a high degree of originality, in fact we believe that this analysis has not been carried out previously, and certainly has not been carried out with reference to the Italian regions. It should be considered that in the analysis of the variables of the ESG model, strictly economic variables or variables relating to productivity and the efficiency of production factors are not taken into consideration. In fact, since the positive relationship between poor economic performance and the level of RHS at a territorial level is already widely known, we decided to analyse a new set of criteria for the evaluation of RHS precisely as indicated in the ESG model.
The article continues as follows: the second section presents a very brief analysis of the literature useful for introducing the topic, the third section presents the econometric models, the fourth section show the clustering analysis with the k-Means algorithm, the fifth section contains an analysis of machine learning for prediction, the sixth section concludes.
2. Literature Review
Below we report a brief analysis of the literature relating to RHS. Since our analysis is mainly of a metric nature, the literature indicated only serves to introduce the topic.
RHS and demography. Demographic and ethnographic aspects can play a very significant role in the choice to forgo health care. In fact, people who are discriminated against for reasons of age, gender and because they belong to religious minorities could also present higher levels of RHS. Specifically, people who are subjected to discrimination on demographic and religious grounds may also be subjected to a form of socio-economic discrimination that prevents access to healthcare. In fact, the presence of social, relational and family networks is necessary to assist the population in accessing healthcare. People discriminated against on a demographic, and therefore economic, basis tend to live in peripheral places with less access to healthcare facilities. It follows that on the one hand social discrimination and on the other the lack of adequate economic means could push certain groups to be particularly inclined to give up healthcare. People who forgo healthcare are young people, women, patients with low levels of education and patients with chronic diseases [1].
RHS for economic reason. One of the main reasons for giving up healthcare services is economic discrimination. The lack of financial resources tends to reduce access to healthcare even in those countries that have a public healthcare system. The reasons that can lead people on medium-low incomes to give up health care therefore concern the economic condition in which they find themselves. For example, unemployment, having low incomes, having a single-parent family which creates financial pressure for single mothers to manage children, can push the population to give up healthcare. Obviously, not taking enough care of one's health can only worsen the economic condition of people who give up healthcare. A vicious circle therefore ensues. People with low incomes forego medical care. Giving up medical care leads to a worsening of the health condition and a further worsening of the economic-social condition. In Switzerland, approximately 30% of people belonging to the low-income social group give up healthcare for economic reasons [2]. The high costs of specialist medical care due to the mix of corruption and informal payments increases the value of RHS in Italy [3]. Economic deprivation increased the value of RHS during the lockdowns in the Covid-19 pandemic in France [4]. RHS is positively related to retirement, chronic disease, financial difficulties and long-term unemployment [5]. RHS can growth due to the lack of medication insurance as in the case of Canada [6]. RHS among pregnant woman is positively associated to poor socio-economic status in Romania [7]. Household income has a positive impact in affecting the choice to renounce to healthcare services in a comparison between French and Romanian pregnant woman [8]. Lack of financial resources together with social status increase the level of RHS in woman in Ivory Coast [9]. In south of Italy the level of RHS tends to be higher in respect to northern Italian regions.
RHS and localization. Location can play a very important role in determining the choice to forego health care. In fact, people living in peripheral areas may have fewer opportunities to access the healthcare system. In fact, peripheral areas tend to lack adequate health services. Obviously location is a consequence of economic conditions. People who have low incomes have difficulty locating themselves in central and urban areas and, being forced to live in the suburbs and rural areas, tend to give up health care much more than those who live in central and urban areas. Renunciation tends to growth in rural areas in respect to urban area such as in the case of Côte D'ivoire [10].
RHS and Covid 19. Covid 19 has increased the renunciation of healthcare services by many patients suffering from various pathologies who have had to delay healthcare treatments to benefit the treatment of Covid 19 patients. Covid 19 has therefore generated a general worsening of the health conditions of the population, especially those who require continuous care due to the presence of chronic diseases. The increase in hospitalization due to Covid 19 has increased the level of RHS for non-Covid 19 disease [11]. Lockdowns policies had a role in increasing RHS during the Covid-19 pandemic in France [12].
| Synthesis of Literature Review | |
| Topic | References |
| RHS and demography | [1] |
| RHS for economic reason | [2,3,4,5,6,7,8,9] |
| RHS and localization | [10] |
| RHS and Covid 19 | [11,12] |
| RHS and psychological disease | [13,14,15,16] |
| How to contrast RHS | [17] |
RHS, psychological diseases and social discrimination. Psychological aspects and social discrimination can have a great impact in determining the choice to forgo health care. Psychological illnesses are in fact experienced with great difficulty by patients who struggle to discuss them with friends and relatives and therefore have greater difficulty in turning to expert specialists in the sector. This condition is serious especially for young people also following the covid 19 pandemic. In fact, there has been an increase in cases of serious psychological problems in the young population which prevent them from having a responsible attitude towards taking care of their health and can lead to the renunciation of healthcare services . this condition is even more particular for some diseases which are stigmatized at a social level through discrimination. The lack of psychological and social support can inhibit the patient's ability to have access to healthcare even in systems where healthcare is public or even for medium-high per capita incomes. Depression, fatigue and anxiety can improve RHS [13]. Young adults show high levels of RHS especially for mental diseases in France [14]. Patient with HIV can renounce to health care services either due to psychological disease either to social discrimination and lack of motivational and relational support [15]. Students with eating disorders, especially bulimic eating disorders, show higher level of RHS, as in the case of France [16].
How to contrast RHS. The methodologies to combat the phenomenon of renunciation of healthcare services include, for example, the use of the healthcare mediator. Health mediation can reduce RHS as in the case of French Guyana [17]. However, it is necessary to better structure health care services also through new methodologies that can make the importance of prevention and medical care understood, especially by the population discriminated against for economic-social reasons. This activity could also be carried out with the help of new information technologies, i.e. through digitization and the applications of data science and artificial intelligence. There is also an advantage in social and public terms in monitoring the population that has little access to health care, in fact in this case it would be possible to reduce the manifestation of those diseases that are very costly for health systems such as diabetes, hypertension, and chronic conditions.
3. The Econometric Model
Below we present three econometric equations, each of which was estimated using four econometric techniques. The choice to use three econometric equations was motivated by the need to precisely evaluate the impact of the E, S and G components within the RHS. This choice was made both to use the large database offered by ISTAT-BES data more effectively and also to evaluate the impact of the individual components of the ESG model in terms of RHS. The econometric techniques used are Panel Data with Fixed Effects Panel Data with Random Effects, Pooled Ordinary Least Squares-OLS and Weighted Least Squares-WLS. The use of four different metric systems was necessary to verify the consistency of the regression results both from the point of view of statistical significance and also from the point of view of the relationships, positive or negative, between the variables analyzed. The data used refers to the Italian regions in the period between 2004 and 2022. Furthermore, for each variable we have carried out further in-depth analysis, highlighting, with practical examples, which regions present the most relevant correlations in order to propose a more solid metric analysis.
3.1. The Relationship between RHS and the E-Component within the ESG Model
Below we present an econometric analysis aimed at identifying the impact of the E-Environment components within the ISTAT-BES dataset with respect to the RHS variable. In particular, we analyzed the following equation, namely:
Where e . Results are indicated in the Table 1.
The analysis shows that the RHS value is positively associated to the following variables, namely:
- DRMH: is the number of permanent exhibition structures per 100 km2 (museums, archaeological areas and monuments open to public), weighted by the number of visitors. The weight of each structure is assumed to be equal to (Vi/VM), where Vi is the number of visitors to the facility, M is the total number of structures and V is the total number of visitors. There is a positive relationship between the DRMH value and the RHS value. Many regions that have a high RHS value also have a high DRMH value such as Lazio with an RHS value equal to an amount of 13.2 and DRMH equal to 4.09, Umbria with an RHS value equal to 13 and a DRMH value equal to 1.4, Lombardy with an RHS value equal to 12.2 units and a DRMH value equal to 1.57, Valle D'Aosta with an RHS value equal to 12.1 units and a DRMH value of 1.38 units, Piedmont with an RHS value of 11.6 units and a DRMH value of 1.18 units. This positive relationship is mainly due to the presence of some regions which have a significant artistic-museum heritage and which also have a high value in terms of RHS such as Lazio. In effect, Lazio is both one of the regions with the highest level of renunciation of healthcare which is also one of the regions with the greatest endowment of museums and artistic heritage.
- IFF: is the forest area (wooded and non-wooded) affected by fire for 1,000 km2. Esiste una relazione positive tra il valore di IFF ed il valore di RHS. Infatti possiamo notare che molte regioni che hanno un valore elevato di RHS hanno anche un valore elevato di IFF come per esempio la Sardegna che ha un valore di RHS pari a 18,3 e IFF pari a 10,7, l’Abruzzo con un valore corrispondente di 13,8 e 2,8, Lazio con 13,2 e 4,4, Molise con 13,2 unità e 5,7.
- LMWS: is the percentage of the overall volume of total water losses in municipal drinking water distribution networks (difference between volume fed into the network and volume authorized) on the total water injected. There is a positive relationship between LMWS and RHS. Nello specifico possiamo notare che vi sono delle regioni che hanno un livello elevato sia di LMWS che di RHS come per esempio l’Abruzzo con un valore di LMWS di 59,8 e RHS di 13,8, il Molise con LMWS pari a 51,8 e RHS pari a 13,2, Sardegna con LMWS pari a 51,3 unità e RHS pari a 18,3, Lazio con LMWS pari a 49,7 e RHS pari a 13,2, e Umbria con LMWS pari a 49,1 e RHS pari a 13, Umbria con LMWS pari a 49,1 unità e RHS pari a 13.
- CALB: is the percentage of people aged 14 and over who believe the extinction of plant/animal species among the 5 concerns priority environmental issues. There is a positive relationship between CALB and RHS. Some regions that have a high average value of CALB also have a high average value of RHS. For example, Sardinia with CALB equal to 30.1 and RHS equal to 18.3, Valle d'Aosta with CALB equal to 28.9 units and RHS equal to 12.1, Abruzzo with CALB equal to 28.4 and RHS equal at 13.8, Umbria with CALB equal to 27.7 and RHS equal to 13, Piedmont with CALB equal to 26.5 units and RHS equal to 11.6, Lombardy with CALB equal to 26.2 and RHS equal to 12.2.
The data also shows that the value of RHS is negatively associated to the following variables, namely:
- MCE: is the level of payments on account of competence for protection and enhancement of cultural goods and activities, in euros per capita. There is a negative relationship between the MCE value and the RHS value. In fact we can see that many regions that have an MCE value above the average also have a RHS value below the average. For example, if we take 2021 into consideration we note that: Trentino Alto Adige has an MCE value of 46.9 and RHS equal to 7.3, Friuli Venezia Giulia has an MCE value of 32.5 units and RHS equal to 10.6, Emilia Romagna has an MCE value of 31.1 units and RHS equal to 11.2 units, Liguria with an MCE value of 22.8 and RHS equal to 11, Marche with MCE equal to 20, 3 and RHS equal to 11.3 and Veneto with an MCE value of 19.2 and RHS equal to 9.4.
- WT: is the percentage share of polluting loads flowing into secondary plants or advanced, in equivalent inhabitants, compared to the loads urban totals (Aetu) generated. There is a negative relationship between the WT value and the RHS value. Specifically we can see that many regions that have a higher than average WT value also have a lower than average RHS value. Among these regions we can identify the following: Trentino Alto Adige with a WT value equal to 74 and an RHS value equal to 5.33, Emilia Romagna with a WT value equal to 67 and an RHS value equal to 7, Piedmont with a WT value equal to 63 and a RHS value equal to 8.38, Basilicata with a WT value equal to 62 and a RHS value equal to 8.37, Campania with a WT value equal to 60 and a RHS value equal to 7.33, Lombardy with a WT value equal to 59 and an RHS value equal to 7.57, Valle d'Aosta with a WT value equal to 58 and an RHS value equal to 7, 55.
- CACC: is the percentage of people aged 14 and over who consider the change climate or the increase in the greenhouse effect and the hole of ozone among the 5 priority environmental concerns. Esiste una relazione negative tra il valore di CACC ed il valore di RHS. Per esempio se prendiamo in considerazione il 2021 possiamo notare che vi sono varie regioni che hanno un valore di CACC superiore alla media ed un valore di RHS inferiore alla media come per esempio: Toscana con un valore di CACC pari a 70,1 e RHS pari a 8,3, Marche con CACC pari a 69,3 e RHS pari a 11,3, Veneto con un valore di CACC pari a 68,6 unità e RHS pari a 9,4, Emilia Romagna con un valore di CACC pari a 68,2 e RHS pari a 11,2, Friuli Venezia Giulia con CACC pari a 67,3 e RHS pari a 10,6, Trentino Alto Adige con un valore in termini di CACC pari a 66,9 unità e RHS pari a 7,3, e infine la Puglia con un valore di CACC pari a 66,8 unità e RHS pari a 10,2 unità.
Specifically, we found that the level of RHS tend to growth with the E-component within the ESG model, for the analyzed variables.
3.2. The Relationship between RHS and the S-Component within the ESG Model
Below we present an analysis that highlights the impact of some variables of the S-Component calculated within the ISTAT-BES within the ESG model. In particular, we estimated the following equation:
Where e . Results are indicated in Table 2.
We can see that the RHS value is positively associated with the following variables, namely:
- EFT: is the percentage of fixed-term employees e collaborators who started their current job since at least 5 years on the total number of fixed-term employees and collaborators. There is a positive relationship between EFT and RHS. If we consider for example the year 2022, we can note that there are in fact regions in which both the EFT value and the RHS value are higher than the average as happens in the case of Calabria with an EFT value equal to 27.6 and RHS equal to 7.2, Basilicata with an EFT value equal to 27.5 and RHS equal to 7.5 units, Sicily with an EFT value equal to 27.4 units and an RHS value equal to 7, 2, Puglia with an EFT value of 23.5 and an RHS value of 7.5 units.
- EPWH: is the percentage of employed who carried out their work from home in the last 4 weeks on total employed people. There is a positive relationship between the EPWH value and the RHS value. There are regions that have a high level of EPWH and also of RHS such as Piedmont with an amount of EPWH equal to 13 and a value of RHS equal to 9.6 units, Friuli Venezia Giulia with an EPWH value equal to 10 .6 units and an RHS value of 7.7 units.
- IES: is the average number long accidental interruptions per user (interruptions without warning and longer than 3 minutes) of the electricity service. There is a positive relationship between IES e RHS. Specifically, if we take the average of the IES value and the average of the RHS value we can notice that there are companies that have high values both in terms of IES and in terms of RHS such as: Calabria with an IES value equal to 3.69 and RHS equal to 10.08, Puglia with an IES value equal to 2.99 and RHS equal to 9.7, Lazio with an IES value equal to 2.41 and RHS equal to 10.44, Abruzzo with IES equal to 2.56 and RHS equal to 11.34, Sardinia with an IES value equal to 2.96 and RHS equal to 14.4.
- SMWC: is the percentage of population residing in the municipalities with separate waste collection greater than and equal to 65%. There is a positive relationship between the SMWC value and the RHS value. In fact, there are regions that have high levels both in terms of RHS and SMWC such as: Sardinia with an RHS value equal to 18.3 units and SMWC equal to 91.2 units, Abruzzo with an RHS value equal to 13.8 units and SMWC equal to 67.2, Umbria with an RHS value equal to 13 and SMWV equal to 72.9 units, Lombardy with an RHS value equal to 12.2 units and SMWC equal to 76.2 units, Valle d'Aosta with an RHS value of 12.1 units and SMWC of 80.6 units.
- NM: is the Number of nurses e midwives per 1,000 inhabitants. There is a positive relationship between NM and RHS. We can note that the regions that have positive values in terms of NM also have positive values in terms of RHS for example Umbria with a value of NM equal to 7.7 and RHS equal to 13, Valle d'Aosta with a value of NM equal to 7.1 and RHS equal to 12.1, Lazio with NM equal to 7.1 and RHS equal to 13.2.
The RHS value is negatively associated with the following variables, namely:
- TUS: is the percentage of employed in unstable jobs at time t0 (term employees + collaborators) than one year away they have a stable job (employees a permanent) on the total number of people employed in jobs unstable at time t0. There is a negative relationship between the TUS value and the RHS value. We can note that regions that have TUS values higher than the average also have RHS values lower than the average such as Veneto with a TUS value equal to 31.1 units and RHS equal to 8.9 units, Molise with a of TUS equal to 27 and a RHS value equal to 9.2, Tuscany with a TUS value equal to 26.4 units and RHS equal to 8.4 units, Trentino Alto Adige with a TUS value equal to 23.7 units and RHS equal to 7.6 units.
- GDM: is the share of people in families who, when asked “Taking into account all available incomes, how does your family manage to make ends meet?” they choose the response mode “With great difficulty”. There is a negative relationship between the value of RHS and the value of GDM. In fact, we can note that the regions that have GDM values higher than the average also have RHS values lower than the average such as Campania with GDM equal to 31.9 and RHS equal to 8.9, Puglia with GDM 9, 9 and RHS equal to 10.2 and Sicily with GDM equal to 8.8 and RHS equal to 9.
The analysis show that RHS tends to be negatively associated with the S-Component within the ESG model. Regions that have a positive level of the S-Component within the ESG model tends to have a negative value in terms of RHS.
3.3. The Relationship between RHS and the G-Component within the ESG Model
We have estimated the following equation:
 Where e . Results are indicated in Table 3.
Specifically we found that the level of RHS is positively associated to:
- PYCC: is the percentage of people of 14 years and over who have non-cohabiting relatives (over to parents, children, brothers, sisters, grandparents, grandchildren), friends or neighbours to count on out of the total of 14 people years and more. There is a positive relationship between the PYCC value and the RHS value. For example, there are regions that have a high value of both PYCC and RHS such as Sardinia with a PYCC value of 84.7 units and RHS equal to 12.3, Friuli Venezia Giulia with PYCC of 83.5 and a RHS value of 7.7 units, Calabria with 82.6 units and RHS equal to 7.2 units, and finally Umbria with PYCC equal to 82.5 units and RHS equal to 8.1 units.
- PDAL: is the presence of elements of degradation in the area where you live: percentage of people aged 14 and more than that they often see elements of social degradation and environmental in the area where they live (they often see at least one element of degradation among the following: people who take drugs, people who deal drugs, acts of vandalism against public property, prostitutes looking for clients) out of the total number of people aged 14 and over. There is a positive relationship between the PDAL value and the RHS value. Specifically, we can verify that the presence of regions that simultaneously have a PDAL and RHS value higher than the average, i.e.: Friuli Venezia Giulia with a PDAL value of 1.5 units and RHS with 7.7 units, Basilicata with PDAL equal to 3 .2 units and a RHS value equal to 7.5 units, Calabria with a PDAL value equal to 4.4 units and RHS equal to 7.2 units, Abruzzo with a PDAL value equal to 4.5 units and RHS equal to 7.6 units, Umbria with PDAL equal to 4.9 and RHS equal to 8.1 units, Sicily with a PDAL value equal to 5 and RHS equal to 7.2 units.
- KW: is the percentage of employed with university education (Isced 6,7 and 8) in Scientific-Technological professions (Isco 2-3) on total number of employed people. There is a positive relationship between the KW value and the RHS value. The comparison between the two historical series shows that there are many regions that have both a KW value and an RHS value lower than the average, i.e.: Tuscany with an average KW value of 17.16 and an average RHS value of at 6.98, Sicily with an average KW value of 16.82 and an average RHS value of 7.92 units, Piedmont with a KW value of 16.48 units, an RHS value of 8 .38 units, Friuli Venezia Giulia with KW equal to 16.24 and an RHS value equal to 6.83, Veneto with a KW value equal to 15.76 and an RHS value equal to 7.17 units, Trentino Alto Adige with a KW value of 15.56 and a RHS value of 5.33.
- RIU: is the percentage of people aged 11 and over who have used the Internet at least once a week in the 3 months preceding the interview. There is a positive relationship between the RIU value and the RHS value. For example, considering 2022 we can note that some regions that have a high level of RIU also have a high level of RHS such as: Friuli Venezia Giulia with a value of RIU equal to 78.5 units and a value of RHS equal to 7.7, Piedmont with a RIUS value of 75.4 and a RHS value of 9.6, Umbria with a RIU value of 75.4 and a RHS value of 8.1.
We also found that the level of RHS is negatively associated to:
- SWFR: is the percentage of people aged 14 and over which is a lot satisfied with relationships with friends out of the total people aged 14 and over. There is a negative relationship between the SWFR value and the RHS value. In fact, many regions that have a SWFR value higher than the average also have a RHS value lower than the average such as Trentino Alto Adige with a SWFR value equal to 31.2 and an RHS value equal to 5.3, Veneto with a SWFR value equal to 25.1 and an RHS value equal to 6.4 units, Emilia Romagna with a SWFR value equal to 25 and an RHS value equal to 6.4, Valle d'Aosta with a SWFR value equal to 245 and an RHS value equal to 6.4 units, Liguria with a SWFR value equal to 24.6 units and an RHS value equal to 5.8, Lombardy with a SWFR value equal to 23 .4 and an RHS value of 6.8, Tuscany with a SWFR value of 22.5 units and RHS of 6.8 units.
- SP: is the number of persons aged 14 and over who have carried out at least one in the last 12 months social participation activities out of the total people aged 14 and over. The activities considered are: participating in meetings or initiatives (cultural, sporting, recreational, spiritual) created or promoted by parishes, congregations or religious groups or spiritual; participate in association meetings cultural, recreational or other; attend meetings of ecological associations, for civil rights, for peace; participate in organizational meetings trade unions; participate in association meetings professional or category; attend meetings of political parties; carry out free activities for a match; pay a monthly or periodic fee for a sports club/club. There is a negative relationship between the SP value and the RHS value. That is, the regions that have values higher than the average of SP also have values lower than the average of RHS such as Trentino Alto Adige with a value of PS equal to 33.4 units and RHS equal to 5.3 units, Valle d 'Aosta with a PS value equal to 30.3 and RHS equal to 6.4 units, Veneto with a PS value equal to 29.5 units and RHS equal to 6.4 units, Lombardy with a PS value equal to 27.3 and a RHS value equal to 6.8 units, Marche with a PS value equal to 26.2 units and RHS equal to 7, Tuscany with a PS value equal to 25.9 units and RHS equal to 6 .8 units, Liguria with a PS value of 25.8 units and RHS of 5.8 units.
- GT: is the percentage of people of 14 years and more than most people believe is trustworthy out of the total people of 14 years and more. There is a relationship between the value of GT and the value of RHS. Specifically, considering for example 2022, there are regions that have a GT value above the average and a lower RHS value, namely: Trentino Alto Adige with a GT value equal to 41.7 units and RHS equal to 5, 3 units, Lazio with GT equal to 30.6 units and RHS equal to 6.9 units, Valle d'Aosta with a GT value equal to 30 and a RHS value equal to 6.4, Lombardy with a GT value equal to 26.8 units and an RHS value equal to 6.8 units, Liguria with a GT value equal to 26.3 units and an RHS value equal to 5.8 units, Veneto with a GT value equal to 25.9 units and RHS equal to 6.4 units, Emilia Romagna with a GT value equal to 25.2 units and RHS equal to 6.4 units, Tuscany with a GT value equal to 24.8 units and RHS equal to 6.8 units.
- EP: is the percentage of people who voted in the last parliamentary elections European Union out of the total number of those entitled. Esiste una relazione negativa tra il valore di EP ed il valore di RHS. Se per esempio consideriamo il 2019 allora possiamo notare che vi sono molte regioni che hanno un valore di EP superiore alla media ed un valore di RHS inferiore alla media ovvero Umbria con un valore di EP pari a 67,7 unità e RHS pari ad un valore di 6,1 unità, Emilia Romagna con un valore di EP pari a 67,3 ed un valore di RHS pari a 4,2 unità, Toscana con un valore di EP pari a 65,8 ed un valore di RHS pari a 6, Lombardia con un valore di EP pari a 64,1 unità ed un valore di RHS pari a 5,4 unità, Veneto con un valore di EP pari a 63,7 unità ed un valore di RHS pari a 5,54 unità, Trentino Alto Adige con un valore di EP pari a 59,9 ed un valore di RHS pari a 3,3 unità, Liguria con un valore di EP pari a 58,5 unità ed un valore di RHS pari a 4,7 unità, Friuli Venezia Giulia con un valore di EP pari a 57 ed un valore di RHS pari a 4,5.
- TPF: is the average score of trust in the police and firefighters (on a scale from 0 to 10) expressed by people aged 14 and over. There is a negative relationship between the TPF value and the RHS value. That is, regions that have a medium-high level of TPF tend to have medium-low levels of RHS, such as: Trentino Alto Adige with a TPF value of 7.7 and RHS of 5.3 units, Emilia Romagna with a TPF value equal to 7.7 units and RHS equal to 6.4 units, Liguria with a TPF value equal to 7.6 units and an RHS value equal to 5.8 units, Veneto with a TPF value equal to 7.6 units and RHS equal to 6.4 units, Lombardy with a TPF value equal to 7.5 units and a RHS value equal to 6.8 units, Lazio with a TPF value equal to 7.5 units and an RHS value of 6.9 units.
- AAIP: Average age of parliamentarians in the Senate and the Chamber. I am excluding senators and deputies elected in the constituencies foreign countries and senators for life. There is a negative relationship between the AAIP value and the RHS value. In fact, considering for example the year 2022, the regions that have AAIP values higher than the average also have RHS values lower than the average such as: Valle d'Aosta with an AAIP value equal to 55 and a value of RHS equal to 6.4, Liguria with an AAIP value equal to 53.4 and RHS equal to 5.8, Trentino Alto Adige with an AAIP value equal to 52.8 and an RHS value equal to 5.3, Lazio with an AAIP value of 52.6 and a RHS value of 6.9 units, Lombardy with an AAIP value of 52.4 and a RHS value of 6.8, Veneto with a value of AAIP equal to 52.4 units and RHS equal to 6.4 units.
- WBSA: is the percentage of people aged 14 and over who are very or quite worried, for themselves or for someone in your family, to suffer violence sexual activity among all people aged 14 and over. Esiste una relazione negativa tra il valore di WBSA ed il valore di RHS. That is, regions that have a high average level of WBSA also have a low average level of RHS as happens for example in the case of Piedmont with a value of WBSA equal to 33.7 and SHR equal to 6.7, Lombardy with a value of WBSA equal to 32.4 and an SHR value equal to 6.7, Tuscany with a WBSA value equal to 29.1 units and an RHS value equal to 6.7, Emilia Romagna with a WBSA value equal to 28 .5 units and an RHS value of 5.8 units, Umbria with a WBSA value of 26.5 units and an RHS value of 7.5 units.
- PCR: is the percentage of people of 14 years and over who have non-cohabiting relatives (over to parents, children, brothers, sisters, grandparents, grandchildren), friends or neighbours to count on out of the total of 14 people years and more. There is a negative relationship between the PCR value and the RHS value. Specifically, there are regions that have a PCR value higher than the average and regions that have a RHS value lower than the average such as Campania with a PCR value equal to 33.6 units and RHS equal to 4.7 units, Lazio with a PCR value equal to 31.5 units and RHS equal to 6.9 units, Lombardy with a PCR value equal to 243.2 units and an RHS value equal to 6.8, Tuscany with a of PCR equal to 20.4 units and a RHS value equal to 6.8 units, Veneto with a PCR value equal to 18.4 units and RHS equal to 6.4 units, Liguria with a PCR value equal to 18 .3 units and RHS equal to 5.8 units.
- NOFP: is the percentage of people aged 14 and over who believe that their personal situation will worsen in the coming years 5 years on the total of people aged 14 and over. There is a negative relationship between the NOFP value and the RHS value. Specifically, there are many regions that have a NOFP value lower than the average and a RHS value higher than the average such as: Marche with a NOFP value equal to 18.1 units and an RHS value equal to 7, Friuli Venezia Giulia with a value of 16.6 units and an RHS value of 7.7 units, Molise with a NOFP value of 16.3 units and an RHS value of 5.6 units, Emilia Romagna with a of NOFP equal to 15.3 and an RHS value equal to 6.4, Tuscany with a NOFP value equal to 15.2 and an RHS value equal to 6.8 units, Valle d'Aosta with a NOFP value Equal to 14.3 units and an RHS value of 6.4 units, Veneto with a NOFP value of 14 and an RHS value of 6.4.
As the analysis shows, the value of RHS tend to be positively associate to the G-Component within the ESG model.
3.4. The Aggregate Impact of the ESG Model on RHS
The econometric analysis conducted demonstrates that the RHS value tends to grow in regions that have high E and G levels and to decrease in regions that have high S levels. Overall, the RHS value tends to grow in connection with the ESG value . Therefore, the growth of the ESG value is not a good indicator of the population's ability to effectively use the healthcare system. The fact of living in a region that has an environmental policy and good governance in itself does not guarantee the reduction of the value of giving up healthcare services. This effect may appear paradoxical. However, we must consider that the element that most affects the choice to give up healthcare is income and social inclusion. This is why the RHS value tends to be negatively associated with the S dimension. In fact, in regions where there is greater social cohesion it is possible to reduce the renunciation of healthcare services. That is, the RHS variable tends to be much more sensitive to variations in social condition, compared to the even positive variations of the E and G components within the ESG model. It follows that the ESG model tends to be inefficient in the sense of the value of RHS, as it is not certain that improving the ESG values will reduce the value of RHS, indeed the data shows that the value of RHS tends to increase especially with growth by E and G.
4. Ranking of Italian Regions and Macro-Regions in the Sense of RSH
Below we consider rankings relating to Italian regions and macro-regions with reference to the RSH value.
Ranking of the Italian regions by RSH value in 2022. Sardinia is in first place by RSH value in 2022 with a value of 12.3, followed by Piedmont with an amount of 9.6 units, and Umbria with a value of 8.1 units. In the middle of the table are Sicily with a value of 7.2 units, followed by the Marche with a value of 7.0, and Lazio with an amount of 6.9 units. Molise closes the ranking with a value of 5.6 units, followed by Trentino Alto Adige with a value of 5.3 units and Campania with an amount of 4.7 (Figure 1).
Ranking of the Italian regions by percentage change in the RSH value between 2017 and 2022. Friuli Venezia Giulia is in first place for the value of the percentage change in the RSH value with an amount of 60.42% corresponding to a change from an amount of 4.8 units up to a value of 7.7 units. Piedmont follows with a value of 43.28% corresponding to a variation from an amount of 6.7 units up to 9.6 units. Trentino Alto Adige is in third place with an amount equal to 43.24% corresponding to a variation from an amount of 4.8 units up to a value of 7.7 units. In the middle of the table is Sardinia with a variation of -1.6% corresponding to a variation from an amount of 12.5 to 12.3. Liguria follows with a variation of -3.33%, equal to a reduction from 6.0 to 5.8 units. Veneto follows with a variation equal to an amount of -4.48% corresponding to a variation from an amount of 6.7 units up to a value of 6.4 units. Among the last regions, there is Calabria with a value equal to -40.98% equal to a reduction from an amount of 12.2 units up to a value of 7.2 units. Molise follows with a variation equal to -48.62% corresponding to a variation from an amount of 10.9 units up to a value of 5.6 units. Campania is in last place with a value of -53% corresponding to a variation from an amount of 10 units up to a value of 4.7 units. On average between 2017 and 2022, the value of RSH decreased for the Italian regions from an amount of 8.21 units to a value of 7.14 units corresponding to a reduction of -12.98% (Figure 2).
The value of RSH in the Italian macro-regions between 2017 and 2022. Between 2017 and 2022 the value of RSH had a fluctuating trend in the Italian macro-regions. The Italian macro-regions with increasing RSH values are indicated below: North-West with +27.12%, North with +18.64%, North-East with +10.34%. The regions with decreasing RSH values are the Central Italy with -17.65%, the Islands with -21.3%, and the South with -35.19% and the South with -42.59%. We can note that while the RSH value increased in the Northern regions, the same value decreased in the Central-Southern regions. The data therefore suggests a reduction in the RSH value in the northern regions. On the contrary, the central-southern regions have reduced the RSH value with decreasing values. The trend of RSH is therefore counterfactual, i.e. it tends to grow in the North and decrease in the Central-Southern regions (Figure 3).
Looking at the trend of the RSH between 2017 and 2022 we can therefore note that this value has grown significantly especially in the regions of Northern Italy. Particularly significant is the trend of the variable in Lombardy with +21.43%, Emilia Romagna with +10.43%, Friuli Venezia Giulia with an amount of +60.42%, Piedmont and Trentino Alto Adige with +43%. This result appears counterfactual, as the Northern Italian regions tend to have higher per capita incomes and more efficient healthcare services. The inhabitants of the North should therefore be more oriented towards obtaining healthcare services, especially compared to the citizens of the South of Italy. However, the data shows that citizens of Northern Italy had a higher growth rate of renunciation of healthcare services compared to the regions of Central and Southern Italy.
5. Clusterization with k-Means Algorithm Optimized with the Silhouette Coefficient
Below we present a clustering with k-Means algorithm optimized with the Silhouette coefficient. The analysis highlights the presence of two clusters indicated as follows:
- Cluster 1: Abruzzo, Lazio, Molise, Sardinia, Calabria, Puglia, Marche, Umbria;
- Cluster 2: Friuli Venezia Giulia, Veneto, Emilia Romagna, Tuscany, Trentino Alto Adige, Lombardy, Valle d'Aosta, Piemonte, Liguria, Campania, Sicily, Basilicata.
The data highlights the presence of the following cluster ordering: C1>C2. From a strictly geographical point of view, it appears that the central-southern regions have much higher RHS levels than those of the northern regions. There are, however, exceptions. In particular we can note that there are three southern regions that are part of cluster 2, i.e. the cluster that has the reduced levels of RHS, namely Campania, Sicily, Basilicata. We can therefore note that cluster 1 appears to be quite homogeneous from the point of view of the participating regions with a similar level of per capita income and a similar geographical positioning. On the contrary, we note that cluster 2 appears to be quite heterogeneous, and brings together very diversified regions both from the point of view of geographical positioning and also from the point of view of per capita income. Furthermore, Cluster 2 is made up of 12 regions. At this point, to verify the presence of a clustering model that can be more efficient, we can try to set a value of k=3. Setting k=3 turns out to be a suboptimal solution. In fact, as we have already verified, the optimal value of k is equal to 2 using the Silhouette coefficient. However, the fact of using a value of k=3, despite being suboptimal, can be considered positively if it allows obtaining greater information content. In fact, we must not forget that the k-Means algorithm is an unsupervised algorithm and therefore the value of k must be set in compliance with qualitative-quantitative criteria that may be able to offer greater information and insights. Therefore, by setting k=3, even knowing that it is a suboptimal solution in the sense of the Silhouette coefficient, it is possible to obtain the following result, namely:
- Cluster 1: Friuli Venezia Giulia, Emilia Romagna, Lombardy, Trentino Alto Adige, Veneto, Valle d'Aosta, Tuscany, Liguria, Piemonte;
- Cluster 2: Marche, Puglia, Molise, Calabria, Sicily, Lazio, Basilicata, Campania, Umbria;
- Cluster 3: Sardinia, Abruzzo.
From the point of view of the ordering of the clusters, we can note that the average value of RHS in Cluster 3 is higher than the corresponding value of Cluster 2 and Cluster 3. That is, it is possible to identify the following cluster structure: C3>C2>C1.
We can note that the regions in which citizens show higher levels of RHS are Sardinia and Abruzzo, i.e. two southern regions. This is also followed by the regions of Cluster 2 which are essentially southern regions with the addition of some regions of Central Italy, namely Marche, Umbria and Lazio. Finally, the regions that have lower RHS values are indicated within Cluster 1. We can note that these are northern regions with the addition of Tuscany which is a region in Central Italy. The picture resulting from the clustering with k=3 highlights the existence of a distinction between the southern regions and the northern regions with reference to access to healthcare. In fact, the population of the southern regions and also of central Italy tends to give up healthcare much more than the northern regions. The reasons for this renunciation may depend on the offer of health services, and also on the perception that the local population has regarding the accessibility of health services. On the contrary, in Northern Italy there is a greater offer of health services. However, it is very likely that the main reason for giving up healthcare services is the low per capita income in the southern regions. In fact, central-southern populations tend to have medium-low incomes compared to residents of Northern Italy. Therefore, the inhabitants of Northern Italy, having greater resources at their disposal, can face the costs of accessing care more easily. A further element consists in the fact that the population of Northern Italy has better healthcare facilities available than those of Central and Southern Italy. The population of Northern Italy therefore has greater opportunities to have access to healthcare both for reasons related to per capita income and also for issues relating to the presence of a greater supply of healthcare services. It follows that the income difference between Northern Italy and Central-Southern Italy tends to have a significant impact in terms of access to healthcare with consequences also on the life expectancy of the population.
In this type of analysis, we made the most of the interpretative flexibility offered by the k-Means clustering algorithm, which, being unsupervised, requires the identification of a level of k that is compatible with the objective of the analysis both quantitatively and qualitatively. In this case, we chose to optimize the algorithm through the use of the Silhouette coefficient. The value of k such as to maximize the value of the Silhouette coefficient led to the definition of k=2. However, with k=2 we have highlighted an analytical insufficiency due to the presence of an inadequate division of the Italian regions between clusters. Therefore we opted for a value of k=3 to obtain a broader representation of the value of the Italian regions in the sense of SHR. In this case, therefore, we have chosen a suboptimal k value in the sense of optimizing the Silhouette coefficient, i.e. k=3 instead of k=2, to maximize insights of the datasets.
6. Predictions with Machine Learning Algorithms
Below we present a machine learning analysis carried out through a comparison of eight algorithms. The algorithms were trained with 70% of the available data while the remaining 30% was used for the actual prediction. The algorithms are compared through the use of a set of statistical indicators namely R-Squared-R^2, Mean Absolute Error-MAE, Mean Squared Error-MSE, Root Mean Squared Error-RMSE. Specifically, the indicators used are shown below:
- R Squared
- Mean Average Error
- Mean Squared Error==
- Root Mean Squared Error==
Below we report, in the Table 4, the statistical errors and the R^2 calculated for each individual algorithm.
The ranking of the algorithms was created through their ability to maximize the value of the R-Squared and minimize statistical errors. Each algorithm is assigned a ranking value. The ranking values are subsequently added. Therefore, the algorithm that has a lower value in total terms is also the best algorithm, as it appears to have obtained the best performances in the various rankings. Therefore we obtain the following ordering of the algorithms:
- Simple Regression Tree with a payoff value of 4;
- ANN-Artificial Neural Network with a payoff value of 9;
- Tree Ensemble Regression with a payoff value of 12;
- PNN-Probabilistic Neural Network with a payoff value of 15;
- Random Forest Regression with a payoff value of 23;
- Gradient Boosted Tree Regression with a payoff value of 24;
- Linear Regression with a payoff value of 26;
- Polynomial Regression with a payoff value of 31.
Results are indicated in the following Table 5.
Therefore, by applying the most performing algorithm, namely the Simple Regression Tree, we can predict the future trend of the RHS variable in the Italian regions. First of all, we distinguish the regions into two different subgroups: losing regions, i.e. regions for which a growth in the RHS value is predicted, and winning regions, i.e. regions for which a reduction in the RHS value is predicted.
Losing regions. The regions for which a growth in the RHS value is predicted, i.e. the losing regions, are indicated below:
- Calabria, with an increase in RHS from an amount of 7.20 units up to a value of 12.30 units or equal to a change of +70.83% corresponding to an amount of 5.10 units;
- Puglia, with an increase in RHS from 7.50 units up to 12.30 units or equal to 4.80 units corresponding to 64.00%;
- Campania, with an increase in RHS from an amount of 4.70 units up to a value of 7.20 units or equal to a variation of 2.50 units corresponding to +53.19%;
- Valle d'Aosta, with an increase in RHS from an amount of 6.40 units up to a value of 9.60 units or equal to a change of +50.00%;
- Liguria with a variation from an amount of RHS 5.80 units up to 7.70 units or equal to +32.76%;
- Trentino Alto Adige, with a variation in RHS from an amount of 5.30 units up to 6.80 units or equal to a variation of 28.30%;
- Molise, with a variation in RHS from an amount of 5.60 units up to 6.90 units or equal to a variation of 23.21%;
- Emilia Romagna and Veneto with a change in RHS equal to +20.31%.
Looking at these results, even taking them as valid from a methodological point of view, we try to understand if they actually make sense from the point of view of regional health policies. We can note that it is certainly probable that regions that already have high levels of RHS will tend towards a further growth of this variable in the future due to the worsening of both socio-economic conditions, the healthcare system and also treatment and prevention habits. In this sense, therefore, an increase in the value of RHS in Calabria, Puglia, Valle d'Aosta, Emilia Romagna, and Veneto could make sense. For similar reasons it is very likely that regions that have low levels of RHS remain in this “virtuousness”. In this sense, a growth in the value of RHS in Liguria, Trentino Alto Adige, Molise and Campania, as predicted by the Simple Regression Tree, appears very unlikely. However, it must always be considered that any changes in the supply of health services at a regional level due to public finance constraints, together with changes in screening, prevention, control and treatment habits, could lead to a growth in the value of RHS also in the regions that show low levels of RHS (Table 6).
Winning regions. There are also regions for which a reduction in the RHS value is predicted. These regions can be considered winning regions. In fact, the reduction of the RHS is certainly a positive fact. Among the regions for which the Simple Regression Tree predicts a reduction in the RHS value are the following:
- Marche, with a decreasing variation equal to -1.43% corresponding to a variation from an amount of 7.00 units up to a value of 6.90 units;
- Lombardy, with a decreasing variation of -5.88% corresponding to a variation from an amount of 6.80 units to a value of 6.40 units;
- Basilicata, with a decreasing variation equal to -6.67% corresponding to a variation from an amount of 7.50 units up to 7.00 units;
- Friuli Venezia Giulia, with a decreasing variation from an amount of 7.70 units to a value of 6.80 units or equal to a value of -11.69%;
- Umbria, with a decreasing variation from an amount of -14.81% corresponding to a variation of 8.10 units up to a value of 6.90 units;
- Lazio with a decreasing variation equal to -15.94% corresponding to a variation from an amount of 6.90 units to a value of 5.80 units;
- Piedmont, with a decreasing variation equal to -19.79% corresponding to a variation from an amount of 9.60 units up to 7.70 units;
- Tuscany, with a decreasing variation of -22.06% or from 6.80 units to a value of 5.30 units;
- Abruzzo, with a decreasing variation of -23.68% or from 7.60 units to 5.80 units;
- Sicily, with a decreasing variation equal to -34.72% corresponding to a variation from 7.20 units up to 4.70 units;
- Sardinia, with a decreasing variation equal to -38.21% corresponding to a variation from an amount of 12.30 units up to 7.60 units.
Also in this case we can analyze the predictions critically to verify whether they can make sense in the dynamics of health economic policies at a regional level. In fact, without prejudice to the correctness of the quantitative method used, it is necessary to verify whether these conclusions can also have a qualitative sense. In fact, there are regions for which it is difficult to imagine a reduction in the value of RHS in the short term unless there are profound changes in the supply of health services at a regional level or changes in the habits of the resident population. In fact, these regions already have a medium-high level of RHS and it is very unlikely that it will decrease quickly. The reference is particularly to the Marche, Basilicata, Friuli Venezia Giulia, Umbria, Piedmont, Abruzzo, Sicily, Sardinia. However, it is much more likely that a reduction in the value of RHS will occur in Lombardy, Lazio and Tuscany, both because these regions have lower RHS levels as a basis and because they also have the health infrastructure capable of increasing the offer towards patients and to change patient behaviour in order to create the conditions for a reduction in the value of RHS (Table 7).
However, on average, the Simple Regression Tree algorithm predicts an increasing variation in the RHS value of +4.41% or from 7.14 units up to 7.46 units. That is, the algorithm predicts an increase in the renunciation of healthcare services. This result could also be critically analysed. In fact, in light of the considerations carried out, it is very likely that the real value of the reduction in RHS is much greater than the average estimated 4.41%. In fact, especially the southern regions, and also some northern regions, such as Piedmont, will probably experience -a growth in the value of RHS especially in the case of application of new fiscal reforms of an autonomous nature which could increase the gap between North and South and between regions rich and poor regions.
7. Conclusions
In this article, we have taken into consideration the role of RHS in light of the ESG model in the Italian regions. Our analysis turns out to be original. In fact, the presence of a positive relationship between the level of RHS and low levels of economic activity is known in the literature. In our case, however, we analyzed the relationship between RHS and ESG considering that issues relating to profitability and productivity are not directly relevant within ESG models. The econometric analysis conducted highlighted a positive relationship between the RHS value and the two components E and G of the ESG model. It follows that the renunciation of healthcare services tends to grow in regions that have good environmental and governance performances. On the contrary, the econometric analysis has demonstrated the presence of a negative relationship between RHS and the S component of the ESG model, i.e. it is possible to reduce the renunciation of healthcare services in regions that have a greater endowment of the social component.
We subsequently used the k-Means clustering analysis algorithm. Clustering analysis is necessary to evaluate the impact of the economic gap between Central-Northern and Southern Italy in the sense of RHS. In fact, the clustering shows an Italy divided in two with the southern regions having much higher RHS levels than the regions of Central-Northern Italy. This analysis confirms the dependence of RHS on the structure of medium-low incomes at a territorial level.
Finally, we used eight machine-learning algorithms to check which one was best suited to the structure of the data to make a prediction. The analysis conducted showed that the algorithm best able to offer a correct representation of the data is the Simple Regression Tree. Through the application of the Simple Regression Tree, we predicted an average growth of the RHS value in the Italian regions for an amount equal to 4.4%.
Abbreviations
| LIST OF ABBREVIATIONS | ||
| N | Variables | Abbreviation |
| 1 | Average age of Italian parliamentarians | AAIP |
| 2 | Concern about climate change | CACC |
| 3 | Concern about the loss of biodiversity | CALB |
| 4 | Concern about landscape deterioration | CALD |
| 5 | Density and relevance of museum heritage | DRMH |
| 6 | Employed in fixed-term jobs for at least 5 years | EFT |
| 7 | Electoral participation | EP |
| 8 | Employed people working from home | EPWH |
| 9 | Great difficulty in making ends meet | GDM |
| 10 | Generalized trust | GT |
| 11 | Irregularity of the electricity service | IES |
| 12 | Impact of forest fires | IFF |
| 13 | Knowledge workers | KW |
| 14 | Leakage from the municipal water supply | LMWS |
| 15 | Municipalities' current expenditure on culture | MCE |
| 16 | Nurses and midwives | NM |
| 17 | Negative opinion on future prospects | NOFP |
| 18 | Perception of crime risk | PCR |
| 19 | Presence of elements of degradation in the area where you live | PDAL |
| 20 | People you can count on | PYCC |
| 21 | Regular internet users | RIU |
| 22 | Separate municipal waste collection service | SMWC |
| 23 | Social participation | SP |
| 24 | Satisfaction with friendship relationships | SWFR |
| 25 | Trust in the police and firefighters | TPF |
| 26 | Transformations from unstable jobs to stable jobs | TUS |
| 27 | Worry about being sexually assaulted | WBSA |
| 28 | Wastewater Treatment | WT |
References
- Baggio, S.; Vernaz, N.; Spechbach, H.; Salamun, J.; Jacquerioz, F.; Stringhini, S.; Gétaz, L. Vulnerable patients forgo health care during the first wave of the Covid-19 pandemic. Preventive medicine 2021, 150, 106696. [Google Scholar] [CrossRef] [PubMed]
- Guessous, I. Health care renunciation for economic reasons in Switzerland. . Swiss Medical Weekly 2011, 141, w13165–w13165. [Google Scholar]
- Reginato, E.; Fadda, I.; Paglietti, P.; Pavan, A. Informal payments and performance in the health care sector: possible relationships in a sub-national perspective. International Journal of Business and Management 2020, 3, 126–144. [Google Scholar] [CrossRef]
- Gaubert, G.; Nauleau, S.; Franke, F.; Rebeaudet, S.; Mosnier, E.; Landier, J.; Gaudart, J. Deprivation effect on COVID-19 cases incidence and severity: a geo-epidemiological study in PACA region, France. medRxiv 2023. [Google Scholar]
- Guinchard, B. Vulnerable patients forgoing health care for economic reasons: a concern for health professionals. Japanese Red Cross Hiroshima Coll. Nurs. 2019, 19, 55–58. [Google Scholar]
- Ridde, V.; Aho, J.; Ndao, E.M.; Benoit, M.; Hanley, J.; Cloos, S.L.E.P. Unmet healthcare needs among migrants without medical insurance in Montreal, Canada. Global Public Health 2020, 15, 1603–1616. [Google Scholar] [CrossRef] [PubMed]
- Sandu, C.B.; Jaba, E.; Jemna, D.V.; Lionte, C.; Harja, E.; Depret, M.H.; Ancelot, L. The Effect of Health Care Renunciation of Pregnant Women on their New-Borns' Health. Romanian Statistical Review 2023, 3. [Google Scholar]
- Ancelot, L.; Bonnal, L.; Depret, M.H.; Favard, P.; Jemna, D.V.; Sandu, C.B. Unmet need for health care during pregnancy: A French–Romanian comparison. Applied Economics 2020, 52, 1298–1310. [Google Scholar] [CrossRef]
- Kouame, J.; Sackou-Kouakou, J.G.; Tiade, M.L.; Hounsa, A.; Gokpeya, M.; Malik, S.; Desquith, A. Determinants of Health Care Renunciation among Women in Ivory Coast: Case of the District of Abobo Anonkoi-3. ournal of Health Policy and Management 2021, 6, 116–129. [Google Scholar] [CrossRef]
- Attia-Konan, A.R.; Oga, A.S.S.; Koffi, K.; Kouamé, J.; Touré, A.; Kouadio, L. Assessing factors associated with catastrophic healthcare expenditure in Côte d’Ivoire: evidence from the\household living standard survey 2015. Health Econ Outcome Res Open Access 2020. [Google Scholar] [CrossRef]
- Nanfosso, R.T.; Tadadjeu, S. Does the fear of covid-19 transmission affect hospital attendance in Cameroon? 2022. [Google Scholar]
- Chamboredon, P.; Roman, C.; Colson, S. COVID-19 pandemic in France: health emergency experiences from the field. International nursing review 2020, 67, 326–333. [Google Scholar] [CrossRef] [PubMed]
- Chanvrier, H.; Rattaz, V.; Offredi, V.; Dupuis, M.; Horsch, A. Swiss cohort on Traumatic Childbirth and Health (SwiTCH): protocol for a prospective, population-based cohort study on parents’ mental health from pregnancy to one year postpartum. BMJ open 2024, 1, e080557. [Google Scholar] [CrossRef] [PubMed]
- Rambliere, L.; Leservoisier, C.; Bedo, Y.; Macalli, M.; Lebugle, A.; Douay, C.; Guénée, L. Major depressive disorder in post-secondary students attending foodbanks in France. Frontiers in Public Health 2023, 11, 1177617. [Google Scholar] [CrossRef] [PubMed]
- Arisegi, S.A.; Tomori, B.A. Attitudes and practices related to stigma and discrimination against persons living with HIV/AIDS among health workers in a tertiary care facility in Sokoto. Nigeria. Int Arch Med Med Sci 2019, 1, 1. [Google Scholar]
- Tavolacci, M.P.; Déchelotte, P.; Ladner, J. Eating disorders among college students in France: characteristics, help-and care-seeking. International Journal of Environmental Research and Public Health 2020, 16, 5914. [Google Scholar] [CrossRef] [PubMed]
- Brun-Rambaud, G.; Alcouffe, L.; Tareau, M.A.; Adenis, A.; Vignier, N. Access to health care for migrants in French Guiana in 2022: a qualitative study of health care system actors. Frontiers in Public Health 2023, 11, 1185341. [Google Scholar] [CrossRef] [PubMed]
Figure 1.
Ranking of Italian regions by RSH value in 2022.
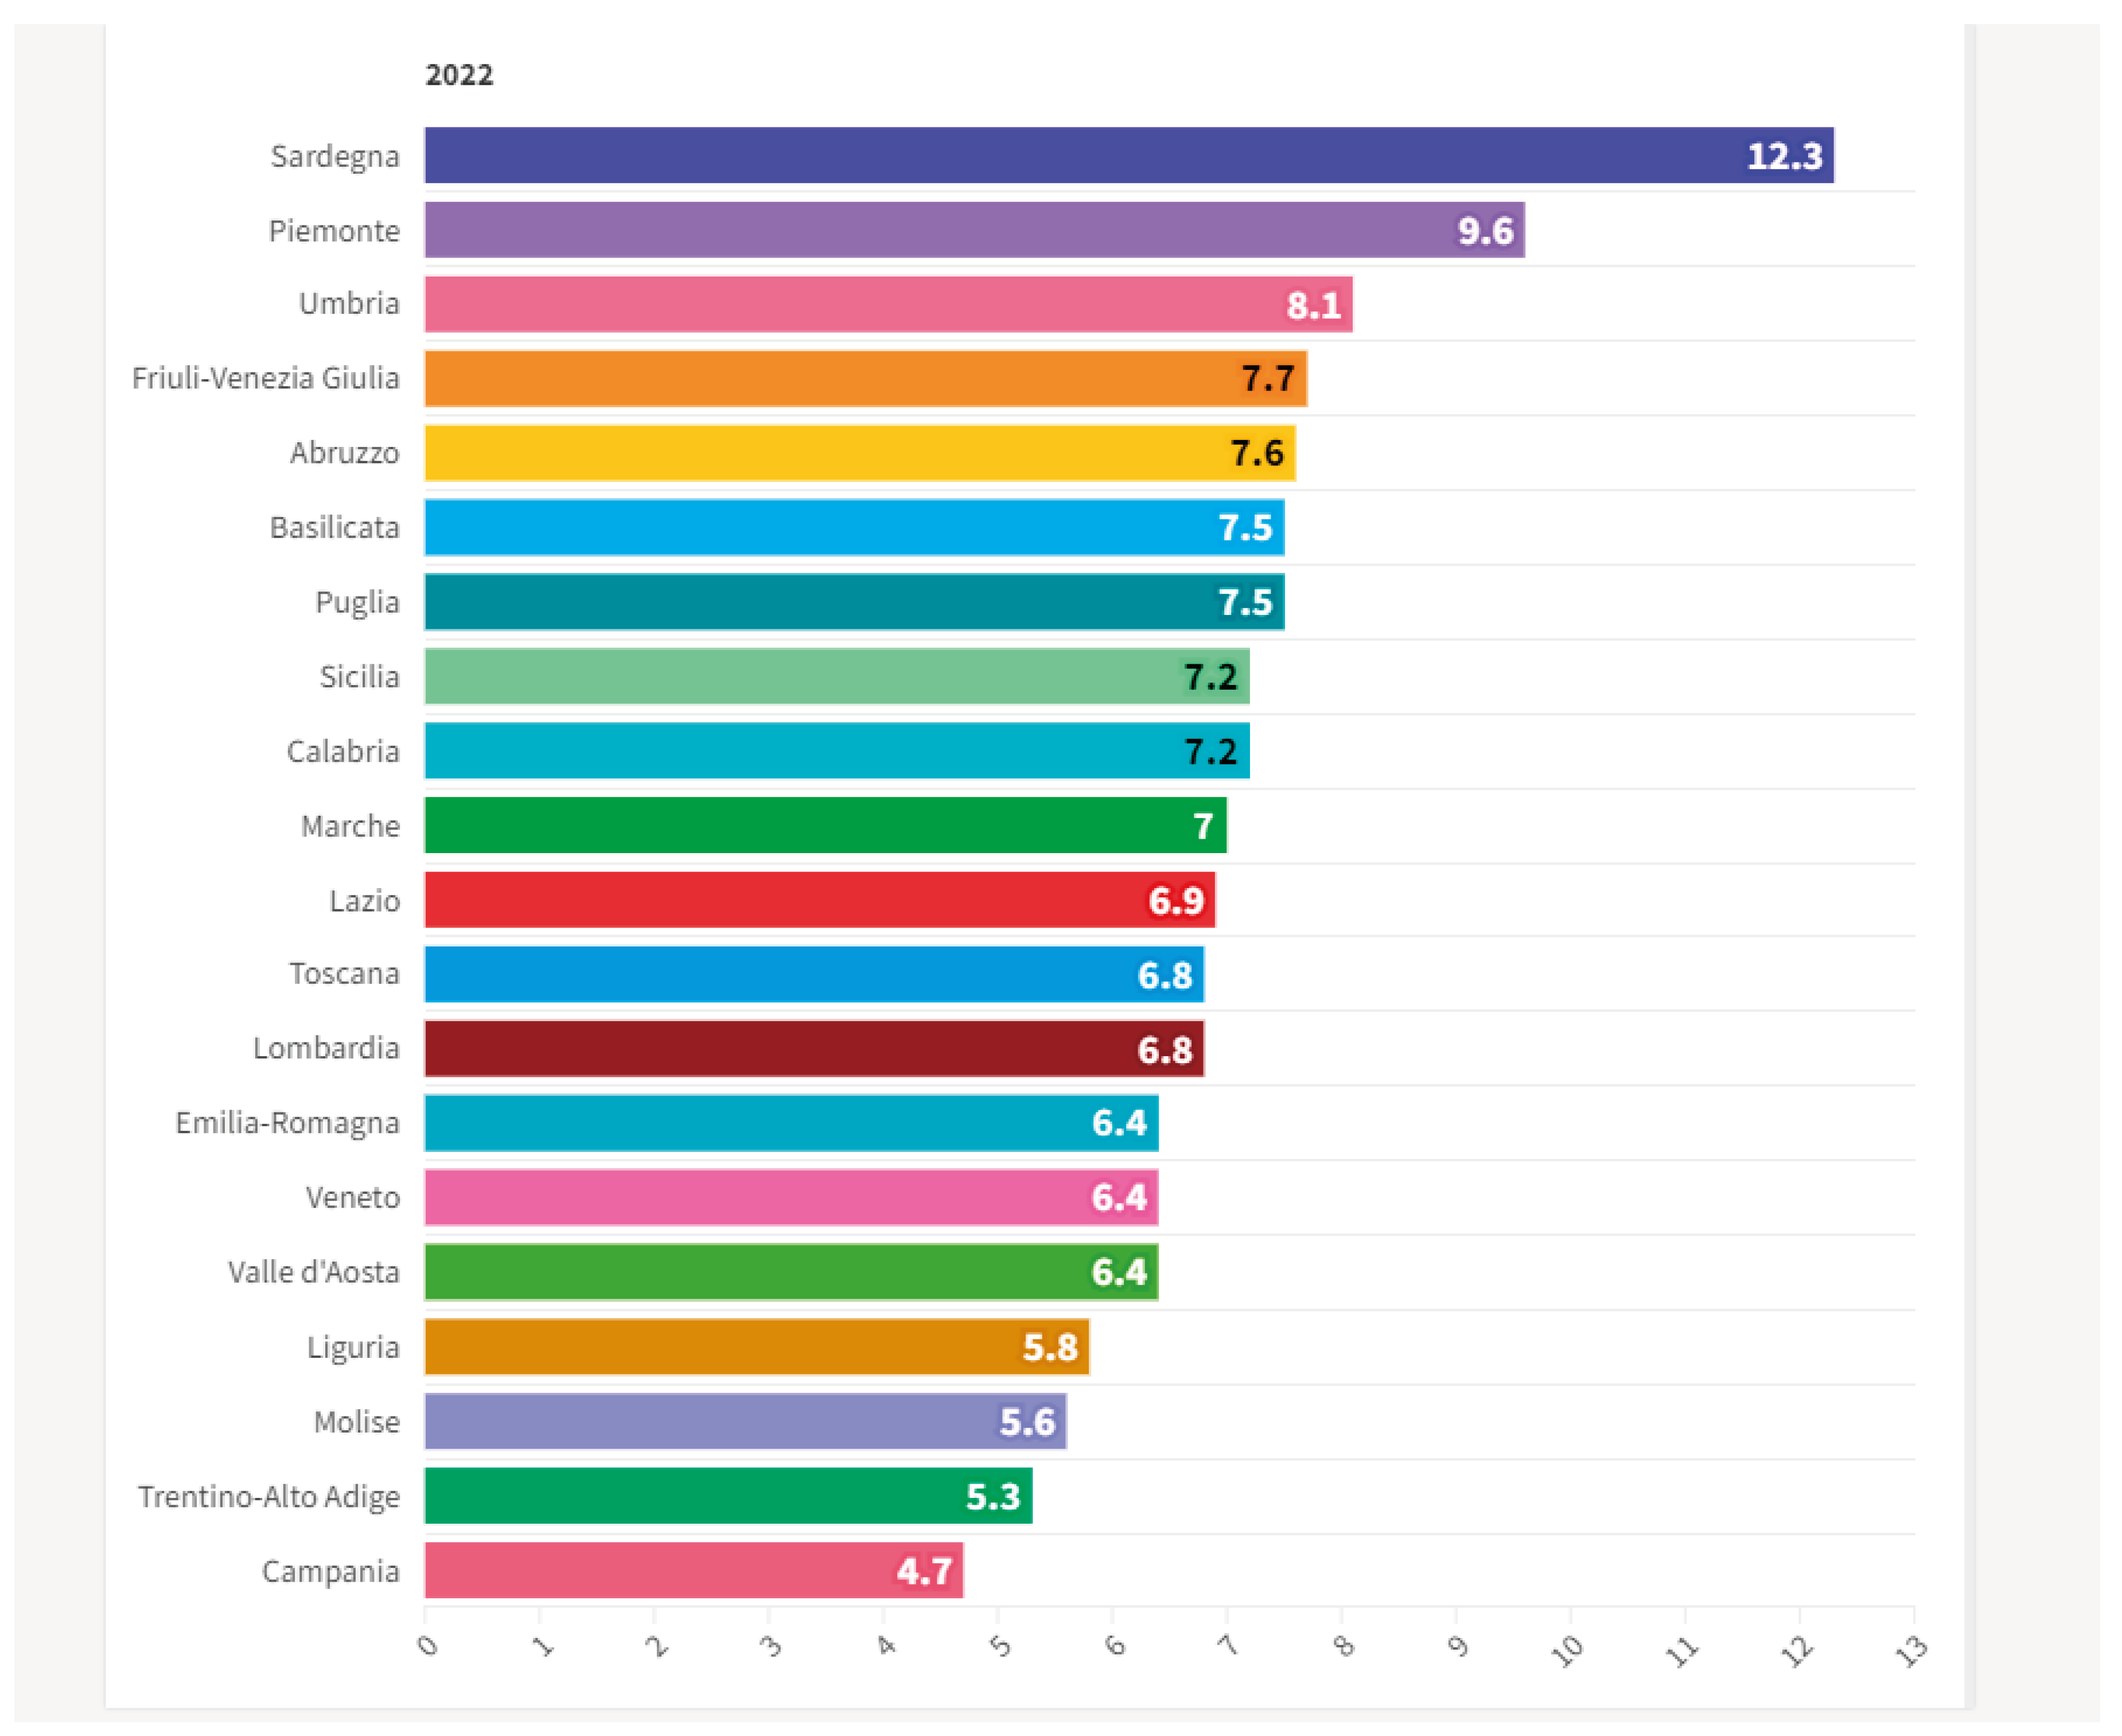
Figure 1.
Ranking of the Italian regions by value of the percentage change in RSH between 2017 and 2022.
Figure 1.
Ranking of the Italian regions by value of the percentage change in RSH between 2017 and 2022.
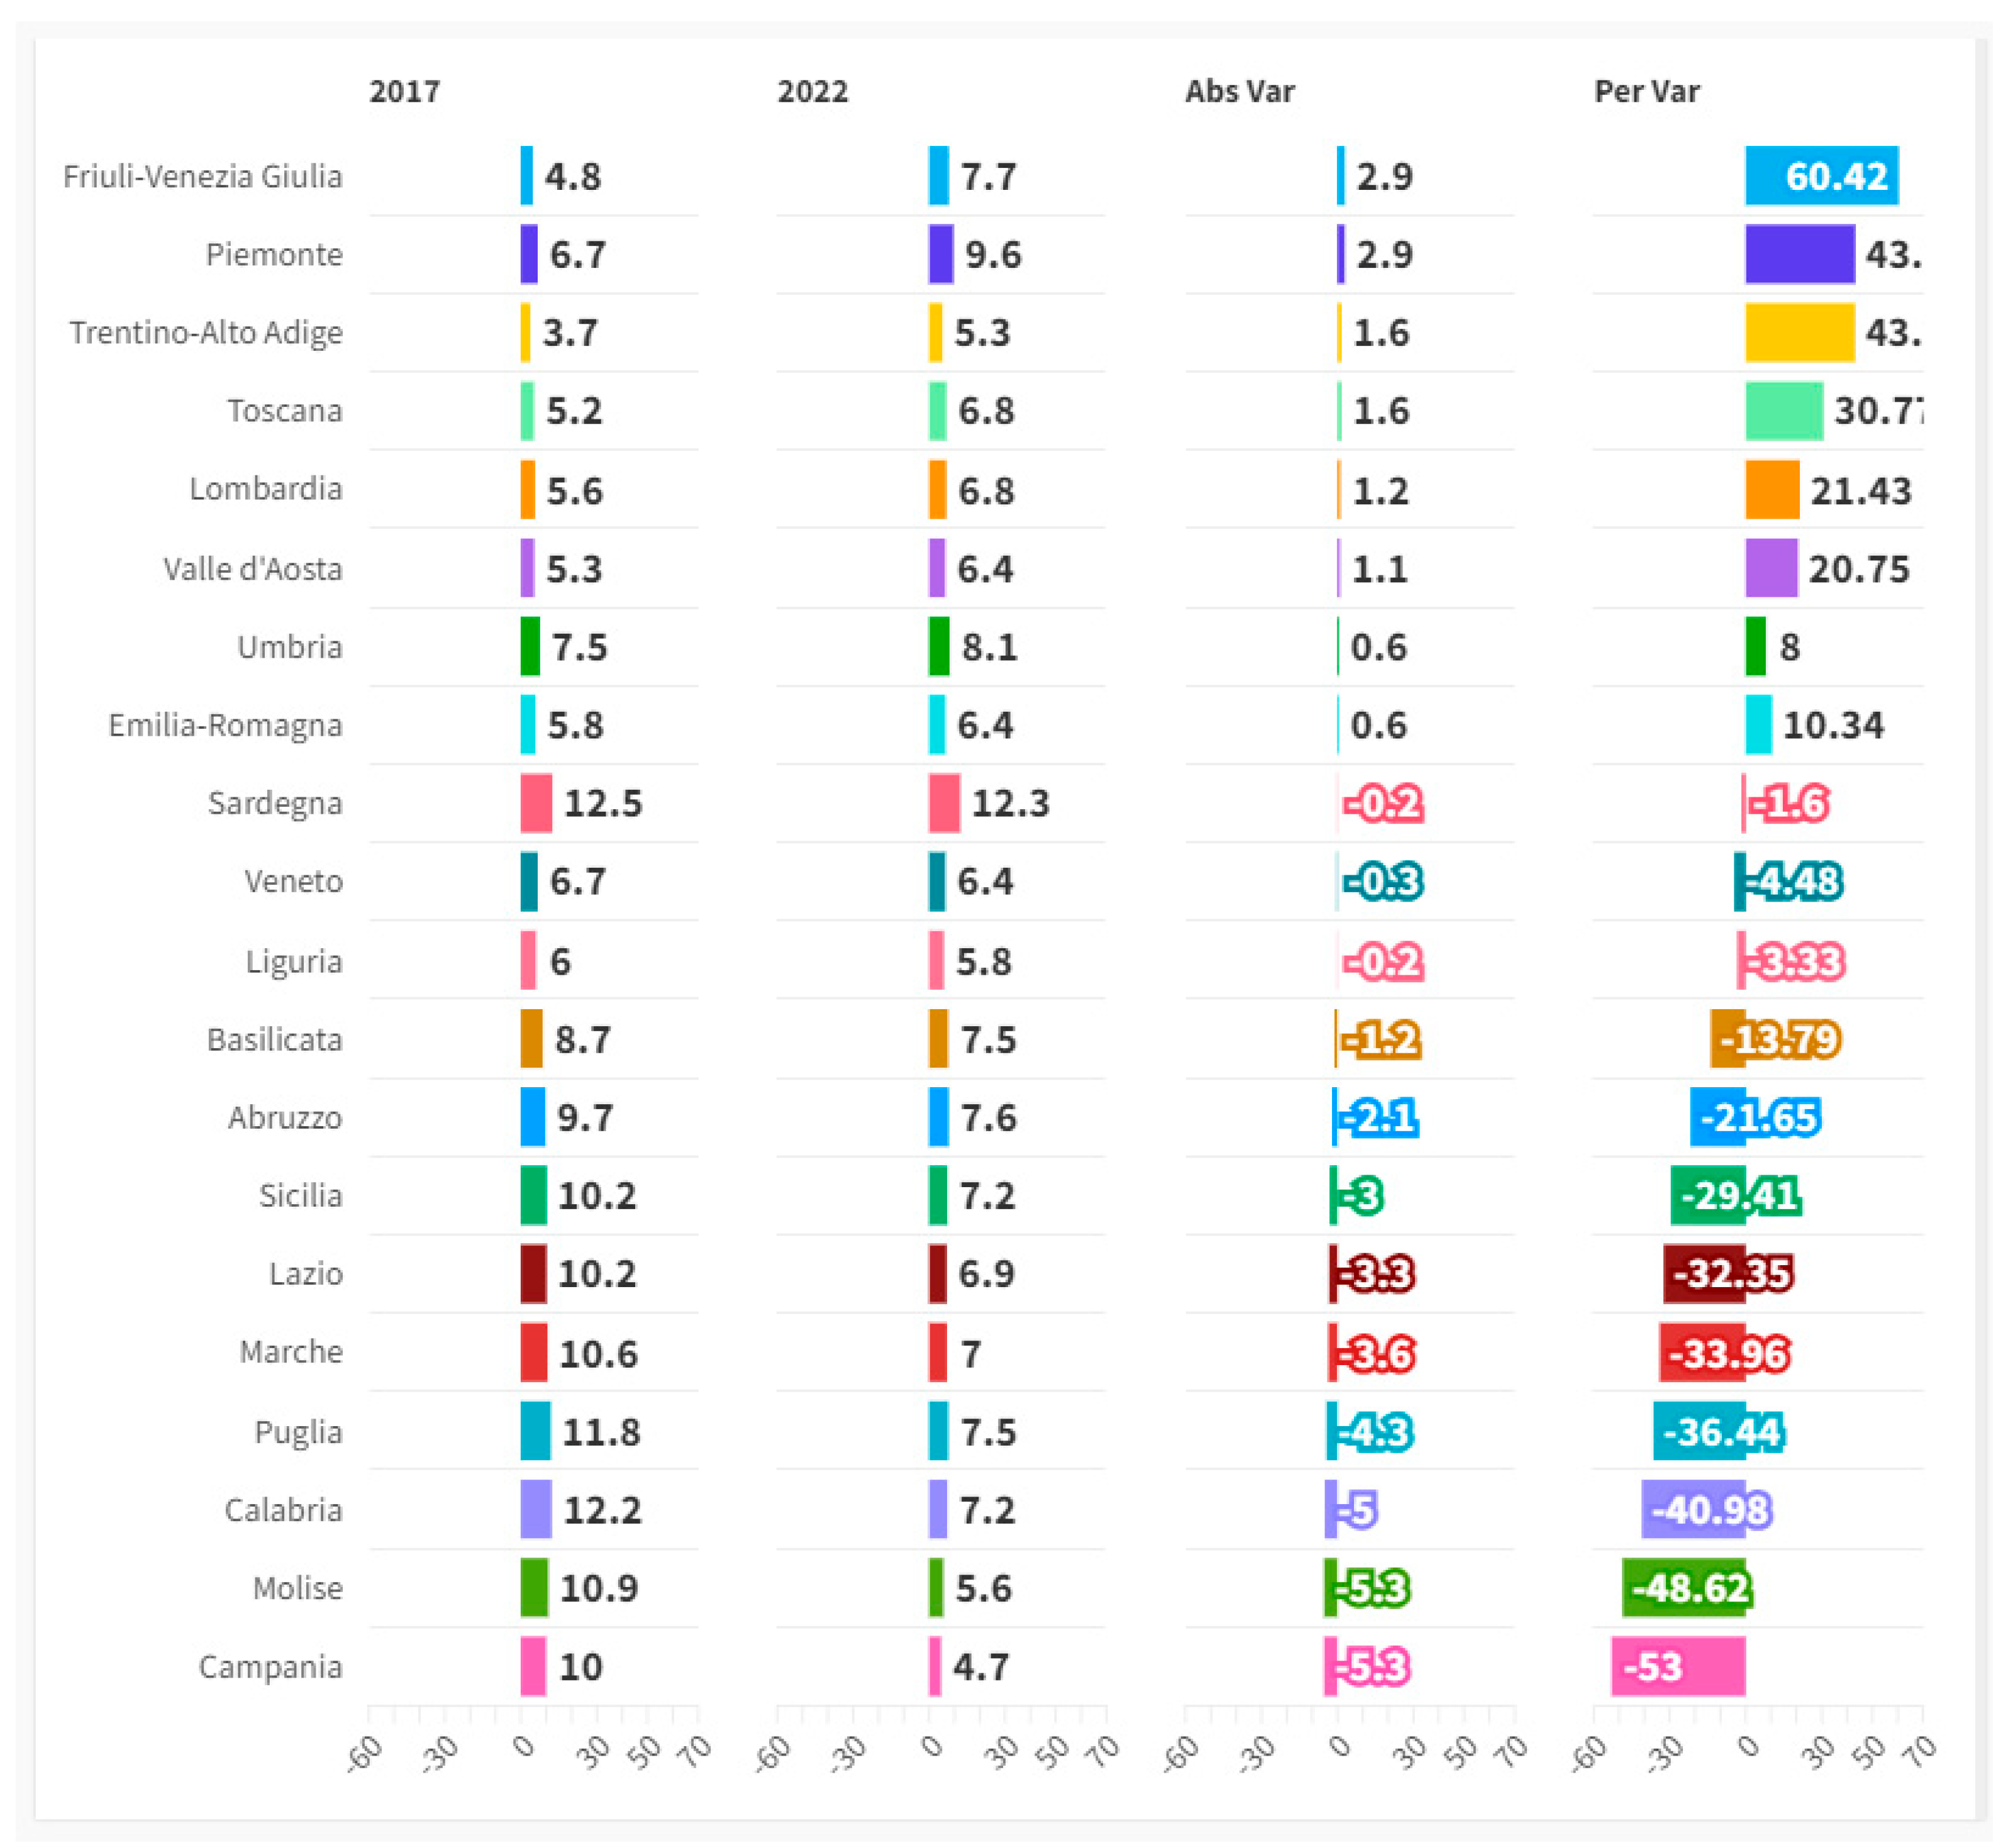
Figure 2.
The value of RSH in the Italian macro-regions between 2017 and 2022.
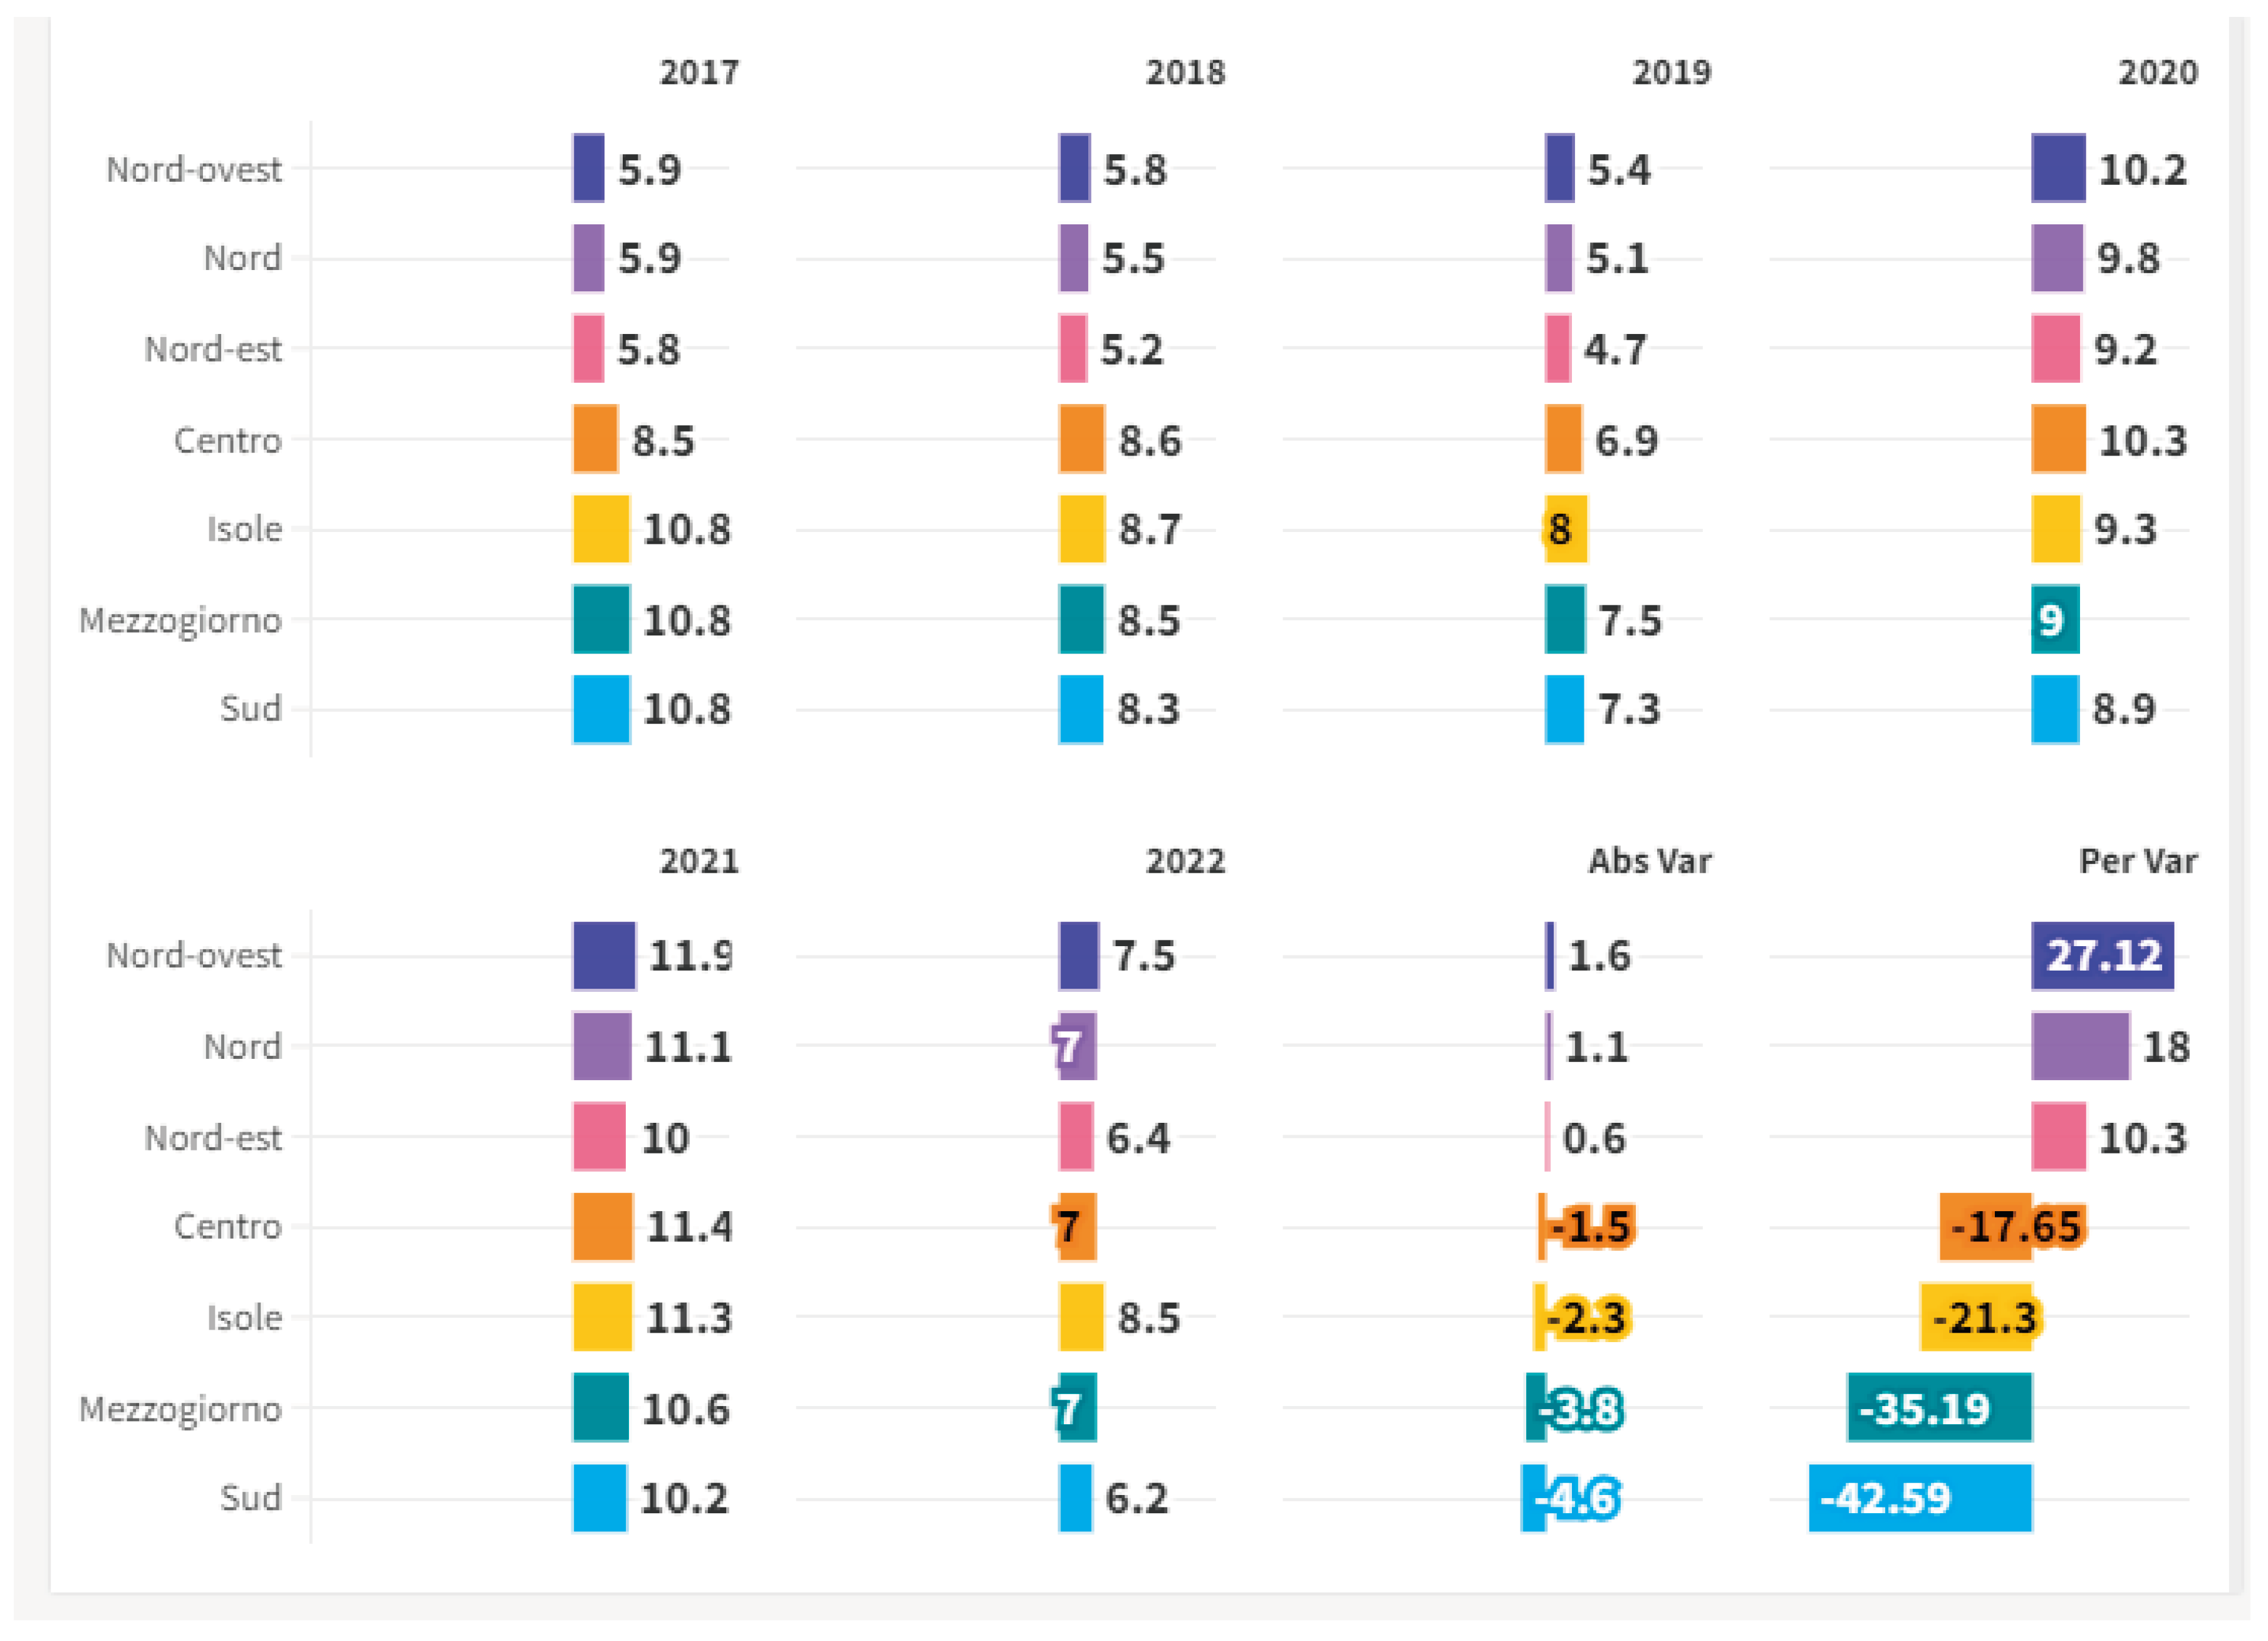
Figure 3.
Average values for the clusters.
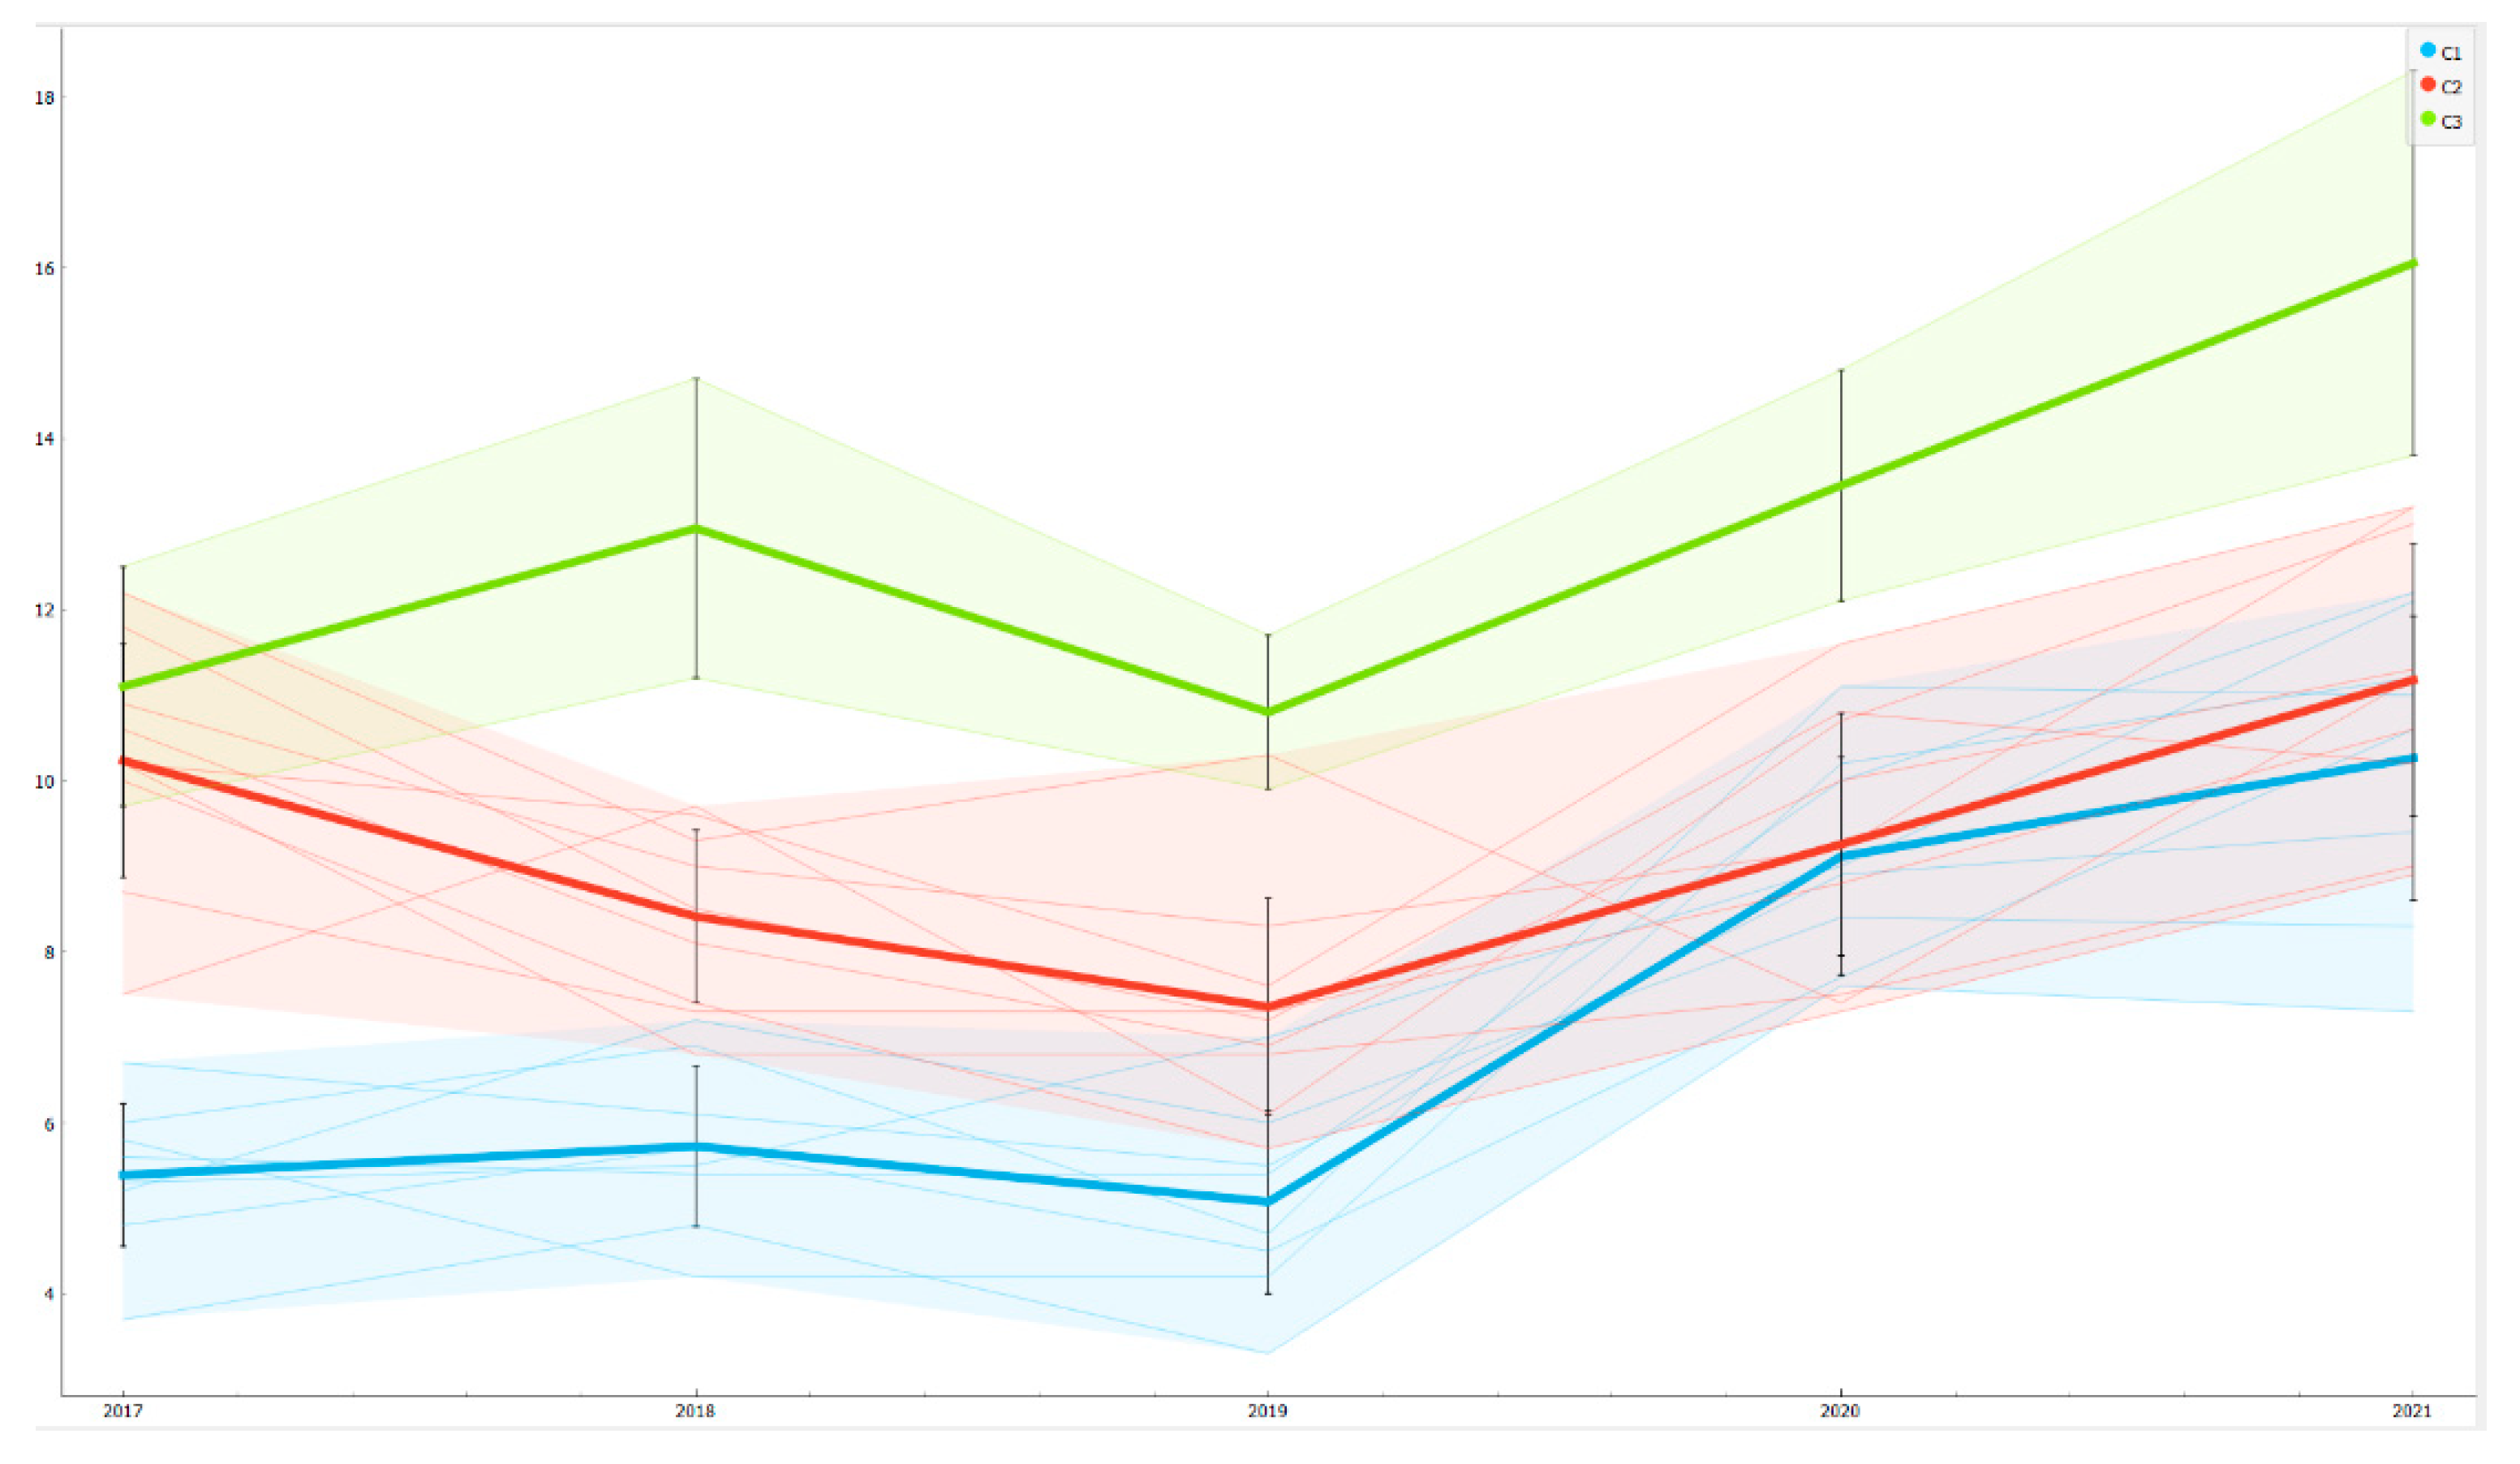

Table 1.
Summary of the results of the metric analysis to estimate the impact of the E component of the ESG model on the RHS variable.
Table 1.
Summary of the results of the metric analysis to estimate the impact of the E component of the ESG model on the RHS variable.
| Summary of the results of the metric analysis to estimate the impact of the E component of the ESG model on the RHS variable | ||||||||||
|---|---|---|---|---|---|---|---|---|---|---|
| Costant | MCE | DRMH | IFF | CALD | LMWS | WT | CACC | CALB | ||
| 1-step dynamic panel | Coefficient | 0.783892 | -0.0810786 | 0.684384 | 0.0780967 | -0.256734 | 0.0609608 | -0.0785058 | -0.094142 | 0.662777 |
| Standard Error | 0.213515 | 0.0111281 | 0.138908 | 0.0367299 | 0.0318453 | 0.00903857 | 0.0069137 | 0.0163158 | 0.0516181 | |
| p-Value | 0.0337 | 0.0017 | 0.0004 | <0.0001 | 0.0007 | <0.0001 | <0.0001 | <0.0001 | <0.0001 | |
| ** | *** | *** | *** | *** | *** | *** | *** | *** | ||
| Fixed-effects | Coefficient | 0.783892 | -0.0810786 | 0.684384 | 0.0780967 | -0.256734 | 0.0609608 | -0.0785058 | -0.094142 | 0.662777 |
| Standard Error | 0.213515 | 0.0111281 | 0.138908 | 0.0367299 | 0.0318453 | 0.00903857 | 0.0069137 | 0.0163158 | 0.0516181 | |
| p-Value | 0.0003 | <0.0001 | <0.0001 | 0.0342 | <0.0001 | <0.0001 | <0.0001 | <0.0001 | <0.0001 | |
| *** | *** | *** | ** | *** | *** | *** | *** | *** | ||
| Random-effects | Coefficient | 0.76878 | -0.0809812 | 0.60813 | 0.0852705 | -0.259213 | 0.0625014 | -0.0794829 | -0.0909106 | 0.656532 |
| Standard Error | 0.245992 | 0.0100988 | 0.128877 | 0.0328026 | 0.0311177 | 0.00873113 | 0.00666758 | 0.0147755 | 0.0471486 | |
| p-Value | 0.0018 | <0.0001 | <0.0001 | 0.0093 | <0.0001 | <0.0001 | <0.0001 | <0.0001 | <0.0001 | |
| *** | *** | *** | *** | *** | *** | *** | *** | *** | ||
| Pooled OLS | Coefficient | 0.748249 | -0.0798378 | 0.524942 | 0.0900283 | -0.262927 | 0.0637989 | -0.0802588 | -0.0876985 | 0.65096 |
| Standard Error | 0.208541 | 0.00947836 | 0.121482 | 0.0301548 | 0.0312375 | 0.00871201 | 0.00665631 | 0.0138761 | 0.0446925 | |
| p-Value | 0.0004 | <0.0001 | <0.0001 | 0.003 | <0.0001 | <0.0001 | <0.0001 | <0.0001 | <0.0001 | |
| *** | *** | *** | *** | *** | *** | *** | *** | *** | ||
Table 2.
Summary of the results of the metric analysis to estimate the impact of the S component of the ESG model on the RHS variable.
Table 2.
Summary of the results of the metric analysis to estimate the impact of the S component of the ESG model on the RHS variable.
| Summary of the results of the metric analysis to estimate the impact of the S component of the ESG model on the RHS variable | |||||||||
|---|---|---|---|---|---|---|---|---|---|
| Costant | TUS | EFT | EPWH | GDM | IES | SMWC | NM | ||
| Fixed-effects | Coefficient | 119.345 | -0.0642 | 0.08902 | 0.33622 | -0.1605 | 0.48954 | 0.04795 | 0.22954 |
| Std. Error | 0.69656 | 0.01812 | 0.02434 | 0.04484 | 0.02596 | 0.26062 | 0.00838 | 0.06213 | |
| p-value | 0.0876 | 0.0005 | 0.0003 | <0.0001 | <0.0001 | 0.0612 | <0.0001 | 0.0003 | |
| * | *** | *** | *** | *** | * | *** | *** | ||
| Fixed-effects | Coefficient | 0.28593 | -0.0622 | 0.09955 | 0.33985 | -0.1359 | 0.73708 | 0.04478 | 0.24695 |
| Std. Error | 0.63138 | 0.01788 | 0.02379 | 0.04417 | 0.02408 | 0.21849 | 0.00803 | 0.06088 | |
| p-value | 0.6506 | 0.0005 | <0.0001 | <0.0001 | <0.0001 | 0.0007 | <0.0001 | <0.0001 | |
| *** | *** | *** | *** | *** | *** | *** | |||
| Pooled OLS | Coefficient | -0.6114 | -0.0512 | 0.12764 | 0.36155 | -0.0737 | 0.73822 | 0.02922 | 0.2991 |
| Std. Error | 0.32854 | 0.01877 | 0.02448 | 0.04589 | 0.02156 | 0.1589 | 0.00689 | 0.062 | |
| p-value | 0.0636 | 0.0067 | <0.0001 | <0.0001 | 0.0007 | <0.0001 | <0.0001 | <0.0001 | |
| * | *** | *** | *** | *** | *** | *** | *** | ||
| WLS | Coefficient | -0.3189 | -0.0571 | 0.11199 | 0.38061 | -0.0835 | 0.71774 | 0.0271 | 0.28035 |
| Std. Error | 0.26256 | 0.0142 | 0.02197 | 0.03497 | 0.02049 | 0.1479 | 0.00584 | 0.04807 | |
| p-value | 0.2254 | <0.0001 | <0.0001 | <0.0001 | <0.0001 | <0.0001 | <0.0001 | <0.0001 | |
| *** | *** | *** | *** | *** | *** | *** | |||
Table 3.
Summary of the results of the metric analysis to estimate the impact of the G component of the ESG model on the RHS variable.
Table 3.
Summary of the results of the metric analysis to estimate the impact of the G component of the ESG model on the RHS variable.
| Summary of the results of the metric analysis to estimate the impact of the G component of the ESG model on the RHS variable | |||||||||||||||
|---|---|---|---|---|---|---|---|---|---|---|---|---|---|---|---|
| Costant | SWFR | PYCC | SP | GT | EP | TPF | AAIP | WBSA | PDAL | PCR | NOFP | KW | RIU | ||
| Random-effects | Coefficient | 1.91258 | -0.131784 | 0.029789 | -0.0447872 | -0.156562 | -0.0285487 | 1.01464 | -0.0320259 | -0.0875101 | 0.25179 | -0.068159 | -0.345171 | 0.119799 | 0.107944 |
| Std. Error | 0.483357 | 0.0231713 | 0.00831672 | 0.0191117 | 0.01943 | 0.00505056 | 0.139641 | 0.00538905 | 0.0127784 | 0.027641 | 0.0126382 | 0.0394233 | 0.0245155 | 0.0226136 | |
| p-value | <0.0001 | <0.0001 | 0.0003 | 0.0191 | <0.0001 | <0.0001 | <0.0001 | <0.0001 | <0.0001 | <0.0001 | <0.0001 | <0.0001 | <0.0001 | <0.0001 | |
| *** | *** | *** | ** | *** | *** | *** | *** | *** | *** | *** | *** | *** | *** | ||
| Fixed-effects | Coefficient | 2.1178 | -0.145952 | 0.0318272 | -0.0532093 | -0.151101 | -0.0304838 | 1.08244 | -0.0308267 | -0.0875979 | 0.26702 | -0.0543467 | -0.365273 | 0.119079 | 0.0998052 |
| Std. Error | 0.502397 | 0.0274459 | 0.00866328 | 0.0202441 | 0.0203398 | 0.00531519 | 0.146157 | 0.00549322 | 0.0129606 | 0.0301434 | 0.0187585 | 0.0414316 | 0.0254073 | 0.0239785 | |
| p-value | <0.0001 | <0.0001 | 0.0003 | 0.009 | <0.0001 | <0.0001 | <0.0001 | <0.0001 | <0.0001 | <0.0001 | 0.004 | <0.0001 | <0.0001 | <0.0001 | |
| *** | *** | *** | *** | *** | *** | *** | *** | *** | *** | *** | *** | *** | *** | ||
| WLS | Coefficient | 1.90718 | -0.128797 | 0.028207 | -0.0436287 | -0.143502 | -0.0282742 | 0.893536 | -0.0305163 | -0.0754479 | 0.227894 | -0.0656816 | -0.306149 | 0.129465 | 0.106414 |
| Std. Error | 0.356514 | 0.0171689 | 0.00685262 | 0.0154451 | 0.015389 | 0.00382441 | 0.112239 | 0.00433434 | 0.0106515 | 0.0224781 | 0.00885184 | 0.0315253 | 0.0199275 | 0.0177443 | |
| p-value | <0.0001 | <0.0001 | <0.0001 | 0.005 | <0.0001 | <0.0001 | <0.0001 | <0.0001 | <0.0001 | <0.0001 | <0.0001 | <0.0001 | <0.0001 | <0.0001 | |
| *** | *** | *** | *** | *** | *** | *** | *** | *** | *** | *** | *** | *** | *** | ||
| Pooled OLS | Coefficient | 1.62128 | -0.125295 | 0.0274316 | -0.0370164 | -0.16281 | -0.0258701 | 0.905481 | -0.0337106 | -0.0878191 | 0.239999 | -0.0723725 | -0.309761 | 0.129202 | 0.117103 |
| Std. Error | 0.428778 | 0.0209924 | 0.0081271 | 0.0187183 | 0.0187875 | 0.00486522 | 0.134896 | 0.00549225 | 0.0130947 | 0.0269786 | 0.00959701 | 0.0375896 | 0.0245754 | 0.0213049 | |
| p-value | 0.0002 | <0.0001 | 0.0008 | 0.0487 | <0.0001 | <0.0001 | <0.0001 | <0.0001 | <0.0001 | <0.0001 | <0.0001 | <0.0001 | <0.0001 | <0.0001 | |
| *** | *** | *** | ** | *** | *** | *** | *** | *** | *** | *** | *** | *** | *** | ||
Table 4.
Statistical Results of the Machine Learning Predictions.
| Statistical Results of the Machine Learning Predictions | ||||
|---|---|---|---|---|
| Statistical Errors | ANN-Artificial Neural Network | PNN-Probabilistic Neural Network | Simple Regression Tree | Gradient Boosted Tree Regression |
| R^2 | -1,773 | -1,823 | -0,115 | -1,932 |
| Mean Absolute Error | 0,370 | 0,405 | 0,243 | 0,595 |
| Mean Squared Error | 0,271 | 0,313 | 0,125 | 0,413 |
| Root Mean Squared Error | 0,521 | 0,559 | 0,354 | 0,643 |
| Statistical Errors | Random Forest | Tree Ensemble Regression | Linear Regression | Polynomial Regression |
| R^2 | -20,859 | -1,439 | -3,359 | -3,705 |
| Mean Absolute Error | 0,524 | 0,448 | 0,547 | 0,670 |
| Mean Squared Error | 0,356 | 0,307 | 0,428 | 0,500 |
| Root Mean Squared Error | 0,597 | 0,554 | 0,654 | 0,707 |
Table 5.
Ranking of Algorithms Based on Their Predictive Performance.
| Ranking of Algorithms Based on Their Predictive Performance | ||||||
|---|---|---|---|---|---|---|
| Rank | Algorithms | R^2 | MAE | MSE | RMSE | Sum |
| 1 | Simple Regression Tree | 1 | 1 | 1 | 1 | 4 |
| 2 | ANN-Artificial Neural Network | 3 | 2 | 2 | 2 | 9 |
| 3 | Tree Ensemble Regression | 2 | 4 | 3 | 3 | 12 |
| 4 | PNN-Probabilistic Neural Network | 4 | 3 | 4 | 4 | 15 |
| 5 | Random Forest | 8 | 5 | 5 | 5 | 23 |
| 6 | Gradient Boosted Tree Regression | 5 | 7 | 6 | 6 | 24 |
| 7 | Linear Regression | 6 | 6 | 7 | 7 | 26 |
| 8 | Polynomial Regression | 7 | 8 | 8 | 8 | 31 |
Table 6.
Losing Regions: i.e. Regions in which is Predicted a Growth of RHS.
| Losing Regions: i.e. Regions in which is Predicted a Growth of RHS | ||||
|---|---|---|---|---|
| Regions | 2022 | Prediction | Abs Var | Per Var |
| Calabria | 7,20 | 12,30 | 5,10 | 70,83 |
| Puglia | 7,50 | 12,30 | 4,80 | 64,00 |
| Campania | 4,70 | 7,20 | 2,50 | 53,19 |
| Valle d'Aosta | 6,40 | 9,60 | 3,20 | 50,00 |
| Liguria | 5,80 | 7,70 | 1,90 | 32,76 |
| Trentino Alto Adige | 5,30 | 6,80 | 1,50 | 28,30 |
| Molise | 5,60 | 6,90 | 1,30 | 23,21 |
| Emilia Romagna | 6,40 | 7,70 | 1,30 | 20,31 |
| Veneto | 6,40 | 7,70 | 1,30 | 20,31 |
Table 7.
Winning Regions: i.e. Regions in which is Predicted a Reduction in the Level of RHS.
| Winning Regions: i.e. Regions in which is Predicted a Reduction in the Level of RHS | ||||
|---|---|---|---|---|
| Region | 2022 | Prediction | Abs Var | Per Var |
| Marche | 7,00 | 6,90 | -0,10 | -1,43 |
| Lombardia | 6,80 | 6,40 | -0,40 | -5,88 |
| Basilicata | 7,50 | 7,00 | -0,50 | -6,67 |
| Friuli Venezia Giulia | 7,70 | 6,80 | -0,90 | -11,69 |
| Umbria | 8,10 | 6,90 | -1,20 | -14,81 |
| Lazio | 6,90 | 5,80 | -1,10 | -15,94 |
| Piemonte | 9,60 | 7,70 | -1,90 | -19,79 |
| Toscana | 6,80 | 5,30 | -1,50 | -22,06 |
| Abruzzo | 7,60 | 5,80 | -1,80 | -23,68 |
| Sicilia | 7,20 | 4,70 | -2,50 | -34,72 |
| Sardegna | 12,30 | 7,60 | -4,70 | -38,21 |
Disclaimer/Publisher’s Note: The statements, opinions and data contained in all publications are solely those of the individual author(s) and contributor(s) and not of MDPI and/or the editor(s). MDPI and/or the editor(s) disclaim responsibility for any injury to people or property resulting from any ideas, methods, instructions or products referred to in the content. |
© 2024 by the authors. Licensee MDPI, Basel, Switzerland. This article is an open access article distributed under the terms and conditions of the Creative Commons Attribution (CC BY) license (http://creativecommons.org/licenses/by/4.0/).
Copyright: This open access article is published under a Creative Commons CC BY 4.0 license, which permit the free download, distribution, and reuse, provided that the author and preprint are cited in any reuse.