Submitted:
04 March 2024
Posted:
04 March 2024
You are already at the latest version
Abstract
Employing remote sensing techniques to evaluate crop residue cover (CRC) enables rapid mapping of tillage practices over large cropland areas, which has significant practical implications for monitoring the implementation of conservation tillage practices. This research utilized Sentinel-2 MSI and Landsat-8 OLI remotely sensed data, various spectral indices were calculated and the datasets were correlated with the field-measured CRC data. Selected spectral indices, highly significantly correlated, were chosen to build a correlation model between the indices and the CRC. Considering Sentinel-2 MSI and Landsat 8 OLI remotely sensed data variations in spectral and spatial scales, the accuracy of CRC models was evaluated using R2 and RMSE values. From the results, it's evident that all six spectral indices, including STI, NDTI, SRNDR, NDI5, NDI7 and NDSVI, registered correlation coefficients with the CRC exceeded 0.3 in the study area. STI and NDTI showed a stronger correlation to CRC, with coefficients of 0.810 and 0.803, respectively. For the Landsat 8 data, the lowest correlation obtained was for NDSVI with the Landsat 8 data with a correlation coefficient of 0.358. Applying the linear regression technique, STI and NDTI obtained higher accuracy compared to other indices in the Sentinel-2 MSI data. For NDTI and STI, The R2 values were 0.650 and 0.665, respectively, while their corresponding RMSE values were 3.96% and 4.03%. The highest model accuracy was obtained for the STI and NDTI constructed from the Landsat 8 OLI data (R2 values 0.41 and 0.40; RMSE values 5.25% and 5.27%, respectively). The CRC model built using partial least squares regression (PLSR) exhibited greater precision when applied to the Sentinel-2 MSI data (R2 value 0.894; RMSE value 2.18%) in comparison to the Landsat 8 OLI data (R2 value 0.695; RMSE value 3.70%). PLSR has the potential to enhance the precision of the model. In addition, the study area shows that the estimation of the CRC is better in the one-dimensional linear regression model and the PLSR model created with the Sentinel-2 MSI optical data compared to the Landsat 8 OLI optical remotely sensed data. The validation suggests that the CRC estimation in the study area is more precise when using the model relying on Sentinel-2 satellite imagery rather than the Landsat 8 OLI imagery.
Keywords:
Remote sensing
; crop residue cover
; partial least squares regression
; Sentinel-2 MSI
; Landsat 8 OLI
1. Introduction
Straw plays a vital role in conservation tillage technology and is an essential component of the farm ecosystem. Through the use of conservation tillage technology, soil erosion can be controlled, which reduces the rate of rainwater flow and evaporation by covering the soil surface with straw, which increases rainwater accumulation and decreases soil erosion [1]. Furthermore, conservation tillage technology is critical for enhancing soil organic matter content. First, the organic matter, which decomposes after the crop straw is crushed and returned to the field, can promote the adjustment of soil structure and fertility. Second, the crushing of straw and returning it to the field can also effectively reduce the burning of straw, which is of benefit to environmental air quality. Consistently implementing conservation tillage techniques can decrease the reliance on chemical fertilizers in farming and prevent the accumulation of harmful substances in the soil caused by excessive and prolonged use of such fertilizers. Undoubtedly, enhancing crop quality and yields is of great significance, as evidenced by the studies conducted by [2,3,4,5]. Considering these factors, it is imperative to monitor conservation tillage to ensure an accurate and dynamic understanding of the variations in crop residue cover (CRC).
Traditional CRC surveys are based on photo and random rope pull methods, which are often labor-intensive and time-consuming for estimating the CRC; also such surveys cannot obtain the CRC data over a large scale within a limited time-frame. The common practice of the sample line method is to straighten two ropes crossed vertically (90°) and mark each rope with equally spaced markers, then record the count of markers overlapping with the crop residue on the ground by visual interpretation. Finally, the CRC measurement is estimated by calculating the proportion of markers overlapping with the crop residue relative to the total count of markers [6]. Use of the photographic technique at an early stage was based on taking digital photos of crop straw in the field and then projecting the digital photos onto a screen featuring random dots. Ultimately, the CRC measurement for the digital images was determined by determining the proportion of random dots that intersected with the crop residue in relation to the overall quantity of random dots. Subsequently, advancements in computer technology and image recognition systems facilitated the primary derivation of the actual CRC value through extraction and classification of these digital photographs. Although this latter method is more efficient than the sample line method, it also has some limitations [7].
With the broader availability of remote sensing technology, CRC estimation has emerged as an essential study area in conservation tillage. Currently, there have been notable advances in CRC monitoring research using remote sensing. Daughtry et al. investigated the spectral response characteristics for the CRC of various crops such as wheat and maize based on measuring the reflectance spectra using an ASD hyperspectral spectrometer [8]. They pointed out that due to the specific properties of cellulose and lignin in crop straw, it exhibits distinctive absorption features around 2100 nm. The researchers developed a cellulose absorption index (CAI) for the accurate estimation of CRC. The Normalized Difference Index (NDI5), derived from the fourth and fifth bands of Landsat 5 TM data, demonstrated a significant correlation with CRC [9]. Deventer analyzed the relationship with CRC using the Normalized Difference Tillage Index (NDTI) and the Simple Tillage Index (STI) constructed based on 5th and 7th bands of the Landsat-5 TM data. The results showed a good relationship between these parameters. Gao et al. developed an inversion model for the CRC using Sentinel-2 as the data source, and with optimization using the residual line parameters, the RANDRI model exhibited a higher accuracy than the NDRI and SANDRI, particularly in high-residue covered croplands. To enhance the precision of CRC estimation, certain researchers have combined the spectral index with texture features [10]. For example, in their study by [11], demonstrated that incorporating texture characteristics into CRC retrieval could be accomplished through the use of the spectral attributes of the Sentinel-2 MSI data, which led to enhanced estimation accuracy. Xiang et al. used Sentinel-2 to invert the CRC in central Jilin Province using spectral indices and texture features, yielding an optimized accuracy by using the partial least squares method [12].
The previous studies indicated CRC is estimated primarily using the indices containing short-wave infrared band [23,24,25]. Sentinel-2 MSI data and Landsat-8 OLI remotely sensed data have similar bands and settings for crop residue cover estimation, hence performance aspects of the respective images were assessed as early as 2015. The performance disparities between the Sentinel-2 MSI and Landsat-8 OLI remotely sensed data in estimating forest variables were investigated by [13].The findings indicated that Sentinel-2 MSI exhibited superior performance than Landsat-8 OLI data regarding predicting forest variables. Korhonen et al. conducted a study on the disparities between Sentinel-2 MSI and Landsat-8 OLI data in the context of leaf area index (LAI) inversion [14]. Their findings revealed that the Sentinel-2 MSI optical data was superior to the Landsat-8 OLI optical data. Finally, in the study by [15], a comparison was made between the disparities of soil salinity inversion using Sentinel-2 MSI data and Landsat-8 OLI remotely sensed data. The findings indicated that the models derived from Sentinel-2 MSI data exhibited superior accuracy in comparison to those developed using Landsat-8 OLI data. Although both Sentinel-2 MSI and Landsat 8 OLI optical data have been commonly employed for estimating the CRC, but few studies have compared their relative performance. Clearly, there is an urgent need to document the relative merits of Sentinel-2 MSI and Landsat 8 OLI optical data with respect to CRC estimation [16].
The primary objectives of this research include: 1) evaluating the precision of Sentinel-2 MSI and Landsat-8 OLI optical data in CRC estimation; 2) enhancing the accuracy of the CRC estimation by employing the PLSR method; 3) exploring the spatial characteristics of CRC at the regional scale.
2. Data and Methods
2.1. Overview of the Study Area
Located in the southern part of the Songnen Plain, the study area, including Changchun and Siping (123°32'E-127°05'E, 42°83E-45°50'N), has a relatively flat topography. This region, characterized by fertile soil and an excellent physical soil structure, is a major agricultural area in China. Located in the southern region of the Songnen Plain, this area experiences a temperate continental monsoon climate with pronounced seasonal variations, including hot summers and cold winters. The average summer temperatures exceed 23°C, annual sunshine hours range from 2259 to 3016, and annual precipitation varies between 400 and 600 mm [17,18].
In the study area, the soil types predominantly consist of black soil, meadow soil and black calcareous soil with 34.5%, 29.06% and 15.28%, indicating a low spatial heterogeneity of soil properties. Both Siping and Changchun have average slopes below 5 degrees, respectively. In contrast, the rainfall and average air temperature of both are 657.7 and 661.8 and 6.9 and 7.1, respectively, with minor differences, and both are temperate continental semi-humid monsoon climate types [19,20]. Therefore, estimation of the CRC within the southern region of the Songnen Plain is crucial to understanding how well the implementation of conservation tillage practices is proceeding. In clear weather, CRC sampling was conducted from May 10 2022 to May 21 2022. In the study area, maize planting was typically conducted in early May. Figure 1 illustrates the geographical locations of CRC sampling points within the study area.
2.2. Data Acquisition and Pre-Processing
2.2.1. Measured CRC Acquisition
Field measurements for estimating the CRC were conducted from May 10 2022 to May 20 2022. The CRC was measured using the photographic method and based on using a sample square of side length 10 m. During sampling, the camera lens was pointed vertically downward, and the camera was kept at a distance of 1 m from the ground. Additionally, a handheld GPS position locators was utilized to determine the geographic coordinates of each sample with a 3 m accuracy. In total, there were 70 valid samples collected. The distribution map and location of all sampling sites are shown in Figure 1.
The CRC was photographed using a digital camera, with 12 photos taken at each sampling site evenly distributed along the diagonal. The area covered by each photo is approximately 1 square meter. The average of the 12 photos was used as the actual CRC value for the sample point. Based on the manual visual interpretation method, training samples were constructed from different classes of regions of interest (ROI). To determine the CRC, the samples were classified into two categories, crop straw and soil, using support vector machine (SVM) supervised classification. The calculation of crop cover was based on using the number of images of crop straw as the numerator and the number of images of soil and crop straw as the denominator [11]. Since the measurement were collected after planting in spring, it was less likely that we would get exceptionally high values for maize residue cover, with most being around 15 percent.
In the formula: a and b refer to the number of images of crop straw and soil, respectively.
2.2.2. Data Preprocessing for Remote Sensing
The Sentinel-2 MSI optical data for Changchun and Siping from May 10 to May 20 2022 were acquired from GEE (https://earthengine.google.com/) for CRC estimation.Sentinel-2 satellites feature a multispectral imager covering 13 bands, spanning from visible to short-wave infrared spectra, offering spatial resolutions of 10 m, 20 m, and 60 m for different bands. The swath width of the Sentinel-2 MSI is 290 km. Sentinel-2A features a revisit period of ten days, which reduces to five days when operated in conjunction with Sentinel-2B [21]. The Class 2A product is a radiometric calibrated and atmospherically corrected low-level atmospheric reflectance product (Table S2).
Remote sensing images from Landsat 8 OLI, covering the study area between May 10 and May 25, 2022, were acquired from GEE (https://earthengine.google.com/). The eighth earth observation satellite in the U.S. Landsat program, Landsat 8, was sent into orbit from California on February 11, 2013 [22]. Landsat uses nine bands, including panchromatic bands offering a spatial resolution of 15 meters, and visible, near-infrared, and short-wave infrared bands having a 30-m spatial resolution, an imaging swath of 185 × 185 km, and a revisit period of 16-days (Table S1).
2.3. Spectral Indices for CRC Estimation
The CRC model was constructed based on Sentinel-2 MSI and Landsat 8 OLI remote sensing data in this experiment. Six relatively mature and more commonly used spectral indices are selected in this study, as detailed in Table 1. Five out of the six tillage indices are based on the normalized difference format, such as NDTI. NDTI utilizes the reflectance and ratio of the visible and near-infrared bands to assess tillage activities, enabling the detection and differentiation of tilled and untilled land [23]. NDI is an index used to evaluate specific targets or parameters in remote sensing images, and the calculation of NDI varies depending on the research objectives and the spectral bands used. SRNDI is an index calculated using spectral ratios to mitigate the impact of atmospheric conditions, surface reflectance, and illumination differences between different images [24]. NDSVI assesses the distribution and condition of soil and vegetation in remote sensing images, calculated based on differences in reflectance between the infrared and visible bands [25]. STI is a remote sensing index that evaluates tillage activities in agricultural fields. It quantifies the changes in reflectance between pre- and post-tillage conditions, calculated by comparing the reflectance values of specific spectral bands before and after tillage operations. Table 1 illustrates the bands corresponding to Sentinel-2 MSI and Landsat 8 OLI [12].
2.4. PLSR Method
The PLSR method is an approach to multivariate statistical analysis for practical applications. This method is used mainly for construction of linear regression models between multiple dependent and independent variables. Multicollinearity is mitigated by the PLSR method. Having more observations than variables significantly improves the construction of the model. The use of PLSR can eliminate the resulting negative impact [26]. This study involves many spectral indices, and there is a particular correlation problem with respect to the calculation of each band combination. By performing principal component analysis (PCA) and calculating the relationship between their independent variables in the preliminary stage, it was found that there were different degrees of covariance between the respective variables. Therefore, the PLSR method can eliminate the covariance problem between multiple independent variables. The PLSR model is particularly advantageous when a set of dependent variables needs to be predicted from many independent variables while effectively solving strong covariance and noise problems in multiple independent variables. Compared with other traditional least squares methods, PLSR can effectively compress the covariance strength of variables and provide richer information, which can be applied to complex analytical systems [27].In its simplest form, the linear model consists of a series of predictor (x) variables and the dependent variable y [28,29]:
In the formula: b0 is the intercept of the regression coefficient and the bi value is the regression coefficient calculated from variable 1 to p for the data.
2.5. Evaluation of Accuracy of Fitting
2.5.1. Coefficient of Determination (R2) and Root Mean Square Error (RMSE)
In order to establish a regression relationship between the observed CRC values and the Sentinel-2 MSI optical data, only those spectral indices with the best fit were selected. In this study, Seventy percent of the observed CRC values and the responsible Sentinel 2 MSI optical data were allocated for constructing the training set, while the remaining thirty percent was dedicated to establishing the validation set. In observed and remotely sensed datasets, there were 70 samples, 47 for training, and 23 for validation. The model accuracy was evaluated by R2 and RMSE values [30,31]. RMSE shrinks as R2 approaches 1, resulting in a better inversion effect and vice versa (i.e., the worse the model fit is). The R2 and the RMSE values were calculated as follows:
In the formula: x_1 denotes the actual CRC value, x_2 denotes the CRC prediction value, denotes the average value of actual CRC and n is the sampling points number.
2.5.2. Pearson Product-Moment Correlation Coefficient (PPMCC)
The PPMCC measures the correlation between two variables, yielding a value ranging from -1 to 1 [32,33]. The intensity of the variables correlation is usually judged with reference to the following range of correlation coefficient values: 0.8-1.0 indicates a very strong correlation; 0.6-0.8 denotes a strong correlation; 0.4-0.6 suggests a moderate correlation; 0.2-0.4 rep-resents a weak correlation; 0.0-0.2 characterizes a very weak correlation.
In the given formula: symbolizes the spectral indices, denotes the average spectral index, denotes the MRC measured value, symbolizes the average of the measured MRC value.
3. Results
3.1. CRC Extraction for the Study Area
The CRC values for the sample plots can be obtained by distinguishing between the crop straw and the soil in the photographs. First, the photos were trimmed to retain only the crop straw and soil parts. Second, the photos were classified using ENVI software. The results for the CRC for all samples in the experiments were obtained from the support vector machine (SVM) classification. The original sample images and its corresponding classification are illustrated in Figure 2. The classification accuracy was determined using the Kappa coefficient in conjunction with the confusion matrix evaluation coefficient. The overall accuracy of classification for the ground truth sample data was 87.7%, and the Kappa coefficient was 0.85. For the study area, the CRC was characterized by analyzing the main statistical parameters such as minimum, maximum, mean values, sample size, coefficient of variation, skewness, standard deviation, and kurtosis (Table 2). The mean CRC value for the entire dataset in the study area was 0.05, ranging from 0.01 to 0.42. Since the cropland in the study area is already in post-planting between May 10 and 20, and the tillage practice in the area is conventional tillage in 2022, the crop residue cover of the farmland in study area was usually be low, below 10%. As illustrated in Figure 1, the spatial distribution of modeling and validation points under-scores the representativeness of both datasets across the entire study area.
3.2. Correlation Analysis of Spectral Indices to CRC
Correlation analysis usually refers to the analysis of two or more sets of related variables, which indicates to a certain extent a close relationship between the dependent and independent variables; the closer the relationship is, the higher is the correlation between that spectral index and the CRC. This study used the PPMCC method to examine the correlation between the CRC with the spectral index. Figure 3 displays the correlation between the spectral index of the remotely sensed data and observed CRC. The correlation coefficient between multiple spectral indices of Sentinel-2 MSI and the CRC is found to be higher, benefiting from its high spatial resolution. Among the results, the NDTI, STI, and correlation coefficients with CRC were higher, with values for the latter being 0.803 and 0.810, respectively. In addition, the NDSVI and NDI5 had lower correlation coefficients with the CRC, recorded at 0.709 and 0.725, respectively. Six key spectral indices, derived from the correlation analysis, were subsequently employed in the development of the CRC inversion model. Of these, the STI and NDTI spectral indices demonstrated higher estimation for the CRC in the univariate regression model, with R2 of 0.665 and 0.65, respectively, and corresponding RMSE of 3.96% and 4.03%, as shown in Figure 4.
Furthermore, the association between the Landsat-based spectral indices and the observed CRC is depicted in Figure 5. The relatively low correlation coefficient between multiple spectral indices and the CRC may be attributed to the finer spatial resolution of Sentinel-2 MSI (10 m) relative to the coarser 30 m resolution of Landsat 8 OLI data. Among the indices, the NDTI, STI, and NDI7 exhibited higher correlation coefficients with the CRC, the values being 0.641, 0.637, and 0.524, respectively, while the NDSVI and NDI5 had lower correlation coefficients with the CRC, the values being 0.358 and 0.387, respectively. With respect to the correlation analysis, six spectral indices were selected for constructing the CRC inversion model. Of these, the STI and NDTI spectral indices demonstrated higher estimation for the CRC in the univariate regression model, with R2 of 0.41 and 0.40, respectively, and corresponding RMSE of 5.25% and 5.27%, as shown in Figure 5.
3.3. CRC Inversion Using PLSR
Due to the low accuracy of the univariate-based linear regression model, we attempted to construct a regression model based on the PLSR method. As shown in Table 3, the PLSR models constructed from Sentinel-2 MSI and Landsat 8 OLI optical data were evaluated for their accuracy. The CRC model constructed using Sentinel-2 MSI data demonstrated higher accuracy (R2 value of 0.894; RMSE of 2.18%) compared to that using Landsat 8 OLI data (R2 value of 0.695; RMSE of 3.70%).The training and validation datasets of the CRC estimation model, utilized Sentinel-2 MSI optical data, exhibited higher accuracy and stability than those based on Landsat-8 OLI optical data.
The CRC models developed using the PLSR method and data from Sentinel-2 MSI and Landsat 8 OLI are shown in Figure 6, along with their R2 and RMSE values. Using Sentinel-2 MSI data, the PLSR method-constructed model demonstrated high accuracy for the validation set, as evidenced by an R2 value of 0.897 and an RMSE of 1.40%. However, for the Landsat 8 OLI data, the constructed model exhibited lower accuracy in the validation set, as indicated by an R2 value of 0.769 and an RMSE of 2.10%. These results indicated that employing the PLSR method can enhance model accuracy. In summary, the CRC model derived from Senti-nel-2 MSI data demonstrated significantly higher accuracy compared to that from Landsat 8 OLI data.
3.4. The CRC Prediction Maps
CRC prediction based on the Sentinel-2 MSI and Landsat-8 OLI remotely sensed data are presented in Figure 7 and Figure 8, respectively. The prediction maps display similar spatial tendencies. However, as mentioned previously, the prediction accuracy based on Sentinel-2 MSI remotely sensed data surpasses that of that from Landsat 8 OLI data. Areas with higher CRC values due to straw were identified close to Lishu County in the southern part of Siping City, near Nong'an County in the eastern part of Changchun City, and around Gongzhuling County in the southern part of Changchun City. This aspect is connected mainly with implementation of national or local agricultural policies. To promote the sustainable development of agriculture, Lishu County introduced a new regime for the return of conservation tillage straw to the field. After the autumn harvest of corn, all the straw is broken up and returned to the field, so the area has a high CRC. Nong'an County, a national mechanization demonstration region, has promoted the mulching of straw and its return to the field via conservation tillage technology and has become the county which widely promotes this technology. Specifically, the arable land in the county features a high degree of straw mulching such that after the harvest the corn is mulched and returned to the field. Conservation tillage technology is also widely pro-moted in Gongzhuling County, so the CRC in this area is relatively high.
4. Discussion
Directly correlating the spectral reflectance from remote sensing images to the CRC is challenging, thus six spectral indices were used as a means to predict the CRC. The models constructed based on univariate linear regression generally had low accuracy, therefore, we sought to construct regression models using the PLSR method, which in combination with the spectral indices were used to predict the CRC values. In this study, Sentinel-2 MSI and Land-sat-8 OLI remotely sensed data were employed to investigate the influence of spectral scale and spatial resolution variations on the CRC inversion.
Regarding the NDTI and STI, models developed with the B11 and B12 bands of Sentinel-2 MSI remotely sensed data showed the highest correlation coefficients with the CRC, exhibiting PPMCC values of 0.861 and 0.860, respectively. Similarly, the NDTI and STI, constructed using the B6 and B7 bands of Landsat 8 OLI remotely sensed data, exhibited the highest correlation with the CRC, with PPMCC value of 0.641 and 0.637, respectively. The highest correlation with the CRC was observed for the NDTI and STI in both remotely sensed data, there being excellent agreement between the two models. The highest correlation obtained in these combinations may be related to the fact that the central wavelengths of both the B12 band using Sentinel-2 MSI data and the B7 band using Landsat 8 data are around 2100 nm. According to previous studies, the CRC is sensitive to the wavelength region near 2100 nm, especially so in the spectral reflectance band around 2100 nm [34,35]. This unique spectral domain may be used as a predictor of the CRC content. This finding aligns with that reported in previous studies. Deventer et al. investigated the STI and NDTI using Landsat-5 TM data, finding that these spectral indices exhibited a strong correlation with the CRC and were effective in differentiating soil from straw [36]. Sharma et al. employed six TIs in a linear regression model to estimate the CRC. Pronounced correlations were observed with the STI and NDTI, producing R2 values of 0.78 and 0.89, respectively [37]. Xiang et al. using Sentinel-2 re-motely sensed data, selected multiple spectral indices and used a one-dimensional linear regression method to develop a predictive model using these indices and the CRC [12]. The results indicated that the linear regression models employing the NDTI and STI had higher accuracy.
To enhance the inversion accuracy further, the PLSR algorithm was utilized for constructing the inversion model. The PLSR model developed from Sentinel-2 MSI data demonstrated high accuracy, evidenced by R2 and RMSE values of 0.894 and 2.18%, respectively. In contrast, the PLSR model utilizing Landsat 8 OLI data showed comparatively lower accuracy, with R2 and RMSE values at 0.695 and 3.70%, respectively. During the experiments, both datasets were subjected to the PLSR method to estimate the CRC. Good experimental results were realized, which indicates that the PLSR method can be applied to estimate the CRC in the study area. Employing the PLSR method can effectively enhance the accuracy of model in-version, showing performance comparable to that reported in similar studies. For example, Xiang et al. employed the PLSR model to invert the CRC in the southern Songnen Plain, incorporating the spectral index and texture features derived from Sentinel-2 MSI [12]. The results demonstrated that using the PLSR model in combination with texture features and spectral indices significantly improved the model's inversion accuracy.
The univariate based linear regression model was constructed as shown in Figure 4 and Figure 5. The accuracy of the Sentinel-based inversion model surpassed that of Landsat-based inversion model. Additionally, when estimating the CRC for the study area using the PLSR method, the model derived from Sentinel-2 MSI data demonstrated superior accuracy compared to that developed from Landsat 8 OLI data, as detailed in Table 3.
Overall, the accuracy of both the one-dimensional linear regression model and the PLSR model, when constructed from Sentinel-2 MSI data, was superior to that from Landsat 8 OLI data. In an attempt to explain this, first it should be noted that the central wavelengths of both remote sensing sources, corresponding to the bands selected in this study, do not differ significantly. However, the reflectance data from Sentinel-2 MSI, as indicated in Tables S1 and S2, utilize narrower bandwidths compared to those of Landsat 8 OLI data, resulting in a higher spectral resolution. The Landsat 8 OLI features a bandwidth of 200 nm in its B7 band, where-as the Sentinel-2 MSI's B12 band has a narrower bandwidth of 180 nm. This difference facilitates more precise identification of CRC information on the ground [38]. Secondly, the Senti-nel-2 MSI data is characterized by its higher spatial resolution. In ground measurements, the sample size is set to 10 meters to correspond with the spatial resolution of the Sentinel-2 MSI data. In contrast, the spatial resolution of Landsat 8 OLI is 30 meters, resulting in a greater number of mixed pixels during signal processing. Although representativeness is considered when selecting sample points, the 30-meter pixels of Landsat 8 OLI might exhibit greater spatial heterogeneity compared to the 10-meter pixels of Sentinel-2 MSI optical data. Therefore, the pixel values of the Sentinel-2 MSI optical data may more accurately depict the straw cover at the actual sampling points. The study results suggest that the sample area of the sampling points significantly impacts the experimental outcomes, hence the importance of considering the spatial resolution of the image when setting the sample area [39]. Finally, the Sentinel-2 MSI data boast a higher temporal resolution, offering revisits every five days in contrast to the 16-day interval of Landsat 8 OLI data. The remote sensing data acquisition spanned from May 10 to May 20, 2022 in this study. On GEE, inputting the desired image's start and end times is sufficient to retrieve all images within the specified period, and the Sentinel-2 MSI data (May 20 2022) was closer to the actual sampling time than the Landsat 8 OLI data (May 25 2022) [40]. These factors contributed to the enhanced accuracy of the CRC estimation model utilizing Sentinel-2 MSI data, in comparison to the model derived from Landsat 8 OLI data.
This study's findings indicate that the model accuracy, when estimating the CRC based on Sentinel-2 MSI data, surpasses that of models using Landsat 8 OLI data. The PLSR method exhibits a significant increase in the CRC estimation accuracy, consistent across both satellite datasets. The final model demonstrates high precision. However, CRC estimation via remote sensing technology is sensitive to external factors, including the soil type, soil texture, moisture content of soil and straw and the growth of green vegetation. In addition, the limited amount of field-measured CRC data influences the model's accuracy. These external in-fluences will be evaluated in an attempt to further improve model accuracy and more accurately estimate the CRC information in the area of interest [41,42,43,44].
5. Conclusions
Estimation of the CRC, utilizing the PLSR method and satellite remote sensing data, has been conducted. An assessment was made of the relative advantages of using Sentinel-2 MSI versus Landsat 8 OLI remotely sensed data in CRC estimation, particularly considering the impact of spatial scale and spectral resolution differences. This study resulted in the following conclusion:
- (1)
- From the comprehensive analysis of results, it's evident that all six spectral indices, including STI, NDTI, SRNDR, NDI5, NDI7 and NDSVI, registered correlation coefficients with the CRC exceeded 0.3 in the study area, indicating a consistent and notable relationship across various indices.
- (2)
- In a detailed comparison of data sources, the NDTI and STI, when derived from Sen-tinel-2 MSI remotely sensed data, yielded higher correlation coefficients of 0.803 and 0.810, respectively. Conversely, the NDSVI based on Landsat 8 OLI data exhibited the lowest correlation, with a coefficient of 0.358, pointing to a variance in data source effectiveness for spectral analysis.
- (3)
- Employing the one-dimensional linear regression method, the STI and NDTI using Sentinel-2 MSI data exhibited higher accuracies compared to other indices, producing R2 values of 0.665 and 0.650, and RMSE values of 3.96% and 4.03%, respectively. Spectral indices STI and NDTI, constructed from Landsat 8 OLI data, exhibited the highest estimation accuracy with R2 values of 0.41 and 0.40, respectively, and RMSE values of 5.25% and 5.27%, respectively. In contrast, the CRC model constructed using the PLSR method and Sentinel-2 MSI data demonstrated superior accuracy, with an R2 value of 0.894 and an RMSE value of 2.18%, outperforming the Landsat 8 OLI data, which had an R2 value of 0.695 and an RMSE value of 3.70%. The CRC model constructed using the Sentinel-2 MSI data was considered superior to the Landsat-8 OLI optical data in estimating the CRC. Furthermore, the PLSR model constructed based on Sentinel-2 MSI data was determined to be more effective for estimating the CRC compared to the model based on the Landsat 8 OLI data.
Supplementary Materials
The following supporting information can be downloaded at the website of this paper posted on Preprints.org.
Author Contributions
Conceptualization, J.D. and K.S.; methodology, J.D. and K.S.; software, Y.Z. and Z.L.; validation, J.D., Y.Z. and Z.L.; formal analysis, Y.Z. and Z.L.; investigation, J.D. and Y.Z.; resources, Y.Z. and Z.L.; data curation, Y.Z. and Z.L.; writing—original draft preparation, J.D. and Y.Z.; writing—review and editing, J.D.; visualization, Y.Z. and Z.L.; supervision, J.D. and K.S.; project administration, J.D. and K.S.; funding acquisition, J.D. and K.S. All authors have read and agreed to the published version of the manuscript.
Funding
This study was jointly supported by the National Key Research and Development Program of China (2021YFD1500103), the Science and Technology Project for Black Soil Granary (XDA28080500) and the Common Application Support Platform for National Civil Space Infrastructure Land Observation Satellites (2017-000052-73-01-001735).
Data Availability Statement
Not applicable.
Acknowledgments
The authors would like to thank the anonymous reviewers for their valuable comments on the manuscript, which helped improve the quality of the paper. We would also like to thank the Charlesworth Author Services for English language editing.
Conflicts of Interest
The authors declare no conflict of interest. The funders had no role in the design of the study; in the collection, analyses, or interpretation of data; in the writing of the manuscript, or in the decision to publish the results.
References
- YAN, Q.; Fei, D.; Ge, L.; Feng, Y.; LU, J.; Feng, L.; ZHANG, J.; LI, J.; DUAN, Z. Alternate Row Mulching Optimizes Soil Temperature and Water Conditions and Improves Wheat Yield in Dryland Farming. Journal of integrative agriculture 2018, 17, 2558–2569. [Google Scholar] [CrossRef]
- Chen, S.; Xu, C.; Yan, J.; Zhang, X.; Zhang, X.; Wang, D. The influence of the type of crop residue on soil organic carbon fractions: An 11-year field study of rice-based cropping systems in southeast China. Agric. Ecosyst. Environ. 2016, 223, 261–269. [Google Scholar] [CrossRef]
- Matinfar, H.R.; Maghsodi, Z.; Mousavi, S.R.; Rahmani, A. Evaluation and Prediction of Topsoil organic carbon using Machine learning and hybrid models at a Field-scale. CATENA 2021, 202, 105258. [Google Scholar] [CrossRef]
- Kavoosi, Z.; Raoufat, M.H.; Dehghani, M.; Abdolabbas, J.; Kazemeini, S.A.; Nazemossadat, M.J. Feasibility of satellite and drone images for monitoring soil residue cover. J. Saudi Soc. Agric. Sci. 2020, 19, 56–64. [Google Scholar] [CrossRef]
- Wang, S.; Huang, X.; Zhang, Y.; Yin, C.; Richel, A. The effect of corn straw return on corn production in Northeast China: An integrated regional evaluation with meta-analysis and system dynamics. Resour. Conserv. Recycl. 2021, 167, 105402. [Google Scholar] [CrossRef]
- Laflen, J.; Amemiya, M.; Hintz, E. Measuring Crop Residue Cover. Journal of soil and Water Conservation 1981, 36, 341–343. [Google Scholar]
- Morrison, J.E.; Huang, C.-H.; Lightle, D.T.; Daughtry, C.S. Residue Measurement Techniques. Journal of soil and water conservation 1993, 48, 478–483. [Google Scholar]
- Daughtry, C.; Hunt, E.; McMurtrey, J. Assessing crop residue cover using shortwave infrared reflectance. Remote. Sens. Environ. 2004, 90, 126–134. [Google Scholar] [CrossRef]
- McNairn, H.; Protz, R. Mapping Corn Residue Cover on Agricultural Fields in Oxford County, Ontario, Using Thematic Mapper. Can. J. Remote. Sens. 1993, 19, 152–159. [Google Scholar] [CrossRef]
- Gao, L.; Zhang, C.; Yun, W.; Ji, W.; Ma, J.; Wang, H.; Li, C.; Zhu, D. Mapping crop residue cover using Adjust Normalized Difference Residue Index based on Sentinel-2 MSI data. Soil Tillage Res. 2022, 220, 105374. [Google Scholar] [CrossRef]
- Cai, W.; Zhao, S.; Wang, Y.; Peng, F.; Heo, J.; Duan, Z. Estimation of Winter Wheat Residue Coverage Using Optical and SAR Remote Sensing Images. Remote. Sens. 2019, 11, 1163. [Google Scholar] [CrossRef]
- Xiang, X.; Du, J.; Jacinthe, P.-A.; Zhao, B.; Zhou, H.; Liu, H.; Song, K. Integration of tillage indices and textural features of Sentinel-2A multispectral images for maize residue cover estimation. Soil Tillage Res. 2022, 221, 105405. [Google Scholar] [CrossRef]
- Astola, H.; Häme, T.; Sirro, L.; Molinier, M.; Kilpi, J. Comparison of Sentinel-2 and Landsat 8 imagery for forest variable prediction in boreal region. Remote. Sens. Environ. 2019, 223, 257–273. [Google Scholar] [CrossRef]
- Korhonen, L.; Hadi; Packalen, P. ; Rautiainen, M. Comparison of Sentinel-2 and Landsat 8 in the estimation of boreal forest canopy cover and leaf area index. Remote Sens. Environ. 2017, 195, 259–274. [Google Scholar] [CrossRef]
- Wang, J.; Ding, J. , Yu, D., Ma, X., Zhang, Z., Ge, X. Teng, D.; Li, X.; Liang, J.; Guo, Y.; et al. Machine learning-based detection of soil salinity in an arid desert region, Northwest China: A comparison between Landsat-8 OLI and Sentinel-2 MSI. Sci. Total. Environ. 2020, 707, 136092. [Google Scholar] [CrossRef] [PubMed]
- Luo, S.; Tian, L.; Chang, C.; Wang, S.; Zhang, J.; Zhou, X.; Li, X.; Tran, L.P.; Tian, C. Grass and maize vegetation systems restore saline-sodic soils in the Songnen Plain of northeast China. Land Degrad. Dev. 2018, 29, 1107–1119. [Google Scholar] [CrossRef]
- Song, X.-D.; Yang, F.; Ju, B.; Li, D.-C.; Zhao, Y.-G.; Yang, J.-L.; Zhang, G.-L. The influence of the conversion of grassland to cropland on changes in soil organic carbon and total nitrogen stocks in the Songnen Plain of Northeast China. CATENA 2018, 171, 588–601. [Google Scholar] [CrossRef]
- Wang, L.; Seki, K.; Miyazaki, T.; Ishihama, Y. The causes of soil alkalinization in the Songnen Plain of Northeast China. Paddy Water Environ. 2009, 7, 259–270. [Google Scholar] [CrossRef]
- Zhou, M.; Liu, X.; Meng, Q.; Zeng, X.; Zhang, J.; Li, D.; Wang, J.; Du, W.; Ma, X. Additional application of aluminum sulfate with different fertilizers ameliorates saline-sodic soil of Songnen Plain in Northeast China. J. Soils Sediments 2019, 19, 3521–3533. [Google Scholar] [CrossRef]
- Dou, S.; Guo, D. ; others Soil Type Distribution and Black Soil Land Protection in Jilin Province. Journal of Jilin Agricultural University 2018, 40, 449–456. [Google Scholar]
- Wang, Q.; Shi, W.; Li, Z.; Atkinson, P.M. Fusion of Sentinel-2 Images. Remote sensing of environment 2016, 187, 241–252. [Google Scholar] [CrossRef]
- Vermote, E.; Justice, C.; Claverie, M.; Franch, B. Preliminary Analysis of the Performance of the Land-sat 8/OLI Land Surface Reflectance Product. Remote Sensing of Environment 2016, 185, 46–56. [Google Scholar] [CrossRef]
- Chi, Y.; Sun, J.; Sun, Y.; Liu, S.; Fu, Z. Multi-temporal characterization of land surface temperature and its relationships with normalized difference vegetation index and soil moisture content in the Yellow River Delta, China. Glob. Ecol. Conserv. 2020, 23, e01092. [Google Scholar] [CrossRef]
- Jin, X.; Ma, J.; Wen, Z.; Song, K. Estimation of Maize Residue Cover Using Landsat-8 OLI Image Spectral Information and Textural Features. Remote. Sens. 2015, 7, 14559–14575. [Google Scholar] [CrossRef]
- Serbin, G.; Daughtry, C.S.; Hunt Jr, E.R.; Brown, D.J.; McCarty, G.W. Effect of Soil Spectral Properties on Remote Sensing of Crop Residue Cover. Soil Science Society of America Journal 2009, 73, 1545–1558. [Google Scholar] [CrossRef]
- Chen, P.; Jing, Q. A comparison of two adaptive multivariate analysis methods (PLSR and ANN) for winter wheat yield forecasting using Landsat-8 OLI images. Adv. Space Res. 2017, 59, 987–995. [Google Scholar] [CrossRef]
- Shen, L.; Gao, M.; Yan, J.; Li, Z.-L.; Leng, P.; Yang, Q.; Duan, S.-B. Hyperspectral Estimation of Soil Organic Matter Content using Different Spectral Preprocessing Techniques and PLSR Method. Remote. Sens. 2020, 12, 1206. [Google Scholar] [CrossRef]
- Geladi, P.; Kowalski, B.R. Partial least-squares regression: a tutorial. Anal. Chim. Acta 1986, 185, 1–17. [Google Scholar] [CrossRef]
- Jin, X.; Xu, X.; Song, X.; Li, Z.; Wang, J.; Guo, W. Estimation of Leaf Water Content in Winter Wheat Using Grey Relational Analysis–Partial Least Squares Modeling with Hyperspectral Data. Agron. J. 2013, 105, 1385–1392. [Google Scholar] [CrossRef]
- Ćalasan, M.; Aleem, S.H.A.; Zobaa, A.F. On the root mean square error (RMSE) calculation for parameter estimation of photovoltaic models: A novel exact analytical solution based on Lambert W function. Energy Convers. Manag. 2020, 210, 112716. [Google Scholar] [CrossRef]
- Di Bucchianico, A. Coefficient of Determination (R 2). Encyclopedia of statistics in quality and reliability 2008, 1. [Google Scholar]
- Abdel-Megeed, S.M. Accuracy of Correlation Coefficient with Limited Number of Points. J. Exp. Educ. 1984, 52, 188–191. [Google Scholar] [CrossRef]
- Häne, B.G.; Jäger, K.; Drexler, H.G. The Pearson product-moment correlation coefficient is better suited for identification of DNA fingerprint profiles than band matching algorithms. Electrophoresis 1993, 14, 967–972. [Google Scholar] [CrossRef]
- Daughtry, C.S. Discriminating Crop Residues from Soil by Shortwave Infrared Reflectance. Agron. J. 2001, 93, 125–131. [Google Scholar] [CrossRef]
- Xie, S.; Li, Y.; Wang, X.; Liu, Z.; Ma, K.; Ding, L. Research on estimation models of the spectral characteristics of soil organic matter based on the soil particle size. Spectrochim. Acta Part A: Mol. Biomol. Spectrosc. 2021, 260, 119963. [Google Scholar] [CrossRef] [PubMed]
- Van Deventer, A.; Ward, A.; Gowda, P.; Lyon, J. Using Thematic Mapper Data to Identify Contrasting Soil Plains and Tillage Practices. Photogrammetric engineering and remote sensing 1997, 63, 87–93. [Google Scholar]
- Sharma, V.; Irmak, S.; Kilic, A.; Sharma, V.; Gilley, J.E.; Meyer, G.E.; Knezevic, S.Z.; Marx, D. Quantification and Mapping of Surface Residue Cover for Maize and Soybean Fields in South Central Nebraska. Trans. ASABE 2016, 59, 925–939. [Google Scholar] [CrossRef]
- Mandanici, E.; Bitelli, G. Preliminary Comparison of Sentinel-2 and Landsat 8 Imagery for a Combined Use. Remote. Sens. 2016, 8, 1014. [Google Scholar] [CrossRef]
- Fassnacht, F.; Hartig, F.; Latifi, H.; Berger, C.; Hernández, J.; Corvalán, P.; Koch, B. Importance of Sample Size, Data Type and Prediction Method for Remote Sensing-Based Estimations of Above-ground Forest Biomass. Remote Sensing of Environment 2014, 154, 102–114. [Google Scholar] [CrossRef]
- Zheng, B.; Campbell, J.B.; de Beurs, K.M. Remote sensing of crop residue cover using multi-temporal Landsat imagery. Remote. Sens. Environ. 2012, 117, 177–183. [Google Scholar] [CrossRef]
- Serbin, G.; Daughtry, C.S.; Hunt Jr, E.R.; Brown, D.J.; McCarty, G.W. Effect of Soil Spectral Properties on Remote Sensing of Crop Residue Cover. Soil Science Society of America Journal 2009, 73, 1545–1558. [Google Scholar] [CrossRef]
- Bannari, A.; Pacheco, A.; Staenz, K.; McNairn, H.; Omari, K. Estimating and mapping crop residues cover on agricultural lands using hyperspectral and IKONOS data. Remote. Sens. Environ. 2006, 104, 447–459. [Google Scholar] [CrossRef]
- Pacheco, A.; McNairn, H. Evaluating multispectral remote sensing and spectral unmixing analysis for crop residue mapping. Remote. Sens. Environ. 2010, 114, 2219–2228. [Google Scholar] [CrossRef]
- Serbin, G.; Daughtry, C.S.; Hunt Jr, E.R.; Reeves III, J.B.; Brown, D.J. Effects of Soil Composition and Mineralogy on Remote Sensing of Crop Residue Cover. Remote Sensing of Environment 2009, 113, 224–238. [Google Scholar] [CrossRef]
Figure 1.
Geographical location of CRC sampling points in the study area.
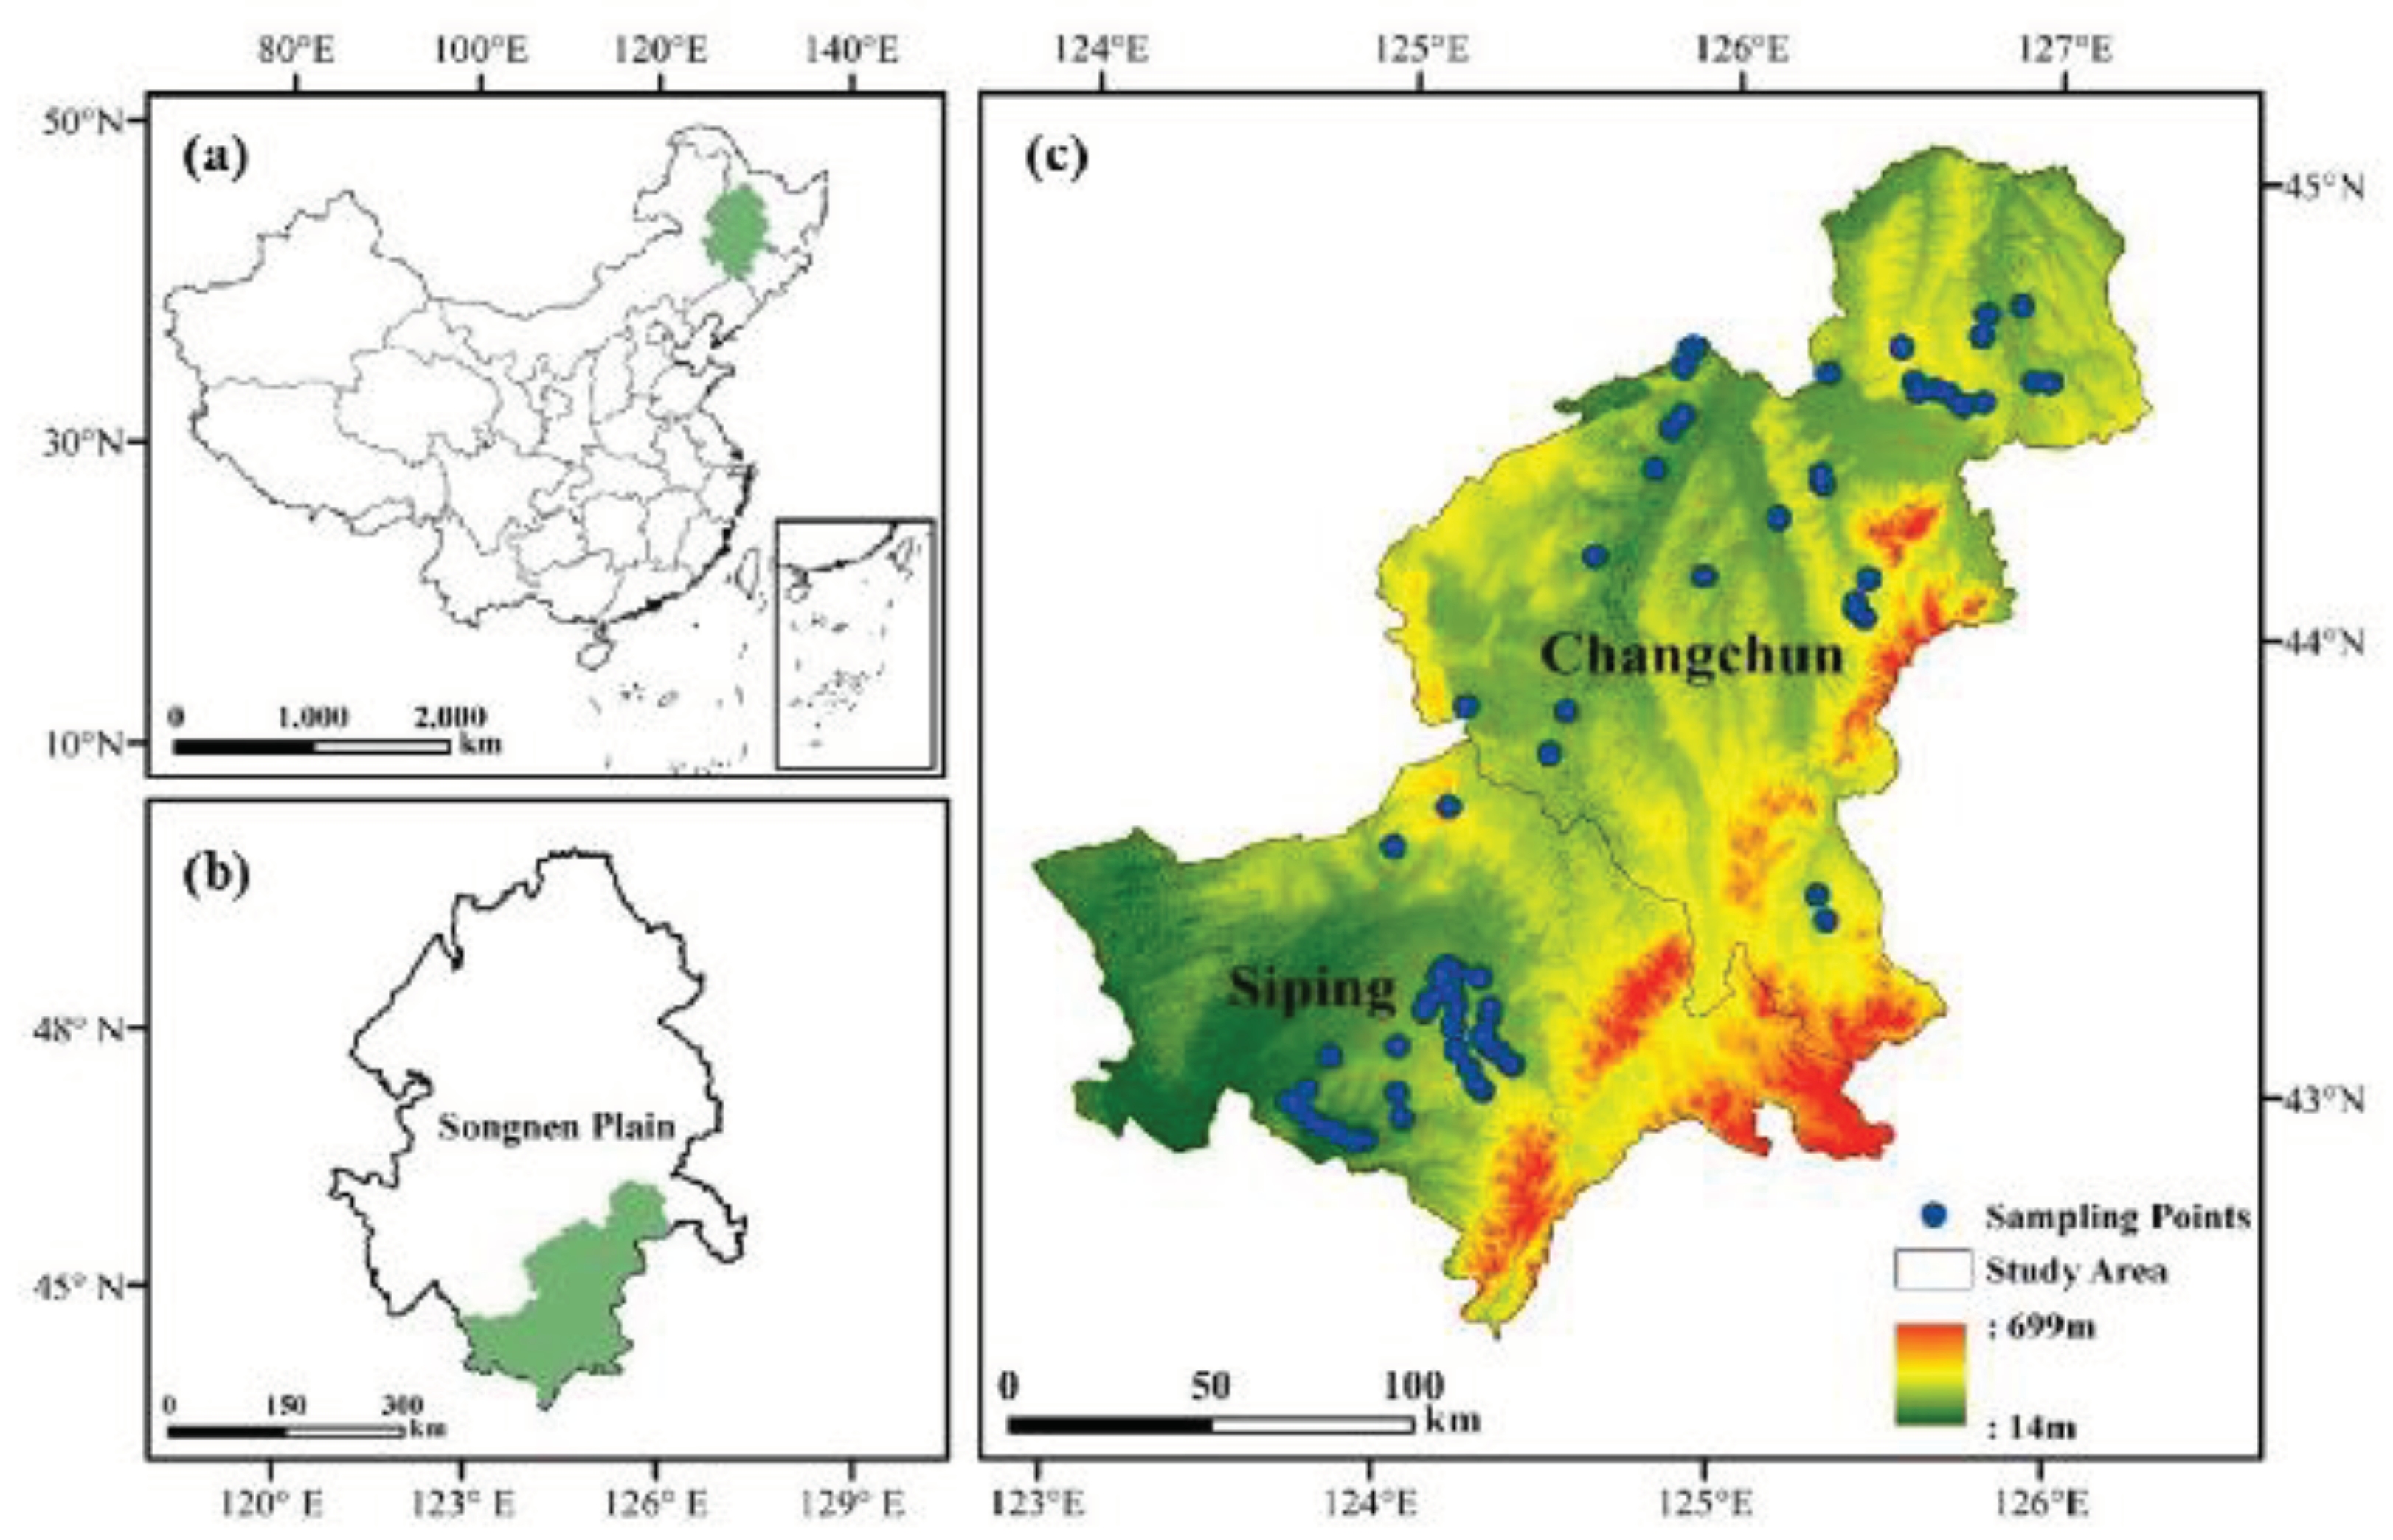
Figure 2.
Comparison of sample point pre- and post-classification: (a) Original photo; (b) Image for crop extraction).
Figure 2.
Comparison of sample point pre- and post-classification: (a) Original photo; (b) Image for crop extraction).
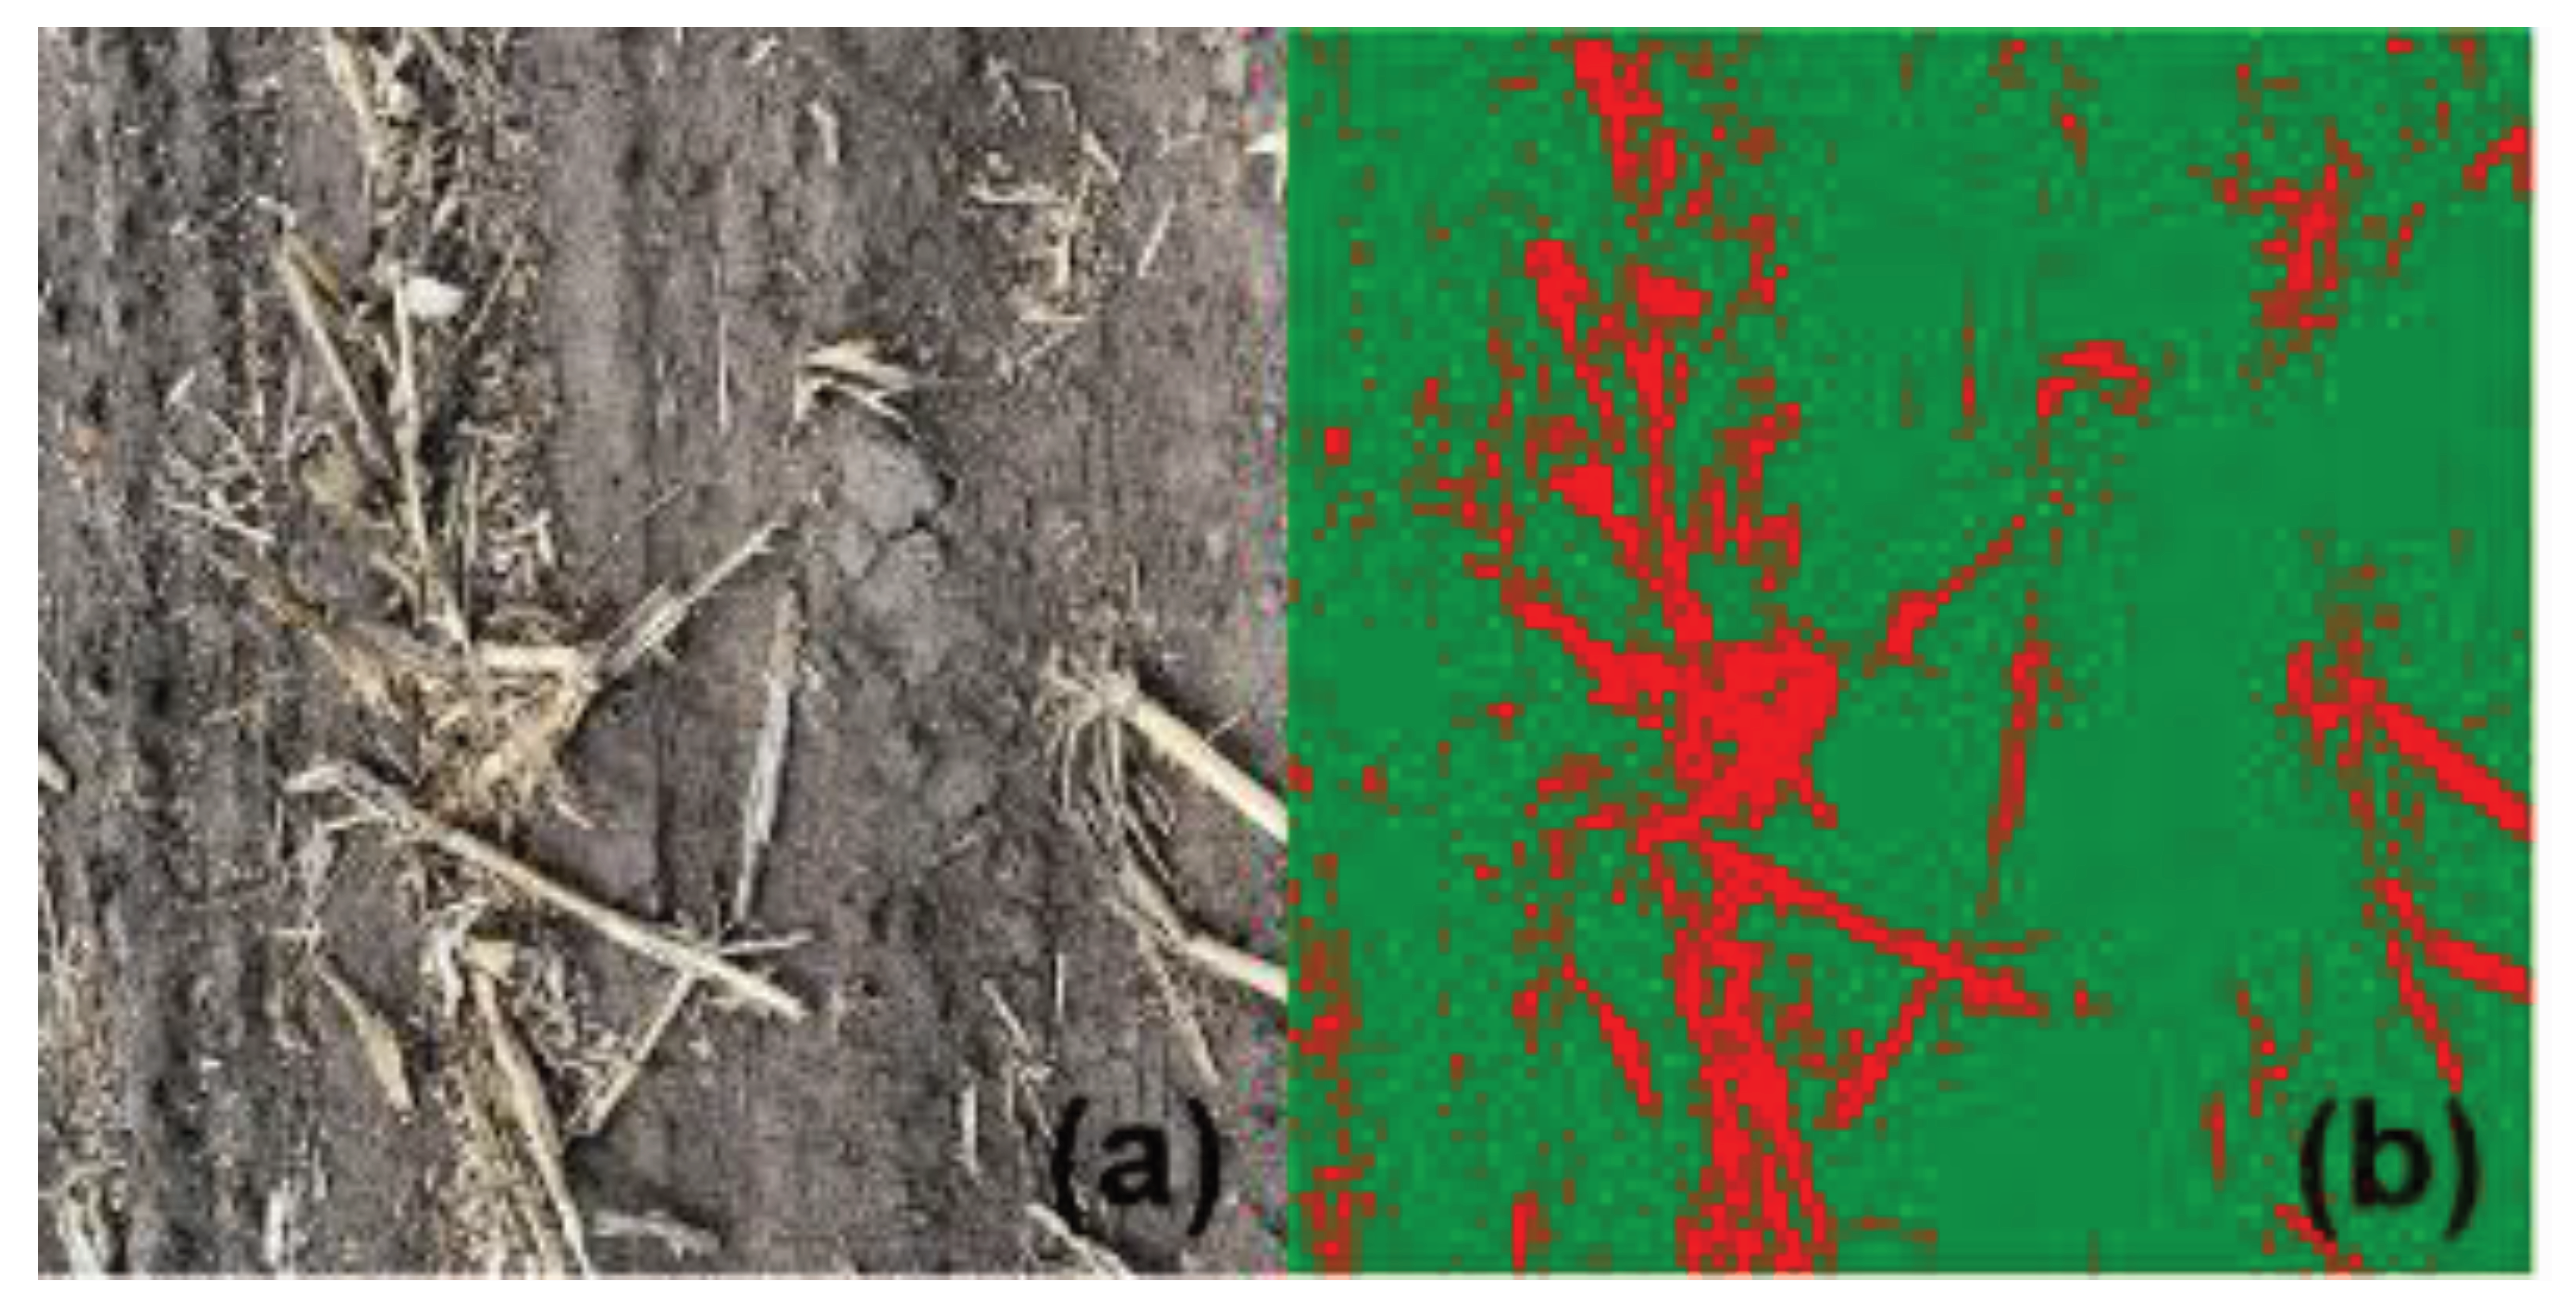
Figure 3.
Correlation coefficient of the measured CRC and the spectral index based on Sentinel-2 MSI and Land-sat 8 OLI remotely sensed data.
Figure 3.
Correlation coefficient of the measured CRC and the spectral index based on Sentinel-2 MSI and Land-sat 8 OLI remotely sensed data.
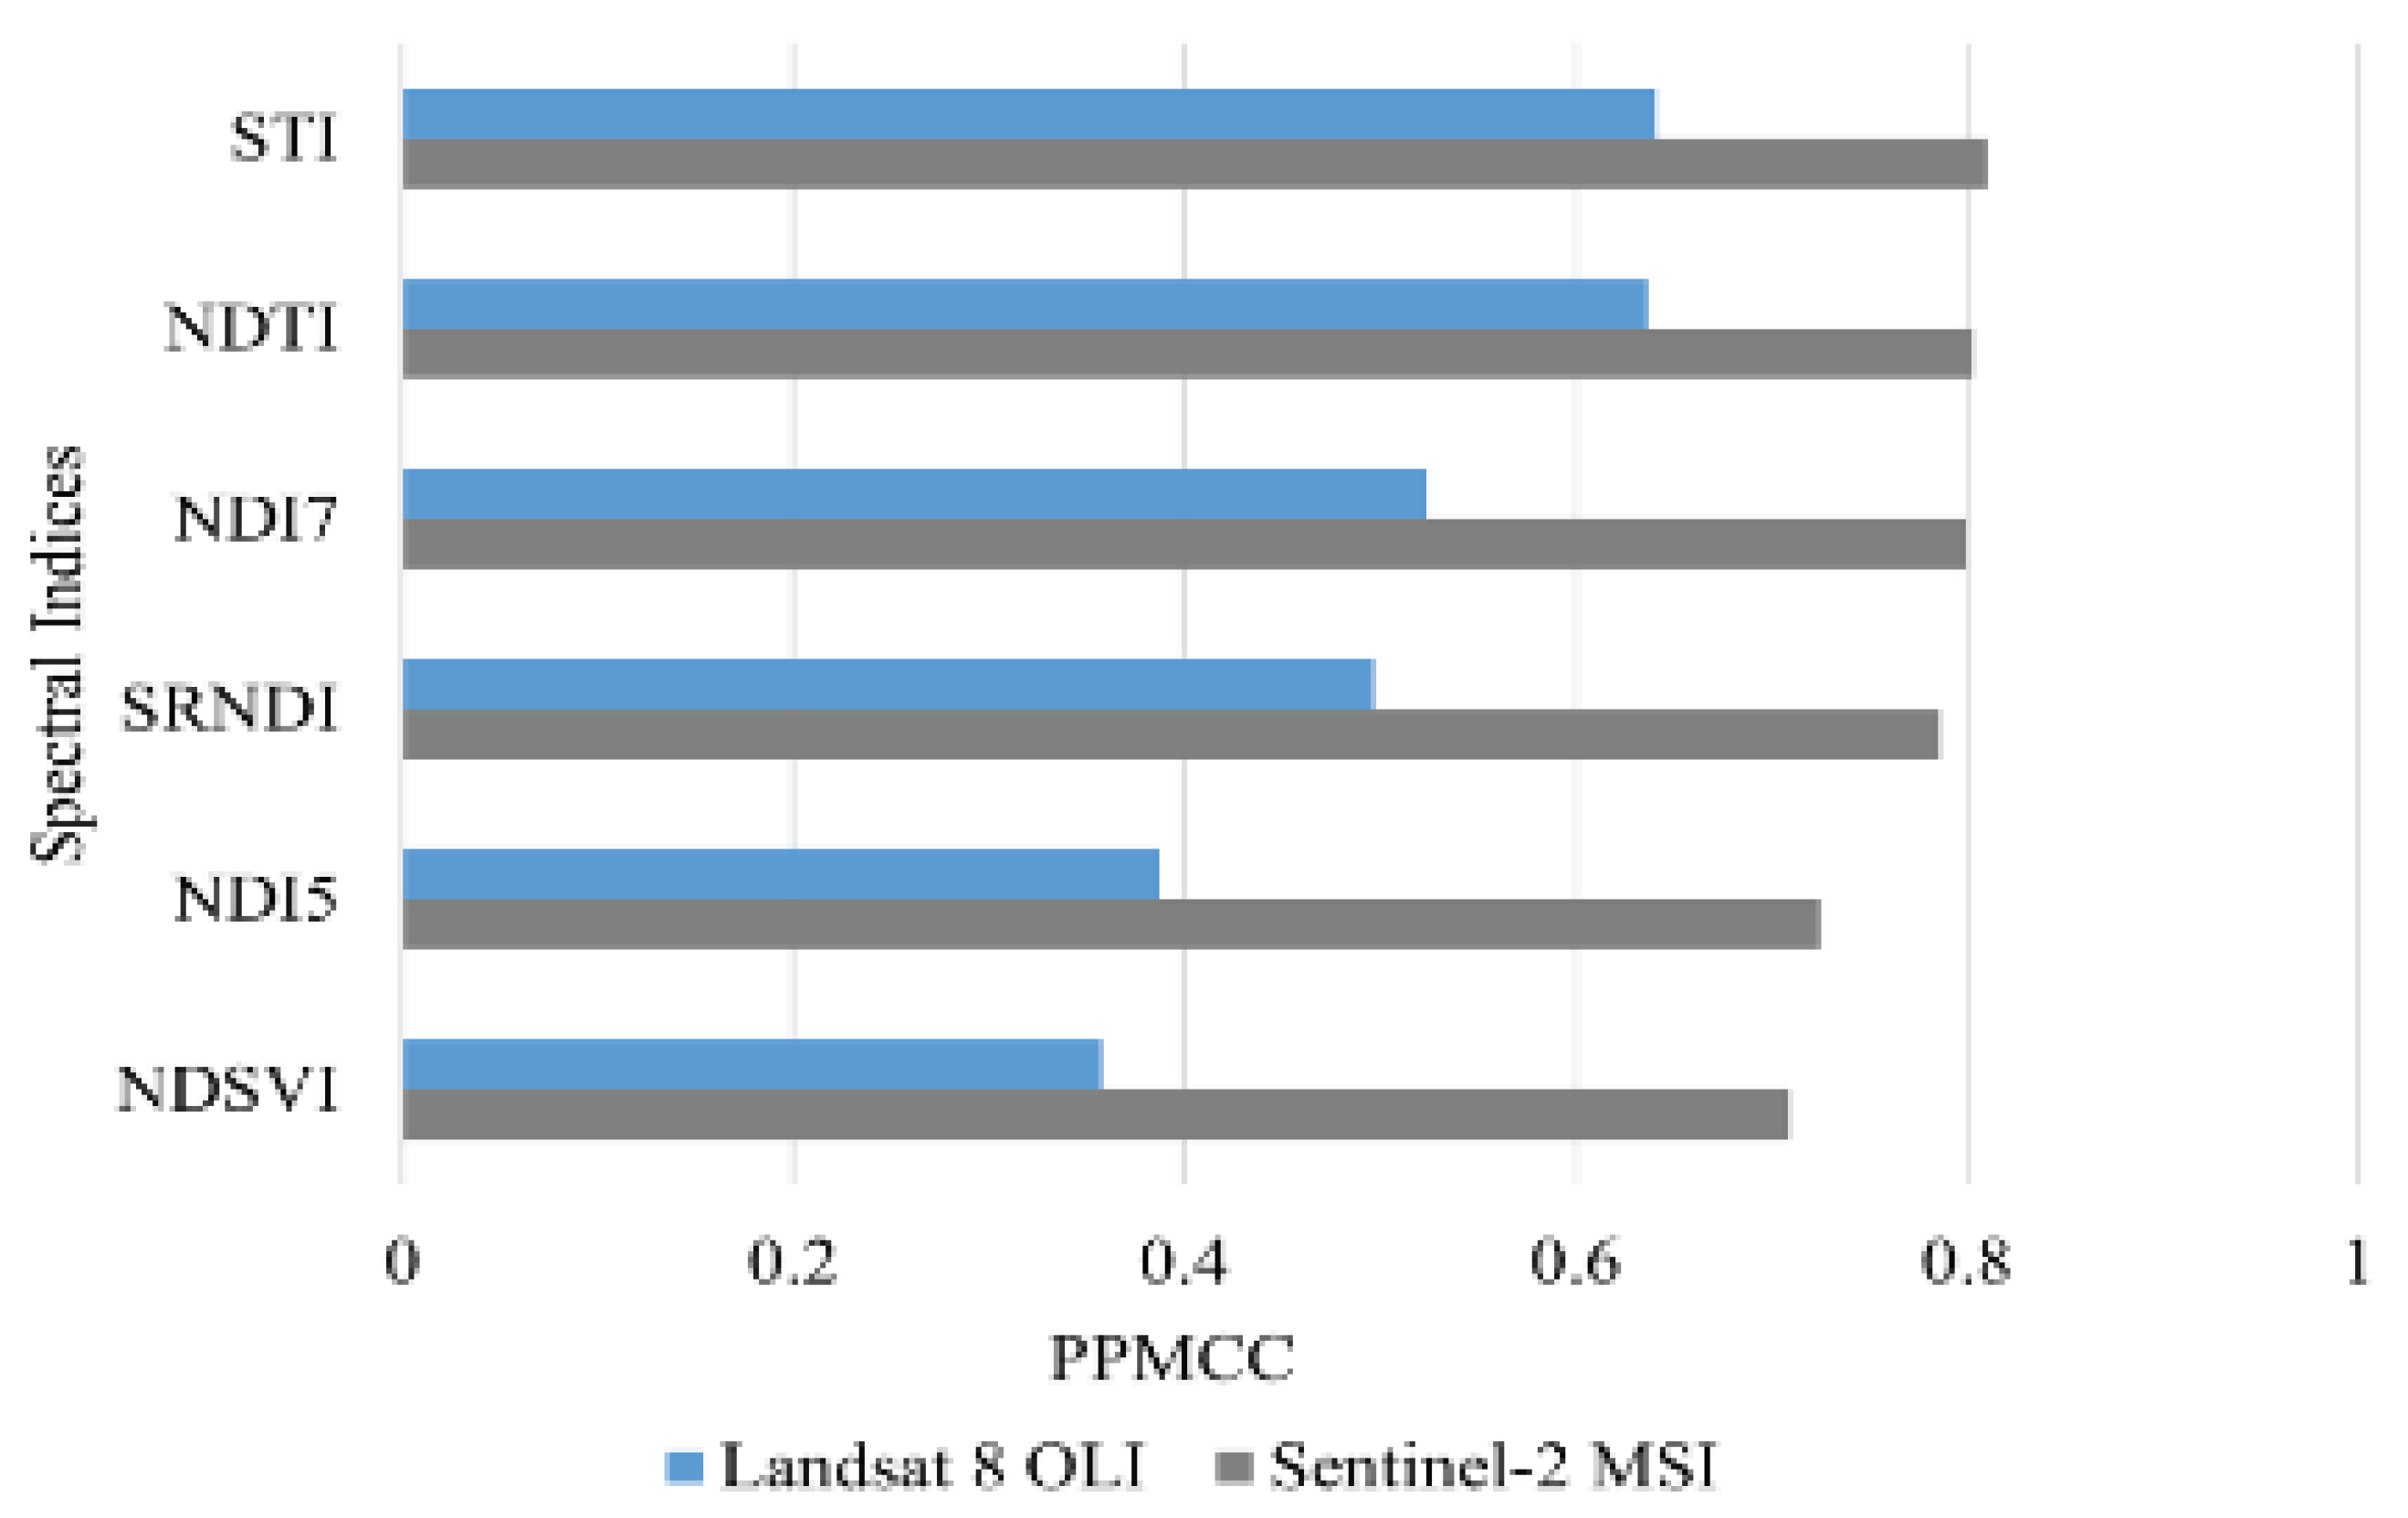
Figure 4.
Responses between the NDTI and STI with CRC derived from Sentinel-2 MSI remotely sensed data.
Figure 4.
Responses between the NDTI and STI with CRC derived from Sentinel-2 MSI remotely sensed data.
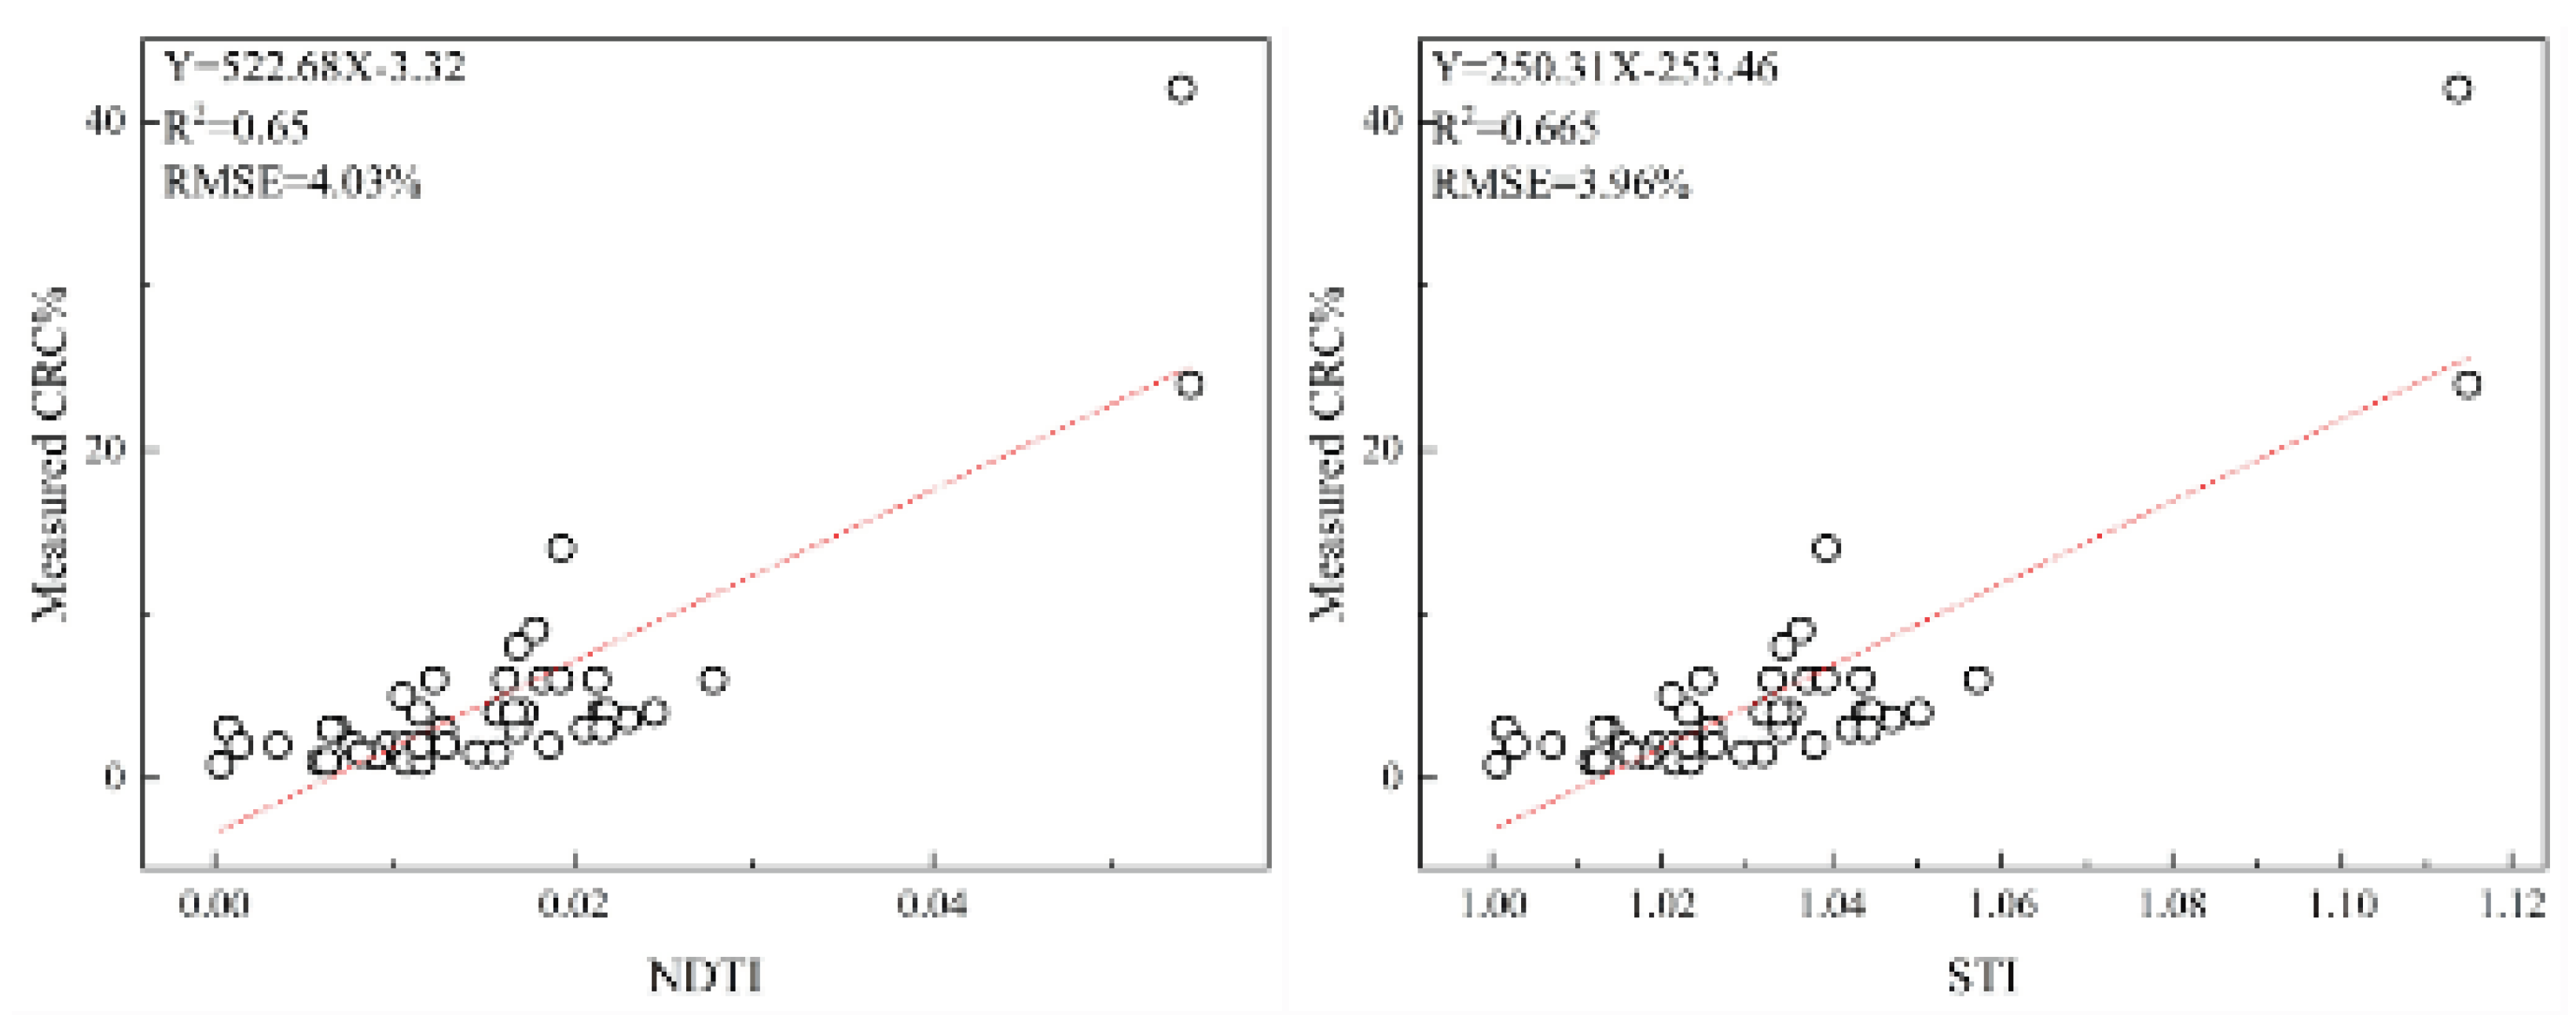
Figure 5.
Responses between the NDTI and STI with CRC based on Sentinel-2 MSI.
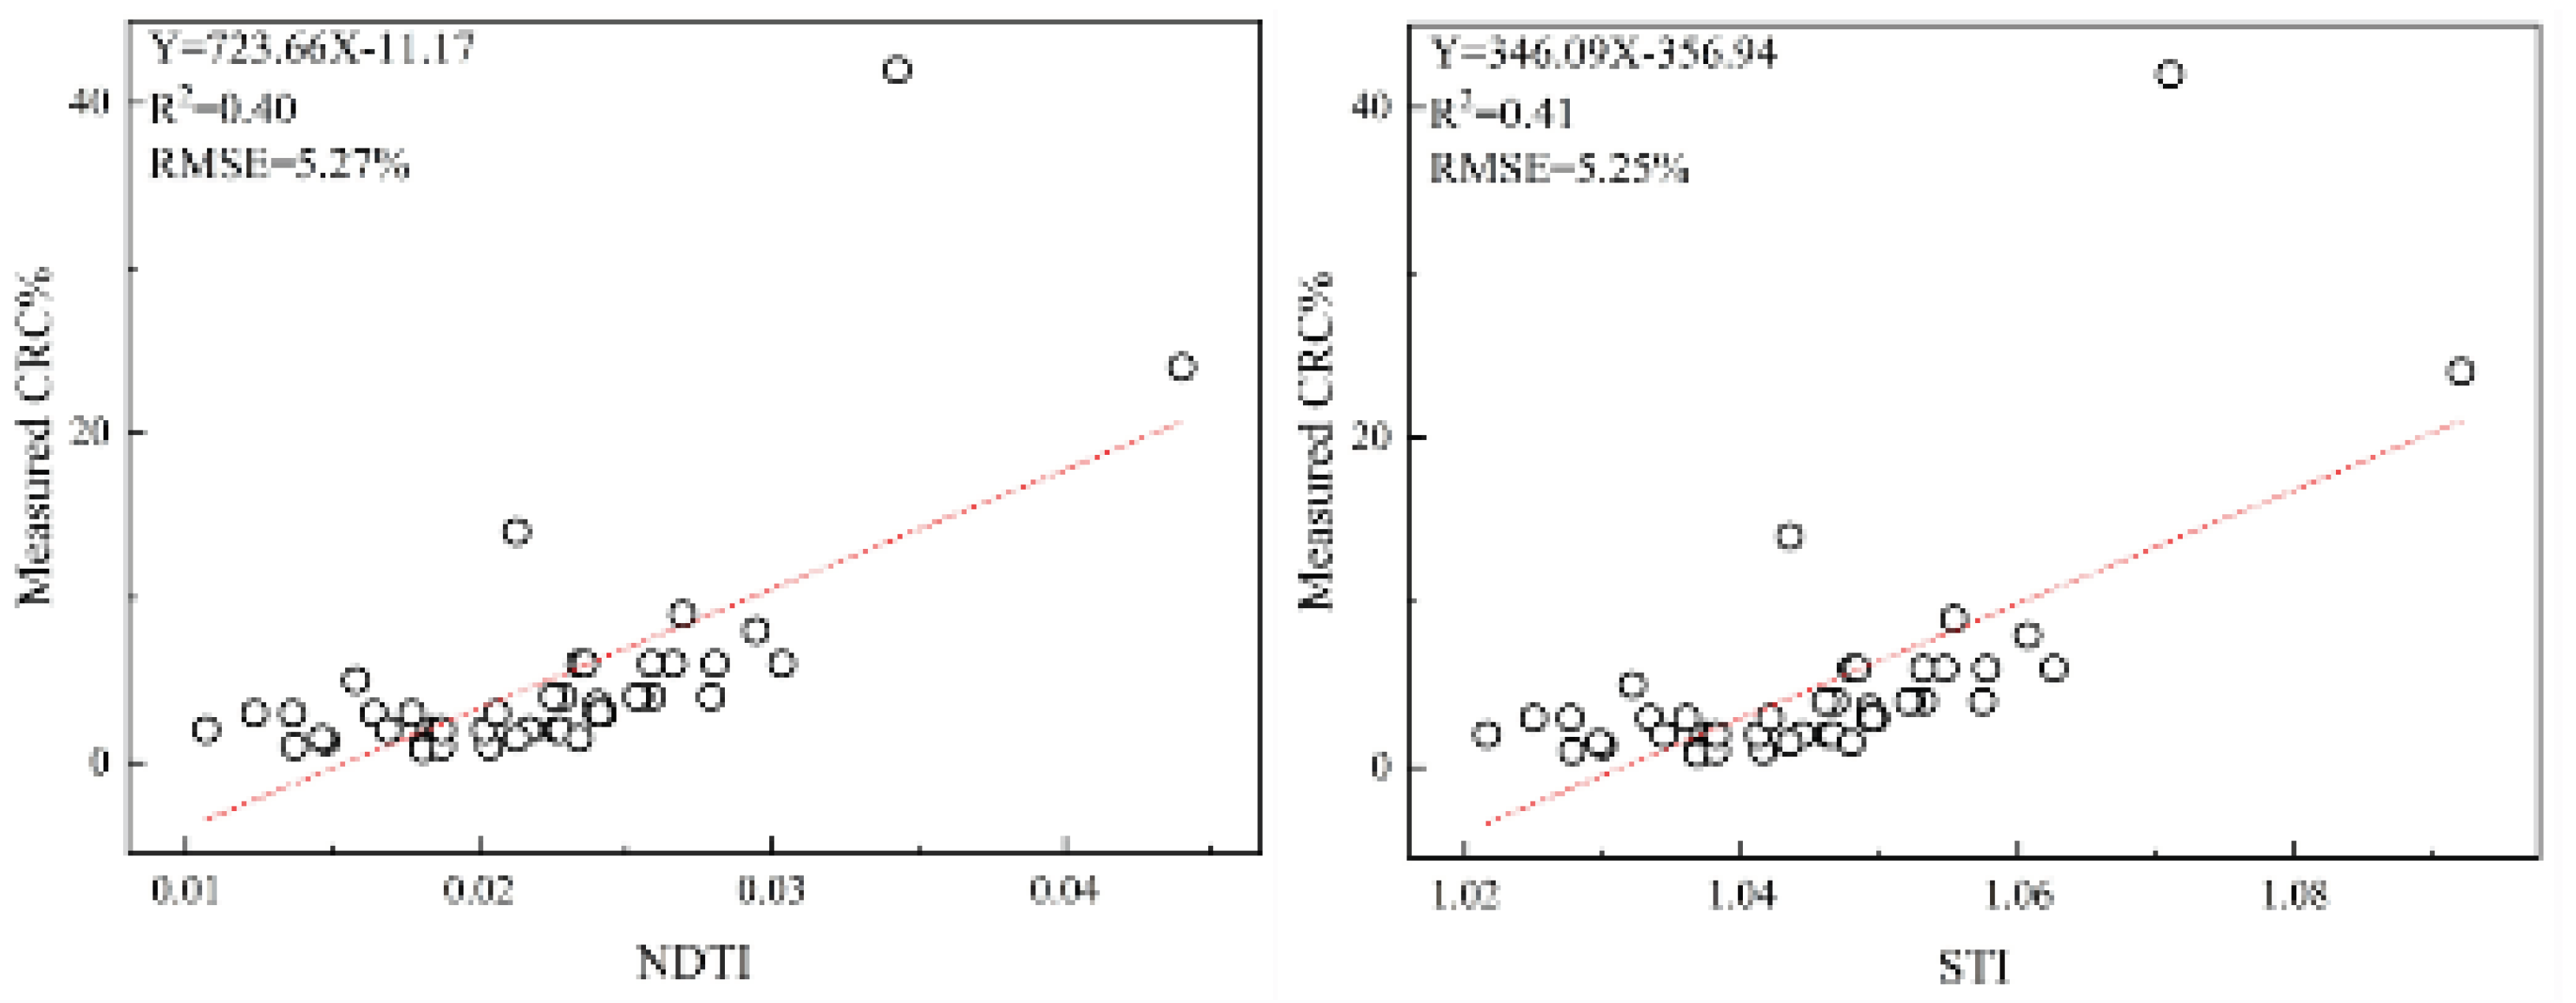
Figure 6.
Measured CRC values versus CRC values predicted from the Sentinel-2 MSI and Landsat 8 OLI optical data.
Figure 6.
Measured CRC values versus CRC values predicted from the Sentinel-2 MSI and Landsat 8 OLI optical data.
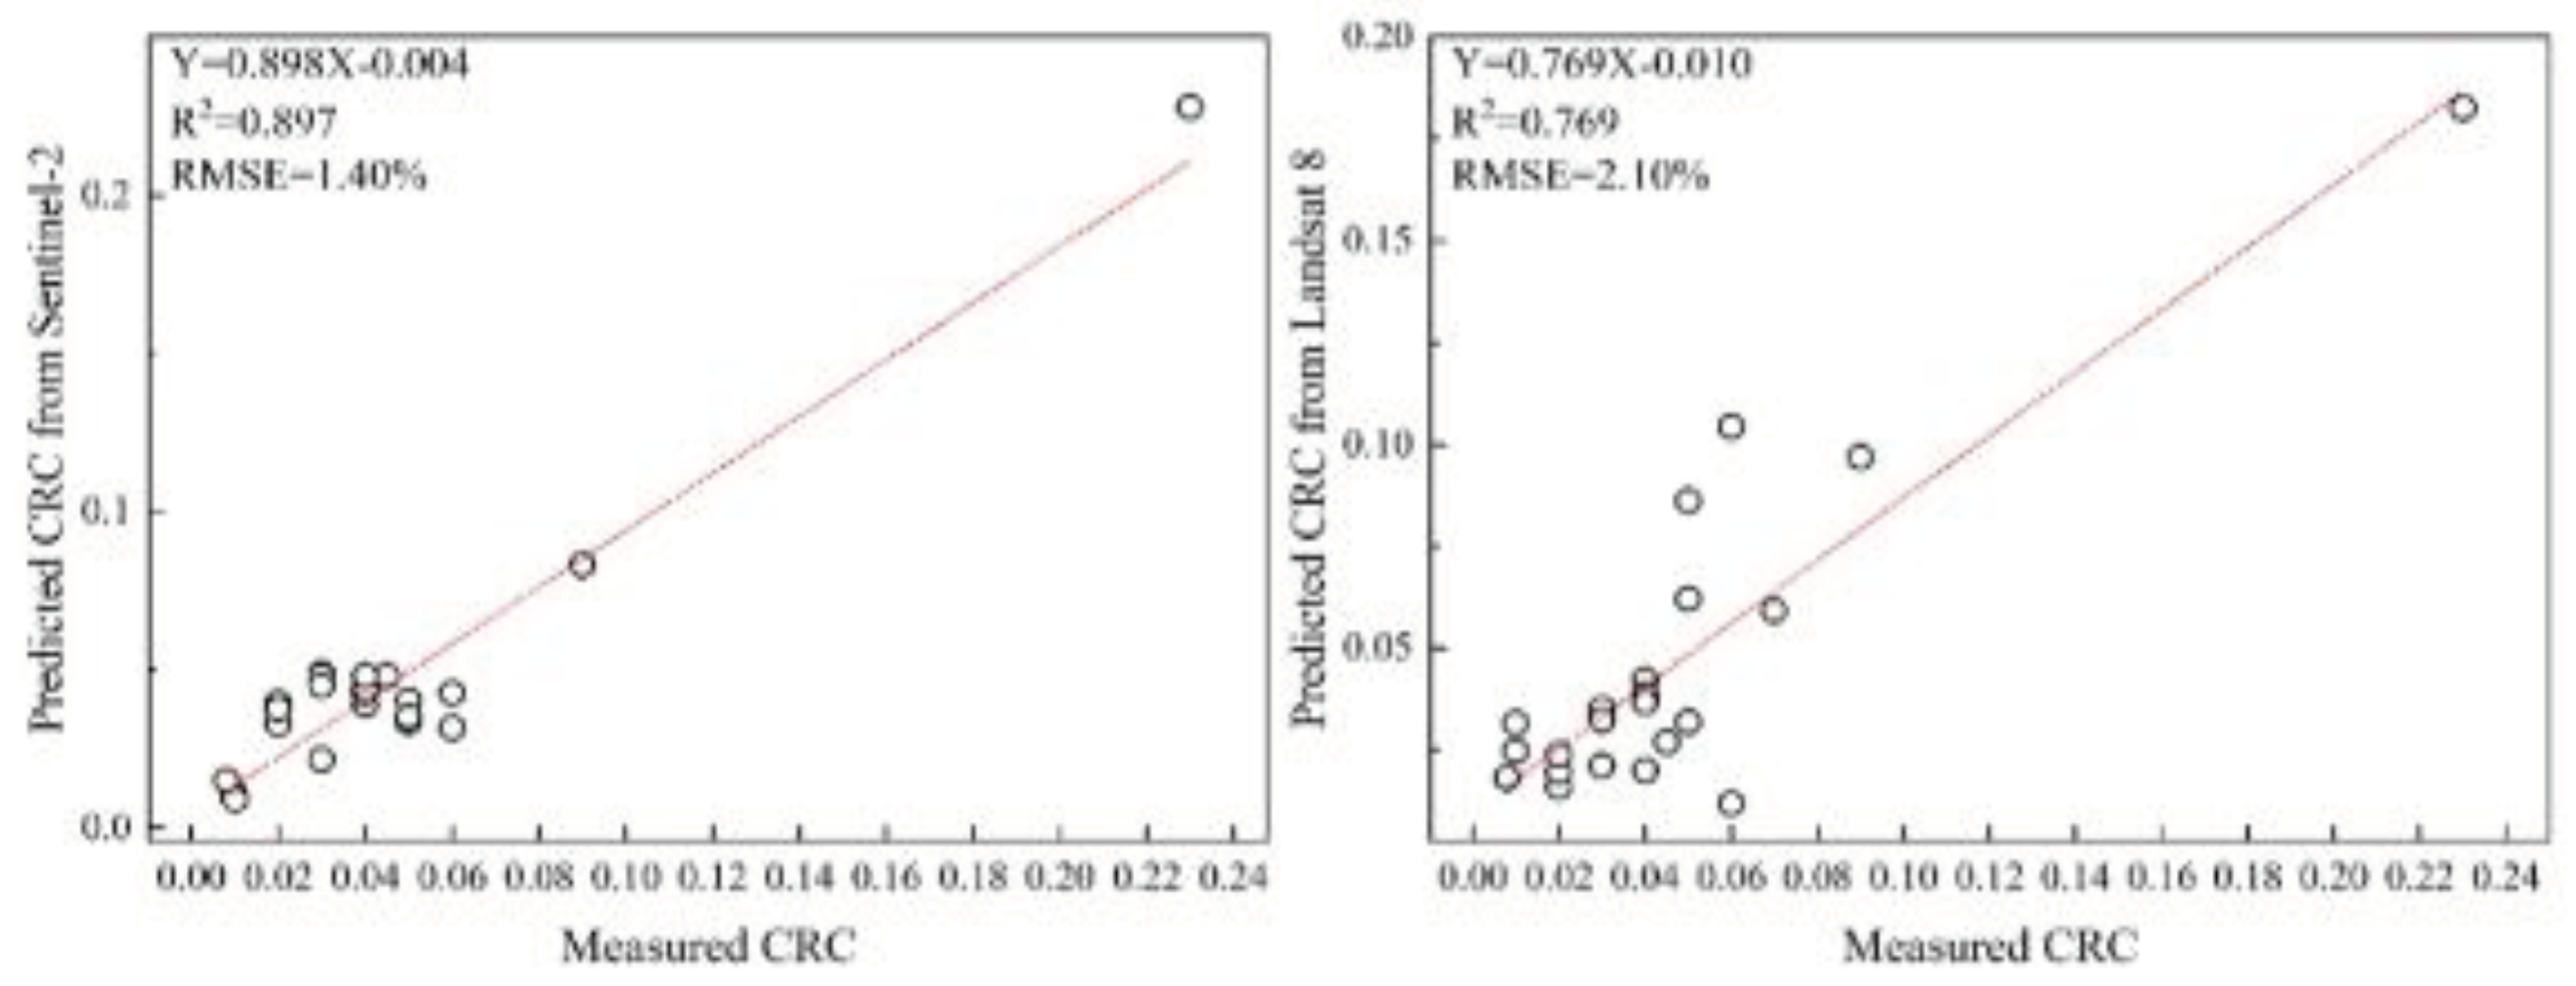
Figure 7.
CRC estimation derived from Sentinel-2 MSI data and the PLSR model.
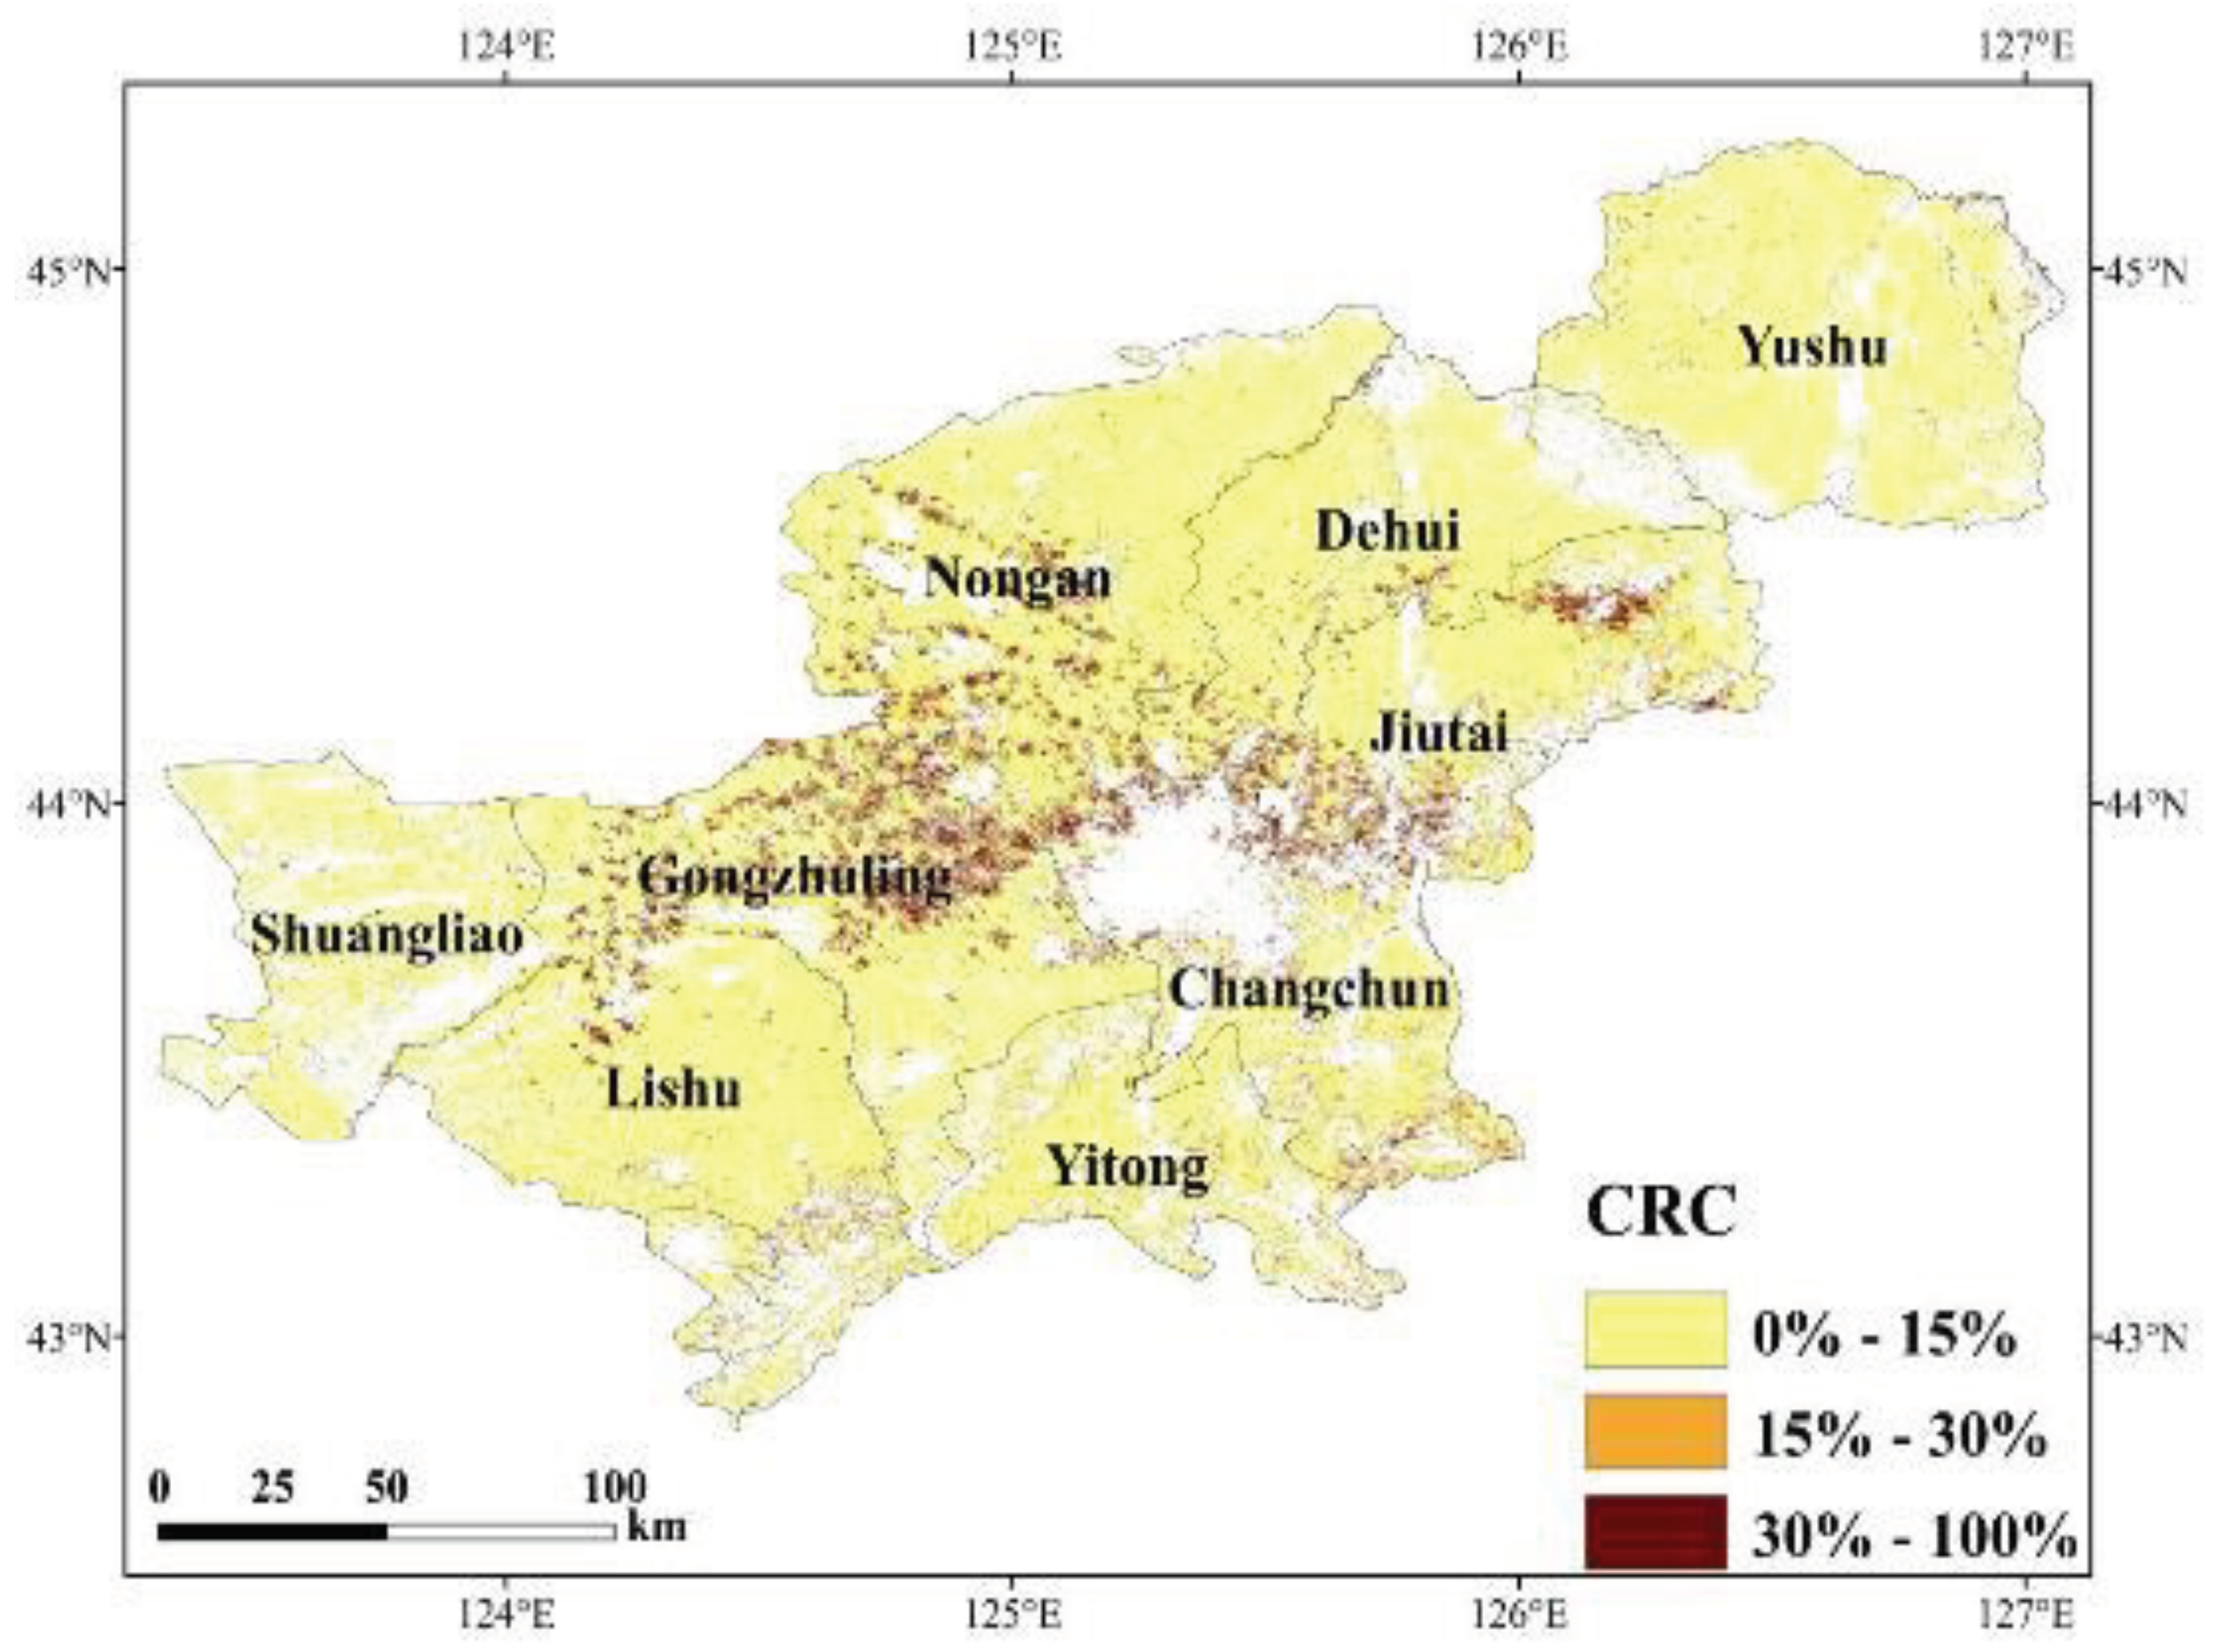
Figure 8.
CRC estimation derived from Landsat 8 OLI data and the PLSR model.
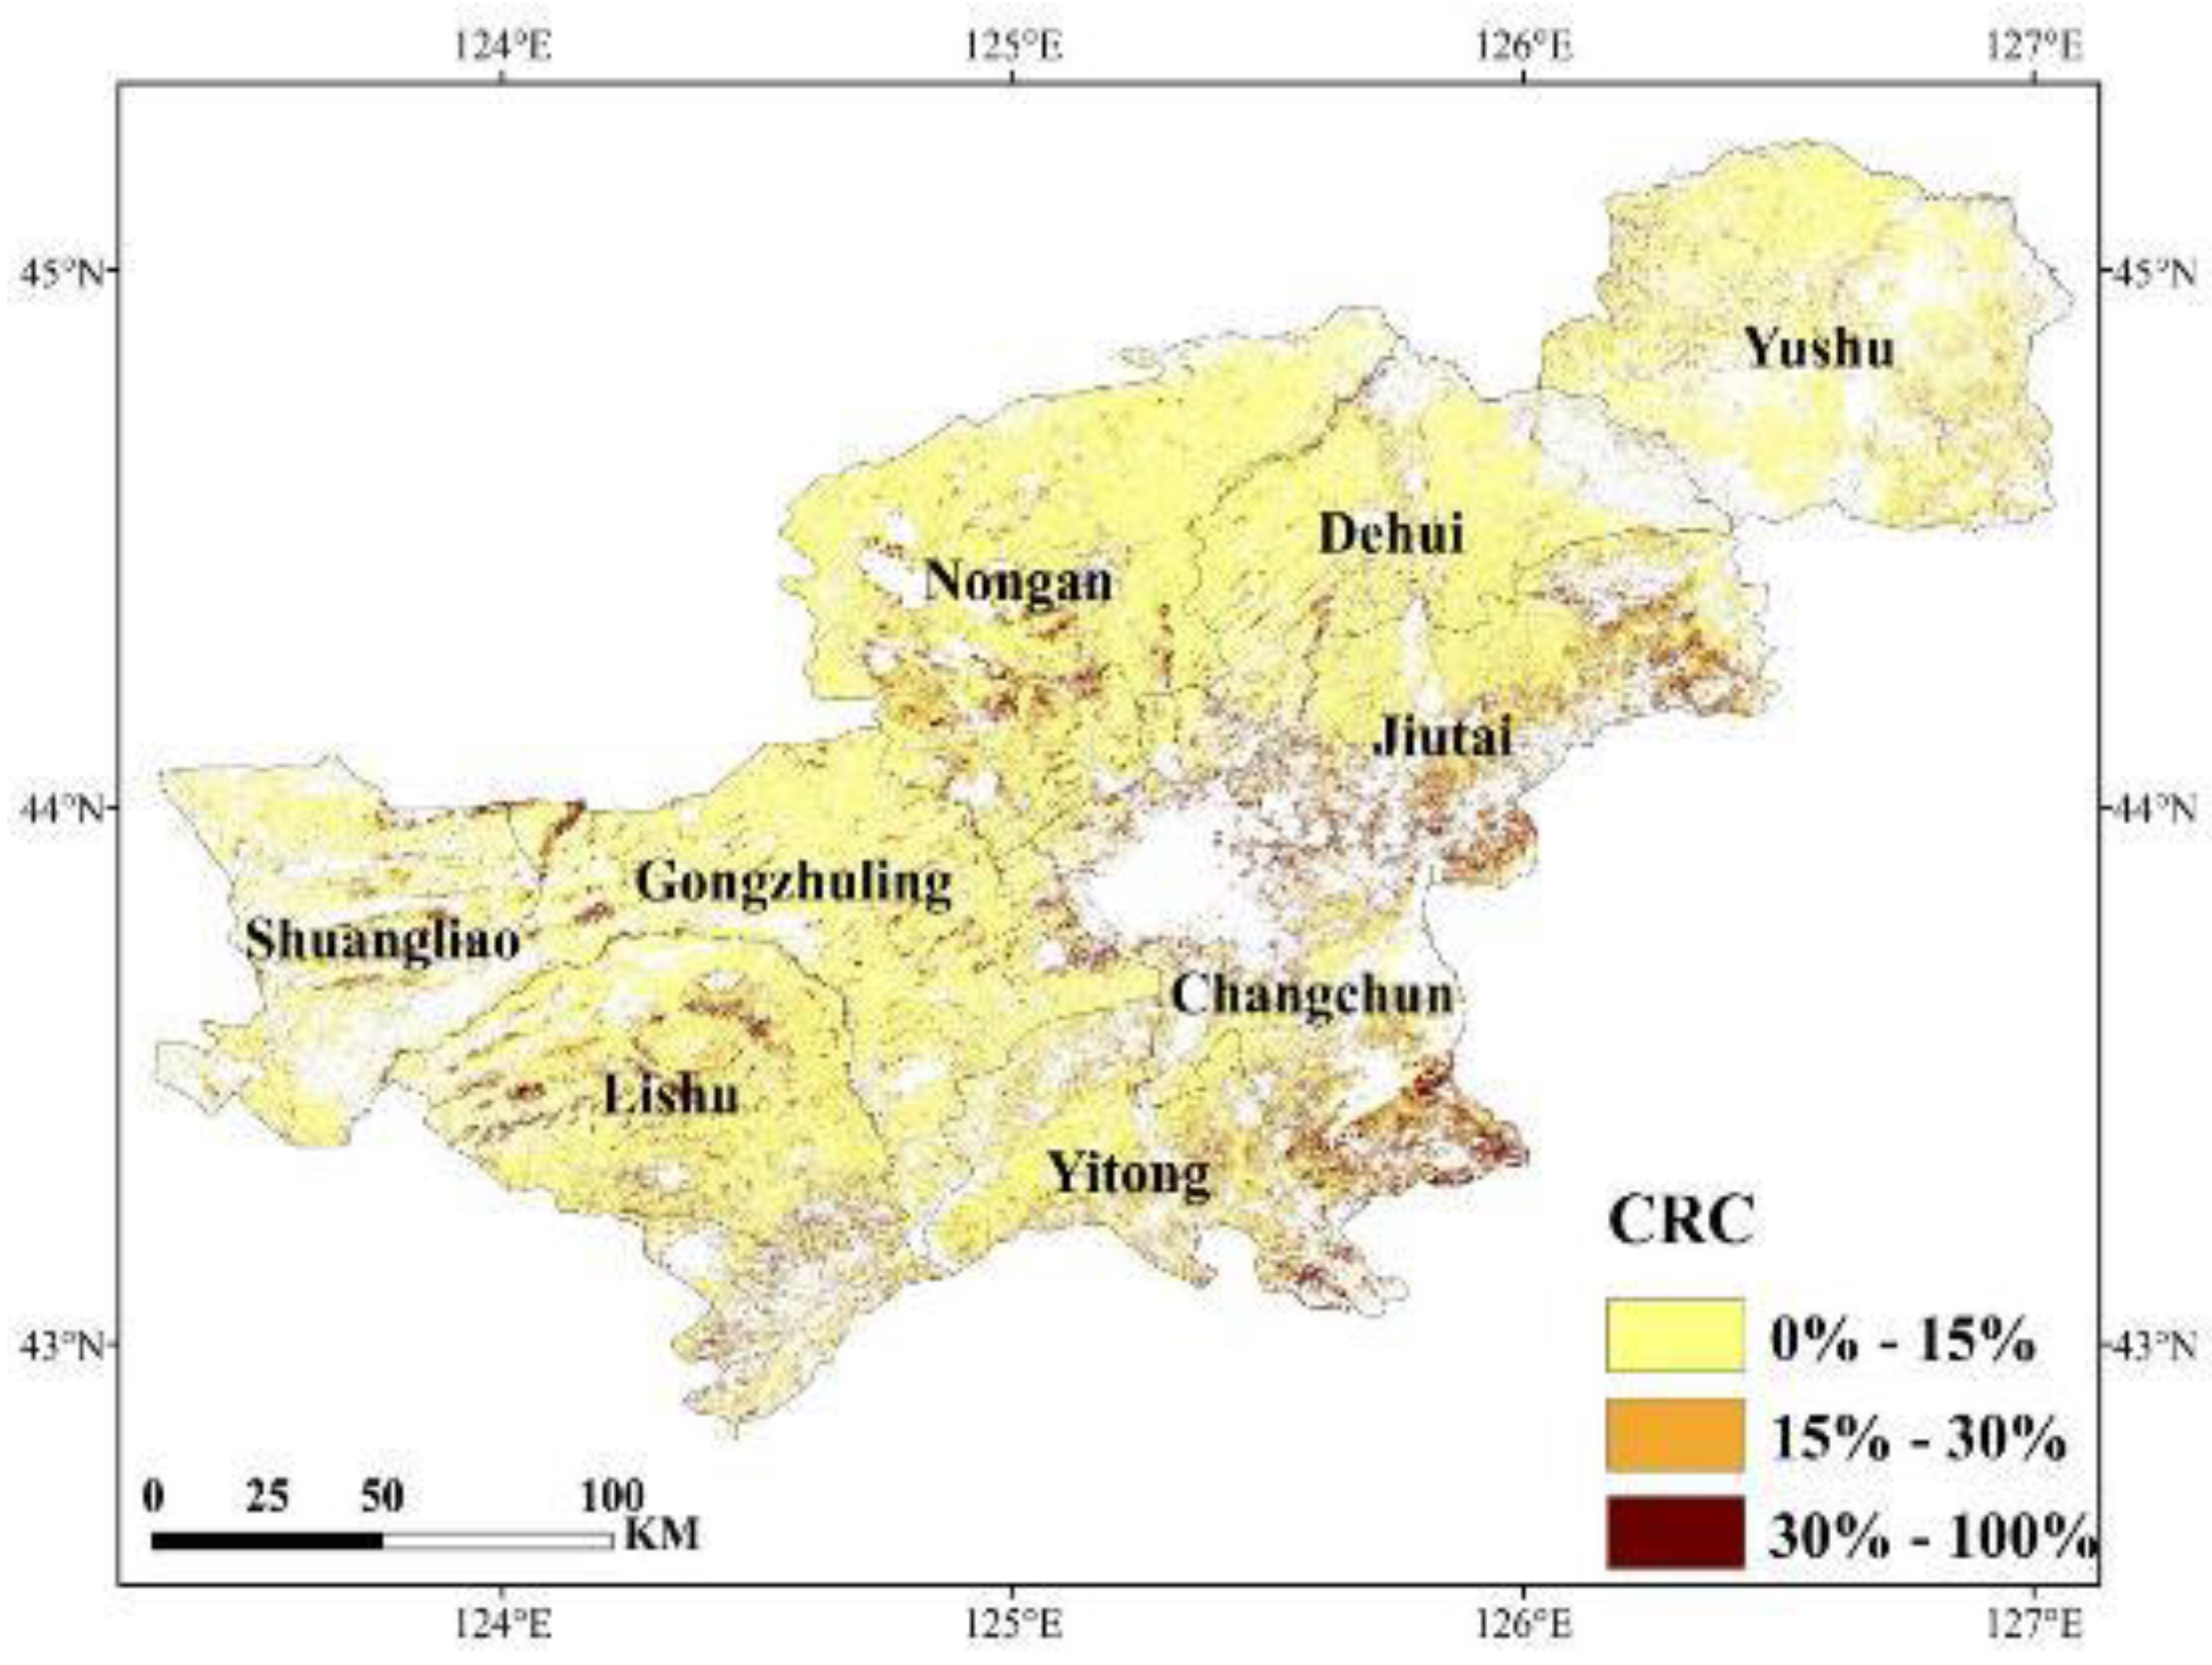

Table 1.
The spectral index bands of Sentinel-2 MSI versus Landsat 8 OLI optical data.
| Tillage index | Abbreviation | Landsat 8 OLI Formula | Sentinel-2 MSI Formula |
|---|---|---|---|
| Normalized difference tillage index | NDTI | (B6-B7)/(B6+B7) | (B11-B12)/(B11+B12) |
| Simple tillage index | STI | B6/B7 | B11/B12 |
| Normalized difference index 5 | NDI5 | (B5-B6)/(B5+B6) | (B8A-B11)/(B8A+B11) |
| Normalized difference index 7 | NDI7 | (B5-B7)/(B5+B7) | (B8A-B12)/(B8A+B12) |
| Shortwave red normalized difference index | SRNDI | (B7-B4)/(B7+B4) | (B12-B4)/(B12+B4) |
| Normalized difference senescent vegetation index | NDSVI | (B6-B4)/(B6+B4) | (B11-B4)/(B11+B4) |
Table 2.
Statistical data for CRC(%).
| Sample Type | Sample size | Maximum value | Minimum value | Average value | Standard deviation | Skewness | Kurtosis | Coefficient of variation |
|---|---|---|---|---|---|---|---|---|
| Total Sample | 70 | 42 | 1 | 5 | 6 | 4.34 | 22.3 | 1.27 |
| Training set | 47 | 42 | 1 | 4 | 7 | 4.33 | 21.3 | 1.40 |
| Validation set | 23 | 23 | 1 | 5 | 4 | 3.35 | 13.6 | 0.94 |
Table 3.
Performance data for the PLSR models derived from Sentinel-2 MSI versus Landsat 8 OLI.
| Data source | Training set | Validation set | ||
|---|---|---|---|---|
| R2 | RMSE | R2 | RMSE | |
| Sentinel-2 | 0.894 | 2.18% | 0.897 | 1.40% |
| Landsat 8 | 0.695 | 3.70% | 0.769 | 2.10% |
Disclaimer/Publisher’s Note: The statements, opinions and data contained in all publications are solely those of the individual author(s) and contributor(s) and not of MDPI and/or the editor(s). MDPI and/or the editor(s) disclaim responsibility for any injury to people or property resulting from any ideas, methods, instructions or products referred to in the content. |
© 2024 by the authors. Licensee MDPI, Basel, Switzerland. This article is an open access article distributed under the terms and conditions of the Creative Commons Attribution (CC BY) license (http://creativecommons.org/licenses/by/4.0/).
Copyright: This open access article is published under a Creative Commons CC BY 4.0 license, which permit the free download, distribution, and reuse, provided that the author and preprint are cited in any reuse.


