

Submitted:
29 February 2024
Posted:
29 February 2024
You are already at the latest version
Abstract
Background: As a relatively high number of ST-segment elevation myocardial infarction (STEMI) patients develop major adverse cardiovascular events (MACE) following percutaneous coronary intervention (PCI), our aim was to determine the significance, and possible predictive value of QRS complex width and ST-segment elevation. Methods: Our patient sample included 200 PCI-treated STEMI patients, which were divided into two groups, based on the duration of symptoms: (I) less than 6 hours, and (II) 6-12 hours. For every patient, ECG was performed at 6 different time points. Long-term follow-up lasted 6 years from the STEMI onset. Statistical analysis was performed. Results: The mean age was 60.6±11.39 years, and 142 were male. Wider QRS complex, more pronounced ST-segment elevation, and more frequently absent ST-segment resolution were more common in the second group. Presentation of MACE was more frequent in this group. An increase of pre-PCI QRS complex width by 1 msec increases the risk of 6-year MACE by 3%, and an increase in pre-PCI ST-segment elevation by 1mm increases the risk of 6-year MACE by 3.26 times. Conclusion: To the best of our understanding, this study represents a pioneer research that utilized these ECG elements in the context of predicting a 6-year MACE. A wider QRS complex and a more pronounced ST-segment elevation were associated with longer total ischemic time. More research is needed to confirm these findings.
Keywords:
ST-elevation myocardial infarction
; acute coronary syndrome
; QRS complex
; ST-segment
; ECG
; percutaneous coronary intervention
1. Introduction
Even though there have been improvements in the management of ST-segment elevated myocardial infarction (STEMI), as the most serious subtype of coronary artery disease it still represents a significant factor in global mortality [1]. Percutaneous coronary intervention (PCI) and pharmacological treatments have led to decreased mortality in these patients. Despite these advancements, due to the high burden mandated by short- and long-term adverse events, patients who survive the acute phase of STEMI will possibly experience major adverse cardiovascular events (MACE) [2,3]. Major adverse cardiovascular events represent an important cause of morbidity and mortality of STEMI patients, and it is described that up to 15% of these patients will develop MACE, even after a successful PCI procedure [3,4]. In the current literature, the incidence of MACE ranges from 4.2% to 51%, and some of the described risk factors are established atherosclerotic disease, triple vessel disease, stent implantation, hypertension, uric acid levels, and estimated glomerular filtration rate (eGFR) [4,5,6]. In patients undergoing PCI, short-term mortality has been extensively studied. However, long-term mortality still remains an understudied research objective [7].
The 12-lead electrocardiogram (ECG) represents the most utilized method in diagnosing, triaging, and determining appropriate treatment in STEMI patients [8]. As one of the most commonly used methods in clinical practice, it allows immediate risk assessment of acute coronary syndrome patients [9,10]. Even though it is a well-established diagnostic tool, different ECG presentations of acute myocardial ischemia, in terms of prognosis, are not quite well defined [9]. The QRS complex morphology, and ST-segment changes, have already been described as potential predictors of certain outcomes. Some of the previous work analyzed the role of poor R wave progression, with a dominant QS pattern in V3, in reduced left ventricular ejection fraction (LVEF) prediction, as well as the influence of QRS complex width on left ventricular systolic dysfunction (LVSD) development, increased risk of heart failure (HF), and death [11,12]. Some of the more recent important ECG parameters are fragmented QRS (fQRS) and QRS distortion, which showed themselves useful in determining reperfusion success, and stratifying high cardiac risk patients [8]. ST segment has proven its significance in the early identification of successful recanalization, as well as patients with a lower possibility of benefitting from the early restoration of flow through the infarct-related artery (IRA) [13,14]. Despite being commonly used, ECG and its elements, such as the QRS complex and ST segment, haven’t been extensively evaluated in the prediction of long-term MACE, so the aim of this study was to utilize these ECG components in the long-term MACE prediction of STEMI patients.
2. Materials and Methods
2.1. Sample and group formation
This longitudinal study was conducted at the Institute for Cardiovascular Diseases of Vojvodina (Sremska Kamenica, Serbia), and was approved by the Ethics Committee of this institution. The study included a period of three years (January 2016 - December 2018), during which a patient sample was formed. The data were extracted from the Hospital Information System, and the follow-up data were collected during the regular check-up examinations of the patients.
The inclusion criteria for this study were: (I) patients older than 18 years, (II) patients with first presentation of acute myocardial infarction with ST-segment elevation, and (III) the symptoms duration lasted less than 12 hours.
The exclusion criteria were: (I) the additional comorbidities, which could influence the patients’ outcomes, (II) patients with previous myocardial infarction, with or without ST-segment elevation, (III) structural heart diseases, (IV) patients with previously performed surgical revascularization procedure, (V) patients in the state of cardiogenic shock during the admission, (VI) left or right bundle branch block detected during the admission, (VII) patients with the atrioventricular block of the second or third degree, (VIII) patients with a permanent or temporary pacemaker, (IX) patients with disbalance of electrolytes that could influence the ECG (e.g. calcium and potassium levels), (X) contraindications for the administration of antiplatelet drugs, (XI) patients with no need for further intervention after coronarography was performed, and (XII) patients who were not compliant.
Based on the duration of the symptoms, patients were divided into two groups: (I) Group A, in which symptoms lasted up to 6 hours from the onset (N = 100), and (II) Group B, in which symptoms lasted from 6 to 12 hours from the onset (N = 100).
For every patient, the following data were collected: (I) demographic data, (II) functional status, assessed through New York Heart Association (NYHA) classification, Killip classification, and Canadian Cardiovascular Society (CCS) angina scale, (III) data about myocardial infarction localization, culprit vessel, and the performed treatment, (IV) laboratory data, measuring Creatine Kinase isoenzyme MB (CK-MB) and Troponin I (TnI), (V) hospitalization data, (VI) echocardiographic assessment data, and (VII) ECG data.
2.2. Electrocardiographic data
Electrocardiography (ECG) was performed for every patient. Recording was done at the speed of 50mm/sec so that a higher degree of precision could be obtained. The ECG ruler was utilized in the QRS complex width and ST-segment elevation measurements, which were done in all 12 leads, after which the mean values were taken. The measurements were done at different time points: (I) during admission, prior to the PCI procedure, (II) immediately after the PCI procedure, (III) an hour after the PCI procedure, (IV) the third day of hospitalization, (V) a month after, during the first follow-up exam, and (VI) six months after, during the second follow-up exam. The ST-segment resolution was defined as a decrease of more than 50% of the initial ST-segment elevation, measured in millimeters.
2.3. Patient follow-up
The total follow-up period was six years, during which data were collected at two-time points of six months (short-term) and six years (long-term). For the short-term follow-up, patients were assessed during the regular exams, while for the long-term outcome follow-up, patients were contacted via telephone. During this time, the absolute number of losses in follow-up patients was 23, including 14 in group A, and 9 in group B, without a statistically significant difference (p=0.380). After discharge, all patients were followed up for the occurrence of major adverse cardiac events (MACE), which included: myocardial reinfarction, the need for an additional PCI procedure of both culprit and non-culprit vessels, heart failure, stroke, and cardiovascular death. For this part of the analysis, patients were divided into two groups: (I) patients with MACE, and (II) patients without MACE.
2.4. Statistical analysis
The collected data were divided into subcategories, based on their similarities, and were analyzed on three levels: (I) the whole sample, (II) patients with symptoms duration of more than 6 hours (Group A), and (III) patients with symptoms duration of less than 6 hours. Python 3.10.6 was used as the programming language in this research. Categorization of the variables followed, in which the division was made into categorical and continuous groups, and variables were analyzed using adequate tests. Categorical variables were expressed as numbers (percentages), and the Chi-squared test was used to determine differences between the two groups. Continuous variables were presented as medians (interquartile range) and analyzed by Student t-test or Mann–Whitney U test, based on sample normality. Two-tailed tests were used, and statistical significance was observed at a level p<0.05, for every variable. Using binary regression analysis, the odds ratios of developing adverse cardiovascular events were determined, and by Cox regression analysis, the significance of the connection was expressed. The predictive value of ECG measurements was determined by the area under the receiver operator characteristic (AUC-ROC) curve.
3. Results
3.1. Sample analysis
Out of 200 patients with a mean age of 60.6±11.39 years, 142 were male and 58 female. Patients data that stood out as significantly different were heart rate (80.0 bpm (IQR 70.0 - 90.0) vs. 80.0 bpm (IQR 80.0 - 90.0), p=0.035) and the duration of symptoms (120.0 min (IQR 90.0 - 180.0) vs. 420.0 min (IQR 360.0 - 600.0), p=0.000). Based on the Killip classification, there were no patients described as class III (acute pulmonary edema) and IV (cardiogenic shock) at the time of inclusion in the study. However, after the inclusion, 3% of patients had deteriorated. The most prevalent infarct-related artery (IRA) differed between groups since the right coronary artery was more common in group A, while the left anterior descending artery was in group B. Markers of myocardial injury (CK-MB and TnI) were significantly higher in group B, during all four measurements. Length of hospitalization was not significantly different between the observed groups (6 days (IQR 5-7) vs. 5 days (IQR 5-7), p=0.265). The left ventricle ejection fraction value was significantly lower in group B, both during the hospitalization (50.0% (IQR 46.0 - 55.0) vs. 48.0% (IQR 42.0 - 55.0), p=0.024), and 6-month follow-up (55.0% (IQR 50.0 - 57.5) vs. 50.0% (IQR 45.0 - 55.0), p=0.000). The rest of the data is presented in Table 1. Additional information about the PCI procedure and culprit vessels are stored in Table S1.
3.2. ECG data
3.2.1. QRS complex width measurement
The QRS complex width measurements showed statistical significance at the following time points: 60 minutes post-PCI (86.5mm (IQR 80.0 - 100.0) vs. 100.0mm (IQR 87.25 - 100.0), p=0.008), 72-hour post-PCI (81.0mm (IQR 80.0 - 90.5) vs. 95.0mm (IQR 85.0 - 100.0), p=0.000), one month after (80.0mm (IQR 80.0 - 90.0) vs. 90.0mm (IQR 85.0 - 100.0), p=0.000), and six months after (80.0mm (IQR 80.0 - 90.0) vs. 90.0mm (IQR 80.0 - 100.0), p=0.000). In group A, in which symptoms lasted less than 6 hours, the QRS complex was more narrow during all measurements, compared to group B (Table 2).
3.2.2. ST-segment elevation
Similar to the previous results the ST-segment elevation showed statistical significance at the following time points: 60 minutes post-PCI (0.5mm (IQR 0.0 - 1.0) vs. 1.0mm (IQR 0.0 - 2.0), p=0,005), 72-hour post-PCI (0.0mm (IQR 0.0 - 0.5) vs. 0.5mm (IQR 0.0 - 1.0), p=0.000), one month after (0.0mm (IQR 0.0 - 0.0) vs. 0.0mm (IQR 0.0 - 0.5), p=0.003), and six months after (0.0mm (IQR 0.0 - 0.0) vs. 0.0mm (IQR 0.0 - 0.0), p=0.013). In group B, in which symptoms lasted more than 6 hours, the ST-segment elevation was more pronounced during all measurements, compared to group A (Table 2). ST-segment resolution was significantly more common in group A right after the PCI procedure (72% vs 49%, p=0.001), while other time points did not significantly differ between the observed groups.
3.3. Follow-up data
3.3.1. 6-month follow-up
Out of 200 patients, 32 had MACE during a 6-month period. MACE was more common in group B (9% vs. 23%, p=0.012). The most frequent was heart failure (N = 28), which was more abundant in group B (6% vs. 22%, p=0.002). During this period, 6 patients died. The majority of them (N = 5) died out of the hospital, while one died during the hospitalization. All patients died due to a coronary event (Table 3). Additional data are stored in Table S2.
3.3.2. 6-year follow-up
During this extensive follow-up period, 44 patients had MACE. The most common one was cardiovascular death (N = 14), followed by re-PCI of the non-culprit vessel (N = 10), and reinfarction (N = 7). Taking into consideration the time frame from the PCI procedure until the MACE, it is determined that MACE happens earlier in group B (2287 days (IQR 1874 - 2476) vs. 1854 days (IQR 615 - 2208), p=0.000). All follow-up data are presented in Table 3.
3.4. ECG data in MACE prediction
3.4.1. Value of QRS complex width in association with MACE
A wider QRS complex was associated with a higher possibility of developing a 6-year MACE, at all time points of measurement. The highest statistical significance (p=0.010) was observed right after the PCI procedure, between the group with (100ms (IQR 90 - 110)) and without MACE (95ms (IQR 85 - 100)). The odds ratio (OR) calculation showed that the highest significance has the QRS width value after a month (OR = 1.042, 95% CI 1.012 - 1.074, p=0.007). An increase of pre-PCI QRS complex width by 1 msec increases the risk of MACE by 3% (OR = 1.028 95% CI 1.003 - 1.053, p=0.029). All results are presented in Table 3. The highest AUC value was displayed by the QRS complex 60 minutes after the PCI procedure (AUC = 0.74) (Figure 1A).
3.4.2. Value of ST-segment elevation in association with MACE
During all time points of measurement, a more pronounced ST-segment elevation was also associated with a higher possibility of developing a 6-year MACE. Three time points have demonstrated very high statistical significance between a group with and without MACE: right after the PCI procedure (2mm (IQR 0.75-3) vs. 1mm (IQR 0.00-2.5), p=0.000), 60 minutes after the procedure (0.5mm (IQR 0.5-2) vs. 0mm (IQR 0-1), p=0.000), and 1-month after (0mm (IQR 0-0.5) vs. 0mm (IQR 0-0), p=0.000). For this parameter, the 1-month time point has shown itself as the most suitable for the odds ratio calculation (OR = 3.256, 95% CI 1.572-6.747, p=0.001). An increase in pre-PCI ST-segment elevation by 1mm increases the risk of MACE by 3.26 times. All results are presented in Table 4. The highest AUC values have been demonstrated 60 minutes after the PCI (AUC=0.75) (Figure 1B).
4. Discussion
To the best of our knowledge, this is the first study that analyzed the possible utilization of QRS complex width and ST-segment elevation in long-term MACE prediction. In the group of patients with symptoms lasting 6 to 12 hours, values of myocardial injury markers (CK-MB and TnI) were significantly higher, and myocardial function, assessed with echocardiography, showed lower values of left ventricle ejection fraction. Wider QRS complex and more pronounced ST-segment elevation were associated with this group at almost all time points of measurement, and the ST-segment resolution was more commonly absent. Presentation of MACE was more frequent in this group, and it developed in a shorter time frame compared to the group with patients in which the PCI procedure was done in less than 6 hours. It was calculated that an increase of pre-PCI QRS complex width by 1 msec increases the risk of 6-year MACE by 3%, and an increase in pre-PCI ST-segment elevation by 1mm increases the risk of 6-year MACE by 3.26 times.
In our study, one of the main variables that statistically differed between groups was the heart rate (HR). The group with shorter onset-to-treatment time (OTT), of up to 6 hours, showed lower baseline values of this parameter. In previously published research, the elevated admission HR in PCI-treated STEMI patients was a strong, independent predictor of adverse outcomes and mortality, and a value of HR greater than 80 beats per minute (bpm) could identify patients at increased risk of death. However, it is not certain whether HR reduction results in improved outcomes [15,16,17]. Symptom duration was also statistically different between the observed groups. This was expected, as the group division was made by this parameter. However, the real reason for this occurrence is still not certain. In the available literature, patients with longer symptom onset to door time (SODT) had poorer prognoses and worse survival rates. Some of the factors influencing SODT may be older age, ethnicity, and diabetes mellitus, as well as the technical aspect of healthcare-providing [18]. It is shown that during ‘’on-hours’’ (work days), patients more commonly contacted physicians, rather than the emergency services, which led to increased SODT [19]. As time-to-treatment is directly associated with infarct size, minimizing any component of treatment delay and emphasizing shorter onset-to-treatment time in STEMI patients is imperative, decreasing mortality and improving outcomes [20,21]. In our patient group with longer OTT, left ventricular ejection fraction (LVEF) was significantly lower, possibly due to the more extensive myocardial involvement. Decreased LVEF is an important predictor of cardiac prognosis, and reduced values are seen in up to 40% of STEMI patients [22,23].
In our sample, a significantly wider QRS complex was observed in the group with longer OTT, at almost all time points of measurement. In previous research, changes in the QRS complex and the value of the QRS score were associated with the size of the infarcted area [24,25]. As longer OTT leads to more extensive myocardial necrosis,[20]. our findings could be easily understood, as a wider QRS complex could be a consequence of the infarction and a manifestation of a larger infarct volume. The importance of this finding lies in the knowledge that the QRS complex and its elements are established predictors of cardiac risk, mortality, and outcomes of STEMI patients [8,26,27]. However, in previous work, the width, as an easily measured variable, was not studied, so our finding needs to be further evaluated. In our analysis, ST-segment elevation measured 72 hours after the PCI procedure showed the highest statistical difference between the observed groups. Similar to the previous parameter, ST-segment elevation was more significantly pronounced in the longer OTT group, while ST-segment resolution was more commonly absent in the same group. Lack of ST-segment resolution, as well as higher elevation, were previously associated with larger infarct size, leading to worse patient outcomes, and lower LVEF [28,29,30,31,32,33]. As total ischemic time (TIT) is longer in the previously mentioned group, this finding strongly supports that the infarct volume highly depends on the ischemic time.
During long-term follow-up, 24.6% of patients had MACE. It was more common in the longer OTT group, and the most prevalent type was cardiovascular death, followed by re-PCI of the non-culprit vessel. In the available literature, the described incidence of MACE shows a wide range of 4.2% to 51%, and risk factors, such as established atherosclerotic disease, triple vessel disease, stent implantation, hypertension, diabetes, and decreased kidney function, were associated with an increased chance of developing [4,5,6]. In our cohort, there was no statistically significant difference observed between the risk factors, so the main possible explanation could be prolonged ischemic time, resulting in more extensive myocardial lesions. Even though reperfusion is the main therapeutic aim in STEMI patients, it is well known that it can be followed by a myocardial reperfusion injury (MRI) [34]. Myocardial damage during an acute myocardial infarction is a result of an interplay between ischemia and following reperfusion. Consequently, numerous conditions arise, such as ventricular arrhythmias, myocardial stunning, microvascular obstructions (MVO), as well as intramyocardial hemorrhage. All of these can significantly influence patient outcomes [35]. The size of the myocardial infarction and MVO represent independent predictors for long-term mortality, as well as the development of HF in these patients [36,37]. According to the latest European Cardiology Society (ESC) guidelines for acute coronary syndrome treatment, the strategies for reduction of ischemic-reperfusion lesions are still an unfulfilled clinical need, [38] as well as a potential focus of future research. Due to extensive myocardial injury, leading to previously described changes in QRS complex width, and ST-segment elevation, these ECG elements have demonstrated certain predictive power, in terms of MACE. The highest AUC value has been shown by QRS complex (AUC = 0.74) width and ST-segment elevation (AUC = 0.75) 60 minutes after the PCI procedure. These ECG changes may not be the most adequate predictive markers of long-term MACE when used isolated. However, future research might possibly include these easily measured ECG parameters in predictive models, where their real predictive power would be obtained.
5. Conclusions
To the best of our understanding, this study represents a pioneer research that utilized QRS complex width and ST-segment elevation in the context of predicting long-term major adverse cardiovascular events. Wider QRS complex and more pronounced ST-segment elevation were associated with longer total ischemic time (TIT), at all time points of measurement, accompanied by the absence of ST-segment resolution. Longer ischemic time led to more frequent manifestations of a 6-year MACE, which developed in a shorter time frame compared to the group of patients in which the PCI procedure was done in less than 6 hours. An increase of pre-PCI QRS complex width by 1 msec increases the risk of 6-year MACE by 3%, and an increase in pre-PCI ST-segment elevation by 1mm increases the risk of 6-year MACE by 3.26 times.
Supplementary Materials
The following supporting information can be downloaded at the website of this paper posted on Preprints.org. Table S1: Culprit vessel and treatment data; Table S2: Additional 6-month follow-up data.
Author Contributions
Conceptualization, S.M. and M.Č.; methodology, A.M. and A.B.; software, I.P. and I.M.; validation, M.Č.; formal analysis, S.M..; investigation, S.M.; resources, A.B..; data curation, I.M. and I.P.; writing—original draft preparation, S.M., T.M.; writing—review and editing, M.Č., M.P., A.S.M.; visualization, I.M. and I.P.; supervision, A.S.M. All authors have read and agreed to the published version of the manuscript.
Funding
Nothing to disclose.
Institutional Review Board Statement
The study was conducted in accordance with the Declaration of Helsinki, and approved by the Ethics Committee of the Institute for Cardiovascular Diseases of Vojvodina (100-¼, 24.01.2023.).
Informed Consent Statement
Informed consent was obtained from all subjects involved in the study.
Conflicts of Interest
The authors declare no conflicts of interest.
References
- Liu, M.; Pan, J.; Meng, K.; Wang, Y.; Sun, X.; Ma, L.; Yu, X. Triglyceride-Glucose Body Mass Index Predicts Prognosis in Patients with ST-Elevation Myocardial Infarction. Sci Rep 2024, 14 (1), 976. [CrossRef]
- He, J.; Kong, L.; An, D.; Chen, B.; Zhao, C.; Li, Z.; Yang, F.; Dong, J.; Wei, L.; Shan, P.; Chen, Y.; Wu, L.; Xu, J.; Ge, H.; Pu, J. Prognostic Value of Segmental Strain After ST-Elevation Myocardial Infarction: Insights From the EARLY Assessment of MYOcardial Tissue Characteristics by Cardiac Magnetic Resonance (EARLY-MYO-CMR) Study. Journal of Magnetic Resonance Imaging n/a (n/a). [CrossRef]
- Giustino, G.; Mehran, R.; Dangas, G. D.; Kirtane, A. J.; Redfors, B.; Généreux, P.; Brener, S. J.; Prats, J.; Pocock, S. J.; Deliargyris, E. N.; Stone, G. W. Characterization of the Average Daily Ischemic and Bleeding Risk After Primary PCI for STEMI. Journal of the American College of Cardiology 2017, 70 (15), 1846–1857. [CrossRef]
- Tsai, I.-T.; Wang, C.-P.; Lu, Y.-C.; Hung, W.-C.; Wu, C.-C.; Lu, L.-F.; Chung, F.-M.; Hsu, C.-C.; Lee, Y.-J.; Yu, T.-H. The Burden of Major Adverse Cardiac Events in Patients with Coronary Artery Disease. BMC Cardiovasc Disord 2017, 17 (1), 1. [CrossRef]
- Poudel, I.; Tejpal, C.; Rashid, H.; Jahan, N. Major Adverse Cardiovascular Events: An Inevitable Outcome of ST-Elevation Myocardial Infarction? A Literature Review. Cureus 2019. [CrossRef]
- Miao, B.; Hernandez, A. V.; Alberts, M. J.; Mangiafico, N.; Roman, Y. M.; Coleman, C. I. Incidence and Predictors of Major Adverse Cardiovascular Events in Patients With Established Atherosclerotic Disease or Multiple Risk Factors. Journal of the American Heart Association 2020, 9 (2), e014402. [CrossRef]
- Pedersen, F.; Butrymovich, V.; Kelb, æk H.; Wachtell, K.; Helqvist, S.; Kastrup, J.; Holmvang, L.; Clemmensen, P.; Engstr, øm T.; Grande, P.; Saunam, äki K.; J, ørgensen E. Short- and Long-Term Cause of Death in Patients Treated With Primary PCI for STEMI. Journal of the American College of Cardiology 2014, 64 (20), 2101–2108. [CrossRef]
- Tanriverdi, Z.; Dursun, H.; Simsek, M. A.; Unal, B.; Kozan, O.; Kaya, D. The Predictive Value of Fragmented QRS and QRS Distortion for High-Risk Patients with STEMI and for the Reperfusion Success. Annals of Noninvasive Electrocardiology 2015, 20 (6), 578–585. [CrossRef]
- Savonitto, S.; Ardissino, D.; Granger, C. B.; Morando, G.; Prando, M. D.; Mafrici, A.; Cavallini, C.; Melandri, G.; Thompson, T. D.; Vahanian, A.; Ohman, E. M.; Califf, R. M.; Van de Werf, F.; Topol, E. J. Prognostic Value of the Admission Electrocardiogram in Acute Coronary Syndromes. JAMA 1999, 281 (8), 707–713. [CrossRef]
- Rafie, N.; Kashou, A. H.; Noseworthy, P. A. ECG Interpretation: Clinical Relevance, Challenges, and Advances. Hearts 2021, 2 (4), 505–513. [CrossRef]
- Alhamaydeh, M.; Gregg, R.; Ahmad, A.; Faramand, Z.; Saba, S.; Al-Zaiti, S. Identifying the Most Important ECG Predictors of Reduced Ejection Fraction in Patients with Suspected Acute Coronary Syndrome. Journal of Electrocardiology 2020, 61, 81–85. [CrossRef]
- López-Castillo, M.; Aceña, Á.; Pello-Lázaro, A. M.; Viegas, V.; Merchán Muñoz, B.; Carda, R.; Franco-Peláez, J.; Martín-Mariscal, M. L.; Briongos-Figuero, S.; Tuñón, J. Prognostic Value of Initial QRS Analysis in Anterior STEMI: Correlation with Left Ventricular Systolic Dysfunction, Serum Biomarkers, and Cardiac Outcomes. Annals of Noninvasive Electrocardiology 2021, 26 (1), e12791. [CrossRef]
- BUSZMAN, P.; SZAFRANEK, A.; KALARUS, Z.; GASIOR, M. Use of Changes in ST Segment Elevation for Prediction of Infarct Artery Recanalization in Acute Myocardial Infarction. European Heart Journal 1995, 16 (9), 1207–1214. [CrossRef]
- Matetzky, S.; Novikov, M.; Gruberg, L.; Freimark, D.; Feinberg, M.; Elian, D.; Novikov, I.; Di, S. E.; Agranat, O.; Har, -Zahav Yedael; Rabinowitz, B.; Kaplinsky, E.; Hod, H. The Significance of Persistent ST Elevation versus Early Resolution of ST Segment Elevation after Primary PTCA. Journal of the American College of Cardiology 1999, 34 (7), 1932–1938. [CrossRef]
- Resting Heart Rate and Long-Term Outcomes in Patients with Percutaneous Coronary Intervention: Results from a 10-Year Follow-Up of the CORFCHD-PCI Study. https://www.hindawi.com/journals/crp/2019/5432076/ (accessed 2024-02-28).
- Noman, A.; Balasubramaniam, K.; Das, R.; Ang, D.; Kunadian, V.; Ivanauskiene, T.; Zaman, A. G. Admission Heart Rate Predicts Mortality Following Primary Percutaneous Coronary Intervention for ST-Elevation Myocardial Infarction: An Observational Study. Cardiovascular Therapeutics 2013, 31 (6), 363–369. [CrossRef]
- Parodi, G.; Bellandi, B.; Valenti, R.; Memisha, G.; Giuliani, G.; Velluzzi, S.; Migliorini, A.; Carrabba, N.; Antoniucci, D. Heart Rate as an Independent Prognostic Risk Factor in Patients with Acute Myocardial Infarction Undergoing Primary Percutaneous Coronary Intervention. Atherosclerosis 2010, 211 (1), 255–259. [CrossRef]
- Wah, W.; Pek, P. P.; Ho, A. F. W.; Fook-Chong, S.; Zheng, H.; Loy, E. Y.; Chua, T. S. J.; Koh, T. H.; Chow, K. Y.; Earnest, A.; Pang, J.; Ong, M. E. H. Symptom-to-Door Delay among Patients with ST-Segment Elevation Myocardial Infarction in Singapore. Emergency Medicine Australasia 2017, 29 (1), 24–32. [CrossRef]
- Hafiz, A. M.; Naidu, S. S.; DeLeon, J.; Islam, S.; Alkhatib, B.; Lorenz, M.; D’Elia, A.; Rosenthal, B.; Marzo, K. Impact of First Contact on Symptom Onset–to-Door Time in Patients Presenting for Primary Percutaneous Coronary Intervention. The American Journal of Emergency Medicine 2013, 31 (6), 922–927. [CrossRef]
- De Luca, G.; Parodi, G.; Sciagrà, R.; Venditti, F.; Bellandi, B.; Vergara, R.; Migliorini, A.; Valenti, R.; Antoniucci, D. Time-to-Treatment and Infarct Size in STEMI Patients Undergoing Primary Angioplasty. International Journal of Cardiology 2013, 167 (4), 1508–1513. [CrossRef]
- Symptom onset-to-balloon time and mortality in the first seven years after STEMI treated with primary percutaneous coronary intervention | Heart. https://heart.bmj.com/content/98/23/1738.short (accessed 2024-02-28).
- Birdal, O.; Pay, L.; Aksakal, E.; Yumurtaş, A. Ç.; Çinier, G.; Yücel, E.; Tanboğa, İ. H.; Karagöz, A.; Oduncu, V. Naples Prognostic Score and Prediction of Left Ventricular Ejection Fraction in STEMI Patients. Angiology 2024, 75 (1), 36–43. [CrossRef]
- Lazăr, M.-A.; Ionac, I.; Luca, C.-T.; Petrescu, L.; Vacarescu, C.; Crisan, S.; Gaiță, D.; Cozma, D.; Sosdean, R.; Arnăutu, D.-A.; Cozlac, A.-R.; Luca, S.-A.; Gurgu, A.; Totorean, C.; Mornos, C. Reduced Left Ventricular Twist Early after Acute ST-Segment Elevation Myocardial Infarction as a Predictor of Left Ventricular Adverse Remodelling. Diagnostics 2023, 13 (18), 2896. [CrossRef]
- Evaluation of a QRS scoring system for estimating myocardial infarct size. I. Specificity and observer agreement. | Circulation. https://www.ahajournals.org/doi/abs/10.1161/01.CIR.65.2.342 (accessed 2024-02-28).
- QRS Score at Presentation Electrocardiogram Is Correlated With Infarct Size and Mortality in ST-Segment Elevation Myocardial Infarction Patients Undergoing Primary Percutaneous Coronary Intervention. https://www.jstage.jst.go.jp/article/circj/81/8/81_CJ-16-1255/_article/-char/ja/ (accessed 2024-02-28).
- Das, M. K.; Michael, M. A.; Suradi, H.; Peng, J.; Sinha, A.; Shen, C.; Mahenthiran, J.; Kovacs, R. J. Usefulness of Fragmented QRS on a 12-Lead Electrocardiogram in Acute Coronary Syndrome for Predicting Mortality. The American Journal of Cardiology 2009, 104 (12), 1631–1637. [CrossRef]
- Liu, Q.; Zhang, Y.; Zhang, P.; Zhang, J.; Cao, X.; He, S.; Yang, D. Both Baseline Selvester QRS Score and Change in QRS Score Predict Prognosis in Patients with Acute ST-Segment Elevation Myocardial Infarction after Percutaneous Coronary Intervention. Coron Artery Dis 2020, 31 (5), 403–410. [CrossRef]
- Rodríguez-Palomares, J. F.; Figueras-Bellot, J.; Descalzo, M.; Moral, S.; Otaegui, I.; Pineda, V.; del Blanco, B. G.; González-Alujas, M. T.; Evangelista Masip, A.; García-Dorado, D. Relation of ST-Segment Elevation Before and After Percutaneous Transluminal Coronary Angioplasty to Left Ventricular Area at Risk, Myocardial Infarct Size, and Systolic Function. The American Journal of Cardiology 2014, 113 (4), 593–600. [CrossRef]
- Weaver, J. C.; Ramsay, D. D.; Rees, D.; Binnekamp, M. F.; Prasan, A. M.; McCrohon, J. A. Dynamic Changes in ST Segment Resolution After Myocardial Infarction and the Association with Microvascular Injury on Cardiac Magnetic Resonance Imaging. Heart, Lung and Circulation 2011, 20 (2), 111–118. [CrossRef]
- Dizon, J. M.; Brener, S. J.; Maehara, A.; Witzenbichler, B.; Biviano, A.; Godlewski, J.; Parise, H.; Dambrink, J.-H.; Mehran, R.; Gibson, C. M.; Stone, G. W. Relationship between ST-Segment Resolution and Anterior Infarct Size after Primary Percutaneous Coronary Intervention: Analysis from the INFUSE-AMI Trial. European Heart Journal. Acute Cardiovascular Care 2014, 3 (1), 78–83. [CrossRef]
- Prognostic Impact of Early ST-Segment Resolution in Acute ST-Elevation Myocardial Infarction | Circulation. https://www.ahajournals.org/doi/full/10.1161/01.CIR.0000147778.05979.E6 (accessed 2024-02-28).
- Rakowski, T.; Dziewierz, A.; Siudak, Z.; Mielecki, W.; Brzozowska-Czarnek, A.; Legutko, J.; Rzeszutko, L.; Urbanik, A.; Dubiel, J. S.; Dudek, D. ST-Segment Resolution Assessed Immediately after Primary Percutaneous Coronary Intervention Correlates with Infarct Size and Left Ventricular Function in Cardiac Magnetic Resonance at 1-Year Follow-Up. Journal of Electrocardiology 2009, 42 (2), 152–156. [CrossRef]
- Haeck, J. D. E.; Verouden, N. J. W.; Kuijt, W. J.; Koch, K. T.; Majidi, M.; Hirsch, A.; Tijssen, J. G. P.; Krucoff, M. W.; De Winter, R. J. Impact of Early, Late, and No ST-Segment Resolution Measured by Continuous ST Holter Monitoring on Left Ventricular Ejection Fraction and Infarct Size as Determined by Cardiovascular Magnetic Resonance Imaging. Journal of Electrocardiology 2011, 44 (1), 36–41. [CrossRef]
- Røsand, Ø.; Høydal, M. A. Cardiac Exosomes in Ischemic Heart Disease—A Narrative Review. Diagnostics 2021, 11 (2), 269. [CrossRef]
- Fröhlich, G. M.; Meier, P.; White, S. K.; Yellon, D. M.; Hausenloy, D. J. Myocardial Reperfusion Injury: Looking beyond Primary PCI. European Heart Journal 2013, 34 (23), 1714–1722. [CrossRef]
- Stone, G. W.; Selker, H. P.; Thiele, H.; Patel, M. R.; Udelson, J. E.; Ohman, E. M.; Maehara, A.; Eitel, I.; Granger, C. B.; Jenkins, P. L.; Nichols, M.; Ben-Yehuda, O. Relationship Between Infarct Size and Outcomes Following Primary PCI: Patient-Level Analysis From 10 Randomized Trials. J Am Coll Cardiol 2016, 67 (14), 1674–1683. [CrossRef]
- de Waha, S.; Patel, M. R.; Granger, C. B.; Ohman, E. M.; Maehara, A.; Eitel, I.; Ben-Yehuda, O.; Jenkins, P.; Thiele, H.; Stone, G. W. Relationship between Microvascular Obstruction and Adverse Events Following Primary Percutaneous Coronary Intervention for ST-Segment Elevation Myocardial Infarction: An Individual Patient Data Pooled Analysis from Seven Randomized Trials. Eur Heart J 2017, 38 (47), 3502–3510. [CrossRef]
- Byrne, R. A.; Rossello, X.; Coughlan, J. J.; Barbato, E.; Berry, C.; Chieffo, A.; Claeys, M. J.; Dan, G.-A.; Dweck, M. R.; Galbraith, M.; Gilard, M.; Hinterbuchner, L.; Jankowska, E. A.; Jüni, P.; Kimura, T.; Kunadian, V.; Leosdottir, M.; Lorusso, R.; Pedretti, R. F. E.; Rigopoulos, A. G.; Rubini Gimenez, M.; Thiele, H.; Vranckx, P.; Wassmann, S.; Wenger, N. K.; Ibanez, B.; ESC Scientific Document Group. 2023 ESC Guidelines for the Management of Acute Coronary Syndromes. Eur Heart J 2023, 44 (38), 3720–3826. [CrossRef]
Figure 1.
Receiver operator characteristic curves for: (a) QRS complex width, based on the time point of measurement; (b) ST-segment elevation, based on the time point of measurement.
Figure 1.
Receiver operator characteristic curves for: (a) QRS complex width, based on the time point of measurement; (b) ST-segment elevation, based on the time point of measurement.
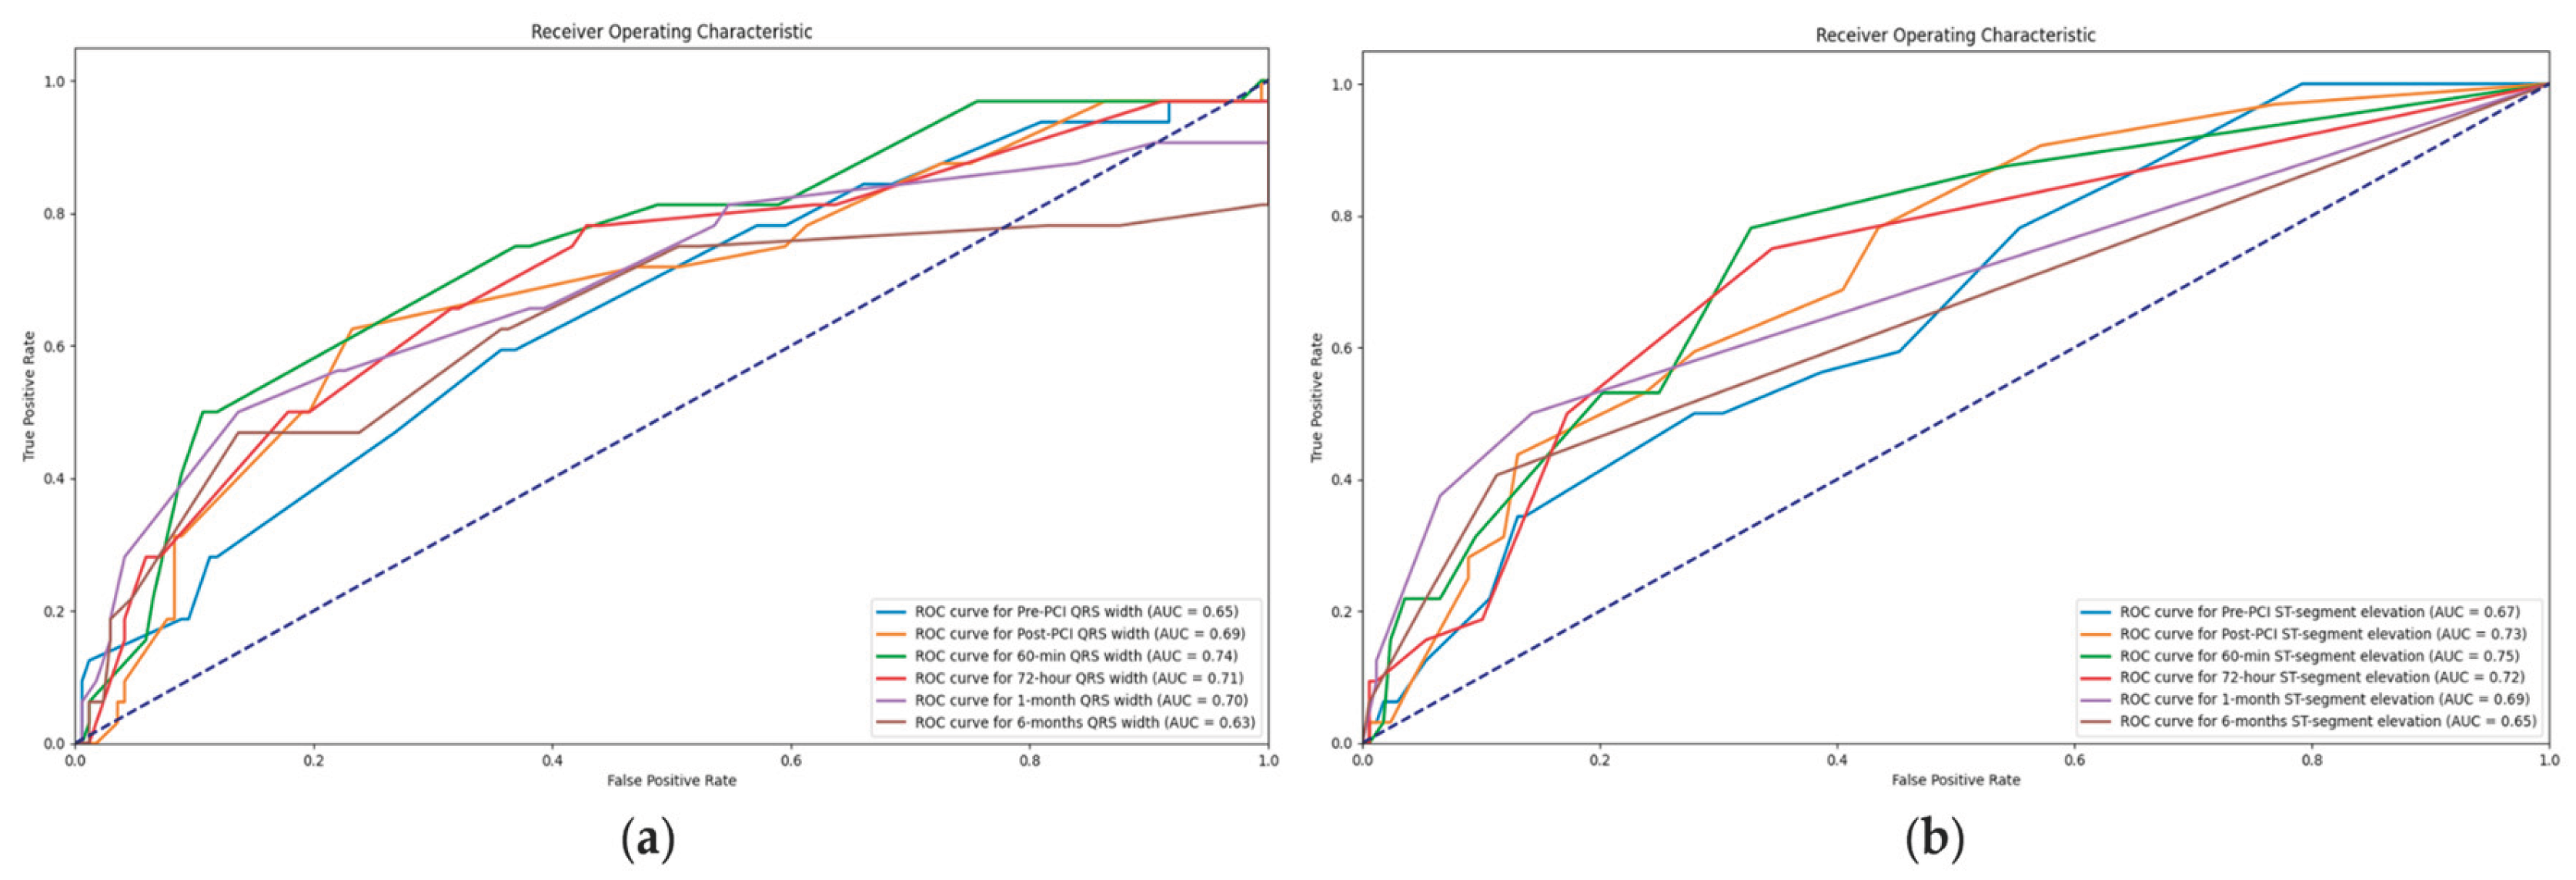

Table 1.
Patient sample.
| Variables | Whole sample (N = 200) | Symptoms duration of less than 6 hours (N = 100) | Symptoms duration of more than 6 hours (N = 100) | P value |
|---|---|---|---|---|
| Sex | 1,000 | |||
| Female | 58 (29%) | 29 | 29 | |
| Male | 142 (71%) | 71 | 71 | |
| Age (years) | 60,6 | 58.5 [52.0 - 67.0] | 60.0 [52.0 - 74.0] | 0,154 |
| Height (cm) | 173,1 | 175.0 [166.75 - 180.0] | 175.0 [165.0 - 180.0] | 0,463 |
| Weight (kg) | 82,6 | 82.0 [75.0 - 90.0] | 80.0 [70.0 - 90.0] | 0,299 |
| Body mass index (kg/m2) | 27,5 | 26.8 [25.24 - 29.55] | 26.45 [24.35 - 29.4] | 0,426 |
| Body surface area (m2) | 2,0 | 2.0 [1.87 - 2.08] | 1.98 [1.83 - 2.12] | 0,301 |
| Heart rate (beats/min) | 78,5 | 77.5 [65.0 - 85.0] | 79.0 [70.0 - 86.25] | 0,035 |
| Systolic blood pressure (mmHg) | 141,0 | 140.0 [120.0 - 150.0] | 140.0 [130.0 - 160.0] | 0,131 |
| Diastolic blood pressure (mmHg) | 82,4 | 80.0 [70.0 - 90.0] | 80.0 [80.0 - 90.0] | 0,437 |
| Vascular risk factors and comorbidities | ||||
| Hypertension | 126 (63%) | 65 | 61 | 0,660 |
| Diabetes mellitus | 36 (18%) | 17 | 19 | 0,854 |
| Family history | 63 (32%) | 32 | 31 | 1,000 |
| Kidney function | ||||
| Creatinine (micromol/l) | 96,6 | 93.0 [79.0 - 108.25] | 94.0 [81.75 - 106.25] | 0,829 |
| Clearance (ml/min) | ||||
| >90 | 89 (45%) | 50 | 39 | 0,155 |
| 60-90 | 80 (40%) | 40 | 40 | 1,000 |
| 45-59 | 23 (12%) | 7 | 16 | 0,076 |
| 30-44 | 4 (2%) | 2 | 2 | 1,000 |
| 15-29 | 4 (2%) | 1 | 3 | 0,614 |
| Duration of the symptoms (min) | 304,3 | 120.0 [90.0 - 180.0] | 420.0 [360.0 - 600.0] | 0,000 |
| Killip | ||||
| 1 | 128 (64%) | 72 | 56 | 0,027 |
| 1/2 | 4 (2%) | 1 | 3 | 0,614 |
| 2 | 56 (28%) | 24 | 32 | 0,270 |
| 2/3 | 6 (3%) | 1 | 5 | 0,214 |
| 3 | 4 (2%) | 0 | 4 | 0,130 |
| 4 | 2 (1%) | 2 | 0 | 0,477 |
| Post MI NYHA status | ||||
| 1 | 175 (88%) | 89 | 86 | 0,669 |
| 2 | 18 (9%) | 11 | 7 | 0,459 |
| 2/3 | 2 (1%) | 0 | 2 | 0,477 |
| 3 | 1 (0.5%) | 0 | 1 | 1,000 |
| 4 | 4 (2%) | 0 | 4 | 0,130 |
| Post MI CCS | ||||
| 0 | 188 (94%) | 95 | 93 | 0,766 |
| 1 | 9 (5%) | 4 | 5 | 1,000 |
| 2 | 1 (1%) | 0 | 1 | 1,000 |
| 3 | 1 (1%) | 0 | 1 | 1,000 |
| 4 | 1 (1%) | 1 | 0 | 1,000 |
| Myocardial injury assessment | ||||
| Creatine Kinase isoenzyme MB (CKMB) | ||||
| Pre-PCI | 61,5 | 27.5 [21.0 - 35.25] | 59.0 [36.0 - 110.0] | 0,000 |
| 6-hour | 285,1 | 244.0 [122.25 - 376.25] | 345.5 [168.0 - 500.0] | 0,007 |
| 24-hour | 148,1 | 107.0 [72.25 - 188.0] | 139.5 [81.0 - 194.25] | 0,324 |
| 72-hour | 38,7 | 30.0 [21.75 - 38.0] | 32.0 [25.0 - 45.0] | 0,040 |
| Troponin I (TnI) | ||||
| Pre-PCI | 1,4 | 0.04 [0.01 - 0.2] | 1.29 [0.37 - 3.46] | 0,000 |
| 6-hour | 17,7 | 11.43 [5.26 - 29.2] | 25.0 [10.1 - 30.0] | 0,000 |
| 24-hour | 12,9 | 7.65 [3.3 - 14.89] | 10.42 [5.5 - 16.9] | 0,575 |
| 72-hour | 3,4 | 2.21 [1.04 - 3.64] | 3.1 [1.2 - 4.77] | 0,074 |
| In-hospital stay length (days) | 6,2 | 6.0 [5.0 - 7.0] | 5.0 [5.0 - 7.0] | 0,265 |
| Intrahospital complications | 0 (0%) | 0 | 0 | 1,000 |
| Without | 176 (88%) | 88 | 88 | 1,000 |
| Ventricular thrombus | 4 (2%) | 2 | 2 | 1,000 |
| Pericardial effusion | 5 (3%) | 1 | 4 | 0,365 |
| Ventricular fibrillation | 11 (6%) | 8 | 3 | 0,215 |
| Pulseless electrical activity | 1 (1%) | 1 | 0 | 1,000 |
| Cardiac tamponade | 1 (1%) | 0 | 1 | 1,000 |
| Stroke | 1 (1%) | 0 | 1 | 1,000 |
| In-hospital death | 1 (1%) | 0 | 1 | 1,000 |
| Echocardiographic assessment | ||||
| In-hospital FSLV | 35,0 | 34.7 [29.55 - 38.42] | 35.95 [32.6 - 40.15] | 0,254 |
| In-hospital EFLV | 48,9 | 50.0 [46.0 - 55.0] | 48.0 [42.0 - 55.0] | 0,024 |
| In-hospital LVIDs | 3,2 | 3.2 [2.9 - 3.5] | 3.15 [2.8 - 3.5] | 0,647 |
| In-hospital LVIDd | 4,9 | 4.9 [4.6 - 5.2] | 4.9 [4.6 - 5.22] | 0,823 |
| In-hospital LVEDV | 102,0 | 94.0 [84.0 - 115.25] | 97.0 [78.5 - 121.5] | 0,787 |
| In-hospital LVESV | 52,6 | 48.0 [40.88 - 60.0] | 50.0 [36.25 - 65.0] | 0,727 |
| In-hospital MADd | 3,0 | 3.0 [2.9 - 3.2] | 3.0 [2.9 - 3.1] | 0,374 |
| In-hospital mitral regurgitation | ||||
| 0 | 59 (30%) | 26 | 33 | 0,352 |
| 0/1 | 5 (3%) | 4 | 1 | 0,365 |
| 1 | 64 (32%) | 38 | 26 | 0,095 |
| 1/2 | 31 (16%) | 11 | 20 | 0,118 |
| 2 | 34 (17%) | 19 | 15 | 0,572 |
| 2/3 | 7 (4%) | 2 | 5 | 0,442 |
NYHA, New York Heart Association; CCS, Canadian Cardiology Society; PCI, Percutaneous Coronary Intervention; FSLV, Fractional Shortening of the Left Ventricle; EFLV, Left Ventricle Ejection Fraction; LVIDs, Left Ventricular Internal Dimension in Systole; LVIDd, Left Ventricular Internal Dimension in Diastole; LVEDV, Left Ventricular End-Diastolic Volume; LVESV, Left Ventricular End-Systolic Volume; MADd, Mitral Annulus Diameter Dimension;.
Table 2.
ECG data.
| Variables | Whole sample (N = 200) | Symptoms duration of less than 6 hours (N = 100) | Symptoms duration of more than 6 hours (N = 100) | P value |
|---|---|---|---|---|
| Dynamics of the QRS complex | ||||
| Pre-PCI QRS width | 100,5 | 100.0 [90.0 - 110.0] | 100.0 [93.5 - 110.0] | 0,463 |
| Post-PCI QRS width | 98,8 | 95.0 [85.0 - 100.0] | 100.0 [90.0 - 110.0] | 0,111 |
| 60-min QRS width | 94,7 | 86.5 [80.0 - 100.0] | 100.0 [87.25 - 100.0] | 0,008 |
| 72-hour QRS width | 89,8 | 81.0 [80.0 - 90.5] | 95.0 [85.0 - 100.0] | 0,000 |
| 1-month QRS width | 87,9 | 80.0 [80.0 - 90.0] | 90.0 [85.0 - 100.0] | 0,000 |
| 6-months QRS width | 87,7 | 80.0 [80.0 - 90.0] | 90.0 [80.0 - 100.0] | 0,000 |
| ST-segment elevation (mm) | ||||
| Pre-PCI | 3,75 | 3.5 [2.5 - 5.0] | 3.0 [2.0 - 5.0] | 0,064 |
| Post-PCI | 1,89 | 1.0 [0.0 - 2.5] | 2.0 [0.5 - 3.0] | 0,051 |
| 60-min | 1,02 | 0.5 [0.0 - 1.0] | 1.0 [0.0 - 2.0] | 0,005 |
| 72-hour | 0,47 | 0.0 [0.0 - 0.5] | 0.5 [0.0 - 1.0] | 0,000 |
| 1-month | 0,18 | 0.0 [0.0 - 0.0] | 0.0 [0.0 - 0.5] | 0,003 |
| 6-months | 0,14 | 0.0 [0.0 - 0.0] | 0.0 [0.0 - 0.0] | 0,013 |
| ST-segment resolution (>50%) | ||||
| Post-PCI | 121 (61%) | 72 | 49 | 0,001 |
| 60-min | 98 (49%) | 48 | 50 | 0,888 |
| 72-hour | 82 (41%) | 39 | 43 | 0,666 |
| 1-month | 52 (26%) | 23 | 29 | 0,420 |
| 6-months | 16 (8%) | 7 | 9 | 0,794 |
| Newly formed branch block | ||||
| No | 175 (88%) | 87 | 88 | 1,000 |
| Transitory RBBB | 2 (1%) | 1 | 1 | 1,000 |
| Transitory LBBB | 9 (5%) | 7 | 2 | 0,172 |
| Transitory LAHB | 4 (2%) | 2 | 2 | 1,000 |
| Permanent LAHB | 5 (3%) | 1 | 4 | 0,365 |
| Permanent ILBBB | 2 (1%) | 0 | 2 | 0,477 |
| Permanent RBBB | 2 (1%) | 2 | 0 | 0,477 |
PCI, Percutaneous coronary intervention; RBBB, Right Bundle Branch Block; LBBB, Left Bundle Branch Block; LAHB, Left Anterior Hemiblock; ILBBB, Incomplete Bundle Branch Block.
Table 3.
Follow-up data.
| Variables | Whole sample (N = 200) | Symptoms duration of less than 6 hours (N = 100) | Symptoms duration of more than 6 hours (N = 100) | P value |
|---|---|---|---|---|
| 6-months follow-up data | ||||
| In-hospital death | 1 (1%) | 0 | 1 | 1,000 |
| Out-of-hospital death | 5 (3%) | 1 | 4 | 0,365 |
| Coronary event-related death | 6 (3%) | 1 | 5 | 0,214 |
| Reinfarction of the treated vessel | 1 (1%) | 1 | 0 | 1,000 |
| Manifested HF | 28 (14%) | 6 | 22 | 0,002 |
| Stent thrombosis | 4 (2%) | 2 | 2 | 1,000 |
| Clinically manifested restenosis | 2 (1%) | 0 | 2 | 0,477 |
| Ventricular thrombus | 1 (1%) | 1 | 0 | 1,000 |
| MACE | 32 (16%) | 9 | 23 | 0,012 |
| Dual Antiplatelet Treatment | ||||
| Acetylsalicylic acid + Ticagrelor | 79 (40%) | 27 | 52 | 0,001 |
| Acetylsalicylic acid + Clopidogrel | 109 (55%) | 69 | 40 | 0,000 |
| Acetylsalicylic acid + Ticagrelor + Oral anticoagulant | 2 (1%) | 2 | 0 | 0,477 |
| Acetylsalicylic acid + Clopidogrel + Oral anticoagulant | 9 (5%) | 2 | 7 | 0,172 |
| Acetylsalicylic acid + Clopidogrel + Direct oral anticoagulant | 1 (1%) | 0 | 1 | 1,000 |
| 6-months NYHA | ||||
| 1 | 171 (86%) | 94 | 77 | 0,001 |
| 1/2 | 1 (1%) | 1 | 0 | 1,000 |
| 2 | 19 (10%) | 4 | 15 | 0,016 |
| 2/3 | 1 (1%) | 0 | 1 | 1,000 |
| 3 | 2 (1%) | 0 | 2 | 0,477 |
| 3/4 | 1 (1%) | 0 | 1 | 1,000 |
| 6-months CCS | ||||
| 0 | 174 (87%) | 86 | 88 | 0,833 |
| 1 | 13 (7%) | 8 | 5 | 0,566 |
| 2 | 6 (3%) | 4 | 2 | 0,678 |
| 3 | 2 (1%) | 1 | 1 | 1,000 |
| Echocardiographic assessment | ||||
| 6-months FSLV | 35,7 | 35.8 [33.3 - 40.0] | 36.0 [32.65 - 39.25] | 0,572 |
| 6-months EFLV | 51,8 | 55.0 [50.0 - 57.5] | 50.0 [45.0 - 55.0] | 0,000 |
| 6-months LVIDs | 3,2 | 3.1 [2.8 - 3.45] | 3.2 [2.9 - 3.5] | 0,368 |
| 6-months LVIDd | 5,0 | 5.0 [4.65 - 5.3] | 5.0 [4.5 - 5.35] | 0,502 |
| 6-months LVEDV | 104,0 | 95.0 [80.0 - 115.0] | 101.0 [80.5 - 124.0] | 0,251 |
| 6-months LVESV | 52,3 | 47.0 [37.0 - 52.5] | 50.0 [40.0 - 67.0] | 0,023 |
| 6-months MADd | 3,1 | 3.1 [3.0 - 3.2] | 3.0 [2.9 - 3.2] | 0,183 |
| 6-months mitral regurgitation | ||||
| 0 | 54 (27%) | 28 | 26 | 0,873 |
| 0/1 | 7 (4%) | 7 | 0 | 0,021 |
| 1 | 66 (33%) | 36 | 30 | 0,452 |
| 1/2 | 29 (15%) | 9 | 20 | 0,045 |
| 2 | 25 (13%) | 13 | 12 | 1,000 |
| 2/3 | 10 (5%) | 5 | 5 | 1,000 |
| 3 | 1 (1%) | 0 | 1 | 1,000 |
| 3/4 | 2 (1%) | 1 | 1 | 1,000 |
| 6-years follow-up data | ||||
| All-cause mortality | 22 (11%) | 7 | 15 | 0,114 |
| Cardiovascular death | 14 (7%) | 6 | 8 | 0,782 |
| Non-cardiovascular death | 8 (4%) | 1 | 7 | 0,071 |
| Hospitalization due to HF | 5 (3%) | 3 | 2 | 1,000 |
| Reinfarction | 7 (4%) | 6 | 1 | 0,124 |
| Stroke | 4 (2%) | 3 | 1 | 0,614 |
| Stent restenosis | 4 (2%) | 2 | 2 | 1,000 |
| Re-PCI of the non-culprit vessel | 10 (5%) | 5 | 5 | 1,000 |
| Number of days until the first MACE | 1745 | 2287.0 [1874.0 - 2476.0] | 1854.0 [615.0 - 2208.5] | 0,000 |
| Number of days until death | 2063 | 2361.0 [2272.5 - 2484.0] | 1942.0 [1601.75 - 2260.5] | 0,000 |
HF, Heart Failure; MACE, Major Adverse Cardiovascular Events; NYHA, New York Heart Association; CCS, Canadian Cardiology Society; FSLV, Fractional Shortening of the Left Ventricle; EFLV, Left Ventricle Ejection Fraction; LVIDs, Left Ventricular Internal Dimension in Systole; LVIDd, Left Ventricular Internal Dimension in Diastole; LVEDV, Left Ventricular End-Diastolic Volume; LVESV, Left Ventricular End-Systolic Volume; MADd, Mitral Annulus Diameter Dimension; PCI, Percutaneous Coronary Intervention.
Table 3.
Value of QRS complex width in association with MACE.
| QRS complex | MACE | Width (mm) | P value | OR (95% CI) | P value |
|---|---|---|---|---|---|
| Pre-PCI | No | 100 (IQR 90-105) | 0.026 | 1.028 (1.003-1.053) | 0.029 |
| Yes | 102.5 (IQR 90-110) | ||||
| Right after the procedure | No | 95 (IQR 85-100) | 0.010 | 1.026 (1.004-1.048) | 0.020 |
| Yes | 100 (IQR 90-110) | ||||
| 1-hour after the procedure | No | 94 (IQR 85-100) | 0.013 | 1.027 (1.003-1.052) | 0.025 |
| Yes | 95 (IQR 85-105) | ||||
| 72 hours after the procedure | No | 85 (IQR 80-95) | 0.020 | 1.031 (1.002-1.060) | 0.034 |
| Yes | 89 (IQR 80-100) | ||||
| 1 month | No | 85 (IQR 80-90) | 0.034 | 1.042 (1.012-1.074) | 0.007 |
| Yes | 85 (IQR 80-100) | ||||
| 6 months | No | 85 (IQR 80-90) | 0.041 | 1.038 (1.009-1.069) | 0.011 |
| Yes | 87.5 (IQR 80-100) |
MACE, Major Adverse Cardiovascular Events; PCI, Percutaneous coronary intervention.
Table 4.
Value of ST-segment elevation in association with MACE.
| ST-segment | MACE | Elevation (mm) | P value | OR (95% CI) | P value |
|---|---|---|---|---|---|
| Pre-PCI | No | 3 (IQR 2-5) | 0.018 | 1.61 (1.024-1.317) | 0.020 |
| Yes | 3 (IQR 2.5-5) | ||||
| Right after the procedure | No | 1 (IQR 0-2.5) | 0.000 | 1.296 (1.103-1.523) | 0.002 |
| Yes | 2 (IQR 0.75-3) | ||||
| 1-hour after the procedure | No | 0 (IQR 0-1) | 0.000 | 1.391 (1.111-1.741) | 0.004 |
| Yes | 0.5 (IQR 0.5-2) | ||||
| 72 hours after the procedure | No | 0 (IQR 0-5) | 0.004 | 1.500 (1.037-2.170) | 0.031 |
| Yes | 0 (IQR 0-0.75) | ||||
| 1 month | No | 0 (IQR 0-0) | 0.000 | 3.256 (1.572-6.747) | 0.001 |
| Yes | 0 (IQR 0-0.5) | ||||
| 6 months | No | 0 (IQR 0-0) | 0.003 | 2.972 (1.268-6.965) | 0.012 |
| Yes | 0 (IQR 0-0.25) |
MACE, Major Adverse Cardiovascular Events; PCI, Percutaneous coronary intervention.
Disclaimer/Publisher’s Note: The statements, opinions and data contained in all publications are solely those of the individual author(s) and contributor(s) and not of MDPI and/or the editor(s). MDPI and/or the editor(s) disclaim responsibility for any injury to people or property resulting from any ideas, methods, instructions or products referred to in the content. |
© 2024 by the authors. Licensee MDPI, Basel, Switzerland. This article is an open access article distributed under the terms and conditions of the Creative Commons Attribution (CC BY) license (http://creativecommons.org/licenses/by/4.0/).
Copyright: This open access article is published under a Creative Commons CC BY 4.0 license, which permit the free download, distribution, and reuse, provided that the author and preprint are cited in any reuse.