
Submitted:
28 February 2024
Posted:
29 February 2024
Read the latest preprint version here
Abstract
Accurately estimating shrub biomass in arid and semi-arid regions is critical for understanding ecosystem productivity and carbon stocks at both local and global scales. However, capturing the shrub biomass accurately by satellite observations is challenging due to the short and sparse features of shrubs. In this study, we presented a framework to estimate shrub biomass at a 10m spatial resolution by integrating ground in-situ data, unmanned aerial vehicle (UAV), Sentinel-2, and Sentinel-1 observations. The pilot study was conducted in the Helan mountains of Ningxia province, China. First, the spatial distribution map of shrubland and other land cover types was generated in 2023. Then, a prediction model of shrub biomass was developed in a Random Forest Regression (RFR) approach driven by different predicted variable datasets based on in-situ measurements, UAV, and satellite images. Finally, the developed model was used to produce the biomass map of shrubland in 2023. The uncertainty was characterized by creating a standard deviation (SD) map using the Leave-One-Out Cross-Validation (LOOCV) method in the shrub biomass estimates. The resultant shrubland distribution map in 2023 has an F1 score of 0.92. The shrub biomass model driven by spectral bands and vegetation indices (R2= 0.62) demonstrated superior performance than that only driven by spectral bands (R2=0.33) or vegetation indices (R2=0.55). The uncertainty of the estimated biomass was lower than 4%, with the lowest values (<2%) happening in the high shrub coverage (>30%) and biomass production (>30kg/m2) regions. Furthermore, the findings show that the magnitude of shrub biomass was affected by the aridity and precipitation significantly in the study region. This study provides a workflow to accurately monitor the biomass of shrublands in a complicated environment based on remote sensing images from multi-platform observations.
Keywords:
Shrub biomass
; Machine learning
; Muti-platform
; UAV
; Land cover
1. Introduction
The need to protect the ecological environment and restore ecosystems has grown in recent years due to the effects of human activity and global climate change [1,2,3,4]. As an important vegetation type, shrubs play a crucial role in ecosystems [5,6,7]. They not only maintain soil moisture balance and prevent soil erosion but also provide habitats and fodder [8,9,10], which are essential for preserving biodiversity and maintaining ecological balance [11]. Among their attributes, shrub biomass is a crucial measurement indicator for reflecting shrub growth status and overall vegetation productivity [12,13]. Therefore, accurately estimating shrub biomass is a key task for understanding vegetation growth status, ecological functions, and ecosystem carbon storage [14,15,16].
Conventional methods of field surveying have limitations in accurately estimating the biomass of shrubs [17]. Firstly, these methods necessitate a substantial allocation of human resources and financial investment and are time-consuming, particularly in expansive areas with intricate topography [18,19]. Secondly, field surveys can only yield localized sample data, making it challenging to capture the spatial distribution and temporal patterns of shrubs fully. Conversely, the use of destructive sampling techniques to quantify shrub biomass may potentially impact the surrounding ecological system [20]. Furthermore, the biomass of shrubs is influenced by various factors such as vegetation structure, growth environment, and climatic conditions [21,22]. Consequently, it is challenging to account for these factors using traditional methods comprehensively.
To address the limitations of conventional methods, remote sensing technology has emerged as an effective tool for estimating shrub biomass [23,24,25]. This technology enables the acquisition of extensive and continuous data with high spatial and temporal resolution, facilitating large-scale estimation of shrub biomass [26,27]. Recent advancements in satellite remote sensing technology, along with the availability of data from satellites such as Landsat and Sentinel series, have expanded the possibilities in the field of biomass estimation [28,29]. However, utilizing only the spectral bands of remote sensing images in shrub biomass estimation has its constraints [30]. For example, the visible and near-infrared bands have a narrow wavelength range [31], making it challenging to capture the differences in factors closely related to shrub biomass, such as vegetation structure, leaf area index, and chlorophyll content. To overcome these limitations, many studies have used vegetation indices as important indicators for biomass estimation [32]. Vegetation indices are numerical values calculated from spectral bands that can reflect key information about vegetation growth status, chlorophyll content, leaf area index, and other related factors [33,34]. However, existing vegetation indices may encounter saturation issues and struggle to differentiate higher biomass shrubs in densely vegetated areas [35]. Therefore, it is imperative to evaluate which vegetation indices or spectral bands contribute most significantly to the estimation of shrub biomass, emphasizing the need to identify the optimal feature combination for accurate estimation.
Unmanned aerial vehicles (UAVs) are also essential in the estimation of shrub biomass due to their ability to provide detailed information and significant advantages [36,37]. Equipped with high-resolution sensors and advanced image processing techniques, UAVs can capture high-quality remote sensing imagery, offering comprehensive data on shrub vegetation [38,39]. They are capable of capturing extensive areas of shrub coverage from a high-altitude overhead perspective, enabling the rapid and accurate identification and extraction of shrub objects [37,40,41,42]. Additionally, UAVs have higher spatial resolution and flexibility compared to traditional aerial remote sensing techniques, allowing for the capture of finer details of shrub structure and characteristics [43]. This capability is crucial for biomass estimation, as the spatial heterogeneity and subtle variations of shrubs can significantly impact the accuracy of estimations. Furthermore, UAVs can enhance workflow efficiency, reduce workforce, and save time and costs compared to traditional field surveys and plot measurements [44]. However, there is limited research on integrating UAV-derived shrub biomass estimation at the satellite scale, highlighting the need for further investigation in this area.
Traditionally, biomass estimation models relied on statistical regression techniques to establish empirical relationships between field-measured biomass and various biophysical or remote sensing variables [45]. Over time, several modeling approaches have been developed to enhance the precision of estimating shrub biomass [37,46,47]. In recent times, machine learning methods have emerged as potent tools in this field, demonstrating superior performance compared to conventional modeling methods [48]. However, these models had limitations in capturing complex nonlinear relationships and accounting for spatial heterogeneity [49]. In contrast, machine learning methods, such as random forests, support vector machines, and neural networks, have gained traction due to their capability to handle intricate and nonlinear relationships [50,51]. Machine learning methods offer several advantages over traditional modeling techniques in shrub biomass estimation, particularly in effectively handling large volumes of remote sensing data, including multispectral and hyperspectral imagery, which provide rich spectral and spatial information for accurate biomass estimation [48,52,53].
This work aimed to propose a framework to estimate shrubland biomass at 10m over an arid and semi-arid mountain region based on multi-scale data from field measurements, UAV, Sentinel-1, Sentinel-2 and Landsat observations. The Helan Mountains in Ningxia province, China, were selected as the study area. Firstly, a land cover classification was conducted to identify the shrublands and other land cover types. Secondly, the prediction model of shrub biomass was developed in a Random Forest Regression (RFR) approach driven by different predicted variable datasets based on field measurements, UAV, and satellite images. The field measurement data was used to establish the allometric growth equation between shrub biomass and shrub structure parameters. Using the allometric equation, the shrub biomass was determined in UAV data. Using the UAV-based shrub biomass as inputs, the optimal satellite-based biomass estimation model was developed by comparing different predictor variables from Landsat, Sentinel-1, and Sentinel-2 satellites. Thirdly, with the best model, we created a map of the biomass distribution of shrubland in the Helan Mountains. The accuracy of the resultant map was evaluated over various ranges of shrub biomass or shrub coverage. Finally, we assessed the spatial characteristics of shrubland biomass based on the resultant biomass map and the auxiliary datasets of climate and topography.
2. Material and methods
2.1. Study area
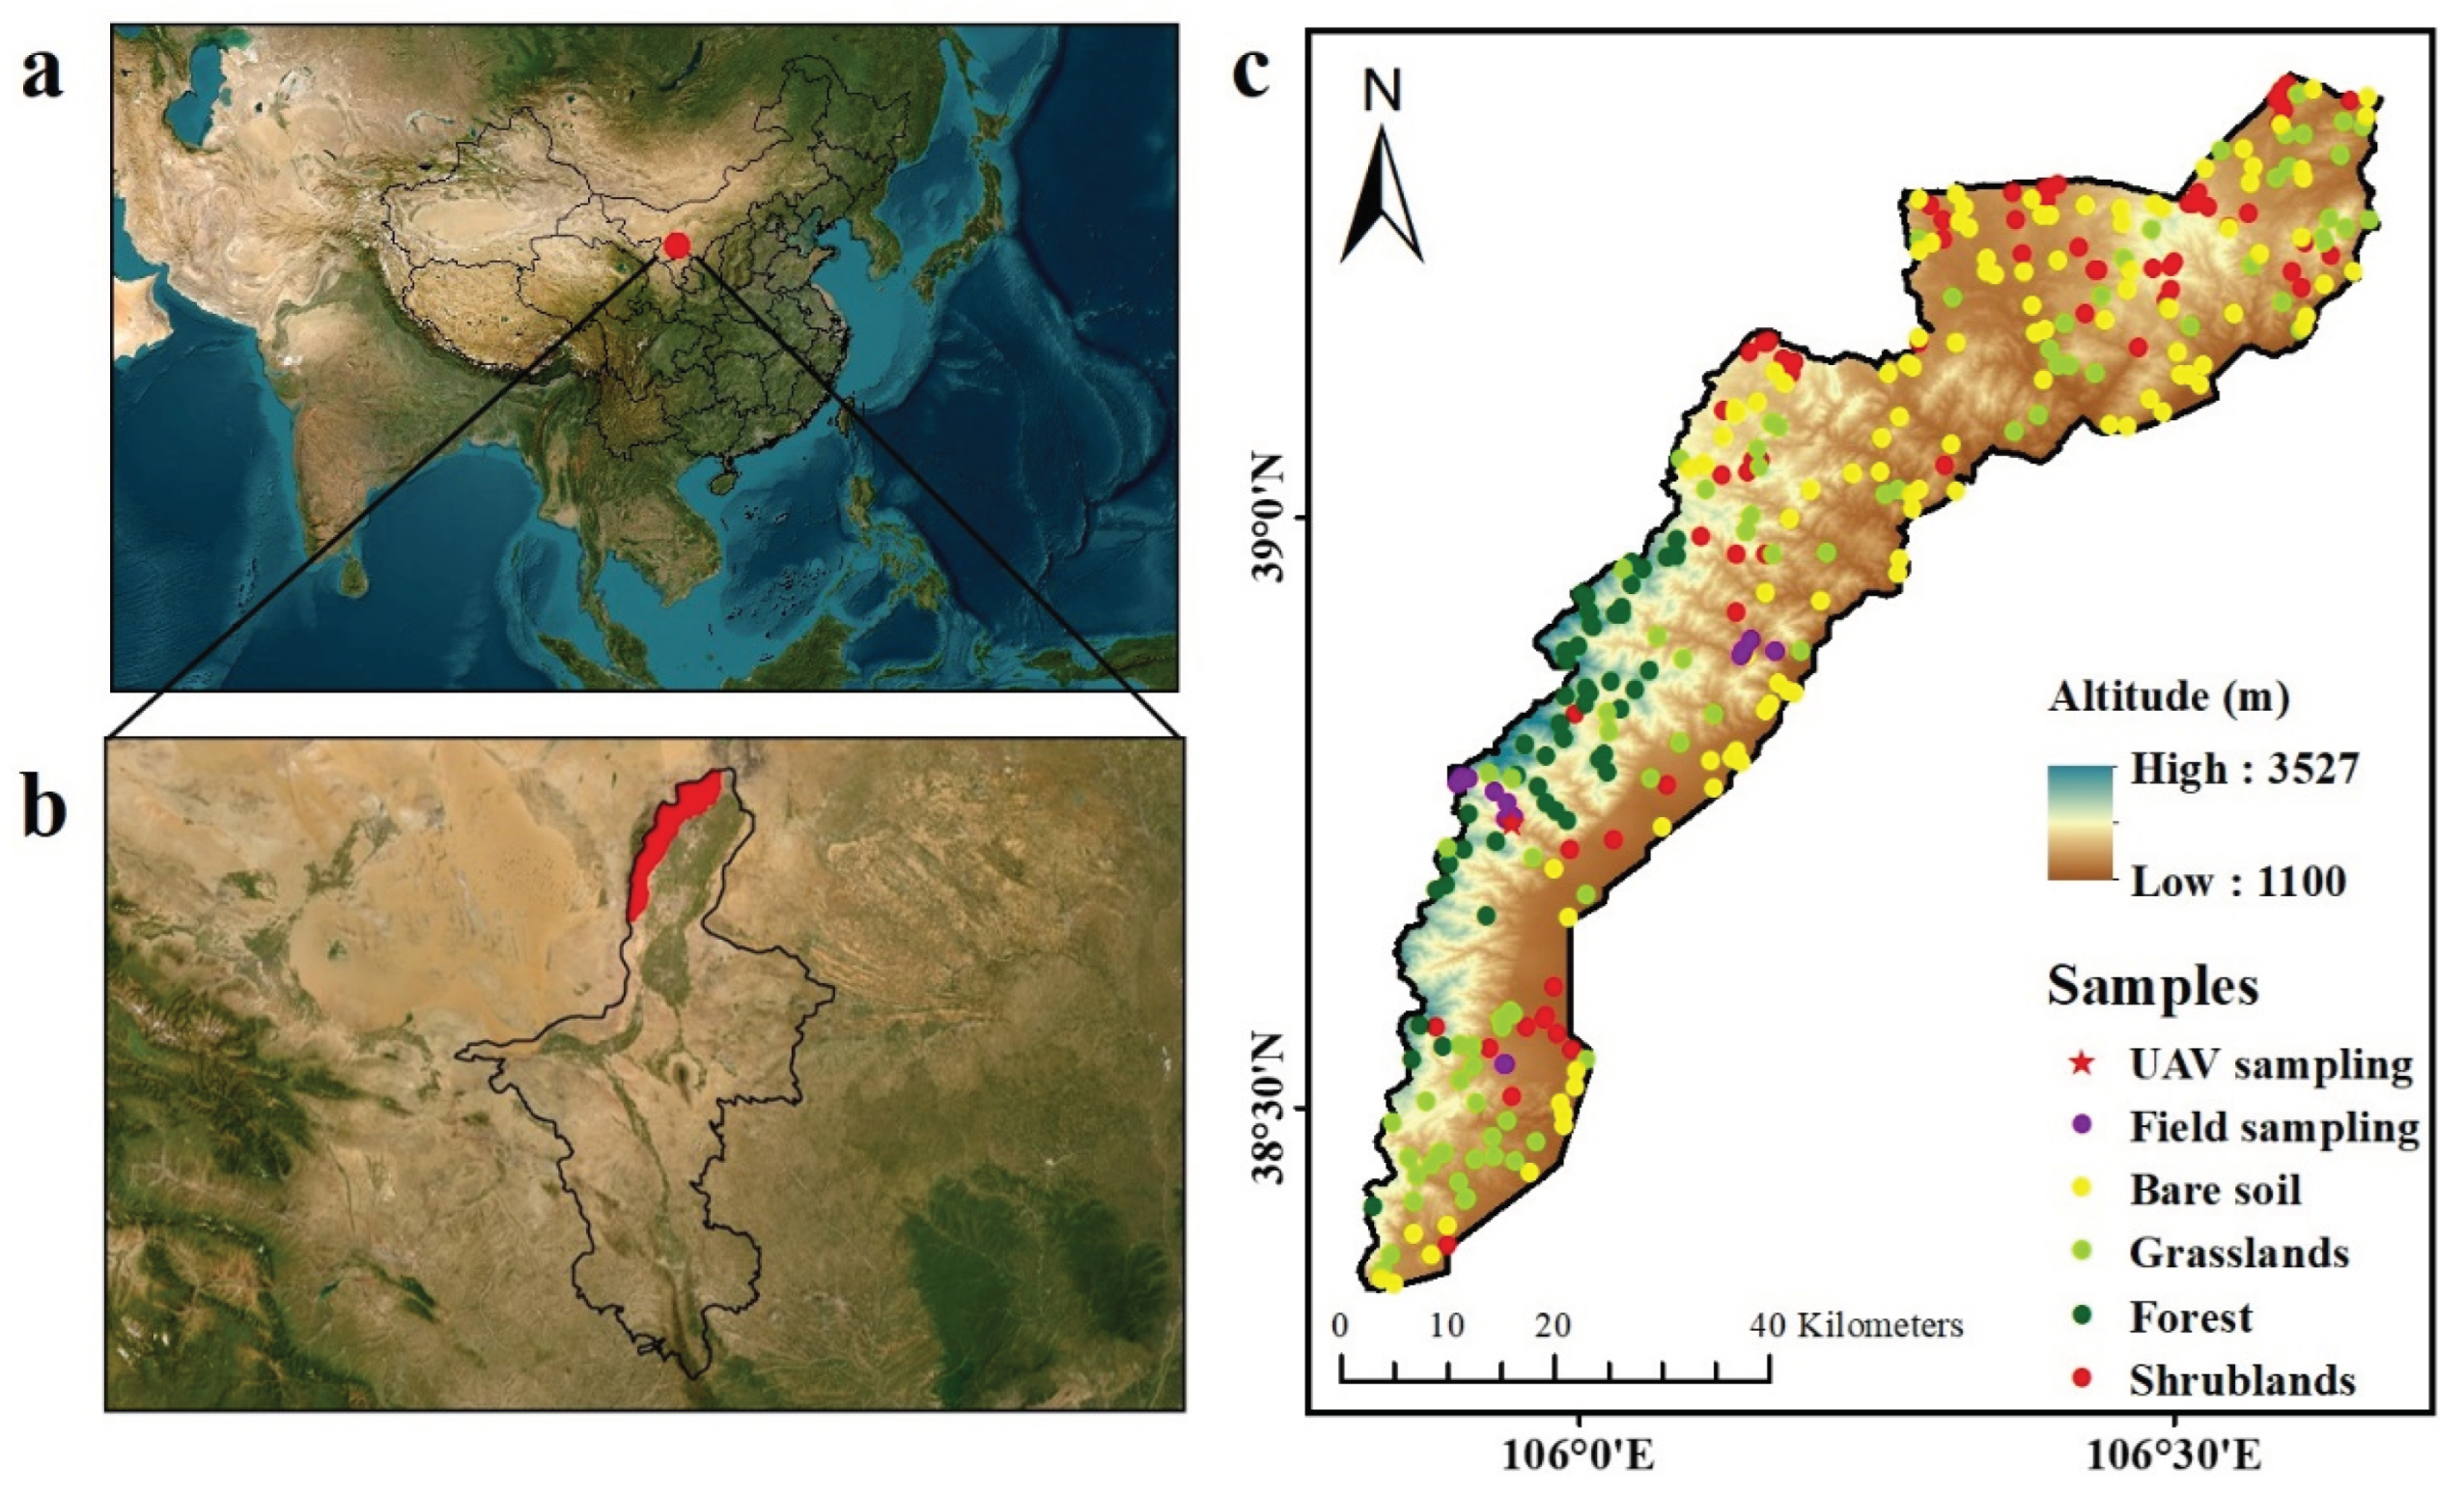
The Helan Mountains are a remnant range of the Kunlun Mountains and are situated at the intersection of the Ningxia Hui Autonomous Region and the Inner Mongolia Autonomous Region. The main peak of the Helan Mountains in Ningxia has an elevation of 3,556 meters and covers an area of approximately 2,100 square kilometers. The mean annual temperature in the study area is around –0.8°C, with a mean annual precipitation of about 430 millimeters.
The study area represents a typical temperate arid mountain region with diverse vegetation types. It is mainly covered by evergreen coniferous forests, deciduous broad-leaved forests, evergreen coniferous shrubs, deciduous broad-leaved shrubs, typical grasslands, and desert grasslands, with slope direction and height influencing distribution patterns. Furthermore, the region has several shrub species, including Amygdalus pedunculata, Caragana korshinskii, and Mongolian almond.
Figure 1.
(a, b) Locations of the Helan Mountain in China and Ningxia province, and (c) the distribution of ground truth samples from field measurements, UAV, and visual interpretation.
Figure 1.
(a, b) Locations of the Helan Mountain in China and Ningxia province, and (c) the distribution of ground truth samples from field measurements, UAV, and visual interpretation.
2.2. Date
2.2.1. Landsat and Sentinel-1/2 data and pre-processing
Our study utilized all available Landsat 7/8/9, Sentinel-2, and Sentinel-1 satellite images from late July to early August 2023. These satellite datasets were conveniently accessed through Google Earth Engine. This study utilized Level-2 Landsat-7 Enhanced Thematic Mapper Plus (ETM+), Landsat-8 Operational Land Imager (OLI), and Landsat-9 OLI-2 data, which include visible, infrared, and shortwave infrared bands with a spatial resolution of 30m. This study also used Sentinel-2 multispectral instrument (MSI) Level-2A products, which provide red-edge band data additionally at 10m compared to Landsat. Sentinel-1 provides dual-polarization C-band Synthetic Aperture Radar (SAR) observations operating at 5.405 GHz (C band), including vertical receive (VV) and horizontal receive (VH) bands. Thus, our dataset includes three visible bands, three red-edge bands, one near-infrared band, two shortwave infrared bands, and two radar bands.
To identify the quality of the satellite images, we performed image processing using the quality assurance (QA) band and CFMask algorithm within the images [54]. Additionally, we conducted calibration processes to harmonize the Landsat and Sentinel-2 images using the approach of ordinary least squares (OLS) regression at 10m [55].
Based on the harmonized Landsat/Sentinel-2 datasets, various vegetation indices sensitive to shrub biomass [56] were calculated to select the optimal predictor variable sets for constructing the estimated model of shrub biomass. A total number of 28 vegetation indices were selected. These vegetation indices were computed at the GEE platform.

Table 1.
Widely used vegetation indices (VIs) for the estimates of shrub biomass. R = Red, G = Green, B = Blue, RE = RedEdge1, NIR = Near-infrared, SWIR1 = Shortwave infrared1 and SWIR2 = Shortwave infrared2. ρ represents the surface reflectance of MODIS bands 2 (841–876 nm), σ = 0.5 × (NIR + Red).
Table 1.
Widely used vegetation indices (VIs) for the estimates of shrub biomass. R = Red, G = Green, B = Blue, RE = RedEdge1, NIR = Near-infrared, SWIR1 = Shortwave infrared1 and SWIR2 = Shortwave infrared2. ρ represents the surface reflectance of MODIS bands 2 (841–876 nm), σ = 0.5 × (NIR + Red).
| No. | Index | Formula |
|---|---|---|
| 1 | Normalized Difference Vegetation Index [57] | NDVI = |
| 2 | Enhanced Vegetation Index 1 [58] | EVI = |
| 3 | Land Surface Water Index [59] | LSWI = |
| 4 | Difference Vegetation Index [60] | DVI = NIR − R |
| 5 | Green Normalized Difference Vegetation Index [61] | GNDVI = |
| 6 | Vegetation Index green [62] | VIgreen = |
| 7 | Infrared Simple Ratio [63] | ISR = |
| 8 | Moisture Stress Index [64] | MSI = |
| 9 | Ratio Vegetation Index [65] | RVI = |
| 10 | Simple Ratio [66] | SR = |
| 11 | Enhanced Vegetation Index 2 [67] | EVI2 = |
| 12 | Modified Simple Ratio [68] | MSR = |
| 13 | Optimized Soil-Adjusted Vegetation Index [69] | OSAVI = (1+L) × , L was set to 0.16 |
| 14 | Renormalized Difference Vegetation Index [70] | RDVI = |
| 15 | Soil Adjusted Vegetation Index [71] | SAVI = (1+L) ×, L=0.5 |
| 16 | Soil Adjusted Vegetation Index2 [72] | SAVI2 = , b was set to 0.025 and a to 1.25 |
| 17 | Stress-related Vegetation Index 1 [73] | STVI1 = |
| 18 | Stress-related Vegetation Index 2 [73] | STVI2 = |
| 19 | Stress-related Vegetation Index 3 [73] | STVI3 = |
| 20 | Red Edge Normalized Difference Vegetation Index [74] | RENDVI = |
| 21 | Anthocyanin Reflectance Index [75] | ARI = - |
| 22 | Vogelmann Red Edge Index [76] | VREI = |
| 23 | Radar ratio vegetation index | Ratio = |
| 24 | Radar Difference Vegetation Index | Difference = VV - VH |
| 25 | Radar normalized difference vegetation index RNDVI | RNDVI = |
| 26 | Near-infrared reflectance of vegetation [77] | NIRv = (NDVI – C) × ρ (C = 0.08) |
| 27 | kernel NDVI [78] | kNDVI = tanh(()2) |
| 28 | Normalized Difference Phenology Index [79] | NDPI = |
2.2.2. Land cover data
The European Space Agency (ESA) WorldCover dataset provides land cover types at 10m global, which has been generated based on Sentinel-1/2 images with 11 land cover types [80]. We generated 500 samples randomly and acquired the land cover type for each sample point. Subsequently, we examined the classification accuracy of each sample by visual interpretation using high-resolution images from Google Earth and ground in-situ photos. Finally, a total of 354 samples have been obtained, including 97 shrublands, 86 grasslands, 112 barren lands, and 59 forests. According to the MODIS land cover dataset, the land with a shrub cover of more than 10% was classified as shrubland for this study [81]. These samples were separated as training and validation points randomly with a ratio of 7:3 used for shrubland mapping.
2.2.3. Ground-based measurements and UAV field images
We conducted two comprehensive field surveys in the Helan Mountains during late April 2023 and from late July to early August in 2023. Thirteen shrubs in the study area were subjected to destructive sampling and structural parameter measurements including length (CL), width (CW), height (CH), crown area (CA), and volume (CV). These measurements were taken to develop the optimal allometric growth equation for estimating shrub biomass. Furthermore, we established 24 sampling plots that were each 10m × 10m in size, where we measured the structural parameters of every shrub. The shrub samples were later processed in the laboratory for drying and weighing to obtain the biomass data.
Table 2.
Field samples, including structural parameters and biomass data of each shrub.
| ID | CL (m) | CW (m) | CH (m) | CA (m2) | CV (m3) | Number of branches | Single branch biomass (g) | Single plant biomass (g) |
|---|---|---|---|---|---|---|---|---|
| 1 | 1.62 | 1.02 | 1.34 | 1.3 | 1.74 | 6 | 487.81 | 2926.88 |
| 2 | 1.74 | 1.55 | 1.83 | 2.12 | 3.88 | 13 | 243.91 | 3170.79 |
| 3 | 1.26 | 1.02 | 0.73 | 1.01 | 0.74 | 33 | 40.95 | 1351.46 |
| 4 | 0.72 | 0.58 | 0.5 | 0.33 | 0.16 | 1 | 183.43 | 183.43 |
| 5 | 0.51 | 0.48 | 0.45 | 0.19 | 0.09 | 1 | 513.86 | 513.86 |
| 6 | 1.15 | 0.96 | 0.84 | 0.87 | 0.73 | 10 | 134.43 | 1344.3 |
| 7 | 0.42 | 0.42 | 0.6 | 0.14 | 0.08 | 1 | 185.91 | 185.91 |
| 8 | 1.63 | 1.58 | 0.74 | 2.02 | 1.5 | 9 | 226.38 | 2037.45 |
| 9 | 0.88 | 0.99 | 1 | 0.68 | 0.68 | 9 | 121.95 | 1097.58 |
| 10 | 1.96 | 2.08 | 1.32 | 3.2 | 4.23 | 40 | 38.48 | 1539.07 |
| 11 | 1.32 | 1.47 | 1.11 | 1.52 | 1.69 | 15 | 144.95 | 2174.3 |
| 12 | 1.05 | 0.98 | 0.59 | 0.81 | 0.48 | 3 | 495.86 | 1487.58 |
| 13 | 0.89 | 0.68 | 0.75 | 0.48 | 0.36 | 5 | 51.95 | 259.77 |
In late April 2023, we acquired a UAV image of the Helan Mountain region with the help of a DJI Phantom 4 Pro V2.0. The image covered an expansive area of 588m ×196m, with a spatial resolution of 0.06m. The Phantom 4 Pro V2.0 UAV provides six bands, including true color (RGB), blue, green, red, red edge, and near-infrared (NIR).
2.2.4. Auxiliary datasets
Relevant climate and terrain datasets, including precipitation, temperature, aridity index, and elevation datasets for our subsequent analyses. The precipitation data was obtained using the Global Precipitation Measurement (GPM) v6 dataset (Precipitation Processing System (PPS) at NASA GSFC, 2019), with a spatial resolution of 11,132m. It provides global rainfall and snowfall observations every three hours by integrating data from all sensors within the GPM system through calibration, merging, and interpolation. The temperature data used was the ECMWF Climate Reanalysis dataset [83], which provides daily observation data at a spatial resolution of 11,132m. The aridity index data was the Global Aridity Index and Potential Evapotranspiration (ET0), which calculates the aridity index based on the mean annual precipitation and evapotranspiration [84], with lower values indicating more severe drought conditions. The spatial resolution of the aridity index dataset is 30 arc-seconds. The elevation data was obtained from the 30m NASA SRTM Digital Elevation dataset [85]. These datasets were obtained through the Google Earth Engine platform and resampled to a spatial resolution of 1,000m to ensure data compatibility.
2.3. Method
Figure 2 shows an overview of the workflow for biomass estimation in the shrublands. It included four main procedures. Firstly, a sample dataset was constructed based on field surveys, ground measurements, UAVs, and Google Earth images. The dataset included samples of land cover types, shrub structure parameters, and biomass. Secondly, a land cover classification was performed to extract the distribution of shrubland. Afterward, the optimal model for shrub biomass estimates was built by comparing several models using different predictor variables derived from individual spectral bands, spectral vegetation indices, and backscatter values of VV and VH. Finally, a comprehensive analysis of the spatial distribution of biomass for the shrubland was conducted. The subsequent paragraphs provide detailed information for each of these steps.
2.3.1. Mapping of shrubland and other land cover types
Random Forest is a well-liked machine-learning method that combines the characteristics of decision trees and randomness [86,87]. It demonstrates good skills in handling large-scale and high-dimensional datasets and is also able to evaluate each feature’s significance in terms of selecting important features.
For our research, we utilized GEE to gather 11 bands of data to classify various land cover types. These bands consist of three visible bands, three infrared bands, one near-infrared band, two shortwave infrared bands, and two radar bands. The band information of each sample point and the associated land cover categorization results were then entered into the Random Forest model. 70% of the sample points were utilized to train the model, while the remaining sample points were reserved for subsequent accuracy assessment. Our evaluation metrics included accuracy, recall, and F1 score, all calculated using Python (version 3.7) and the sklearn package (version 0.0 post2) for constructing the Random Forest model and computing accuracy metrics.
2.3.2. Calculation of biomass at the shrub level
The structural parameters of shrubs closely reflect their growth status and biomass accumulation, making them important indicators for estimating shrub biomass. By conducting field measurements of shrub length, width, and height, we can calculate the shrub's ground area and volume, both of which are positively correlated with shrub biomass [56]. Generally, shrub area and volume directly reflect biomass values. The ground area represents the horizontal structure of the shrub, while the volume represents its horizontal and vertical structural characteristics [56]. Studies have shown a linear link between the biomass of shrubs and CA [56].
To account for the diverse range of shrub species found in different regions, our study produced allometric equations for shrub development, with a specific focus on the Helan Mountains. We utilized seven samples in each iteration to fit the canopy area (CA) and crown volume (CV), with the remaining six samples being used for validation. We conducted a total of iterations, using the coefficient of determination (R²), mean absolute error (MAE), and root mean square error (RMSE) as accuracy assessment criteria. The final selected allometric equations for shrub biomass estimation based on area and volume are as follows: AGB = (R2 = 0.89), AGB = 1060.93×CA (R2 = 0.9).
2.3.3. Calculation of biomass at the UAV plot level
UAV provides an approach to obtain the shrub biomass at the plot level conveniently, which can well alleviate the estimation uncertainty caused by the spatial mismatch between ground sampling and satellite observations [56]. In this study, the shrub was identified firstly by a random forest classification algorithm based on the true color UAV image (Figure 3a). The shrub (number=106) and non-shrub (number=229) samples were collected by visual interpretation of the UAV imagery using a random sampling approach. The RGB band values of each sample in the UAV imagery were extracted as input features for building the random forest classification model. Thus, a binary image of shrub and non-shrub was produced at the UAV level. The model fitness showed that the accuracy, recall, and F1 score of the UAV-based shrub map all exceeded 0.9.
Subsequently, the grids with a size of 10m × 10m were created using the UAV-based shrub and non-shrub map to match the spatial resolution of satellite images. This process was conducted using the “create fishnet” function in ArcMap 10.4. The grids were perfectly aligned with the pixel boundaries of the satellite image (Figure 3c). Within each grid, the crown area (CA) of shrubs was calculated using the shrub pixels. Finally, the total shrub biomass within each grid was estimated by applying a biomass allometric equation based on the CA [56]. To reduce the impacts caused by rugged terrain and clouds, the grids with black or bright backgrounds, steep slopes, or clouds were removed. A total of 86 UAV-based biomass samples were obtained for further analysis.
2.3.4. Satellite-based modeling of shrubland biomass at the regional level
For biomass estimation and accuracy assessment, we selected the Random Forest Regression (RFR) model and employed the leave-one-out cross-validation (LOOCV) method. The RFR model calculates the final score as the mean score of all decision trees rather than through voting, resulting in better predictive performance and higher accuracy than the RF model [88]. We trained the model n times (n=89), where n-1 samples were used for training, and the remaining sample was used for testing. The model with the highest accuracy was selected as the final output, allowing us to make full use of the samples [56].
The model's performance is not positively impacted by every feature [89]. Certain characteristics may cause little variations in samples, which might lower the classification accuracy [90]. For feature selection, we so used the Python RFECV and KFold libraries. To find the optimal feature combination, the Random Forest Regression model's features are combined using the RFECV package. To ensure optimal accuracy for the final feature combination and minimize the possibility of accidental selection, the KFold package is utilized for cross-validation to validate the chosen feature combinations. We then constructed three models: one with only VV and VH and spectral bands (SB), another with only vegetation indices (VI), and a third with all available variables (SBVI). To identify the ideal feature set for each model, feature combination selection was done. Finally, by comparing the accuracy of different models, we identified the optimal feature combination for constructing the biomass model.
2.3.5. Regional implementation of the satellited-based shrubland biomass model
The RFR model with the best predictor variables was selected to estimate the biomass of shrubland in the study area based on the Landsat, Sentinel-1, and Sentinel-2 images. Through the rule of LOOCV, we generated a series of shrubland biomass maps (number=89). Based on these maps, we obtained the resultant biomass map of shrubland by calculating the mean value of each pixel. Meanwhile, the relevant map of standard deviation (SD) for shrubland biomass was also produced to present the potential uncertainty. Subsequently, we analyzed the uncertainty of the resultant biomass map along with the magnitudes of shrubland biomass and coverage. To obtain the shrubland coverage map, we used the shrubland and non-shrubland classification map generated in Section 2.3.1. This 10m binary map was resampled into a shrubland coverage map at a spatial resolution of 1,000m by the mean method. Then, the relationship between the SD map and the shrubland coverage map was examined at 1,000m by a spatial overlay analysis.
2.3.6. Characteristics of the shrubland biomass
To examine the geographical patterns of shrubland biomass, we overlayed the resultant biomass map with different datasets of precipitation, temperature, aridity index, and elevation (Table 3). These datasets were obtained through the GEE platform and were resampled to a consistent spatial resolution of 1,000m. The mean shrubland biomass was calculated within different ranges of the controlling factors.
3. Results
3.1. Mapping of shrubland and other land-cover types
We created a land cover map for the Helan Mountains in 2023 using an RF model constructed with 11 bands. We have identified four land cover types: forest, barren land, grasslands, and shrublands. Figure 4 displays the result map, where only the shrublands were used for biomass estimation. It can be observed that shrublands are predominantly distributed in the southeastern plains and northeastern parts, while forests dominate the southwestern region. Additionally, there is relatively less grassland and more barren land in the study area, which can be attributed to the overall climate type being a typical temperate arid climate with low rainfall. The accuracy assessment on the shrubland and non-shrubland map was shown in Table 4, presenting an overall classification accuracy of 0.91, a recall of 0.92, and an F1 score of 0.92.
3.2. Selection of the best model and variable importance analysis
We conducted three models driven by different variable sets: VV, VH, and spectral bands (SB), another with only vegetation indices (VI), and a third with all available variables (SBVI). The RFECV and KFold packages were used to determine the optimal variables for each model. The best variables for each model are shown in Table 5. The R2, MAE, and RMSE for each of the three models are shown in Figure 5. The results suggested that the SBVI model achieved the best performance, followed by the SB and VI models. Therefore, we selected the SBVI model as our final model for estimating shrub biomass. It also showed that a significant number of vegetation indices related to the near-infrared (NIR) band are incorporated into the model, indicating the high explanatory power of NIR-based vegetation indices for shrub biomass.
The accuracy was assessed based on shrub biomass samples across different groups of shrub coverages and biomass. As shown in Figure 6a, the ratio of RMSE to mean shrub cover was calculated to present the error of one percent coverage of shrub (EOPC). EOPC decreases with increasing shrub cover. Similarly, Figure 6b shows the ratio of RMSE to mean biomass, presenting the error of one unit biomass (EOUB). EOUB decreases as the shrub biomass increases. In terms of R2, the lowest values were observed within the ranges of 20-30% shrub cover and 20-30 kg/m2 shrub biomass. These results indicate good predictive capabilities in high and low shrub cover and shrub biomass ranges, while the estimation accuracy is relatively lower in the moderate shrub cover and biomass ranges.
To determine the contributions of four features to the model, we conducted a sensitivity analysis (Figure 6c). It can be observed that SAVI2 has the most significant impact on model accuracy. Removing SAVI2 resulted in a decrease of R2 by 0.13 and an increase of RMSE by 9.53 kg/m2. In addition, VH had the least impact on the model, as removing VH only led to a decrease of 0.03 in R2 and an increase of 1.93 kg/m2 in RMSE. The findings showed that the four characteristics' contributions—SAVI2, DVI, VV, and VH—ranked from high to low.
3.3. Biomass mapping in the shrubland
We used the SBVI model to estimate the shrubland biomass in the Helan Mountains (Figure 7). The results showed the minimum value of shrub biomass was 10.5 kg/m2, while the maximum value was 54.73kg/m2. Despite having more bushes than other vegetation, the biomass is often lower in the southeast. This is because the shrubs in this area are predominantly low-lying shrubs. By contrast, the central Helan Mountains have greater heights and are mostly characterized by tall shrub, which contributes to usually larger levels of shrub biomass.
3.4. Distribution of shrub biomass under different factors
The mean biomass of shrubs was determined by dividing temperature, precipitation, aridity index, and elevation into several categories. In Figure 8a, as shrub biomass grows with increased precipitation up to 350 mm, then it begins to decline. Figure 8b displays the distribution of shrub biomass across different ranges of mean annual temperature, revealing no significant trend of shrub biomass increase or decrease with rising temperatures. As can be seen in Figure 8c, shrub biomass and the aridity index show a positive link up until the index hits 0.2, at which point the two show a negative correlation. Nevertheless, no discernible pattern of shrub biomass fluctuation with elevation variations is seen in Figure 8d.
4. Discussion
4.1. Algorithms
The integration of unmanned aerial vehicle (UAV) derived shrub biomass estimates into satellite imagery at a larger scale has significant implications for ecological research and environmental monitoring. By establishing a grid with a spatial resolution that matches that of satellite imagery, we were able to estimate shrub biomass within each grid cell. Furthermore, the utilization of UAV imagery provided a cost-effective and efficient method for estimating shrub biomass, which resulted in time and resource savings, as well as improved spatial coverage and accuracy of shrub biomass estimation. However, it is important to acknowledge that there are certain limitations and considerations associated with the integration of UAV and satellite data. The accuracy and reliability of the estimated shrub biomass at the satellite scale are influenced by factors such as the spatial and spectral resolution of the satellite imagery, atmospheric conditions, and the transferability of the allometric equations. Additionally, the temporal difference between the UAV and satellite imagery acquisitions may introduce uncertainties in capturing the dynamic nature of shrub biomass. Consequently, further research is necessary to explore the potential of integrating multi-scale remote sensing data to achieve more comprehensive and accurate estimation and monitoring of shrub biomass.
In this study, we conducted land cover classification in the Helan Mountains region using satellite data. Additionally, we developed three models and selected the model with the highest accuracy for shrub biomass estimation in the shrublands. The selection of the model with the highest accuracy for shrub biomass estimation is a crucial outcome of our study. The precise estimation of shrub biomass enabled by the selected model has several potential applications. Firstly, it can contribute to ecological research and conservation efforts by providing insights into the growth status and productivity of shrub populations [91]. Understanding the spatial distribution and temporal trends of shrub biomass is crucial for assessing ecosystem health, biodiversity, and carbon storage [92,93]. Secondly, our findings have practical implications for land management and restoration projects. Accurate shrub biomass estimation can assist in decision-making processes related to land-use planning, habitat restoration, and the preservation of biodiversity hotspots.
We discovered that errors decreased as vegetation coverage and estimated biomass increased, suggesting that predicting shrub biomass in areas with dense vegetation and lower biomass levels presents challenges. In contrast, our model demonstrated higher predictive accuracy in areas with higher vegetation coverage and biomass. These findings are significant for comprehending the dynamics of shrub ecosystems and can contribute to more effective management and conservation strategies.
4.2. Spatial characteristics of biomass in shrubland
The study found that as precipitation levels increased to 350 mm, shrub biomass growth also increased, suggesting an optimal range for precipitation in the area. However, excessive rainfall beyond a certain threshold may lead to a shift in dominant species from shrubs to other plant types within the region, thereby impacting the growth environment of shrubs and resulting in a reduction in their abundance [94,95,96]. In terms of temperature, there was no discernible pattern of shrub biomass increase or decrease as temperature rose. This suggests that mean annual temperature may not be the primary factor affecting shrub biomass variation in the Helan Mountains. On the other hand, an intriguing relationship was observed between shrub biomass and the aridity index. When the index was below 0.2, there was a positive correlation between shrub biomass and moderately dry conditions. However, beyond an aridity index of 0.2, a negative correlation was observed, indicating that drought conditions are more conducive to shrub growth [96,97]. As for elevation, no significant trend of shrub biomass variation was observed with elevation changes, indicating that elevation may not be a primary factor influencing shrub biomass distribution in the Helan Mountains. Previous studies have suggested a correlation between shrub biomass distribution in the southwestern region of China and the four selected influencing factors in our research [97]. Our study did not find significant effects of temperature and elevation on shrubs, which may be attributed to regional variations. Therefore, future research could further investigate the interactions between these factors to unravel the complex relationships between elevation, environmental conditions, and shrub biomass dynamics.
Although our research yielded promising outcomes, it is essential to acknowledge certain limitations. Firstly, the precision of estimating shrub biomass may be impacted by factors such as soil moisture, topographical variances, and the presence of understory vegetation [8,98]. Future investigations could explore the incorporation of supplementary environmental factors to enhance model efficacy. Secondly, the generalization of our findings to other regions or diverse shrub species should be approached cautiously, as the associations between vegetation indices and shrub biomass may differ. Expanding the study area could provide insights into the applicability of our model. Lastly, our results demonstrated strong performance in depicting the spatial distribution of shrub biomass in the Helan Mountains, contributing significantly to various aspects including vegetation management, shrub surveys, and ecological conservation in the area.
5. Conclusion
In conclusion, this study effectively utilized satellite data to classify shrublands and other land cover types in the Helan Mountains region. Additionally, we georeferenced the shrub biomass estimates computed from the UAV imagery onto satellite imagery. Three models were developed, and the most accurate model was chosen for shrub biomass estimation in the shrublands. We have created a biomass distribution map of shrubs in the Helan Mountains using the most accurate model. Following that, we conducted an accuracy evaluation on various levels of shrub biomass and coverage based on the samples and the shrub biomass distribution map. Finally, an analysis of the regional distribution of shrub biomass concerning temperature, aridity index, elevation, and precipitation was done. This information is essential for evaluating ecosystem health, carbon storage, and biodiversity conservation.
Funding
This study is supported by the National Natural Science Foundation of China (42101355), the Key Research and Development Projects of Ningxia Province, China (2022BEG03050, 2023BEG02049), and the Chinese Universities Scientific Fund (15053346, 10092004, 31051203). We express our gratitude to the anonymous reviewers for their valuable time and efforts in reviewing the manuscript.
References
- Vezzoni, R.; Sijtsma, F.; Vihinen, H. Designing Effective Environmental Policy Mixes in the UN Decade on Ecosystem Restoration. Ecosyst. Serv. 2023, 62, 101541. [Google Scholar] [CrossRef]
- Zhao, Y.; Wang, J.; Zhang, G.; Liu, L.; Yang, J.; Wu, X.; Biradar, C.; Dong, J.; Xiao, X. Divergent Trends in Grassland Degradation and Desertification under Land Use and Climate Change in Central Asia from 2000 to 2020. Ecol. Indic. 2023, 154, 110737. [Google Scholar] [CrossRef]
- Trenberth, K.E. Climate Change Caused by Human Activities Is Happening and It Already Has Major Consequences. J. Energy Nat. Resour. Law 2018, 36, 463–481. [Google Scholar] [CrossRef]
- Xiong, Y.; Mo, S.; Wu, H.; Qu, X.; Liu, Y.; Zhou, L. Influence of Human Activities and Climate Change on Wetland Landscape Pattern—A Review. Sci. Total Environ. 2023, 879, 163112. [Google Scholar] [CrossRef]
- Parmenter, R.R.; MacMahon, J.A. Factors Determining the Abundance and Distribution of Rodents in a Shrub-Steppe Ecosystem: The Role of Shrubs. Oecologia 1983, 59, 145–156. [Google Scholar] [CrossRef]
- Jankju, M. Role of Nurse Shrubs in Restoration of an Arid Rangeland: Effects of Microclimate on Grass Establishment. J. Arid Environ. 2013, 89, 103–109. [Google Scholar] [CrossRef]
- Ballantyne, M.; Pickering, C.M. Shrub Facilitation Is an Important Driver of Alpine Plant Community Diversity and Functional Composition. Biodivers. Conserv. 2015, 24, 1859–1875. [Google Scholar] [CrossRef]
- Li, J.; Zhao, C.Y.; Song, Y.J.; Sheng, Y.; Zhu, H. Spatial Patterns of Desert Annuals in Relation to Shrub Effects on Soil Moisture. J. Veg. Sci. 2010, 21, 221–232. [Google Scholar] [CrossRef]
- Garcia-Estringana, P.; Alonso-Blázquez, N.; Marques, M.J.; Bienes, R.; González-Andrés, F.; Alegre, J. Use of Mediterranean Legume Shrubs to Control Soil Erosion and Runoff in Central Spain. A Large-Plot Assessment under Natural Rainfall Conducted during the Stages of Shrub Establishment and Subsequent Colonisation. CATENA 2013, 102, 3–12. [Google Scholar] [CrossRef]
- Boelman, N.T.; Gough, L.; Wingfield, J.; Goetz, S.; Asmus, A.; Chmura, H.E.; Krause, J.S.; Perez, J.H.; Sweet, S.K.; Guay, K.C. Greater Shrub Dominance Alters Breeding Habitat and Food Resources for Migratory Songbirds in Alaskan Arctic Tundra. Glob. Change Biol. 2015, 21, 1508–1520. [Google Scholar] [CrossRef]
- Wilczek, A.; Jura, J.; Włoch, W.; Kojs, P.; Szendera, W. The Significance of the Field Shrubs and Hedges in Biodiversity Conservation : The Old Field Shrubs and Hedges of Silesian Biotanical Garden. Czyżnie i ich znaczenie w ochronie różnorodności biologicznej. Stare czyżnie w Śląskim Ogrodzie Botanicznym 2005. [Google Scholar]
- Návar, J.; Méndez, E.; Nájera, A.; Graciano, J.; Dale, V.; Parresol, B. Biomass Equations for Shrub Species of Tamaulipan Thornscrub of North-Eastern Mexico. J. Arid Environ. 2004, 59, 657–674. [Google Scholar] [CrossRef]
- Chai, Y.; Zhong, J.; Zhao, J.; Guo, J.; Yue, M.; Guo, Y.; Wang, M.; Wan, P. Environment and Plant Traits Explain Shrub Biomass Allocation and Species Composition across Ecoregions in North China. J. Veg. Sci. 2021, 32, e13080. [Google Scholar] [CrossRef]
- Gómez-Aparicio, L.; Zamora, R.; Gómez, J.M.; Hódar, J.A.; Castro, J.; Baraza, E. Applying Plant Facilitation to Forest Restoration: A Meta-Analysis of the Use of Shrubs as Nurse Plants. Ecol. Appl. 2004, 14, 1128–1138. [Google Scholar] [CrossRef]
- Yu, G.; Li, X.; Wang, Q.; Li, S. Carbon Storage and Its Spatial Pattern of Terrestrial Ecosystem in China. J. Resour. Ecol. 2010, 1, 97–109. [Google Scholar] [CrossRef]
- Fonseca, F.; de Figueiredo, T.; Bompastor Ramos, M.A. Carbon Storage in the Mediterranean Upland Shrub Communities of Montesinho Natural Park, Northeast of Portugal. Agrofor. Syst. 2012, 86, 463–475. [Google Scholar] [CrossRef]
- Catchpole, W.R.; Wheeler, C.J. Estimating Plant Biomass: A Review of Techniques. Aust. J. Ecol. 1992, 17, 121–131. [Google Scholar] [CrossRef]
- Fragaszy, D.M.; Boinski, S.; Whipple, J. Behavioral Sampling in the Field: Comparison of Individual and Group Sampling Methods. Am. J. Primatol. 1992, 26, 259–275. [Google Scholar] [CrossRef] [PubMed]
- Chojnacky, D.C.; Milton, M. Measuring Carbon in Shrubs. In Field Measurements for Forest Carbon Monitoring: A Landscape-Scale Approach; Hoover, C.M., Ed.; Springer Netherlands: Dordrecht, 2008; pp. 45–72. ISBN 978-1-4020-8506-2. [Google Scholar]
- Rojo, V.; Arzamendia, Y.; Pérez, C.; Baldo, J.; Vilá, B. Double Sampling Methods in Biomass Estimates of Andean Shrubs and Tussocks. Rangel. Ecol. Manag. 2017, 70, 718–722. [Google Scholar] [CrossRef]
- Zeng, H.-Q.; Liu, Q.-J.; Feng, Z.-W.; Ma, Z.-Q. Biomass Equations for Four Shrub Species in Subtropical China. J. For. Res. 2010, 15, 83–90. [Google Scholar] [CrossRef]
- Huff, S.; Ritchie, M.; Temesgen, H. Allometric Equations for Estimating Aboveground Biomass for Common Shrubs in Northeastern California. For. Ecol. Manag. 2017, 398, 48–63. [Google Scholar] [CrossRef]
- Laliberte, A.S.; Rango, A.; Havstad, K.M.; Paris, J.F.; Beck, R.F.; McNeely, R.; Gonzalez, A.L. Object-Oriented Image Analysis for Mapping Shrub Encroachment from 1937 to 2003 in Southern New Mexico. Remote Sens. Environ. 2004, 93, 198–210. [Google Scholar] [CrossRef]
- Ramsey, R.D.; Wright, D.L.; McGinty, C. Evaluating the Use of Landsat 30m Enhanced Thematic Mapper to Monitor Vegetation Cover in Shrub-Steppe Environments. Geocarto Int. 2004, 19, 39–47. [Google Scholar] [CrossRef]
- Serrano, L.; Peñuelas, J.; Ustin, S.L. Remote Sensing of Nitrogen and Lignin in Mediterranean Vegetation from AVIRIS Data: Decomposing Biochemical from Structural Signals. Remote Sens. Environ. 2002, 81, 355–364. [Google Scholar] [CrossRef]
- Roy, P.S.; Ravan, S.A. Biomass Estimation Using Satellite Remote Sensing Data—An Investigation on Possible Approaches for Natural Forest. J. Biosci. 1996, 21, 535–561. [Google Scholar] [CrossRef]
- Anderson, K.E.; Glenn, N.F.; Spaete, L.P.; Shinneman, D.J.; Pilliod, D.S.; Arkle, R.S.; McIlroy, S.K.; Derryberry, D.R. Estimating Vegetation Biomass and Cover across Large Plots in Shrub and Grass Dominated Drylands Using Terrestrial Lidar and Machine Learning. Ecol. Indic. 2018, 84, 793–802. [Google Scholar] [CrossRef]
- Chang, J.; Shoshany, M. Mediterranean Shrublands Biomass Estimation Using Sentinel-1 and Sentinel-2. In Proceedings of the 2016 IEEE International Geoscience and Remote Sensing Symposium (IGARSS); July 2016; pp. 5300–5303. [Google Scholar]
- Ji, L.; Wylie, B.K.; Nossov, D.R.; Peterson, B.; Waldrop, M.P.; McFarland, J.W.; Rover, J.; Hollingsworth, T.N. Estimating Aboveground Biomass in Interior Alaska with Landsat Data and Field Measurements. Int. J. Appl. Earth Obs. Geoinformation 2012, 18, 451–461. [Google Scholar] [CrossRef]
- Galidaki, G.; Zianis, D.; Gitas, I.; Radoglou, K.; Karathanassi, V.; Tsakiri–Strati, M.; Woodhouse, I.; Mallinis, G. Vegetation Biomass Estimation with Remote Sensing: Focus on Forest and Other Wooded Land over the Mediterranean Ecosystem. Int. J. Remote Sens. 2017, 38, 1940–1966. [Google Scholar] [CrossRef]
- Lu, D. The Potential and Challenge of Remote Sensing-based Biomass Estimation. Int. J. Remote Sens. 2006, 27, 1297–1328. [Google Scholar] [CrossRef]
- Kushida, K.; Kim, Y.; Tsuyuzaki, S.; Fukuda, M. Spectral Vegetation Indices for Estimating Shrub Cover, Green Phytomass and Leaf Turnover in a Sedge-shrub Tundra. Int. J. Remote Sens. 2009, 30, 1651–1658. [Google Scholar] [CrossRef]
- Bannari, A.; Morin, D.; Bonn, F.; Huete, A.R. A Review of Vegetation Indices. Remote Sens. Rev. 1995, 13, 95–120. [Google Scholar] [CrossRef]
- Chang, J.G.; Shoshany, M.; Oh, Y. Polarimetric Radar Vegetation Index for Biomass Estimation in Desert Fringe Ecosystems. IEEE Trans. Geosci. Remote Sens. 2018, 56, 7102–7108. [Google Scholar] [CrossRef]
- Chang, G.J.; Oh, Y.; Goldshleger, N.; Shoshany, M. Biomass Estimation of Crops and Natural Shrubs by Combining Red-Edge Ratio with Normalized Difference Vegetation Index. J. Appl. Remote Sens. 2022, 16, 014501. [Google Scholar] [CrossRef]
- Abdullah, M.M.; Al-Ali, Z.M.; Srinivasan, S. The Use of UAV-Based Remote Sensing to Estimate Biomass and Carbon Stock for Native Desert Shrubs. MethodsX 2021, 8, 101399. [Google Scholar] [CrossRef] [PubMed]
- Mao, P.; Qin, L.; Hao, M.; Zhao, W.; Luo, J.; Qiu, X.; Xu, L.; Xiong, Y.; Ran, Y.; Yan, C.; et al. An Improved Approach to Estimate Above-Ground Volume and Biomass of Desert Shrub Communities Based on UAV RGB Images. Ecol. Indic. 2021, 125, 107494. [Google Scholar] [CrossRef]
- Iizuka, K.; Itoh, M.; Shiodera, S.; Matsubara, T.; Dohar, M.; Watanabe, K. Advantages of Unmanned Aerial Vehicle (UAV) Photogrammetry for Landscape Analysis Compared with Satellite Data: A Case Study of Postmining Sites in Indonesia. Cogent Geosci. 2018, 4, 1498180. [Google Scholar] [CrossRef]
- Li, Z.; Ding, J.; Zhang, H.; Feng, Y. Classifying Individual Shrub Species in UAV Images—A Case Study of the Gobi Region of Northwest China. Remote Sens. 2021, 13, 4995. [Google Scholar] [CrossRef]
- Abdullah, M.M.; Al-Ali, Z.M.; Abdullah, M.T.; Al-Anzi, B. The Use of Very-High-Resolution Aerial Imagery to Estimate the Structure and Distribution of the Rhanterium Epapposum Community for Long-Term Monitoring in Desert Ecosystems. Plants 2021, 10, 977. [Google Scholar] [CrossRef] [PubMed]
- Ding, J.; Li, Z.; Zhang, H.; Zhang, P.; Cao, X.; Feng, Y. Quantifying the Aboveground Biomass (AGB) of Gobi Desert Shrub Communities in Northwestern China Based on Unmanned Aerial Vehicle (UAV) RGB Images. Land 2022, 11, 543. [Google Scholar] [CrossRef]
- Poley, L.G.; Laskin, D.N.; McDermid, G.J. Quantifying Aboveground Biomass of Shrubs Using Spectral and Structural Metrics Derived from UAS Imagery. Remote Sens. 2020, 12, 2199. [Google Scholar] [CrossRef]
- Gonzalez Musso, R.F.; Oddi, F.J.; Goldenberg, M.G.; Garibaldi, L.A. Applying Unmanned Aerial Vehicles (UAVs) to Map Shrubland Structural Attributes in Northern Patagonia, Argentina. Jt. Virtual Issue Appl. UAVs For. Sci. 2020, 1, 615–623. [Google Scholar] [CrossRef]
- Shashkov, M.; Ivanova, N.; Shanin, V.; Grabarnik, P. Ground Surveys Versus UAV Photography: The Comparison of Two Tree Crown Mapping Techniques. In Proceedings of the Information Technologies in the Research of Biodiversity; Bychkov, I., Voronin, V., Eds.; Springer International Publishing: Cham, 2019; pp. 48–56. [Google Scholar]
- Li, Y.; Andersen, H.-E.; McGaughey, R. A Comparison of Statistical Methods for Estimating Forest Biomass from Light Detection and Ranging Data. West. J. Appl. For. 2008, 23, 223–231. [Google Scholar] [CrossRef]
- Tamiminia, H.; Salehi, B.; Mahdianpari, M.; Beier, C.M.; Klimkowski, D.J.; Volk, T.A. Comparison of Machine and Deep Learning Methods to Estimate Shrub Willow Biomass from UAS Imagery. Can. J. Remote Sens. 2021, 47, 209–227. [Google Scholar] [CrossRef]
- Viana, H.; Aranha, J.; Lopes, D.; Cohen, W.B. Estimation of Crown Biomass of Pinus Pinaster Stands and Shrubland Above-Ground Biomass Using Forest Inventory Data, Remotely Sensed Imagery and Spatial Prediction Models. Ecol. Model. 2012, 226, 22–35. [Google Scholar] [CrossRef]
- Wu, C.; Shen, H.; Shen, A.; Deng, J.; Gan, M.; Zhu, J.; Xu, H.; Wang, K. Comparison of Machine-Learning Methods for above-Ground Biomass Estimation Based on Landsat Imagery. J. Appl. Remote Sens. 2016, 10, 035010. [Google Scholar] [CrossRef]
- Wagner, H.H.; Fortin, M.-J. Spatial Analysis of Landscapes: Concepts and Statistics. Ecology 2005, 86, 1975–1987. [Google Scholar] [CrossRef]
- Tang, Y.; Kurths, J.; Lin, W.; Ott, E.; Kocarev, L. Introduction to Focus Issue: When Machine Learning Meets Complex Systems: Networks, Chaos, and Nonlinear Dynamics. Chaos Interdiscip. J. Nonlinear Sci. 2020, 30, 063151. [Google Scholar] [CrossRef]
- Cao, J.; Tao, T. Using Machine-Learning Models to Understand Nonlinear Relationships between Land Use and Travel. Transp. Res. Part Transp. Environ. 2023, 123, 103930. [Google Scholar] [CrossRef]
- Singh, N.; Singh, D.P.; Pant, B. A Comprehensive Study of Big Data Machine Learning Approaches and Challenges. In Proceedings of the 2017 International Conference on Next Generation Computing and Information Systems (ICNGCIS); December 2017; pp. 80–85. [Google Scholar]
- Zhou, L.; Pan, S.; Wang, J.; Vasilakos, A.V. Machine Learning on Big Data: Opportunities and Challenges. Neurocomputing 2017, 237, 350–361. [Google Scholar] [CrossRef]
- Zhu, Z.; Woodcock, C.E. Object-Based Cloud and Cloud Shadow Detection in Landsat Imagery. Remote Sens. Environ. 2012, 118, 83–94. [Google Scholar] [CrossRef]
- Wang, J.; Xiao, X.; Liu, L.; Wu, X.; Qin, Y.; Steiner, J.L.; Dong, J. Mapping Sugarcane Plantation Dynamics in Guangxi, China, by Time Series Sentinel-1, Sentinel-2 and Landsat Images. Remote Sens. Environ. 2020, 247, 111951. [Google Scholar] [CrossRef]
- Mao, P.; Ding, J.; Jiang, B.; Qin, L.; Qiu, G.Y. How Can UAV Bridge the Gap between Ground and Satellite Observations for Quantifying the Biomass of Desert Shrub Community? ISPRS J. Photogramm. Remote Sens. 2022, 192, 361–376. [Google Scholar] [CrossRef]
- Shoshany, M.; Karnibad, L. Mapping Shrubland Biomass along Mediterranean Climatic Gradients: The Synergy of Rainfall-Based and NDVI-Based Models. Int. J. Remote Sens. 2011, 32, 9497–9508. [Google Scholar] [CrossRef]
- Huete, A.; Didan, K.; Miura, T.; Rodriguez, E.P.; Gao, X.; Ferreira, L.G. Overview of the Radiometric and Biophysical Performance of the MODIS Vegetation Indices. Remote Sens. Environ. 2002, 83, 195–213. [Google Scholar] [CrossRef]
- Xiao, X.; Boles, S.; Liu, J.; Zhuang, D.; Frolking, S.; Li, C.; Salas, W.; Moore, B. Mapping Paddy Rice Agriculture in Southern China Using Multi-Temporal MODIS Images. Remote Sens. Environ. 2005, 95, 480–492. [Google Scholar] [CrossRef]
- Richardson, A.J.; Wiegand, C.L. Distinguishing Vegetation from Soil Background Information. 1997.
- Gitelson, A.A.; Kaufman, Y.J.; Merzlyak, M.N. Use of a Green Channel in Remote Sensing of Global Vegetation from EOS-MODIS. Remote Sens. Environ. 1996, 58, 289–298. [Google Scholar] [CrossRef]
- Gitelson, A.A.; Kaufman, Y.J.; Stark, R.; Rundquist, D. Novel Algorithms for Remote Estimation of Vegetation Fraction. Remote Sens. Environ. 2002, 80, 76–87. [Google Scholar] [CrossRef]
- Fernandes, R.; Butson, C.; Leblanc, S.; Latifovic, R. Landsat-5 TM and Landsat-7 ETM+ Based Accuracy Assessment of Leaf Area Index Products for Canada Derived from SPOT-4 VEGETATION Data. Can. J. Remote Sens. 2003, 29, 241–258. [Google Scholar] [CrossRef]
- Rock, B.N.; Vogelmann, J.E.; Williams, D.L.; Vogelmann, A.F.; Hoshizaki, T. Remote Detection of Forest Damage. BioScience 1986, 36, 439–445. [Google Scholar] [CrossRef]
- Jordan, C.F. Derivation of Leaf-Area Index from Quality of Light on the Forest Floor. Ecology 1969, 50, 663–666. [Google Scholar] [CrossRef]
- Birth, G.S.; McVey, G.R. Measuring the Color of Growing Turf with a Reflectance Spectrophotometer1. Agron. J. 1968, 60, 640–643. [Google Scholar] [CrossRef]
- Jiang, Z.; Huete, A.R.; Didan, K.; Miura, T. Development of a Two-Band Enhanced Vegetation Index without a Blue Band. Remote Sens. Environ. 2008, 112, 3833–3845. [Google Scholar] [CrossRef]
- Chen, J.M. Evaluation of Vegetation Indices and a Modified Simple Ratio for Boreal Applications. Can. J. Remote Sens. 1996, 22, 229–242. [Google Scholar] [CrossRef]
- Rondeaux, G.; Steven, M.; Baret, F. Optimization of Soil-Adjusted Vegetation Indices. Remote Sens. Environ. 1996, 55, 95–107. [Google Scholar] [CrossRef]
- Roujean, J.-L.; Breon, F.-M. Estimating PAR Absorbed by Vegetation from Bidirectional Reflectance Measurements. Remote Sens. Environ. 1995, 51, 375–384. [Google Scholar] [CrossRef]
- Huete, A.R. A Soil-Adjusted Vegetation Index (SAVI). Remote Sens. Environ. 1988, 25, 295–309. [Google Scholar] [CrossRef]
- MAJOR, D.J.; BARET, F.; GUYOT, G. A Ratio Vegetation Index Adjusted for Soil Brightness. Int. J. Remote Sens. 1990, 11, 727–740. [Google Scholar] [CrossRef]
- Thenkabail, P.S.; Ward, A.D.; Lyon, J.; Merry, C.J. Thematic Mapper Vegetation Indices for Determining Soybean and Corn Growth Parameters. 1994, 60.
- Gitelson, A.; Merzlyak, M.N. Quantitative Estimation of Chlorophyll-a Using Reflectance Spectra: Experiments with Autumn Chestnut and Maple Leaves. J. Photochem. Photobiol. B 1994, 22, 247–252. [Google Scholar] [CrossRef]
- Gitelson, A.A.; Merzlyak, M.N.; Chivkunova, O.B. Optical Properties and Nondestructive Estimation of Anthocyanin Content in Plant Leaves¶. Photochem. Photobiol. 2001, 74, 38–45. [Google Scholar] [CrossRef]
- VOGELMANN, J.E.; ROCK, B.N.; MOSS, D.M. Red Edge Spectral Measurements from Sugar Maple Leaves. Int. J. Remote Sens. 1993, 14, 1563–1575. [Google Scholar] [CrossRef]
- Badgley, G.; Field, C.B.; Berry, J.A. Canopy Near-Infrared Reflectance and Terrestrial Photosynthesis. Sci. Adv. 2017, 3, e1602244. [Google Scholar] [CrossRef]
- Camps-Valls, G.; Campos-Taberner, M.; Moreno-Martínez, Á.; Walther, S.; Duveiller, G.; Cescatti, A.; Mahecha, M.D.; Muñoz-Marí, J.; García-Haro, F.J.; Guanter, L.; et al. A Unified Vegetation Index for Quantifying the Terrestrial Biosphere. Sci. Adv. 2021, 7, eabc7447. [Google Scholar] [CrossRef]
- Wang, C.; Chen, J.; Wu, J.; Tang, Y.; Shi, P.; Black, T.A.; Zhu, K. A Snow-Free Vegetation Index for Improved Monitoring of Vegetation Spring Green-up Date in Deciduous Ecosystems. Remote Sens. Environ. 2017, 196, 1–12. [Google Scholar] [CrossRef]
- Zanaga, D.; Van De Kerchove, R.; Daems, D.; De Keersmaecker, W.; Brockmann, C.; Kirches, G.; Wevers, J.; Cartus, O.; Santoro, M.; Fritz, S.; et al. SA WorldCover 10 m 2021 V200 2022.
- Friedl, M.; Sulla-Menashe, D. MODIS/Terra+Aqua Land Cover Type Yearly L3 Global 500m SIN Grid V061 2022.
- Precipitation Processing System (PPS) At NASA GSFC GPM IMERG Final Precipitation L3 Half Hourly 0.1 Degree x 0.1 Degree V06 2019.
- Copernicus Climate Change Service ERA5-Land Monthly Averaged Data from 2001 to Present 2019.
- Zomer, R.J.; Xu, J.; Trabucco, A. Version 3 of the Global Aridity Index and Potential Evapotranspiration Database. Sci. Data 2022, 9, 409. [Google Scholar] [CrossRef]
- Farr, T.G.; Rosen, P.A.; Caro, E.; Crippen, R.; Duren, R.; Hensley, S.; Kobrick, M.; Paller, M.; Rodriguez, E.; Roth, L.; et al. The Shuttle Radar Topography Mission. Rev. Geophys. 2007, 45. [Google Scholar] [CrossRef]
- Belgiu, M.; Drăguţ, L. Random Forest in Remote Sensing: A Review of Applications and Future Directions. ISPRS J. Photogramm. Remote Sens. 2016, 114, 24–31. [Google Scholar] [CrossRef]
- Biau, G.; Scornet, E. A Random Forest Guided Tour. TEST 2016, 25, 197–227. [Google Scholar] [CrossRef]
- Cootes, T.F.; Ionita, M.C.; Lindner, C.; Sauer, P. Robust and Accurate Shape Model Fitting Using Random Forest Regression Voting. In Computer Vision – ECCV 2012; Fitzgibbon, A., Lazebnik, S., Perona, P., Sato, Y., Schmid, C., Eds.; Lecture Notes in Computer Science; Springer Berlin Heidelberg: Berlin, Heidelberg, 2012; Vol. 7578, pp. 278–291. ISBN 978-3-642-33785-7. [Google Scholar]
- Rogers, J.; Gunn, S. Identifying Feature Relevance Using a Random Forest. In Proceedings of the Subspace, Latent Structure and Feature Selection; Saunders, C., Grobelnik, M., Gunn, S., Shawe-Taylor, J., Eds.; Springer: Berlin, Heidelberg, 2006; pp. 173–184. [Google Scholar]
- Hasan, M.A.M.; Nasser, M.; Ahmad, S.; Molla, K.I. Feature Selection for Intrusion Detection Using Random Forest. J. Inf. Secur. 2016, 7, 129–140. [Google Scholar] [CrossRef]
- Corona, P.; Pasta, S.; Giardina, G.; La Mantia, T. Assessing the Biomass of Shrubs Typical of Mediterranean Pre-Forest Communities. Plant Biosyst. - Int. J. Deal. Asp. Plant Biol. 2012, 146, 252–257. [Google Scholar] [CrossRef]
- Das, B.; Bordoloi, R.; Deka, S.; Paul, A.; Pandey, P.K.; Singha, L.B.; Tripathi, O.P.; Mishra, B.P.; Mishra, M. Above Ground Biomass Carbon Assessment Using Field, Satellite Data and Model Based Integrated Approach to Predict the Carbon Sequestration Potential of Major Land Use Sector of Arunachal Himalaya, India. Carbon Manag. 2021, 12, 201–214. [Google Scholar] [CrossRef]
- Enes, T.; Lousada, J.; Fonseca, T.; Viana, H.; Calvão, A.; Aranha, J. Large Scale Shrub Biomass Estimates for Multiple Purposes. Life 2020, 10, 33. [Google Scholar] [CrossRef]
- Velasco, N.; Soto-Agurto, C.; Carbone, L.; Massi, C.; Bustamante, R.; Smit, C. Large-Scale Facilitative Effects for a Single Nurse Shrub: Impact of the Rainfall Gradient, Plant Community and Distribution across a Geographical Barrier. J. Ecol. n/a. [CrossRef]
- Zhang, Y.; Huang, M.; Lian, J. Spatial Distributions of Optimal Plant Coverage for the Dominant Tree and Shrub Species along a Precipitation Gradient on the Central Loess Plateau. Agric. For. Meteorol. 2015, 206, 69–84. [Google Scholar] [CrossRef]
- Holzapfel, C.; Tielbörger, K.; Parag, H.A.; Kigel, J.; Sternberg, M. Annual Plant–Shrub Interactions along an Aridity Gradient. Basic Appl. Ecol. 2006, 7, 268–279. [Google Scholar] [CrossRef]
- Liu, M.; Li, D.; Hu, J.; Liu, D.; Ma, Z.; Cheng, X.; Zhao, C.; Liu, Q. Altitudinal Pattern of Shrub Biomass Allocation in Southwest China. PLOS ONE 2020, 15, e0240861. [Google Scholar] [CrossRef]
- Bolstad, P.V.; Elliott, K.J.; Miniat, C.F. Forests, Shrubs, and Terrain: Top-down and Bottom-up Controls on Forest Structure. Ecosphere 2018, 9, e02185. [Google Scholar] [CrossRef]
Figure 2.
The workflow for estimating biomass of shrubland in the Helan mountains, China.
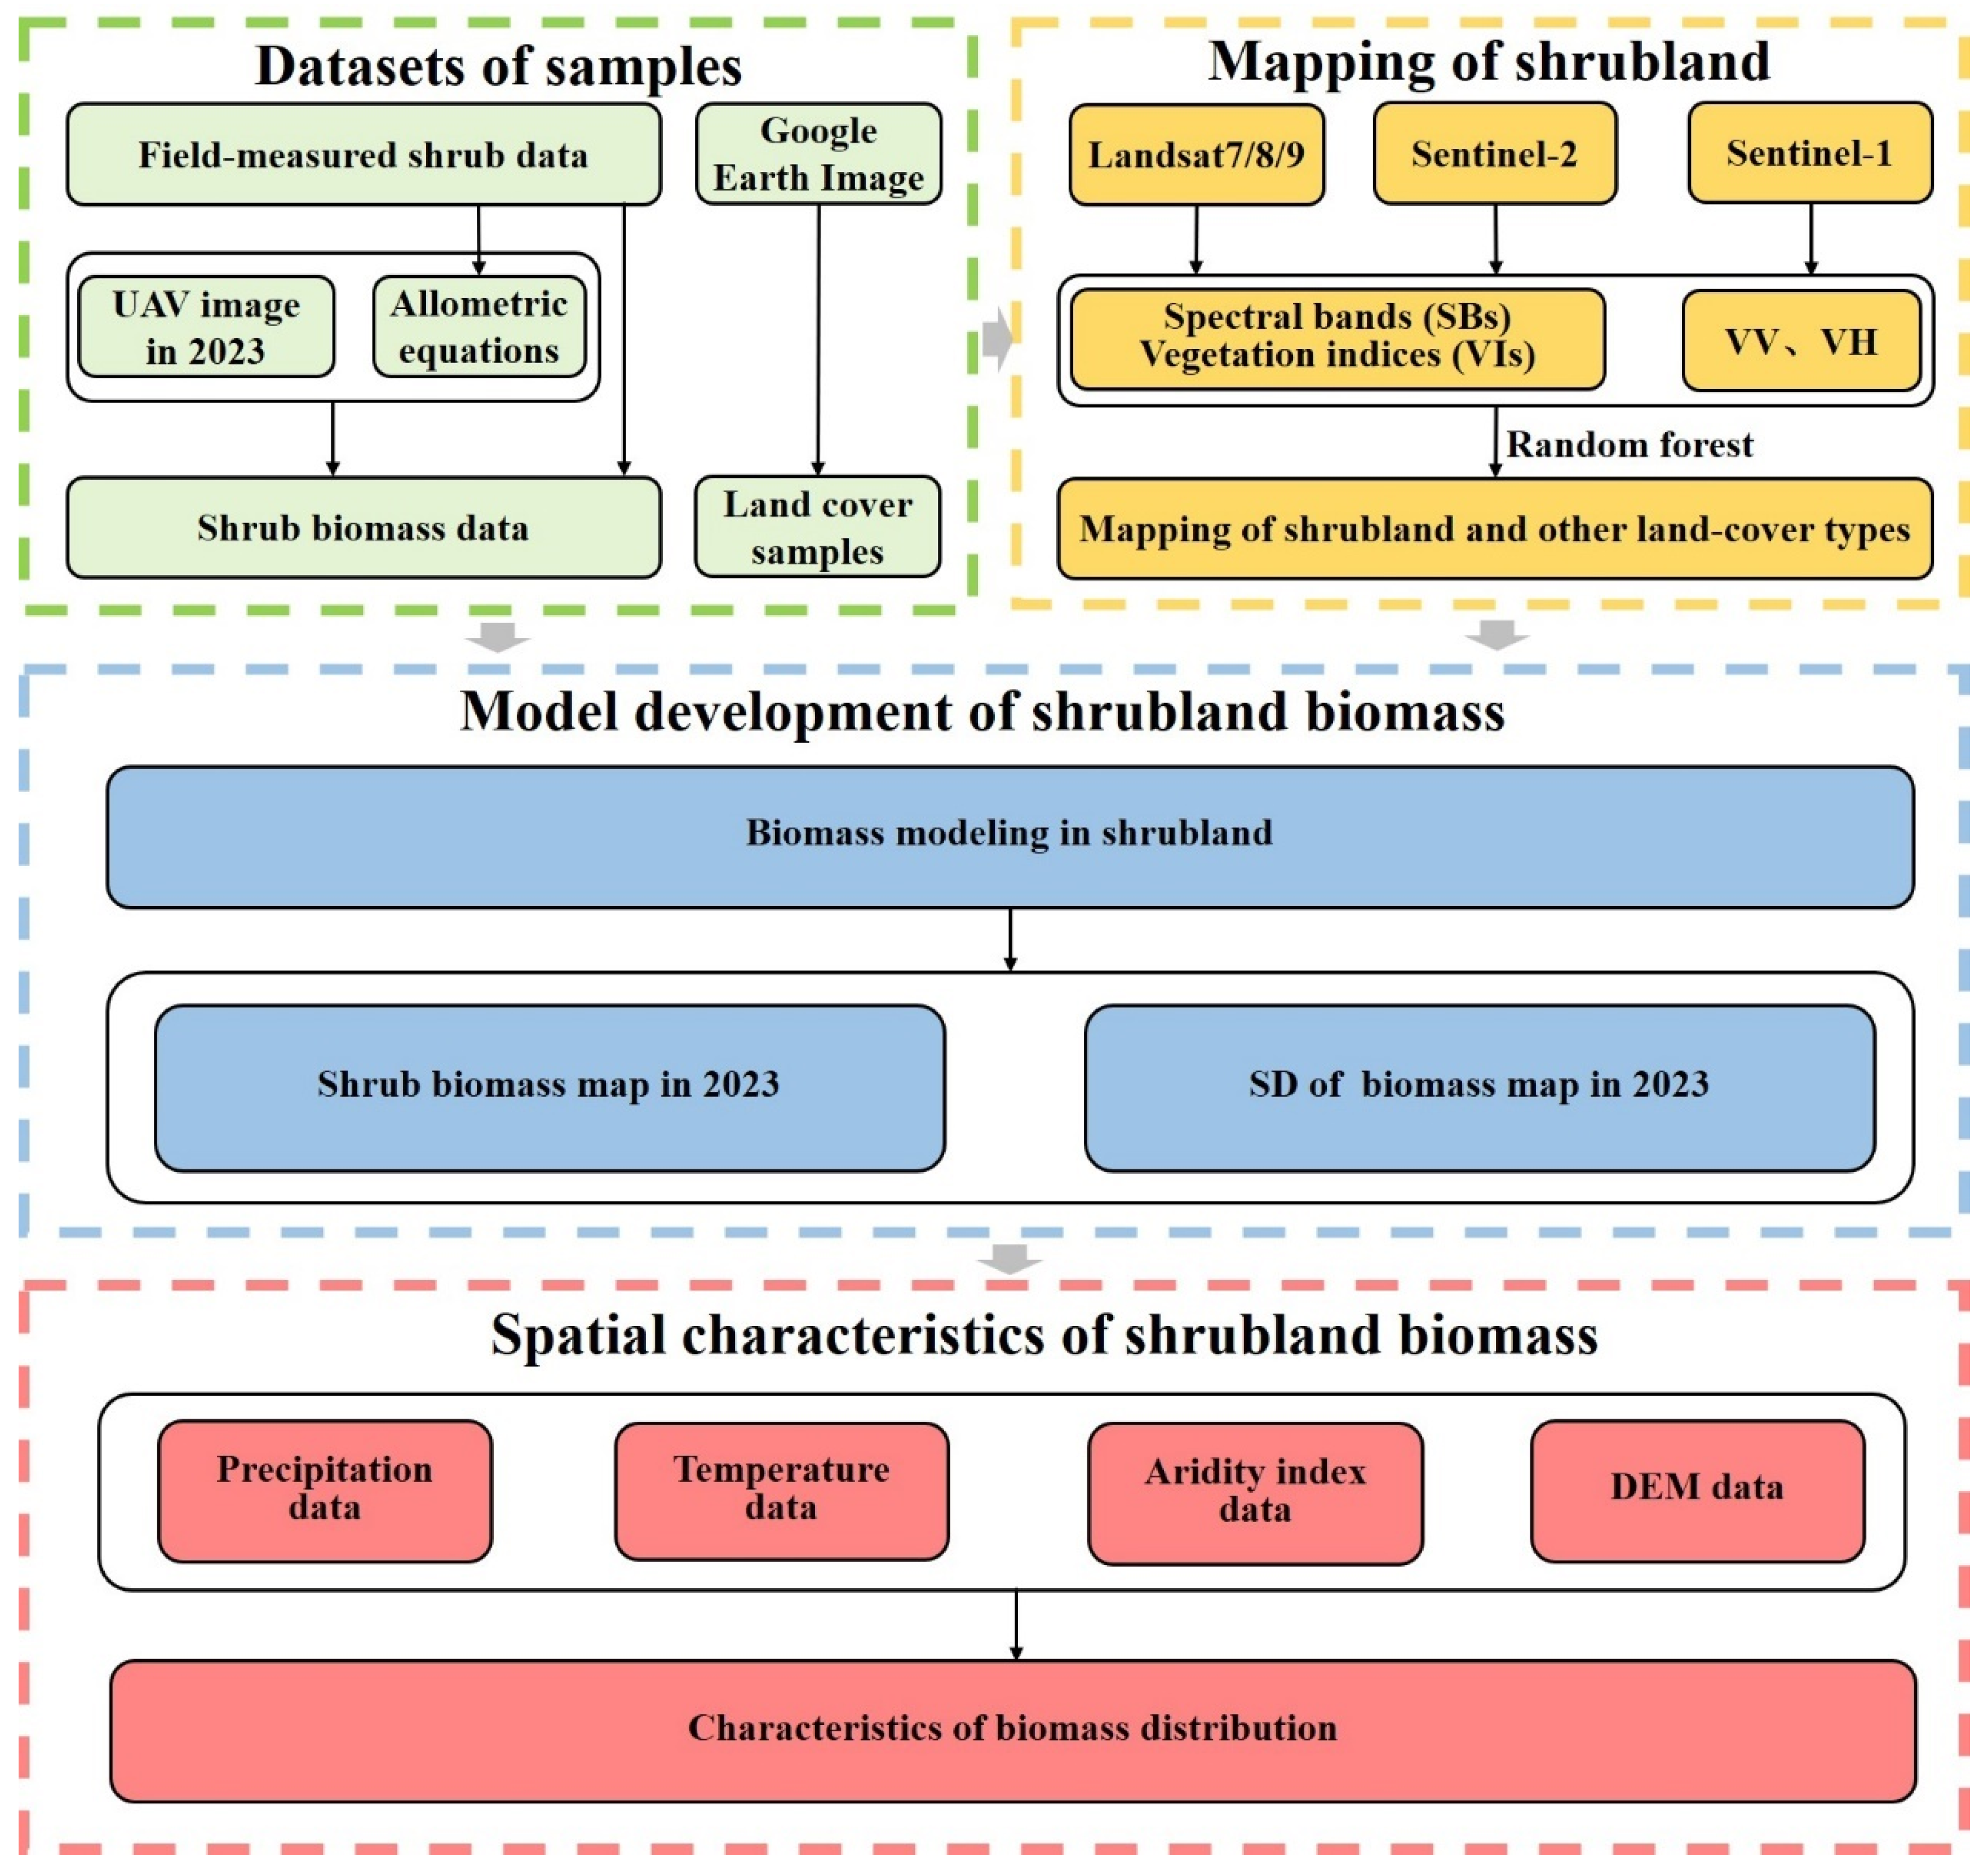
Figure 3.
(a) depicts the original unmanned aerial vehicle (UAV) image. (b) represents the classified map of shrublands. (c) illustrates the fishnet constructed based on the UAV imagery. (d-g) represent the zoomed-in views of four sample points in Figure 3b.
Figure 3.
(a) depicts the original unmanned aerial vehicle (UAV) image. (b) represents the classified map of shrublands. (c) illustrates the fishnet constructed based on the UAV imagery. (d-g) represent the zoomed-in views of four sample points in Figure 3b.
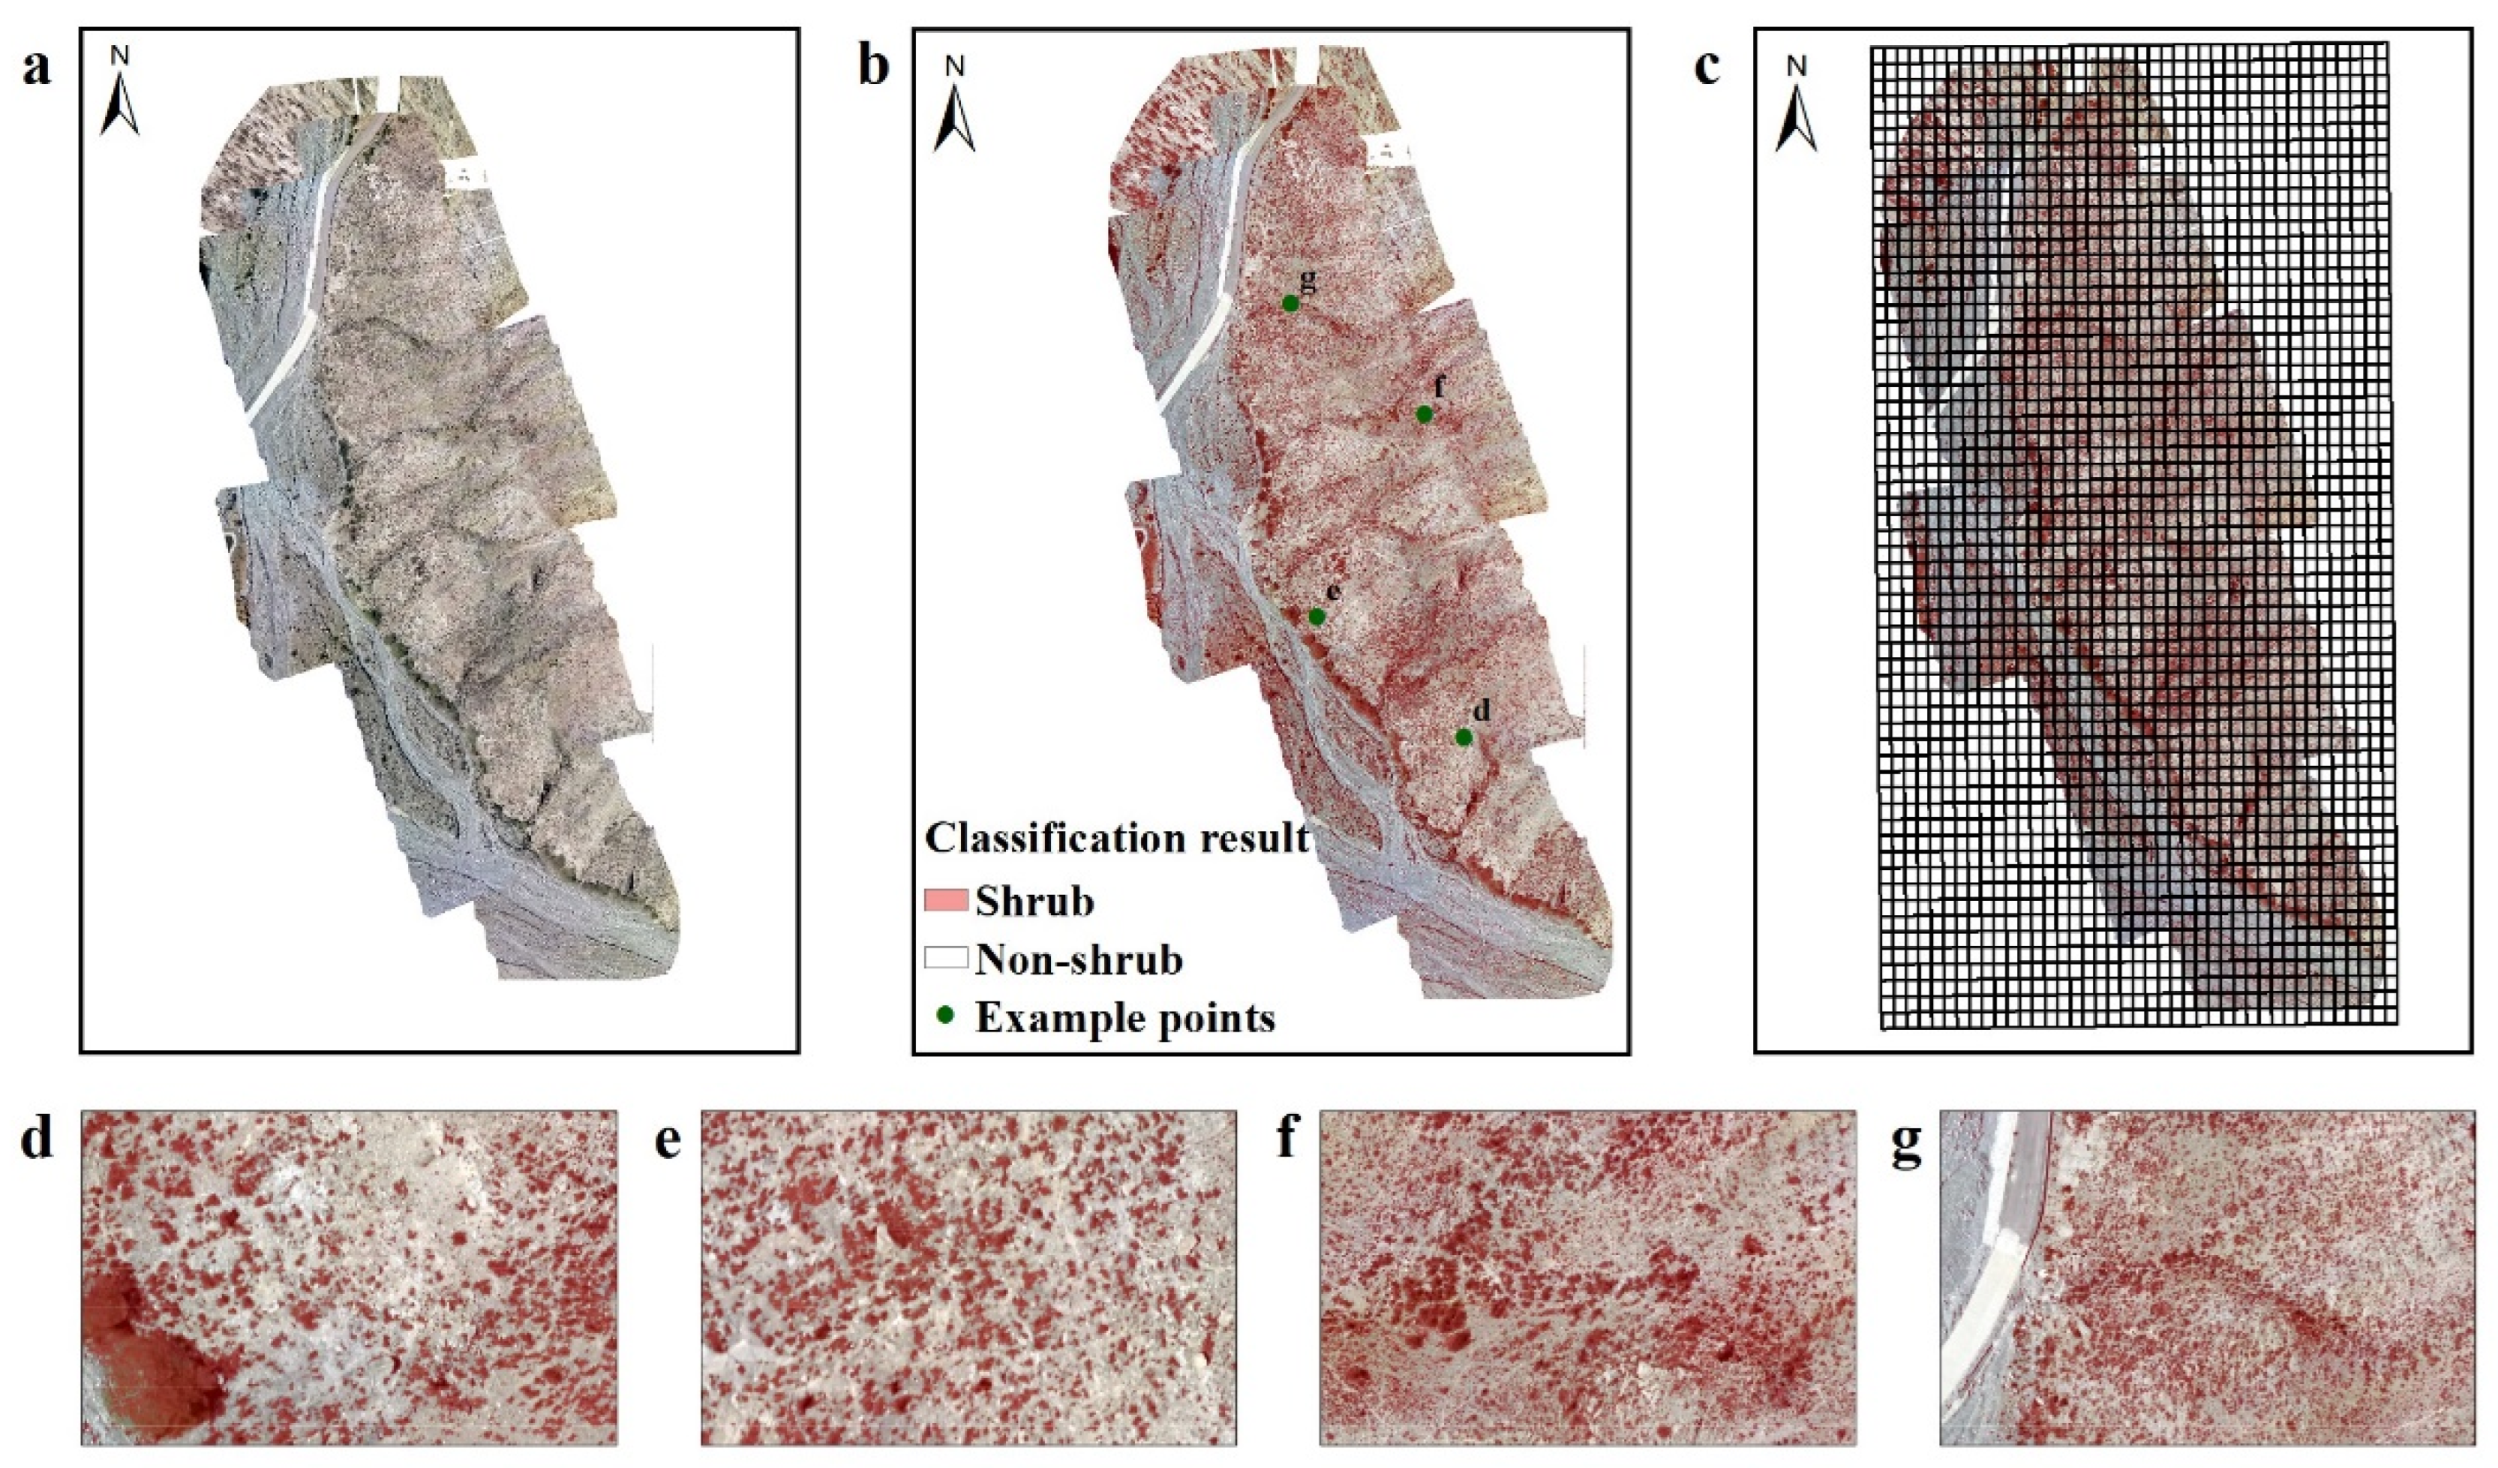
Figure 4.
(a) displays the shrublands and other land-cover types of Helan Mountain, China in 2023. (b-i) represents the zoom-in views of four example regions in the resultant map and the Google Earth images.
Figure 4.
(a) displays the shrublands and other land-cover types of Helan Mountain, China in 2023. (b-i) represents the zoom-in views of four example regions in the resultant map and the Google Earth images.
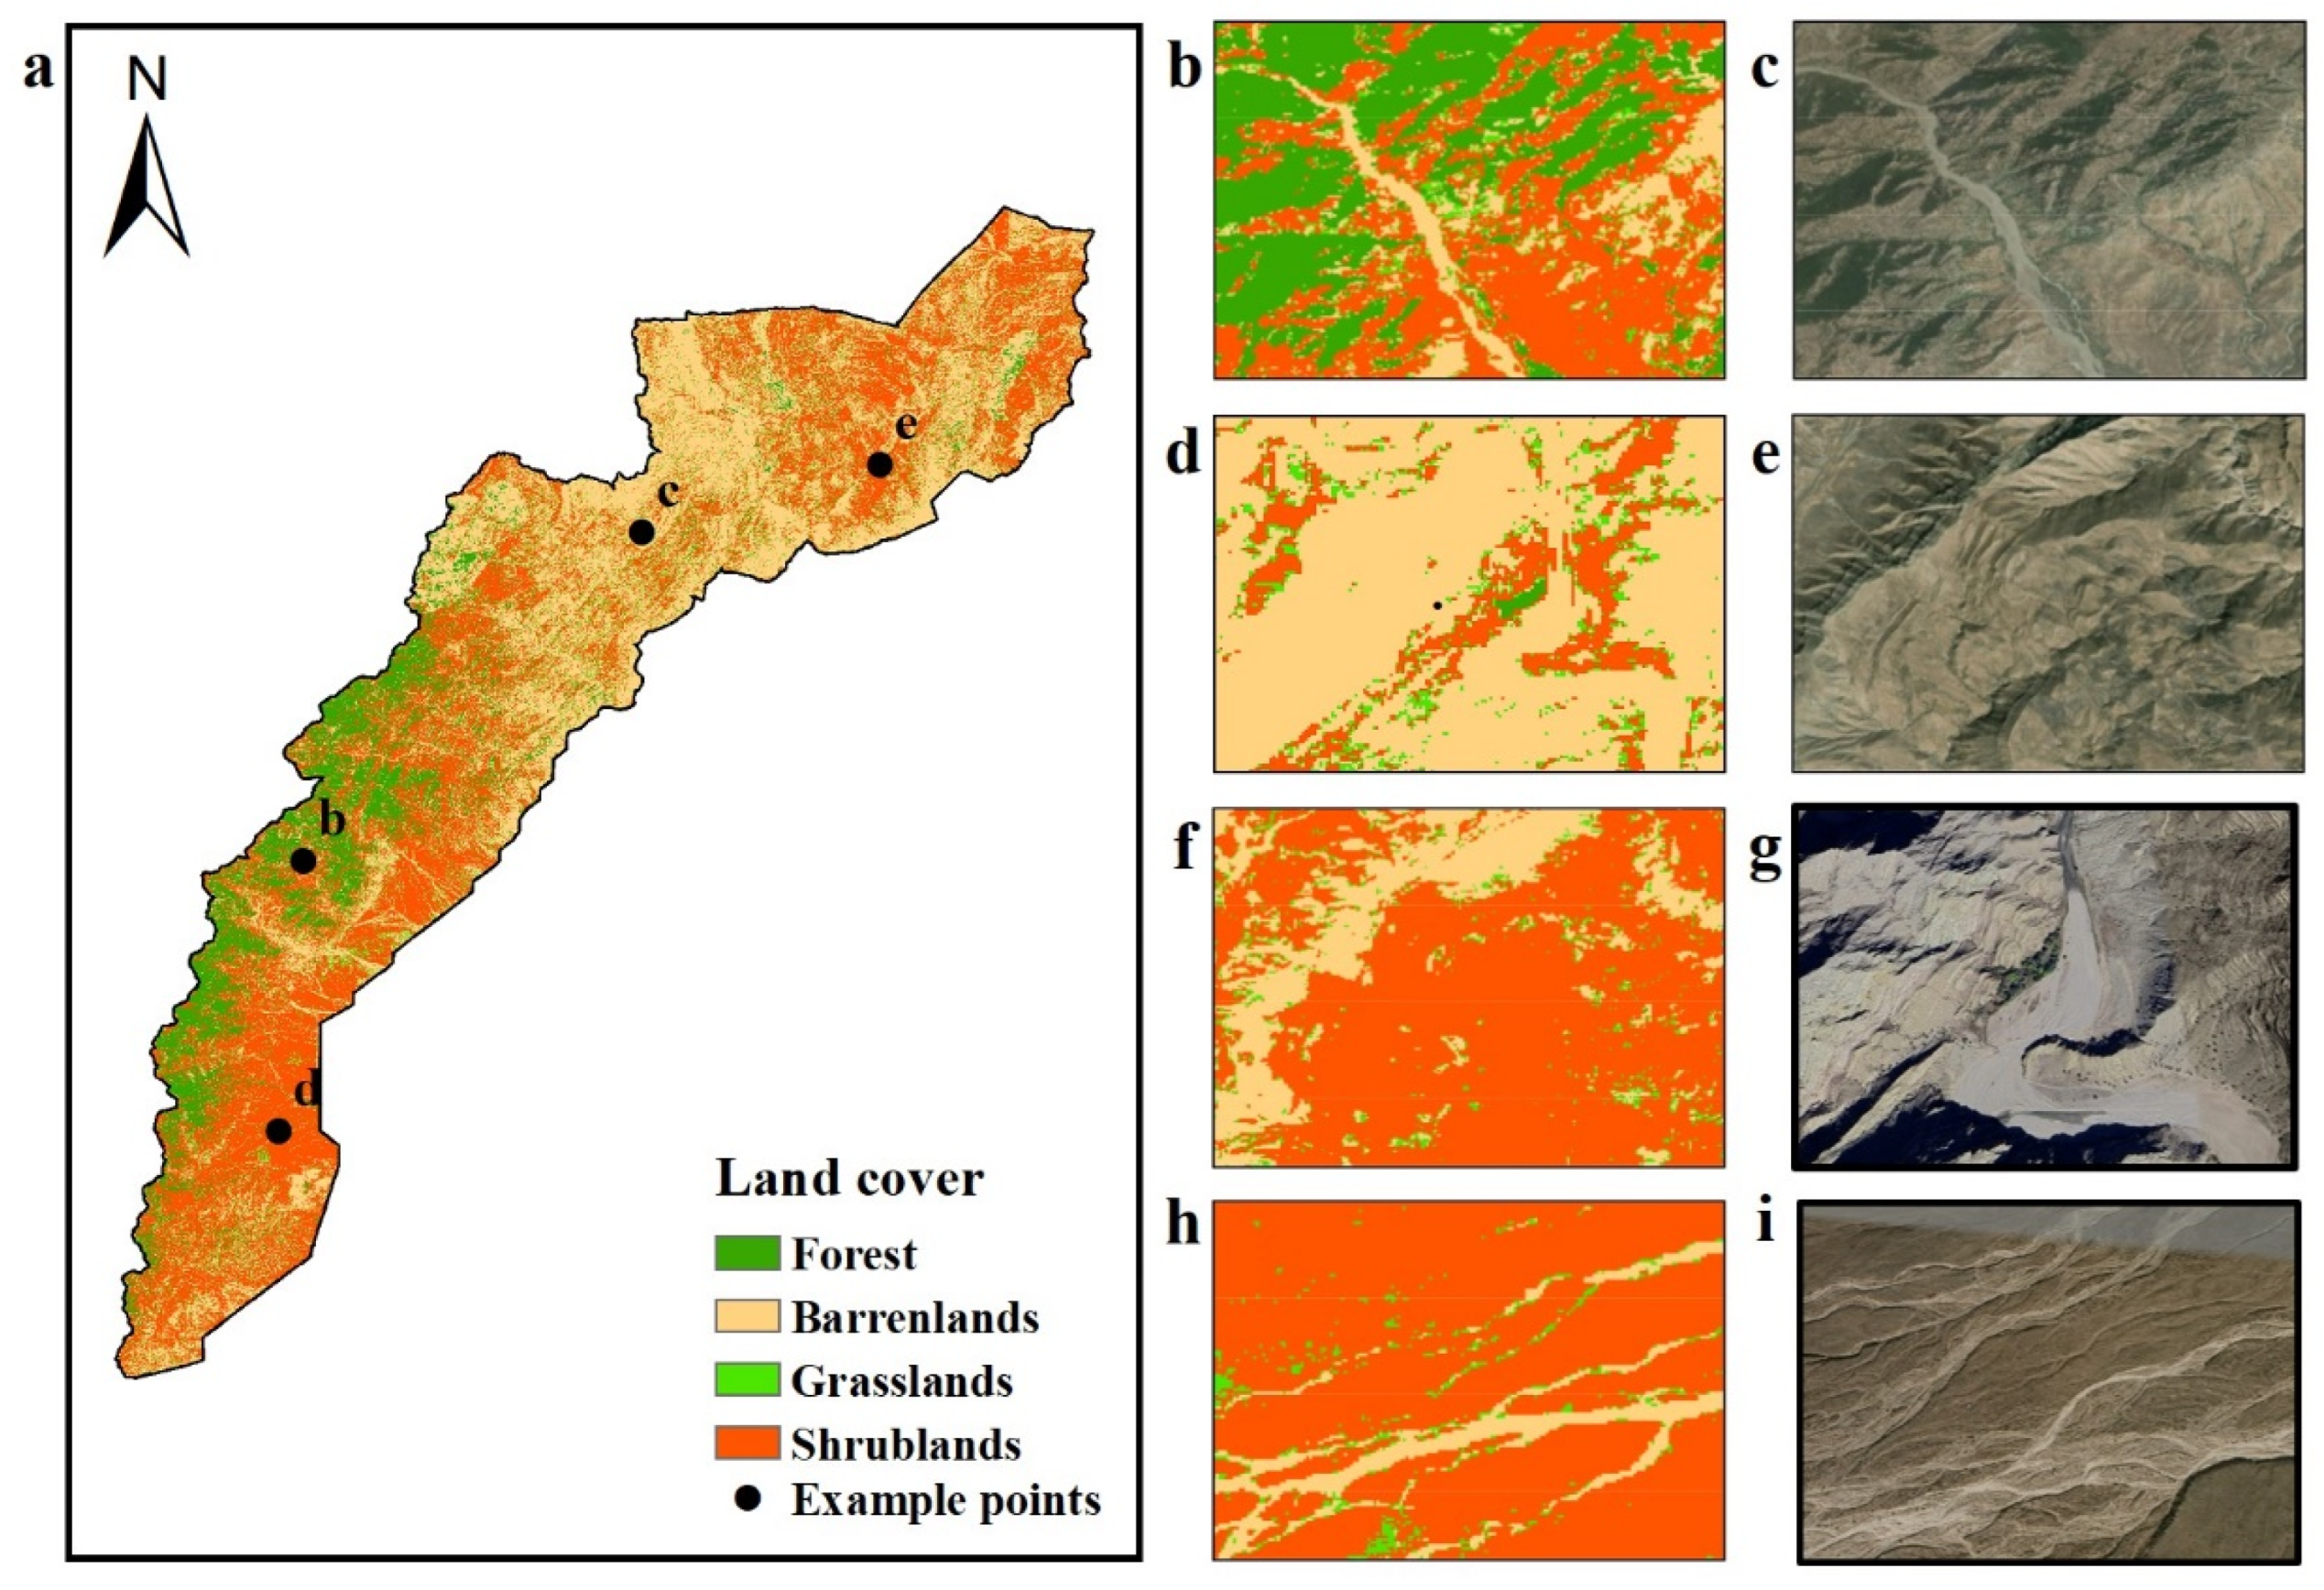
Figure 5.
The comparison of accuracy among the three models. The x-axis represents three models driven by the basic bands (SB), the vegetation indices (VI), and the combination of the basic bands and vegetation indices (SBVI). Their performance is evaluated using R2 and RMSE.
Figure 5.
The comparison of accuracy among the three models. The x-axis represents three models driven by the basic bands (SB), the vegetation indices (VI), and the combination of the basic bands and vegetation indices (SBVI). Their performance is evaluated using R2 and RMSE.

Figure 6.
(a) illustrates the distribution of R2 and EOPC within different ranges of shrub coverage. (b) displays the distribution of R2 and EOUB within different ranges of shrub biomass. (c) illustrates the sensitivity of the biomass model to each variable examined by R2 and RMSE. These analyses were conducted based on the ground samples. EOPC denotes the error of one percent coverage of shrub, calculated by RMSE/mean shrub coverage. EOUB denotes the error of one unit biomass, calculated by RMSE/mean shrub biomass.
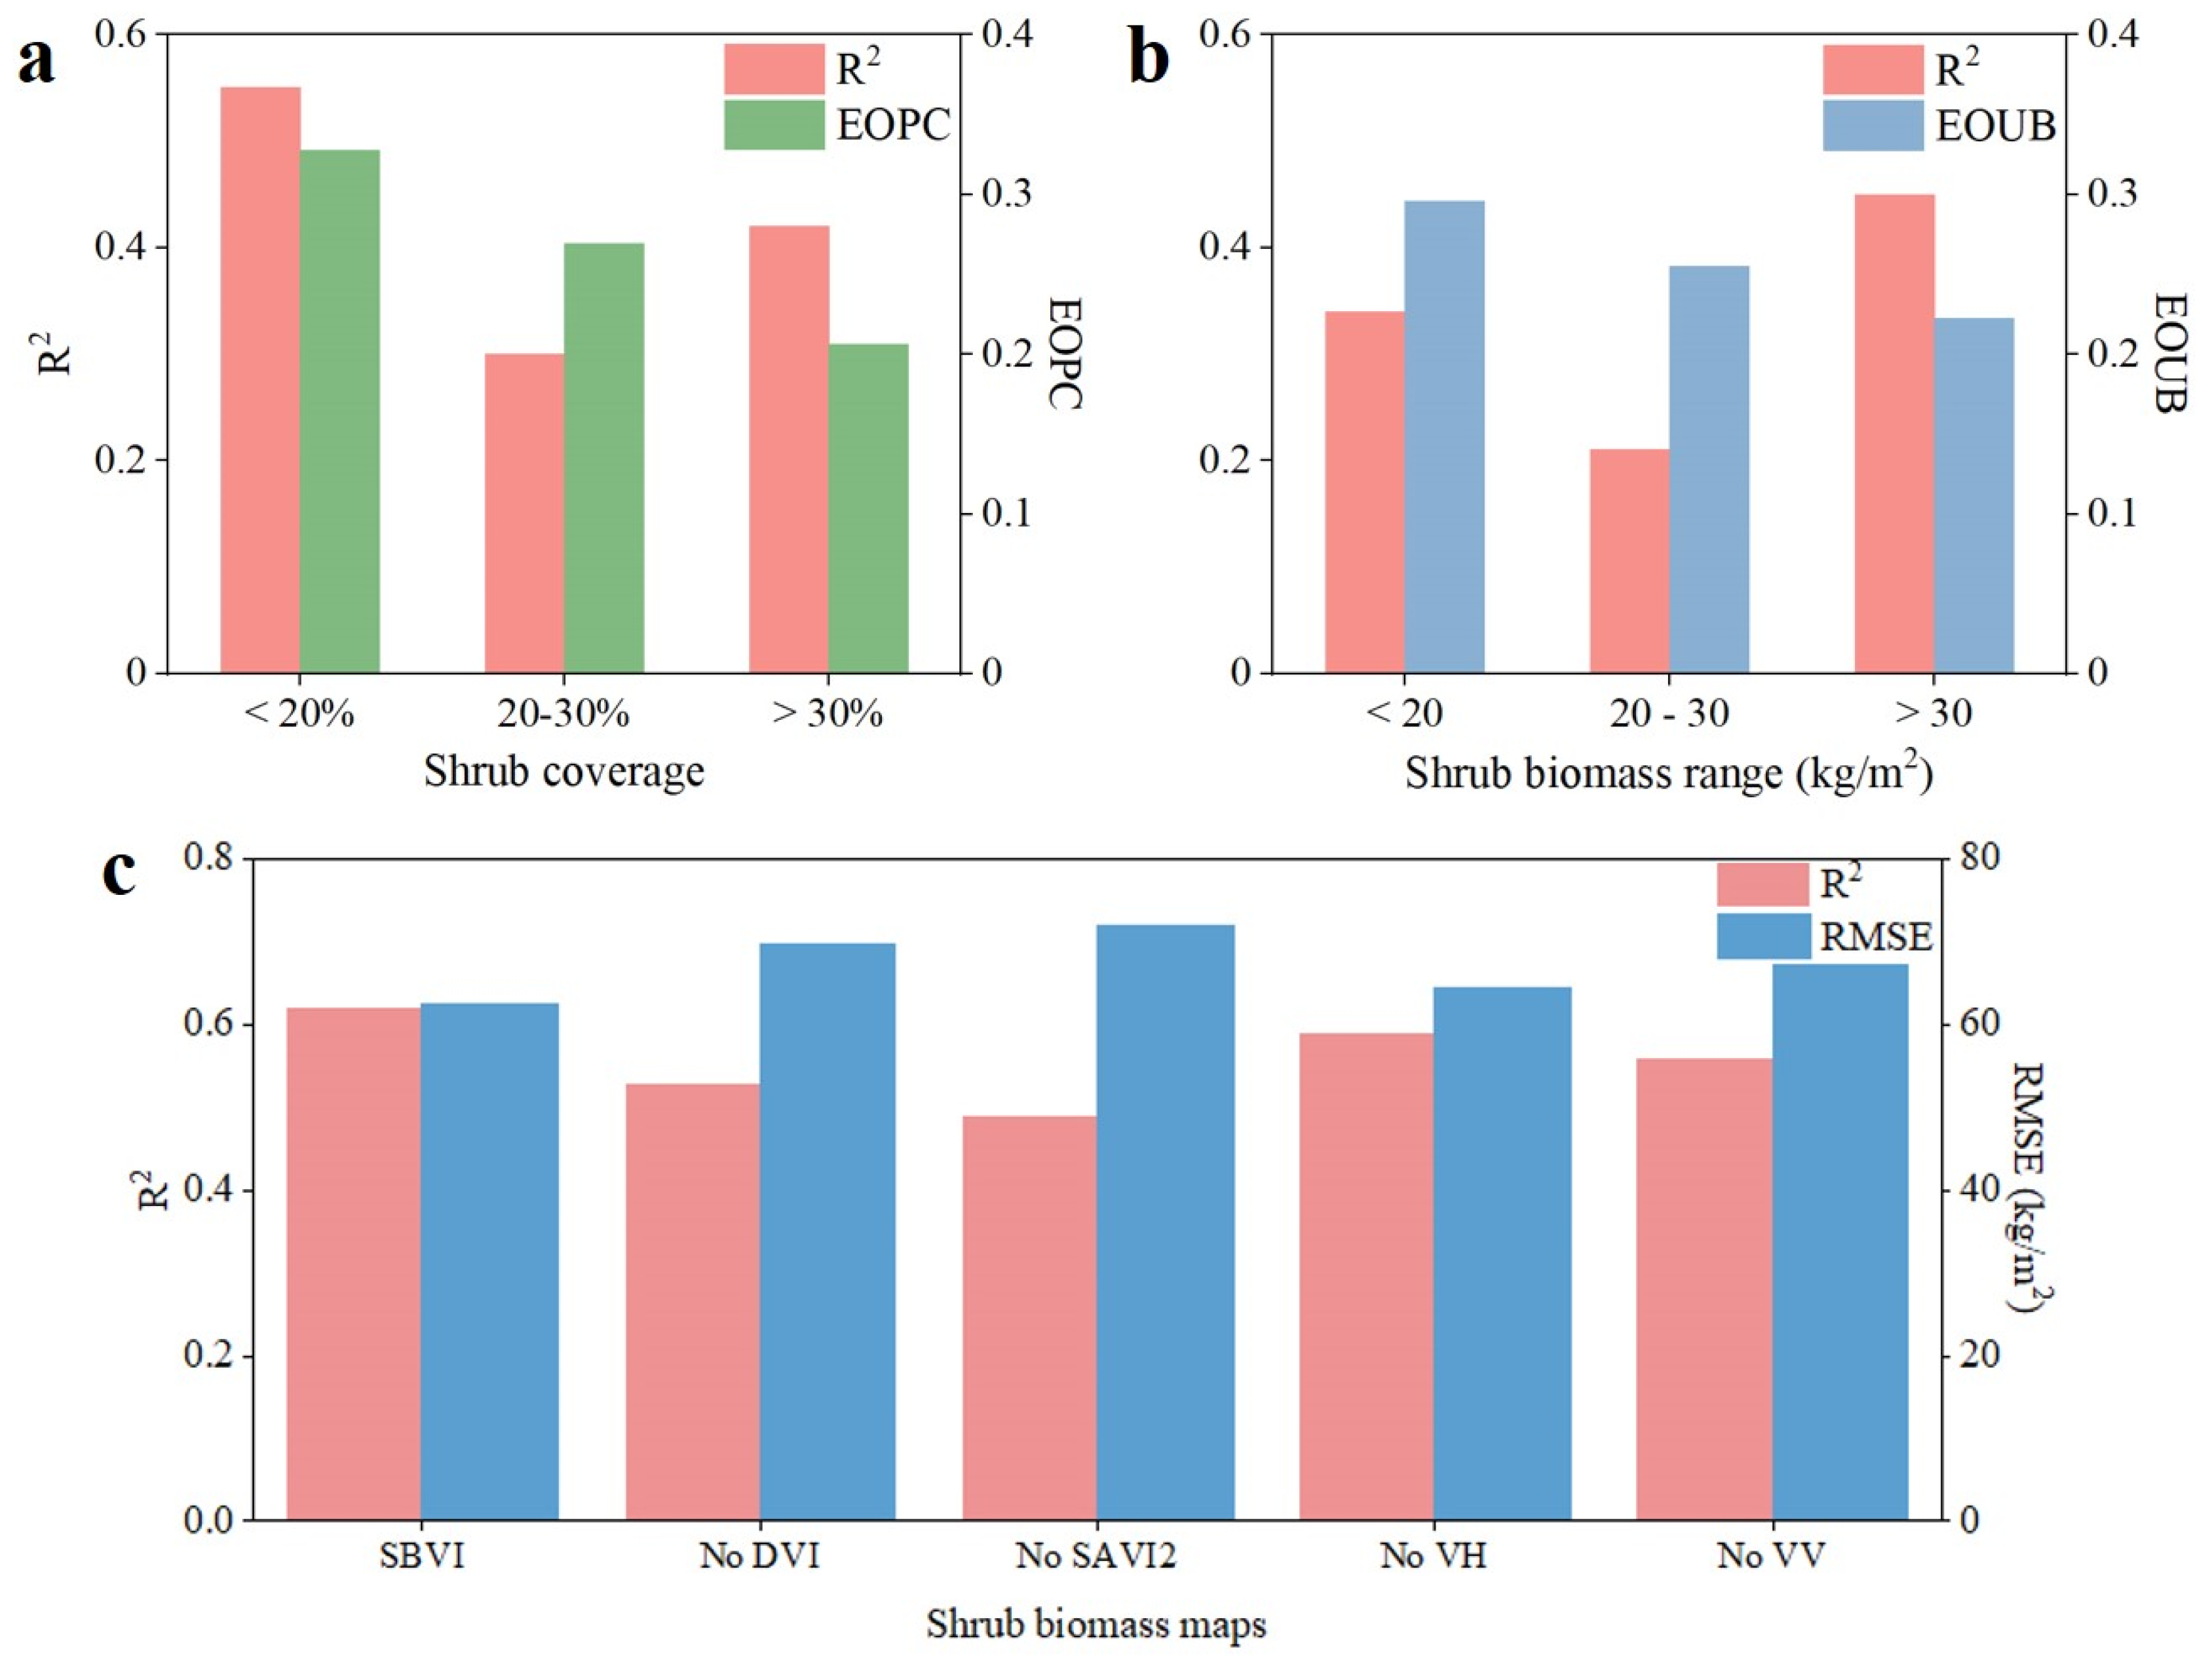
Figure 7.
(a) represents the estimated distribution map of shrub biomass in the Helan Mountains. (b) displays the corresponding map of standard deviation (SD). (c) illustrates the distribution of EOPC within different ranges of shrub coverage. (d) displays the distribution of EOUB within different ranges of shrub biomass. These analyses were conducted based on the estimated distribution map of shrub biomass and the corresponding map of standard deviation. EOPC denotes the error of one percent coverage of shrub, calculated by SD/mean shrub coverage. EOUB denotes the error of one unit biomass, calculated by SD/mean shrub biomass.
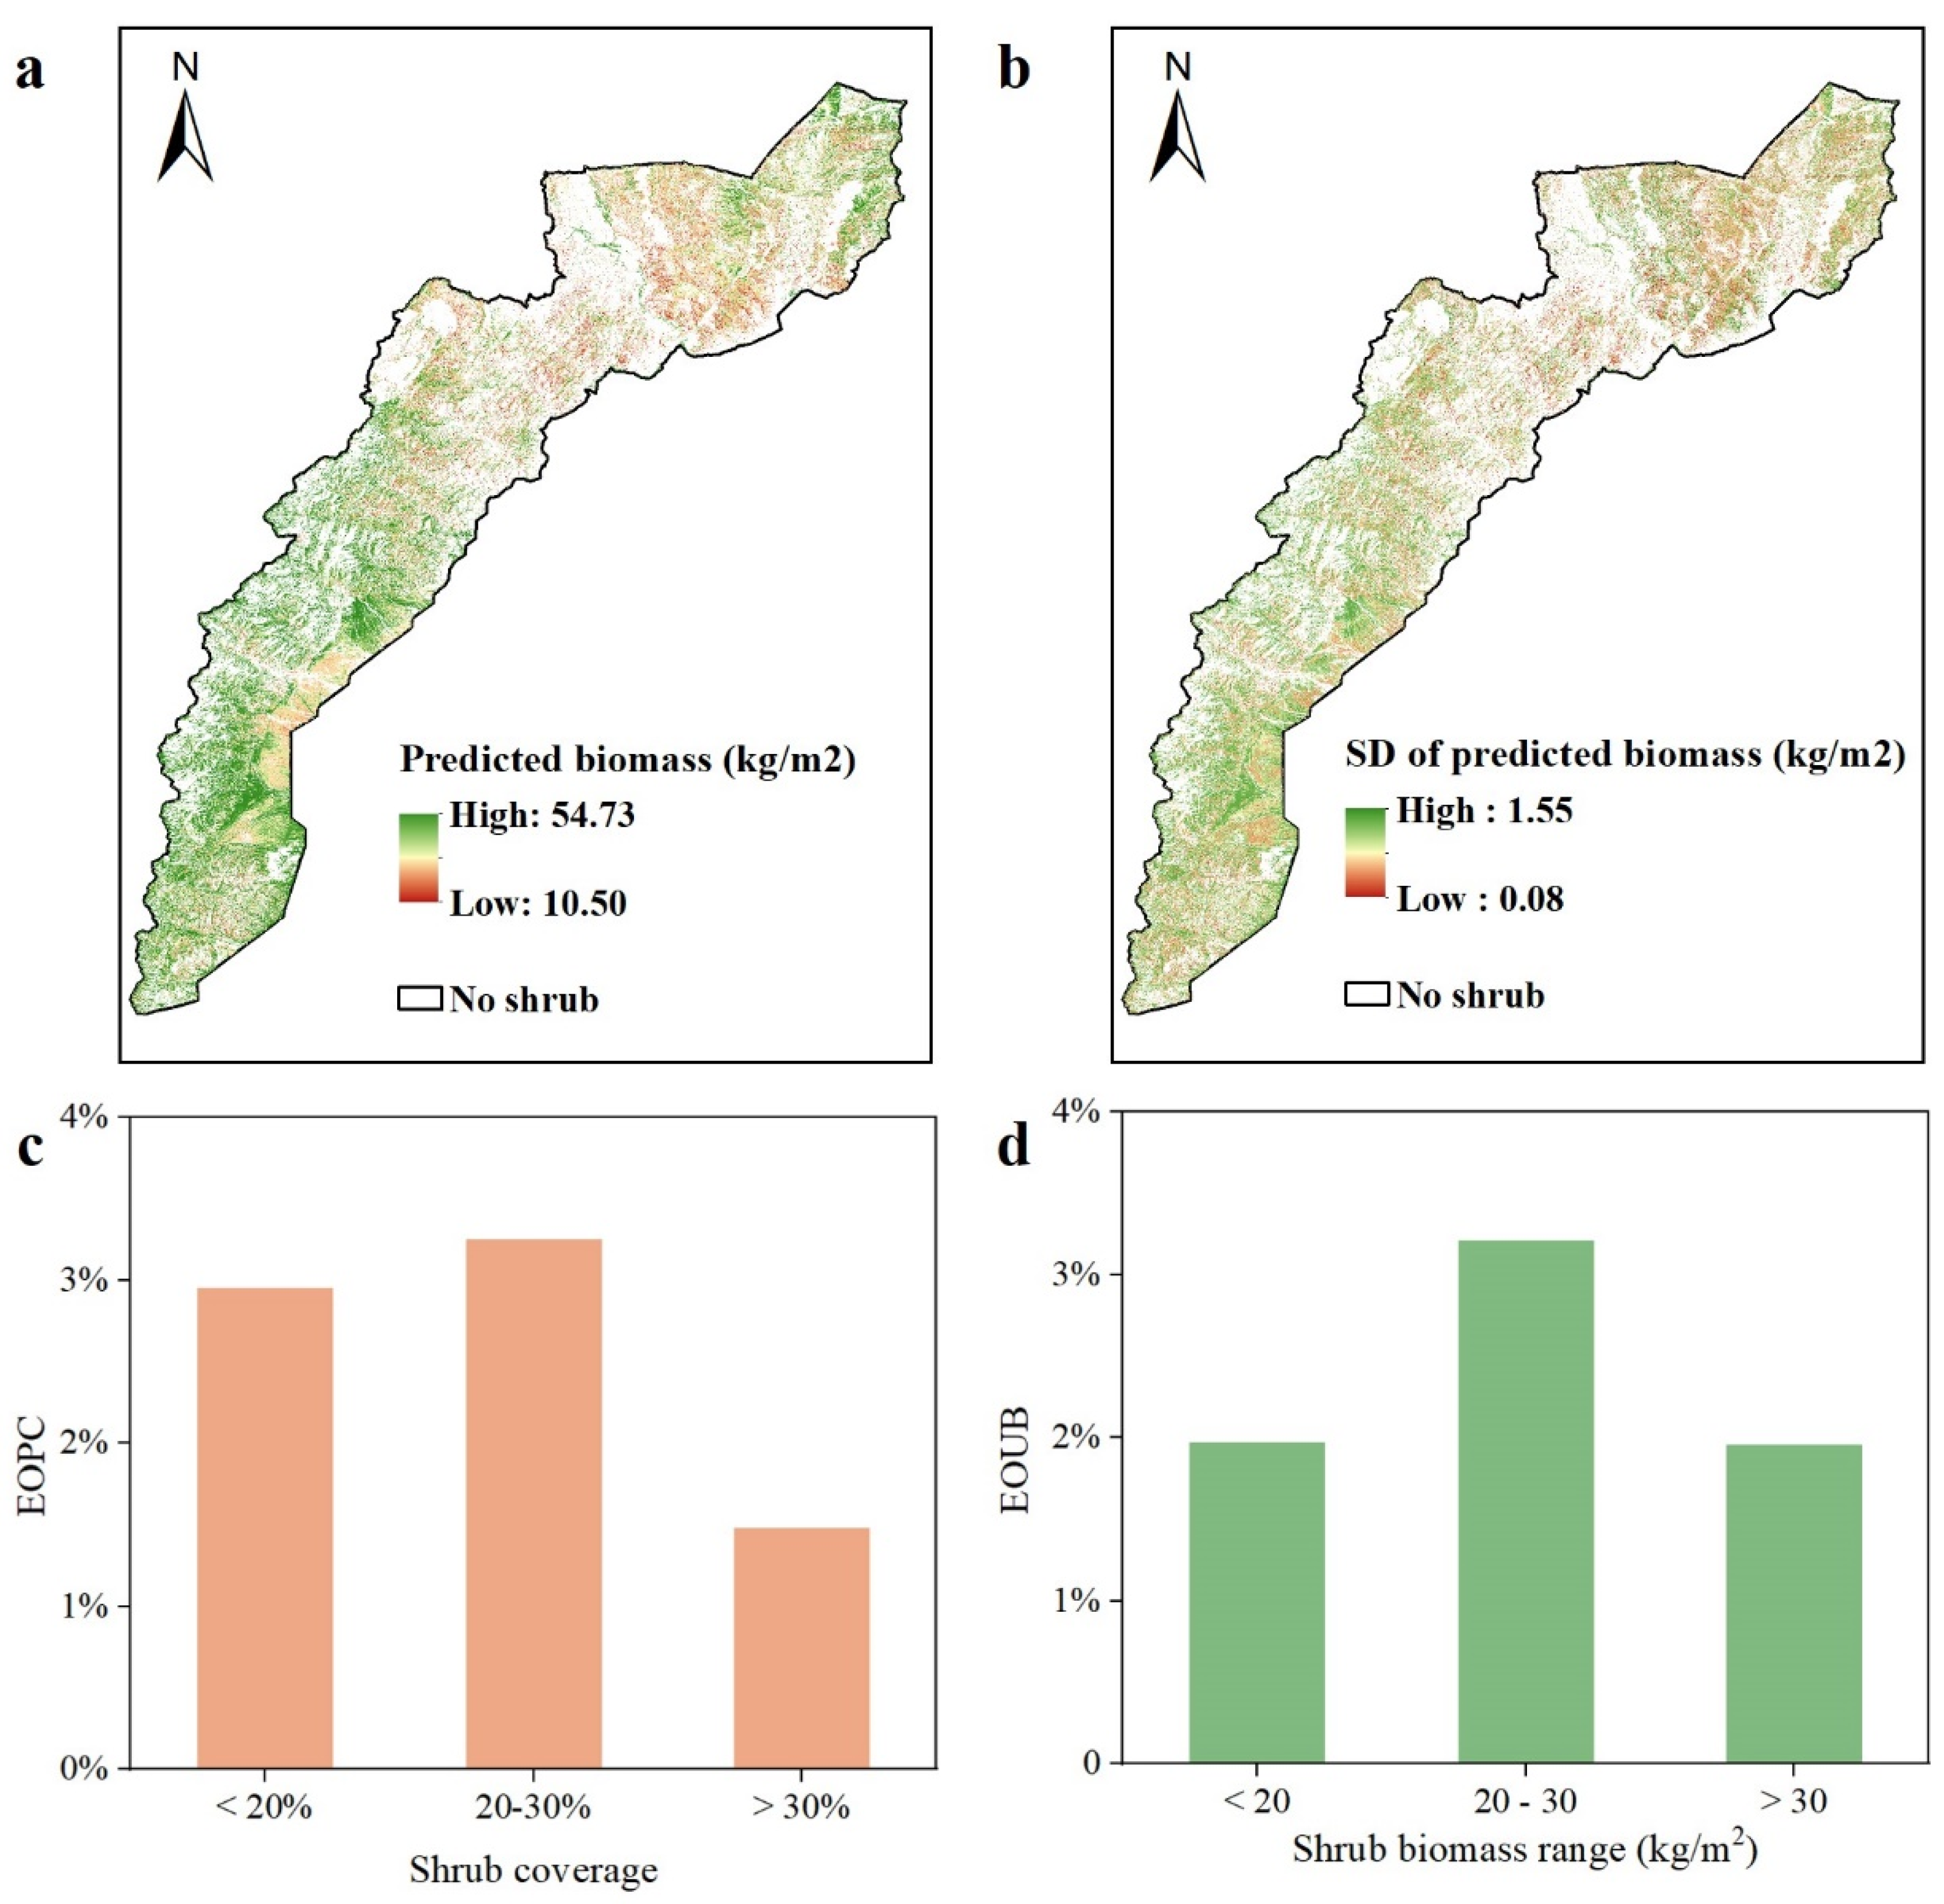
Figure 8.
(a) depicts the distribution of shrub biomass under precipitation gradients. (b) illustrates the distribution of shrub biomass under temperature gradients. (c) represents the distribution of shrub biomass within different ranges of aridity index. (d) displays the distribution of shrub biomass along elevation gradients.
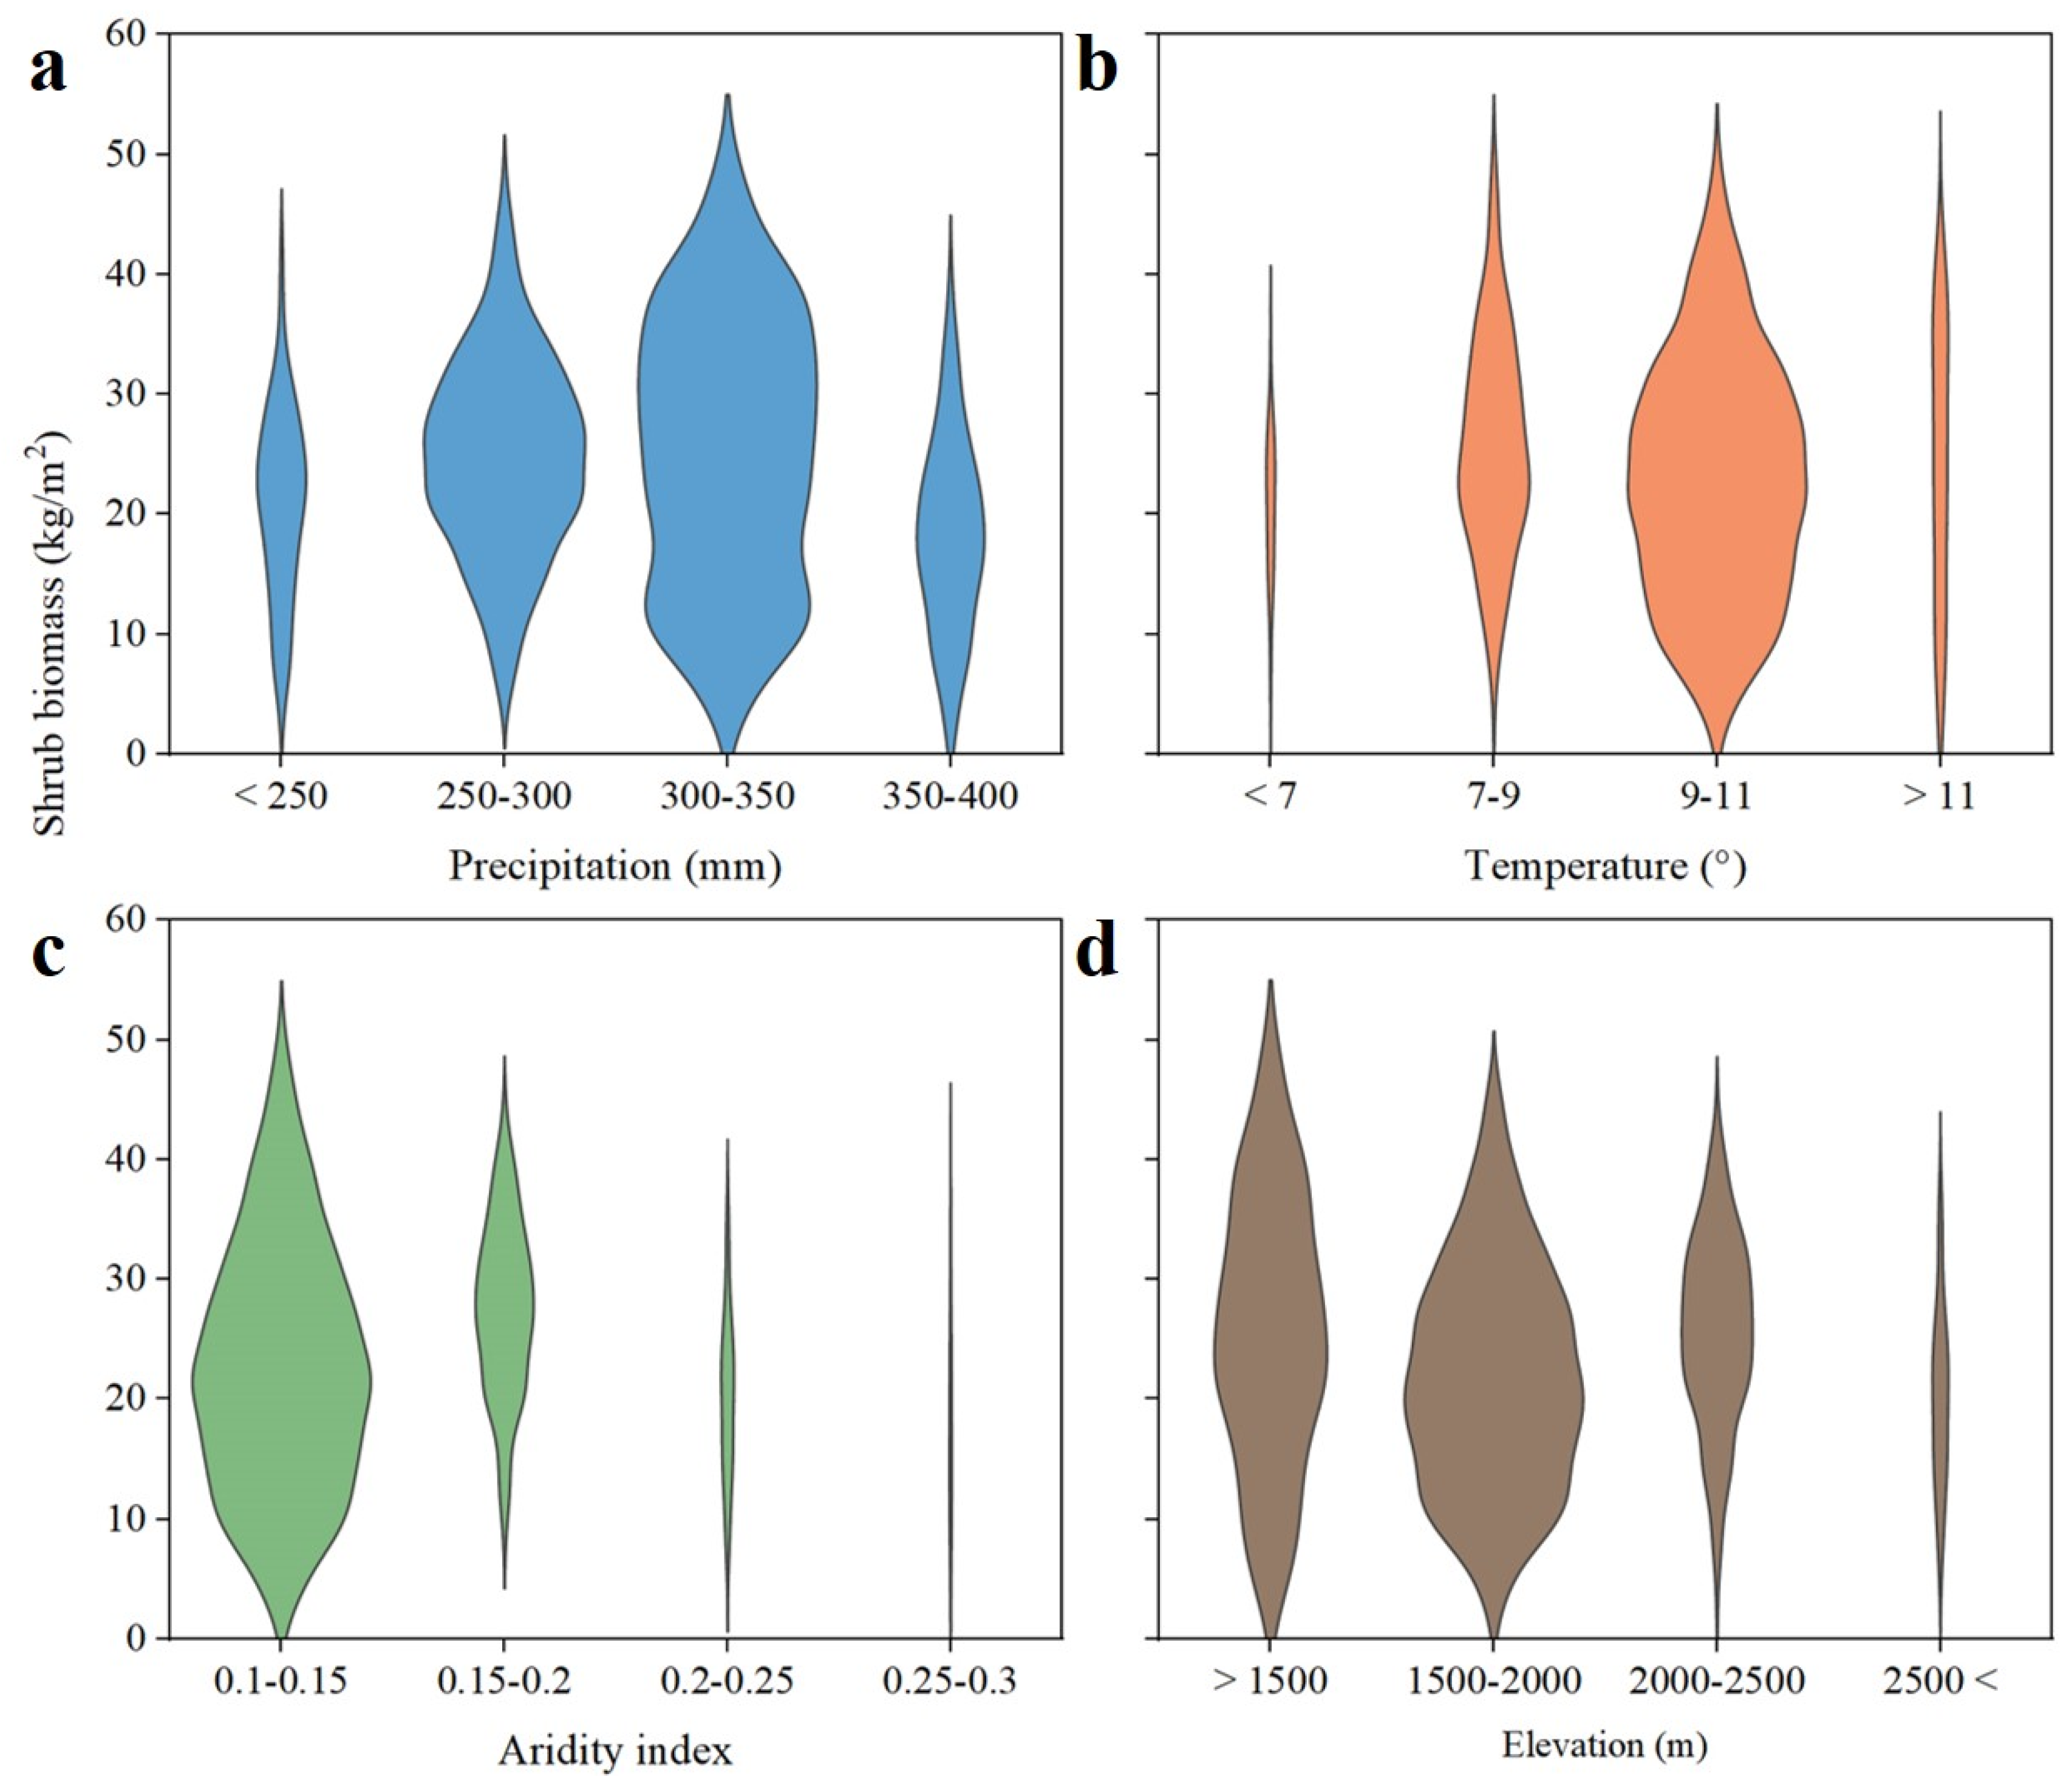
Table 3.
Auxiliary datasets were used in this study.
| Influencing factor | Name | Spatial resolution |
| Precipitation | Global Precipitation Measurement (GPM) v6 | 11132m |
| Air temperature | ERA5-Land Daily Aggregated - ECMWF Climate Reanalysis | 11132m |
| Aridity Index | Global Aridity Index and Potential Evapotranspiration (ET0) Climate Database v2 | 1000m |
| Elevation | NASA SRTM Digital Elevation | 30m |
Table 4.
Shrubland and non-shrubland classification accuracy assessment results.
| Accuracy index | Accuracy | Recall | F1 score |
|---|---|---|---|
| Value | 0.91 | 0.92 | 0.92 |
Table 5.
Model feature selection results.
| Model | Features |
|---|---|
| SB | Blue, Red, NIR, SWIR2 |
| VI | EVI, DVI, GNDVI, SAVI2, Ratio, RNDVI |
| SBVI | DVI, SAVI2, VH, VV |
Disclaimer/Publisher’s Note: The statements, opinions and data contained in all publications are solely those of the individual author(s) and contributor(s) and not of MDPI and/or the editor(s). MDPI and/or the editor(s) disclaim responsibility for any injury to people or property resulting from any ideas, methods, instructions or products referred to in the content. |
© 2024 by the authors. Licensee MDPI, Basel, Switzerland. This article is an open access article distributed under the terms and conditions of the Creative Commons Attribution (CC BY) license (http://creativecommons.org/licenses/by/4.0/).
Copyright: This open access article is published under a Creative Commons CC BY 4.0 license, which permit the free download, distribution, and reuse, provided that the author and preprint are cited in any reuse.


