
Submitted:
26 February 2024
Posted:
26 February 2024
Read the latest preprint version here
Abstract
Two polyurethanes (PUs) were similarly synthesized by reacting a cycloaliphatic isocyanate with 1,4 butanediol and two polyols of different nature (polyester, polycarbonate diol) with molecular weights of 1000 Da. The PU made with polycarbonate diol polyol (YCD) was the only showing intrinsic self-healing at 20 °C. For assessing the mechanism of intrinsic self-healing of YCD, a structural characterization by molecular weights determination, infrared and X-ray photoelectronic spectroscopies, differential scanning calorimetry, X-ray diffraction, thermal gravimetric analysis and dynamic mechanical thermal analysis was carried out. It was concluded that the self-healing at 20 °C of YCD was due to non-covalent dynamic exchange interactions among the carbonate groups of the soft segments. Therefore, the chemical nature of the polyol played a key role in developing PUs with intrinsic self-healing at 20 °C.
Keywords:
Polyurethane
; polycarbonate diol polyol
; intrinsic self-healing
; soft segments
; carbonate-carbonate interactions
; mechanism of self-healing.
1. Introduction
Since 2017 there has been a significant interest in developing self-healing polymeric materials [1] with potential applications in biomedical devices, construction materials, aerospace industry, and electronics [2]. Self-healing can be produced by an extrinsic (encapsulation of a healing agent in the polymeric matrix) or an intrinsic mechanism (dynamic reversible covalent or non-covalent bonds) [3,4,5,6,7,8]. Intrinsic self-healing in different polymers have been ascribed of the existence of inherent reversible bonds of different nature including Diels-Alder (DA) reactions [9,10,11,12], cycloaddition [13], acylhydrazone bonds [14,15,16,17], trithiocarbonate bonds [18,19,20], disulfide bonds [21,22,23,24,25], diarylfuranone bonds [26], hydrogen bonding [27,28], hydrophobic interactions [29,30,31,32], π-π stacking [33,34,35], metal-ligand interactions [36,37,38,39], and ionic interactions [40,41,42,43]. The most of the self-healing polymers need an activation temperature of 80-120 °C [9,44], and, in general, they show reduced mechanical properties.
PUs have inherent dynamic bonds, i.e. hydrogen bond interactions between urethane and/or urea groups [45]. PUs are obtained by addition reactions of polyols to polyisocyanates [46,47]. The structure of the most PUs consist of alternating "soft" segments of the polyol with low glass transition temperature (Tg) and "hard" segments made by reacting isocyanates with short-chain diols. The difference in polarity and chemical nature between the hard and soft segments leads to micro-phase separation in PUs [48,49] which imparts molecular mobility in some regions (soft phase) and physical and structural integrity (hard phase) in others [50,51].
The self-healing in polymers involves two consecutive steps, i.e. cloture followed by heal, similarly to the biological healing of skin wounds [52]. These steps require dynamic links, in addition to the mobility of the polymer chains [53,54,55]. Some self-healing PUs exhibit shape memory caused by physical crosslinking (polar interactions, hydrogen bonds), crystallization of the hard segments, and molecular motion of the soft segments [56]. Xu et al. have designed shape memory-assisted self-healing PUs made with polytetramethylene glycol [57] and epsilon-caprolactone diol [58], they contained disulfide bonds [59]. In a different approach, other researchers [60,61] have reported the synthesis of low molecular weight PUs with end groups that can be assembled by hydrogen bonding and π-π stacking interactions to produce thermally-reversible supramolecular networks with weak non-covalent interactions [62,63]. Feula et al. [64] synthesized a repairable supramolecular PU elastomer with self-assembly at 45 °C caused by aromatic π–π stacking interactions and hydrogen bonding.
Another strategy to produce self-healing PUs consisted in introducing disulfide bonds in the structure. Jing et al. [65] have obtained PUs with aromatic disulfide bonds and an important number of hydrogen bonds, a relatively quick self-healing (60 °C for 5 h or room temperature for 24 h) combined with a high tensile strength (8.0 MPa) was found.
The most self-healing PUs are made with polyester or polyether polyols, and there is a growing interest in developing PUs made with polycarbonate diol polyols because they impart excellent chemical and mechanical properties [66,67].
Different self-healing PU gels made with polycarbonates have been previously reported [68,69]. Chen et al. [68] have reported improved mechanical properties and excellent self-healing behavior of bulk polymerized hydrogels based on methoxy polyethylene glycol (Mn = 5000 Da) and an aliphatic polycarbonate - 2-methyl-2-benzyloxy carbonyl propylene carbonate (MBC). The MBC monomer acted as a rigid segment into the gel network, enhancing the cooperative hydrogen bonding interactions between the carbonyl and hydroxyl groups, they were the main responsible of the self-healing obtained at room temperature for 3 h without applying any external stimulus. Similarly, Han et al. [69] have synthesized gels with 5-methyl-5-carboxytrimethylene carbonate and trimethylene carbonate (TMC), and polypropylene glycol (Mn = 2000 Da). These gels showed both shape memory and self-healing (6 hours at room temperature without any external stimulus), particularly when the content of the soft TMC segments increased, this resulted in a cross-linked network. The combination of the dynamic network of reversible hydrogen bonds within the gels and their shape memory properties were responsible of the self-healing.
Recently, different self-healing PUs made with polycarbonate diols have been described [70,71,72,73]. Zhang et al. [70] synthesized PUs with 5-methyl-5-[(4-methoxy)-benzyloxycarbonyl]-1.3-dioxan-2-one) (MMC) aliphatic polycarbonate and propyleneglycol polyol, they showed both shape memory and self-healing at 37 °C for 6 hours. As the MMC content decreased, more efficient self-healing (99.3 % recovery of its initial mechanical properties measured by stress-strain test) was obtained. The self-healing of the PUs was driven by hydrogen bonding and π-π stacking, as well as by the existence of mobile flexible and short chains. On the other hand, Yang et al. [71] synthesized a self-healing PUs made with CO2-based polycarbonate and amide moieties, their autonomous self-healing ability was ascribed to reversible hydrogen bonds, i.e. hydrogen bonding between amide groups and hydrogen bonding between the amide group and the carbonate group. In addition, Matějka et al. [72] have synthesized aliphatic PUs by reacting poly(hexamethylene) carbonate diol, hexamethylenediisocyanate and 1,6-hexanediol chain extender, they exhibited self-healing upon heating at 120 °C followed by curing at room temperature. Under these conditions, the scratches on the surface were repaired in 1 h, while the fractured bulk PU required 7 hours for complete healing. The crack healing was ascribed to molecular diffusion across the interface and chain entanglement formation between the contacting surfaces. Similarly, Li et al. [73] have synthesized shape memory and self-healing PUs by reacting polycarbonate diol (Mn = 2000 Da), 4,4′-diphenylmethane diisocyanate and 1,4-butanediol, they exhibited self-healing at 80 °C for 40 seconds and the extent of self-healing depended on the hard segments content. The self-healing was ascribed to the existence of hydrogen bonds between the hard and the soft segments and the dipole-dipole interactions between the hard segments.
Despite the advances that have been achieved in developing self-healing PUs, including the PUs made with polycarbonate diol polyols, the most of them require the application of temperature or a long time to achieve self-healing. Therefore, it remains a challenge to develop PUs with fast and controlled healing [52], particularly a rapid self-healing at room temperature without any external stimulus. Patent EP3103846A [74] reported a PU made with polycarbonate diol polyol that showed rapid self-repairing at room temperature, without any external stimulus. However, the mechanism by which the self-healing occurs in this PU has not been disclosed yet. To begin to understand its self-healing mechanism, in this study, a comparison of the properties of two similarly synthesized PUs with polycarbonate diol polyol (which shows self-healing at room temperature) and polyester polyol (which does not exhibit-self-healing at room temperature) was carried out. Our hypothesis is that the chemical nature of the polyol determines the intrinsic self-healing of the PU at room temperature. In order to confirm our hypothesis, the differences in the structure of the two PUs were addressed by using different experimental techniques and a mechanism of self-healing based on non-covalent dynamic exchange interactions between the carbonate groups in the soft segments was proposed.
2. Materials and Methods
2.1. Materials
The raw materials used in the synthesis of the polyurethanes (PUs) were an isocyanate – 4,4´ methylene bis (cyclohexyl) isocyanate (HMDI) with 90 % purity (Sigma Aldrich Co., St. Louis, MO, USA) -, a chain extender – 1,4-butanediol (BD) with 99 % purity (Panreac Applichem®, Darmstadt, Germany) -, and two different polyols - polycarbonate of 1,6 hexanediol polyol with molecular weight of 1000 Da (Eternacoll® UH-100, UBE Chemical Europe S.A., Castellón, Spain) – CD -, and polyadipate of 1,6 hexanediol polyol with molecular weight of 1000 Da (Synthesia, Barcelona, Spain) - PE.
2.2. Methods
2.2.1. Synthesis of the Polyurethanes (PUs)
Two PUs were similarly synthesized with two polyols of different chemical nature and similar molecular weight (1000 Da) by using the one-shot method. An NCO/OH ratio of 1.1 was used. The required amounts of polyol (3.9062 g) and 1,4-butanediol (0.035 g) were placed in a 60 mL polypropylene bottle heated at 80 °C which was stirred in a double centrifuge SpeedMixer DAC 150.1 FVZ-K equipment (FlackTek Inc., Landrum, SC, USA) at 2,400 rpm for 1 minute. The mixture was placed in an oven at 80 °C for 10 minutes. Then, the required amount of HMDI (isocyanate) (1.0938 g) was added to the mixture and stirred in a double centrifuge SpeedMixer equipment at 2,400 rpm for 1 minute. Afterwards, the PUs were cured in an oven for 7.5 hours by following different consecutive stages: 50 °C for 30 min; 60 °C for 30 min; 70 °C for 30 min; and 80 °C for 6 hours. After 24 hours at room temperature, the PUs were annealed at 85 °C for 1 hour. The hard segments contents of the two PUs were similar (22 wt.% for PU made with CD polyol and 23 wt.% for PU made with PE polyol).
The nomenclature used in this study for the two PUs was “YCD” – PU made with CD polyol - and “YPE” – PU made with PE polyol.
2.2.2. Experimental Techniques
Self-healing assessment. The quantitative self-healing of the PUs at 20 °C was determined by using a new equipment and method described elsewhere [75]. A cylindrical PU piece of 19 mm diameter and 3 mm thick was placed inside a thermostatic hermetic chamber (Figure 1). Inside the chamber, the PU piece was fully pierced with a 1 mm diameter needle and, immediately, the needle was withdrawn and a nitrogen gas flowed from bottom to upper inside the chamber, the variation of the gas flow was continuously monitored over time until the gas stops flowing. The time between the piercing of the PU and the flow stop of the gas was taken as the self-healing time at 20 °C. Furthermore, the variation of the gas flow that passes through the crack made in the PU over time allowed the determination of the kinetics of self-healing at 20 °C. Three punctures in different locations of each PU were made and the self-healing results were averaged.
Tack measurement. The tack of the PUs was measured at 20 °C by using the probe tack test. A flat cylindrical probe of 3 mm diameter was brought into contact with the PU surface, a force of 5 N was applied for 1 second, and then the probe was separated at a constant rate of 10 mm/s. As many replicates as necessary were performed to obtain at least 3 concordant values.
Gel permeation chromatography (GPC). GPC was used to determine the molecular weights of the PUs. GPC equipment was provided with a Waters 1515 isocratic high-performance liquid chromatography pump and a Waters 2414 refractive index detector. Samples were eluted at a flow rate of 1 mL/min in HPLC grade tetrahydrofuran (THF). Polystyrene standards were used for calibration.
Infrared spectroscopy in attenuated total reflectance mode (ATR-IR spectroscopy). ATR-IR spectroscopy was used to assess the chemical composition and structure of the polyols and the PUs. An Alpha spectrometer (Bruker Optik GmbH, Ettlinger, Germany) provided with a germanium prism was used, and 60 scans were performed with a resolution of 4 cm-1.
Differential Scanning Calorimetry (DSC). DSC was used to assess the structure and thermal properties of the PUs. Three consecutive thermal runs under nitrogen atmosphere (flow rate: 100 mL/min) were performed in a DSC Q100 equipment (TA Instruments, New Castle, DE, USA) : (i) Heating from -80 °C to 200 °C (heating rate = 10 °C/min); (ii) Cooling from 200 °C to -80 °C (cooling rate = 10 °C/min); and (iii) . Heating from -80 °C to 250 °C (heating rate = 10 °C/min).
X-ray diffraction (XRD). Wide angle XRD was used to assess the crystallinity of the polyols and the PUs. A Bruker D8-Advance equipment (Bruker, Etlinger, Germany) provided with a nickel filter and a Göebel mirror, a Kritalloflex K 760-80F X-ray generator (3000 W; 20-60 kV; 5-80 mA), and the wavelength of copper (λ = 1.5406 Å) were used. A scan of 2θ angles from 5° to 90° was performed by varying 0.05° every 3 seconds.
Thermal gravimetric analysis (TGA). TGA was used to assess the structure and thermal properties of the polyols and the PUs. A TGA Q500 equipment (TA Instruments, New Castle, DE, USA) was used and the experiments were carried out under nitrogen atmosphere (flow rate: 50 mL/min). 9–10 mg sample was placed in a platinum crucible and heated from 35 °C to 600 °C by using a heating rate of 10 °C/min.
Dynamic mechanical thermal analysis (DMA). DMA was used to assess the viscoelastic properties of the PUs. A TA DMA Q800 instrument (New Castle, Delaware, DE, USA) was used, the experiments were carried out in the single cantilever mode. Rectangular PU samples with dimensions of 33 mm x 12 mm x 2.5 mm were used, they were heated from –100 °C to 80 °C by using a heating rate of 5 °C/min and a frequency of 1 Hz.
X-ray photoelectron spectroscopy (XPS). XPS was used to assess the chemical composition and chemical species on the PU surfaces. A XPS K-ALPHA instrument (Thermo Fisher Scientific, Waltham, MA, USA) provided with twin crystal monochromator and hemispherical analyzer were used. A sample spot of 400 µm diameter was analyzed by using Aluminum kα radiation (1486.6 eV), a current of 3 mA and a voltage of 12 kV. Charge compensation was achieved with the system flood gun. Survey scan with pass energies of 200 eV were obtained and high resolution C1s, O1s and N1s spectra were obtained by using pass energies of 50 eV.
Ethylene glycol contact angle measurements. The wettability on the PU surfaces was quantified by ethylene glycol (purity > 99.0%, Merck-Schuchardt, Hohenbrunn, Germany) contact angle measurement at 20 °C. An ILMS goniometer (GBX Instruments, Bourg de Pèage, France) was used and ethylene glycol droplets of 3 μL were placed in different locations on the PU surface and measured 15 seconds after drop deposition. The contact angles were the average of at least 3 drops placed on different zones of the PU surface with an error less than ± 2°.
Stress-strain test. The mechanical properties of the PUs were assessed by stress-strain tests according to ASTM D 638 standard. Standardized type 2 dumbbell PU specimens were prepared and tested in a Zwick/Roell Z005 universal testing machine (Barcelona, Spain) by using a cross-head speed of 100 mm/min. Smooth pneumatic jaws were used. Three replicates for each PU were obtained and the results were averaged.
3. Results and Discussion
3.1. Assessment of the Self-Healing at 20 °C of the PUs
The self-healing of YCD and YPE polyurethanes were measured in the equipment displayed in Figure 1. YCD shows a quick self-healing at 20 °C (1.4 seconds) whereas YPE does not show self-healing (Figure 2).
Some PUs show tack at room temperature, i.e. the polymeric chains move under the application of mild stresses [76]. Considering that the self-healing of YCD could be due to the existence of tack, the tack of the PUs was assessed by the probe tack test. Figure 3 shows that none of the PUs show tack (i.e., no maximum in the stress-displacement curve was found and the stress was lower than 3 kPa) and, therefore, the self-healing in YCD cannot be ascribed to the existence of tack.
3.2. Structural Characterization of the PUs
The synthesis procedures of YCD and YPE polyurethanes were similar and they have 22-23 wt.% hard segments, the only difference between them is the polyol, i.e. polycarbonate diol – CD - or polyester – PE - polyol. Considering that the linear polymers may displayed self-healing properties via intensive segmental motion, the similar low hard segments content in both YCD and YPE would produce similar intensive segmental motion. However, only YCD shows self-healing. On the other hand, the molecular weights of YCD and YPE are moderate (Table 1), and YCD shows higher molecular weight and higher polydispersity than YPE. Furthermore, the Mz value is significantly higher in YCD and YPE shows a narrower molecular weight distribution than YCD. Therefore, the self-healing in YCD cannot be ascribed only to intensive segmental motion.
Because a short diol, a cycloaliphatic isocyanate and a polycarbonate diol or a polyester polyol were used in the synthesis of YCD and YPE, the existence of dynamic covalent bonds for explaining the self-healing at 20 °C in YCD can be discarded. It should be noted that, although only diols are used in the synthesis of the PUs, urea groups should be formed during cure in oven. Furthermore, considering that the hard segments content in YCD is quite low, the contribution of the hydrogen bonds between urethane, urea and urethane-urea groups is not expected to be sufficient to justify the existence of self-healing at 20 °C. It is our hypothesis that the self-healing at 20 °C in YCD must be related to the interactions between the soft segments, and that the chemical nature of the polyol determines its self-healing ability.
Figure 4 and Figure 5 show the schemes of the potential interactions between the polar groups in YCD and YPE. Four potential interactions can be anticipated in YCD and YPE : (i) urea-urethane: (ii) urea-ester/urea-carbonate; (iii) urethane-ester/urethane-carbonate; and (iv) ester-ester/carbonate-carbonate. The main difference between YCD and YPE should be the distinct strength of those interactions. It can be expected that the interactions of the carbonate groups between themselves and with urethane and urea groups in YCD are stronger than the ones of the ester groups between themselves and with urethane and urea groups in YPE. Furthermore, 13 carbonate groups exist in the soft segments in YCD and 18 ester groups are present in YPE (Figure 6).
In this study, the interactions between the polymeric chains in YCD and YPE have been assessed by ATR-IR spectroscopy, DSC, X-ray diffraction, TGA and DMA.
Figure 7 shows the ATR-IR spectra of YCD and YPE. The ATR-IR spectra of both PUs show the same absorption bands and they differ in the wavenumber of the OCC band of the soft segments (1256 cm−1 in YCD, and 1169 and 1259 cm−1 in YPE). The main absorption bands of the PUs correspond to the hard segments - N-H stretching at 3356-3364 cm−1, C=O stretching due to urethane and urea at 1729–1737 cm−1 – and the soft segments - C-H stretching at 2938-2954 and 2867-2875 cm−1, C-H bending at 1465 and 1346-1370 cm−1, and C-O stretching at 900-1256 cm−1. The number of ester groups in the soft segments of YPE is higher than the one of carbonate groups in the soft segments of YCD (Figure 6), and, therefore, the intensity of the C=O stretching band is lower in YCD than in YPE. In fact, the ratio of the intensities of the C=O band with respect to that of the OCC band is lower (0.57) in the ATR-IR spectrum of YCD than in the one of YPE (1.35). According to Figure 7, the ratio of the intensities of the C=O band with respect to that of the OCC band in the polyols (CD and PE) are somewhat similar to the ones of the respective PUs, i.e. 0.56 in CD and 1.46 in PE. Therefore, the major differences in the ATR-IR spectra of the PUs are due to the soft segments.
The interactions between the polar groups of the PUs were evidenced by curve fitting of the carbonyl stretching region of the ATR-IR spectra, a Gaussian function was used (Figure 8). The wavenumber of each C=O contribution was assigned according to previous literature [77,78,79]: 1750 cm-1 for free C=O of carbonate; 1736 cm-1 for carbonyl-carbonyl interactions in the soft segments; 1730 cm-1 for free urethane; 1711 cm-1 for hydrogen-bonded carbonyl groups in the hard and soft segments; and 1699 cm-1 and 1660 cm-1 for urea groups.
The curve fitting of the C=O stretching region of the ATR-IR spectrum of YCD (Figure 8) shows five contributions: 24 % free carbonate groups at 1742 cm−1, 38 % free urethane and carbonate-carbonate interactions at 1730 cm−1, 14 % hydrogen-bonded urethane at 1716 cm-1, 15 % free urea at 1692 cm-1, and 9 % hydrogen-bonded urea at 1653 cm-1 (Table 2). Thus, YCD shows important contributions of free carbonate groups and carbonate-carbonate interactions. On the other hand, the curve fitting of the carbonyl region of YPE (Figure 8, Table 2) shows 56 % free ester and free urethane groups at 1732 cm−1, 26 % hydrogen-bonded urethane at 1719 cm−1, 10 % free urea at 1695 cm−1, and 8 % hydrogen-bonded urea at 1667 cm-1. The percentages of free and hydrogen-bonded urethane species are higher in YPE than in YCD, whereas the percentage of free urea is higher in YCD (Table 2).
Thus, the differences between YCD and YPE rely in the lower percentage of urethane species, the higher percentage of free urea and the existence of free carbonate groups in YCD with respect to YPE. In fact, a previous study [80] has established that the PE polyol had 88 % free ester group at 1730 cm−1 and 8 % bonded by dipole-dipole interactions C=O groups at 1712 cm−1, whereas the CD polyol had 36 % free carbonate group at 1741 cm−1, and 64 % bonded by dipole-dipole interactions C=O groups at 1730 cm−1, this confirming strong interactions between the carbonate groups in the CD polyol and also in YCD.
The structure of the PUs was also assessed by DSC. The DSC curves of the first heating run of the PUs (Figure 9) show the glass transition temperature (Tg) of the soft segments at −21 °C (YCD) and −40 °C (YPE), YCD shows higher Tg value due to high polarity of the carbonate groups. The heat capacity at constant pressure (∆cp) is higher in YPE (0.35 J/g °C) than in YCD (0.29 J/g °C), this indicates stronger interactions between the soft segments in YPE. On the other hand, YPE shows a cold crystallization at 21 °C followed by a melting at 36-42 °C (melting enthalpy : 7 J/g), whereas YCD exhibits only a small melting at 77 °C (melting enthalpy : 0.1 J/g). Therefore, the movement of the polymeric chains is more restricted in YPE than in YCD, this agrees well with the existence of a higher percentage of urethane groups and less intensive segmental motion of the polymeric chains in YPE.
To remove the thermal history of the PUs, after cooling down to -80 °C, a second DSC heating run was carried out (Figure 10). The DSC curves exhibit two glass transitions due to the soft segments (Tss : -18 °C - YCD -, and -37 °C - YPE) and the hard segments (Ths :236 °C - YCD -, and 241 °C - YPE). YCD shows a lower difference between the Tg values of the soft and hard segments indicating a lower degree of phase separation than in YPE.
Both PUs show crystallinity because they have two main diffraction peaks at 2θ values of 21° and 22° in YPE and at 2θ values of 20° and 23° in YCD (Figure 11). Although the two PUs exhibit crystallinity, their nature is different because of the different 2θ values at which the diffraction peaks appear. Previous studies [59,72] have reported the existence of an ordered and crystalline structure of the soft segments in PUs made with polycarbonate with characteristic crystalline peaks at 2θ values of 20° and 23°. This crystallization assists the micro-phase separation of the soft and hard segments which can be related to carbonate-carbonate interactions between the soft segments. In fact, the polyols (CD and PE) show diffraction peaks at the same 2θ values than their corresponding PUs (Figure 11) and, therefore, the crystallinity of YCD and YPE should derive from the interactions between the soft segments. The diffraction peaks at 2θ values of 21° and 22° in PE polyol has been ascribed to ester-ester interactions and the ones at 20° and 23° to carbonate-carbonate interactions in CD polyol [80]. On the other hand, the intensities of the diffraction peaks of YPE are higher than the ones of YCD (Table 3) and they are lower than the ones of the corresponding polyols (Table 4), in a greater extent in YPE; this indicates the rupture of some interactions in the polyol chains when they react for obtaining the PUs, in a more noticeable manner in YPE than in YCD. This is also supported by the fact that the diffraction peaks of the PUs are broader, i.e. less crystalline, than the ones of the corresponding polyols (Figure 11). The higher crystallinity of YPE can be ascribed to its shorter and less polydisperse molecular weight distribution (Table 1). This may facilitate the alignment and organization into a more ordered structure in YPE than in YCD, and the lower crystallinity of YCD permits more intensive segmental motions of its polymeric chains which should facilitate the self-healing at 20 °C.
Previous studies [66,76] have shown that TGA curves show differenced thermal degradations of the hard and soft segments in PUs. Figure 12 shows that TGA curves of YCD and YPE differ mainly in the thermal decompositions above 300 °C, the decomposition of YPE is less sudden because of its lower molecular weight.
The differences in the TGA curves of the PUs can be better evidenced in the derivative of the TGA curves (DTGA curves) (Figure 13). The DTGA curve of YCD shows three thermal degradations at 311 °C (likely due to carbonate–carbonate interactions), 340 °C and 363 °C (likely due to hard segments) with weight losses of 87 %, 4 % and 9 % respectively. The thermal degradation at 340 °C in YCD can be ascribed to a mix phase of carbonyl groups of the carbonate and the urethane [72,77]. On the other hand, the DTGA curve of YPE shows two thermal degradations at 300 °C (likely due to ester-ester interactions) and 352 °C (likely due to hard segments) with weight losses of 69 % and 26 % respectively. The assignment of the thermal degradations is based on the DTGA curves of the CD and PE polyols (Figure 13) which show one main thermal degradation at 340 °C and 352 °C respectively; these thermal degradations has been ascribed to carbonate-carbonate and ester-ester interactions respectively [80].
The main thermal degradation of YCD and YPE at 311 °C and 300 °C can be ascribed to the interactions between the soft segments which are more important/stronger in YCD (higher weight loss is obtained). Because the interactions between the soft segments in the PUs are less intensive than in the parent polyols, the temperatures of the thermal decompositions of the PUs at 300-311 °C are lower than the ones of the corresponding polyols (340-352 °C). Whereas the thermal decomposition of the carbonate-carbonate interactions in the CD polyol appears at lower temperature than the one of the ester-ester interactions in the PE polyol, the opposite trend is obtained in the PUs. In addition, the thermal degradations at higher temperature show higher weight losses in YPE, this can be ascribed to the decomposition of the hard segments (urethane and urea) which, according to the curve fitting of the carbonyl stretching of the ATR-IR spectra, are more abundant in YPE than in YCD. In both PUs, the most intensive interactions between the polymeric chains are produced between the soft segments, and YPE shows stronger interactions between the hard segments, which favors micro-phase separation that limits the movement of the chains. This results agree well with the experimental evidences provided by DSC experiments.
Because the different structure of YCD and YPE, they show different viscoelastic properties which were assessed by DMA. In the glassy region, the storage moduli of YCD are higher than the ones of YPE, but the opposite trend is found in the glass transition and rubbery plateau regions (Figure 14). Once the glass transition is reached, the interactions between the polymeric chains of YCD become significantly weaker than in YPE and, thus, the mobility of the polymeric chains is favored in YCD with respect to YPE. The tan delta vs temperature plots of the PUs (Figure 15) shows only one structural relaxation at similar temperature (10 °C for YCD and 9 °C for YPE), the tan delta values in the maxima appear at 0.38 and 0.24 respectively. The higher tan delta value of the structural relaxation of YCD indicates higher loss moduli than in YPE, i.e. more intensive chain mobility due to lower interactions between the polymeric chains. This agrees well with the experimental evidences shown by DSC and TGA.
In summary, YCD has a significant number of free carbonate groups and lower percentage of free and hydrogen-bonded urethane groups than YPE. Furthermore, only YPE shows cold crystallization and YCD exhibits lower degree of phase separation and lower crystallinity than YPE. In addition, higher weight losses are obtained in the thermal degradation of the hard segments and lower tan delta value are found in the structural relaxation of YPE than in YCD. All these findings evidence the existence of more mobile polymeric chains in YCD as well as the existence of a significant number of interactions between the carbonate groups, these two features should favor the self-healing at 20 °C in YCD.
3.3. Surface Properties of the PUs
The structural differences among YCD and YPE are also evidenced on their surface properties. XPS experiments show that both PU surfaces contain 75 at.% carbon, but they differ in the amounts of oxygen (24.6 at.% on YCD surface and 23 at.% on YPE surface) and nitrogen (0.4 at.% on YCD surface and 2 at.% on YPE surface). Therefore, YCD surface is more enriched in oxygen (likely due to higher atomic oxygen content in carbonate groups than in ester groups) and less enriched in nitrogen than YPE surface.
The curve fittings of the high resolution N1s photopeaks of the two PU surfaces show one contribution only at binding energy of 400.0 eV due to -NH-COO- species of urethane and urea, the amount of this species is higher in YPE.
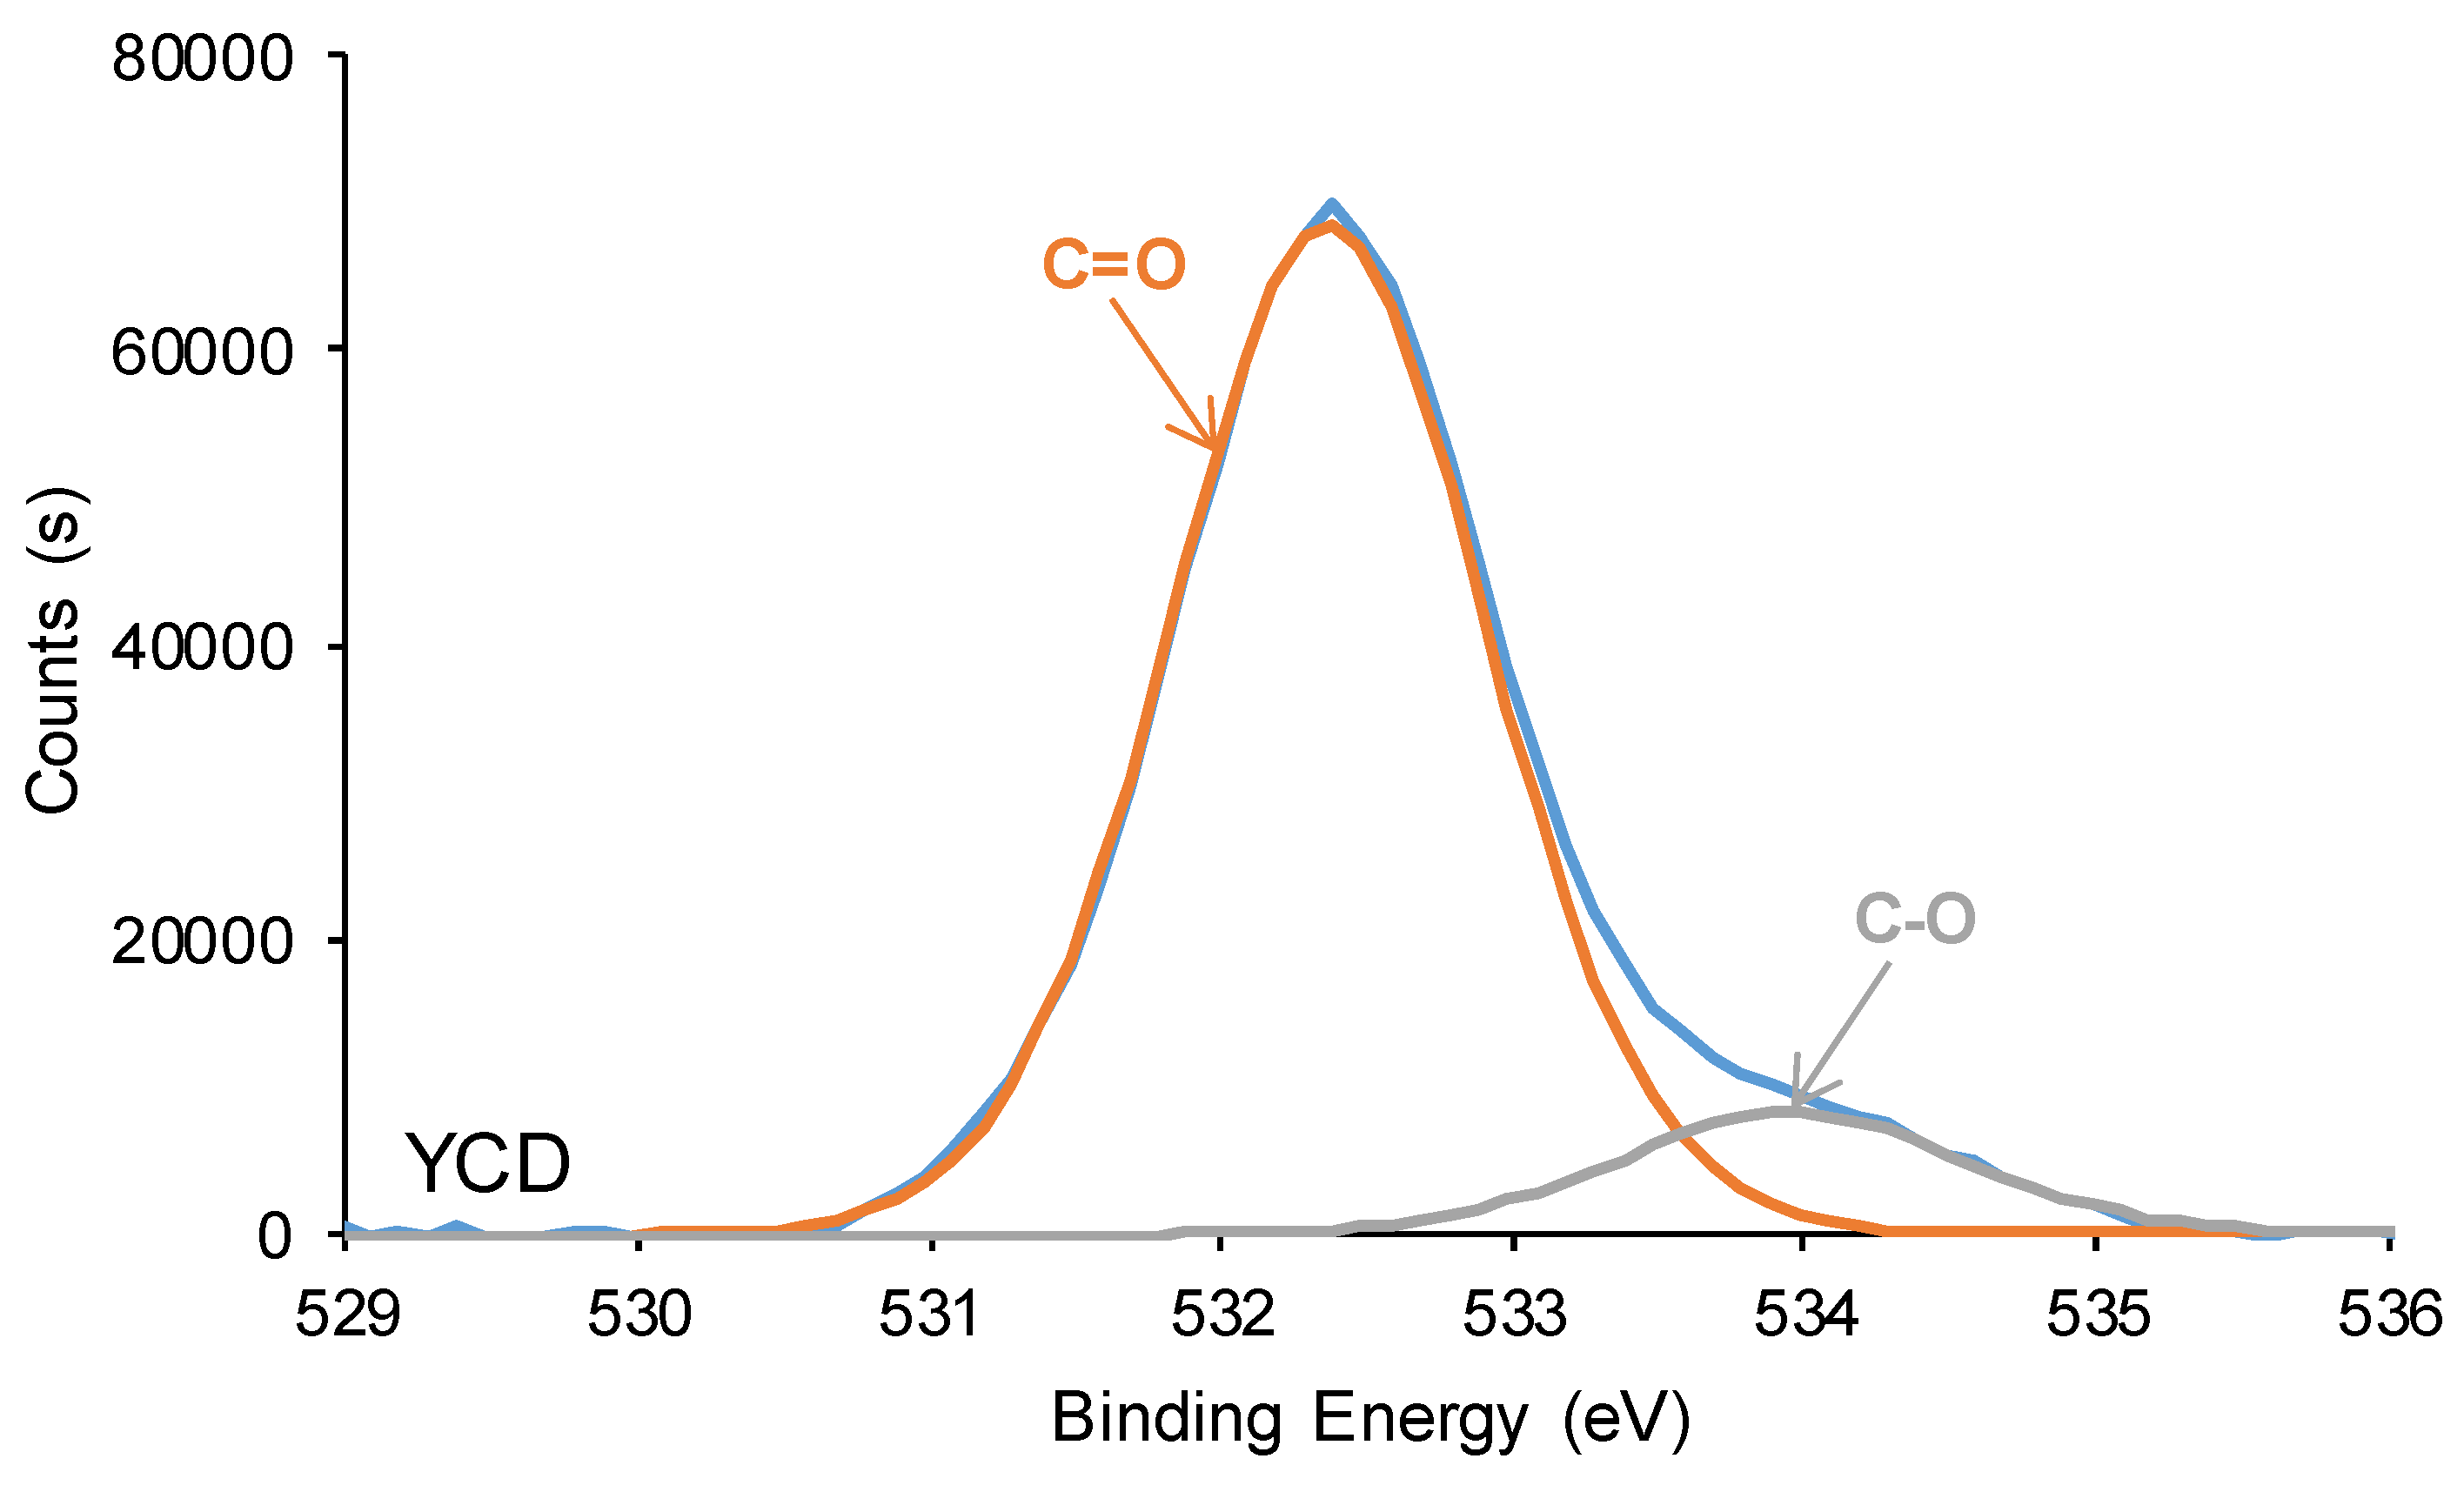
The curve fitting of the high resolution O1s photopeak of YPE shows 1 at.% -NH-COO- species at binding energy of 530.8 eV (Figure 16), and both PU surfaces exhibit different percentages of C-O and C=O species. Thus, the C=O content on YCD surface is significantly higher (88 at.%) than on YPE surface (69 at.%), both species appear at similar binding energies (532.3-532.4 eV). The differences in the percentages of C=O species on the PU surfaces are due to the presence of free carbonate groups in YCD. Furthermore, lower C-O content exists on YCD surface (12 at.%) than on YPE surface (30 at.%), this species appears at a slightly higher binding energy (534.0 eV) on YPC surface than on YPE surface (533.6 eV). Therefore, the XPS experiments of the PU surfaces show the same trends than the ATR-IR spectra of the PUs.
The curve fitting of the high resolution C1s photopeaks of YPC and YPD surfaces show the existence of C-C (binding energy = 284.9 eV), C-O (binding energy = 285.5-285.6 eV), C-N (binding energy = 286.6-286.9 eV) and C=O (binding energy = 289.1-289.2 eV) species (Figure 17, Table 5), the carbonate groups (binding energy = 290.8 eV) only appears on YCD surface. YCD surface shows higher C-C and C-O contents and lower C-N and C=O contents than YPE surface, due to the existence of higher amount of urethane/urea and ester species on YPE surface. Therefore, the mobility of the soft segments on YCD surface is significantly higher than the one on YPE surface, this should favor the dynamic exchange between polar groups in YCD. On the other hand, the higher amount of urethane/urea and ester species on YPE surface with respect to YCD surface is also confirmed by the significantly lower ethylene glycol contact angle value on YPE surface (59°) than on YCD surface (84°). These findings agree well with the ones derived from ATR-IR, DSC and TGA because the higher amount of urethane/urea groups on YPE surface facilitates the formation of hydrogen bonds between them and causes the formation of a more ordered phase in the hard segments than on YCD surface. In turn, the polymeric chains movement of YPE would be less favored than in YCD, and this is associated to the absence of self-healing at 20 °C in YPE. Furthermore, the existence of carbonate-carbonate interactions in the soft segments of YCD should favour self-healing.
3.4. Mechanical Properties of the PUs
The mechanical properties are important in PUs and they are influenced by their structure. The stress-strain curves of YCD and YPE are significantly different (Figure 18). YPE shows a typical stress-strain curve of a stiff thermoplastic material, i.e. somewhat high Young modulus (1.7 MPa) and high tensile strength (3.8 MPa), and low elongation-at-break (50 %). However, YCD shows the typical stress-strain curve of an elastomeric material, i.e. low tensile strength (0.6 MPa) and elongation-at-break higher than 1120 %. Thus, the mechanical properties confirm the existence of higher amount of urethane/urea and ester species in YPE, and the higher mobility of the soft segments in YCD as well, this would favor the self-healing of YCD.
4. Conclusions
Two PUs with similar low hard segments content (22-23 wt.%) were synthesized under the same experimental conditions, they only differ in the chemical nature of the polyol (polycarbonate diol, polyester). Whereas the PU made with polycarbonate diol polyol showed intrinsic self-healing at 20 °C, the one made with polyester polyol did not. The self-healing of YCD was not due to the existence of tack nor to dynamic covalent bonds nor to extensive hydrogen bonding, but to the existence of a significant number of free carbonate groups in the soft segments and intensive segmental mobility of the polymeric chains.
The structural characterization showed a significant number of free carbonate groups and smaller percentage of free and hydrogen-bonded urethane groups in YCD with respect to YPE. Furthermore, only YPE showed cold crystallization and YCD exhibited lower degree of phase separation and lower crystallinity than YPE. In addition, higher weight losses were obtained in the thermal degradation of the hard segments and lower tan delta values were found in the structural relaxation of YPE than in YCD. Whereas the mechanical properties of YPE corresponded to a stiff thermoplastic material, the ones of YCD corresponded to an elastomeric material. All these findings evidenced the existence of mobile polymeric chains in YCD as well as the existence of a significant number of carbonate groups in the soft segments, these two features favored the intrinsic self-healing at 20 °C.
On the basis of the above findings, the proposed mechanism of the intrinsic self-healing at 20 °C of YCD is the existence of non-covalent dynamic exchange interactions of the carbonate groups in the soft segment (Figure 19). YCD showed a significant number of free carbonate groups and also carbonate-carbonate interactions. When a damage is produced, the rupture of the carbonate-carbonate interactions was produced. In a short time, because of the high mobility of the soft segments in YCD and the strong interaction between carbonate groups in the soft segments, the initially bonded carbonate groups interacted with initially free carbonate groups, the formation of a significant number of new carbonate-carbonate interactions was produced, and a fast intrinsic self-healing at 20 °C was produced.
Author Contributions
Conceptualization, J.M.M.-M.; methodology, J.M.M.-M.; formal analysis, Y.P.-A. and J.M.M.-M.; investigation, Y.P.-A.; resources, J.M.M.-M.; data curation, Y.P.-A.; writing—original draft preparation, Y.P.-A.; writing—review and editing, J.M.M.-M.; supervision, J.M.M.-M.; project administration, J.M.M.-M.; funding acquisition, J.M.M.-M. All authors have read and agreed to the submission of the manuscript.
Funding
This research received no external funding.
Institutional Review Board Statement
Not applicable.
Data Availability Statement
Not applicable.
Acknowledgments
The authors thank Synthesia (Barcelona, Spain) and UBE Chemical Europe (Castellón, Spain) for supplying the polyols used in this study. The assistance of N. Mateo-Oliveras in carrying out DSC and TGA experiments is acknowledged.
Conflicts of Interest
The authors declare no competing financial interest.
References
- Zhang, M. Q.; Rong, M. Z. Extrinsic and intrinsic approaches to self-healing polymers and polymer composites, John Wiley & Sons, 2022.
- Wen, N.; Song, T.; Ji, Z.; Jiang, D.; Wu, Z.; Wang, Y.; Guo, Z. Recent advancements in self-healing materials: Mechanicals, performances and features. React. Funct. Polym. 2021, 168, 105041. [Google Scholar] [CrossRef]
- Adzima, B. J.; Kloxin, C. J.; Bowman, C. N. Externally triggered healing of a thermoreversible covalent network via self-limited hysteresis heating. Adv. Mater. 2010, 22, 2784–2787. [Google Scholar] [CrossRef] [PubMed]
- Yoshie, N.; Watanabe, M.; Araki, H.; Ishida, K. Thermo-responsive mending of polymers crosslinked by thermally reversible covalent bond: Polymers from bisfuranic terminated poly (ethylene adipate) and tris-maleimide. Polym. Degrad. Stab. 2010, 95, 826–829. [Google Scholar] [CrossRef]
- Fairbanks, B. D.; Singh, S. P.; Bowman, C. N.; Anseth, K. S. Photodegradable, photoadaptable hydrogels via radical-mediated disulfide fragmentation reaction. Macromolecules. 2011, 44, 2444–2450. [Google Scholar] [CrossRef] [PubMed]
- Chang, K.; Jia, H.; Gu, S. Y. A transparent, highly stretchable, self-healing polyurethane based on disulfide bonds. European Polymer Journal. 2019, 112, 822–831. [Google Scholar] [CrossRef]
- Xu, Y.; Chen, D. Self-healing polyurethane/attapulgite nanocomposites based on disulfide bonds and shape memory effect. Mater. Chem. Phys. 2017, 195, 40–48. [Google Scholar] [CrossRef]
- Wang, Z.; Xie, C.; Yu, C.; Fei, G.; Wang, Z.; Xia, H. A facile strategy for self-healing polyurethanes containing multiple metal–ligand bonds. Macromol. Rapid Commun. 2018, 39, 1700678. [Google Scholar] [CrossRef]
- Chen, X.; Dam, M. A.; Ono, K.; Mal, A.; Shen, H.; Nutt, S. R.; Sheran, K.; Wudl, F. A thermally re-mendable cross-linked polymeric material. Science 2002, 295, 1698–1702. [Google Scholar] [CrossRef] [PubMed]
- Ehrhardt, D.; Van Durme, K.; Jansen, J. F.; Van Mele, B.; Van den Brande, N. Self-healing UV-curable polymer network with reversible Diels-Alder bonds for applications in ambient conditions. Polymer 2020, 203, 122762. [Google Scholar] [CrossRef]
- Rajeev, K. K.; Nam, J.; Kim, E.; Kim, Y.; Kim, T. H. A self-healable polymer binder for Si anodes based on reversible Diels–Alder chemistry. Electrochim. Acta 2020, 364, 137311. [Google Scholar] [CrossRef]
- Lü, S.; Gao, C.; Xu, X.; Bai, X.; Duan, H.; Gao, N.; Feng, C.; Xiong, Y.; Liu, M. Injectable and self-healing carbohydrate-based hydrogel for cell encapsulation. ACS Appl. Mater. Interfaces. 2015, 7, 13029–13037. [Google Scholar] [CrossRef] [PubMed]
- Chung, C. M.; Roh, Y. S.; Cho, S. Y.; Kim, J. G. Crack healing in polymeric materials via photochemical [2+2] cycloaddition. Chem. Mater. 2004, 16, 3982–3984. [Google Scholar] [CrossRef]
- Zhu, M.; Jin, H.; Shao, T.; Li, Y.; Liu, J.; Gan, L.; Long, M. Polysaccharide-based fast self-healing ion gel based on acylhydrazone and metal coordination bonds. Mater. Des. 2020, 192, 108723. [Google Scholar] [CrossRef]
- Wei, Z.; Yang, J. H.; Liu, Z. Q.; Xu, F.; Zhou, J. X.; Zrínyi, M.; Osada, Y.; Chen, Y. M. Novel biocompatible polysaccharide-based self-healing hydrogel. Adv. Funct. Mater. 2015, 25, 1352–1359. [Google Scholar] [CrossRef]
- Xiao, G.; Wang, Y.; Zhang, H.; Chen, L.; Fu, S. Facile strategy to construct a self-healing and biocompatible cellulose nanocomposite hydrogel via reversible acylhydrazone. Carbohydr. Polym. 2019, 218, 68–77. [Google Scholar] [CrossRef] [PubMed]
- Qiao, L.; Liu, C.; Liu, C.; Yang, L.; Zhang, M.; Liu, W.; Wang, J.; Jian, X. Self-healing alginate hydrogel based on dynamic acylhydrazone and multiple hydrogen bonds. J. Mater. Sci. 2019, 54, 8814–8828. [Google Scholar] [CrossRef]
- Amamoto, Y.; Kamada, J.; Otsuka, H.; Takahara, A.; Matyjaszewski, K. Repeatable photoinduced self-healing of covalently cross-linked polymers through reshuffling of trithiocarbonate units. Angew. Chem. Int. Ed. 2011, 50, 1660–1663. [Google Scholar] [CrossRef]
- Dong, P.; Cui, K.; Xu, F.; Jiang, T.; Ma, Z. Synthesis of new ionic crosslinked polymer hydrogel combining polystyrene and poly (4-vinyl pyridine) and its self-healing through a reshuffling reaction of the trithiocarbonate moiety under irradiation of ultraviolet light. Polym. Int. 2018, 67, 868–873. [Google Scholar] [CrossRef]
- Yoon, J. A.; Kamada, J.; Koynov, K.; Mohin, J.; Nicolaÿ, R.; Zhang, Y.; Balazs, A. C.; Kowalewski, T.; Matyjaszewski, K. Self-healing polymer films based on thiol–disulfide exchange reactions and self-healing kinetics measured using atomic force microscopy. Macromolecules. 2012, 45, 142–149. [Google Scholar] [CrossRef]
- Canadell, J.; Goossens, H.; Klumperman, B. Self-healing materials based on disulfide links. Macromolecules. 2011, 44, 2536–2541. [Google Scholar] [CrossRef]
- Zheng, X.; Yang, H.; Sun, Y.; Zhang, Y.; Guo, Y. A molecular dynamics simulation on self-healing behavior based on disulfide bond exchange reactions. Polymer. 2021, 212, 123111. [Google Scholar] [CrossRef]
- Liu, M.; Zhong, J.; Li, Z.; Rong, J.; Yang, K.; Zhou, J.; Shen, L.; Gao, F.; Huang, X.; He, H. A high stiffness and self-healable polyurethane based on disulfide bonds and hydrogen bonding. Eur. Polym. J. 2020, 124, 109475. [Google Scholar] [CrossRef]
- Wu, H.; Liu, X.; Sheng, D.; Zhou, Y.; Xu, S.; Xie, H.; Tian, X.; Sun, Y.; Shi, B.; Yang, Y. High performance and near body temperature induced self-healing thermoplastic polyurethane based on dynamic disulfide and hydrogen bonds. Polymer 2021, 214, 123261. [Google Scholar] [CrossRef]
- Lee, S. H.; Shin, S. R.; Lee, D. S. Self-healing of cross-linked PU via dual-dynamic covalent bonds of a Schiff base from cystine and vanillin. Mater. Des. 2019, 172, 107774. [Google Scholar] [CrossRef]
- Imato, K.; Nishihara, M.; Kanehara, T.; Amamoto, Y.; Takahara, A.; Otsuka, H. Self-healing of chemical gels cross-linked by diarylbibenzofuranone-based trigger-free dynamic covalent bonds at room temperature. Angew. Chem. 2012, 124, 1164–1168. [Google Scholar] [CrossRef]
- Cordier, P.; Tournilhac, F.; Soulié-Ziakovic, C.; Leibler, L. Self-healing and thermoreversible rubber from supramolecular assembly. Nature 2008, 451, 977–980. [Google Scholar] [CrossRef] [PubMed]
- Zhao, D.; Feng, M.; Zhang, L.; He, B.; Chen, X.; Sun, J. Facile synthesis of self-healing and layered sodium alginate/polyacrylamide hydrogel promoted by dynamic hydrogen bond. Carbohydr. Polym. 2021, 256, 117580. [Google Scholar] [CrossRef]
- Jiang, L.; Liu, B.; Zhang, J. Novel high-strength thermoplastic starch reinforced by in situ poly (lactic acid) fibrillation. Macromol. Mater. Eng. 2009, 294, 301–305. [Google Scholar] [CrossRef]
- Davydovich, D.; Urban, M. W. Water accelerated self-healing of hydrophobic copolymers. Nat. Commun. 2020, 11, 5743. [Google Scholar] [CrossRef] [PubMed]
- Chen, H.; Hao, B.; Ge, P.; Chen, S. Highly stretchable, self-healing, and 3D printing prefabricatable hydrophobic association hydrogels with the assistance of electrostatic interaction. Polym. Chem. 2020, 11, 4741–4748. [Google Scholar] [CrossRef]
- Li, Y.; Zhou, T.; Yu, Z.; Wang, F.; Shi, D.; Ni, Z.; Chen, M. Effects of surfactant and ionic concentration on properties of dual physical crosslinking self-healing hydrogels by hydrophobic association and ionic interactions. New J. Chem. 2020, 44, 4061–4070. [Google Scholar] [CrossRef]
- Burattini, S.; Greenland, B. W.; Merino, D. H.; Weng, W.; Seppala, J.; Colquhoun, H. M.; Hayes, W.; Mackay, M. E.; Hamley, I. W.; Rowan, S. J. A healable supramolecular polymer blend based on aromatic π− π stacking and hydrogen-bonding interactions. J. Am. Chem. Soc. 2010, 132, 12051–12058. [Google Scholar] [CrossRef] [PubMed]
- Burattini, S.; Greenland, B. W.; Hayes, W.; Mackay, M. E.; Rowan, S. J.; Colquhoun, H. M. A supramolecular polymer based on tweezer-type π−π stacking interactions: Molecular design for healability and enhanced toughness. Chem. Mater. 2011, 23, 6–8. [Google Scholar] [CrossRef]
- Xu, Z.; Peng, J.; Yan, N.; Yu, H.; Zhang, S.; Liu, K.; Fang, Y. Simple design but marvelous performances: Molecular gels of superior strength and self-healing properties. Soft Matter. 2013, 9, 1091–1099. [Google Scholar] [CrossRef]
- Burnworth, M.; Tang, L.; Kumpfer, J. R.; Duncan, A. J.; Beyer, F. L.; Fiore, G. L.; Rowan, S. J.; Weder, C. Optically healable supramolecular polymers. Nature. 2011, 472, 334–337. [Google Scholar] [CrossRef]
- Li, Z.; Shan, Y.; Wang, X.; Li, H.; Yang, K.; Cui, Y. Self-healing flexible sensor based on metal-ligand coordination. Chemical Engineering Journal. 2020, 394, 124932. [Google Scholar] [CrossRef]
- Liu, Y.; Yuan, J.; Zhang, K.; Guo, K.; Yuan, L.; Wu, Y.; Gao, C. A novel type of self-healing silicone elastomers with reversible cross-linked network based on the disulfide, hydrogen and metal-ligand bonds. Prog. Org. Coat. 2020, 144, 105661. [Google Scholar] [CrossRef]
- Liu, J.; Liu, Y.; Wang, Y.; Zhu, J.; Yu, J.; Hu, Z. Disulfide bonds and metal-ligand co-crosslinked network with improved mechanical and self-healing properties. Mater. Today Commun. 2017, 13, 282–289. [Google Scholar] [CrossRef]
- Wang, Q.; Mynar, J. L.; Yoshida, M.; Lee, E.; Lee, M.; Okuro, K.; Kinbara, K.; Aida, T. High-water-content mouldable hydrogels by mixing clay and a dendritic molecular binder. Nature. 2010, 463, 339–343. [Google Scholar] [CrossRef] [PubMed]
- Peng, Y.; Yang, Y.; Wu, Q.; Wang, S.; Huang, G.; Wu, J. Strong and tough self-healing elastomers enabled by dual reversible networks formed by ionic interactions and dynamic covalent bonds. Polymer. 2018, 157, 172–179. [Google Scholar] [CrossRef]
- Tian, X.; Yang, P.; Yi, Y.; Liu, P.; Wang, T.; Shu, C.; Qu, L.; Tang, W.; Zhang, Y.; Li, M.; Yang, B. Self-healing and high stretchable polymer electrolytes based on ionic bonds with high conductivity for lithium batteries. J. Power Sources. 2020, 450, 227629. [Google Scholar] [CrossRef]
- Reisch, A.; Roger, E.; Phoeung, T.; Antheaume, C.; Orthlieb, C.; Boulmedais, F.; Lavalle, P.; Schlenoff, J. B.; Frisch, B.; Schaaf, P. On the benefits of rubbing salt in the cut: Self-healing of saloplastic PAA/PAH compact polyelectrolyte complexes. Adv. Mater. 2014, 26, 2547–2551. [Google Scholar] [CrossRef] [PubMed]
- Yang, Y.; Ding, X.; Urban, M. W. Chemical and physical aspects of self-healing materials. Prog. Polym. Sci. 2015, 49, 34–59. [Google Scholar] [CrossRef]
- Menon, A. V.; Madras, G.; Bose, S. The journey of self-healing and shape memory polyurethanes from bench to translational research. Polym. Chem. 2019, 10, 4370–4388. [Google Scholar] [CrossRef]
- Eyring, H. Viscosity, plasticity, and diffusion as examples of absolute reaction rates. J. Chem. Phys. 1936, 4, 283–291. [Google Scholar] [CrossRef]
- Flory, P. J.; Krigbaum, W. R. Statistical mechanics of dilute polymer solutions. II. J. Chem. Phys. 1950, 18, 1086–1094. [Google Scholar] [CrossRef]
- Simha, R.; Boyer, R. F. On a general relation involving the glass temperature and coefficients of expansion of polymers. J. Chem. Phys. 1962, 37, 1003–1007. [Google Scholar] [CrossRef]
- Grande, A. M.; Bijleveld, J. C.; Garcia, S. J.; Van Der Zwaag, S. A combined fracture mechanical–rheological study to separate the contributions of hydrogen bonds and disulphide linkages to the healing of poly (urea-urethane) networks. Polymer 2016, 96, 26–34. [Google Scholar] [CrossRef]
- Eschweiler, N.; Keul, H.; Millaruelo, M.; Weberskirch, R.; Moeller, M. Synthesis of α, ω-isocyanate telechelic polymethacrylate soft segments with activated ester side functionalities and their use for polyurethane synthesis. Polym. Int. 2014, 63, 114–126. [Google Scholar] [CrossRef]
- Poljanšek, I.; Fabjan, E.; Moderc, D.; Kukanja, D. The effect of free isocyanate content on properties of one component urethane adhesive. Int. J. Adhes. Adhes. 2014, 51, 87–94. [Google Scholar] [CrossRef]
- Qi, H. J.; Boyce, M. C. Stress–strain behavior of thermoplastic polyurethanes. Mech. Mat. 2005, 37, 817–839. [Google Scholar] [CrossRef]
- Yilgör, I.; Yilgör, E.; Wilkes, G. L. Critical parameters in designing segmented polyurethanes and their effect on morphology and properties: A comprehensive review. Polymer 2015, 58, A1–A36. [Google Scholar] [CrossRef]
- Yu, K.; Xin, A.; Feng, Z.; Lee, K. H.; Wang, Q. Mechanics of self-healing thermoplastic elastomers. J. Mech. Phys. Solids. 2020, 137, 103831. [Google Scholar] [CrossRef]
- Aguirresarobe, R. H.; Nevejans, S.; Reck, B.; Irusta, L.; Sardon, H.; Asua, J. M.; Ballard, N. Healable and self-healing polyurethanes using dynamic chemistry. Prog. Polym. Sci. 2021, 114, 101362. [Google Scholar] [CrossRef]
- Cho, J. W.; Kim, J. W.; Jung, Y. C.; Goo, N. S. Electroactive shape-memory polyurethane composites incorporating carbon nanotubes. Macromol. Rapid Commun. 2005, 26, 412–416. [Google Scholar] [CrossRef]
- Xu, Y.; Chen, D. A novel self-healing polyurethane based on disulfide bonds. Macromol. Chem. Phys. 2016, 217, 1191–1196. [Google Scholar] [CrossRef]
- Xu, Y.; Chen, D. Shape memory-assisted self-healing polyurethane inspired by a suture technique. J. Mater. Sci. 2018, 53, 10582–10592. [Google Scholar] [CrossRef]
- Ha, Y. M.; Kim, Y. O.; Ahn, S.; Lee, S. K.; Lee, J. S.; Park, M.; Chung, J. W.; Jung, Y. C. Robust and stretchable self-healing polyurethane based on polycarbonate diol with different soft-segment molecular weight for flexible devices. Eur. Polym. J. 2019, 118, 36–44. [Google Scholar] [CrossRef]
- Sijbesma, R. P.; Beijer, F. H.; Brunsveld, L.; Folmer, B. J.; Hirschberg, J. K.; Lange, R. F. : Lowe, J. K. L.; Meijer, E. W. Reversible polymers formed from self-complementary monomers using quadruple hydrogen bonding. Science 1997, 278, 1601–1604. [Google Scholar] [CrossRef]
- Shamiryan, D.; Abell, T.; Iacopi, F.; Maex, K. Low-k dielectric materials. Materials Today. 2004, 7, 34–39. [Google Scholar] [CrossRef]
- Merino, D. H.; Slark, A. T.; Colquhoun, H. M.; Hayes, W.; Hamley, I. W. Thermo-responsive microphase separated supramolecular polyurethanes. Polym. Chem. 2010, 1, 1263–1271. [Google Scholar] [CrossRef]
- Gooch, A.; Nedolisa, C.; Houton, K. A.; Lindsay, C. I.; Saiani, A.; Wilson, A. J. Tunable self-assembled elastomers using triply hydrogen-bonded arrays. Macromolecules. 2012, 45, 4723–4729. [Google Scholar] [CrossRef]
- Feula, A.; Pethybridge, A.; Giannakopoulos, I.; Tang, X.; Chippindale, A.; Siviour, C. R.; Buckley, C. P.; Hamley, I. W.; Hayes, W. A thermoreversible supramolecular polyurethane with excellent healing ability at 45 C. Macromolecules 2015, 48, 6132–6141. [Google Scholar] [CrossRef]
- Jing, T.; Heng, X.; Guifeng, X.; Li, L.; Li, P.; Guo, X. Rapid self-healing and tough polyurethane based on the synergy of multi-level hydrogen and disulfide bonds for healing propellant microcracks. Mater. Chem. Front. 2022, 6, 1161–1171. [Google Scholar] [CrossRef]
- García-Pacios, V.; Costa, V.; Colera, M.; Martín-Martínez, J. M. Affect of polydispersity on the properties of waterborne polyurethane dispersions based on polycarbonate polyol. Int. J. Adhes. Adhes. 2010, 30, 456–465. [Google Scholar] [CrossRef]
- Kim, S. M.; Jeon, H.; Shin, S. H.; Park, S. A.; Jegal, J.; Hwang, S. Y.; Oh, D. X.; Park, J. Superior toughness and fast self-healing at room temperature engineered by transparent elastomers. Adv. Mater. 2018, 30, 1705145. [Google Scholar] [CrossRef] [PubMed]
- Chen, C.; Duan, N.; Chen, S.; Guo, Z.; Hu, J.; Guo, J.; Chen, Z.; Yang, L. Synthesis, mechanical properties and self-healing behavior of aliphatic polycarbonate hydrogels based on cooperation hydrogen bonds. Journal of Molecular Liquids 2020, 319, 114134. [Google Scholar] [CrossRef]
- Han, S.; Hu, Z.; Zhang, W.; Hu, J.; Yang, L. Flexible segments regulating the gelation behaviours of aliphatic polycarbonate gels with excellent shape memory and self-healing properties. Journal of Molecular Liquids 2022, 364, 120015. [Google Scholar] [CrossRef]
- Zhang, W.; Chen, S.; Chen, S.; Wang, G.; Han, S.; Guo, J.; Yang, L.; Hu, J. Physical cross-linked aliphatic polycarbonate with shape-memory and self-healing properties. Journal of Molecular Liquids 2023, 381, 121798. [Google Scholar] [CrossRef]
- Yang, G. W.; Zhang, Y. Y.; Wang, Y.; Wu, G. P.; Xu, Z. K.; Darensbourg, D. J. Construction of autonomic self-healing CO2-based polycarbonates via one-pot tandem synthetic strategy. Macromolecules 2018, 51, 1308–1313. [Google Scholar] [CrossRef]
- Matějka, L.; Špírková, M.; Dybal, J.; Kredatusová, J.; Hodan, J.; Zhigunov, A.; Šlouf, M. Structure evolution during order–disorder transitions in aliphatic polycarbonate based polyurethanes. Self-healing polymer. Chemical Engineering Journal 2019, 357, 611–624. [Google Scholar] [CrossRef]
- Li, S.; Zhang, J.; Chen, J.; Yao, M.; Liu, X.; Jiang, Z. Self-healing polycarbonate-based polyurethane with shape memory behavior. Macromol. Res. 2019, 27, 649–656. [Google Scholar] [CrossRef]
- Colera-Llavata, M.; Costa-Vayá, V.; Jofre-Reche, J.A.; Martín-Martínez, J.M. Self-healing polyurethane polymers. 2016, Patent. EP 3103846 A1, Europe.
- Paez-Amieva, Y.; Carpena-Montesinos, J.; Martín-Martínez, J. M. Innovative device and procedure for in situ quantification of the self-healing ability and kinetics of self-healing of polymeric materials. Polymers 2023, 15, 2152. [Google Scholar] [CrossRef]
- Fuensanta, M.; Martín-Martínez, J.M. Thermoplastic polyurethane coatings made with mixtures of polyethers of different molecular weights with pressure sensitive adhesion property. Prog. Org. Coat. 2018, 118, 148–156. [Google Scholar] [CrossRef]
- Niemczyk, A.; Piegat, A.; Olalla, Á. S.; El Fray, M. New approach to evaluate microphase separation in segmented polyurethanes containing carbonate macrodiol. Eur. Polym. J. 2017, 93, 182–191. [Google Scholar] [CrossRef]
- Princi, E.; Vicini, S.; Castro, K.; Capitani, D.; Proietti, N.; Mannina, L. On the micro-phase separation in waterborne polyurethanes. Macromol. Chem. Phys. 2009, 210, 879–889. [Google Scholar] [CrossRef]
- Fuensanta, M.; Khoshnood, A.; Martín-Martínez, J.M. Structure–properties relationship in waterborne poly(urethane-urea)s synthesized with dimethylolpropionic acid (DMPA) internal emulsifier added before, during and after prepolymer formation. Polymers 2020, 12, 2478. [Google Scholar] [CrossRef] [PubMed]
- Paez-Amieva, Y.; Martín-Martínez, J. M. Understanding the interactions between soft segments in polyurethanes: Structural synergies in blends of polyester and polycarbonate diol polyols. Polymers 2023, 15, 4494. [Google Scholar] [CrossRef]
Figure 1.
Diagram of the principle for measuring the self-healing and the kinetics of self-healing at 20 °C of the PUs.
Figure 1.
Diagram of the principle for measuring the self-healing and the kinetics of self-healing at 20 °C of the PUs.
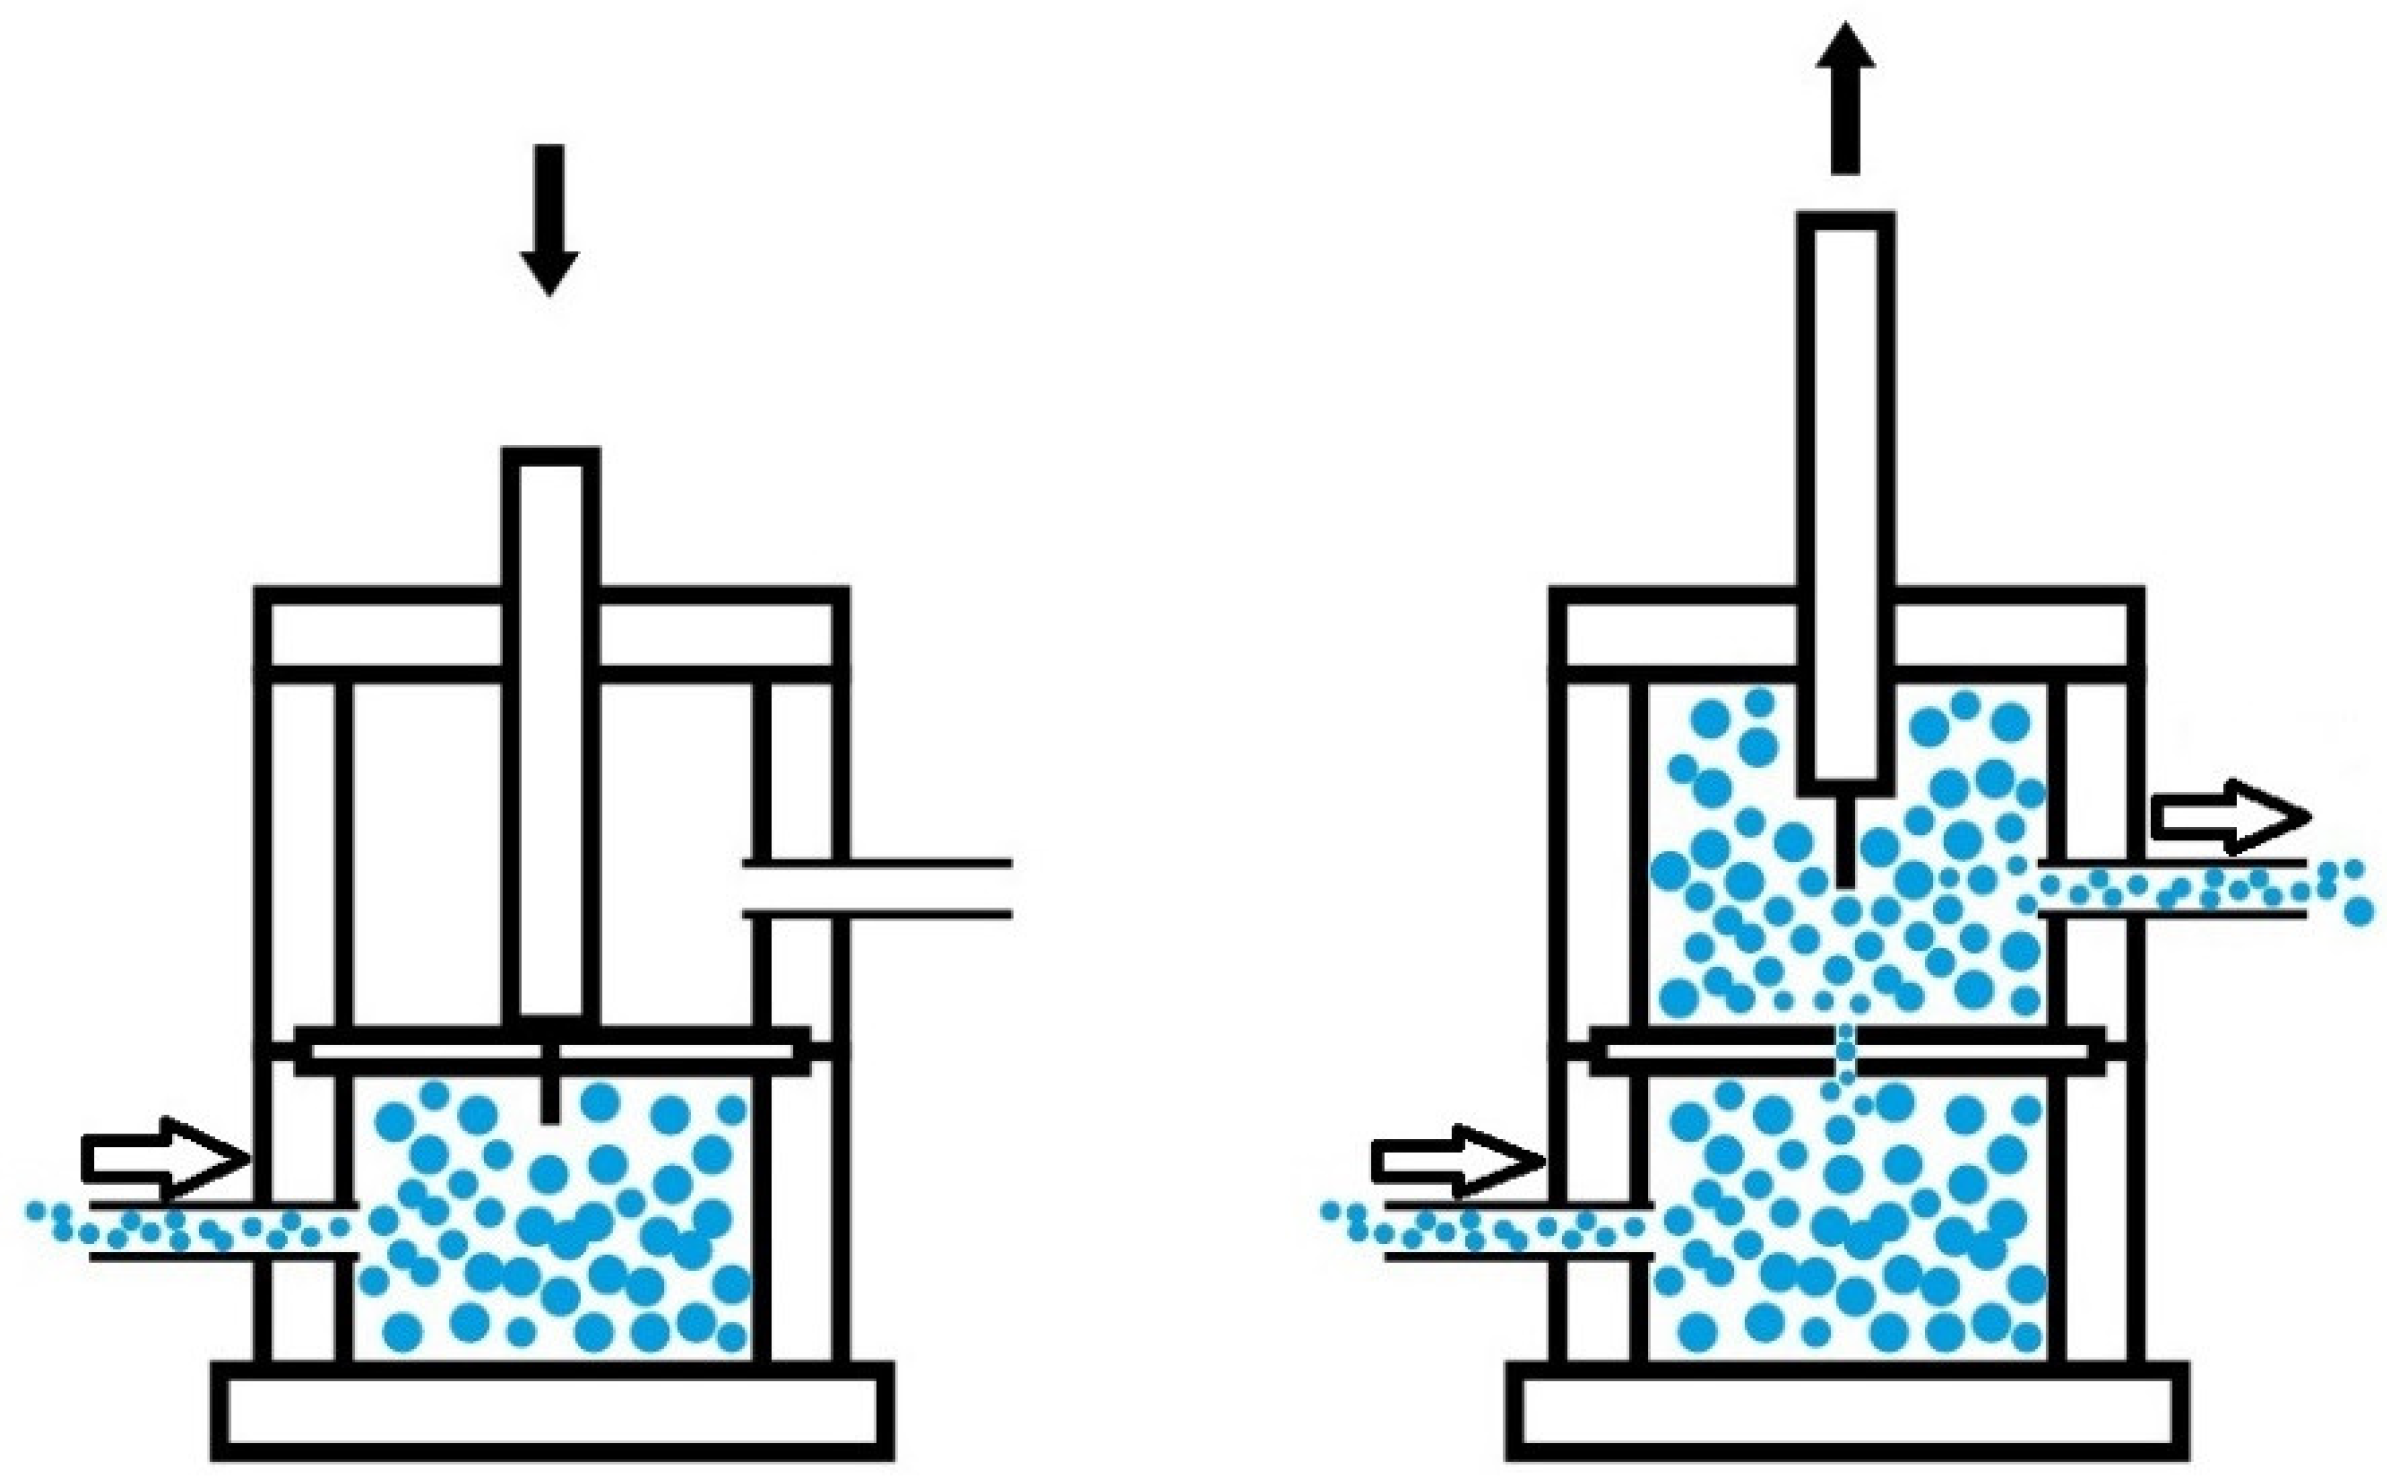
Figure 2.
Kinetics of self-healing at room temperature of the PUs.
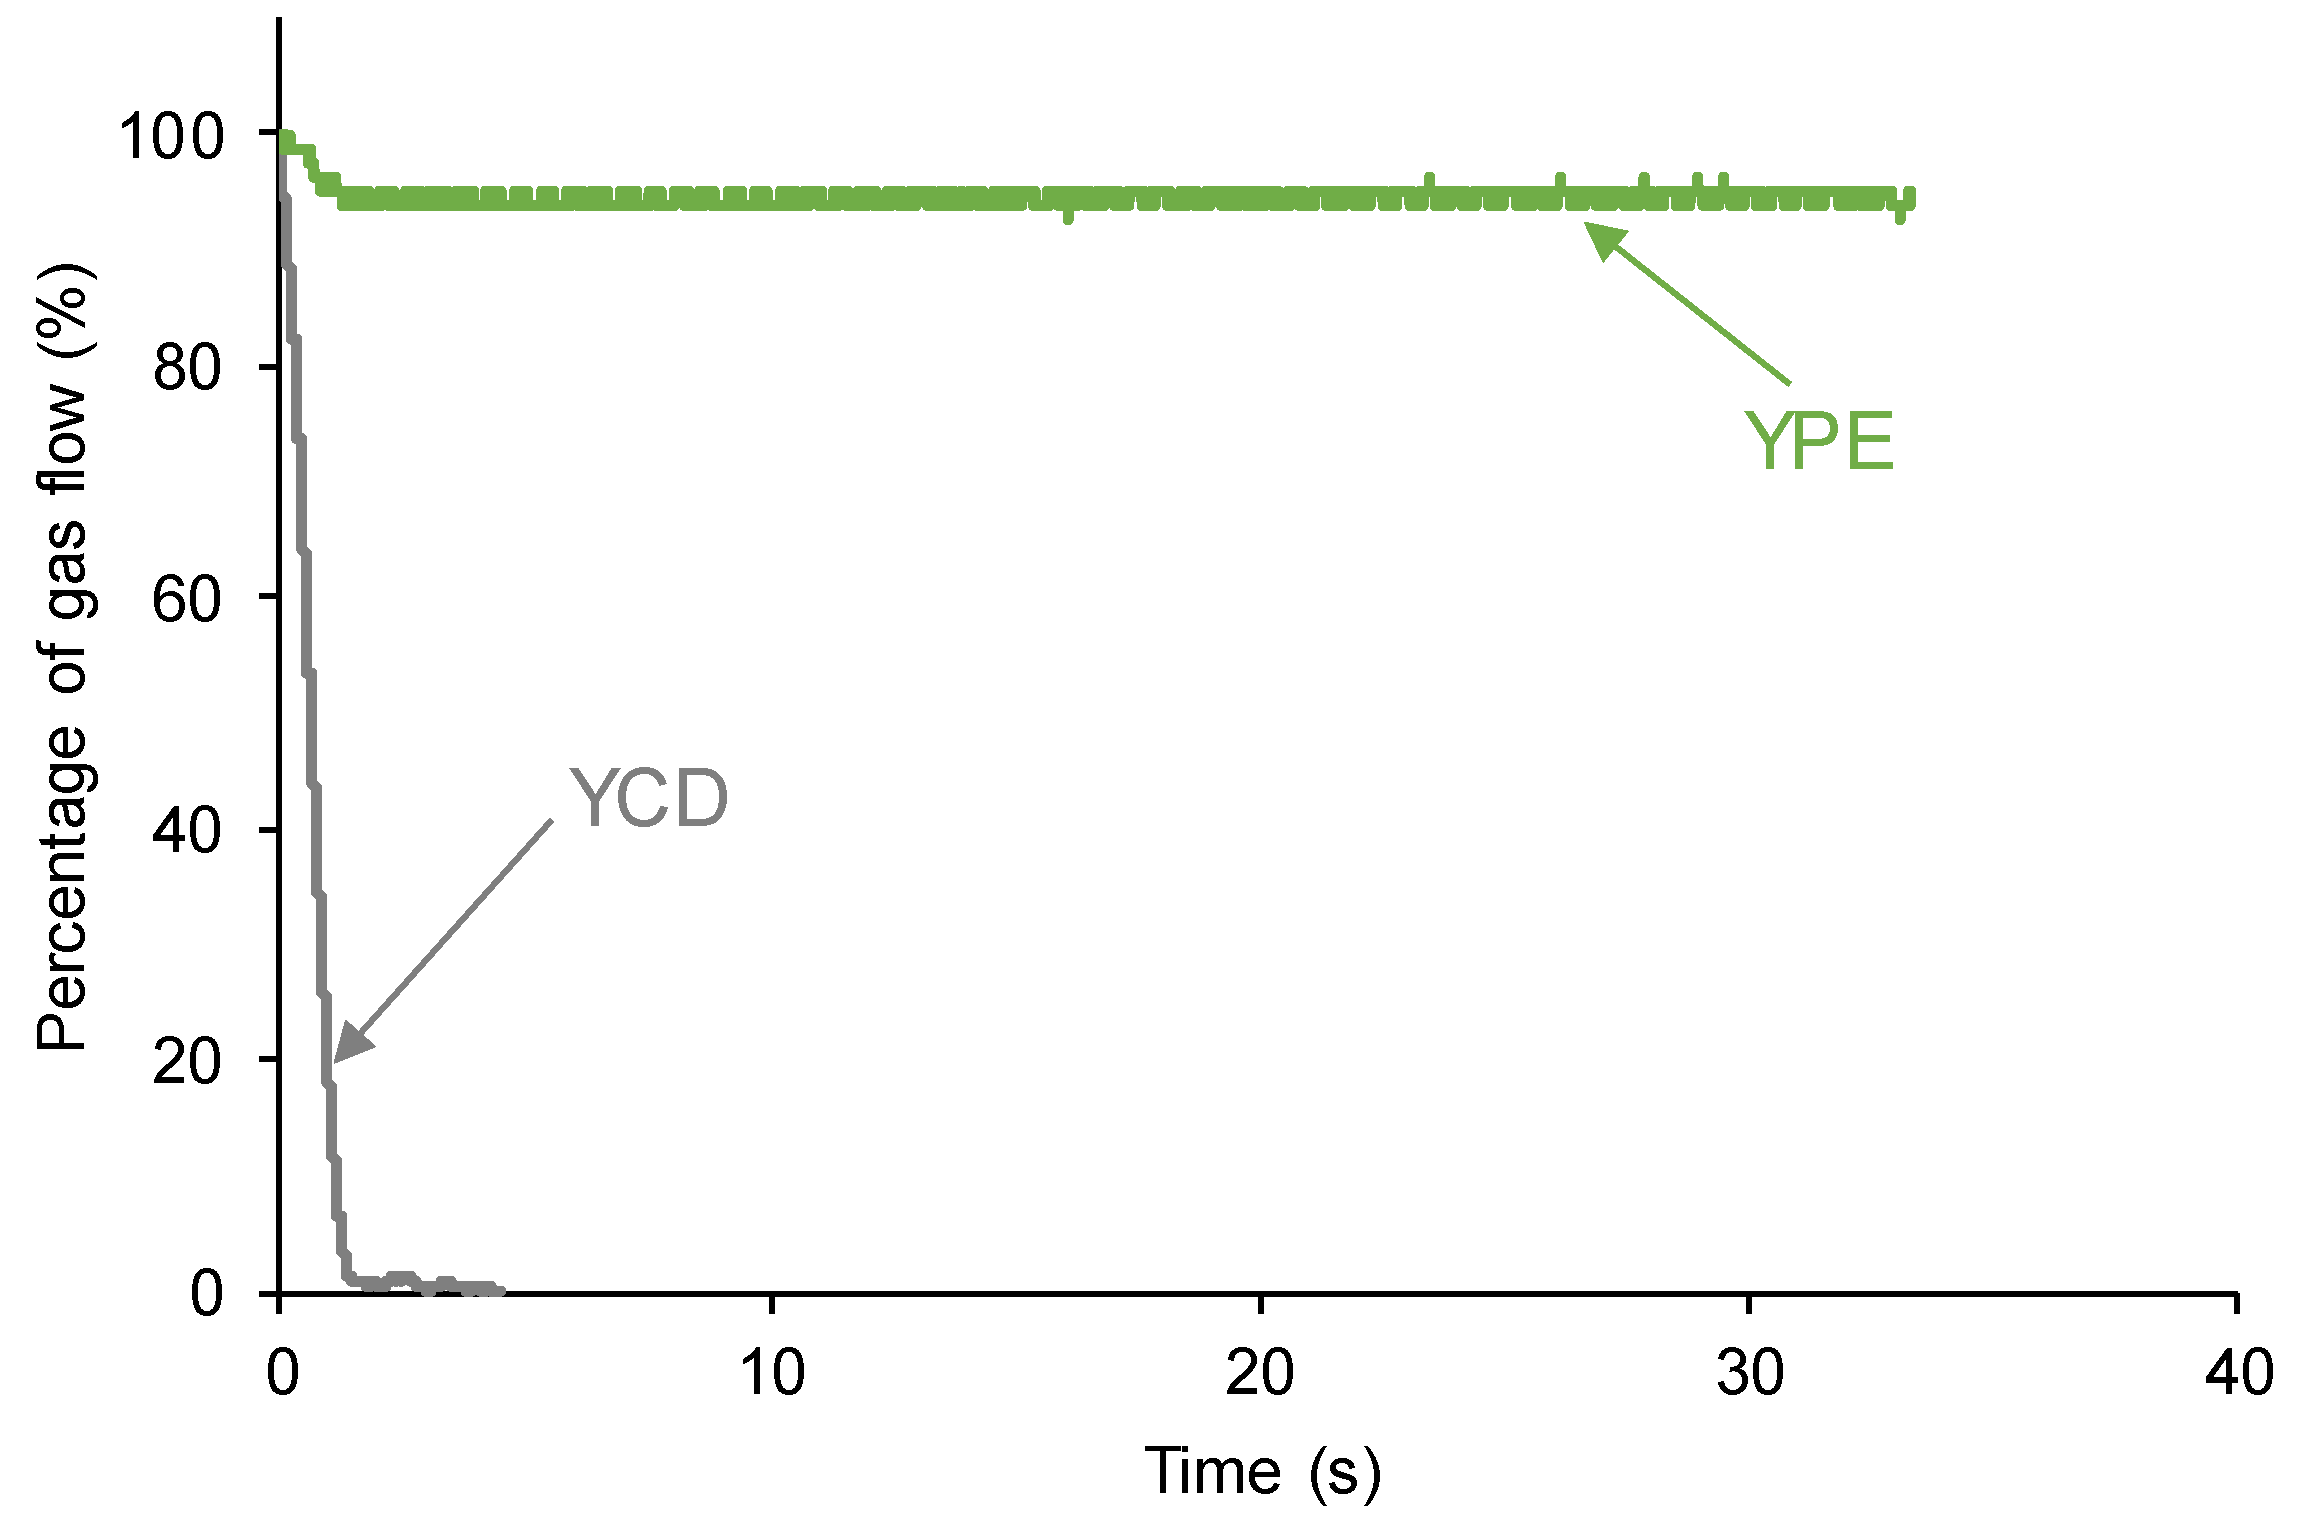
Figure 3.
Variation of the stress at 20 °C as a function of the displacement for the PUs. Probe tack test.
Figure 3.
Variation of the stress at 20 °C as a function of the displacement for the PUs. Probe tack test.
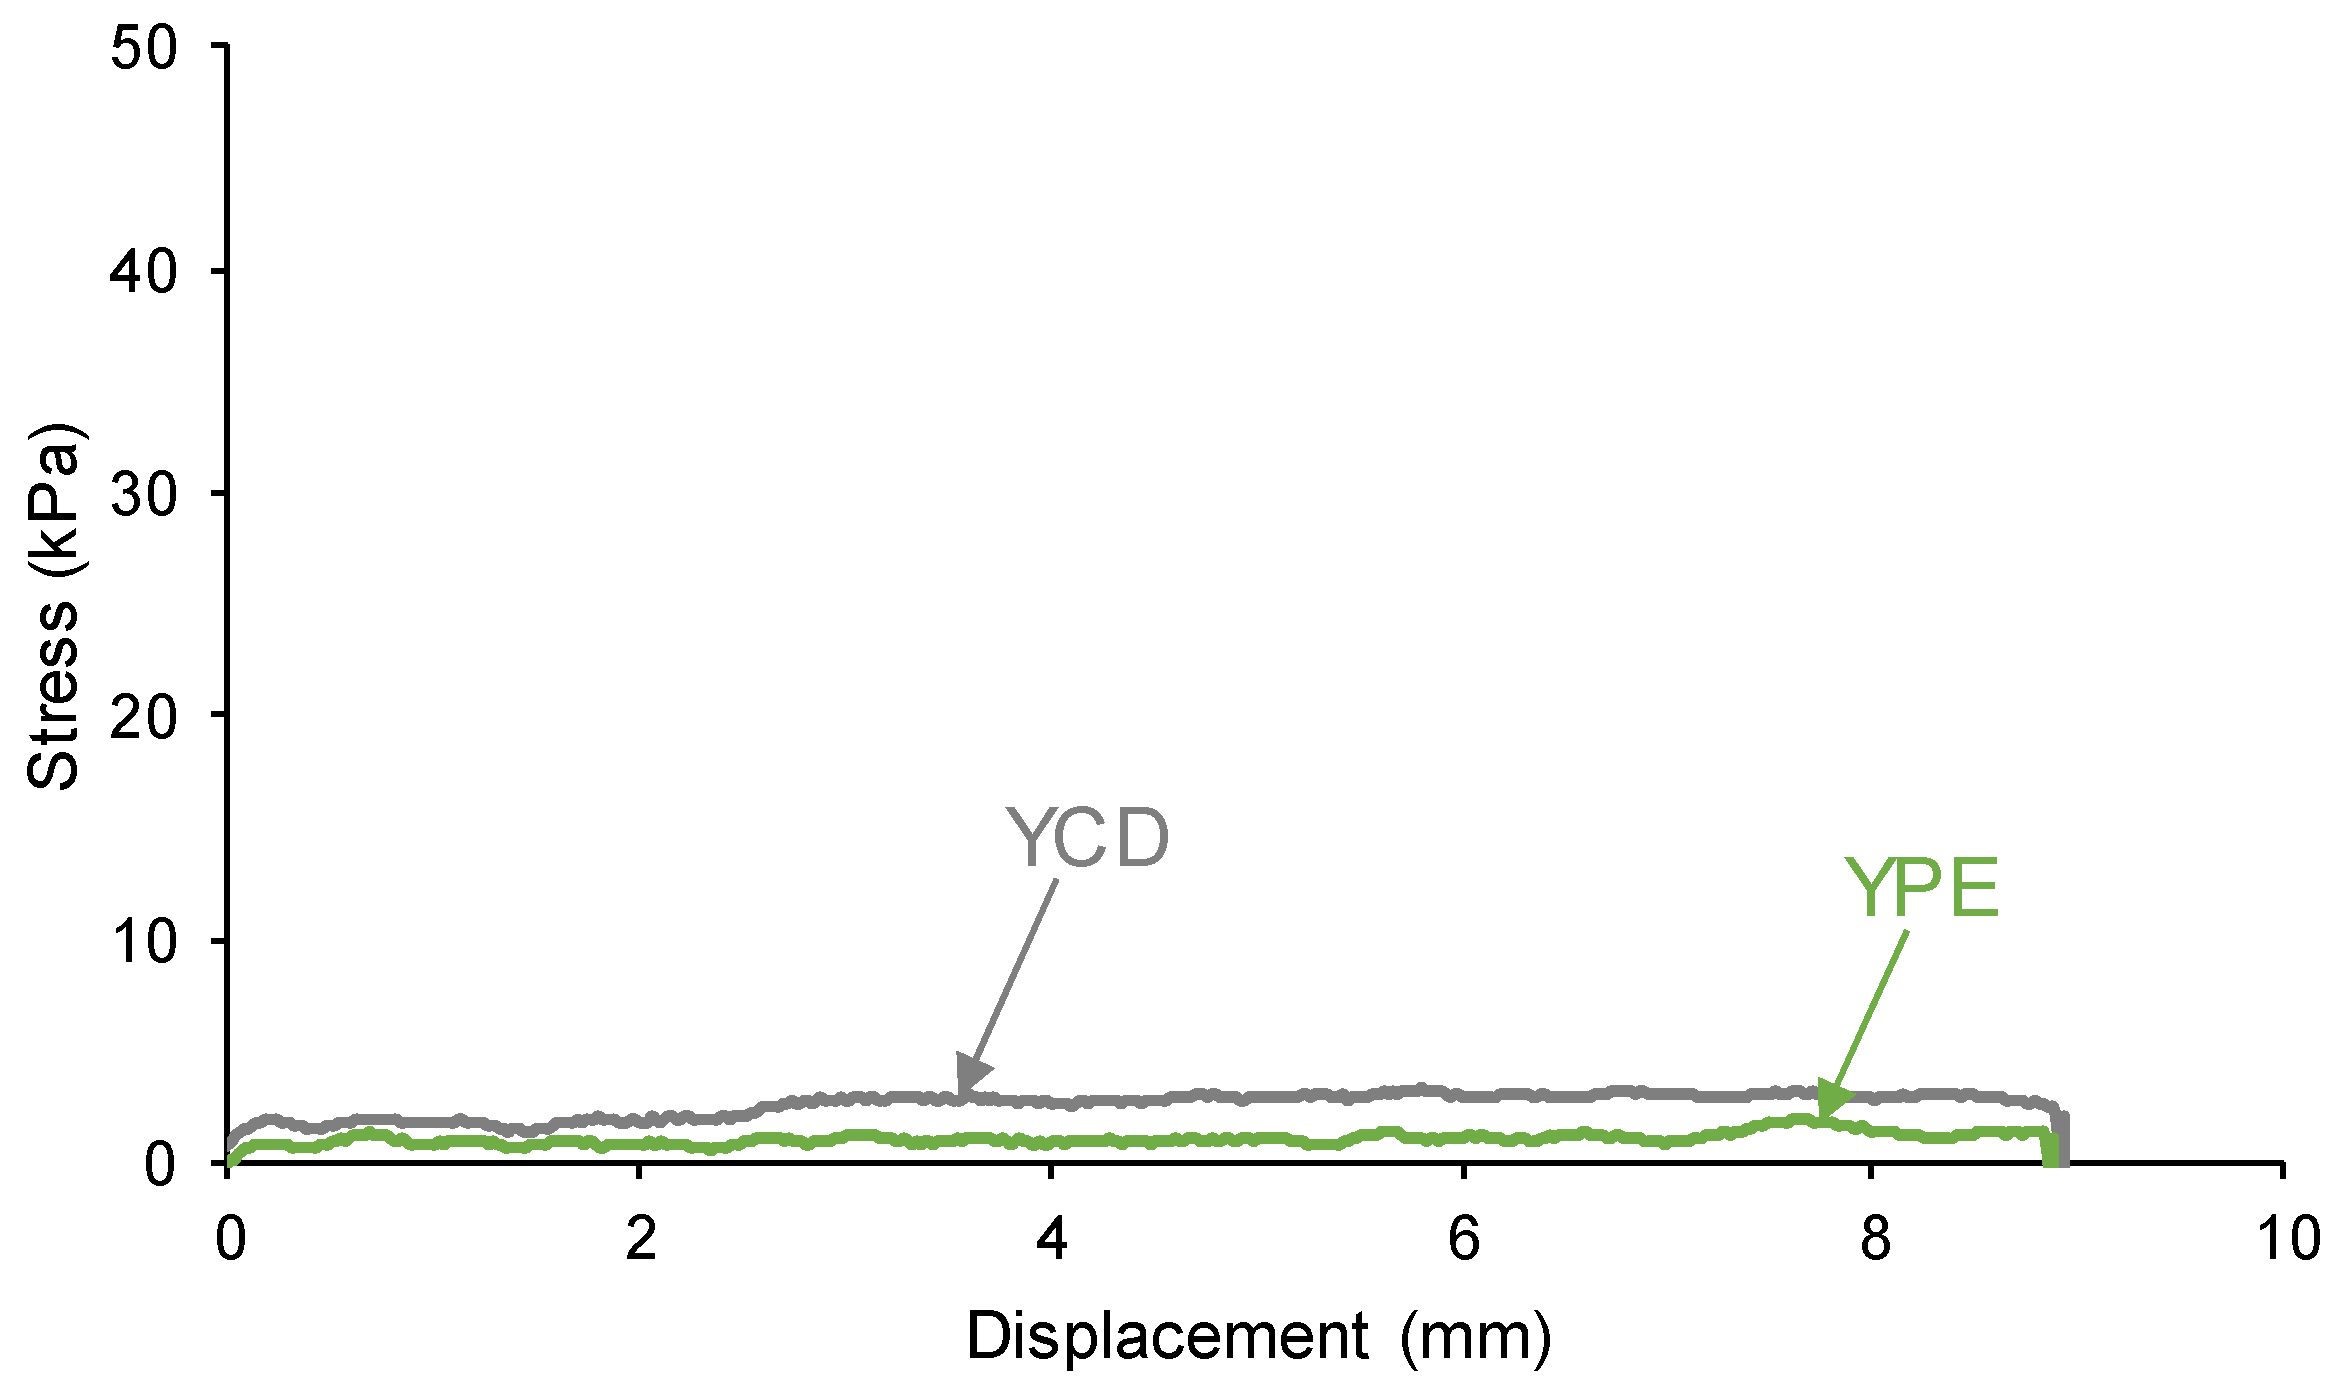
Figure 4.
Potential interactions between polar groups in the soft segments of YCD.
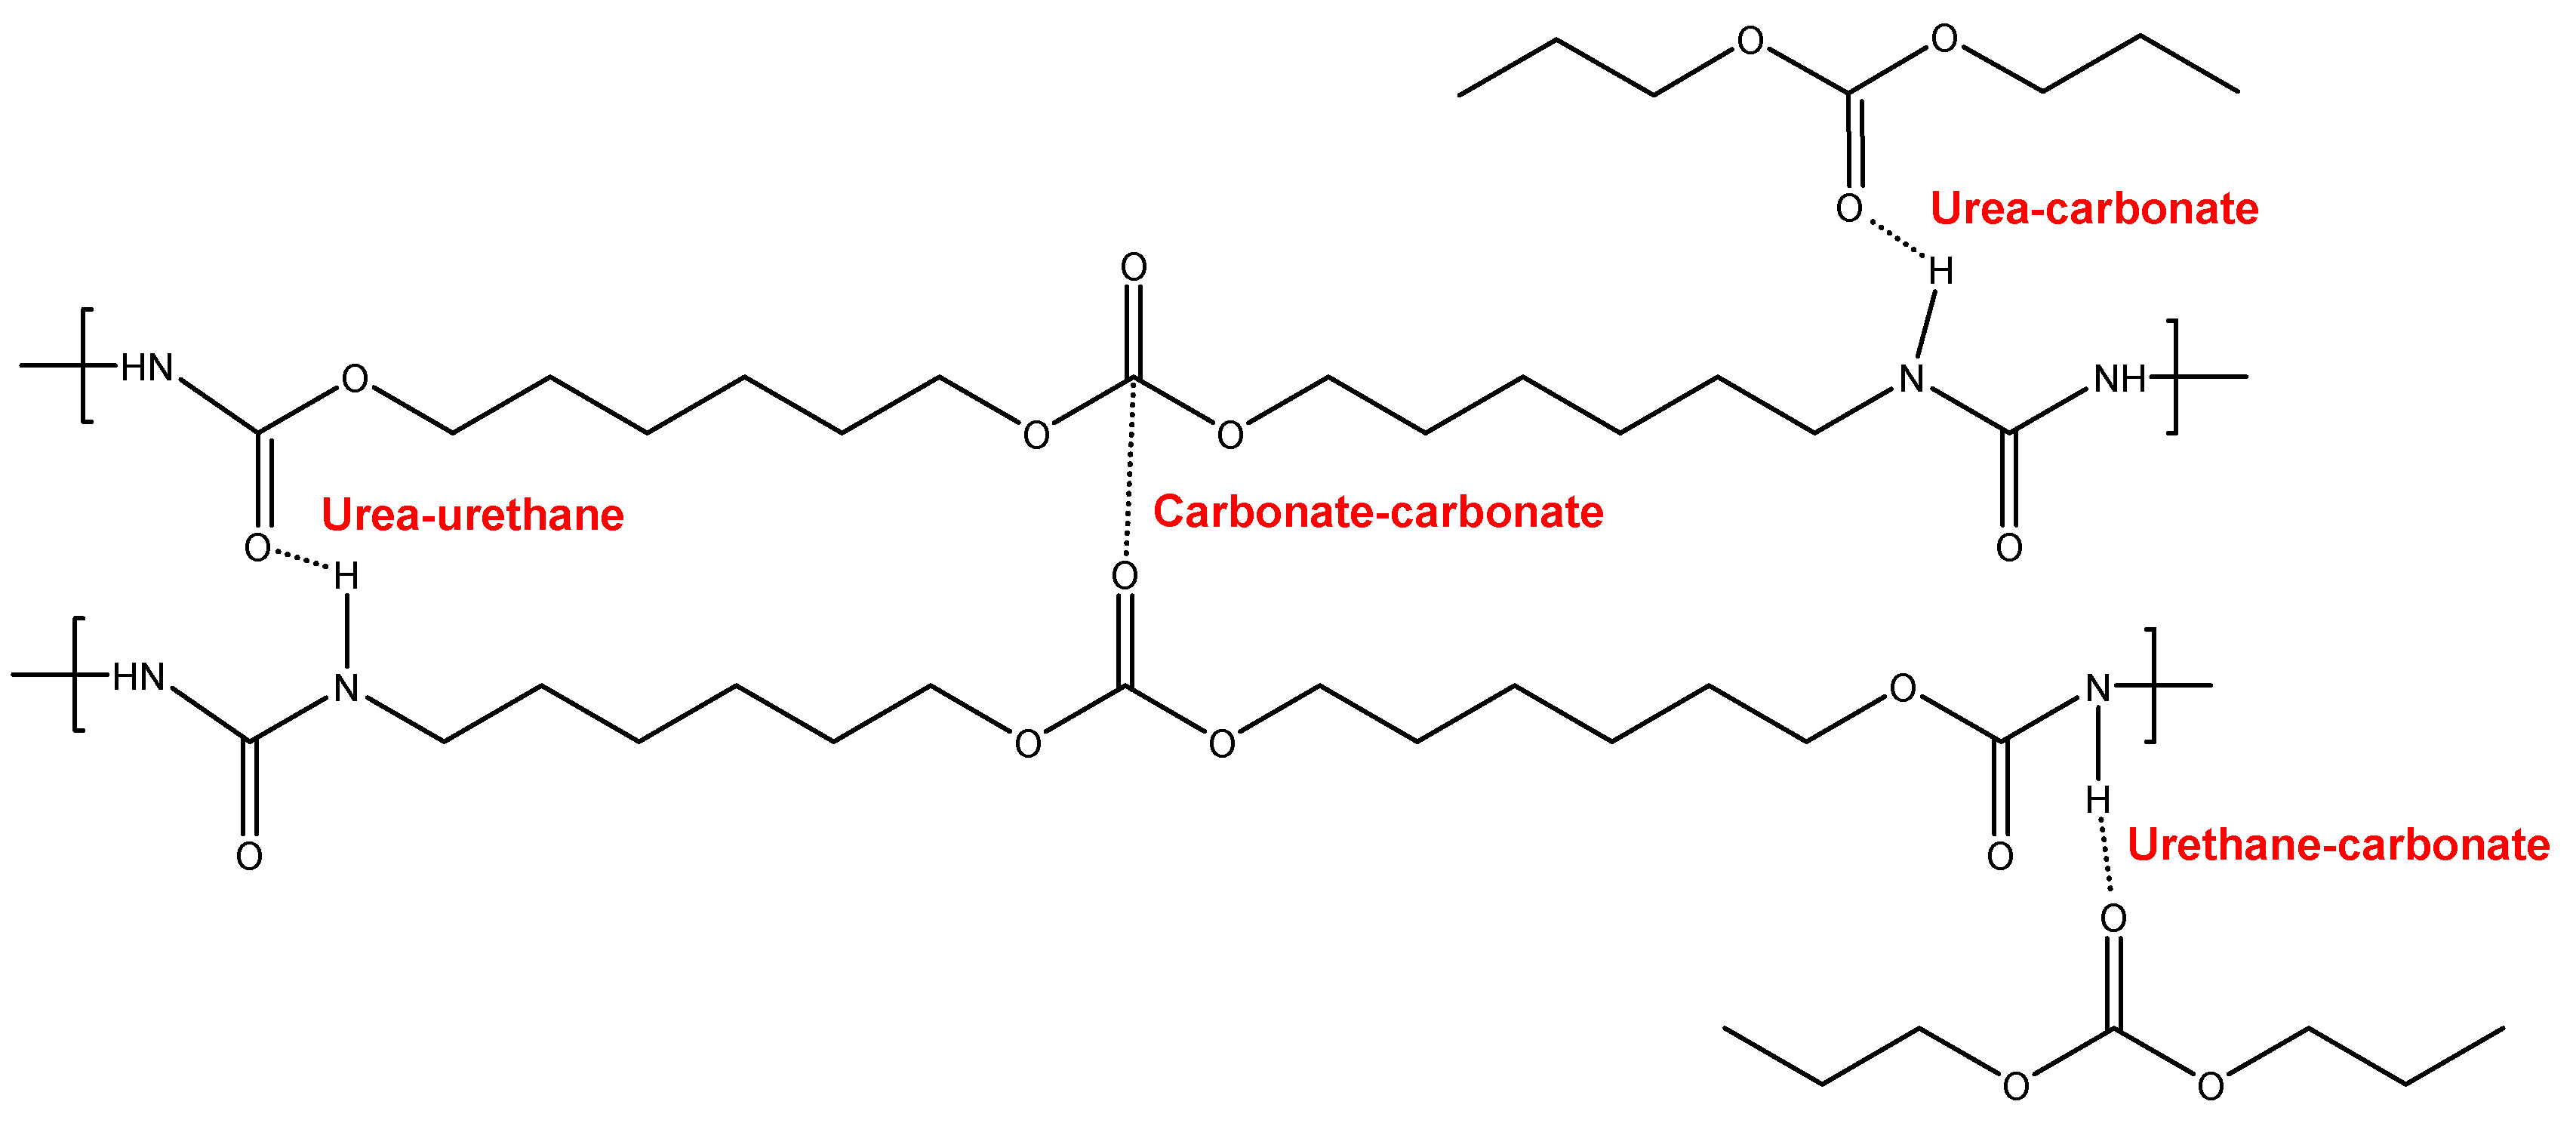
Figure 5.
Potential interactions between polar groups in the soft segments of YPE.
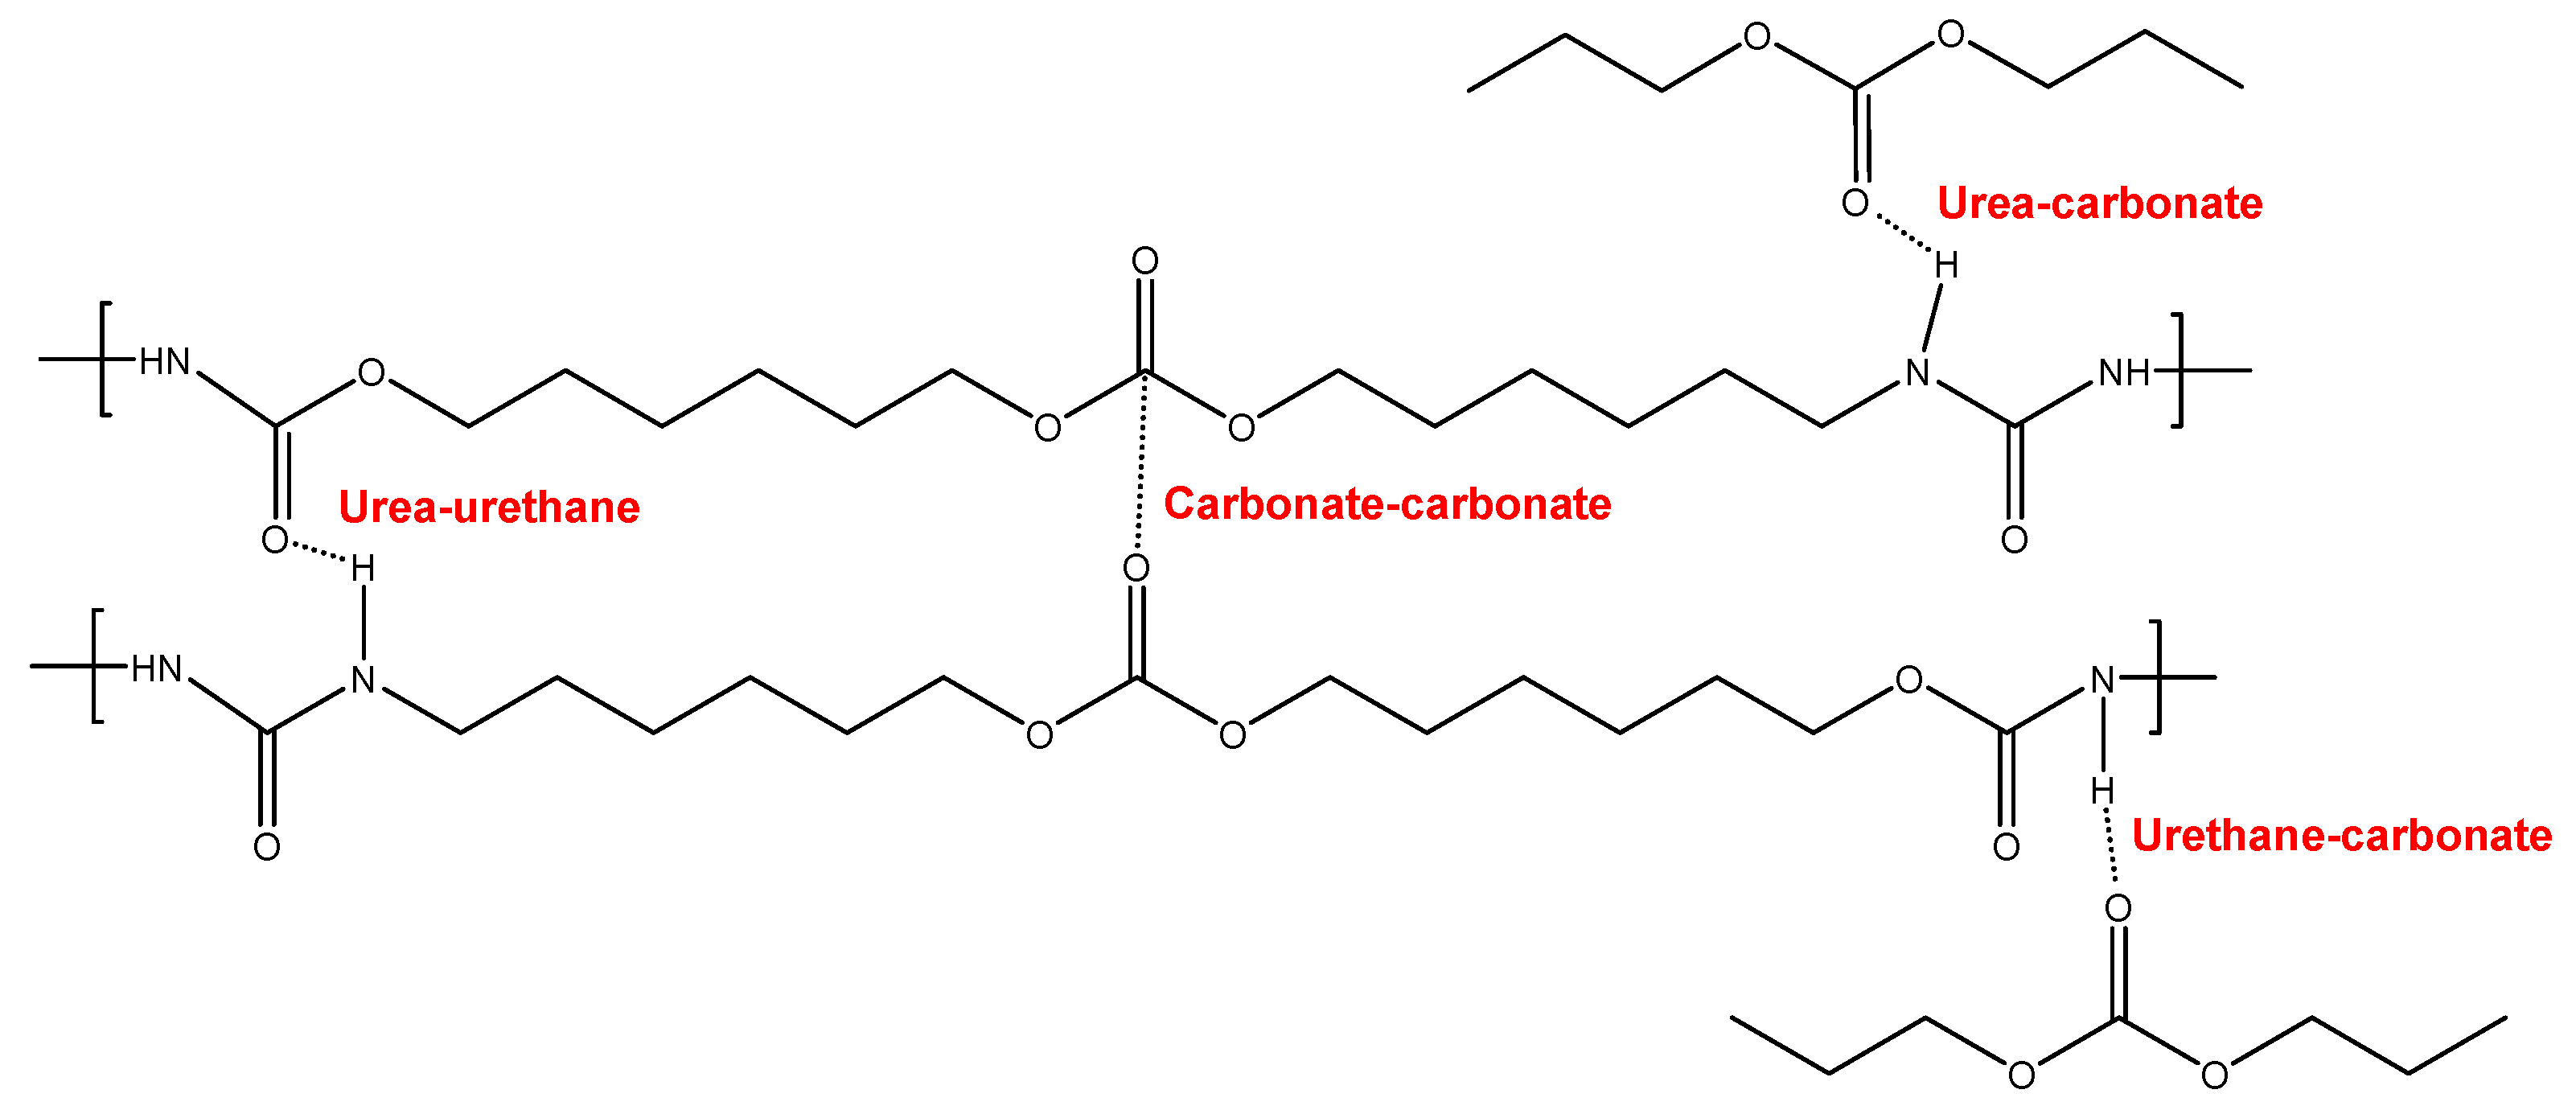
Figure 6.
Chemical structure of the soft segments in the PUs.
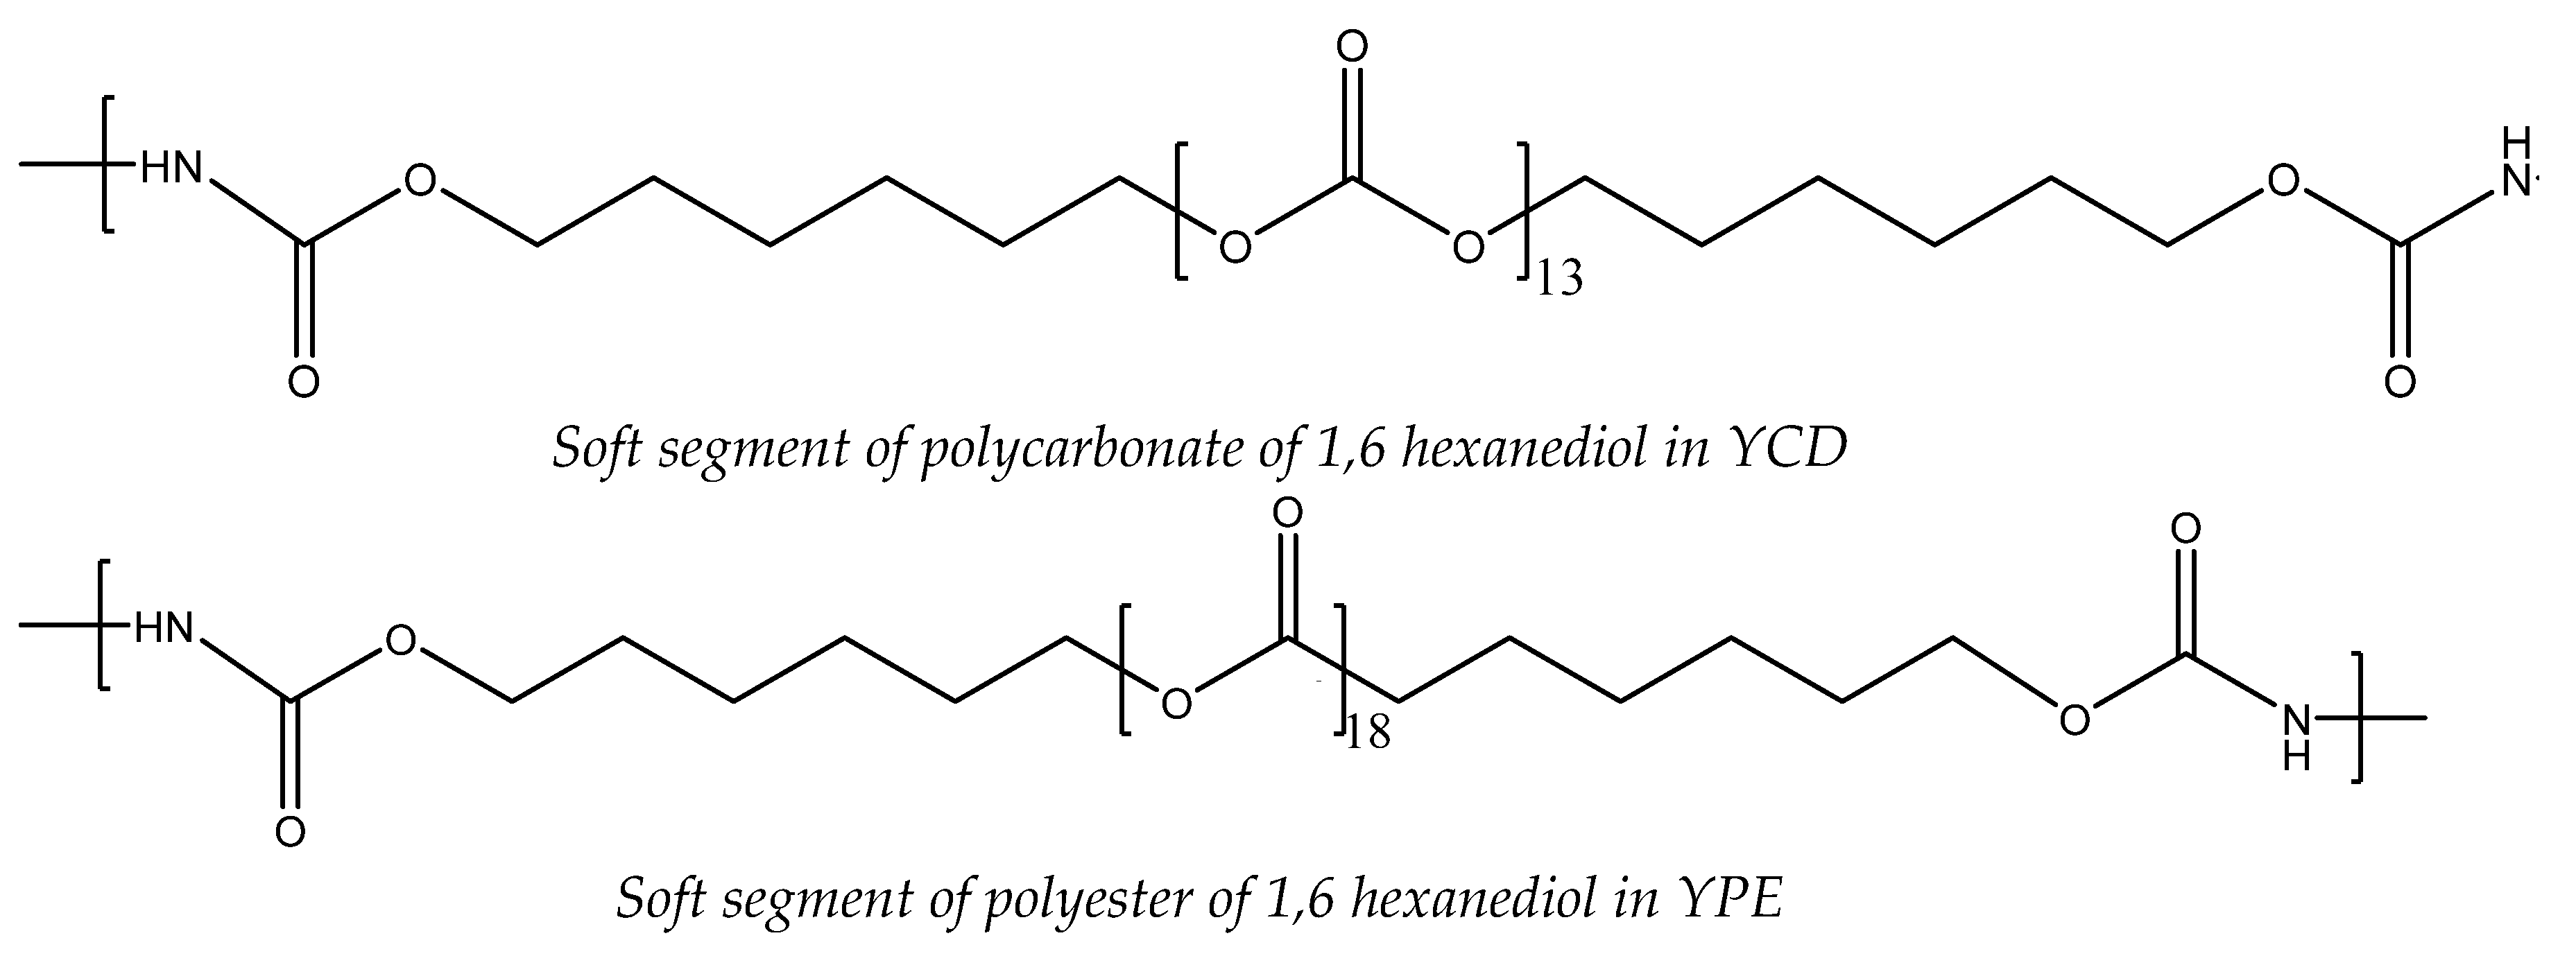
Figure 7.
ATR-IR spectra of the PUs (above) and the polyols (bottom).
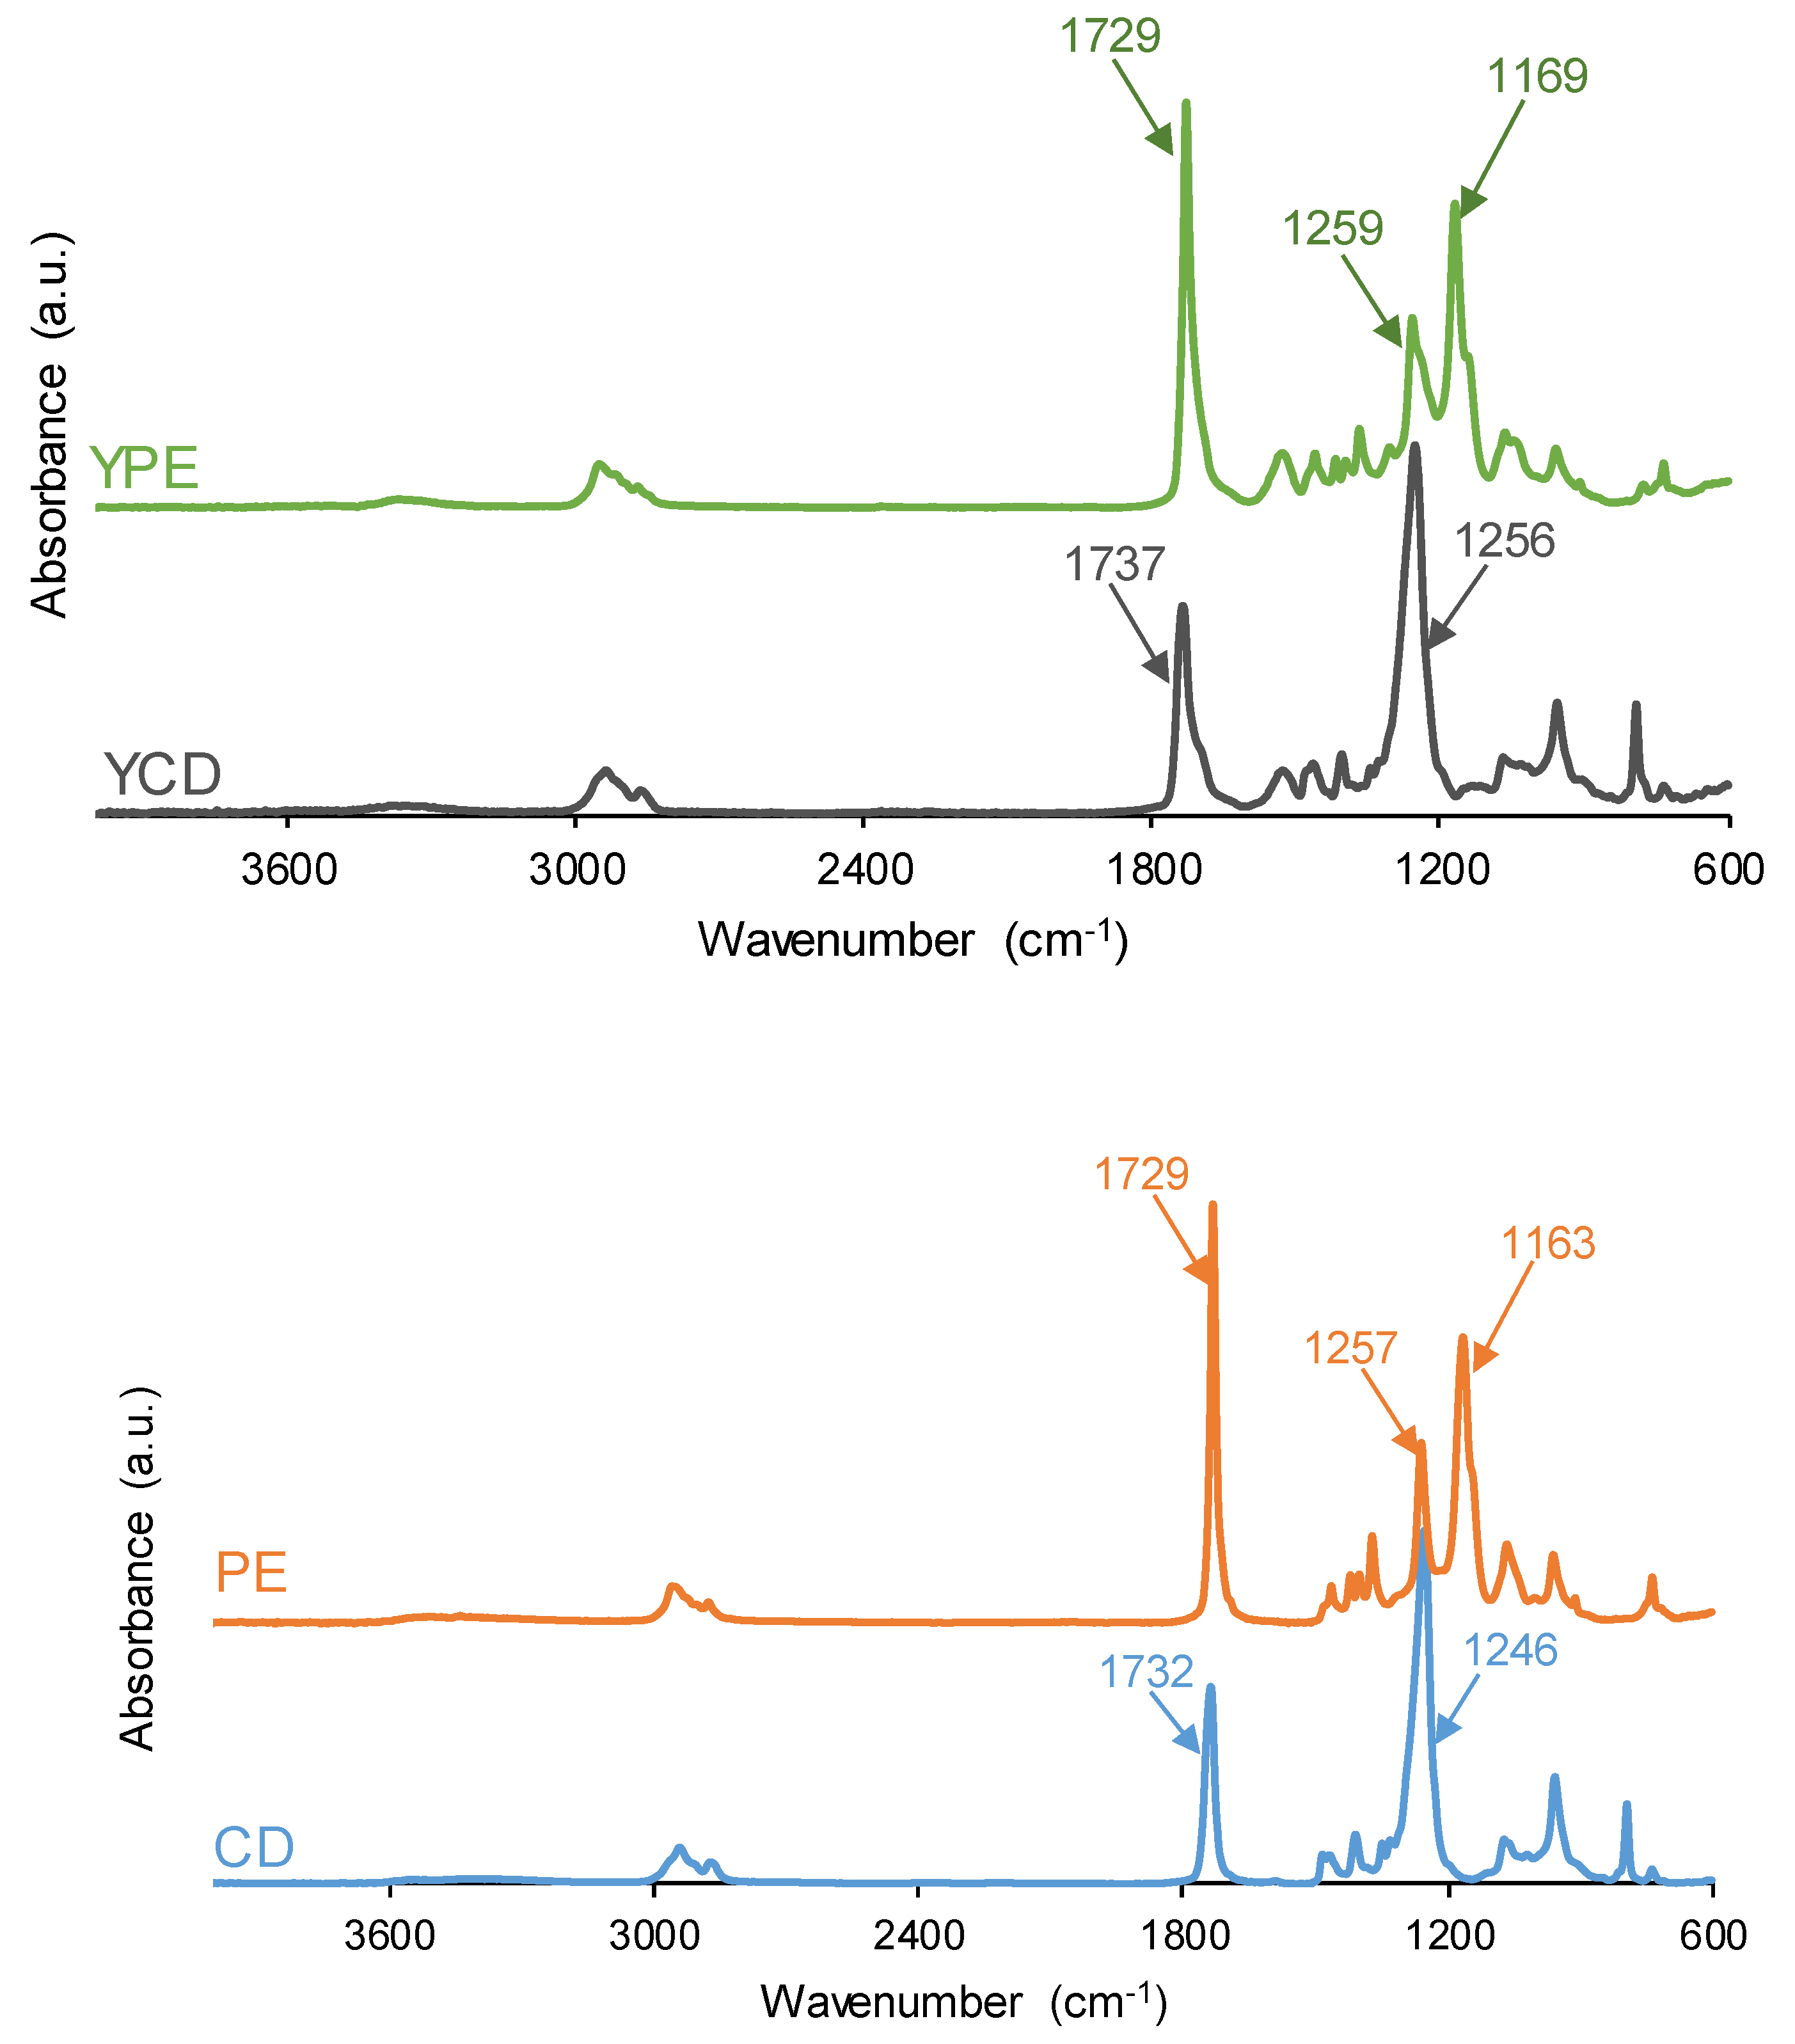
Figure 8.
Curve fitting of the carbonyl stretching region of the ATR-IR spectra of the PUs.
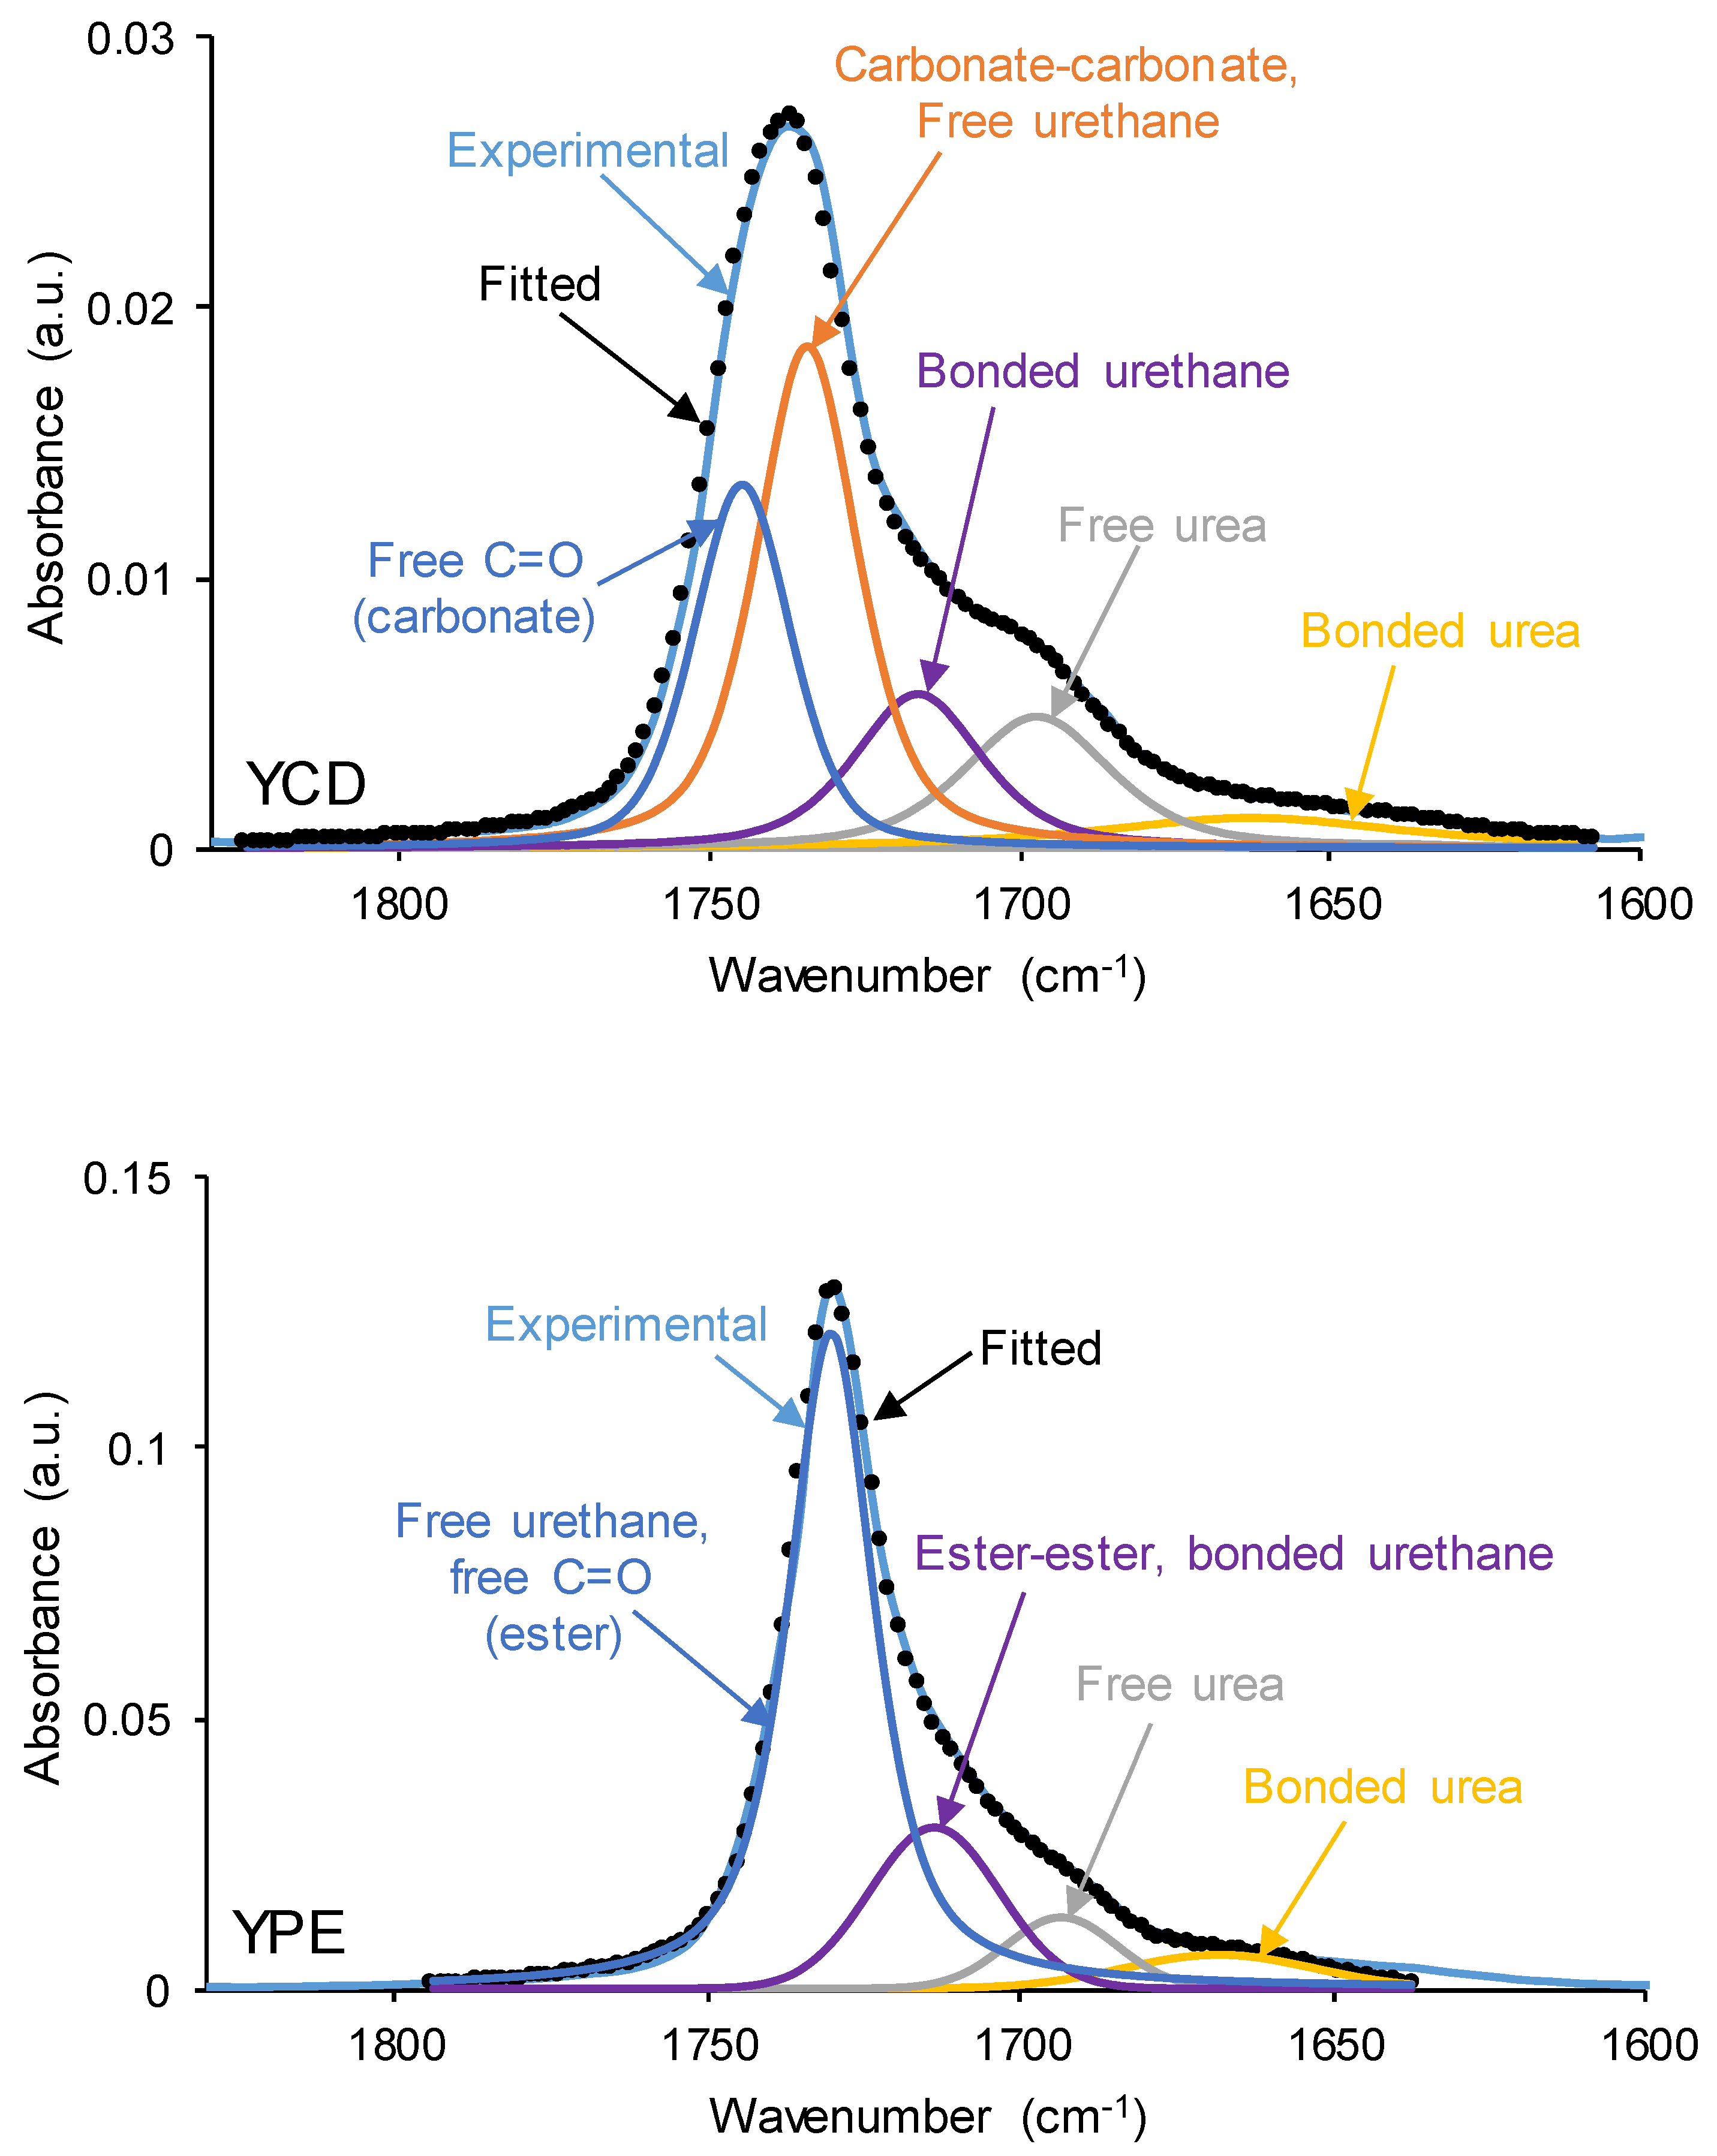
Figure 9.
DSC curves of the PUs. First heating run.
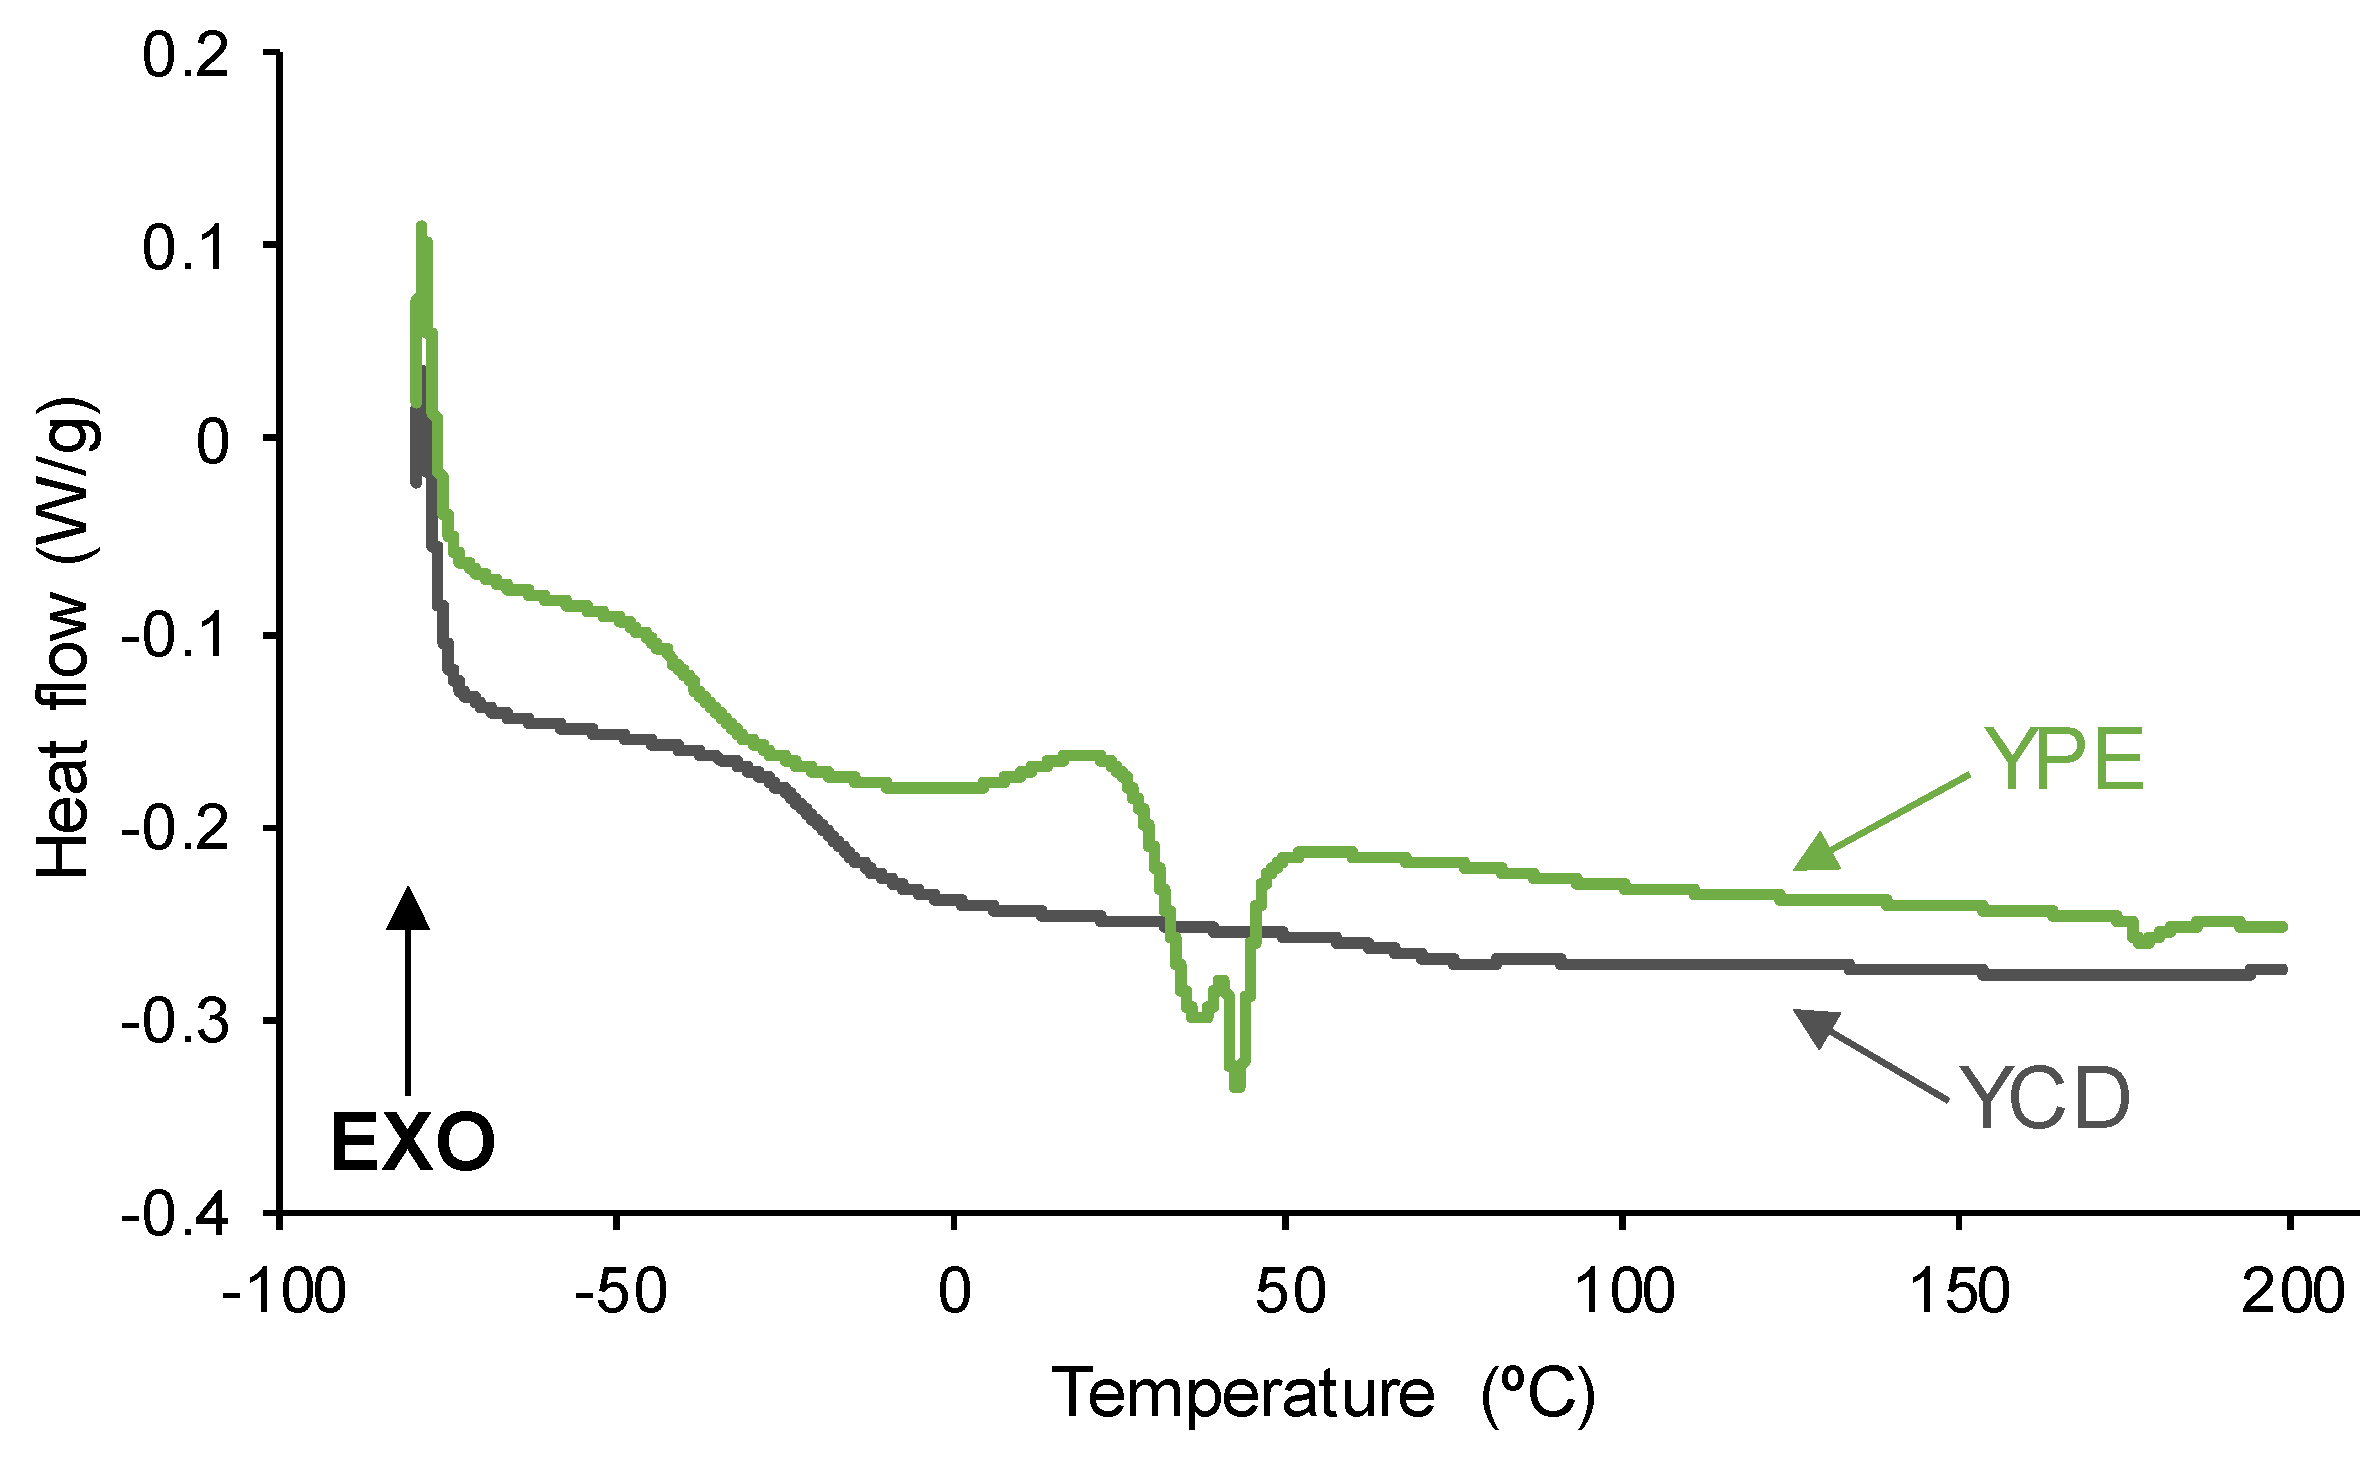
Figure 10.
DSC curves of the PUs. Second heating run.
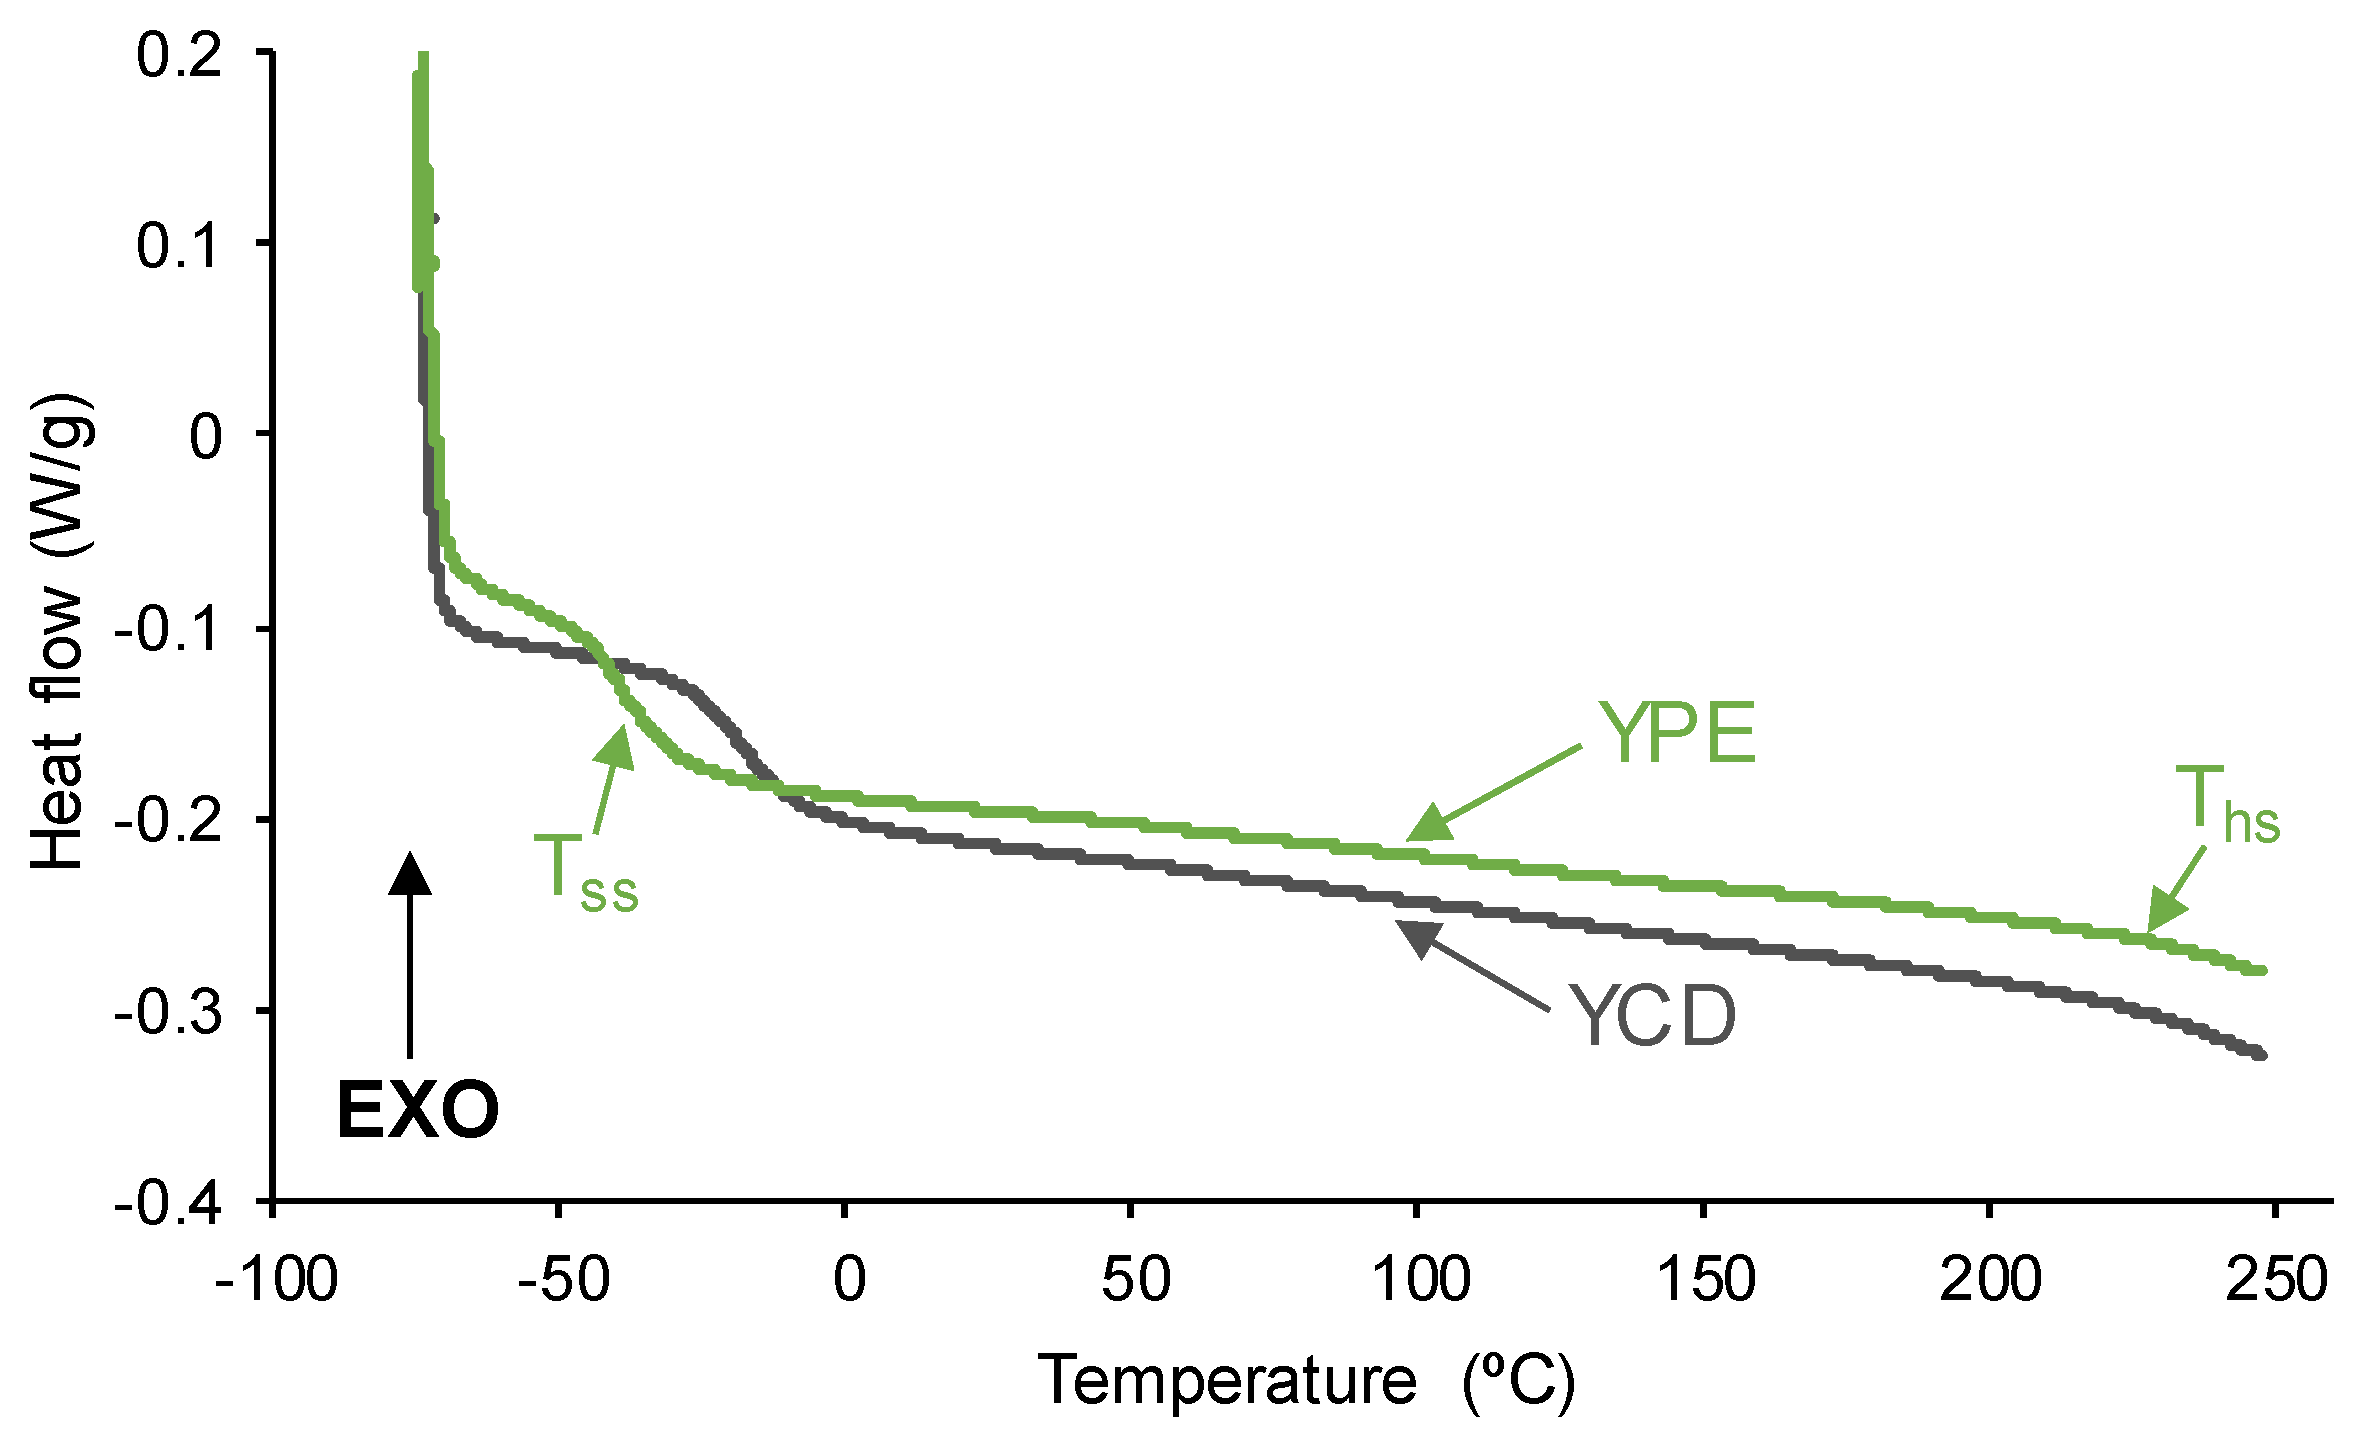
Figure 11.
X-ray diffractograms of the PUs (above) and polyols (bottom).
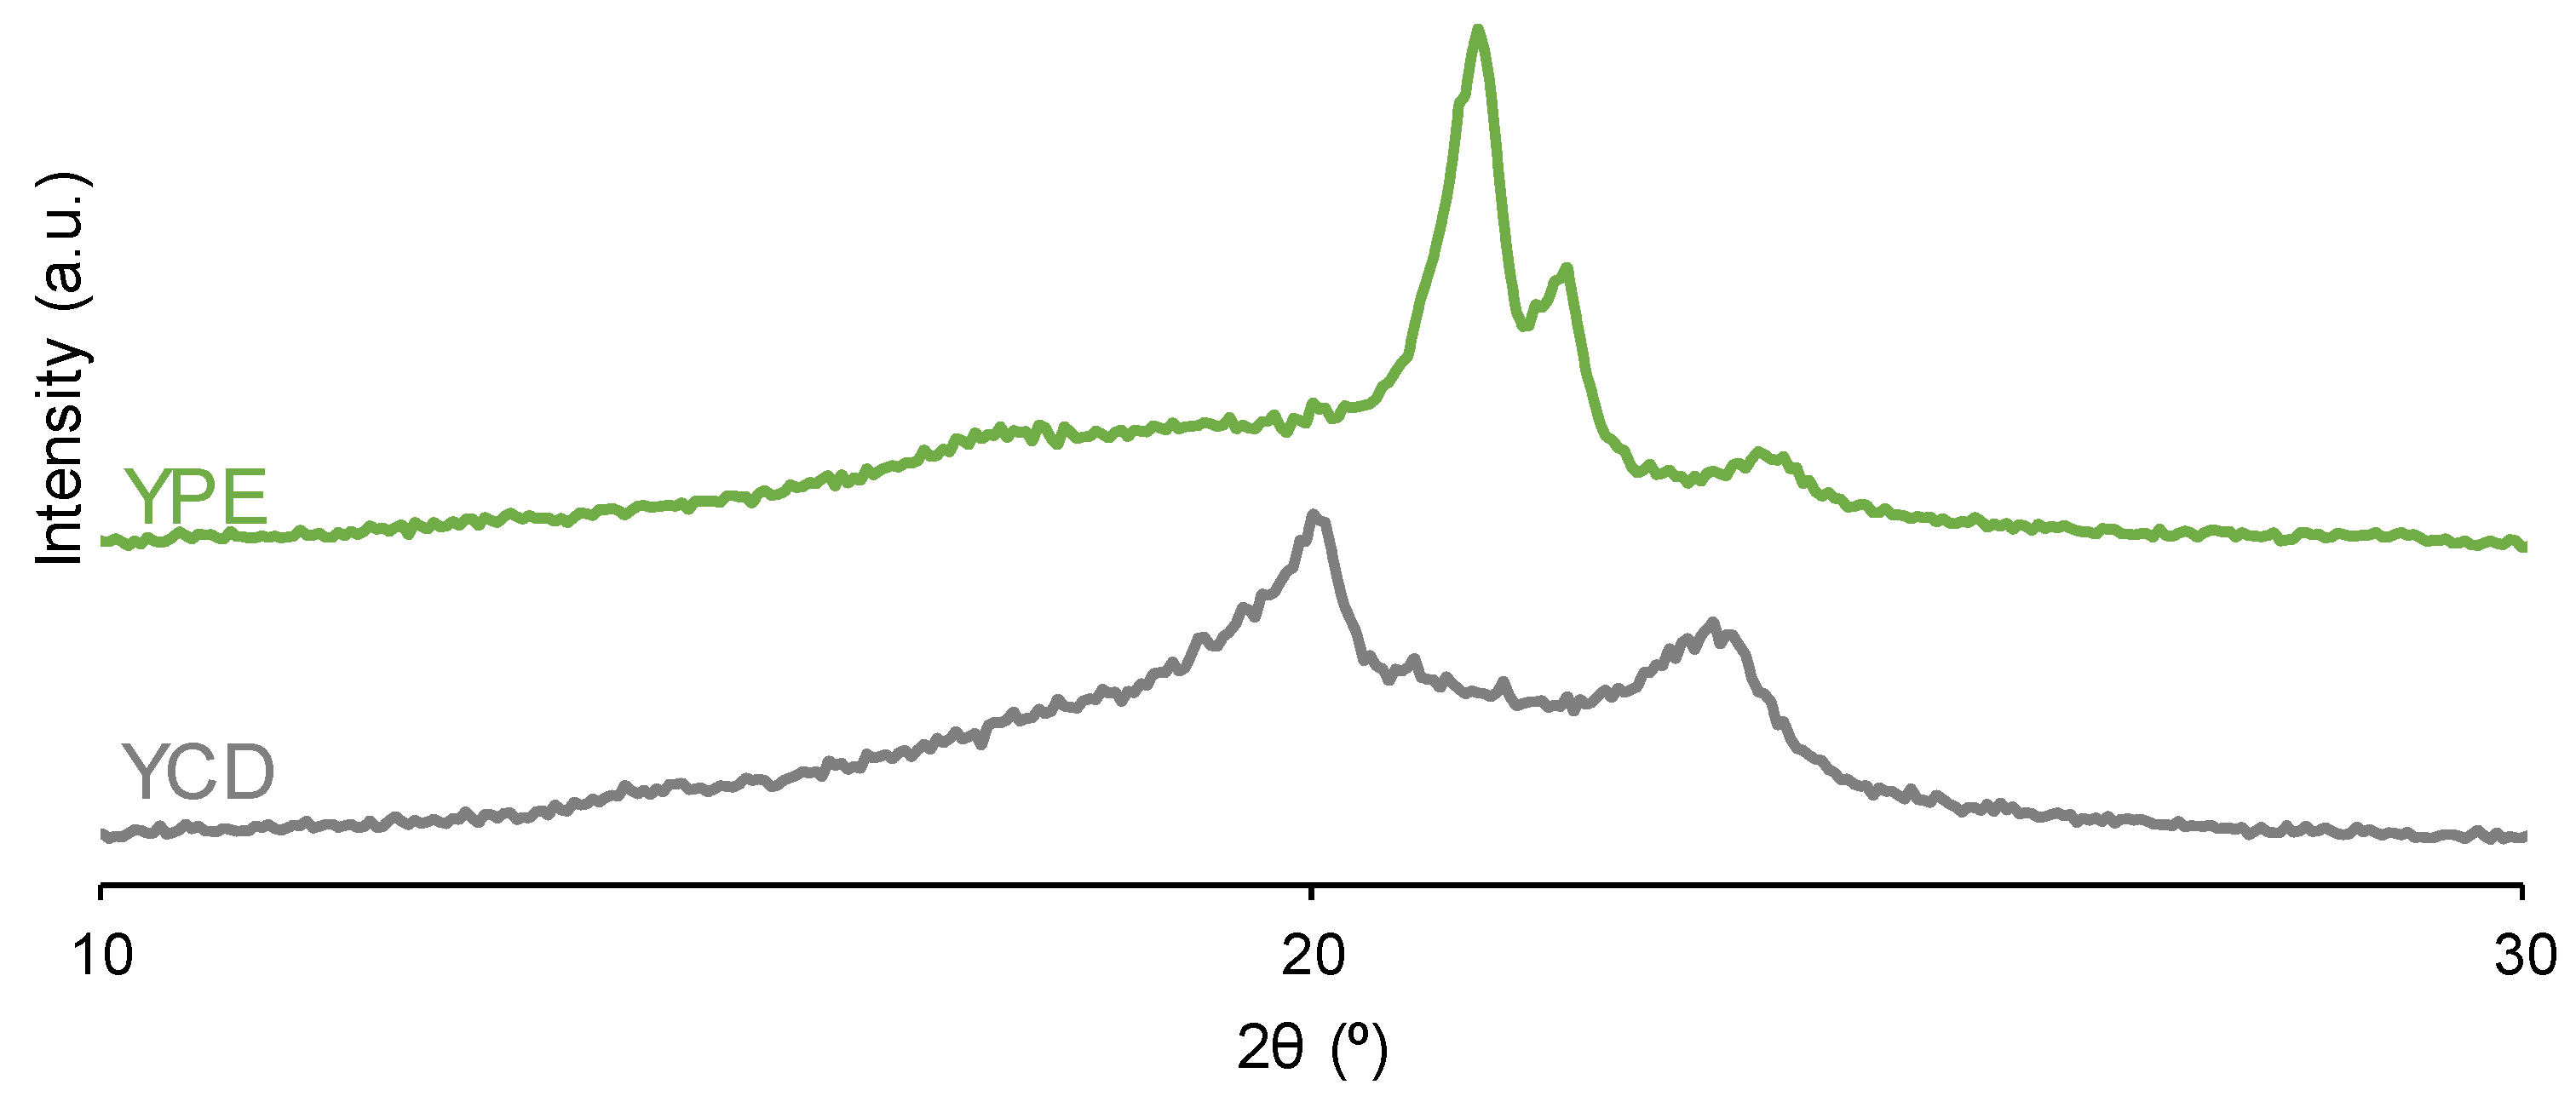
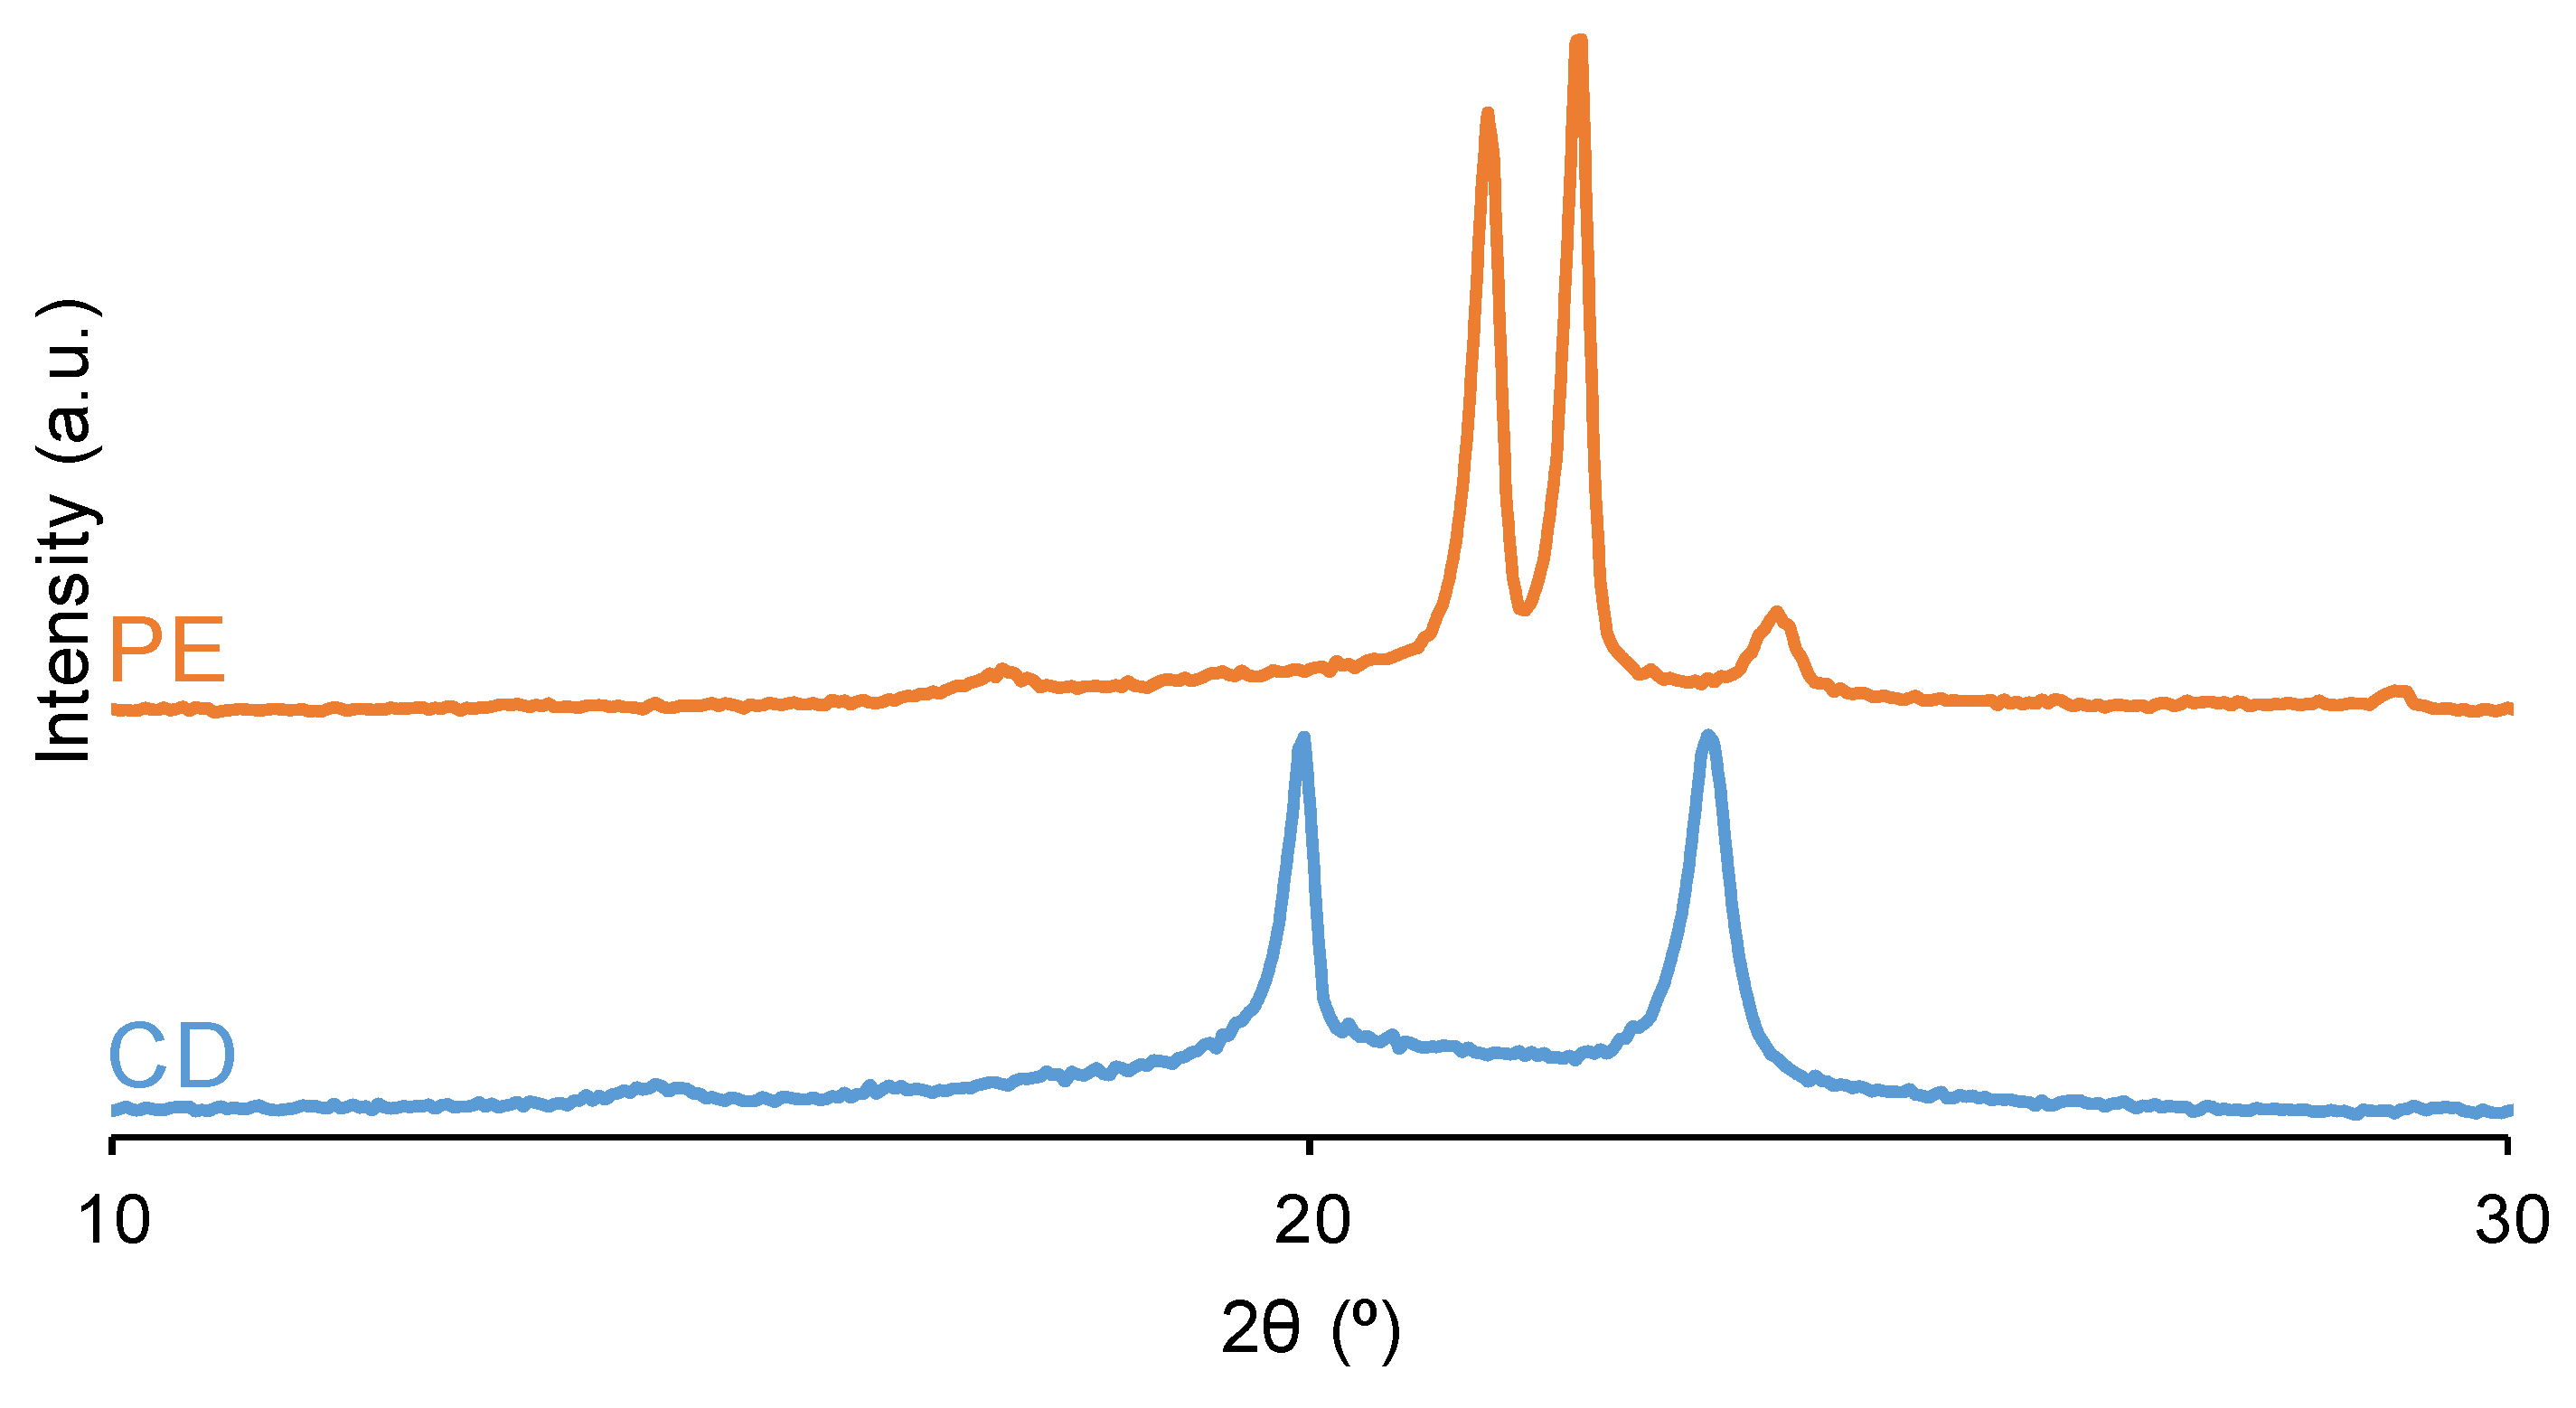
Figure 12.
TGA curves of the PUs.
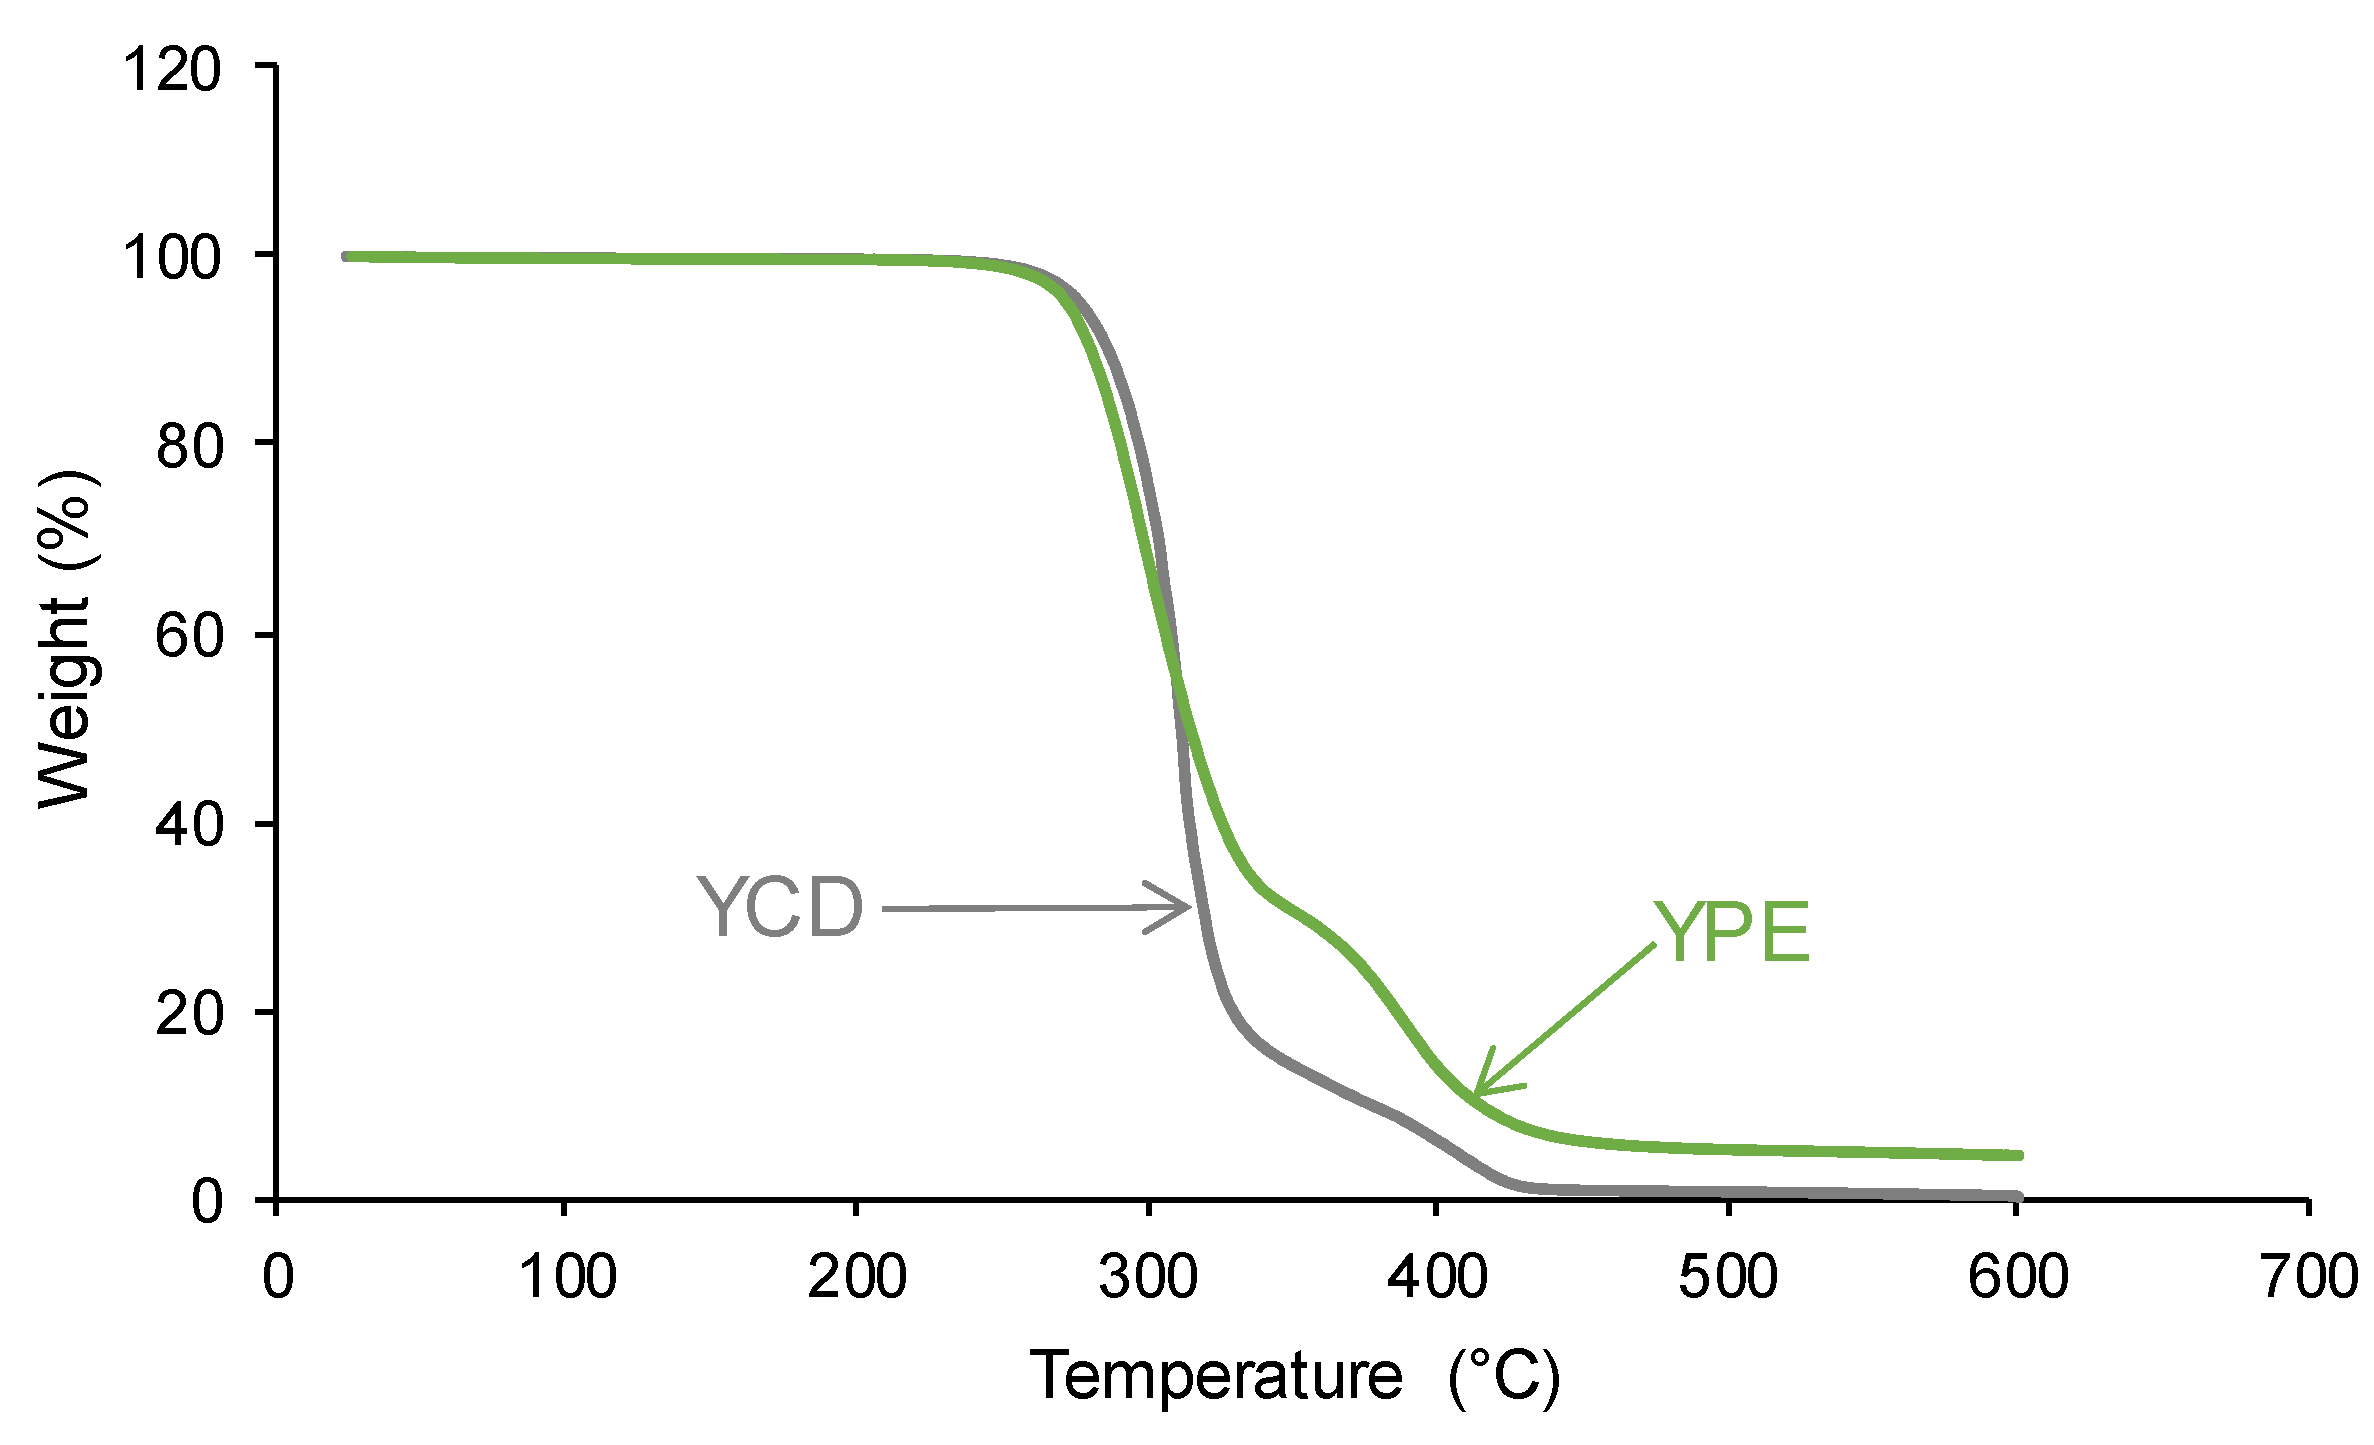
Figure 13.
Curves of the derivative of the weight loss of the PUs (above) and the polyols (bottom). TGA experiments.
Figure 13.
Curves of the derivative of the weight loss of the PUs (above) and the polyols (bottom). TGA experiments.
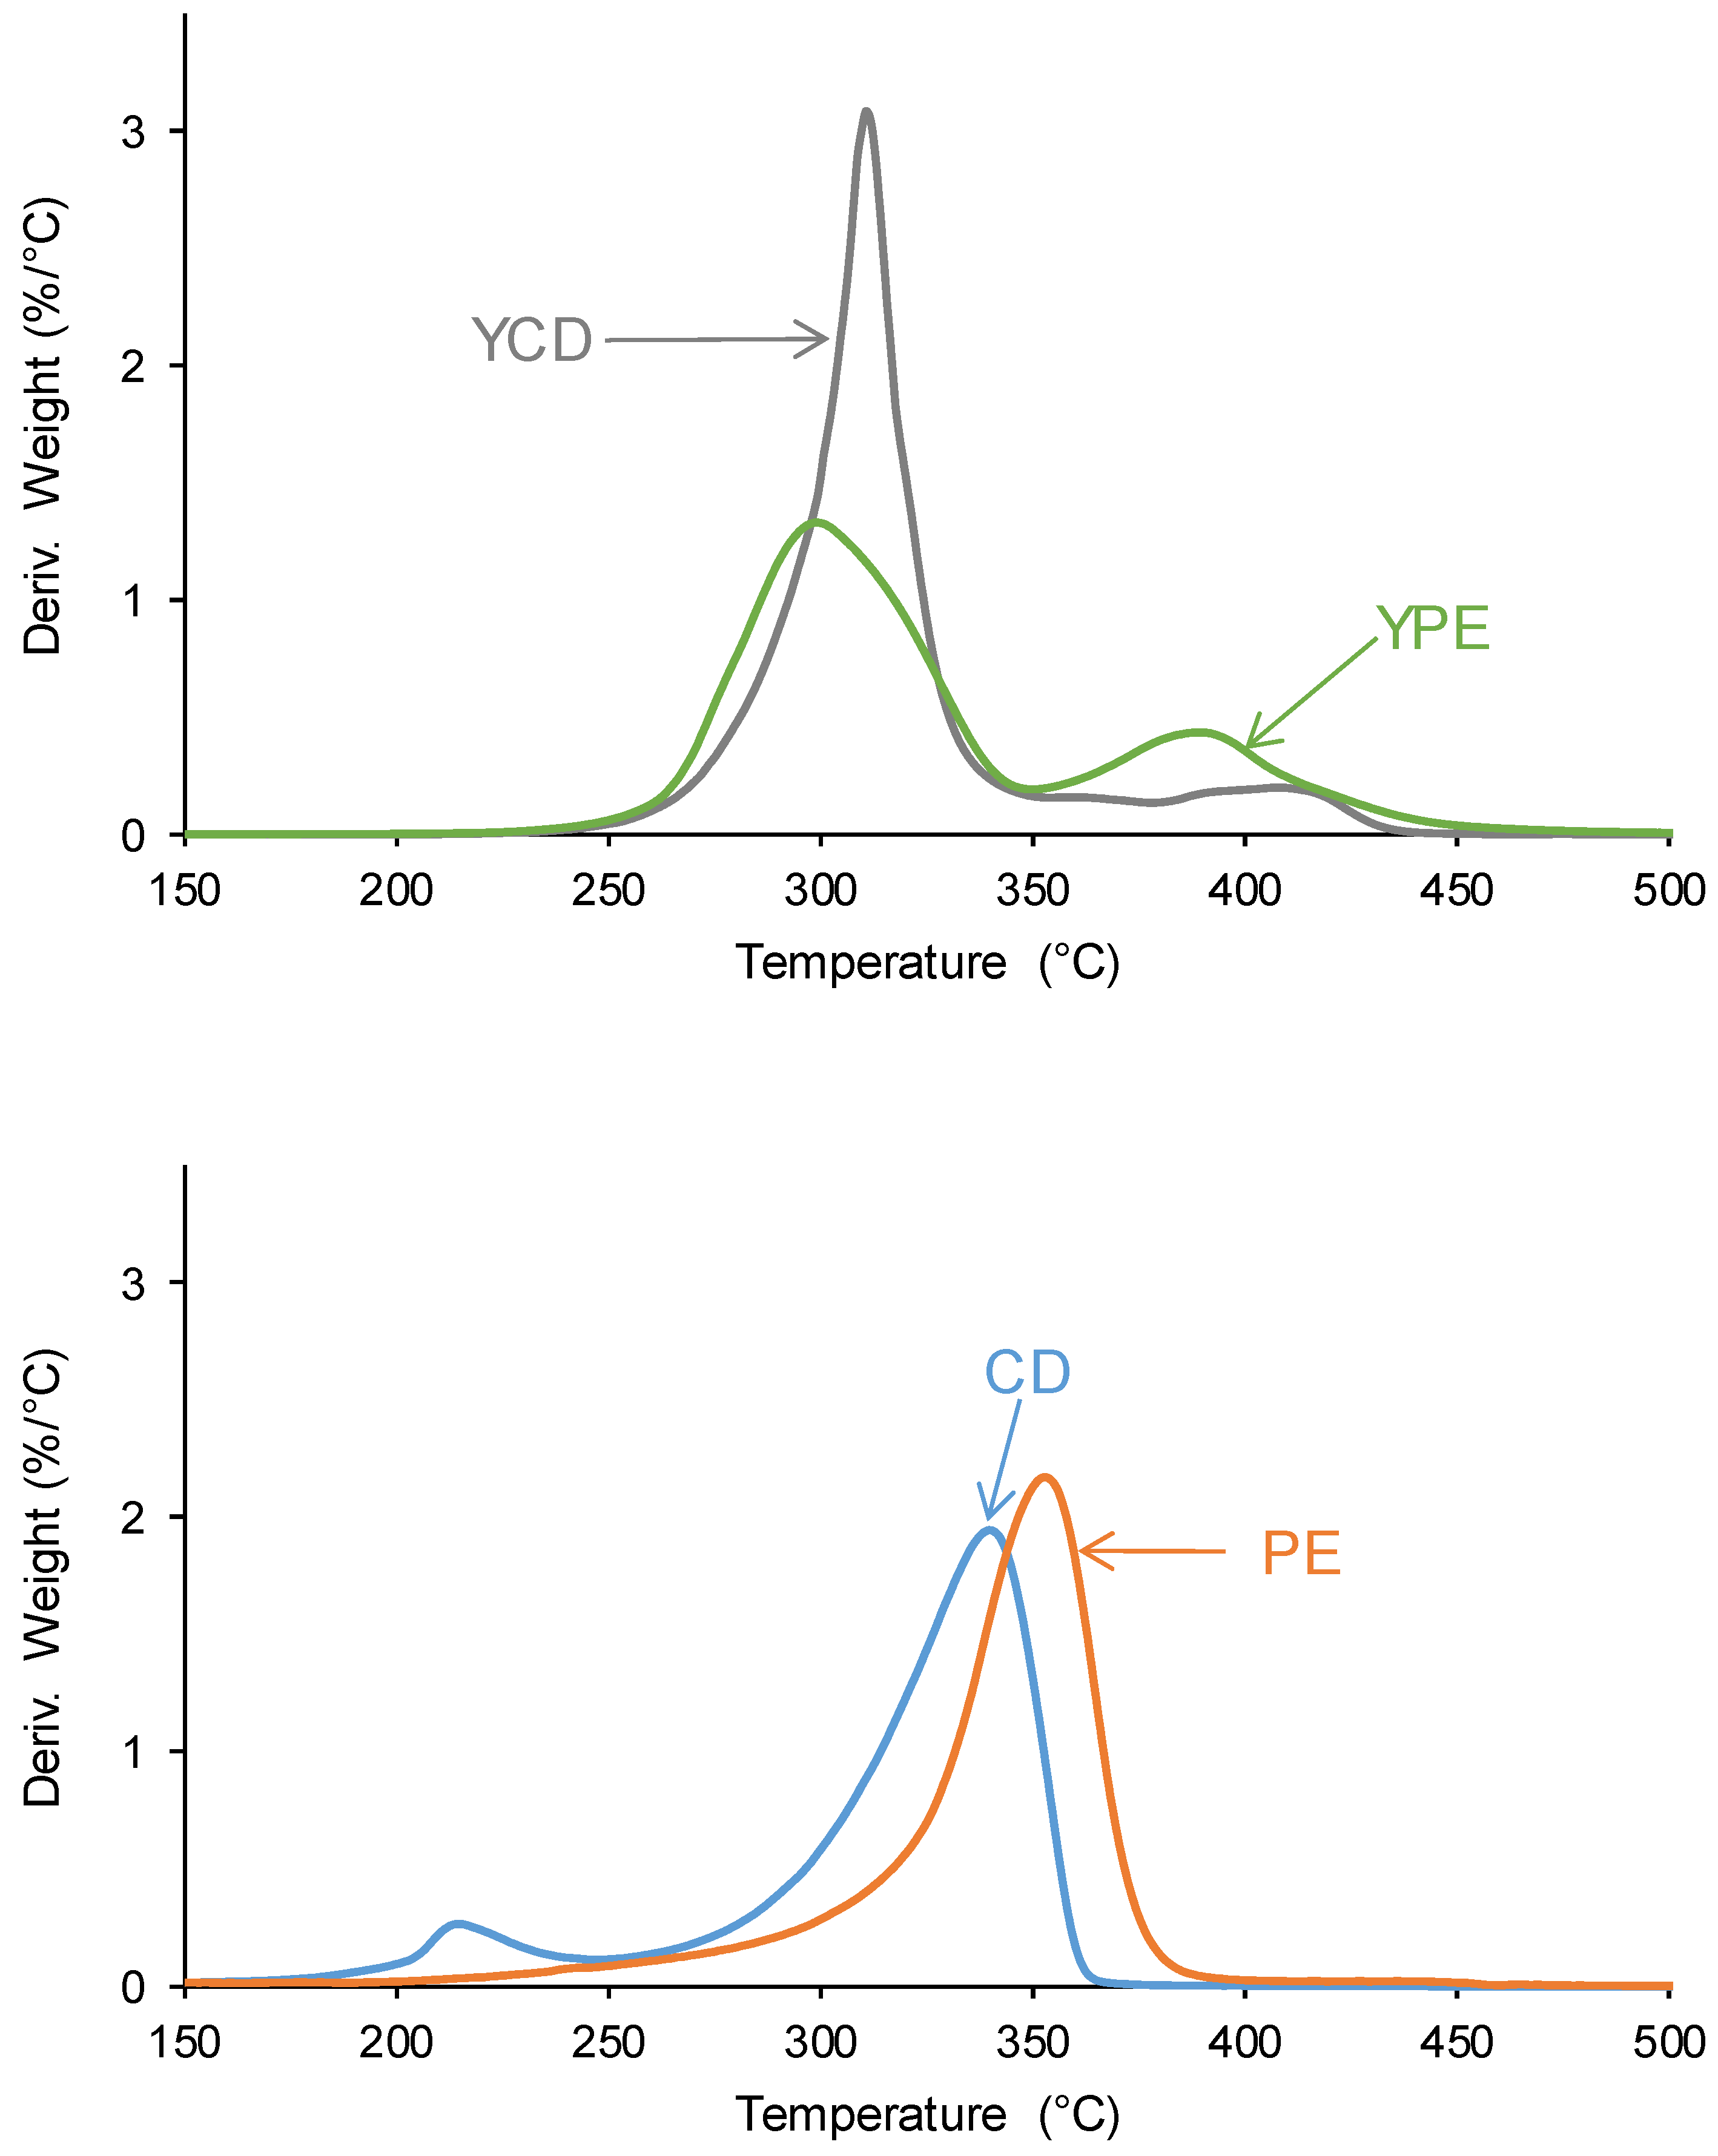
Figure 14.
Variation of the storage (E´) modulus as a function of the temperature of the PUs. DMA experiments.
Figure 14.
Variation of the storage (E´) modulus as a function of the temperature of the PUs. DMA experiments.
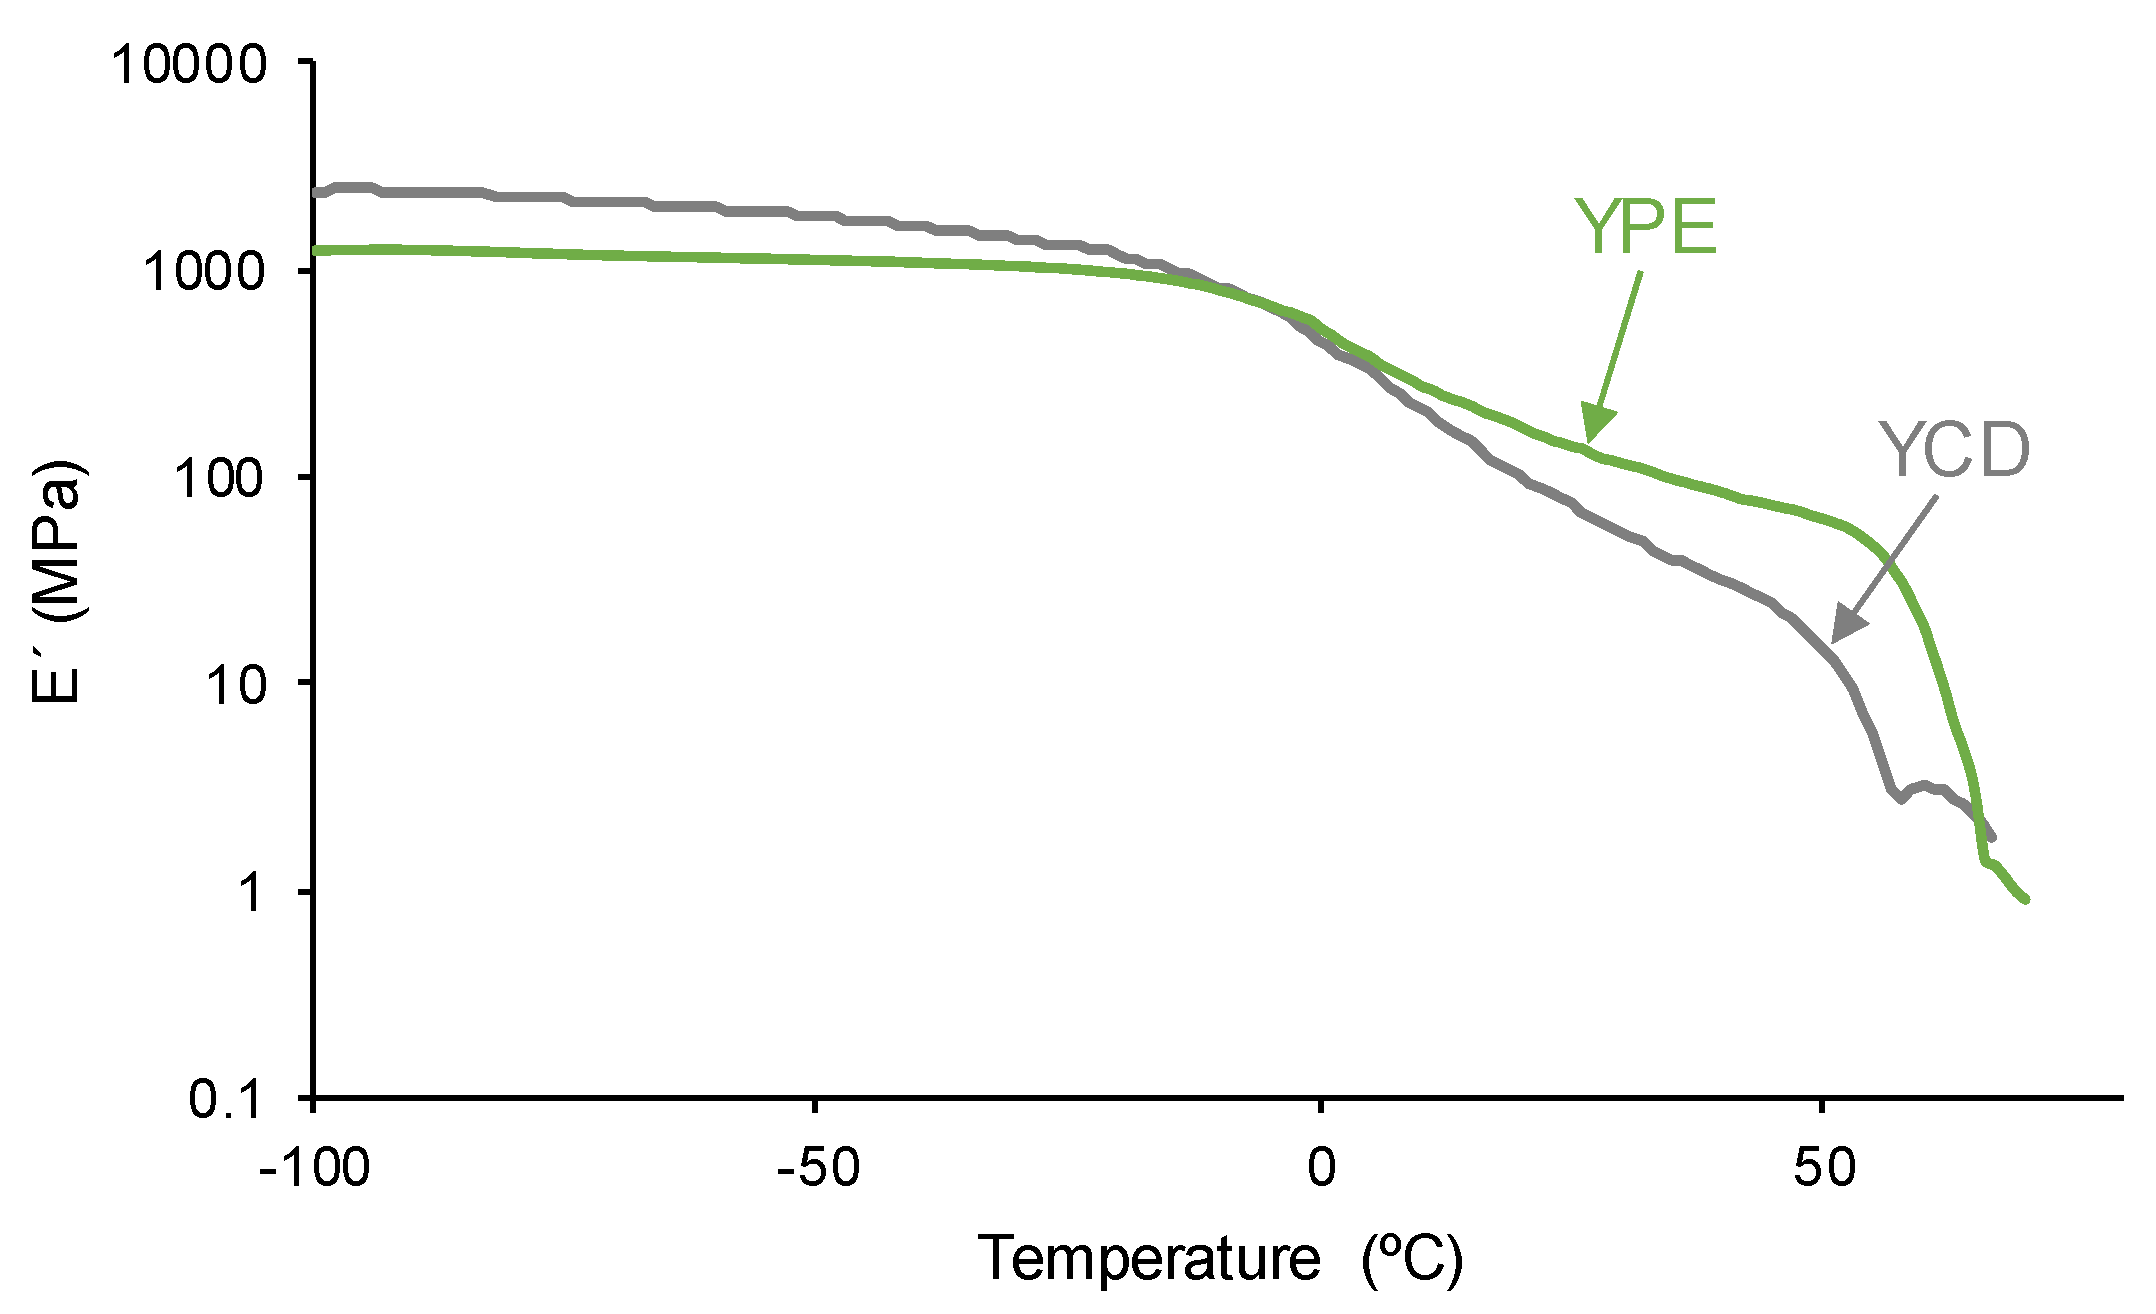
Figure 15.
Variation of tan delta as a function of temperature of the PUs. DMA experiments.

Figure 16.
O1s photopeaks of the PUs surfaces. XPS experiments.
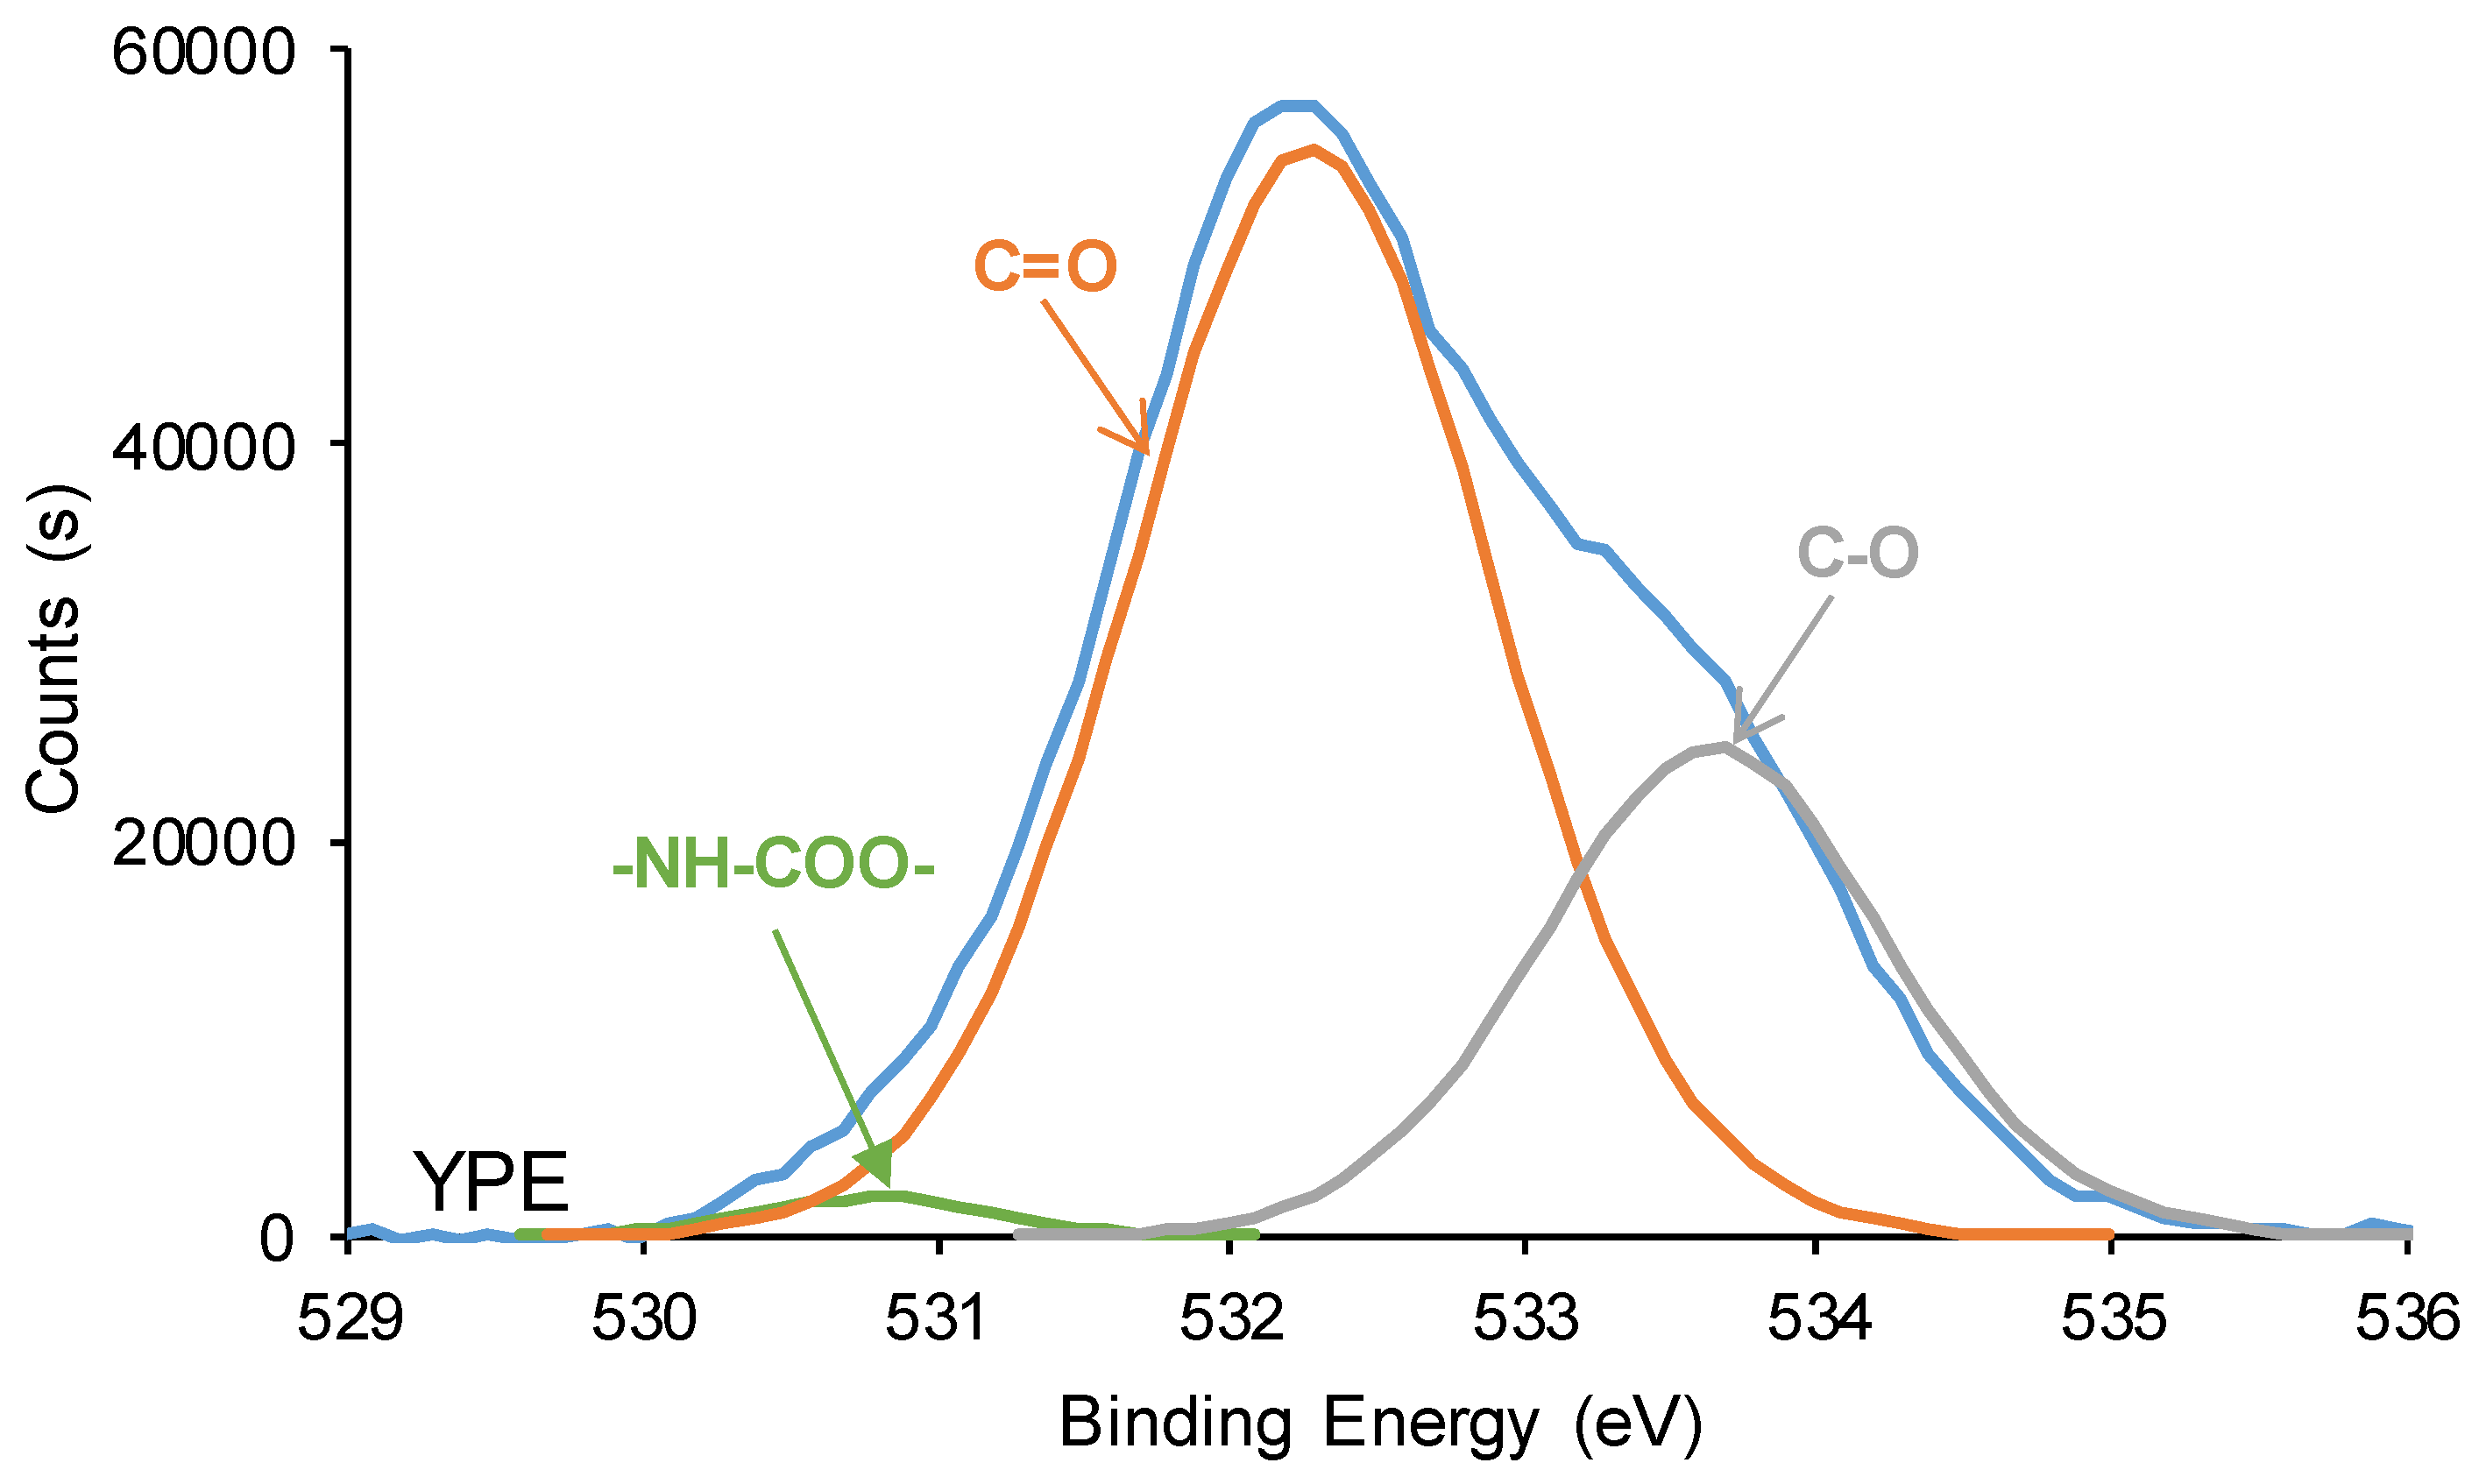
Figure 17.
C1s photopeaks of the PU surfaces. XPS experiments.
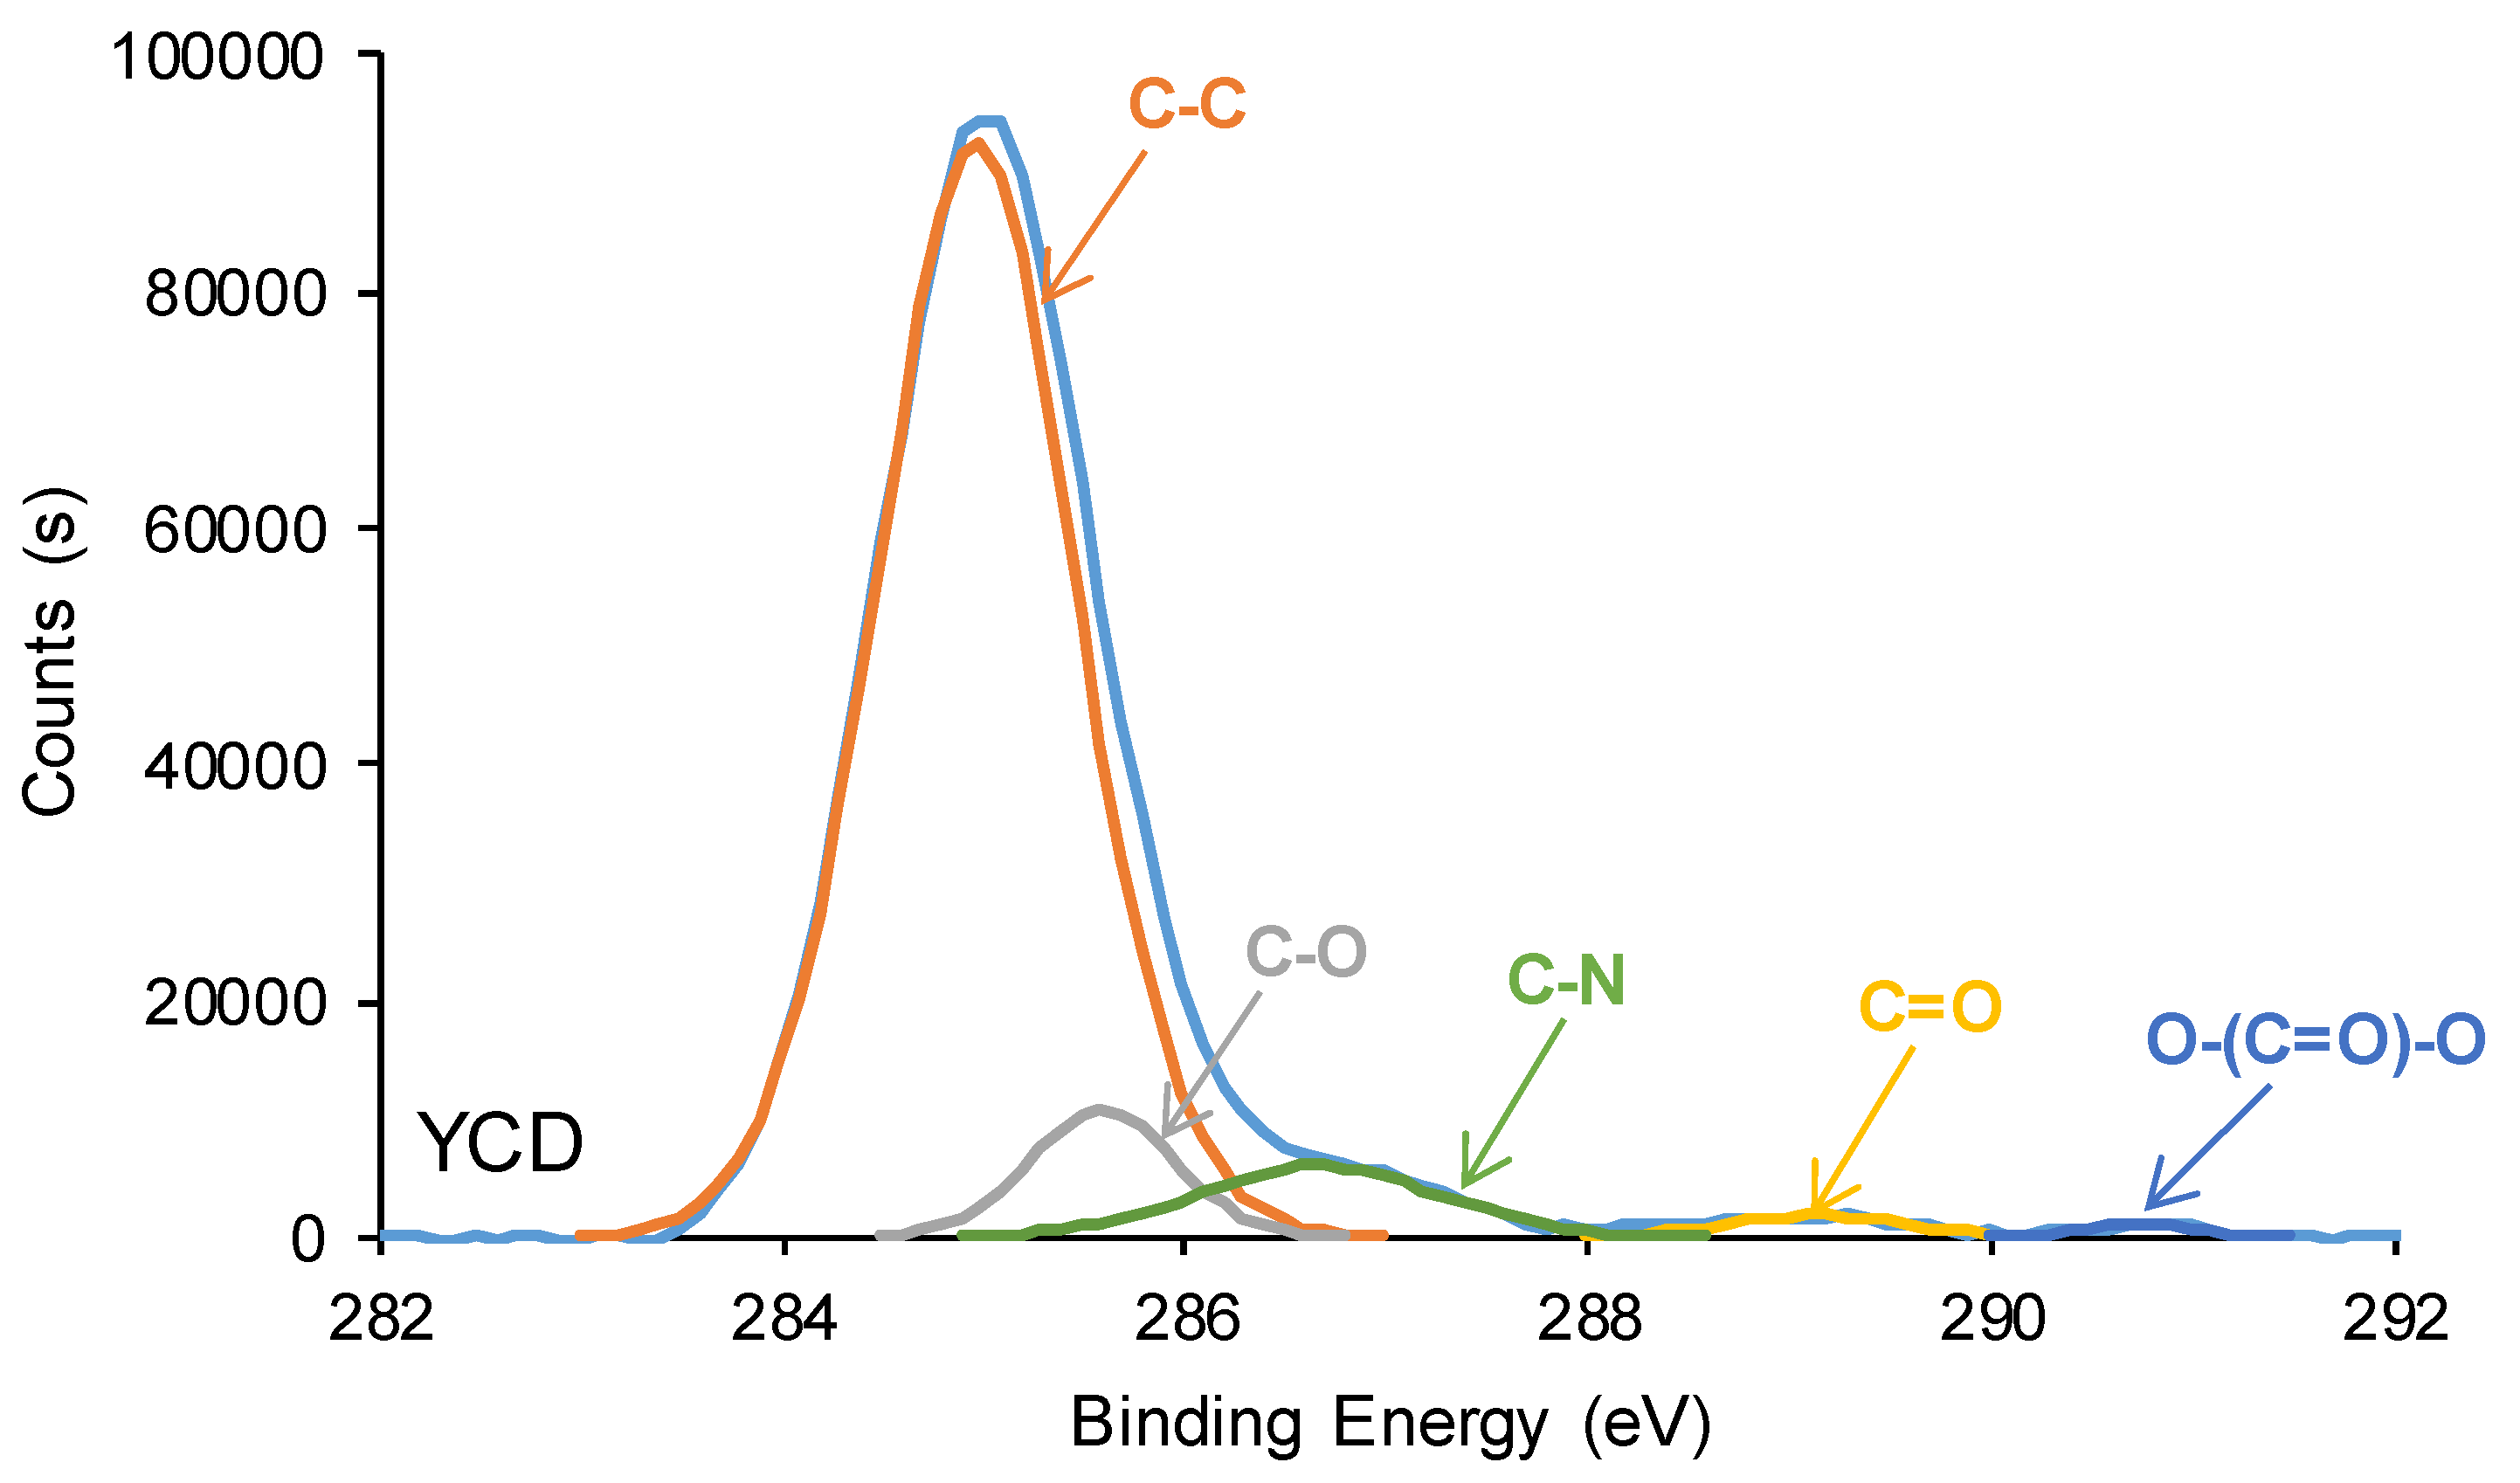
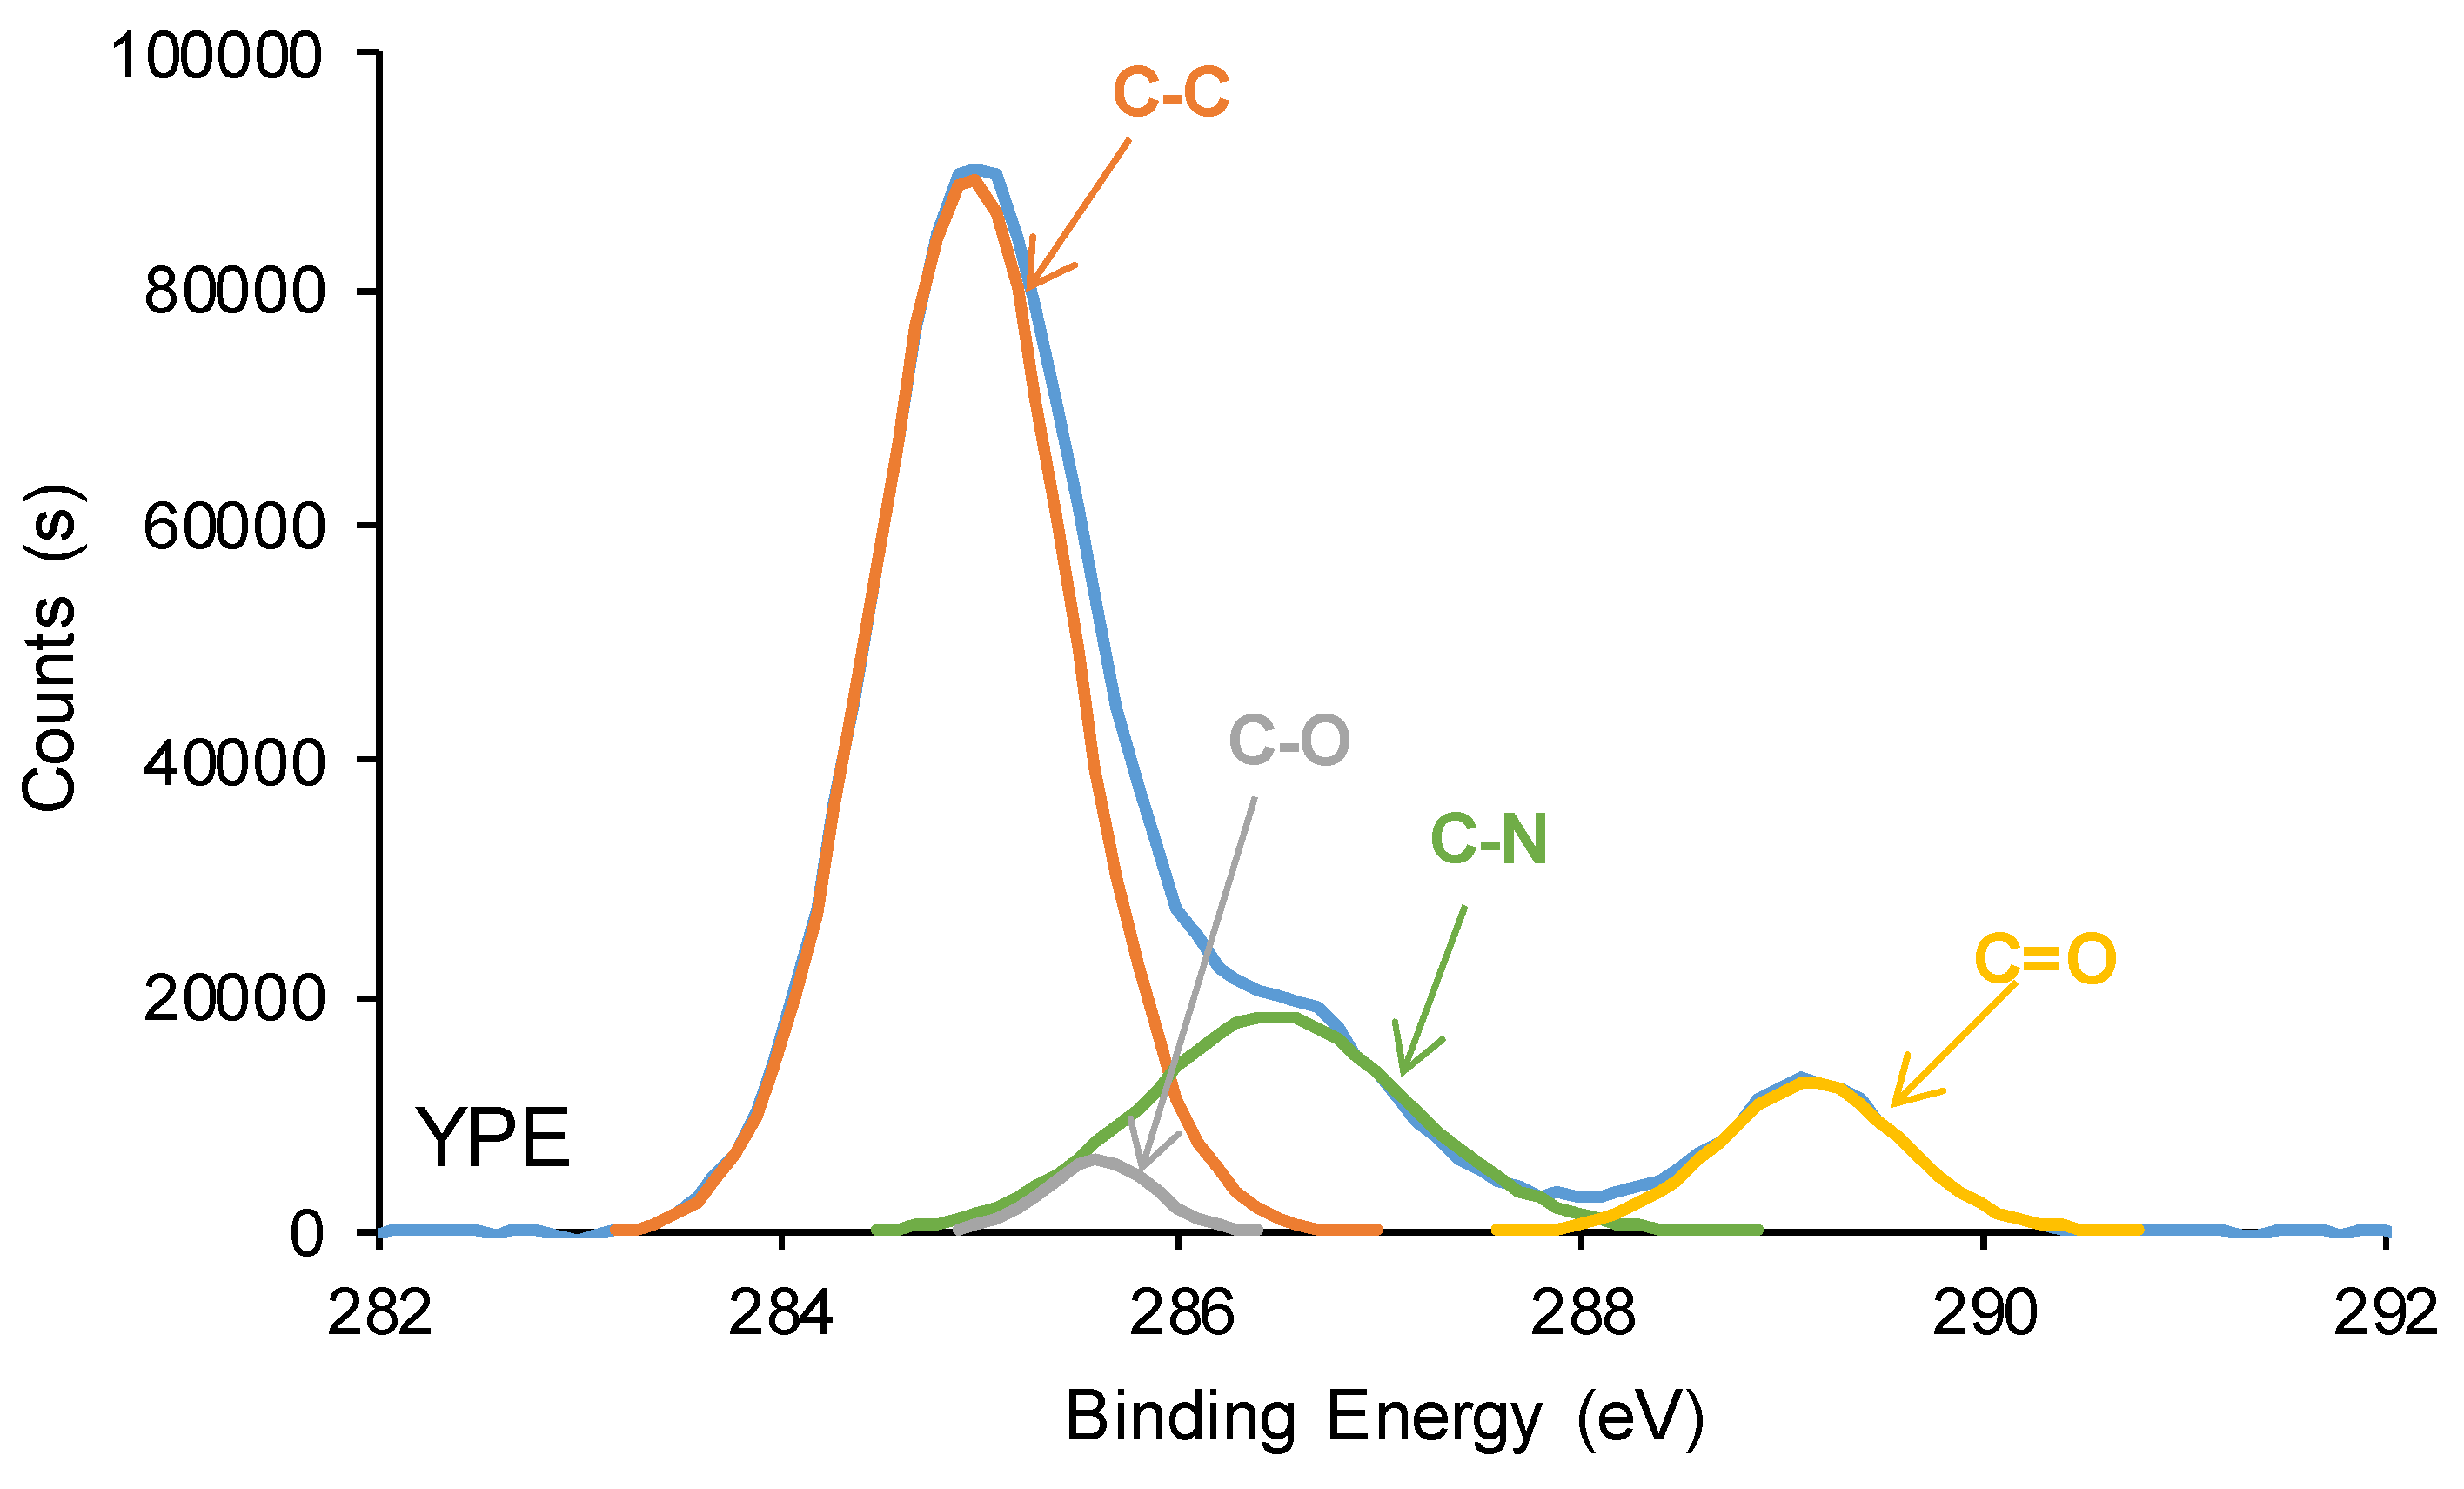
Figure 18.
Stress-strain curves of the PUs.
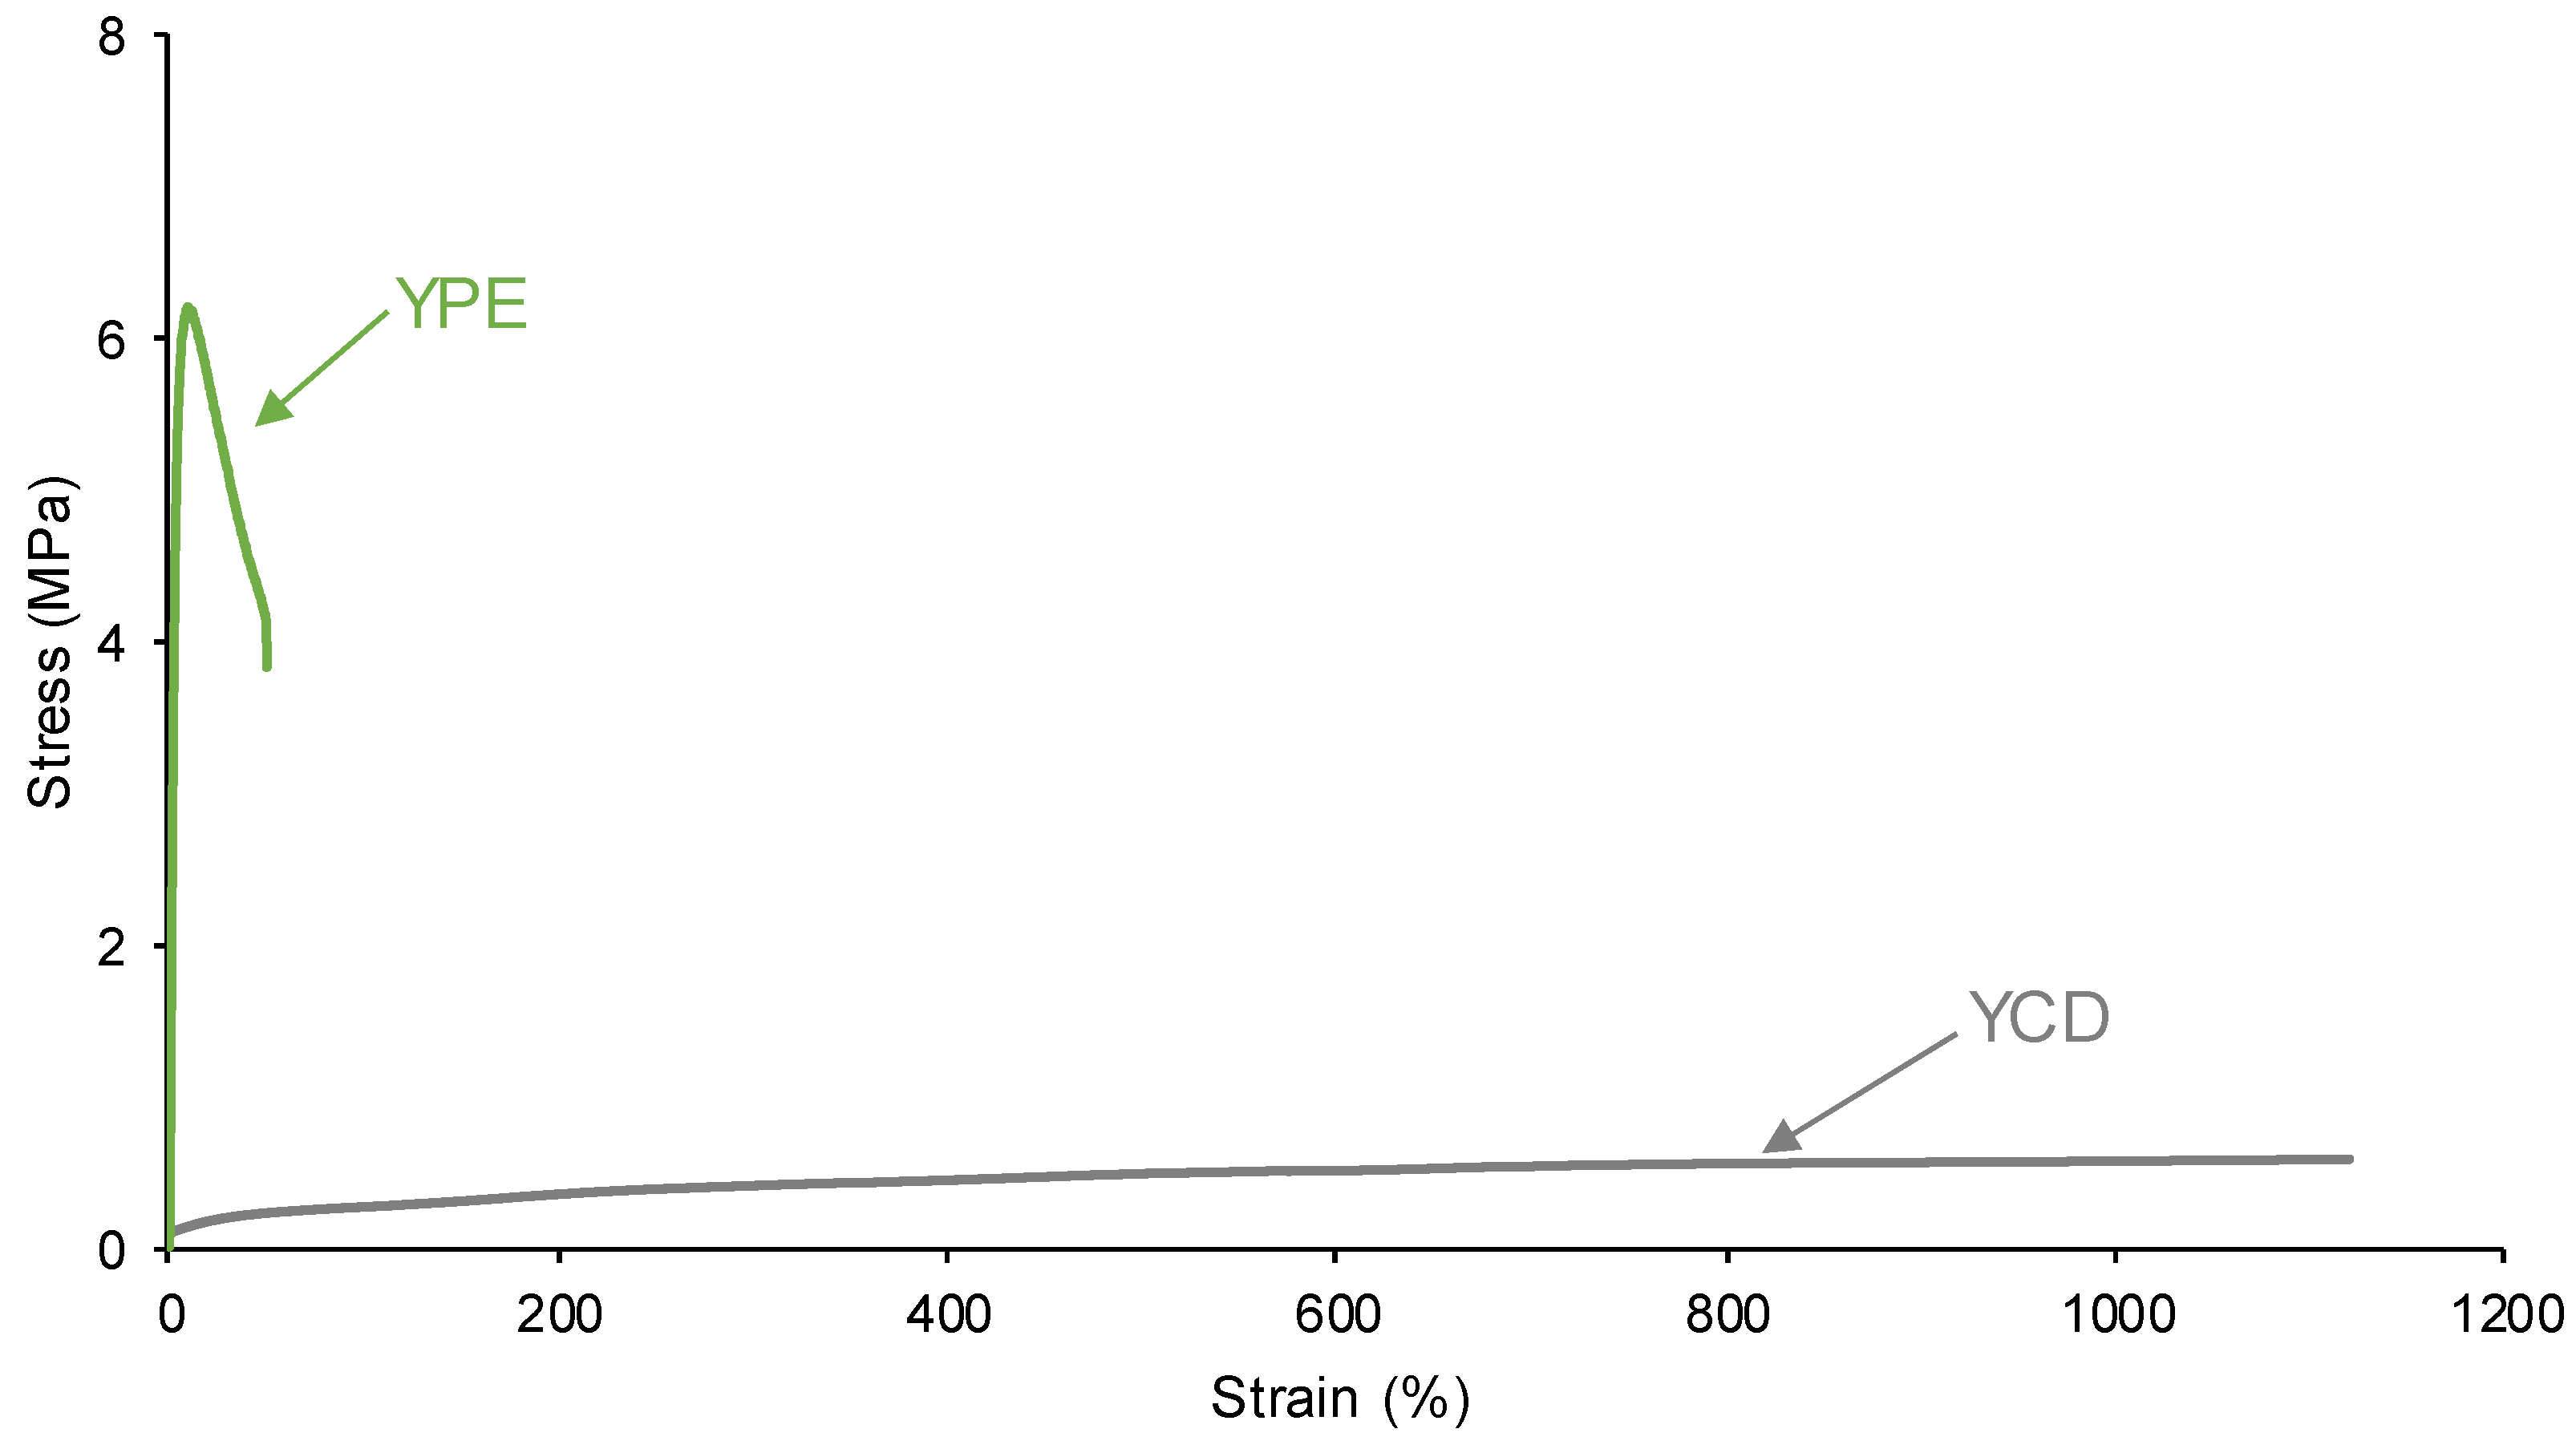
Figure 19.
Proposed non-covalent dynamic exchange self-healing mechanism in YCD.
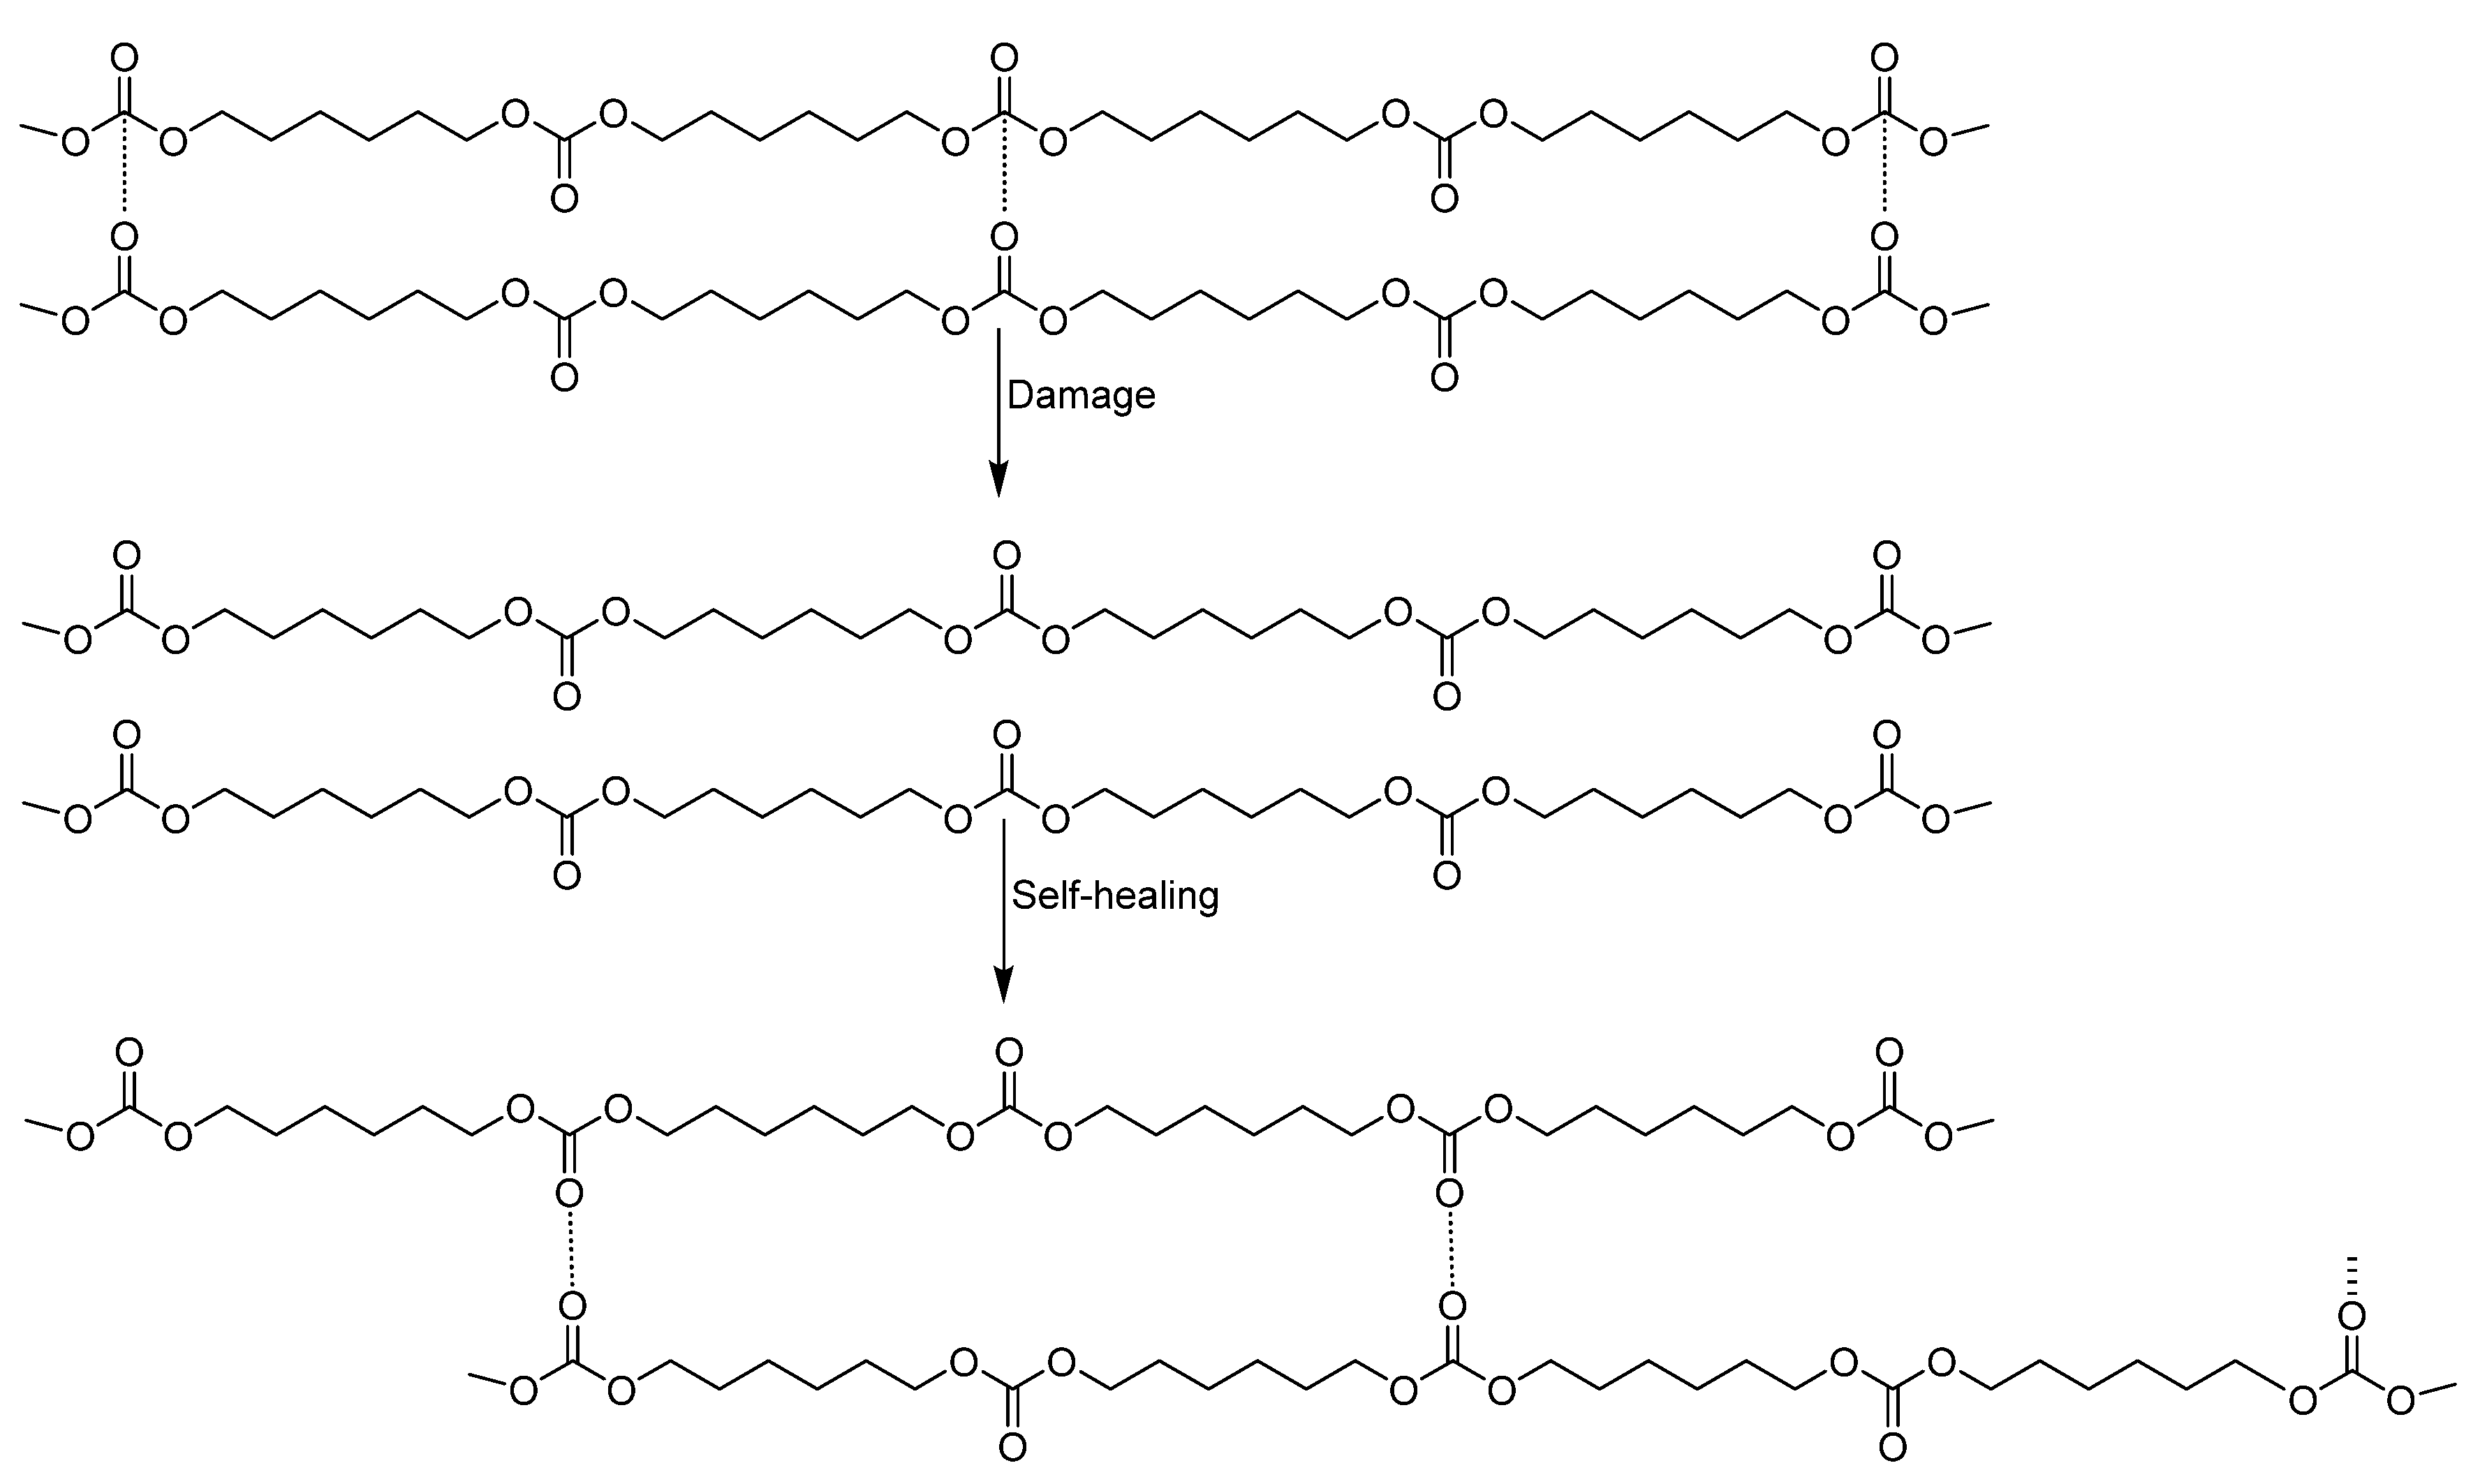

Table 1.
Molecular weights of the PUs.
| PU | Mn (Da) | Mw (Da) | Mz (Da) | PDI |
| YCD | 19762 | 66779 | 178483 | 3.4 |
| YPE | 16986 | 40299 | 82150 | 2.4 |
Table 2.
Percentages of different C=O species obtained by curve fitting of the carbonyl stretching region of the ATR-IR spectra of the PUs.
Table 2.
Percentages of different C=O species obtained by curve fitting of the carbonyl stretching region of the ATR-IR spectra of the PUs.
| Wavenumber (cm-1) | YCD | YPE | Assignment |
| 1653-1667 | 9 | 8 | Bonded urea |
| 1692-1695 | 15 | 10 | Free urea |
| 1716-1719 | 14 | 26 | Ester-ester, bonded urethane |
| 1726-1732 | 38 | 56 | Carbonate-carbonate, Free C=O (ester), free urethane |
| 1742 | 24 | - | Free C=O (carbonate) |
Table 3.
Intensities and 2θ values of the main diffraction peaks of the PUs.
| PU | 2θ (°) | Intensity (a.u.) | 2θ (°) | Intensity (a.u.) | 2θ (°) | Intensity (a.u.) | 2θ (°) | Intensity (a.u.) | 2θ (°) | Intensity (a.u.) |
| YCD | 20 | 3186 | - | - | - | - | 23 | 1677 | - | - |
| YPE | - | - | 21 | 4182 | 22 | 2092 | - | - | 24 | 859 |
Table 4.
Intensities and 2θ values of the main diffraction peaks of the polyols.
| Polyol | 2θ (°) | Intensity (a.u.) | 2θ (°) | Intensity (a.u.) | 2θ (°) | Intensity (a.u.) | 2θ (°) | Intensity (a.u.) | 2θ (°) | Intensity (a.u.) |
| CD | 20 | 3825 | - | - | - | - | 23 | 3891 | - | - |
| PE | - | - | 21 | 6042 | 22 | 6759 | - | - | 24 | 1035 |
Table 5.
Chemical species on the PU surfaces. C1s photopeak. XPS experiments.
| Species | Percentage (at.%) | |
| YCD | YPE | |
| C-C, C-H (B.E. = 284.9 eV) | 83 | 69 |
| C-O (B.E. = 285.5-285.6 eV) | 7 | 3 |
| C-N (B.E. = 286.6-286.9 eV) | 7 | 19 |
| C=O (B.E. = 289.1-289.2 eV) | 2 | 9 |
| O-(C=O)-O (B.E. = 290.8 eV) | 1 | - |
Disclaimer/Publisher’s Note: The statements, opinions and data contained in all publications are solely those of the individual author(s) and contributor(s) and not of MDPI and/or the editor(s). MDPI and/or the editor(s) disclaim responsibility for any injury to people or property resulting from any ideas, methods, instructions or products referred to in the content. |
© 2024 by the authors. Licensee MDPI, Basel, Switzerland. This article is an open access article distributed under the terms and conditions of the Creative Commons Attribution (CC BY) license (http://creativecommons.org/licenses/by/4.0/).
Copyright: This open access article is published under a Creative Commons CC BY 4.0 license, which permit the free download, distribution, and reuse, provided that the author and preprint are cited in any reuse.


