
Submitted:
24 February 2024
Posted:
26 February 2024
You are already at the latest version
Abstract
The agronomic characteristics of Cenchrus purpureus were assessed through a randomized block experimental design with seven accessions (Taiwan grass, King grass, Elephant grass, Merkeron, CT-115, Purpule grass and Maralfalfa) as treatments and four replications research was carried out at the Instituto Tecnológico Superior de Tantoyuca, in 2019 and 2020, under rainfed conditions. Sowing density was established at 36 tillers in 25 m2. Green and dry matter yield, daily rates of dry matter accumulation in leaves, leaf/stem ratio, height, leaf area index and cutting frequency were assessed. Rainfall amount, temperature, relative humidity and global radiation levels were recorded to assess their effect on the evaluated variables. One-way ANOVA and multivariate analysis techniques, such as multiple linear regression (MLR), Clustering, and Principal component analysis (PCA) with the Statistica V7 software, were used. The leaf area index was greatest (p < 0.05) on the dry season. Green and dry matter yield were greatest in Maralfalfa (p < 0.05). Variation in the results is attributed to weather phenomena; nonetheless, Elephant grass and Maralfalfa showed the highest yields. Quality parameters must be evaluated to identify those grasses with the best attributes.
Keywords:
Mathematical models
; Fodder
; Yield
; drought
; Tropic
1. Introduction
Fodder production for cattle feeding occupies a third of the Earth’s surface, which is important for its’ contribution to food security [1]. 25% of the total protein, 18% of the total calories [2], and 34% of the beef [3] consumed at a global level are generated in that space.
The main use of agricultural land in Latin America is cattle rearing [4]; in Mexico, animal husbandry occupies more than 55.9% of the land area, and 29.3% of the total agricultural land area [5]. The largest farming system is focused on meat production, which is concentrated in 10 Mexican states including Veracruz [6]. The Huasteca Alta Veracruzana (HAV) region is representative of the cattle rearing activity. This region concentrates more than 162,000 cattle production units in 3.7 million hectares, with a total of 5.8 million bovines [7]. In HAV, cattle feeding is based on fodder grasses and pastures, which are considered pillars of animal husbandry in Mexico and all over the world [8] due to their efficiency for the net production of proteins for human consumption [9]. Fodder quality and production rates have been affected by climate change, and this has fostered the development of research that seeks to determine the impact of the interaction between the modified climatological conditions and the different areas of animal husbandry, but this has not been satisfactorily achieved so far [10,11,12]. The efficient use of grazing lands is key for the sustainability and productivity of the cattle farming sector; however, to achieve this, commonly used fodder grasses must be evaluated to identify those that were able to adapt to the current climate conditions. It has been proved that improved grasses have a greater biomass production potential, which makes them viable options to replace local species, or those considered native or traditional [13].
Cenchrus is a highly diversified genus [14], with around 145 extant species [15]. Its productive potential in conditions of adequate irrigation and fertilization has been proven [16], as in the case of Elephant grass, a species characterized by its’ large biomass production [17]. This is a species native to Africa and it has been introduced successfully to several tropical and subtropical countries due to its high capability to adapt to different agro-ecological systems, in which it has been used as fodder crop [18]. However, weather conditions in the tropics comprise well-defined rain and drought periods, which affect crop productivity [19].
Fodder production and quality must be carefully evaluated and, based on this evaluation, take proper management decisions to improve the productivity of cattle farming units, and to adapt to the conditions provoked by climate change [20]. These modified environmental conditions (climatic variability) have not been thoroughly investigated, nor their global impact evaluated [12]; in the case of the HAV, the months classified as abnormally dry have increased to 10 from 2016 to 2021, and the region suffered from extreme drought in some years of this period. [21]. Thus, this study aimed to evaluate the agronomic performance of seven accessions of Cenchrus purpureus under the current climate conditions of the HAV.
2. Materials and Methods
2.1. Description of the Experimental Site
2.1.1.
The research was carried out at the experimental field of the Instituto Tecnológico Superior de Tantoyuca, in the municipality of Tantoyuca, state of Veracruz, Mexico, located in the HAV region (Figure 1), between parallels 97° 59’ and 98° 24’W, and 21°06’ and 21°40’N, at an altitude up to 300 masl. This region has a warm subhumid climate, with rainy summers, a mean annual temperature between 22 and 26°C, average annual rainfall between 1100 and 1300 mm, and a relative humidity of 44% [22]. The characteristics of the soil in the site where the pre-study experiment was performed are the following: argillaceous texture, a pH of 7.8, light salinity, 5 % nitrogen content, 50 ppm phosphorus, 49 ppm potassium and organic matter (>5.1 %), according to the analysis performed at the soil laboratory of the Universidad Veracruzana.
2.1.2. Evaluated Germplasm and Experiment Design
The vegetal material used for this study belongs to the Cenchrus purpureus species, and the evaluated accessions, taken as treatments, were King grass, Maralfalfa., Elephant grass, Merkeron, Purple grass, CT-115 and Taiwan, obtained from the Instituto Nacional de Investigaciones Forestales Agrícolas y Pecuarias at the La Posta experimental field, in the town of Paso del Toro, Veracruz. A randomized block experimental design with seven treatments and four replications, which were evaluated throughout a 12-month period under rainfed conditions.
2.1.3. Experiment Site and Sowing
A 1,222 m2 area was used to create 28 plots of 25 m2 (5 m x 5 m), distributed in 4 blocks (7 plots p/block), and a distance of 2 m between plots and blocks. Sowing of the assessed accessions was done with two stems (phytomers with three internodes) per sowing point, introducing two internodes in the seedbed, and placing the stems at a 45° angle. The distance between crop rows and sowing points was 80 cm, obtaining a density of 36 tillers in the 25 m2 of every experimental unit. The seeded ground was only prepared by primary tillage (plowing and harrowing). Seeding was done in September 2018, and the cut of homogenization was made on July 2019, at 15 cm above soil level.
2.1.4. Sampling and Cutting Frequency (CF)
A sample area of 2 m2 (1 m x 2 m) was obtained leaving 2 m of border of each of the experimental units to avoid the edge effect. The cutting frequency was determined considering a mean intercepted radiation rate of ≥ 95 in the four replications of each treatment [24]. Four consecutive cuts were performed from July 2019 to April 2020.
2.1.5. Evaluated Variables
Green matter yield (GMY) and dry matter yield (DMY). Cuts were done at 15 cm above soil level for GMY purposes, and all the biomass of the usable sample (2 m2) was weighed immediately after cutting, using a digital scale with a minimum precision of 1 g 5 whole plants (leaf and stem) were randomly selected to determine the DMY to obtain a subsample of 300 g, which was dried in a forced air lab oven at 65 °C until achieving a constant weight [25]. The obtained results were extrapolated to 10,000 m2 (ha).
Leaf:stem ratio (LSR) and accumulated dry leaf matter rate (ADLMR). 5 plants were selected from the biomass obtained from the sample, and the leaves were separated from the stem. Once separated, the stems were all placed in a forced air lab oven at 65 °C until achieving a constant weight. The LSR was estimated by dividing the dry weight of the leaf samples between the dry weight of the stem samples. The ADLMR was calculated dividing the dry leaf matter yield between the number of days passed from cutting period to cutting period. To determine the values of the GMY, DMY, LSR and ADLMR variables per season (Dry and Rainy), the value of each variable per accession obtained in the cutting of each period were added up, and this was added up to the measurements of the variables of each accession obtained within a year to calculate the annual production [26].
Leaf area index (LAI) and height (H). The LAI was determined with five randomly selected plants taken from the sample; afterwards, the width and length of the fourth leaf of each selected plant were measured to use the method proposed by Herrera [27]. The HI was determined using a measuring tape, calibrated in meters, centimeters and millimeters, to measure five plants of each sample at every cutting period, from soil level to the last leaf.
2.1.6. Climate Variables
Some climate variables that are important for biomass production, such as average rainfall (mm), relative humidity (%), global radiation (W/m2), mean temperature (°C) and reference evapotranspiration (mm), were taken during the development of the research activities (Figure 2). These data were obtained from the weather station located at the experimental field of the Instituto Tecnológico Superior de Tantoyuca. For the purposes of this research, “dry season” is defined as the months of the year in which reference evapotranspiration is greater than the average rainfall because, in these conditions, crops are in a state of stress due to a lack of moisture, and this period is considered key to determine the need for irrigation [28,29].
2.1.7. Statistical Analysis
Analysis of variance (ANOVA). The Statistica v. 10 software was used for statistical analysis; the general linear model (GLM) was as follows:
Where:
Yijk = the quantitative response variable of the i-th accession and the j-th replication.
µ = Overall mean
αi = fixed effect of the i-th C. purpureus accession
= effect of the j-th block
εijk = random error associated to each observation, where ij∼NI(0,σ2), normality was analyzed with the Shapiro-Wilk test; and homoscedasticity, with Bartlett’s test (p < 0.05). The means were compared with the Fisher method (p < 0.05).
Multivariate analysis. Using the studied response variables from each cutting performed, and the monthly average climatological variables of the research site, a multiple linear analysis was executed to ascertain the weight climatological variables have on the assessed accessions. The MLR model is as follows:
Where:
= Dependent variable of the i-th accession
The assessed accessions were typified with the obtained agronomic characteristics and yield indicators [30], through multivariate analysis (K-means clustering), Dendrogram (Graph clustering) was done through complete Euclidean distance transform, amalgamation was done through the unweighted pair-group method, and normalized through the 1-Pearson correlation coefficient [Correlation distance/maximum distance]*100.
Lastly, Principal Component Analysis were used to observe the possible grouping of the agronomic and yield variables, as well as the accession grouping [31].
3. Results
The Taiwan accession showed a greater LAI in the rainy season (p < 0.05) than King grass, Elephant, and Purple grass accessions, and similar to the rest. Regarding the ADLMR, the Merkeron grass accession showed the highest value, statistically different (p < 0.05) only to the Taiwan and King grass accessions, thus demonstrating its capability to accumulate dry matter in the leaves; consequently, this accession showed a LSR of 0.88, the greatest in all the accessions, showing a statistical difference (p < 0.05) with the CT-115 accession, which had the lowest value (0.58). CT-115 was the accession with the greatest capability to accumulate dry matter on the stems, which is made patent by the fact that it is one of the tallest accessions, only lower than King grass and Maralfalfa. An important characteristic from the point of view of productivity is the cutting frequency (CF), that is, the time (days) it takes for the plant to reach maturity and, consequently, harvest time. Merkeron, Elephant and Purple grasses were harvested at intervals ∼60 days, while the rest of the accessions took ∼80 days (p < 0.05) (Table 1).
CT-115 showed the lowest LAI off all the accessions (p < 0.05) during the dry season; on the other hand, Elephant grass had the highest ADLMR, showing a statistical difference (p < 0.05) with Merker grass, Taiwan A-144, King grass and CT-115. The highest LSR was observed in Purple grass (p < 0.05); nevertheless, this accession had the lowest H, showing notable differences with Elephant grass and Taiwan. There was little variation in CF, with Elephant grass having the lowest value, like King grass and CT-115 (p > 0.05) and showing statistical differences with the rest of the accessions (p < 0.05). Merkeron grass was the accession with the most days of cutting frequency of all (p < 0.05) (Table 2).
Table 3 shows that the LAI showed no statistical difference (p > 0.05) among the accessions. However, it is important to highlight the ADLMR variable in Elephant grass, which had a value of 228.51 kg/ha/day, the highest in all treatments, showing statistical differences (p < 0.05) with Merkeron grass, Taiwan, King grass and CT-115 and a greater capability to deposit dry matter on the leaves. Notwithstanding the fact that Elephant grass showed and adequate LSR, it was surpassed by Purple grass, which was statistically different (p < 0.05) from King grass, CT-115 and Maralfalfa. The H obtained was not statistically different (p > 0.05) among the assessed accessions. The shortest CF was 71 days, corresponding to Elephant grass, while the longest corresponded to the Taiwan accession, showing statistical differences (p < 0.05).
The differences in the climate parameters between the dry and rainy seasons (Figure 2) had an influence on the agronomic behavior of the assessed accessions. In the rainy season, LAI, ADLMR, H and CF noteworthy values were reported. In dry season, on the other hand, the LSR was greatest (p < 0.05).
The GMY of the assessed accessions was not statistically different during the rainy season; nevertheless, the DMY results indicate that CT-115 was quantitatively superior to all the other accessions, and statistically different (p < 0.05) from Elephant and Merkeron grass. Conversely, the GMY of Maralfalfa was greatest in the dry season, and it was statistically different from CT-115 and Taiwan (p < 0.05). In turn, Elephant grass had the highest accumulation of dry matter (t/ha), followed by Purple grass and Maralfalfa (p > 0.05) in the same period. The annual cumulative green matter yield was greatest in Maralfalfa, and statistically different (p < 0.05) from Taiwan, while Elephant grass had the greatest amount of accumulated dry matter of all the accessions after a year of assessment (Table 4).
Table 5 shows the average GMY and DMY per cutting period. The capability of Elephant grass of producing dry matter (DM) under the particular climatological conditions of the HAV is evident. There are statistical differences between GMY and DMY (p > 0.05) in both seasons. The greatest values for these variables were reported in the rainy season.
The correlation analysis achieved to determine the degree of association between the DMY with others agronomic variables indicated positive correlations with LAI, H, ADLMR, and negative correlation with LSR. Nevertheless, it was found that there is little association with the GMY variable (r = 0.147), with a value of p= 0.083. In the case of the H and LSR variables, the association was low (r = 0.192 and 0.262, respectively). There is an intermediate value association with the LAI variable (r = 0.572). There was a high degree of association with the ADLMR variable (r = 0.889), and a value of p= 0.001 (Table 6).
The MLR implemented for the creation of statistical models to describe the association degree between climatological and agronomic variables of C. purpureus in the HAV is presented in Table 7. From all the performed analysis, the one that obtained a medium to high value in the goodness-of-fit indicators (r= 0.73 and r2a=0.52) was the GMY variable, where the Forward method included all the climatological variables. The goodness-of-fit indicators for the DMY mathematical model (r = 0.22 and r2a=0.03) do not indicate a good fit of the data, and likewise with the LAI, LSR and ADLMR. The MLR model (Forward method) for H variable showed a medium-high degree of association (r= 0.70 and r2a = 0.48), only including temperature and global radiation.
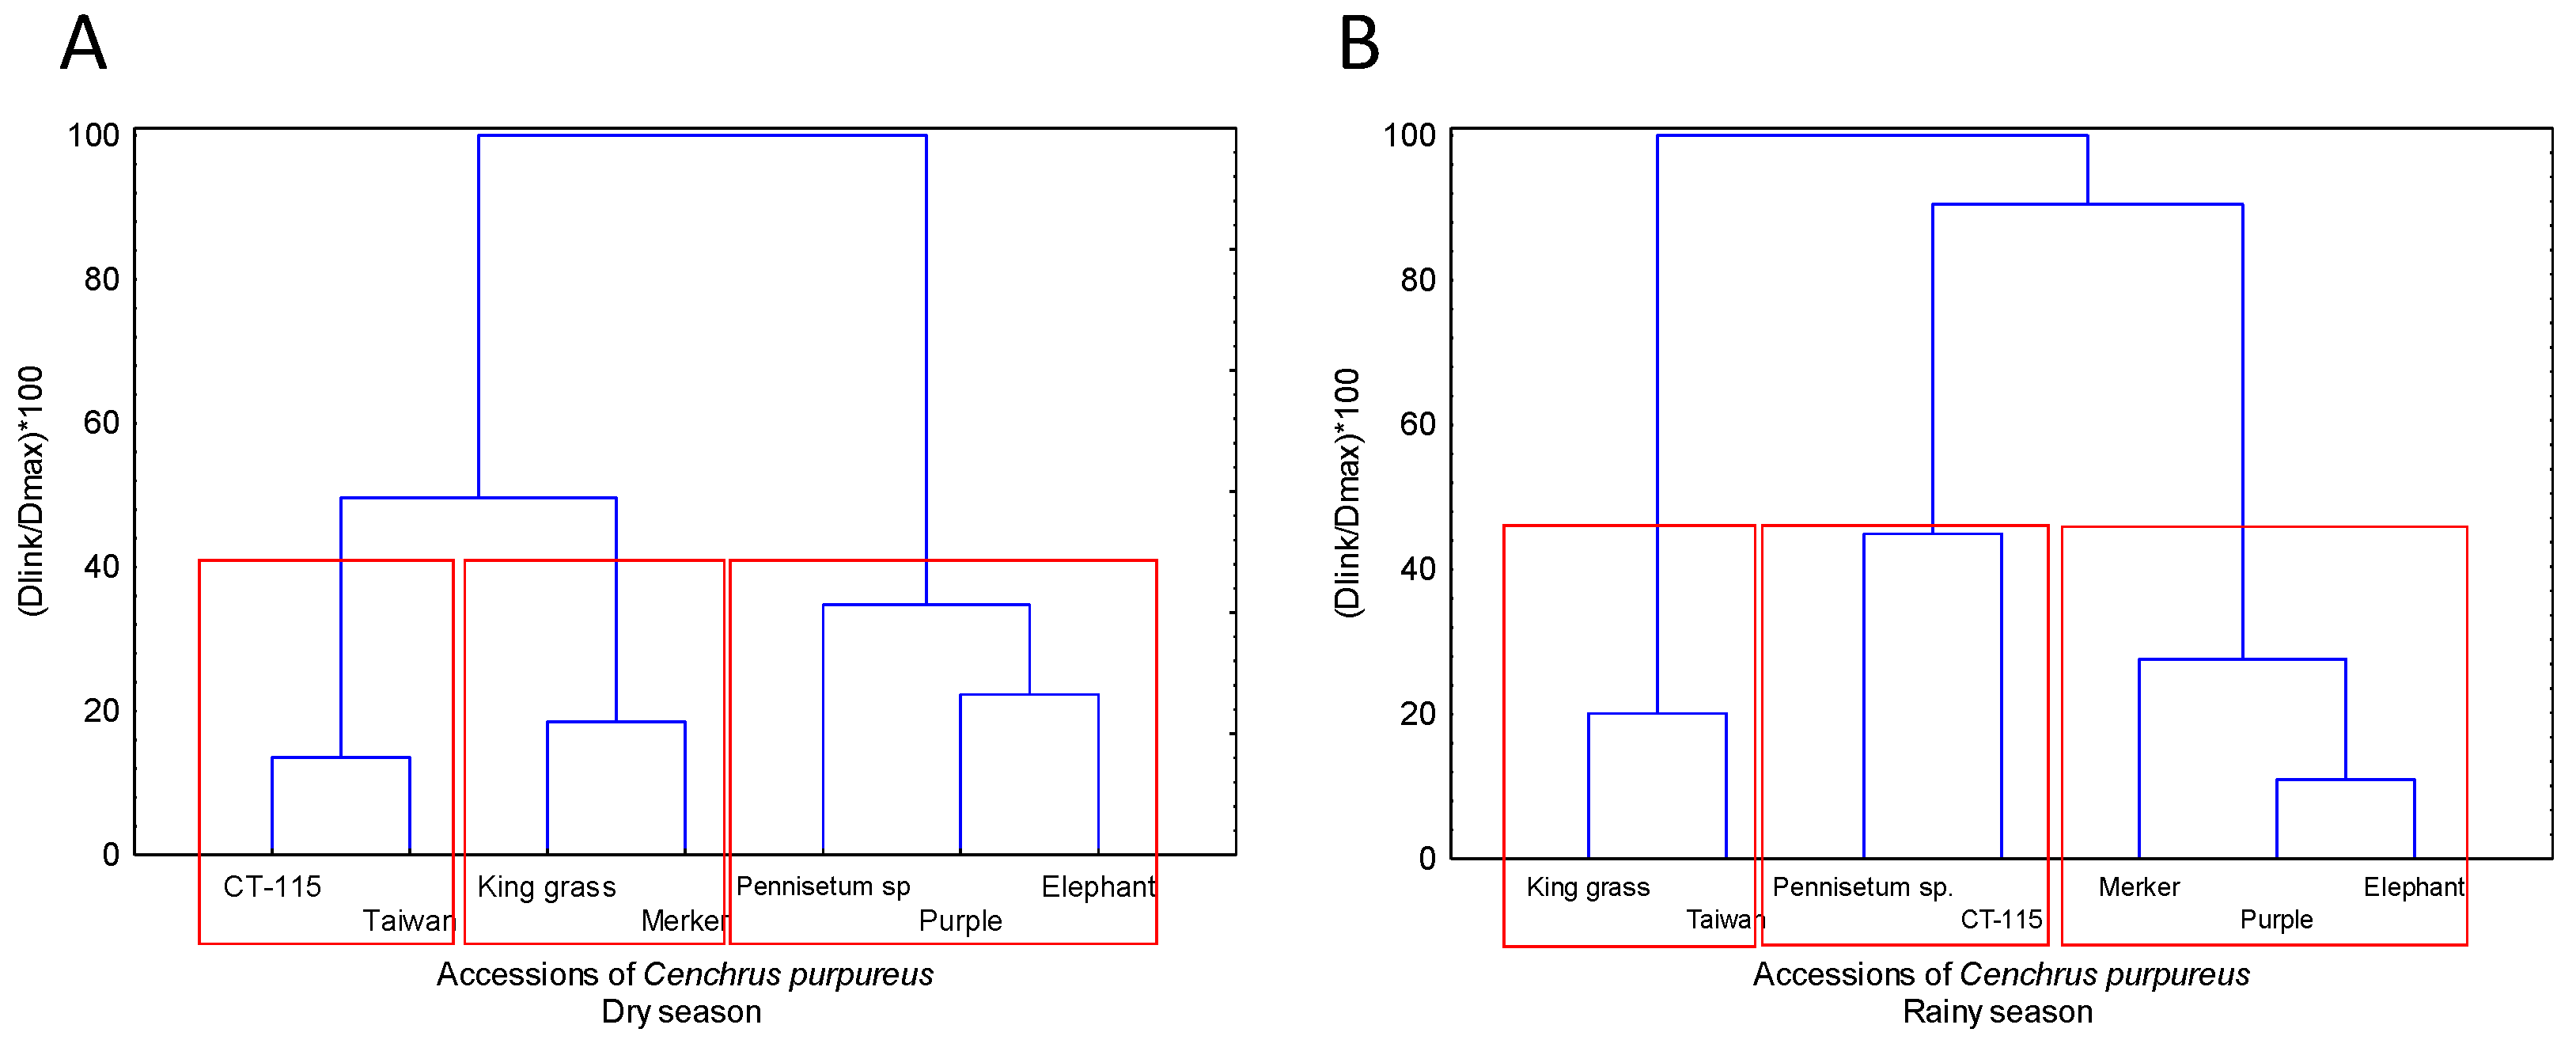
The implemented cluster analysis formed three accession groups according to their agronomic descriptors. Group 1 (G1) includes Elephant and Purple grass, and it is characterized by having the highest DMY, LSR and ADLMR values. Group 2 (G2), comprising Maralfalfa and Merkeron grass, stands out for its high productive capability with regards to GMY. Finally, Group 3 (G3), made up by CT-115, King grass and Taiwan, was characterized by the lowest records of all the indicators used for this analysis (Table 8 and Figure 4).
Figure 3.
Dendrogram, clustering different C. purpureus accessions according to their agronomic and yield descriptors in the Huasteca Veracruzana region. (a). Dry season. (b). Rainy season.
Figure 3.
Dendrogram, clustering different C. purpureus accessions according to their agronomic and yield descriptors in the Huasteca Veracruzana region. (a). Dry season. (b). Rainy season.
The principal component analysis, completed with all the estimated variables (rainy and dry seasons) of the seven C. purpureus accessions, allowed the creation of two groups of orthogonally independent variables. The first group (Factor 1) corresponds to those known as agronomic characteristics, and the second group (Factor 2) is made up of estimated yield variables (Figure 4).
Figure 4.
Grouping of C. purpureus accessions according to two principals’ components: Factor 1. Agronomic characteristics and Factor 2. Yield parameters. (a) and (c). Dry season. (b) and (d). Rainy season.
Figure 4.
Grouping of C. purpureus accessions according to two principals’ components: Factor 1. Agronomic characteristics and Factor 2. Yield parameters. (a) and (c). Dry season. (b) and (d). Rainy season.
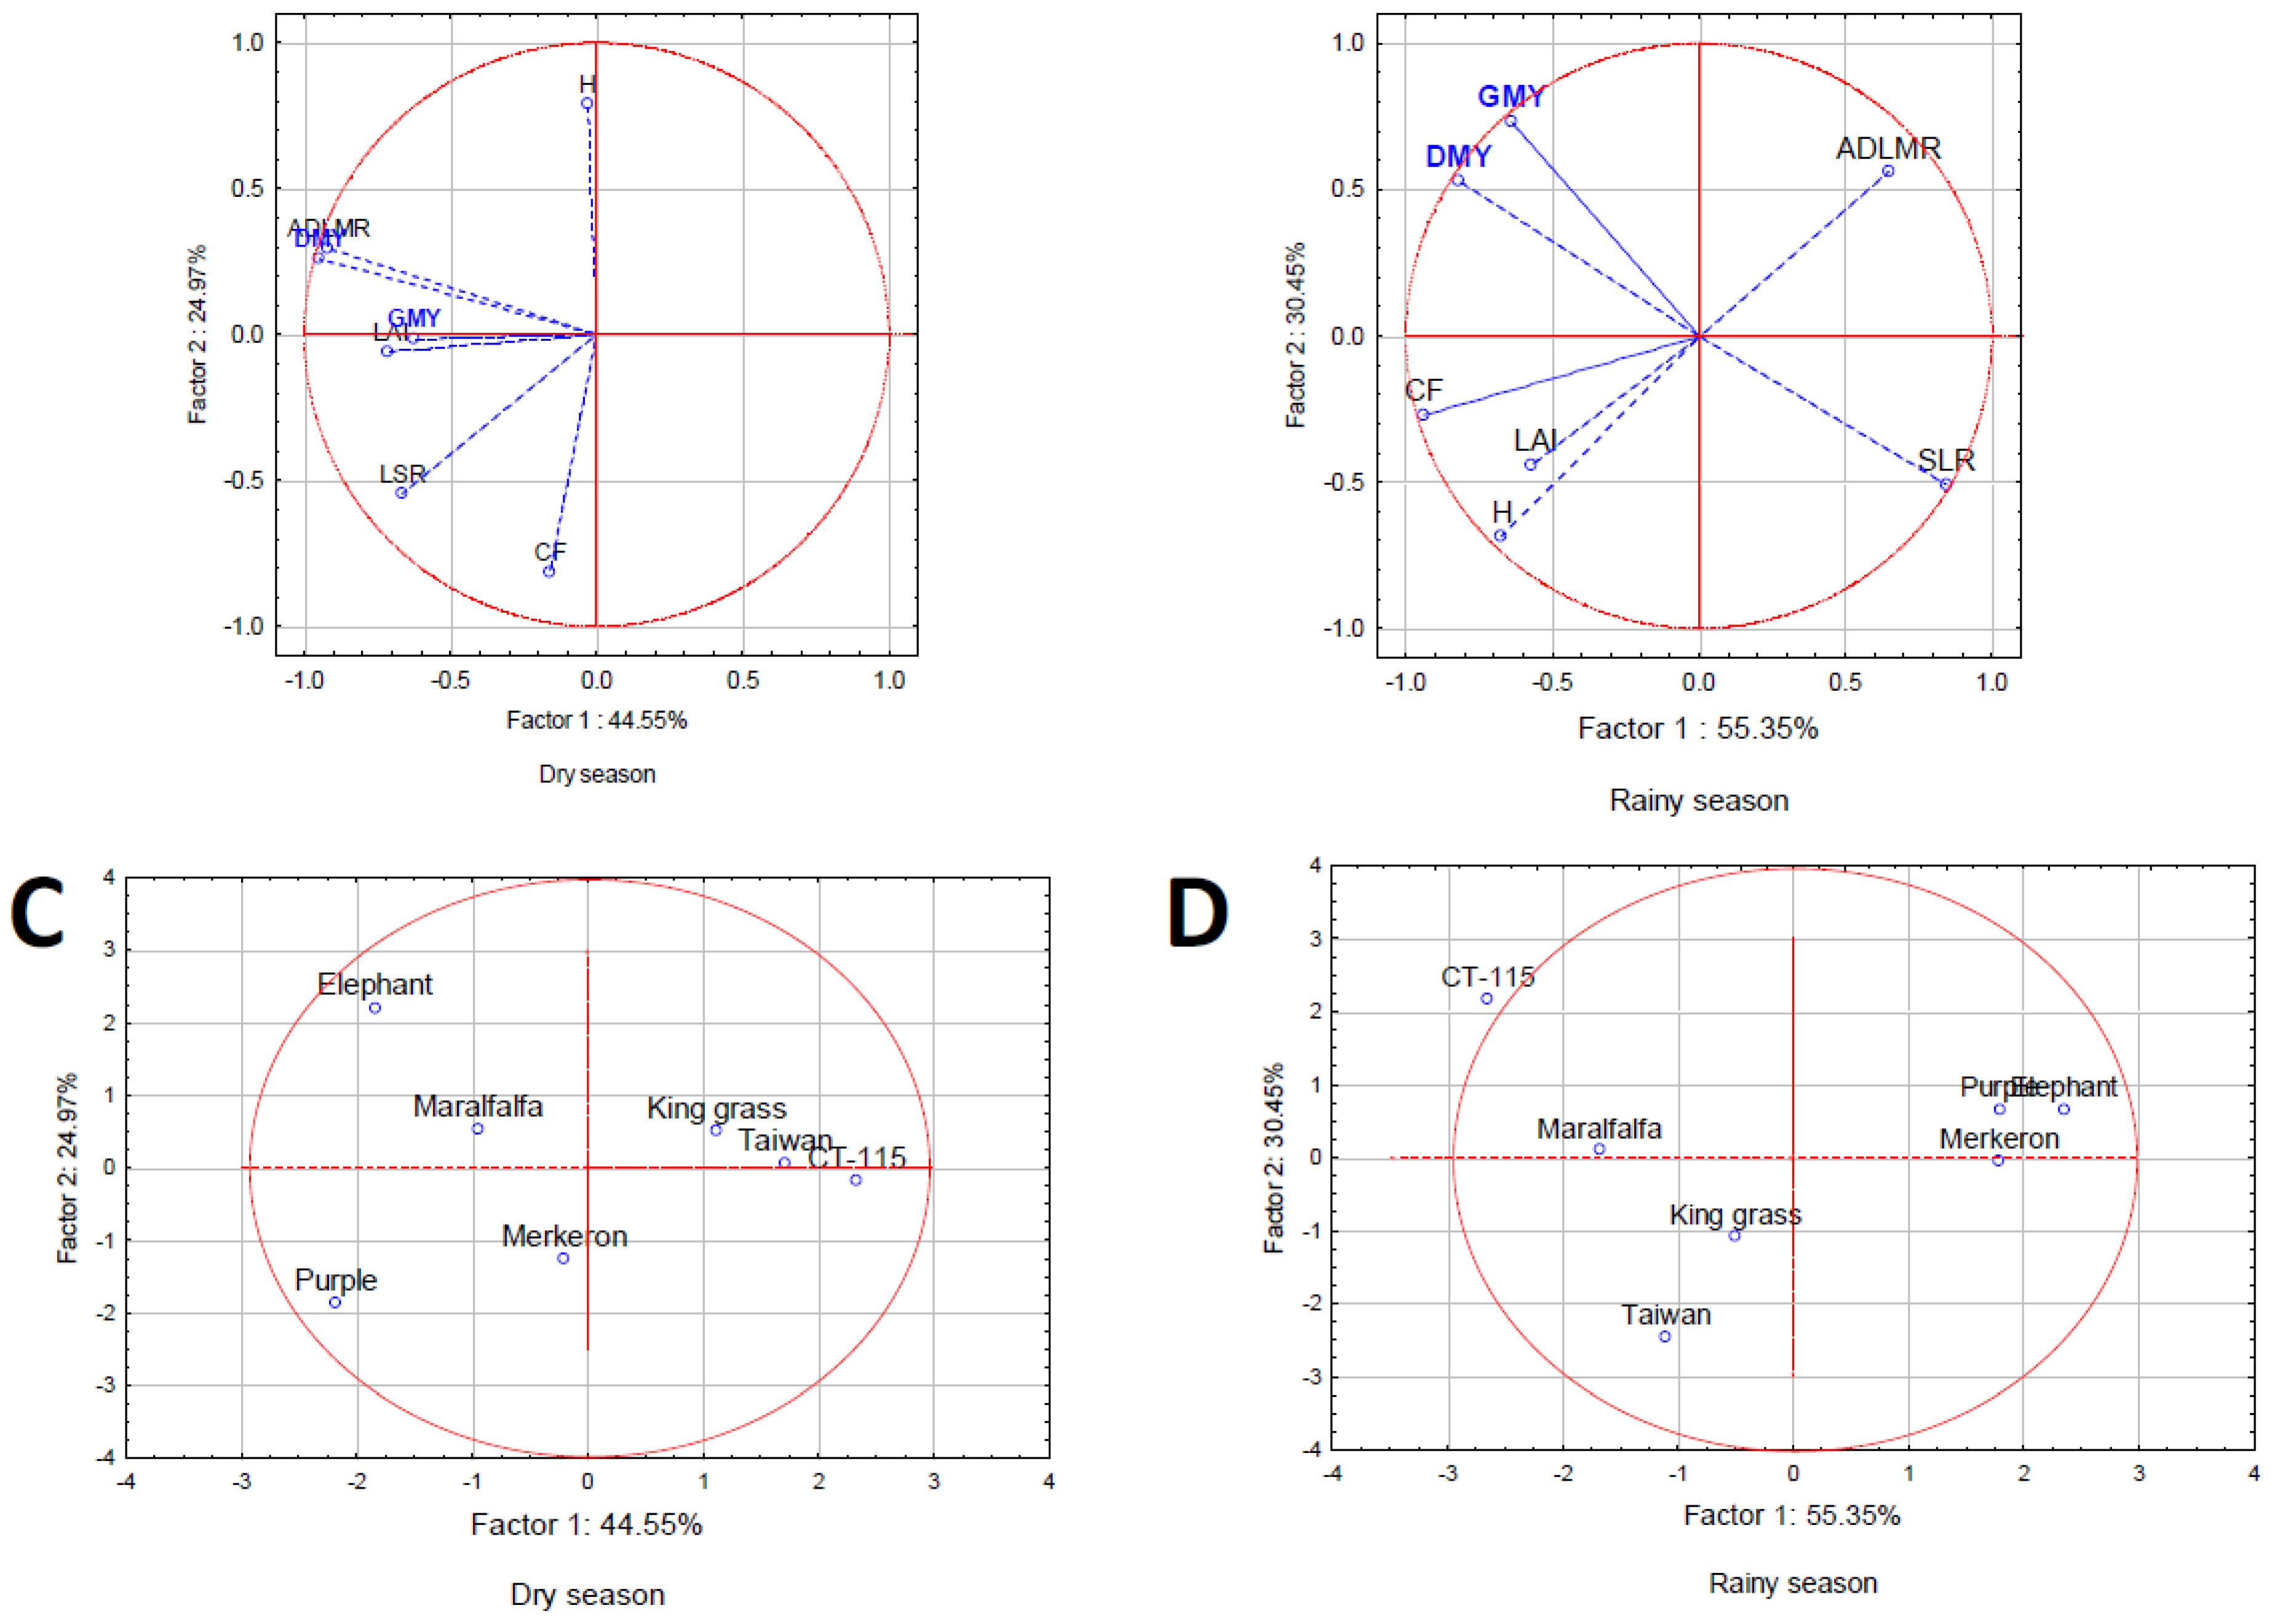
The analysis implemented in the dry and rainy seasons (Figure 4), formed three groups of Cenchrus purpureus accessions, a) outstanding agronomic and yield characteristics, b) outstanding yield characteristics, and c) unremarkable agronomic and yield characteristics. The accessions integrating each group in both seasons are not the same; their genetic characteristics and interactions with the environment define their performance.
4. Discussion
The LAI is an important parameter for the development and production of biomass in a grass crop, because it partially depends on their photosynthetic capability [31]. Taiwan was the accession that had the highest LAI of the assessed accessions. The different climatological conditions in the rainy and dry seasons were decisive in the modification of this agronomic characteristic. The LAI value of CT-115 and Maralfalfa doubled in the rainy season with respect to the dry season (Table 1 and Table 2), which was also reported by Maranhão et al. [32], upon evaluation of a species of the Cenchrus genus in eastern Brazil along three climatologically defined periods (rainy, transitional, and dry) and different cutting ages. In their research, they found that LAI was two times greater in the rainy season, in comparison with the dry season; additionally, according to their results and analysis, they determine that there is a positive correlation with age. Seemingly, the high LAI favor apical growth due to the shading effect caused by the elongation of the stem, as mentioned by these authors, which resembles the results of the research presented in Table 1.
The ADLMR of the Taiwan accession on the rainy season was greater than reported by Vinay-Vadillo et al. [33], in the central region of Veracruz state. Despite the application of different doses of fertilizers, the values that they obtained were lower than those reported in this study. The sowing density remained the same; thus, the greater accumulation of DM/ha, per day, may be attributed to the longer CF, and to a greater acidity of the soil where the experiment was carried out, which negatively affected yield. ADLMR was led by Elephant grass, Purple grass and Maralfalfa (Table 3); these results were corroborated by Reyes-Pérez et al. [16], who reported that these same accessions have a greater potential for this production indicator and have the capability of increasing it with the application of fertilizers, and a greater cutting age.
The LSR results of the evaluated accessions showed greater values in the dry season, in comparison with the rainy season. Purple grass stood out from the rest with regards to this variable, showing a value of 1.03 (at 80 cutting age). This result does not coincide with the results reported by Vinay-Vadillo et al. [33], who evaluated this parameter at 45 days regrowth, however, they found that, upon harvest at the 60th day, LSR values decreased in the cultivars submitted to irrigation with and without nitrogen fertilization, showing that the stem proportions in this grass increase with age. The LSR decreased due to the increase of the stem proportion, mainly in the rainy season, which favors apical growth. This was also described by Habte et al. [26] upon evaluating 45 genotypes of C. purpureus in the dry and rainy seasons of Bishoftu, Ethiopia, at 1890 masl. However, it has been shown [354] that sowing density plays an important role on LSR of C. purpureus cultivars, in which values of 1.6 were obtained when the number of plants per hectare was 11,350. For the purposes of this research, plant density per hectare in the research units was established at 15,625, which could partially explain the lowers values found in the assessed accessions. The increase of the stem proportion in this genus reduces fodder quality in terms of their neutral detergent fiber content, as indicated by Ledea-Rodríguez et al. [35].
In the case of King grass harvested at 80 days, the LSR was 0.78 and 0.89 in the rainy and dry season (Table 1 and Table 2). Seemingly, this result is related to an increased availability of water, because it differs to the reports of Reyes-Pérez et al. [16], who reported a LSR value of 1.0 of this accession at 45 days of regrowth, with and without fertilizers, at different doses and concentrations. However, when harvested after 60 days, the value of this parameter oscillated between 0.66 and 0.70, which led to the conclusion that there is a negative correlation between the LSR and yield, which contrasts with the results obtained in this study, which found values of r= 0.262 and r2= 0.069 between the LRS and DMY (Table 6).
King grass is referred to in this study as one of the accessions with the greatest H value per cutting period (2.00 m). This result differs with the reports of Reyes-Pérez et al. [16], who, upon application of fertilizers at several concentrations, managed to increase this agronomic characteristic, surpassing their control treatment (without fertilizer) at 45 and 60 days. The heights obtained from the non-fertilized accessions that they assessed were generally lower than those reported in this study, which suggests a favorable response to this kind of agricultural practices. On their part, Cruz et al. [36], upon evaluating new clones generated from CT-115, reported that the height parameters surpassed those of the parent plants despite having been established in moderately saline soils, and in drought conditions. This is similar to what is reported in this study, where the height of the assessed accessions differs numerically (p > 0.05). Plant height in different C. purpureus genotypes partially depends on regrowth days; thus, the older the plant is, the taller it is [37], which could explain the mentioned difference.
The accessions with the greatest average GMY’s per cutting period were Maralfalfa and CT-115 (243 and 220 kg/ha, respectively), at CF of 83 days. These results are higher to those presented by Reyes-Pérez et al. [16], who assessed five C. purpureus accessions in a humid subtropical region of South America. They established short cutting periods, and used a greater sowing density, to which the difference is attributed. Nevertheless, these same authors coincide in that Maralfalfa obtained the highest value for this variable, demonstrating its capability to accumulate green matter Moreover, they reported that, assessed conditions of irrigation without fertilizers, CT-115 showed the lowest GMY when harvested at 45 days of regrowth (40.63 t/ha). This result is lower than that obtained with this same accession in this study, despite the fact it was assessed in unirrigated conditions. The difference in results may be related to the cutting frequency because the latter was above 40 days. Encountered yields were lower in the dry season, showing significance in them (p < 0.05). This same effect was reported by Habte et al. [26] and Tulu et al. [38], who associated the high GMY and DMY to the months of highest rainfall. Moreover, they found no significant differences between the genotypes they assessed, unlike the reported results here (Table 5).
The DMY is a desirable attribute in fodder crops, because there are nutrients in this fraction, which could be beneficial to ruminants. The results presented showed that some accessions have a greater capability to deposit dry matter, and the variation of the climatological variables between the rainy and dry seasons did not affect the behavior of this indicator in any considerable degree, which is the case for Elephant grass, Purple grass and Maralfalfa (Table 4). However, it was observed that DMY of the rest of the assessed accessions was affected by the climatological conditions of the rainy and dry seasons (p < 0.05). This indicates that these genotypes are susceptible to climate fluctuations, as demonstrated in an experiment carried out by Ledea-Rodríguez et al. [39] in Granma province, Cuba, where they evaluated three new C. purpureus accessions (CT-601, CT-603 and CT-605), conceived to tolerate drought conditions, in two periods (rainy and lightly rainy); however, they demonstrated their lower DM accumulation capabilities in the period of least rainfall, as reported in this study. Taiwan showed greater DMY in the rainy season, duplicating the amount shown in the dry season. Vinay-Vadillo et al. [34] evaluated the effect of fertilization on DMY of the Taiwan cultivar during the rainy season, which led them to the conclusion that the application of agrochemical agents helps to duplicate this variable; however, their yields do not surpass those reported in this study, possibly due to the shortened CF. The photosynthetic and DM accumulation capabilities show variation within the Cenchrus genus, the higher productive yields of some accessions in the seasons of most abundant rainfall are due to their intrinsic potential and the higher amount of nutrients dissolved in the ground because of the greater humidity, as illustrated by Habte et al. [26], upon evaluation of the DMY and GMY of several genotypes of this genus in similar conditions.
Among the assessed accessions, DMY per cutting, per year, was greatest in Purple grass and Maralfalfa (Table 5). In this respect, Reyes-Pérez et al. [16] mention that these cultivars showed the highest DMY, above king grass, CT-115 and Elephant grass, and they highlighted that fertilization and longer CF are factors that increase the deposit of DM [37,40,41] in all the assessed genotypes. This explains the greater DMY found in this study.
Most of the evaluated agronomic variables showed a low association degree, it was positive, low, and not significant for DMY and GMY (Table 6). With this result, it is possible to infer that the assessed accessions accumulate variable amounts of moisture on the stem, which occupies a greater proportion of the plant (Table 3). On the contrary, Habte et al. [26] found high positive correlations (0.86) between the total amounts of DMY and GMY, accumulated in several C. purpureus cultivars. Seemingly, the higher proportion of leaves (LSR 2.41 and 5.87 in the rainy and dry seasons, respectively) boosted this correlation. Moreover, these authors coincide in the results of the correlation between DMY and LSR (negative correlation), indicating that, the higher LSR is, higher is the total proportion of leaves in the plant and, consequently, the amount of DM represented by the stem is lower.
The data that best fit the MLR model correspond to GMY variable, which is shown by their goodness indicators (Table 7); Araujo et al. [42], report similar values in these indicators for several species of C4 grass crops. P. maximum (Tanzania and Mombasa), grass species with an erect growth habit, like those of the C. genus, reached r2 values between 0.78 and 0.87 in the univariate linear regression analysis in the ADLMR and ambient temperature variables. The step-by-step execution with the Forward method used in this investigation for the multivariate regression model included all the used climatological variables; from these, it can be observed that temperature has a negative angular value on biomass production. Andrade et al. [43] found that temperature is related to enzymatic physiological processes, such as photosynthesis, and other processes related to transport through cellular membranes. The production behavior of the assessed accessions may have been affected by the extreme climatological conditions under which this research was done (Figure 2).
Clustering analysis used ADLMR variable as the most significant in the configuration of the groups. This variable demonstrated importance for its significant value in the research developed by Ray et al. [30], in which they assessed 11 drought-resistant clones of C. purpureus. In their results, they reported that the clustering analysis formed three groups, which they describe by their biomass production yield as: promising, medium and low. The clustering and characteristics of the groups formed by these authors coincides with the reports of this study, and this confirms the genetic and productive variability that exists within the C. genus, as cited by Olivera-Castro et al. [14].
5. Conclusions
In general, the assessed accessions showed variations on their agronomic behavior and yield indicators, which are attributed to changes in the climatological variables between the rainy and dry seasons. Despite this, Elephant gras and Maralfalfa achieved the highest DMY and GMY in both seasons, even though there were minimal differences between them, proving their genetic capability to maintain a stable production in different environmental conditions. It is necessary to simultaneously evaluate the agronomic characteristics, yield and quality indicators of the assessed accessions in order to identify those who show the best levels in these attributes.
Author Contributions
Conceptualization, methodology, writing—original draft preparation, investigation, data analysis and editing, A.A.G., B.D.M.; writing—review and editing, K.L.S.M., P.C.A.; writing—original draft preparation, data analysis, B.D.M., M.B.M.; resources, C.V.C., A.R.A., A.H.B.
Funding
This research received no external funding.
Institutional Review Board Statement
Not applicable.
Informed Consent Statement
Not applicable.
Data Availability Statement
Data are contained within the article.
Acknowledgments
Authors thank CONAHCYT for the financial support.
Conflicts of Interest
The authors declare no conflicts of interest.
References
- Bengtsson, J.; Bullock, J.M.; Egoh, B.; Everson, C.; Everson, T.; O’Connor, T.; O’Farreli, P.J,; Smith, H.G.; Lindborg, R. Grasslands-more important for ecosystem services than you might think. 2019.Ecosphere 10. [CrossRef]
- Mottet, A.; de Haan, C.; Falcucci, A.; Tempio, G.; Opio, C.; Gerber, P. Livestock: On our plates or eating at our table? A new analysis of the feed/food debate. Global Food Security. 2017. 14:1–8. [CrossRef]
- Gerber, P.J.; Mottet, A.; Opio, C.I.; Falcucci, A.; Teillard, F. Environmental impacts of beef production: Review of challenges and perspectives for durability. Meat Science. 2015. 109:2–12. [CrossRef]
- FAO (Organización de las Naciones Unidas para la Alimentación y la Agricultura). El Estado Mundial de la Agricultura y la Alimentación. Cambio Climático, Agricultura y Seguridad Alimentaria. Roma. 2016. pp. 214. https://www.fao.org/3/i6030s/i6030s.pdf.
- CEDRSSA (Centro de Estudios para el Desarrollo Rural Sustentable y la Soberanía Alimentaria). Política pecuaria y ganadería sostenible en México. 2020. https://bit.ly/3pzIe9n.
- SIAP (Servicio de Información Agroalimentaria y Pesquera). 2021. Población ganadera. https://bit.ly/3KtARsn.
- Gaceta Oficial del Estado de Veracruz. Programa Sectorial Alimentando a Veracruz 2019-2024. 2019. [Online]. México: Gobierno del Estado de Veracruz. [Accessed 2022 abril 28] URL Disponible en: http://www.veracruz.gob.mx/finanzas/wp-content/uploads/sites/2/2019/11/Alimentando-veracruz.pdf.
- Corona, L. El metano y la ganadería bovina en México: ¿Parte de la solución y no del problema?. Agro Productividad. 2018. 11:46-51. https://bit.ly/3hz7ybf.
- Hennessy, D.; Shalloo, L.; Van Zanten, H.; Schop, M. ; De Boer. I. The net contribution of livestock to the supply of human edible protein: The case of Ireland. The Journal of Agricultural Science. 2021. 159:463-471. [CrossRef]
- Dumont, B.; Andueza, D.; Niderkorn, V.; Lüscher, A.; Porqueddu, C.; Picon-Cochard, C. A meta-analysis of climate change effects on forage quality in grasslands: specificities of mountain and Mediterranean areas. Grass and Forage Science. 2015. 70:239–254. [CrossRef]
- Ramírez.,R.J.L.; Zambrano, B.D.A.; Campuzano, J.; Verdecia, A.D.M.; Chacón, M.E.; Arceo, B.Y.; Labrada, C.J.; Uvidia, C.H. El clima y su influencia sobre la producción de pastos. Revista Electrónica de Veterinaria. 2017. 18(6), pp. 1-12. https://bit.ly/3ICNNvq.
- Rojas-Downing, M.M.; Pouyan, N.A.; Harrigan, T.; Woznicki. S.A. Climate change and livestock: Impacts, adaptation, and mitigation. Climate Change Management. 2017. 17:145-163. [CrossRef]
- Garcia, E.; Siles, P.; Eash, L.; Van Der Hoek, R.; Kearney, S.P.; Smukler, S.M.; Fonte, S.J. Participatory evaluation of improved grasses and forage legumes for smallholder livestock production in central America. Experimental Agriculture. 2019. 55:776–792. [CrossRef]
- Olivera-Castro, Y.; Castañeda-Pimienta, L.; Toral-Pérez. O.C. Morphobotanical characterization of Cenchrus purpureus (Schumach.) Morrone plants from a national collection. Pastos y Forrajes. 2017. 40:171–174.
- Dos Reis, G.B.; Mesquita, A.T.; Torres, G.A.; Andrade-Vieira, L.F.; Vander. P.A.; Davide, L.C. Genomic homeology between Pennisetum purpureum and Pennisetum glaucum (Poaceae). Comparative Cytogenetics. 2014. 8:199-209. [CrossRef]
- Reyes-Pérez, J.J.; Méndez-Martínez, Y.; Luna-Murillo, R.A.; Espinosa-Coronel, A.L.; Ledea-Rodríguez, J.L. Evaluación de la fertilización en respuestas morfo agronómicas de variedades de Cenchrus purpureus en diferentes edades de rebrote. Tropical and Subtropical Agroecosystems. 2021. 24. https://bit.ly/3szHlzF.
- Negawo, A.T.; Teshome, A.; Kumar, A.; Hanson, J.; Jones, C.S. Opportunities for napier grass (Pennisetum purpureum) improvement using molecular genetics. Agronomy. 2017. 7:1–21. [CrossRef]
- Farrell, G.; Simons, S.A.; Hillocks, R.J. Pests, diseases and weeds of Napier grass, Pennisetum purpureum: A review. International Journal of Pest Management. 2002. 48:39–48. https://bit.ly/3vbhz5D.
- Daniel, J.L.P.; Bernardes, T.F.; Jobim, C.C.; Schmidt, P.; Nussio, L.G. Production and utilization of silages in tropical areas with focus on Brazil. Grass and Forage Science. 2019. 74:188-200. [CrossRef]
- Giridhar, K.; Samireddypalle, A. Impact of Climate Change on Forage Availability for Livestock. In: V. Sejian et al, ed. 2015. Climate Change Impact on Livestock: Adaptation and Mitigation, Springer. India. 2015. p. 97–112. [CrossRef]
- Comisión Nacional del Agua [CONAGUA]. (2022, 19 de junio). Monitor de sequias en México. https://bit.ly/3v9LHhO.
- SIEGVER (Sistema de Información Estadística y Geográfica del estado de Veracruz de Ignacio de la Llave). 2020. Cuadernillos municipales 2020. [pdf] Veracruz: Gobierno del Estado. https://bit.ly/348PdyJ.
- INEGI (Instituto Nacional de Estadística y Geografía). Biblioteca Digital. México. 2021. Disponible en https://www.inegi.org.mx/app/mapas/?ag=30.
- Rojas, G.A.R.; Hernández, G.A.; Quero, C.A.R.; Guerrero, R.J.D.; Ayala, W.; Zaragoza, R.J.L.; Trejo, L.C. Persistencia de Dactylis glomerata L. solo y asociado con Lolium perenne L. y Trifolium repens L. Revista Mexicana de Ciencias Agrícolas. 2016. 7(4), pp. 885-895. https://bit.ly/3II09lS.
- Herrera, G.R.S. Algunos aspectos que pueden influir en el rigor y veracidad del mustreo de pastos y forrajes. Avances en Investigación Agropecuaria. 2014. 18:7-26. http://ww.ucol.mx/revaia/pdf/2014/mayo/1.pdf.
- Habte, E.; Muktar, M.S.; Abdena, A.; Hanson, J.; Sartie, A.M.; Negawo, A.T.; Machado, J.C.; da Silva, F.J. Jones, S.C. Forage Performance and Detection of Marker Trait Associations with Potential for Napier Grass (Cenchrus purpureus) Improvement. Agronomy. 2020. 10:542. [CrossRef]
- Herrera, G.R.S.; Fortes, G.D.; García, M.M.; Cruz, S.A.M.; Romero, U.A. Determinación del índice de área foliar de Cenchrus purpureus vc. CT-115 mediante medidas en la cuarta hoja completamente abierta. Avances en Investigación Agropecuaria. 2018. 22:7–24. http://ww.ucol.mx/revaia/anteriores.php?id=106.
- Pacheco, J.; Domínguez, M.I.; Lamadrid, J.O. Lluvia y evapotranspiración de referencia en cuatro puntos representativos de la provincia de Villa Clara, Cuba. Centro Agrícola. 2006. 33(4), pp. 67-71.
- Llanes-Cárdenas, O.; Norzagaray-Campos, M.; Muñoz-Sevilla, N.P. Determinación de la evapotranspiración potencial (ETP) y de referencia (ETO) como indicador del balance hídrico del corazón agrícola de México. Juyyaania. 2014. 2(1), pp.119-129.
- Ray, J.; Herrera, R.S; Benítez, D.; Días, D.; Arias, R. Multivariate analysis of the agronomic performance and forage quality of new clones of Pennisetum purpureum drought tolerant in Valle del Cauto, Cuba. Cuban Journal of Agricultural Science. 2016. 50:639-648. http://cjascience.com/index.php/CJAS/article/view/668.
- Sinche, M.; Kannan, B.; Paudel, D.; Corsato, C.; Lopez, Y.; Wang, J.; Altpeter, F. Development and characterization of a Naiper grass (Cenchrus purpureus) mapping population for flowering-time and biomass-related traits reveal individuals with exceptional potential and hybrid vigor. GCB Bioenergy. 2021. 13:1561-1575. [CrossRef]
- Maranhão, T.D.; Cândido, M.J.D.; Lopes, M.N.; Pompeu, R.C.F.F.; Carneiro, M.S. de S.; Furtado, R.N.; Silva, R.R. da; Silveira, F.G.A. da. Biomass components of Pennisetum purpureum cv. Roxo managed at different growth ages and seasons. Revista Brasileira de Saúde e Produção Animal. 2018. 19:11–22. [CrossRef]
- Vinay-Vadillo, J.C.; Herrera-Sotero, M.Y.; Juárez-Jiménez, A.; Montero-Lagunes, M.; Villegas-Aparicio, Y.; Enriquez-Quiroz, J.F.; Bolaños-Aguilar, E.D.; Mendoza-Pedroza, S.I. Crecimiento y macronutrientes en Cenchrus purpureus cv. Taiwán con y sin fertilización en Veracruz. Ecosistemas y Recursos Agropecuarios. 2021. 8(II). [CrossRef]
- Nava-Cabello, J.J.; Gutiérrez-Ornelas, E.; Zavala-García, F.; Olivares-Sáenz, E.; Treviño, J.E.; Bernal-Barragán, H.; Herrera, G.R.S. Establecimiento del pasto ‘CT- 115’ (Pennisetum purpureum) en una zona semiárida del noreste de México. Revista Fitotecnia Mexicana. 2013. 36:239–244. https://bit.ly/3tlvMLH.
- Ledea-Rodríguez, J.L.; La O-León, O.; Verdecia-Acosta. D.; Benítez-Jiménez, D.G.; Hernandez-Montiel, L.G. Composición química-nutricional de rebrotes de Cenchrus purpureus (schumach.) morrone durante la estación lluviosa. Tropical and Subtropical Agroecosystems. 2021. 24.
- Cruz, T.J.M.; Ray, R.J.V.; Ledea, R.J.L.; Arias, P.R.C. Establecimiento de nuevas variedades de Cenchrus purpureus en un ecosistema frágil del Valle del Cauto, Granma. Revista Producción Animal. 2017. 29: 29–35. https://bit.ly/345K3DD.
- Arias, R.C.; Ledea, J.L.; Benitez, D.G.; Ray, J.V.; Ramírez, R.J.L. Performance of new varieties of Cenchrus purpureus, tolerant to drought, during dry period. Cuban Journal of Agriculture Science. 2018. 52. https://bit.ly/3pt1d5B.
- Tulu, A.; Diribsa, M.; Temesgen, W. Dry matter yields and quality parameters of ten Naiper grass (Cencherus purpureus) genotypes at three locations in western Oromia, Ethiopia. Tropical Grassland. 2021. 9:43-51. [CrossRef]
- Ledea-Rodríguez, J.L.; Ray-Ramírez, J.V.; Arias-Pérez, R.C.; Cruz-Tejeda, J.M.; Rosell-Alonso, G.; Reyes-Pérez, J.J. Comportamiento agronómico y productivo de nuevas variedades de Cenchrus purpureus tolerantes a la sequía. Agronomía Mesoamericana. 2018. 29:343-362. [CrossRef]
- Ojeda-Quintana, L.J.; Rivera-Espinoza, R.; González-Cañizares, P.J.; De la Rosa-Capote, J.J.; Arteaga-Roduigues, O.; Hernández-Rodríguez, C. Efecto del abono verde de Canavalia ensiformis (L) micorrizada en el cultivo sucesor Cenchrus purpureus (Schumach.) Morrone Cuba CT-169. Pastos y Forrajes. 2019. 42:277-284. https://bit.ly/3vtmhg6.
- Uvidia-Cabadina, H.A.; Ramírez-De la Rivera, J.L.; de Decker, M.; Torres, B.; Samaniego-Guzmán, E.O.; Ortega-Tenezaca, D.B.; Reyes-Silva, D.F.; Uvidis, A.L.A. Influence of age and climate in the production of Cenchrus purpureus in the Ecuadorian Amazon Region. Tropical and subtropical Agroecosistems. 2018. 21:95-100. https://bit.ly/3HEosQq.
- Araujo, L.C.; Santos, P.M.; Rodríguez, R.; Pezzopane, J.R.M.; Oliveira, P.P.A.; Cruz, P.G. Simulating Guineagrass production: empirical and mechanistic approaches. Agronomy Journal. 2013. 105: 61–69. [CrossRef]
- Andrade, A.S.; Santos, P.M.; Pezzopane, J.R.M.; de Araujo, L.C.; Pedreira, B.C.; Pedreira, C.G.S.; Marin, F.R.; Lara, M.A.S. Simulating tropical forage growth and biomass accumulation: an overview of model development and application. Grass and Forage Science. 2015. 71:54–65. [CrossRef]
Figure 1.
Huasteca Alta Veracruzana region. (a). Map of Mexico, the Huasteca region is highlighted in green. (b). Huasteca Alta Veracruzana is highlighted in purple. (c). Municipalities that belong to the Huasteca Alta Veracruzana [23].
Figure 1.
Huasteca Alta Veracruzana region. (a). Map of Mexico, the Huasteca region is highlighted in green. (b). Huasteca Alta Veracruzana is highlighted in purple. (c). Municipalities that belong to the Huasteca Alta Veracruzana [23].
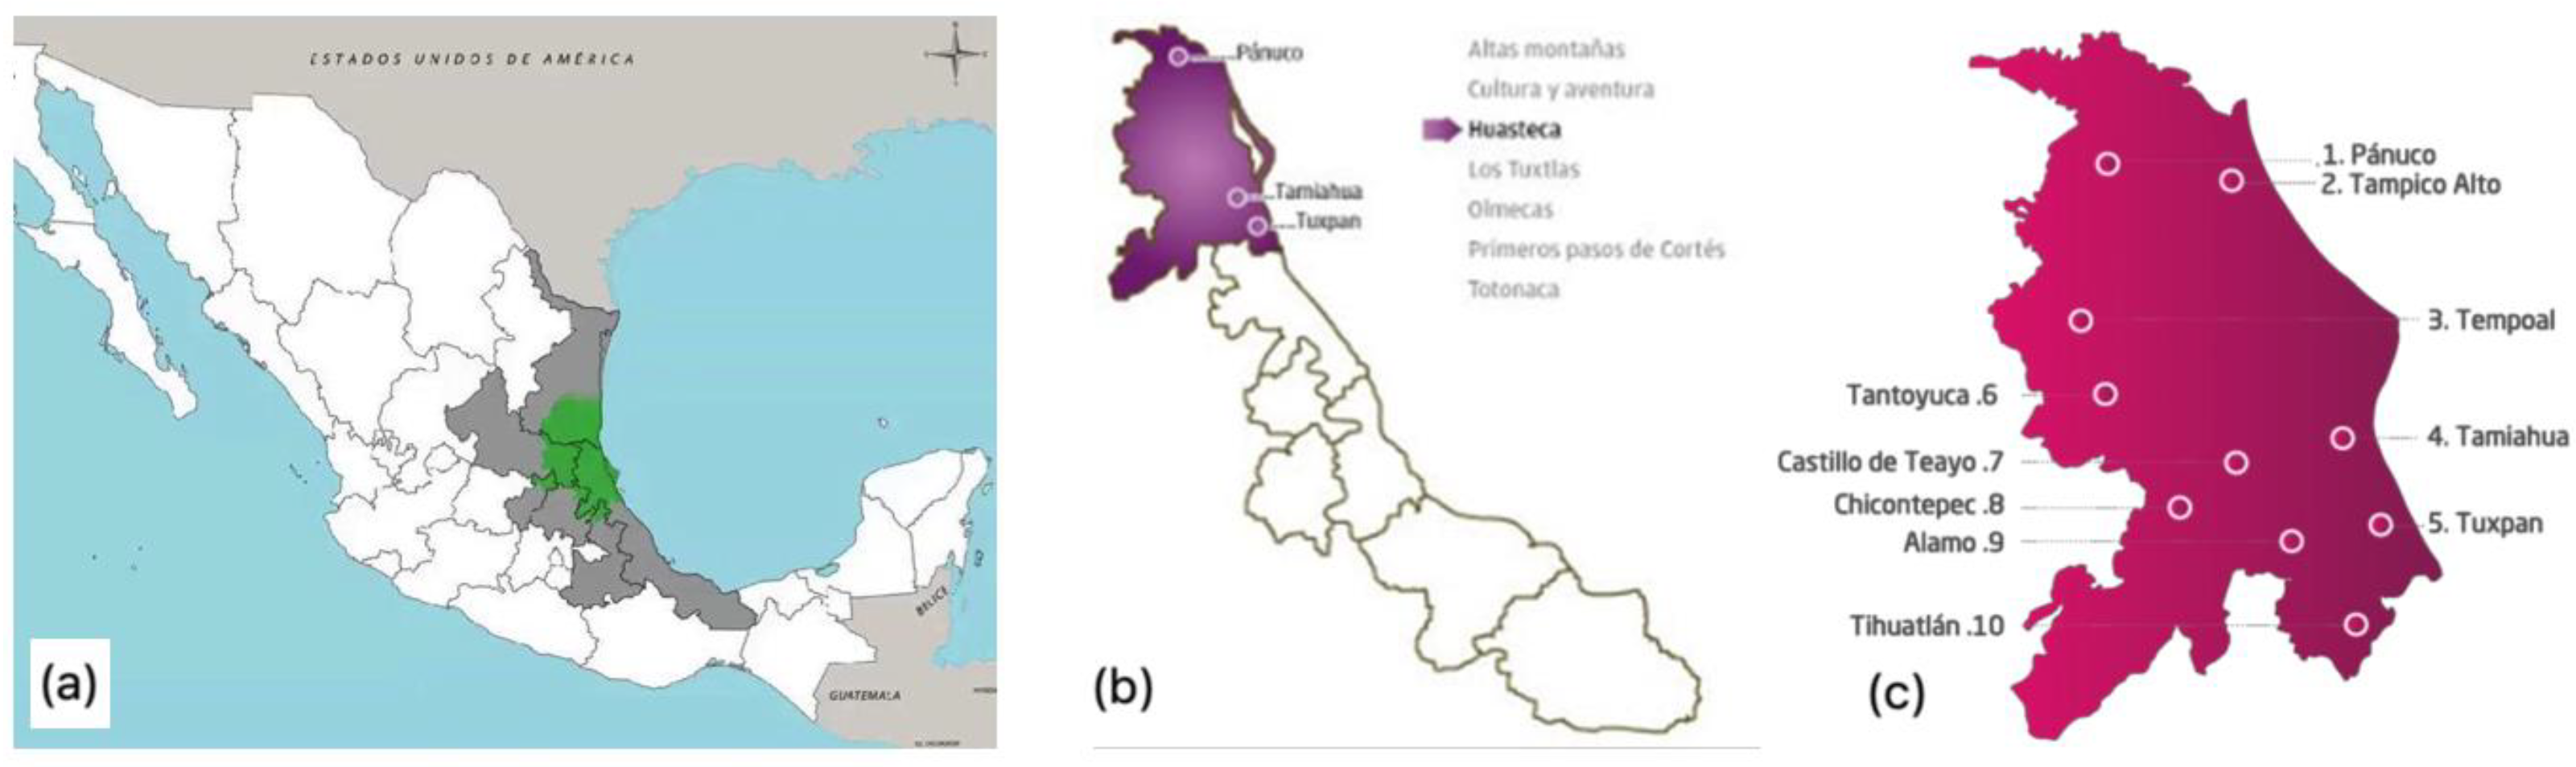
Figure 2.
Climogram of the study region. (a). Accumulated precipitation (mm), Average temperature (°C), Relative humidity (%) and Global radiation (W/m2). (b). Accumulated precipitation (mm), Evapotranspiration (mm), Relative humidity (%) and Potential evaporation (mm). Data were obtained from July 2019 to June 2020.
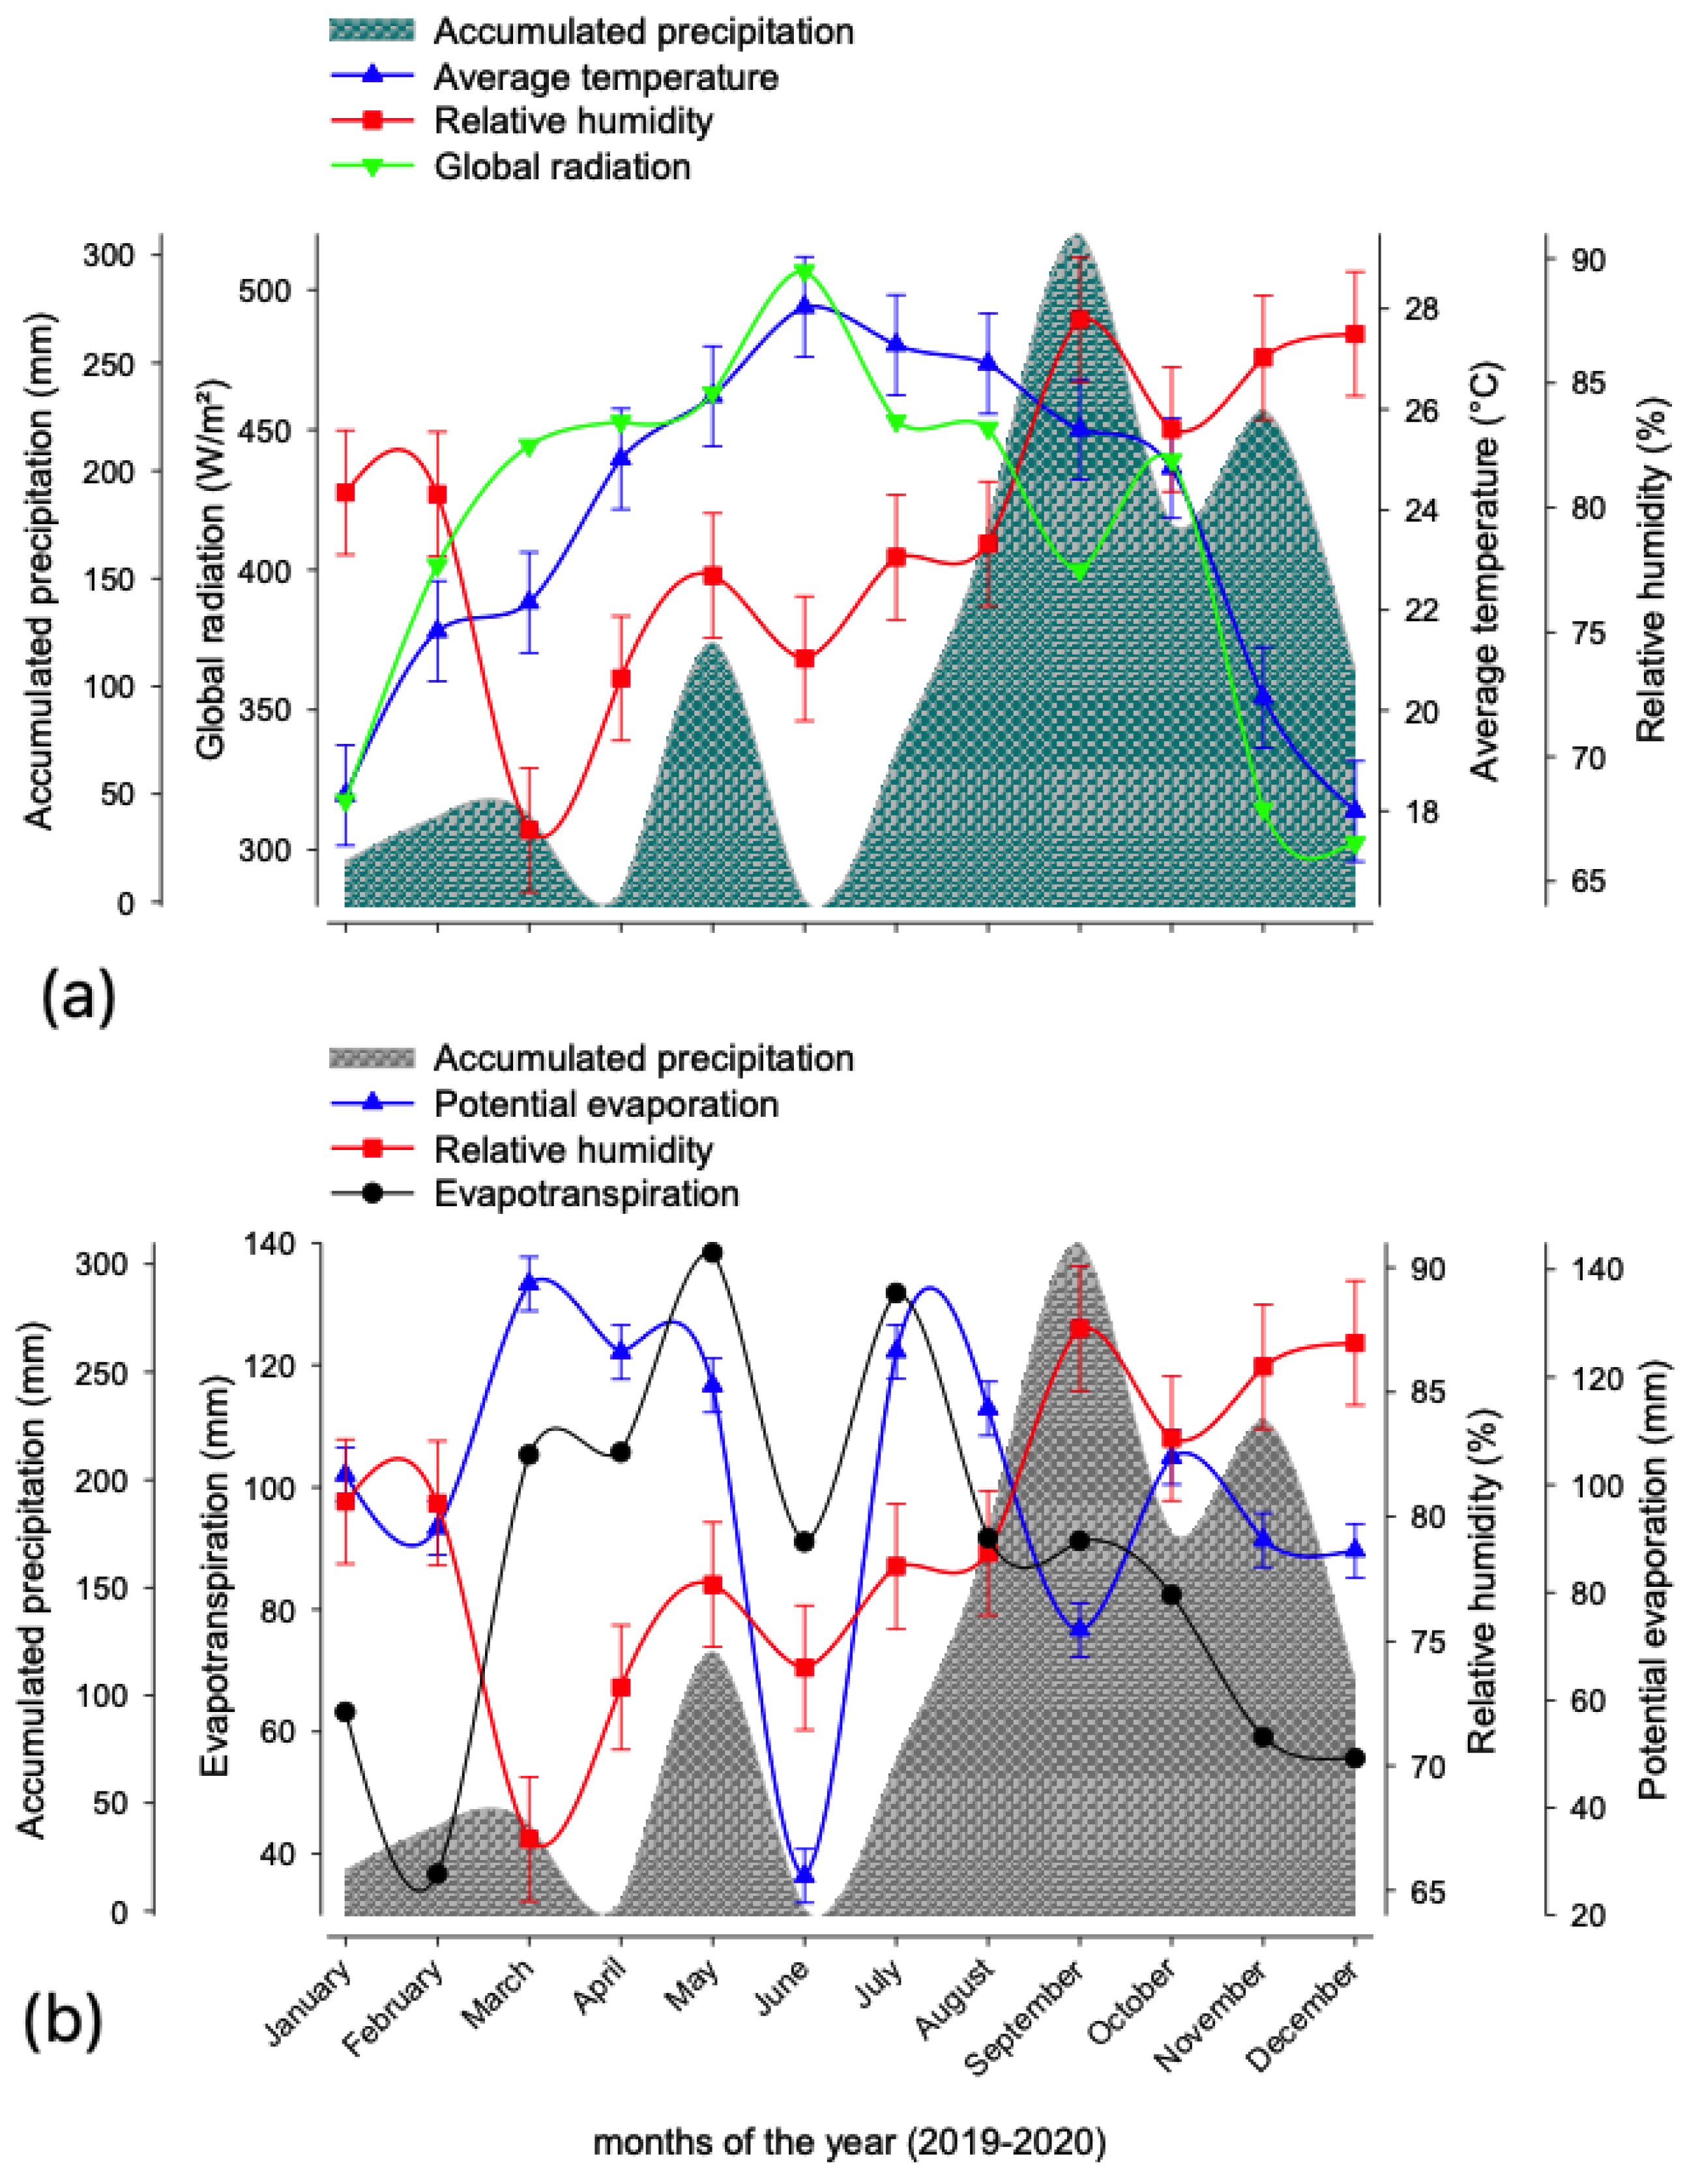

Table 1.
Agronomic variables of seven Cenchrus purpureus accessions in the HAV on the rainy season.
| Accession | Variable | ||||
|---|---|---|---|---|---|
| LAI | ADLMR (kg/ha/day) | LSR | H (m) | CF (Days) | |
| Elephant | 14.71b | 202.44ab | 0.83a | 1.85b | 63.00b |
| Merkeron | 20.30ab | 220.02a | 0.88a | 2.06ab | 62.50b |
| Purpule | 16.59b | 200.72ab | 0.85a | 1.90b | 62.50b |
| Taiwan | 27.11a | 161.95b | 0.82a | 2.28a | 83.00a |
| King grass | 15.99b | 154.07b | 0.78a | 2.16ab | 83.00a |
| CT-115 | 21.15ab | 189.82ab | 0.58b | 2.05ab | 83.00a |
| Maralfalfa | 20.92ab | 170.04ab | 0.70ab | 2.15ab | 83.00a |
| s.e. | 3.53 | 20.35 | 0.06 | 0.13 | 4.13 |
LAI: Leaf area index, ADLMR: Accumulated dry leaf matter rate, LSR: Leaf:stem ratio, H: Height, CF: Cutting frequency, Means within columns followed by different letters differ by Fisher test at 5% probability.
Table 2.
Agronomic variables of seven Cenchrus purpureus accessions in the HAV on the dry season.
| Accession | Variable | ||||
|---|---|---|---|---|---|
| LAI | ADLMR (kg/ha/day) | LSR | H (m) | CF (Days) | |
| Elephant | 19.12a | 228.51a | 0.93b | 1.94a | 79.00e |
| Merkeron | 17.81ab | 108.84bc | 0.91b | 1.79ab | 104.50a |
| Purpule | 17.82ab | 198.68a | 1.22a | 1.70b | 98.00ab |
| Taiwan | 15.35ab | 79.52c | 0.92b | 1.92a | 94.00cb |
| King grass | 11.46ab | 110.97bc | 0.89b | 1.84ab | 85.50cde |
| CT-115 | 9.27b | 91.02c | 0.86b | 1.72b | 84.00de |
| Maralfalfa | 12.35ab | 187.45ab | 0.93b | 1.86ab | 92.50bcd |
| s.e. | 3.15 | 30.56 | 0.06 | 0.06 | 3.34 |
LAI: Leaf area index, ADLMR: Accumulated dry leaf matter rate, LSR: Leaf:stem ratio, H: Height, CF: Cutting frequency. Means within columns followed by different letters differ by Fisher test at 5% probability.
Table 3.
Annual analysis of agronomic variables of seven Cenchrus purpureus accessions in the HAV.
| Accession | Variable | ||||
|---|---|---|---|---|---|
| LAI | ADLMR (kg/ha/day) | LSR | H (m) | CF (Days) | |
| Elephant grass | 16.91a | 215.47a | 0.88ab | 1.89a | 71.0b |
| Merkeron grass | 10.06a | 164.42ab | 0.89ab | 1.92a | 83.5ab |
| Purple grass | 17.21a | 199.70ab | 1.03a | 1.80a | 80.2ab |
| Taiwan | 21.26a | 120.73b | 0.87ab | 2.09a | 88.5a |
| King grass | 13.73a | 132.51b | 0.83b | 2.00a | 84.2ab |
| CT-115 | 15.21a | 140.42ab | 0.72b | 1.88a | 83.5ab |
| Maralfalfa | 16.64a | 178.74ab | 0.81b | 2.00a | 83.5ab |
| Standard error | 2.41 | 19.08 | 0.04 | 0.07 | 3.2 |
| Season | |||||
| Rainy | 19.54a | 185.58a | 0.78b | 2.06a | 74.2b |
| Dry | 14.74b | 143.56b | 0.95a | 1.82b | 91.0a |
| s.e. | 1.29 | 10.20 | 0.02 | 0.37 | 1.7 |
LAI: Leaf area index, ADLMR: Accumulated dry leaf matter rate, LSR: Leaf:stem ratio, H: Height, CF: Cutting frequency. Means within columns followed by different letters differ by Fisher test at 5% probability.
Table 4.
Cumulative green and dry matter yield per season and annual of seven Cenchrus purpureus accessions in the HAV.
Table 4.
Cumulative green and dry matter yield per season and annual of seven Cenchrus purpureus accessions in the HAV.
| Accession | Rainy season | Dry season | Annual | ||||
|---|---|---|---|---|---|---|---|
| GMY (t/ha) |
DMY (t/ha) |
GMY (t/ha) |
DMY (t/ha) |
GMY (t/ha) |
DMY (t/ha) |
DM (%) |
|
| Elephant grass | 261.31a | 54.39a | 155.18abc | 80.09b | 416.50ab | 134.49a | 34.1a |
| Merkeron grass | 269.78a | 55.60a | 179.11a | 46.71a | 448.89ab | 102.31ab | 24.2b |
| Purple grass | 264.66a | 61.65ab | 153.46ab | 69.30b | 418.13ab | 130.95a | 32.7a |
| Taiwan | 252.66a | 60.05ab | 104.96c | 29.21a | 357.62a | 89.27b | 27.5ab |
| King grass | 259.79a | 61.32ab | 156.66ab | 41.11a | 416.46ab | 102.44ab | 26.3ab |
| CT-115 | 321.14a | 79.81b | 120.01bc | 32.20a | 441.16ab | 112.01ab | 27.2ab |
| Maralfalfa | 295.95a | 67.03ab | 190.57a | 67.37b | 486.52b | 134.41a | 30.0ab |
| s.e. | 3.15 | 30.56 | 0.06 | 0.06 | 3.34 | ||
LAI: Leaf area index, ADLMR: Accumulated dry leaf matter rate, LSR: Leaf:stem ratio, H: Height, CF: Cutting frequency. Means within columns followed by different letters differ by Fisher test at 5% probability.
Table 5.
Agronomic variables of seven Cenchrus purpureus accessions in the HAV on the dry season.
| Accession | Variable | |
|---|---|---|
| GMY (t/ha) |
DMY (t/ha) |
|
| Elephant | 208.25ab | 67.24a |
| Merkeron | 224.44a | 51.15ab |
| Purpule | 209.06ab | 65.47a |
| Taiwan | 178.81b | 44.63b |
| King grass | 208.23ab | 51.22ab |
| CT-115 | 220.58ab | 56.00ab |
| Maralfalfa | 243.26a | 67.20a |
| s.e. | 15.01 | 6.19 |
| Season | ||
| Rainy | 275.04a | 62.84a |
| Dry | 151.42b | 52.28b |
| s.e. | 8.02 | 3.31 |
GMY: Green matter yield; DMY: Dry matter yield. Means within columns followed by different letters differ by Fisher test at 5% probability.
Table 6.
Correlation analysis between the DMY and agronomic variables of seven Cenchrus purpureus accessions grown in the HAV.
Table 6.
Correlation analysis between the DMY and agronomic variables of seven Cenchrus purpureus accessions grown in the HAV.
| Variable | r | r2 | a | SE (a) | P value (a) | b | s.e. (b) | P value (b) |
|---|---|---|---|---|---|---|---|---|
| LAI | 0.572 | 0.328 | 14.982 | 1.888 | 0.001 | 0.797 | 0.097 | 0.001 |
| HI | 0.192 | 0.037 | 12.826 | 6.743 | 0.059 | 8.218 | 3.580 | 0.023 |
| LSR | 0.262 | 0.069 | 44.658 | 5.333 | 0.001 | -19.545 | 6.116 | 0.002 |
| DLMAR | 0.884 | 0.782 | 3.967 | 1.227 | 0.002 | 0.153 | 0.007 | 0.001 |
| GMY | 0.147 | 0.022 | 26.466 | 1.525 | 0.001 | 0.000 | 0.001 | 0.083 |
LAI: Leaf area index, ADLMR: Accumulated dry leaf matter rate, LSR: Leaf:stem ratio, H: Height, GMY: Green matter yield, r2: Determination coefficient, a: intercept, b: slope, p: P-value.
Table 7.
Multiple linear regression models of agronomic variables of seven Cenchrus purpureus accessions associated to climatological variables of the HAV.
Table 7.
Multiple linear regression models of agronomic variables of seven Cenchrus purpureus accessions associated to climatological variables of the HAV.
| Variable Y = | a + | b1 + | b2 + | b3 + | b4 + | c | r | r2a | p | MSE | Method |
|---|---|---|---|---|---|---|---|---|---|---|---|
| GMY | -27.2 | 0.10 | -33.01 | 2.12 | 3.15 | 34.68 | 0.73 | 0.52 | 0.01 | 1202.92 | F |
| p value | 0.84 | 0.10 | 0.01 | 0.01 | 0.01 | ||||||
| DMY | 11.08 | - | -1.50 | 0.15 | - | 14.33 | 0.22 | 0.03 | 0.02 | 205.45 | F |
| p value | 0.50 | - | 0.29 | 0.06 | - | ||||||
| LAI | 23.39 | 0.02 | -2.50 | 0.16 | - | 10.19 | 0.27 | 0.05 | 0.01 | 103.95 | F |
| p value | 0.12 | 0.15 | 0.03 | 0.01 | - | ||||||
| H | 3.64 | 0.00 | -0.28 | 0.01 | - | 0.24 | 0.70 | 0.48 | 0.01 | 0.06 | F |
| p value | 0.01 | 0.17 | 0.01 | 0.01 | - | ||||||
| LSR | 2.90 | - | - | -0.01 | -0.01 | 0.16 | 0.53 | 0.28 | 0.01 | 0.02 | B |
| p value | 0.01 | - | - | 0.01 | 0.01 | ||||||
| ADLMR | 80.19 | - | -16.99 | 1.45 | - | 80.36 | 0.32 | 0.08 | 0.01 | 6458.51 | F |
| p value | 0.39 | - | 0.036 | 0.01 | - |
Y model = a + b1X1 + b2X2 + b3X3 + b4X4 + c; a: Intercept; b1…4: Slope factor; X1: Accumulated precipitation (mm); X2: Average temperature (°C); X3: Global radiation (W/m2); X4: relative humidity (%); c: Estimate error, GMY: green matter yield, DMY: dry matter yield, r2a: adjusted correlation coefficient, p: probability value, MSE: Means Square Error , F: forward method, B: backward method. (-): variable not included in the model.
Table 8.
Analysis of the agronomic and yield variables used to classify seven accessions of C. purpureus in the HAV during the rainy and dry seasons.
Table 8.
Analysis of the agronomic and yield variables used to classify seven accessions of C. purpureus in the HAV during the rainy and dry seasons.
| Variable | Rainy season | Dry season | ||||||
|---|---|---|---|---|---|---|---|---|
| G1 | G2 | G3 | p value | G1 | G2 | G3 | p value | |
| LAI | 17.2 ± 2.84 | 21 ± 0.16 | 21.5 ± 7.86 | 0.532 | 14.6 ± 4.49 | 16.4 ± 3.59 | 12.3 ± 4.29 | 0.577 |
| ADLMR | 207.7 ± 10.6 | 179.9 ± 13.9 | 158 ± 5.5 | 0.017 | 109.9 ± 1.5 | 204.8 ± 21.2 | 85.2 ± 8.13 | 0.002 |
| LSR | 0.8 ± 0.02 | 0.6 ± 0.08 | 0.8 ± 0.02 | 0.020 | 0.9 ± 0.01 | 1 ± 0.16 | 0.8 ± 0.04 | 0.437 |
| H | 1.9 ± 0.10 | 2.1 ± 0.07 | 2.2 ± 0.08 | 0.071 | 1.8 ± 0.03 | 1.8 ± 0.12 | 1.8 ± 0.14 | 0.982 |
| CF | 62.6 ± 0.28 | 83 ± 0.00 | 83 ± 0.00 | 0.001 | 95 ± 13.43 | 89.8 ± 9.77 | 89 ± 7.07 | 0.820 |
| GMY | 265.2 ± 4.2 | 308.5 ± 17.8 | 256.2 ± 5.0 | 0.011 | 167.8 ± 15.8 | 166.4 ± 20.9 | 112.4 ± 10.6 | 0.051 |
| DMY | 57.2 ± 3.88 | 73.4 ± 9.03 | 60.6 ± 0.89 | 0.065 | 43.9 ± 3.95 | 72.2 ± 6.85 | 30.7 ± 2.11 | 0.002 |
| Accesions | King grass | Maralfalfa | Purple | King grass | Maralfalfa | CT-115 | ||
| Merkeron | CT-115 | Merkeron | Merkeron | Purplue | Taiwan | |||
| Elephant | Elephant | |||||||
p = probability of committing a type-I error, analyzed with one-way ANOVA, and compared with the Tukey test; p < 0.05 shows a significative difference. DMY: Dry matter yield; LAI: Leaf area index; H: Height; LSR: Leaf:stem ratio; ADLMR: Accumulated dry leaf mater rate; GMY: Green matter yield.
Disclaimer/Publisher’s Note: The statements, opinions and data contained in all publications are solely those of the individual author(s) and contributor(s) and not of MDPI and/or the editor(s). MDPI and/or the editor(s) disclaim responsibility for any injury to people or property resulting from any ideas, methods, instructions or products referred to in the content. |
© 2024 by the authors. Licensee MDPI, Basel, Switzerland. This article is an open access article distributed under the terms and conditions of the Creative Commons Attribution (CC BY) license (http://creativecommons.org/licenses/by/4.0/).
Copyright: This open access article is published under a Creative Commons CC BY 4.0 license, which permit the free download, distribution, and reuse, provided that the author and preprint are cited in any reuse.


