
Submitted:
20 February 2024
Posted:
21 February 2024
You are already at the latest version
Abstract
Detecting and monitoring changes in soil salinity through remote sensing provides an opportunity for field assessment in regions where on-site measurements are limited. This investigation, carried out in Siwa Oasis, Egypt, aimed to assess the efficacy of several soil salinity indices derived from Landsat 5 and 7 satellite images. To achieve this, 56 on-site ground measurements were utilized for evaluation purposes. The study aimed to improve the correlation between EC and index values and explore the relationship between salinity and changes in land cover. Eleven spectral indices were calculated for nine scenes captured in different months from August to December. The first approach involved stacking the data to identify the index with the strongest correlation with ground EC values, without the need for complex analysis or EC value ranging. In the second approach, the ground EC measurements were classified into seven different salinity categories, and the correlation coefficient was calculated between each index and each salinity category. The third approach analyzed the data temporally, considering different salinity levels. Lastly, a spatial correlation analysis was conducted between EC and index values in the fourth scenario. The initial approach revealed a weak correlation due to substantial variation in EC values. However, the SI index demonstrated the highest correlation coefficient of 0.38. In the second scenario, the S2 index exhibited the highest correlation of 0.96 for moderate salinity samples. The third scenario showed that the S1 index achieved the highest correlation value of 0.99 for moderately saline areas. In the fourth scenario, the SI index exhibited the strongest correlation among all four ponds with correlation coefficients of 0.23, 0.23, 0.18, and 0.61. Notably, the correlations observed in the second and third scenarios demonstrated higher correlation coefficients compared to both the first and fourth scenarios. The study highlighted significant variations in EC levels related to land cover types and pond elevation. Additionally, remote sensing methods detected a 48% increase in total vegetated area over 17 years, showing the potential of remote sensing techniques in salinity monitoring for expanding agriculture and improving land management.
Keywords:
Soil Salinity
; Remote sensing
; Landsat
; Spectral Indices
; Correlation
; Land cover
; Siwa
; Egypt
1. Introduction
Soil salinization is a prevalent form of land degradation, particularly in arid and semi-arid environments where evaporation exceeds precipitation [1]. Primary salt-affected soils globally cover an estimated area of approximately 955 million hectares, while secondary salinization impacts around 77 million hectares, with 58% of these occurrences observed in irrigated regions. Almost one-fifth of all irrigated land is affected by salt, and this percentage continues to rise despite significant efforts towards land reclamation [2]. Early detection and monitoring of salinity are critical for implementing effective soil reclamation and management practices to reduce or prevent further increases in salt concentrations. Addressing soil salinity is vital for achieving the goal of Sustainable Development Goal 13, which emphasizes the urgent need to combat climate change and its impacts.
In arid and semi-arid regions like Egypt, where the average annual precipitation is 19.68 mm and water demand is increasing, soil salinization poses a significant challenge. Siwa Oasis, as depicted in Figure 1, has encountered notable drainage problems and rising groundwater levels over the past few decades. Unregulated irrigation practices have led to a rise in water inflow to the oasis, resulting in detrimental drainage issues that endanger the local environment. These trends increase the risk of flooding and may impede future agricultural expansion in the oasis. Given its importance as both an agricultural hub and a tourist destination, the implementation of sustainable water management practices is crucial for the long-term preservation of Siwa Oasis. The high levels of salt weathering observed in Siwa Oasis can be attributed to a combination of environmental, geological, and anthropogenic factors, including the local climate, geological and geomorphological characteristics, groundwater hydrology, and human activities [3].
To accurately map and monitor soil salinity, the initial step involves identifying the areas where salt concentrations are concentrated, while the subsequent step entails detecting temporal and spatial changes in salt occurrence [4]. Soil salinity can be categorized into two main types: primary salinity and secondary salinity. Primary salinity refers to naturally occurring levels of salt in soils, whereas secondary salinity is attributed to human activities [5]. The factors contributing to soil salinization are diverse and context-specific, including natural elements such as soil composition with high saline content or intrusion of seawater. Understanding the specific causes of salinity in a particular region is crucial for implementing effective management and reclamation strategies.
Remote sensing is a powerful method for monitoring salinity across large areas. With different-resolution satellites, such as the Multi-Spectral Instrument, there are increased opportunities to monitor the Earth's surface at high temporal frequencies and for long periods of time [6]. Remote sensing has been widely employed in numerous studies to investigate salinity patterns and trends. Satellite-based remote sensing methods offer an efficient approach to monitoring vast areas while requiring minimal time and financial resources. Given the availability of numerous vegetation indices, research efforts have focused on determining the most suitable indices for specific remote sensing applications. Effectively utilizing remote sensing for vegetation analysis necessitates the careful selection of indices that align with the intended application [7].
By analyzing the spectral reflectance of salt on the surface and the spectral reflectance of vegetation negatively impacted by salt, various salinity and vegetation indices have been developed to quantify the influence of salinity on vegetation in different environmental settings [8]. A modeling approach was adopted to develop a cellular automaton-Markov model that integrates biophysical and socioeconomic factors to simulate the processes of land salinization and desalinization [9]. To comprehensively understand the drivers and dynamics of soil salinity at multiple scales, the integration of in situ measurements, physically-based modeling, and remote sensing analysis has proven valuable. This integrated approach enables the analysis of soil, water, and vegetation attributes, in addition to utilizing Landsat images for monitoring changes in vegetation cover, soil salinity, and waterlogging over time [10].
The process of extracting features and generating maps from raw remote sensing data involves significant transformations. Various techniques, such as spectral unmixing, maximum likelihood classification, fuzzy classification, band rationing, principal component analysis, and correlation equations, have been developed for this purpose [2].
The primary goal of this research is to formulate a methodology capable of efficiently overseeing and resolving soil salinity concerns across a wide range of environmental conditions, soil types, and land cover types without being limited to specific ranges of electrical conductivity (EC) or environmental conditions over an extended period, all while maintaining a low cost. This objective was accomplished by conducting a comparative analysis of eleven spectral indices using four different approaches. The study relies on freely available satellite imagery from Landsat 5, 7, and 8.
The comparison of multiple soil salinity and vegetation indices using different methods can enhance agriculture and water practices. It enables more informed decision-making regarding irrigation management, soil amendment strategies, and targeted interventions to mitigate the negative impacts of soil salinity on crop productivity. Additionally, it aids in the identification of areas prone to salinity issues, facilitating the implementation of appropriate measures for sustainable water use and land management.
2. Materials and Methods
2.1. Study Area characteristics
Situated in Egypt's Western Desert near the Libyan border, Siwa Oasis (N29.203171° N, E25.519545° E) encompasses an area of approximately 1,100 km2. It is bordered by the Great Sand Sea to the south, heights over 100 m to the north, and the Qattara depressions to the east. The region's main economic activity revolves around agriculture, which has a notable reputation for producing high-quality dates and olives. Siwa Oasis is also renowned for its ancient historical cities, pharaonic and Roman monuments, and therapeutic sand baths. The terrain features hills ranging from 100 to 200 meters above sea level, while a significant portion of the land lies at a minimum depth of 18.5 meters below sea level [11]. In the central part of the oasis, a series of shallow lakes and salt pans occupy low-lying areas, sustained by groundwater sources.
Siwa Oasis has an arid climate as shown in Figure 2 with extremely scarce precipitation. The region has average annual temperatures ranging from cryogenic to hyperthermal, rarely dropping below freezing point or exceeding 41°C. The hottest months exhibit average highs and lows of 38°C and 21°C, while the coolest months average highs and lows of 18°C and 7 °C, respectively. There is very little precipitation, with the highest likelihood of light rainfall occurring in the winter months. Dry climates and low precipitation prevent the flushing of excessive salts from the soil. Where there are high evaporation rates, add salts to the surface of the soil. Poor drainage or waterlogging prevents salts from being washed away due to a lack of water transportation.
The soil of Siwa Oasis consists primarily of sandy textures, including medium-depth sand, deep sand, and saline sand deposits known as Kurchev. In accordance with the American Soil Taxonomy, the soils in the study area have been classified into several categories, including Typic Torripsamments, Calcic Aquisalids, Typic Haplosalids, Gypsic Haplosalids, Typic Aquisalids, Typic Lithic and Duric Haplocalcids, and Typic Psammaquents [13]. The average soil depth is 2 meters, with calcium carbonate content ranging from 4–35%. According to land classification studies, the majority of Siwa Oasis lands are saline, saline-alkaline, or alkaline sandy or lime soils. Due to scarce precipitation, Siwa Oasis primarily relies on groundwater. The earlier studies identified two groundwater sources: the Nubian Sandstone Aquifer System (NSAS) and shallow unconfined aquifers. The NSAS lies 600–1,200 meters deep, with 500–600-meter-thick freshwater-bearing layers. The average static water level is 80 meters below the surface, and vertical flow is enabled between the NSAS and the overlying cracked sandstone layer by differences in hydraulic pressure [14]. The aquifer water has 280–600 mg/L of salinity. An impermeable 100-meter clay layer separates the NSAS from the overlying cracked sandstone layer. The hydraulic pressure difference enables vertical flow from the NSAS through the clay into the cracked sandstone. The cracked sandstone layer is divided into 200-meter- and 500-meter-deep sublayers, with the deeper sublayer carrying higher-salinity (2,500–3,500 mg/L) water. The shallow, unconfined aquifers, recharged by precipitation, have up to 4,000 mg/L salinity, and the sustainable management of the aquifers is critical as the sole water source for Siwa Oasis's population. Leakage from geological deposits and penetration into groundwater can contaminate the soil with salts. Irrigation with salt-rich water, which can increase the salt content in the soil, causes high salt concentrations in the soil to cause water stress in plants, reducing the water potential gradient between the soil and roots and hindering nutrient absorption.
2.2. Technical approach and Data Processing
The objective of this study is to examine the effectiveness of different remote sensing indices in order to reduce reliance on in situ measurements for soil salinity monitoring to assess salinity levels in various settings. By utilizing multiple indices and different approaches, a more comprehensive assessment of soil salinity and vegetation dynamics can be achieved. This allows for a more nuanced understanding of the spatial and temporal variations in salinity levels and their impact on vegetation health. In this study as shown in Figure 3, eleven different soil salinity and vegetation indices calculated from freely available Landsat 5 and 7 imagery were compared using four distinct approaches. Comparing multiple indices and methods provides a robust analysis framework, reducing the reliance on a single index or approach. This helps to mitigate potential biases or limitations associated with individual indices, ensuring a more reliable evaluation of soil salinity conditions. Through rigorous analysis and comparison, we aimed to discern the strengths and limitations of each index and identify the most effective indices for delineating soil salinity patterns in the context of the Siwa Oasis environment. To develop a methodology for monitoring and addressing soil salinity issues that are applicable and derived from Landsat satellite images for predicting soil salinity in both bare and cultivated lands within the study area across a wide range of environmental conditions, soil types, and land cover types without being limited to specific ranges of electrical conductivity (EC) or environmental conditions. The use of multiple indices and methods increases the likelihood of obtaining accurate and consistent results. It helps to minimize errors and uncertainties in assessing soil salinity and vegetation conditions, leading to more reliable information for decision-making in agriculture and water management.
2.2.1. Field monitoring
The methodology employed in this study encompasses two primary components: in-situ data acquisition and remote sensing data collection and processing. The field study focused on analyzing soil and water conditions around four ponds, namely Bahi El-Dein, Siwa, Aghormi, and Al-Zaitoun. To estimate changes in soil salinity, the Drainage Research Institute conducted a field study using the EM-38 device, which measured soil salinity at 30 cm intervals up to a depth of 1.5 meters. A total of around 110 soil samples were gathered from different locations to determine the true soil salinity levels through laboratory analysis. These measurements were then compared to the salinity readings obtained from the EM-38 device, which was also used at the same locations. Out of the 78 soil samples tested for salinity in the lab, 56 samples were selected for this study to estimate field salinity levels. The locations of the soil samples are indicated in Figure 4.
The Drainage Research Institute estimated soil salinity values at depths of 0-30, 30-60, 60-90, 90-120, and 120-150 centimeters. Additionally, a monitoring network consisting of 95 wells was established, and 10 measuring rulers were installed to track groundwater levels and salinity surrounding the main ponds of Siwa Oasis. These wells had an average depth of 2 meters and were monitored on a weekly basis for water level and quality.
This monitoring was intended to assess changes in pond, groundwater, and soil conditions, as well as the effectiveness of drainage systems. The sample results were used for this study, allowing estimation of field salinity levels. There are generally four categories used to classify the severity of the problem. These categories are based on both the soil salt content and the capacity of plants to tolerate salt and include severe salinization, moderate salinization, slight salinization, and non-salinization [15]. According to the EC global categorization, the EC (ds/m) values ranged from non-saline = 0.56 to severely saline, reaching 193 according to the world categorization of salinity as shown in Table 1.
2.2.2. Remote sensing
There are two approaches to detecting soil salinity from remote sensing data. The first approach involves analyzing the spectral reflectance of bare soil, specifically looking for salt efflorescence and crust, using salinity indices. The second approach involves analyzing the spectral reflectance of vegetation on affected soils using vegetation indices [17; 18; 19 and 20).
The long operational lifetimes of Landsat have enabled quantifying and monitoring dynamics on the earth's surface over the past three decades. Landsat 5 TM and 7 ETM+ images were used in this study. Landsat 5 and Landsat 7 are both multi-spectral satellite systems that capture data in several spectral bands. However, there are some differences in the bands captured by each system. Landsat 5 captures data in seven spectral bands, while Landsat 7 captures data in eight spectral bands. Based on ground observations and radiometric measurements, it has been determined that the quantity and mineralogy of salts, as well as soil moisture, color, and roughness, are the primary factors that impact salt reflectance [2]. By detecting reflectance and emission changes across these bands, Landsat 5 and 7 monitor shifts in land use, urbanization, vegetation cover, agriculture, water resources, and other factors on Earth's surface. Salt crusts, ranging in thickness from less than 1 mm to 1 m, are puffy structures containing both soil aggregates and salt crystals (ranging in size from 0.5–5 mm) that originate from salty clays and sometimes from salt crusts that affect the reflectance [21].
Geometric distortions in satellite images can lead to an inaccurate representation of features on the ground, which can affect subsequent analysis and interpretation of the data. However, the accuracy of satellite images can be compromised by atmospheric interference such as haze, aerosols, and clouds, which can distort the radiometric values of the image. Calibration and radiometric correction techniques are applied to satellite imagery to normalize the data and remove atmospheric effects. These corrections help ensure that the reflectance values captured by the satellite sensor are more accurate and consistent across different images and dates. Using the Semi-Automatic Classification Plugin for QGIS Landsat 5 and 7, imagery bands were corrected before calculating any indices to monitor soil salinity. The atmospheric correction is critical to remove interference from gases and particles and obtain surface reflectance values more representative of vegetation and soils [22] and [23]. The geometric correction is necessary to account for sensor and satellite positions and the varyingly angled reflectance of solar radiation off the Earth's surface [24]. Without these corrections, vegetation indices would reflect variability in sun/satellite geometry and atmospheric conditions more than the salinity status of vegetation or soils. Several techniques have been developed for the geometric and atmospheric correction of Landsat images [23]. After converting Landsat DNs to reflectance spectral indices, they should be calculated and interpreted for sensing the salinity status of vegetation and soil [25]. The transformation of Landsat DNs to reflectance values involves several steps, including atmospheric correction, conversion from DN to radiance, and conversion from radiance to reflectance. The equations used to apply these transformations are as follows:
Atmospheric correction:
Radiance = DN – offset, where DN is the digital number, and the offset is the value provided in the metadata file.
Equation 1.Conversion from radiance to reflectance
where:
ρλ is the spectral reflectance, Lλ is the spectral radiance, d is the sun-Earth distance in astronomical units, ESUNλ is the mean solar exo-atmospheric irradiance, and θs is the solar zenith angle. The values of ESUNλ and θs are also provided in the metadata file.
Correction for atmospheric transmittance and path radiance:
Equation 2. Correction for atmospheric transmittance and path radiance
where:
ρλ_corr is the corrected spectral reflectance, τλ is the atmospheric transmittance, and ρpath is the path radiance.
In SCP, the transformation of Landsat DNs to reflectance values is automated through a series of tools that apply these equations to each band of the Landsat image. Calibration and radiometric correction techniques are applied to satellite imagery to normalize the data and remove atmospheric effects. These corrections help ensure that the reflectance values captured by the satellite sensor are more accurate and consistent across different images and dates.
2.2.3. Derivation of Salinity Monitoring Indices
A set of eleven multispectral indices has been developed for monitoring salinity, as presented in Table 2. There is a strong relationship between soil spectral reflectance and soil characteristics such as salinity [8] Where:
- Salinity Index 1 (S1): S1 is calculated as the ratio between the reflectance in the blue (B) band and the reflectance in the red (R) band. It provides information about the salinity levels in soil based on the relationship between these two bands [27].
- Salinity Index 2 (S2): S2 is derived by taking the normalized difference between the reflectance in the blue (B) and red (R) bands, divided by the sum of their reflectance values. This index is useful for assessing soil salinity variations based on the spectral differences between these two bands [27].
- Salinity Index 3 (S3): S3 is obtained by multiplying the reflectance values in the green (G) and red (R) bands and then dividing by the reflectance value in the blue (B) band. It offers insights into soil salinity conditions by leveraging the relationship between these three spectral bands [27].
- Salinity Index 6 (S6): S6 is calculated by multiplying the reflectance in the red (R) band and the near-infrared (NIR) band and then dividing by the reflectance in the green (G) band. It helps in evaluating soil salinity based on the spectral characteristics of these three bands [28].
- Salinity Index 3 (SI3): SI3 is determined by taking the square root of the sum of the squares of the reflectance values in the green (G) and red (R) bands. It provides an indicator of soil salinity by considering the combined effect of these two bands [29].
- Salinity Index 1 (SI1): SI1 is obtained by taking the square root of the product of the reflectance values in the green (G) and red (R) bands. It offers insights into soil salinity by considering the interaction between these two spectral bands [30].
- Salinity Index (SI): SI is calculated by taking the square root of the product of the reflectance values in the blue (B) and red (R) bands. It provides information about soil salinity conditions by considering the relationship between these two spectral bands [30].
- EVI (Enhanced Vegetation Index): EVI is an index that enhances the sensitivity to vegetation changes by correcting for atmospheric and soil influences. It provides a more accurate measure of vegetation health and density [31].
- RVI (Ratio Vegetation Index): RVI calculates the ratio between the reflectance in the red band and the reflectance in the green band. It is primarily used to estimate vegetation vigor and density [32].
- SAVI (Soil-Adjusted Vegetation Index): SAVI index, incorporates a soil adjustment factor to account for soil background effects. It is advantageous for accurately assessing vegetation health in areas with high soil brightness [33].
- NDVI (Normalized Difference Vegetation Index): NDVI measures the difference between near-infrared and red reflectance, indicating the presence and vigor of vegetation. It is widely used to monitor vegetation health, density, and changes over time [34].

Table 2.
Eleven salinity indices were derived for this study.
| No. | Index type | Index | Equation |
| 1 | Salinity Index 1 | S1 | B/R |
| 2 | Salinity Index 2 | S2 | (B-R)/(B+R) |
| 3 | Salinity Index 3 | S3 | (G*R)/B |
| 4 | Salinity Index 6 | S6 | (R*NIR)/G |
| 5 | Salinity Index 3 | SI3 | √((G^2+R^2)) |
| 6 | Salinity Index 1 | SI1 | √ (G *R) |
| 7 | Salinity Index | SI | √ (B *R) |
| 8 | Enhanced Vegetation Index | EVI | 2.5(NIR-R)/(NIR+6R-7.5B+1) |
| 9 | Ratio Vegetation Index | RVI | NIR/R |
| 10 | Soil Adjusted Vegetation | SAVI | (NIR-R)/(NIR+R+L) *(1+L) |
| 11 | Normalized Differential Vegetation Index | NDVI | (NIR-R)/(NIR+R) |
*(B, G, R and NIR): The extracted Reflectance values in the blue, green, red, and near-infrared bands.*L = 0.5 constant for Landsat images [26].
These indices were specifically designed to maximize the sensitivity of vegetation indices to salinity stress while minimizing the influence of other environmental factors on individual spectral bands, such as moisture. For each band in every image, the digital numbers were converted to radiance and then reflectance using the Spectral Conversion Parameter (SCP) method. Subsequently, the indices were calculated for the nine scenes captured during different months from August to December, using either the ArcGIS raster calculator or model builder. Each index captures specific aspects of vegetation health and salinity response by leveraging distinct combinations of spectral bands. Through rigorous analysis and comparison, we aimed to discern the strengths and limitations of each index and identify the most effective indices for delineating soil salinity patterns in the context of the Siwa Oasis environment.
Various spectral indices, such as the Normalized Difference Vegetation Index (NDVI), Enhanced Vegetation Index (EVI), and Soil Adjusted Vegetation Index (SAVI), have been developed to quantify specific characteristics of vegetation cover. These indices exploit the distinct spectral properties of vegetation, enabling differentiation from other land cover types. In our analysis, these indices were employed in all four scenarios. Each index was computed and their respective strengths and limitations were assessed. The primary objective is to determine the most suitable approach and the most effective index for capturing soil salinity patterns in the environmental conditions of Siwa Oasis.
3. Results
3.1. Exploring the Relationship between Electrical Conductivity (EC) and Spectral Indices: Initial Analysis
In this phase of the study, we analyze the spectral properties of soil depending on the salinity, specifically the visible and near-infrared regions provided by the Landsat data. In the first step of the analysis, the corresponding values of the ground points were extracted from the calculated indices. These values were then stacked for every index, encompassing all the values from all the images. The correlation equation was then applied to the EC corresponding values and the calculated indices values. Table 3 shows the correlation between some of the ground-measured electrical conductivity (EC) values and values extracted from the eleven spectral indices for each point across the time series of Landsat images, in descending order from the highest to the lowest. The highest correlation coefficient was found for the SI index, at 0.38. Linear R² and Polynomial R² values of 0.14 and 0.15, respectively, were calculated between the EC values and each vegetation index value across the time series of images. The SI and SI1 indices had the highest correlation, respectively, and the NDVI and S2 indices showed the lowest correlation with EC. Figure 5 displays the first four highest correlation and regression values relating to EC and salinity indices for the first approach. However, after extracting the tested linear regression and polynomial regression for each index, respectively, the results showed weak correlation values in this approach due to the high difference in the salinity values.
Upon conducting linear regression and polynomial regression analyses for each index, it was observed that this approach yielded weak correlation values. This can be attributed to the significant variation in salinity values, which ranged from 0.56 to 100, excluding EC values exceeding 100, as they had a noticeable impact on the results. To mitigate the impact of salinity values exceeding 100 on the regression results, exclude the salinity values that exceed 100 from the dataset before conducting the regression analysis. By removing these extreme values, the analysis would focus on the range of salinity values that are more representative and less likely to have a disproportionate influence on the results. This analysis aimed to determine which indices are most strongly correlated with ground EC values, indicating their potential effectiveness for estimating soil salinity without any complex analysis or ranging. However, the results showed low correlations and regressions, likely due to the significant variability in salinity ranges. Without applying any classification between the values, the usage of the indices will not have a high value or significant use.
Figure 6 shows the resulted relations of the first approach between the correlation, regression values and the eleven indices’ values extracted from the calculations.
3.2. Quantifying the Relationship between Salinity Levels and Spectral Indices
To explore a better relationship, the second analysis scenario categorized EC-vegetation index correlations based on different salinity levels. The ground EC measurements were classified into seven different salinity categories: none, slightly saline, moderately saline, high, and three different degrees of severe. Table 4 illustrates the correlation values calculated for the second approach. Where the correlation coefficient was calculated between EC values and each index for each salinity category.
This analysis is designed to determine which indices show the strongest correlations with EC at different salinity levels, indicating their potential suitability for distinguishing between salinity levels. This finding revealed a modest relationship between vegetation indices and EC values, but a more significant relationship between soil salinity indices and bare soil. This is consistent with the findings of [35] and [36]. Figure 7 shows the highest correlation was S2 = 0.96, with R² Linear = 0.89 and R² polynomial = 0.91 for moderate saline samples. As we added more details about the classification and separated the samples, the results improved gradually.
The findings presented in Figure 8 demonstrate that the second approach yielded improved correlation and regression values as the range of electrical conductivity (EC) was expanded. Specifically, the performance of the eleven indices examined in the study was enhanced across all salinity ranges. This approach investigated the relationship between vegetation indices and electrical conductivity (EC) values for soil samples with varying degrees of salinity. The results indicated that non-saline samples had a fair correlation with the indices, with S6 showing the highest correlation value. In slightly saline samples, the correlation improved, with S2 exhibiting the highest correlation value. For moderately saline samples, all the salinity indices showed a good relationship with EC, but S2 had the highest correlation value. However, for highly saline samples, the correlation was weaker than that observed for moderately saline samples, and S2 continued to exhibit the highest correlation value. These findings suggest that the correlation between EC and vegetation indices weakens as salinity levels increase.
3.3. Temporal Analysis of Salinity Indices: Exploring Relationships over Time
In the third analysis scenario, we conducted a comprehensive investigation of the relationship between electrical conductivity (EC) and various indices. This analysis was performed separately for each index, taking into account individual images and different salinity levels. To obtain the indices, we calculated them for each image based on the corresponding salinity degree. This allowed us to establish specific relationships for each scene, treating them as separate areas of interest. Subsequently, we employed a skills model to evaluate the behavior of each index in relation to the varying salinity degrees. This evaluation enabled us to assess how the indices responded to different levels of salinity and identify any patterns or trends. By accumulating the matched indices, we were able to analyze the collective behavior and gain insights into their overall performance and suitability for salinity assessment. Correlation coefficients were determined separately for each index and for different salinity levels, as presented in Table 5.
This allowed us to establish specific relationships for each scene based on temporal analysis. Subsequently, we employed a skills model to evaluate the behavior of each index with varying salinity degrees. Figure 9 displays the correlation and regression models for each index, with the highest correlation found for moderate saline samples S1 0.99, R² linear 0.88, and R² polynomial 0.93 for eight out of the nine images. The graph demonstrates how the correlation values change depending on the picture/time and index. The objective of this analysis was to examine the relationship between EC salinity levels and the fluctuations observed in each index across multiple satellite image scenes, representing different seasons and temporal changes. The aim was to differentiate between the changes occurring in vegetated areas and bare lands over time as the studies of [37]; [38] and [2] revealed. Considering that the study area exhibits a mixed vegetation pattern that poses challenges in distinguishing between the two. The approach provided valuable insights into the potential of each index (highest and lowest) to detect changes in salinity or distinguish between different salinity levels. This approach is particularly useful for conducting time series analysis aimed at identifying temporal changes in salinity levels within a given scene. Hence, the scene is considered the primary unit of analysis, and the inclusion of time-based analysis can provide valuable information regarding the temporal changes in salinity levels.
Conducting a temporal analysis involves comparing images captured at different times to identify changes in land cover and spectral values. By analyzing the temporal patterns, it is possible to distinguish between changes caused by vegetation growth and those caused by other factors such as seasonality or land cover variations. The highly dynamic nature of surface salinity processes necessitates a dynamic and temporally sensitive approach to detecting soil salinity. The use of multi-temporal remote sensing imagery is a particularly suitable method for monitoring changes in salinity levels, particularly in irrigated areas. This approach enables a comprehensive and longitudinal assessment of the evolving salinity conditions of the soil, which is imperative for understanding the complex interactions between irrigation practices and soil salinity. Given the significant impact of water management practices on soil salinity levels, the use of multi-temporal remote sensing imagery provides a valuable tool for researchers and practitioners seeking to monitor and manage soil salinity in irrigated areas [17].
The inclusion of the image/time-based classification in Figure 10 highlights the significance of time-based analysis in understanding the relationships between EC and salinity indices in the third methodology. In summary, this analysis involved a meticulous examination of the correlations between EC and indices. We considered the indices separately for each image and salinity level, created scene-specific relationships, and evaluated their behavior using a skills model. This approach allowed us to explore the relationship between salinity and indices, providing valuable insights into their applicability for salinity assessment.
3.4. Assessing Spatial Correlation and Salinity Indices: Investigating the Influence of Spatial Distribution and Landcover change on Salinity Indices
In the fourth scenario, we conducted a spatial correlation analysis on the electrical conductivity (EC) values by grouping sample points for each pond and calculating the corresponding index values. Sample locations, as presented in Table 6, were used to perform correlation and regression analyses. The results, illustrated in Figure 11, revealed that the Salinity Index (SI) had the strongest correlation with EC values among the four ponds (Bahi, Siwa, Aghormi, and Zaitoun), with correlation coefficients of 0.23, 0.23, 0.18, and 0.61, respectively. This finding suggests that the SI index is useful for evaluating salinity levels in aquatic environments. This approach is suitable for analyzing various morphological locations and elevations, especially those with distinct site characteristics.
Furthermore, our analysis of pond elevations demonstrated a positive correlation between elevation and salinity levels. The highest concentrations of saline soil samples were observed in the Bahi and Siwa pond areas with shallower water depths. Thus, the SI index can be a good tool for monitoring and managing the salinity levels in areas with varying morphological characteristics and elevations.
The findings of our fourth analysis approach involve establishing a relationship between salinity indices, spatial distribution, and the digital elevation model (DEM), which is visually presented in Figure 12. The analysis revealed that the areas surrounding the shallower ponds exhibited the highest levels of soil salinity.
By considering a wide range of indices and methods, the comparison becomes applicable across diverse environmental conditions and land cover types. This enables the assessment of soil salinity in various agricultural settings, regardless of specific electrical conductivity ranges or environmental contexts. Various anthropogenic activities can result in secondary salinization. Over-irrigation of crops is one of these activities, which can cause a rise in the water table, bringing salt to the surface and causing salinization [39]. Deforestation can also contribute to salinization by interfering with the water cycle and altering soil moisture and salinity. Land clearing can enhance soil erosion and organic matter loss, increasing the likelihood of salinization. Water can build up in poor drainage systems, causing soil salinization. Mining activities, through releasing salt into the land and streams, can also contribute to salinization. In conclusion, anthropogenic activities can lead to secondary salinization via a variety of pathways. Due to the uncontrolled flow of irrigation water from wells that the Siwa Oasis's residents dug to use the water for continuous irrigation, the environment is endangered due to the rise in groundwater near the surface.
The general administration of Matrouh Drainage Projects constructed main combined drains to collect wastewater from primary and secondary drains in the Siwa Oasis. Instead of allowing the wastewater to flow directly to the ponds, a mechanical lifting method using pumps was implemented to transport the water. This change had a positive impact on the drainage system and led to a noticeable increase in the agricultural area of the Oasis after previously flooded areas became suitable for cultivation. The sustainability of the Oasis residents also increased as a result.
Environmental variables such as vegetation cover and soil index are crucial for monitoring soil salinization, and their accuracy must be carefully evaluated [40]. Subsequently, an analysis was conducted to investigate the relationship between the distribution of soil salinity, pond elevation, land cover, and land use. Estimation of land cover change based on uncorrected images can present unrealistic change rates, which are two to three times higher than those obtained with corrected images. This is due to variations in sensor sensitivity and atmospheric conditions that can influence the accuracy of change detection. To improve the accuracy of change detection, the use of corrected images is critical for obtaining reliable estimates of land cover change over time [41]. Figure 13 demonstrates the sample density for each class, along with the various ranges of salinity that were considered during the analysis using the IDW interpolation algorithm. Figure 14 shows that the majority of the salinity samples were concentrated in cultivated areas Table 7.
Management interventions implemented thereafter led to a significant reduction of excess water by about 94.7% from 1998 to 2012, resulting in a 24% decrease in the total area of lakes. The closure of hand-dug wells resulted in an 11% decrease in groundwater withdrawal from 1998 to 2006. Groundwater withdrawal decreased by 33% from 2008 to 2012, leading to a 24% reduction in lake area over 10 years (2000–2010) [42]. The change in landcover detection from 2003 to 2020, as shown in Figure 15, occurred after the government replaced old dug-wells with newly designed wells and implemented proper management.
This part of the study aimed to investigate the impact of continuous monitoring of soil salinity and land cover changes in Siwa’s area over 17 years. By considering the cultivated soil’s vegetation performance as an indirect indicator of soil salinity, we can infer potential soil salinity levels [15]. The underlying assumption is that a substantial amount of vegetation signifies successful crop growth and lower levels of detrimental salts in the soil. Using remote sensing techniques, the changes were detected in land cover, and it was found that the total vegetated area increased from 59.8 sq. km in 2003 to 89 sq. km in 2020, representing a 48% increase, as shown in Figure 16. Moreover, it may not be suitable for images with complex land cover patterns or mixed pixels. By applying a supervised classification method and band combinations, we found that the cultivated areas had expanded by 19.70 sq. km. as barren lands were reclaimed and converted into cultivable ones. Moreover, the wetlands had shrunk by 8.27 sq. km as they were transformed into cultivated areas. The results suggest that effective salinity monitoring can contribute to the expansion of cultivated areas and the improvement of land use practices. Collaborating with the irrigation and agriculture authorities in Siwa can help address irrigation shortages and meet agriculture requirements.
Based on the analysis, it can be concluded that effective management of water resources and continuous monitoring of salinity levels can increase the cultivated area, improve water usage, and enhance water distribution. Ensuring that the timing and predictability of water supply are adequate is crucial for effective water management, often more so than the mere adequacy of supply [43]. From a systemic or social perspective, promoting equity in water distribution is essential to prevent certain users from receiving an excess of water at the expense of others. Additionally, optimizing water usage by providing an adequate but not excessive supply and minimizing losses is equally important. By working together, stakeholders can develop effective solutions that balance the needs of different users and promote sustainable water management practices.
4. Conclusions
This study evaluated the performance of eleven soil salinity indices using remote sensing techniques in Siwa Oasis, Egypt. The results provided valuable insights for selecting suitable indices for monitoring and managing soil salinity in the Siwa Oasis and in similar environment. In current research, we demonstrated the values from the Landsat images and exhibited the correlation analysis based on the extracted indices values for the 56 sample locations. In the first scenario of the analysis, the highest correlation coefficient was SI = 0.38, with linear R² = 0.14 and polynomial R² = 0.15 were observed. In the second scenario we generated a relation based on EC degrees and calculated indices. In eleven indices three showed the highest correlation for S2, S6, and SAVI. Among these, S2 index with 0.96 and 0.56 correlation were better for moderate and highly saline samples. In the third scenario, the correlation between EC and vegetation index was calculated for each index and on a per-image basis. In these indices four exhibited the highest correlation for S1, S2, S6, and SAVI, respectively. The S6 demonstrated the highest correlation with 0.72 for non-saline, S2 with 0.74 correlation for slightly saline and S1 with 0.99 for moderately saline. In the fourth scenario we calculated the correlation between EC and index values based on location. The SI index had the highest correlation for all four ponds. The lowest EC values were in the lands near Zaitoun and Agormi, where the ponds had the lowest elevation, while the highest values were monitored near Siwa and Bahi El-dien, where the ponds had the shallowest elevation. The concluded relationship between salinity monitoring and land cover changes over a 17-year period were conducted. The total vegetated area increased by 48% from 2003 to 2020, indicating the effectiveness of salinity monitoring for expanding cultivated areas.
This study demonstrated the feasibility of using remote sensing indices and satellite imagery for detecting and monitoring soil salinity changes to monitor vegetation dynamics. The findings provided insights into the correlation between EC and indices values, as well as the influence of land cover type and pond elevation on salinity variations. However, the analysis did not account for how EC-index correlations may differ with vegetation type or other conditions that vary over time, but the more we change the method of the analysis, the better results we achieve. More comprehensive analysis is needed to assess the utility of individual indices for monitoring temporal salinity changes and distinguishing salinity levels across diverse, dynamically changing conditions.
Acknowledgments
Funding for this research was supported by the National Natural Science Foundation of China (Grant No. 51979239).
Conflicts of Interest
The authors declare that they have no known competing financial interests or personal relationships that could have appeared to influence the work reported in this paper.
References
- Asfaw, E., Suryabhagavan, K. V., & Argaw, M. (2016). Soil salinity modeling and mapping using remote sensing and GIS: The case of Wonji sugar cane irrigation farm, Ethiopia. Journal of the Saudi Society of Agricultural Sciences, 15(2), 196-210. [CrossRef]
- Metternicht, G., & Zinck, J. A. (2003). Remote sensing of soil salinity: Potentials and constraints revisited. Remote Sensing of Environment, 85(1), 1-20. [CrossRef]
- Abdallah, A. (2007). Assessment of Salt weathering in Siwa Oasis (The Western Desert of Egypt). Bulletin de la Societe de Geogrphie de Egypte, 80, 65-80.
- Abdelfattah, M. A., Mostafa, M. H., & El-Kholy, M. A. (2009). Assessment of soil salinization hazard using remote sensing and GIS in arid regions: a case study in Safaga District, Red Sea, Egypt. Environmental Monitoring and Assessment, 157(1-4), 97-110. [CrossRef]
- Allbed, A., & Kumar, L. (2013). Soil salinity mapping and monitoring in arid and semi-arid regions using remote sensing technology: A review. Remote Sensing, 5(9), 4384-4417. [CrossRef]
- Bannari, A., El-Battay, A., Bannari, R., & Rhinane, H. (2018). Sentinel-MSI VNIR and SWIR Bands Sensitivity Analysis for Soil Salinity Discrimination in an Arid Landscape. Remote Sensing, 10(6), 855. [CrossRef]
- Mróz, M., & Sobieraj, A. (2004). Comparison of Several Vegetation Indices Calculated on the Basis of a Seasonal Spot Xs Time Series, and Their Suitability for Land Cover and Agricultural Crop Identification. Technical Sciences, 7, 39-66.
- Abdelaty, E. F., & Aboukila, E. F. (2017). Detection of Soil Salinity for Bare and Cultivated Lands Using Landsat ETM+ Imagery Data: A Case Study from El-Beheira Governorate, Egypt. Alexandria Science Exchange Journal, 38(3), 644-655. [CrossRef]
- Zhou, D., Lin, Z., & Liu, L. (2012). Regional land salinization assessment and simulation through cellular automaton-Markov modeling and spatial pattern analysis. Science of the Total Environment, 439, 260-274. [CrossRef]
- Elnaggar, A. A., El-Hamidi, K. H., Mousa, M. A., & Albakry, M. F. (2017). Mapping Soil Salinity and Evaluation of Water Quality in Siwa Oasis Using GIS. J.Soil Sci. and Agric. Eng., Mansoura Univ., 8(1), 9-19. [CrossRef]
- Embabi, N. S. (2004). The geomorphology of Egypt, land forms and evolution. Vol. 1 The Nile valley and the Western Desert. The Egyptian Geographical Society Special Publication. Nubar Printing House.
- World Climate and Temperature. (n.d.). Siwa Oasis Climate Graph. Retrieved June 24, 2023, from http://www.siwa-oasis.climatemps.com/.
- El-Hassanin, A. S., Abd El Hady, A. A., Ali, R. R., Abdel Maksoud, K. M., and Oda, M. M. M. (2020). Land resources assessment of Siwa Oasis, Western Desert, Egypt. Plant Archives, 20(Supplement 1), 3084-3093. [CrossRef]
- Ismail, M. H., Razack, M., and Elamin, A. E. (2013). Assessment of groundwater recharge in arid areas using remote sensing and GIS: Wadi Watir, Sinai Peninsula, Egypt. Hydrogeology Journal, 21(4), 853-865.
- Wang, F., Chen, X., Luo, G., Ding, J., and Chen, X. (2013). Detecting soil salinity with arid fraction integrated index and salinity index in feature space using Landsat TM imagery. Journal of Arid Land, 5(3), 340-353. [CrossRef]
- Wang, Z., Zhu, S., and Yu, R. (1993). Saline soil of China. Beijing: Science Press. (in Chinese).
- Al-Khaier, F. (2003). This reference is a Master's thesis titled "Soil salinity detection using satellite remote sensing" conducted at the International Institute for Geoinformation Science and Earth Observation in the Netherlands.
- Aldakheel Y.Y. 2011. Assessing NDVI Spatial Pattern as Related to Irrigation and Soil Salinity Management in AlHassa Oasis, Saudi Arabia, Journal of the Indian Society of Remote Sensing, Vol. 39, No. 2, 2011, pp. 171-180. [CrossRef]
- Mashimbye Z.E. 2013. Remote sensing of salt-affected soils. Dissertation presented for the degree Doctor of Philosophy in the Faculty of AgriSciences at Stellenbosch University.
- Matinfar H.R. 2013. Detection of Soil Salinity Changes and Mapping Land Cover Types Based upon Remotely Sensed Data. Arabian Journal of Geosciences, Vol. 6, No. 3, 2013, pp. 913-919. [CrossRef]
- Mougenot, B., Pouget, M., and Epema, G. (1993). Remote sensing of salt-affected soils. Remote Sensing Reviews, 7, 241-259. [CrossRef]
- Song, C., Woodcock, C. E., Seto, K. C., Lenney, M. P., and Macomber, S. A. (2001). Classification and change detection using Landsat TM data: When and how to correct atmospheric effects. Remote Sensing of Environment, 75(2), 230-244. [CrossRef]
- Chander, G., Markham, B. L., & Helder, D. L. (2009). Summary of current radiometric calibration coefficients for Landsat MSS, TM, ETM+, and EO-1 ALI sensors. Remote Sensing of Environment, 113(5), 893-903. [CrossRef]
- Markham, B. L., and Helder, D. L. (2012). Forty-year calibrated record of earth-reflected radiance from Landsat: A review. Remote Sensing of Environment, 122, 30-40. [CrossRef]
- Pflugmacher, D., Cohen, W. B., & Kennedy, R. E. (2012). Using Landsat-derived disturbance history (1972-2010) to predict current forest structure. Remote Sensing of Environment, 122, 146-165. [CrossRef]
- USGS. (n.d.). Landsat 7 Science Data Users Handbook. Retrieved from https://www.usgs.gov/media/files/landsat-7-science-data-users-handbook ↗.
- Bannari, A., Guedon, A. M., El-Harti, A., Cherkaoui, F. Z., & El-Ghmari, A. (2008). Characterization of slightly and moderately saline and sodic soils in irrigated agricultural land using simulated data of advanced land imaging (EO-1) sensor. Communications in Soil Science and Plant Analysis, 39(19-20), 2795-2811. [CrossRef]
- Abbas, A., & Khan, S. (2007). Using remote sensing techniques for appraisal of irrigated soil salinity. Paper presented at the Advances and Applications for Management and Decision-Making Land, Water and Environmental Management: Integrated Systems for Sustainability MODSIM07.
- Douaoui, A. E. K., Nicolas, H., & Walter, C. (2006). Detecting salinity hazards within a semiarid context by means of combining soil and remote-sensing data. Geoderma, 134(1-2), 217-230. [CrossRef]
- Khan, S., Hanjra, M. A., & Mu, J. (2005). Pathways to reduce the environmental footprint of irrigation water in the Aral Sea Basin. Journal of Environmental Management, 75(2), 133-146. [CrossRef]
- Liu, H. Q., & Huete, A. R. (1995). A feedback-based modification of the NDVI to minimize canopy background and atmospheric noise. IEEE Transactions on Geoscience and Remote Sensing, 33, 457-465. [CrossRef]
- Major, D. J., Baret, F., & Guyot, G. (1990). A ratio vegetation index adjusted for soil brightness. International Journal of Remote Sensing, 11(5), 727-740. [CrossRef]
- Huete, A. R. (1988). A soil adjusted vegetation index (SAVI). Remote Sensing of Environment, 25, 295-309. [CrossRef]
- Deering, D. W., Rouse, J. W., Haas, R. H., & Schell, J. A. (1975). Measuring "forage production" of grazing units from Landsat MSS data. Proceedings of the 10th International Symposium Remote Sensing of Environment, 2, 1169-1178.
- Bouaziz, M., Bouaziz, B., Ben Dhiab, A., & Moussadek, R. (2011). Monitoring soil salinity using remote sensing and GIS: A case study of the Nabeul-Hammamet region, Tunisia. Arabian Journal of Geosciences, 4(7-8), 1297-1310. [CrossRef]
- Fan, J., Li, X., Wang, M., Zhou, Y., & Chen, L. (2012). Soil salinity mapping and monitoring in an arid region using Landsat imagery with ETM+ sensor and field data. International Journal of Digital Earth, 5(6), 498-516. [CrossRef]
- Rao, B. R. M., Subbarao, K. V., & Venkateswarlu, B. (1995). Use of remote sensing data for monitoring soil salinization in the Krishna River Basin, Andhra Pradesh, India. International Journal of Remote Sensing, 16(5), 865-878. [CrossRef]
- Karavanova, A., Pachepsky, Y. A., & Timlin, D. J. (2001). Remote sensing of soil salinity: Potentials and constraints. Journal of Applied Remote Sensing, 1(1), 013520. [CrossRef]
- Garcia, C. J., Faz, A., & Hernandez, J. (2005). Secondary salinization: A problem affecting sustainable agriculture in arid and semiarid regions. Journal of Sustainable Agriculture, 27(2), 113-136.
- Wang, J., Peng, J., Li, H.,Yin, C., Liu, W., Wang, T., Zhang, H. (2021). Soil Salinity Mapping Using Machine Learning Algorithms with the Sentinel-2 MSI in Arid Areas, China. Remote Sens., 13, 305. [CrossRef]
- Paolini, L., Grings, F., Sobrino, J. A., Jiménez Muñoz, J. C., and Karszenbaum, H. (2006). Radiometric correction effects in Landsat multi-date/multi-sensor change detection studies. International Journal of Remote Sensing, 27(4), 685-704. [CrossRef]
- Moghazy, N. H., and Kaluarachchi, J. J. (2019). Assessment of groundwater resources in Siwa Oasis, Western Desert, Egypt. Faculty of Engineering, Alexandria University. Production and hosting by Elsevier B.V. [CrossRef]
- Hussein, M. H., Karaman, H. G., and Rashed, A. (2013). Sustainability of Agriculture in Closed Basin of Koum Oshim, Fayoum, Egypt. International Journal of Current Engineering and Technology.
Figure 1.
Using ArcGIS software, a map of the research region based on the ESRI base map location and an elevation map produced from the ALOS DEM.
Figure 1.
Using ArcGIS software, a map of the research region based on the ESRI base map location and an elevation map produced from the ALOS DEM.
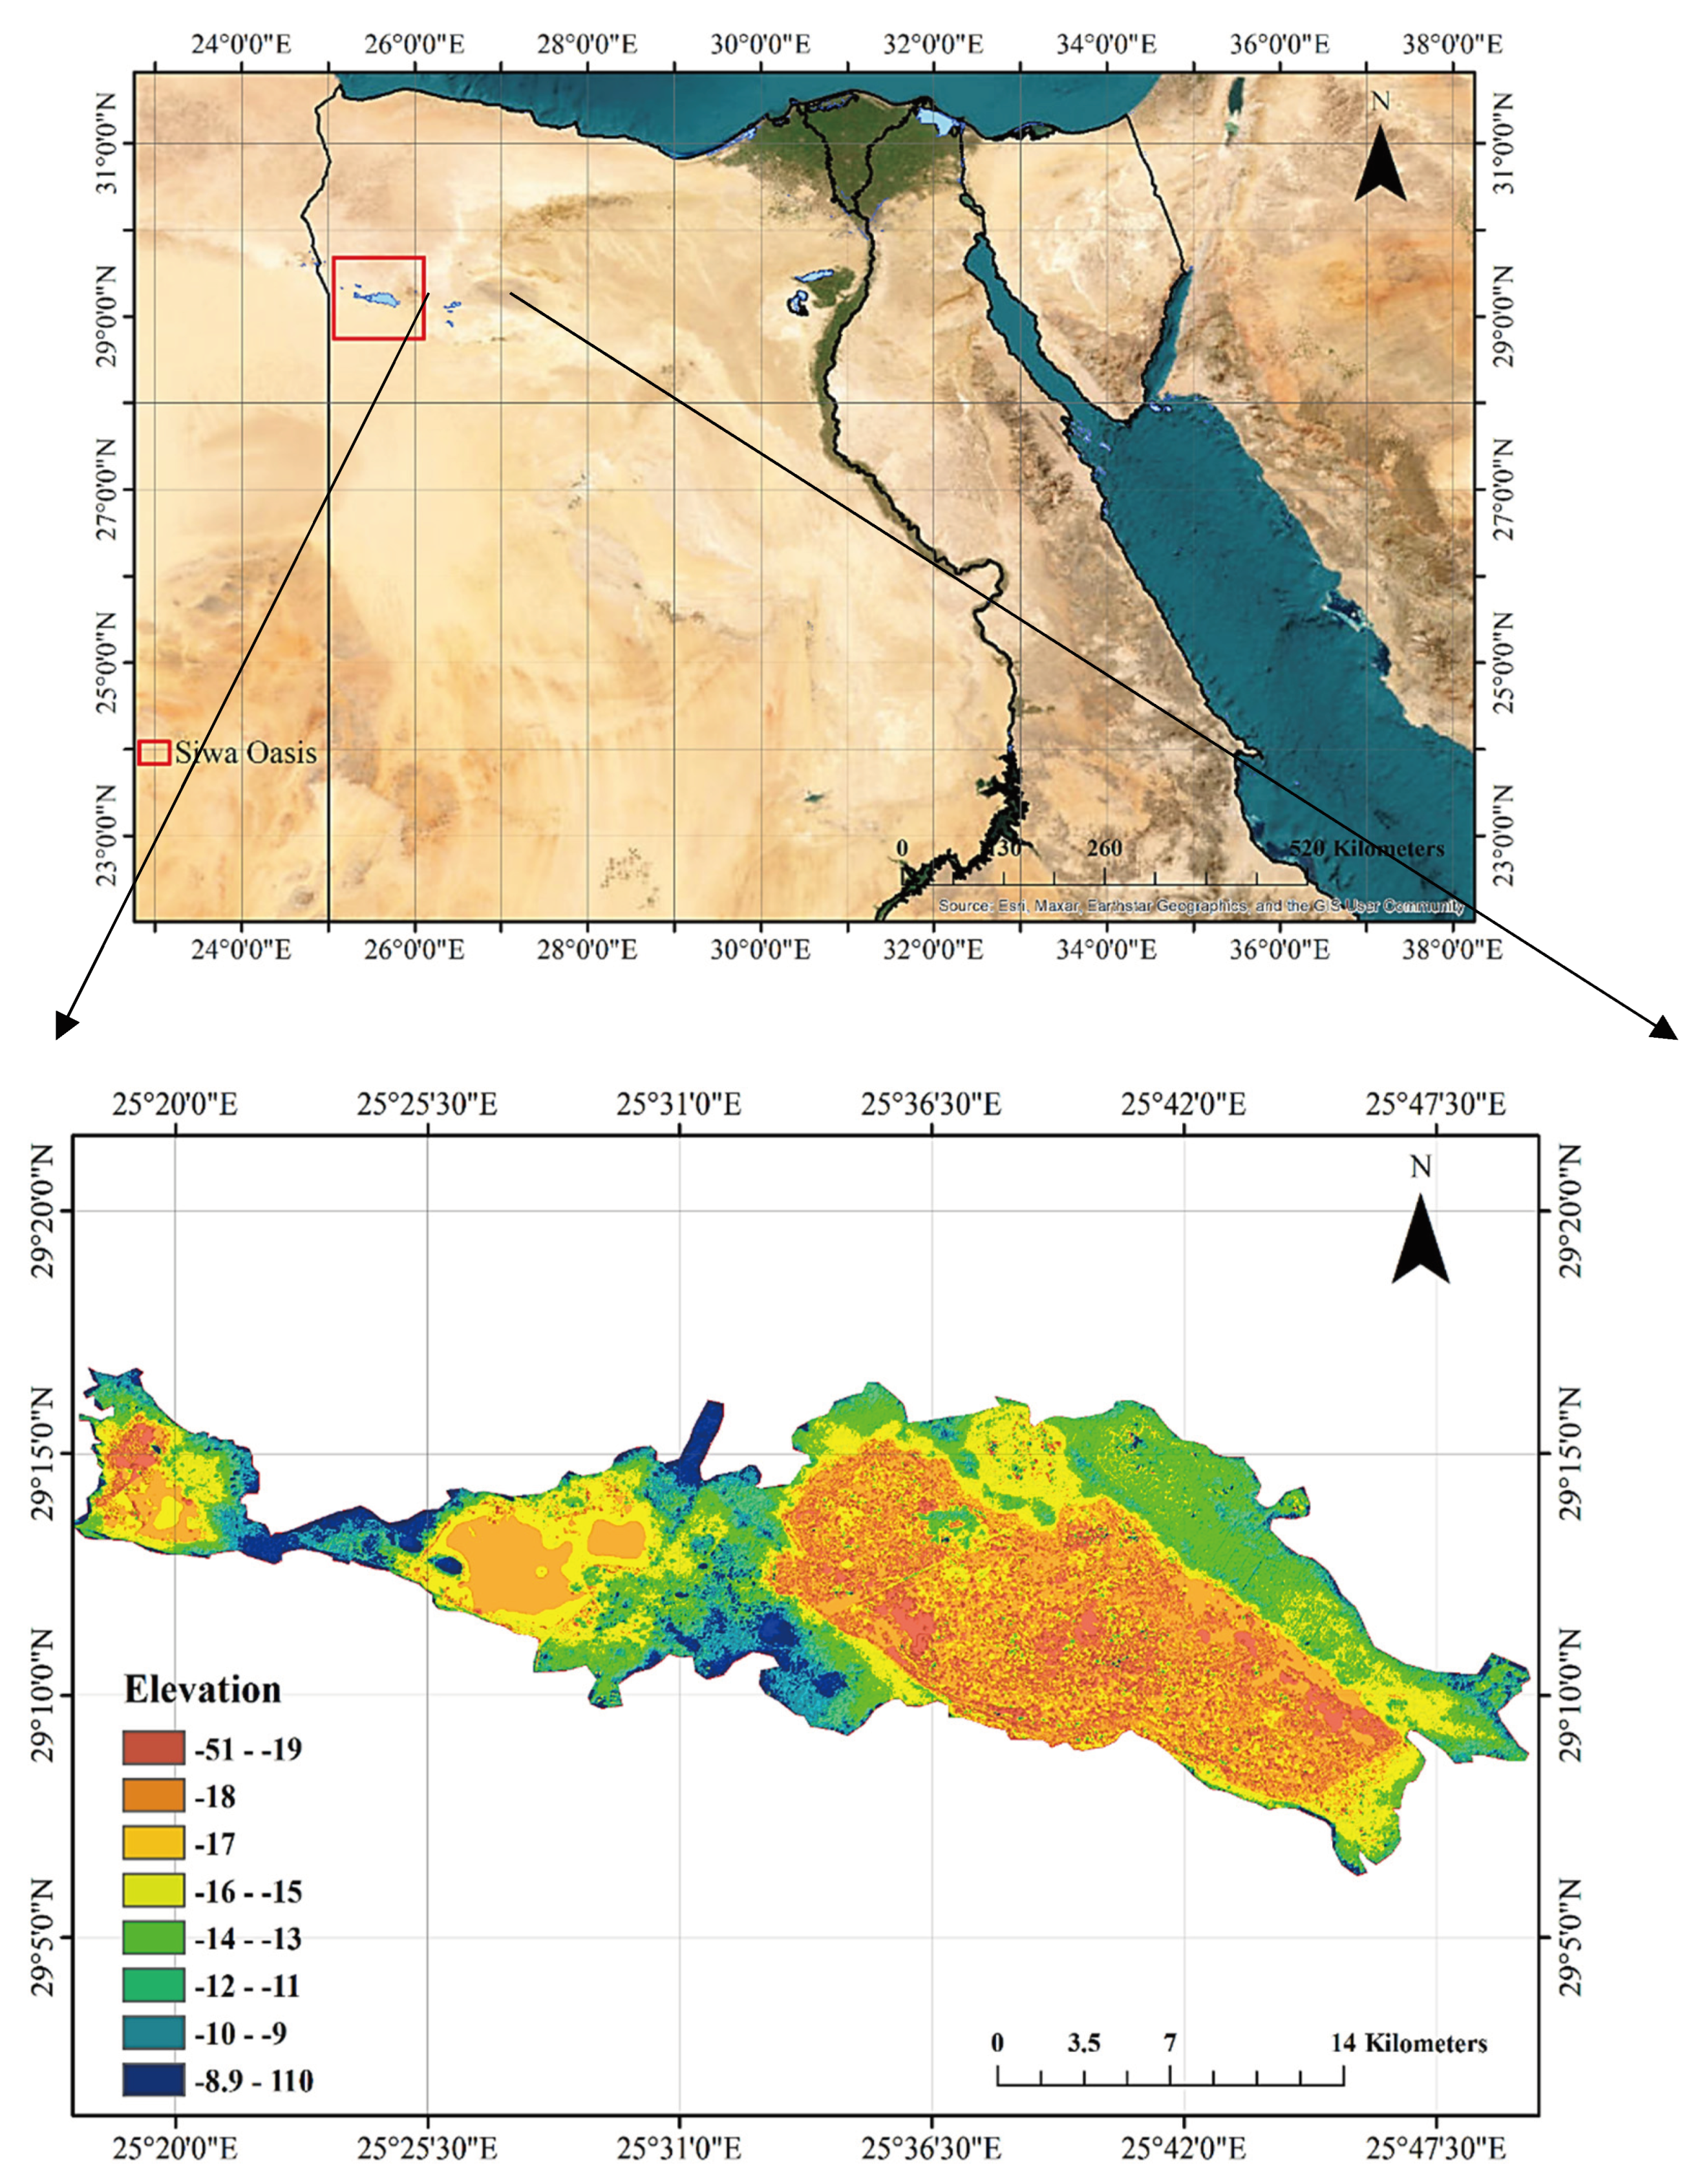
Figure 2.
Siwa Oasis Climate and Temperature: World Climate and Temperature (n.d.).[12].
Figure 2.
Siwa Oasis Climate and Temperature: World Climate and Temperature (n.d.).[12].
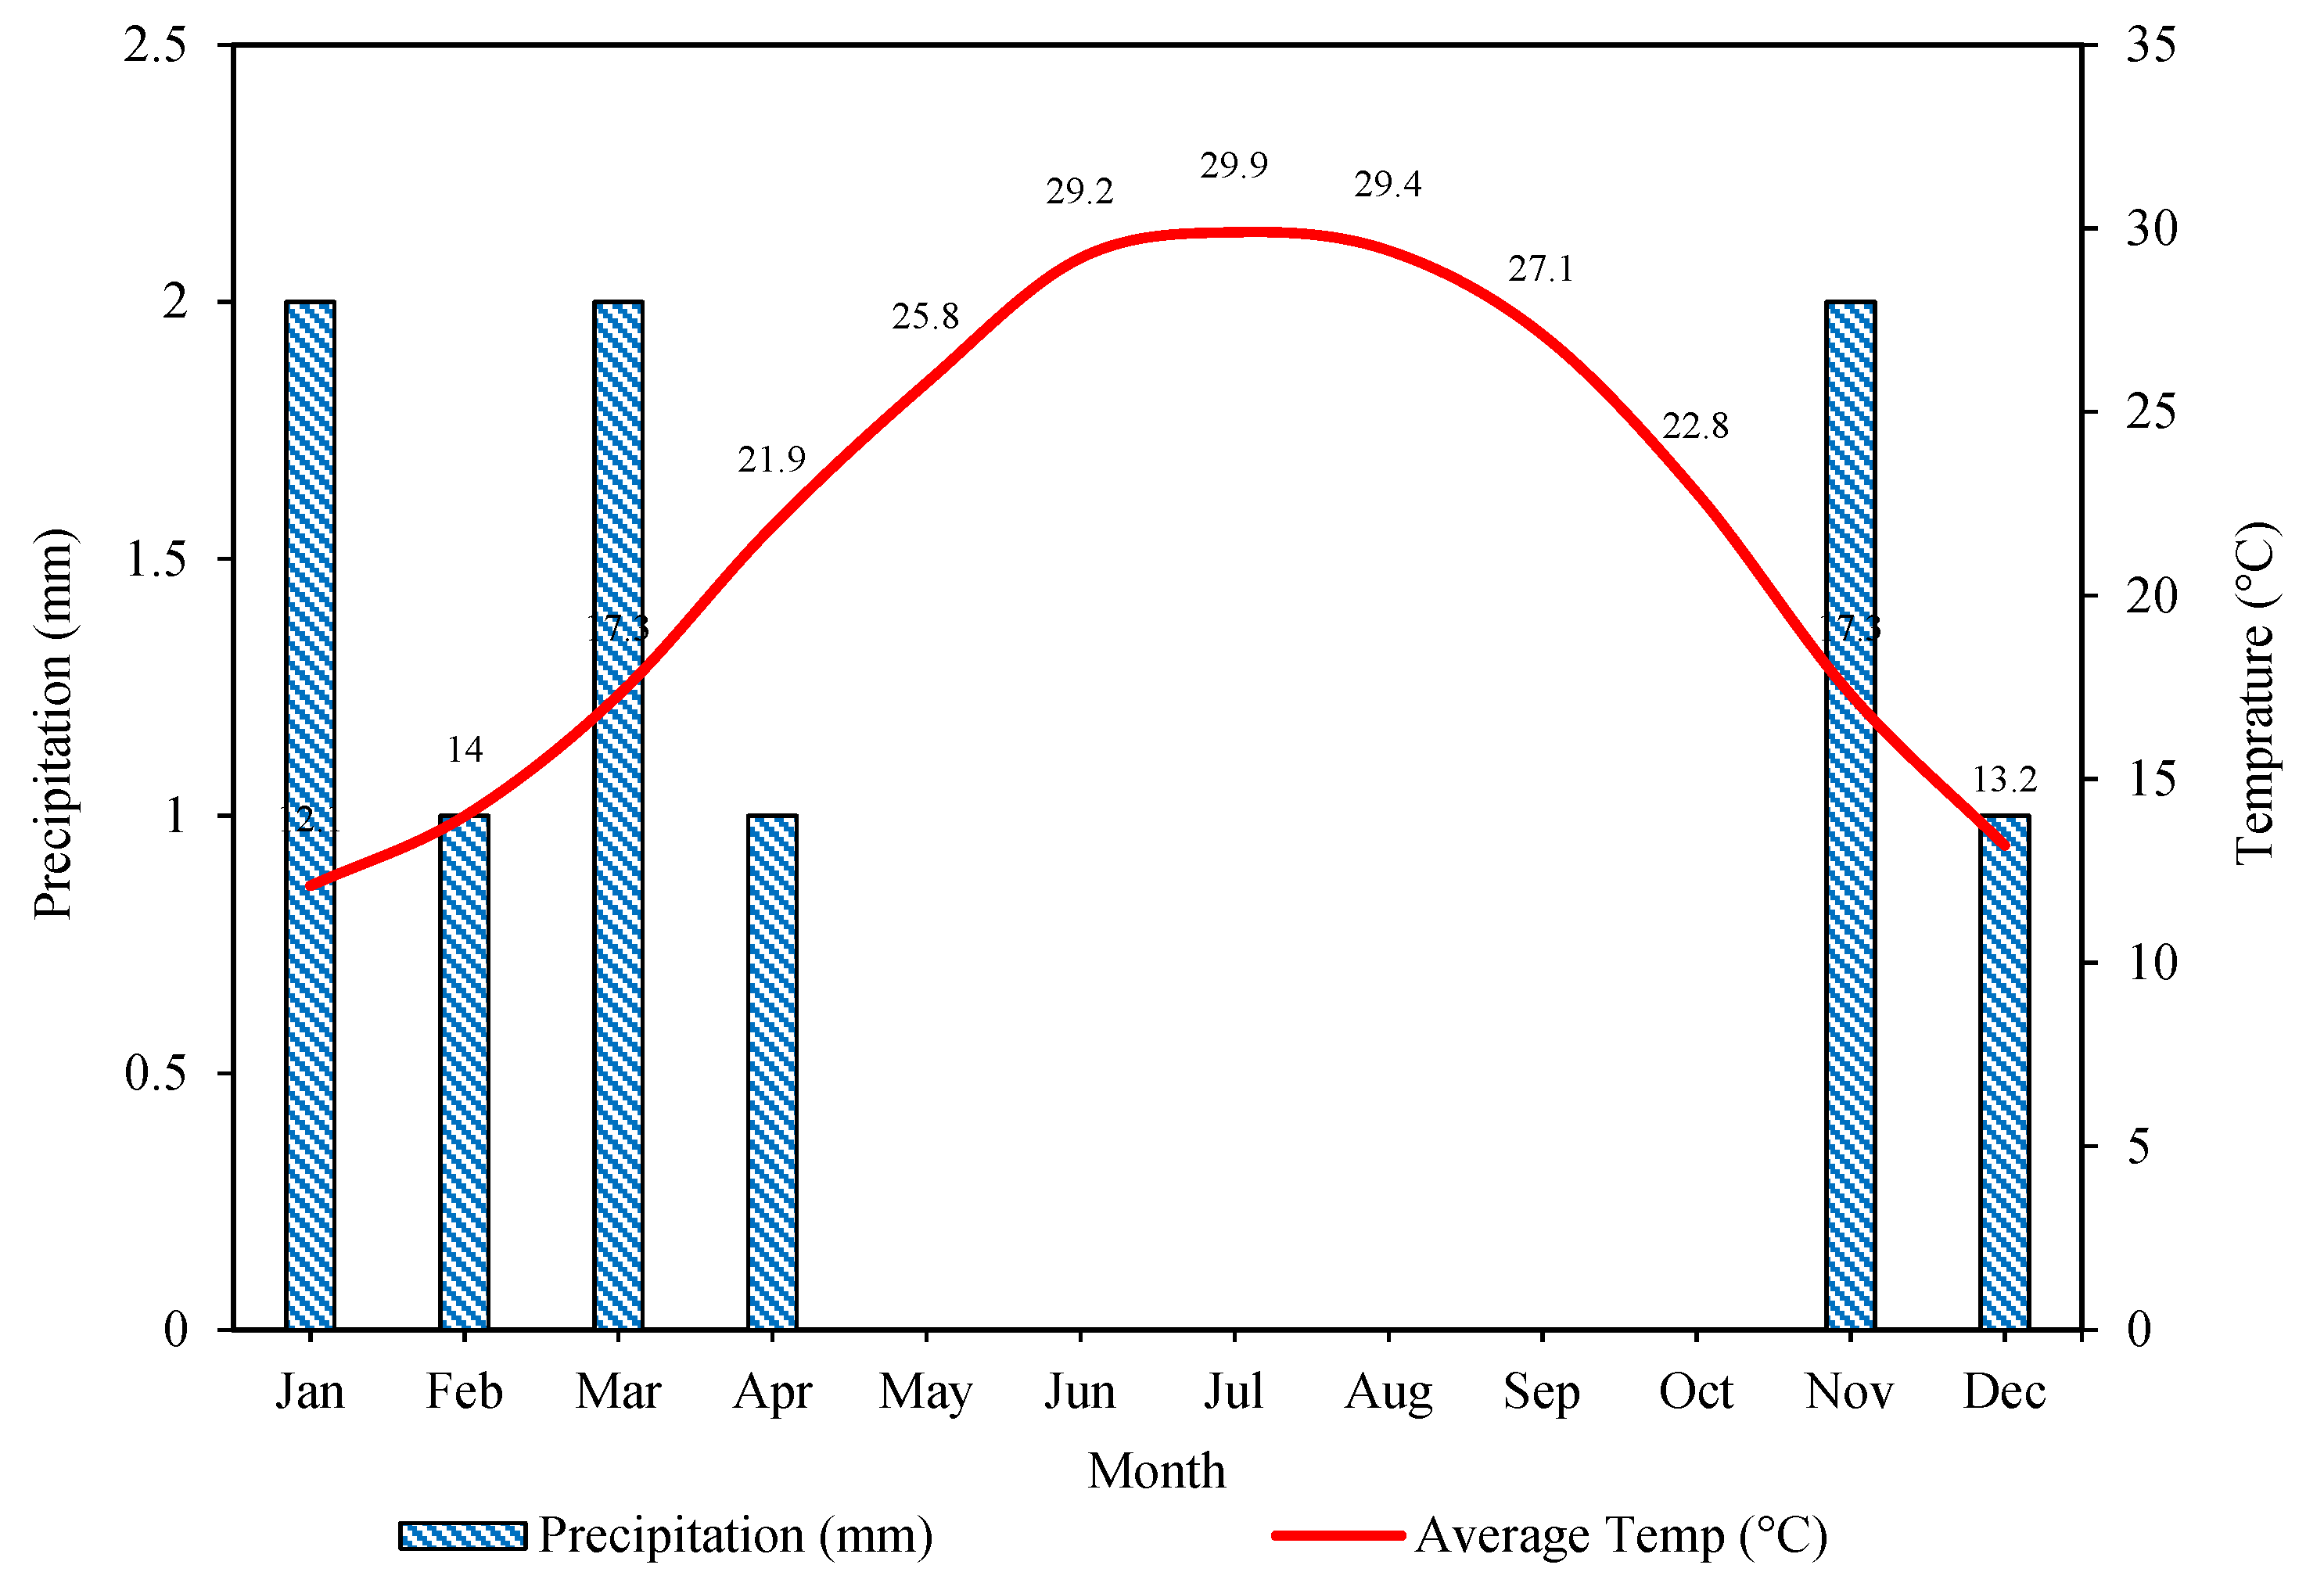
Figure 3.
Workflow chart.
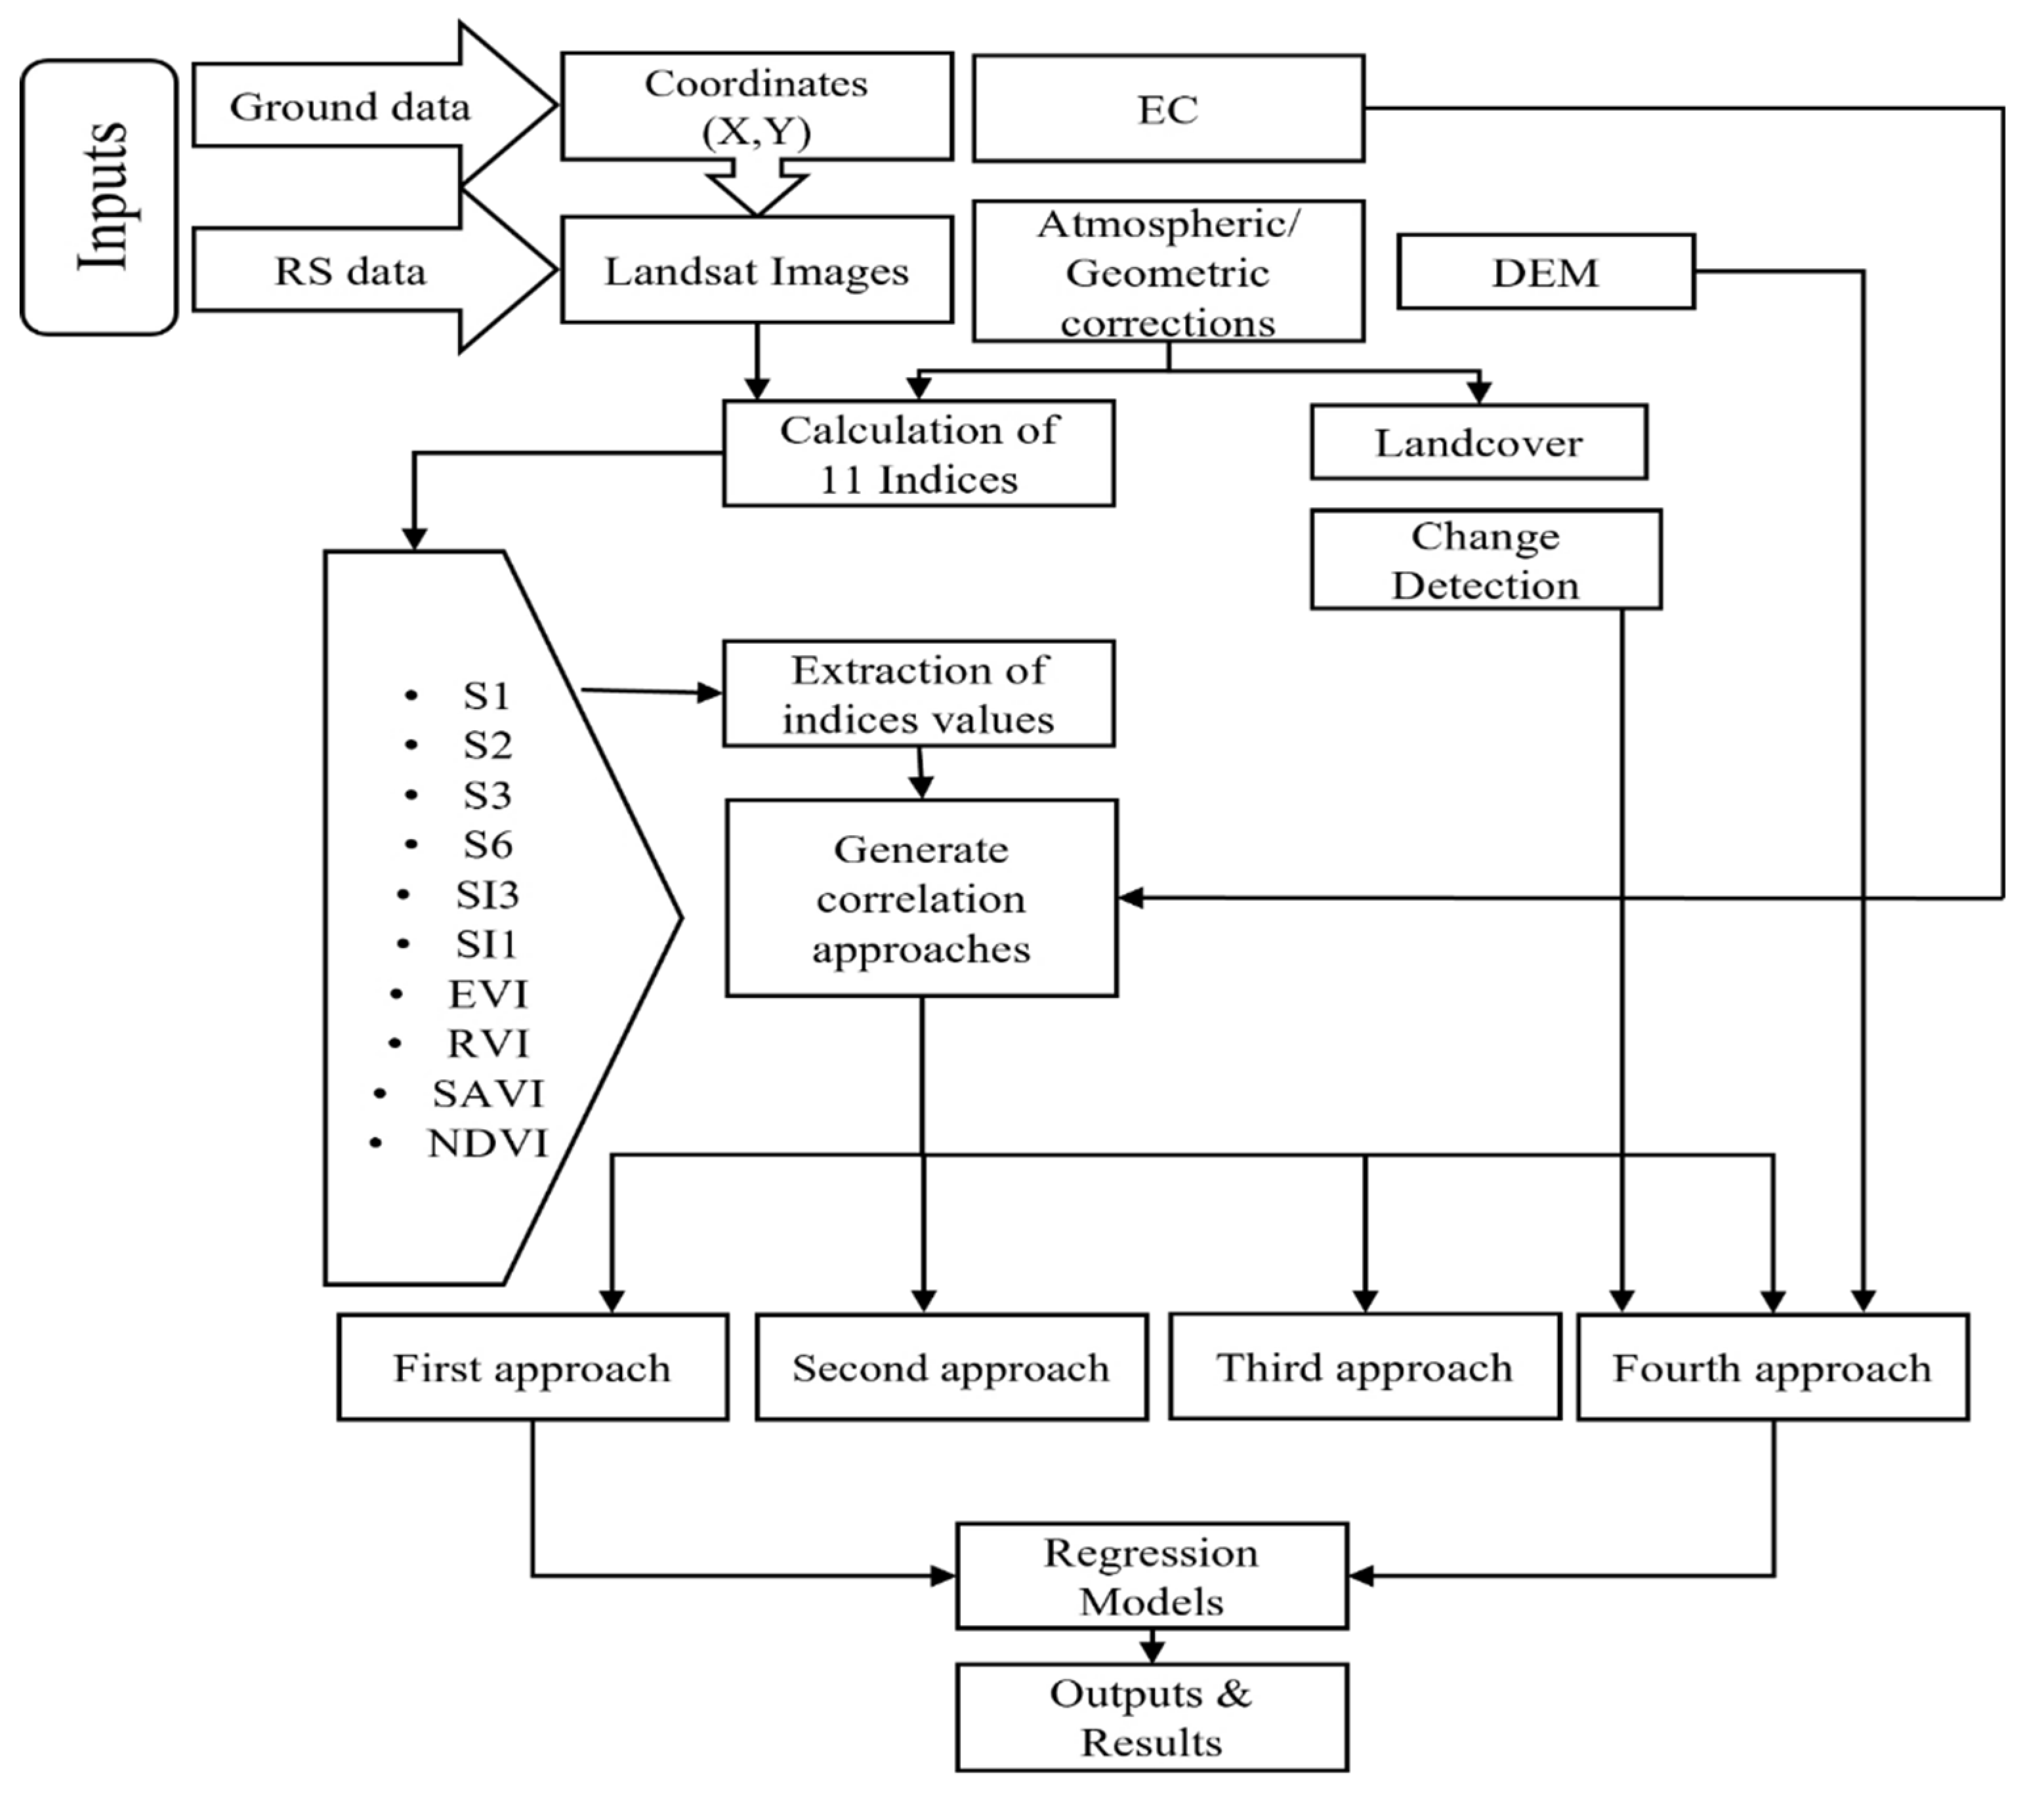
Figure 4.
A topographic map shows the distribution of the ground samples.
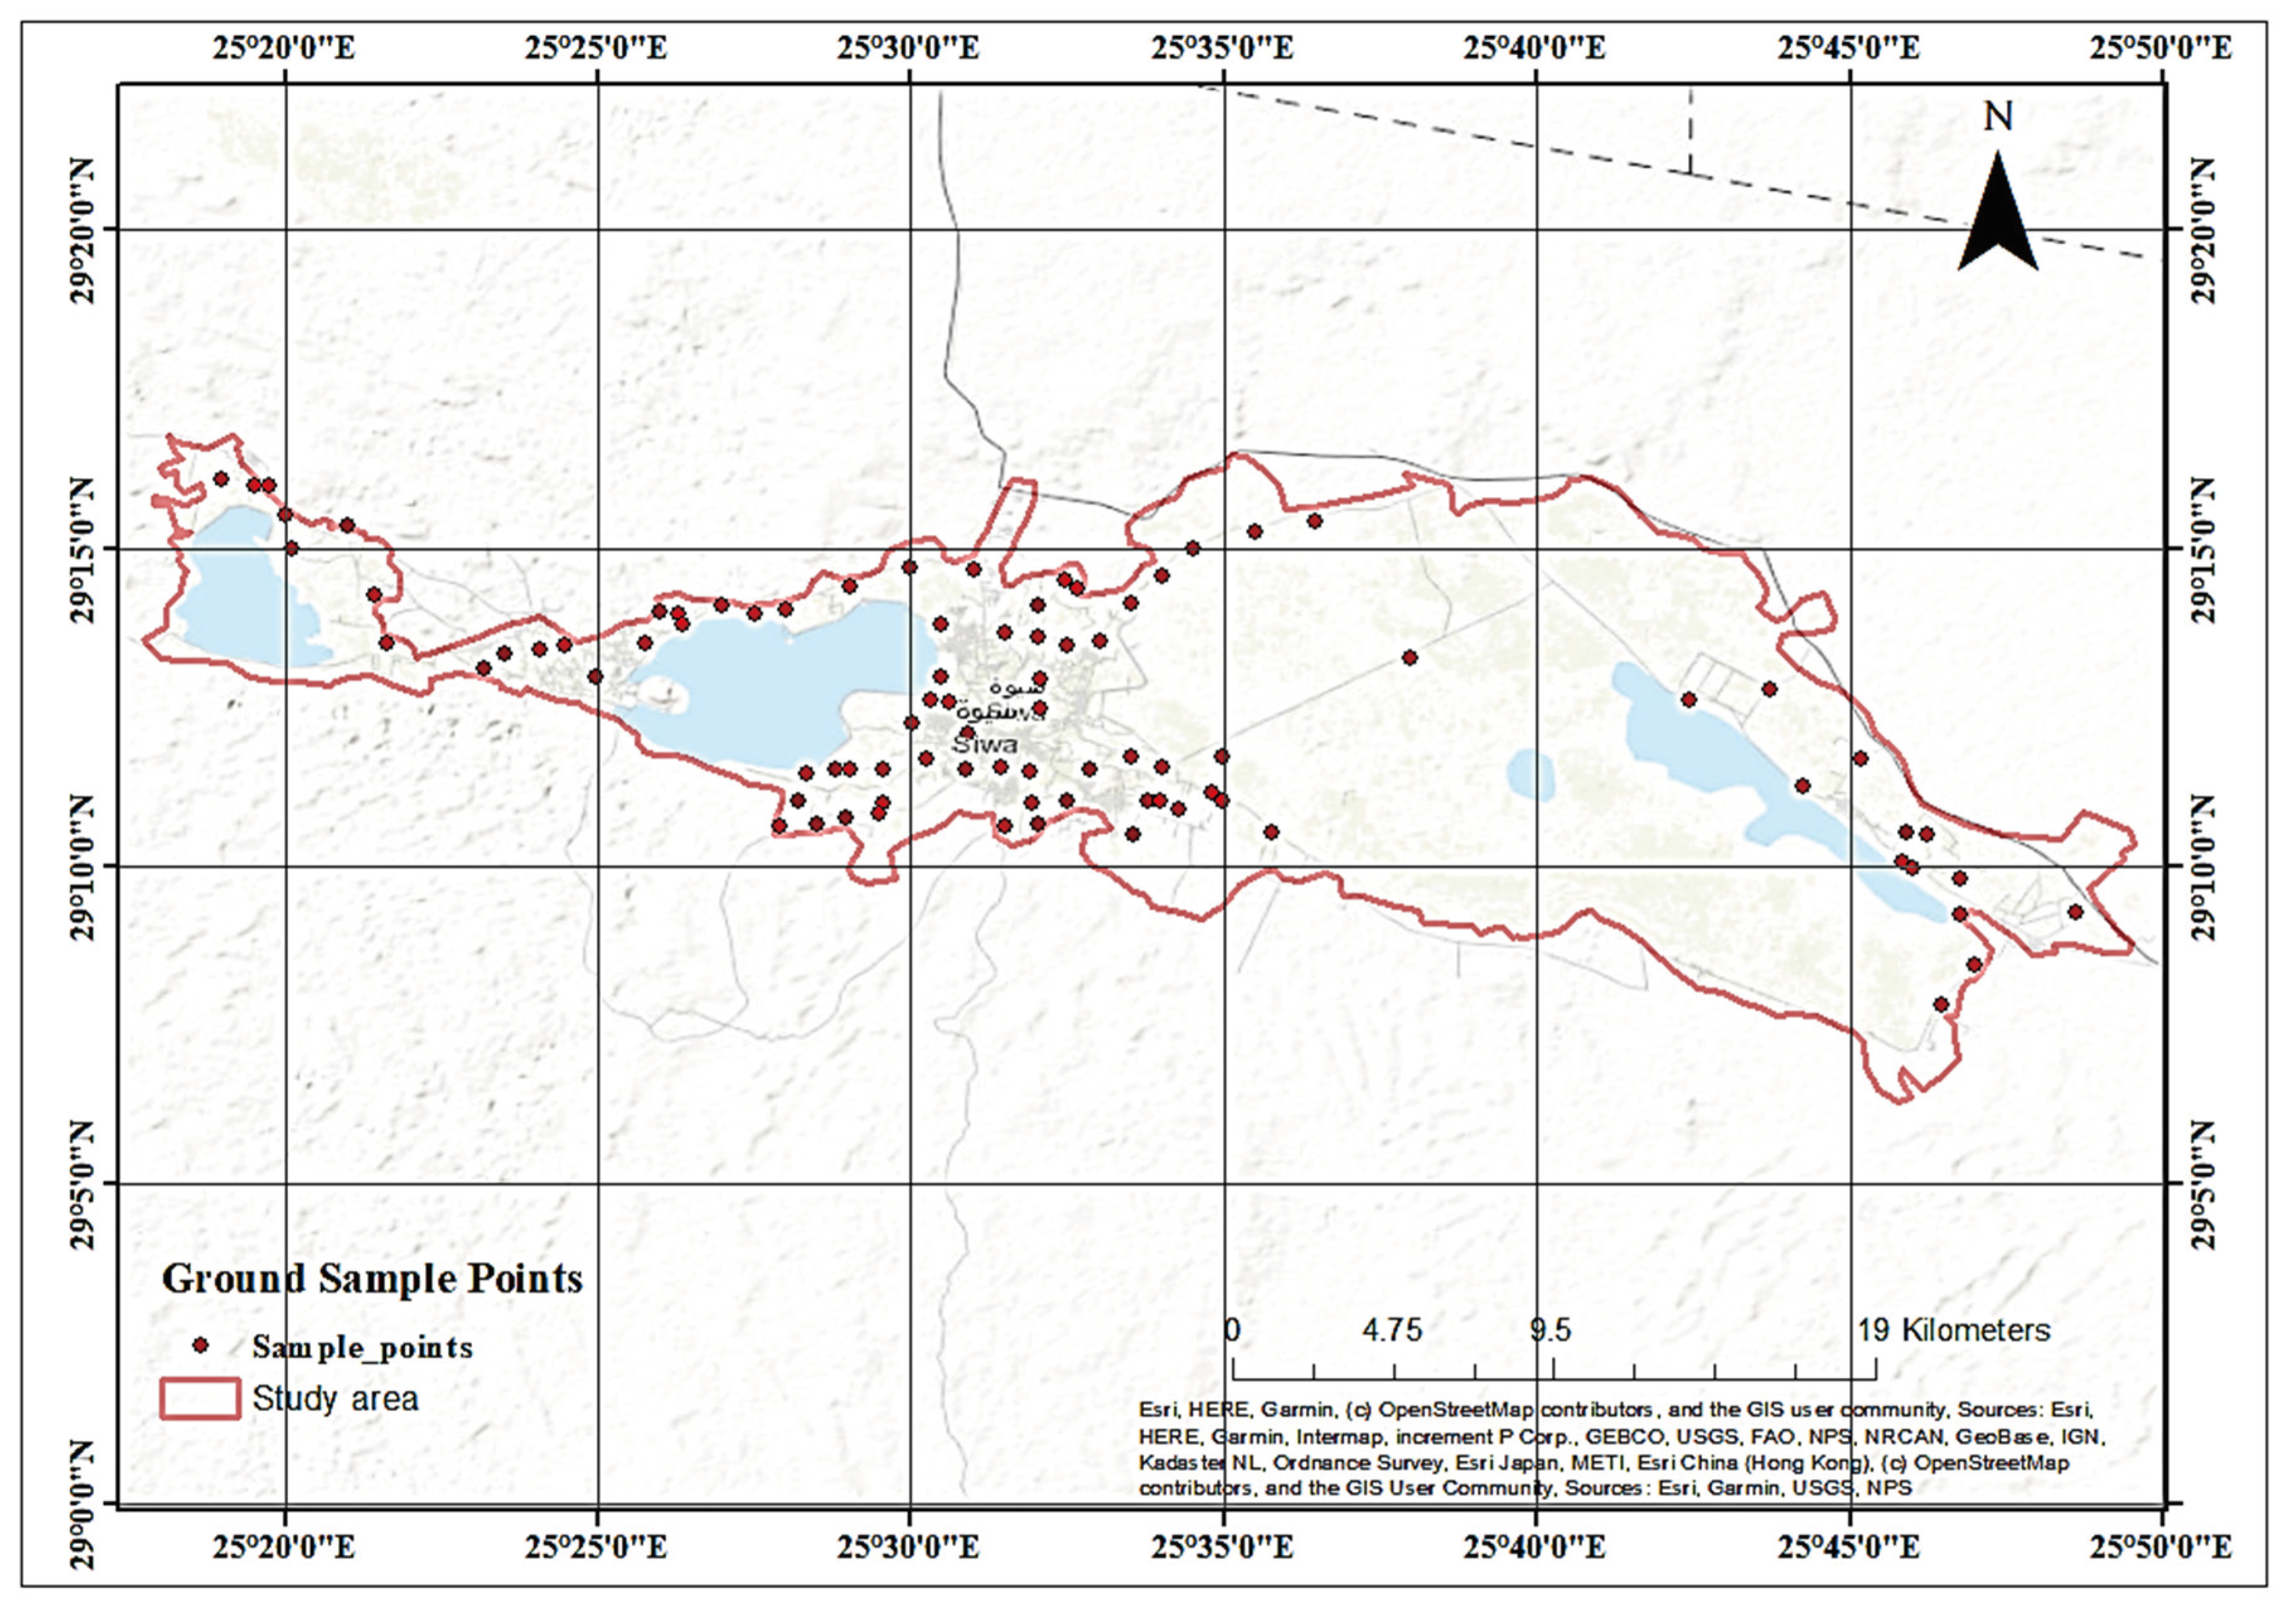
Figure 5.
Linear and Polynomial Regression model equations with some of the highest correlation for EC and salinity indices using the first approach.
Figure 5.
Linear and Polynomial Regression model equations with some of the highest correlation for EC and salinity indices using the first approach.
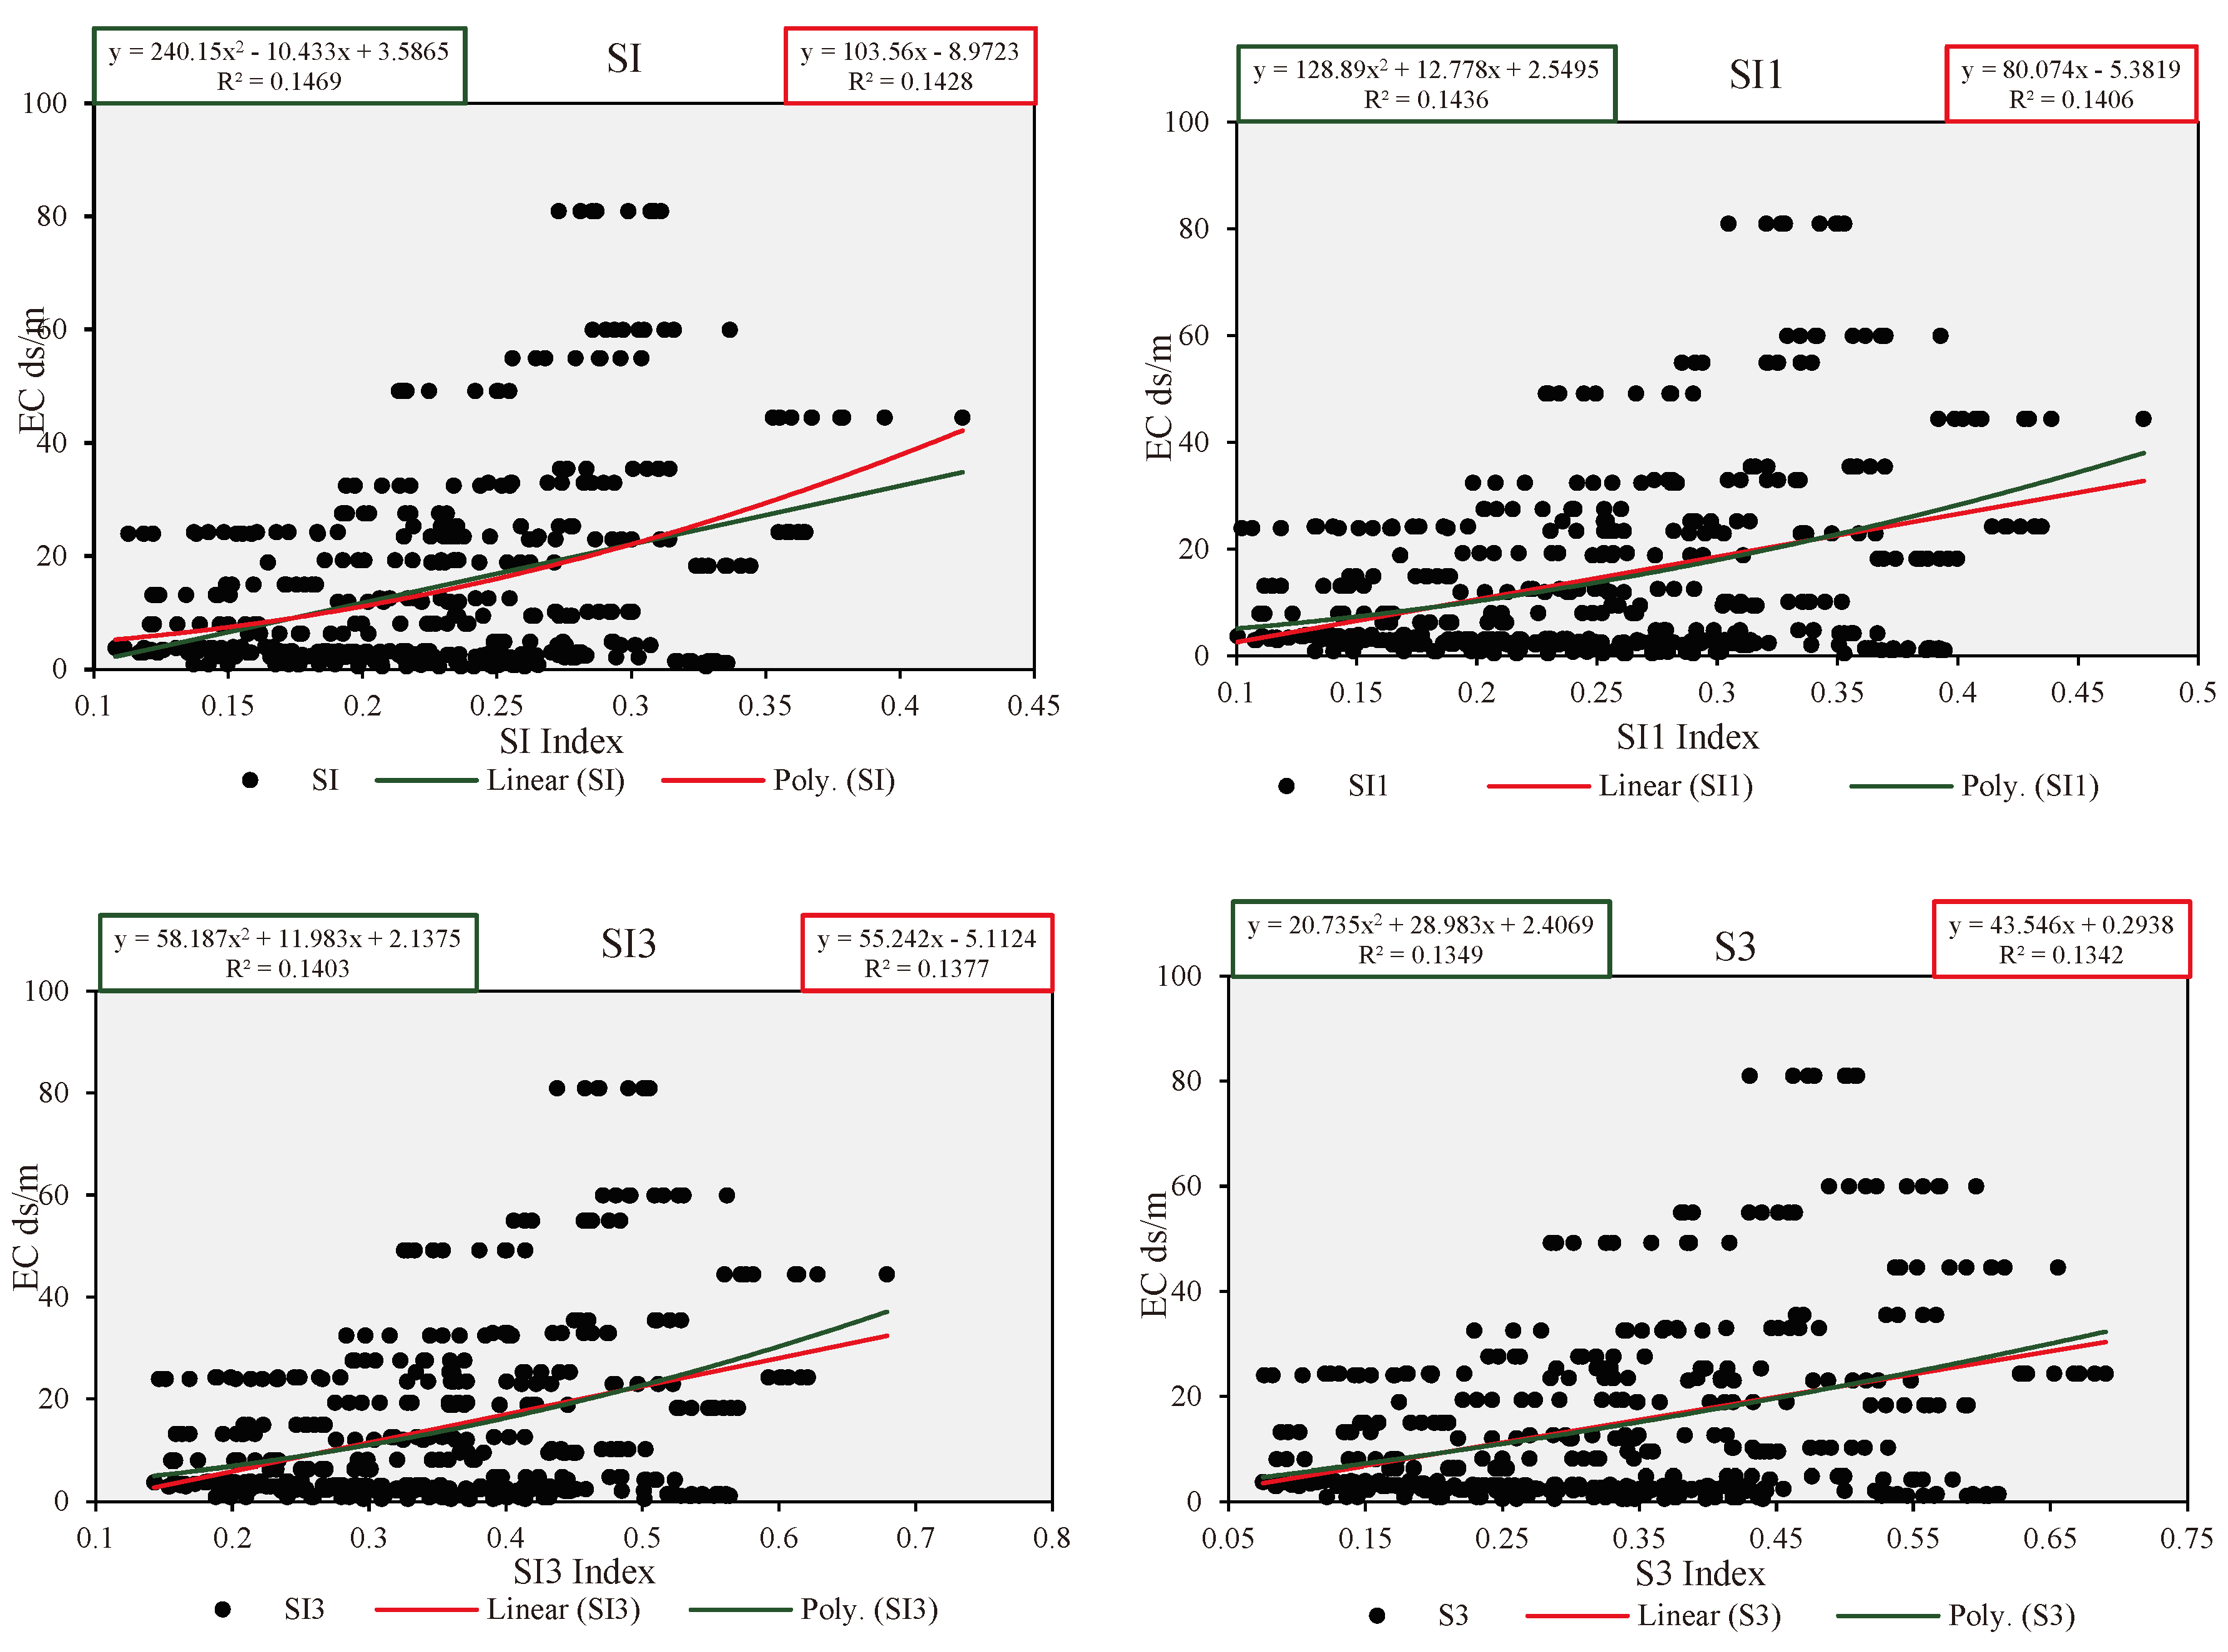
Figure 6.
Correlation and regression analysis of EC and salinity indices using the first approach.
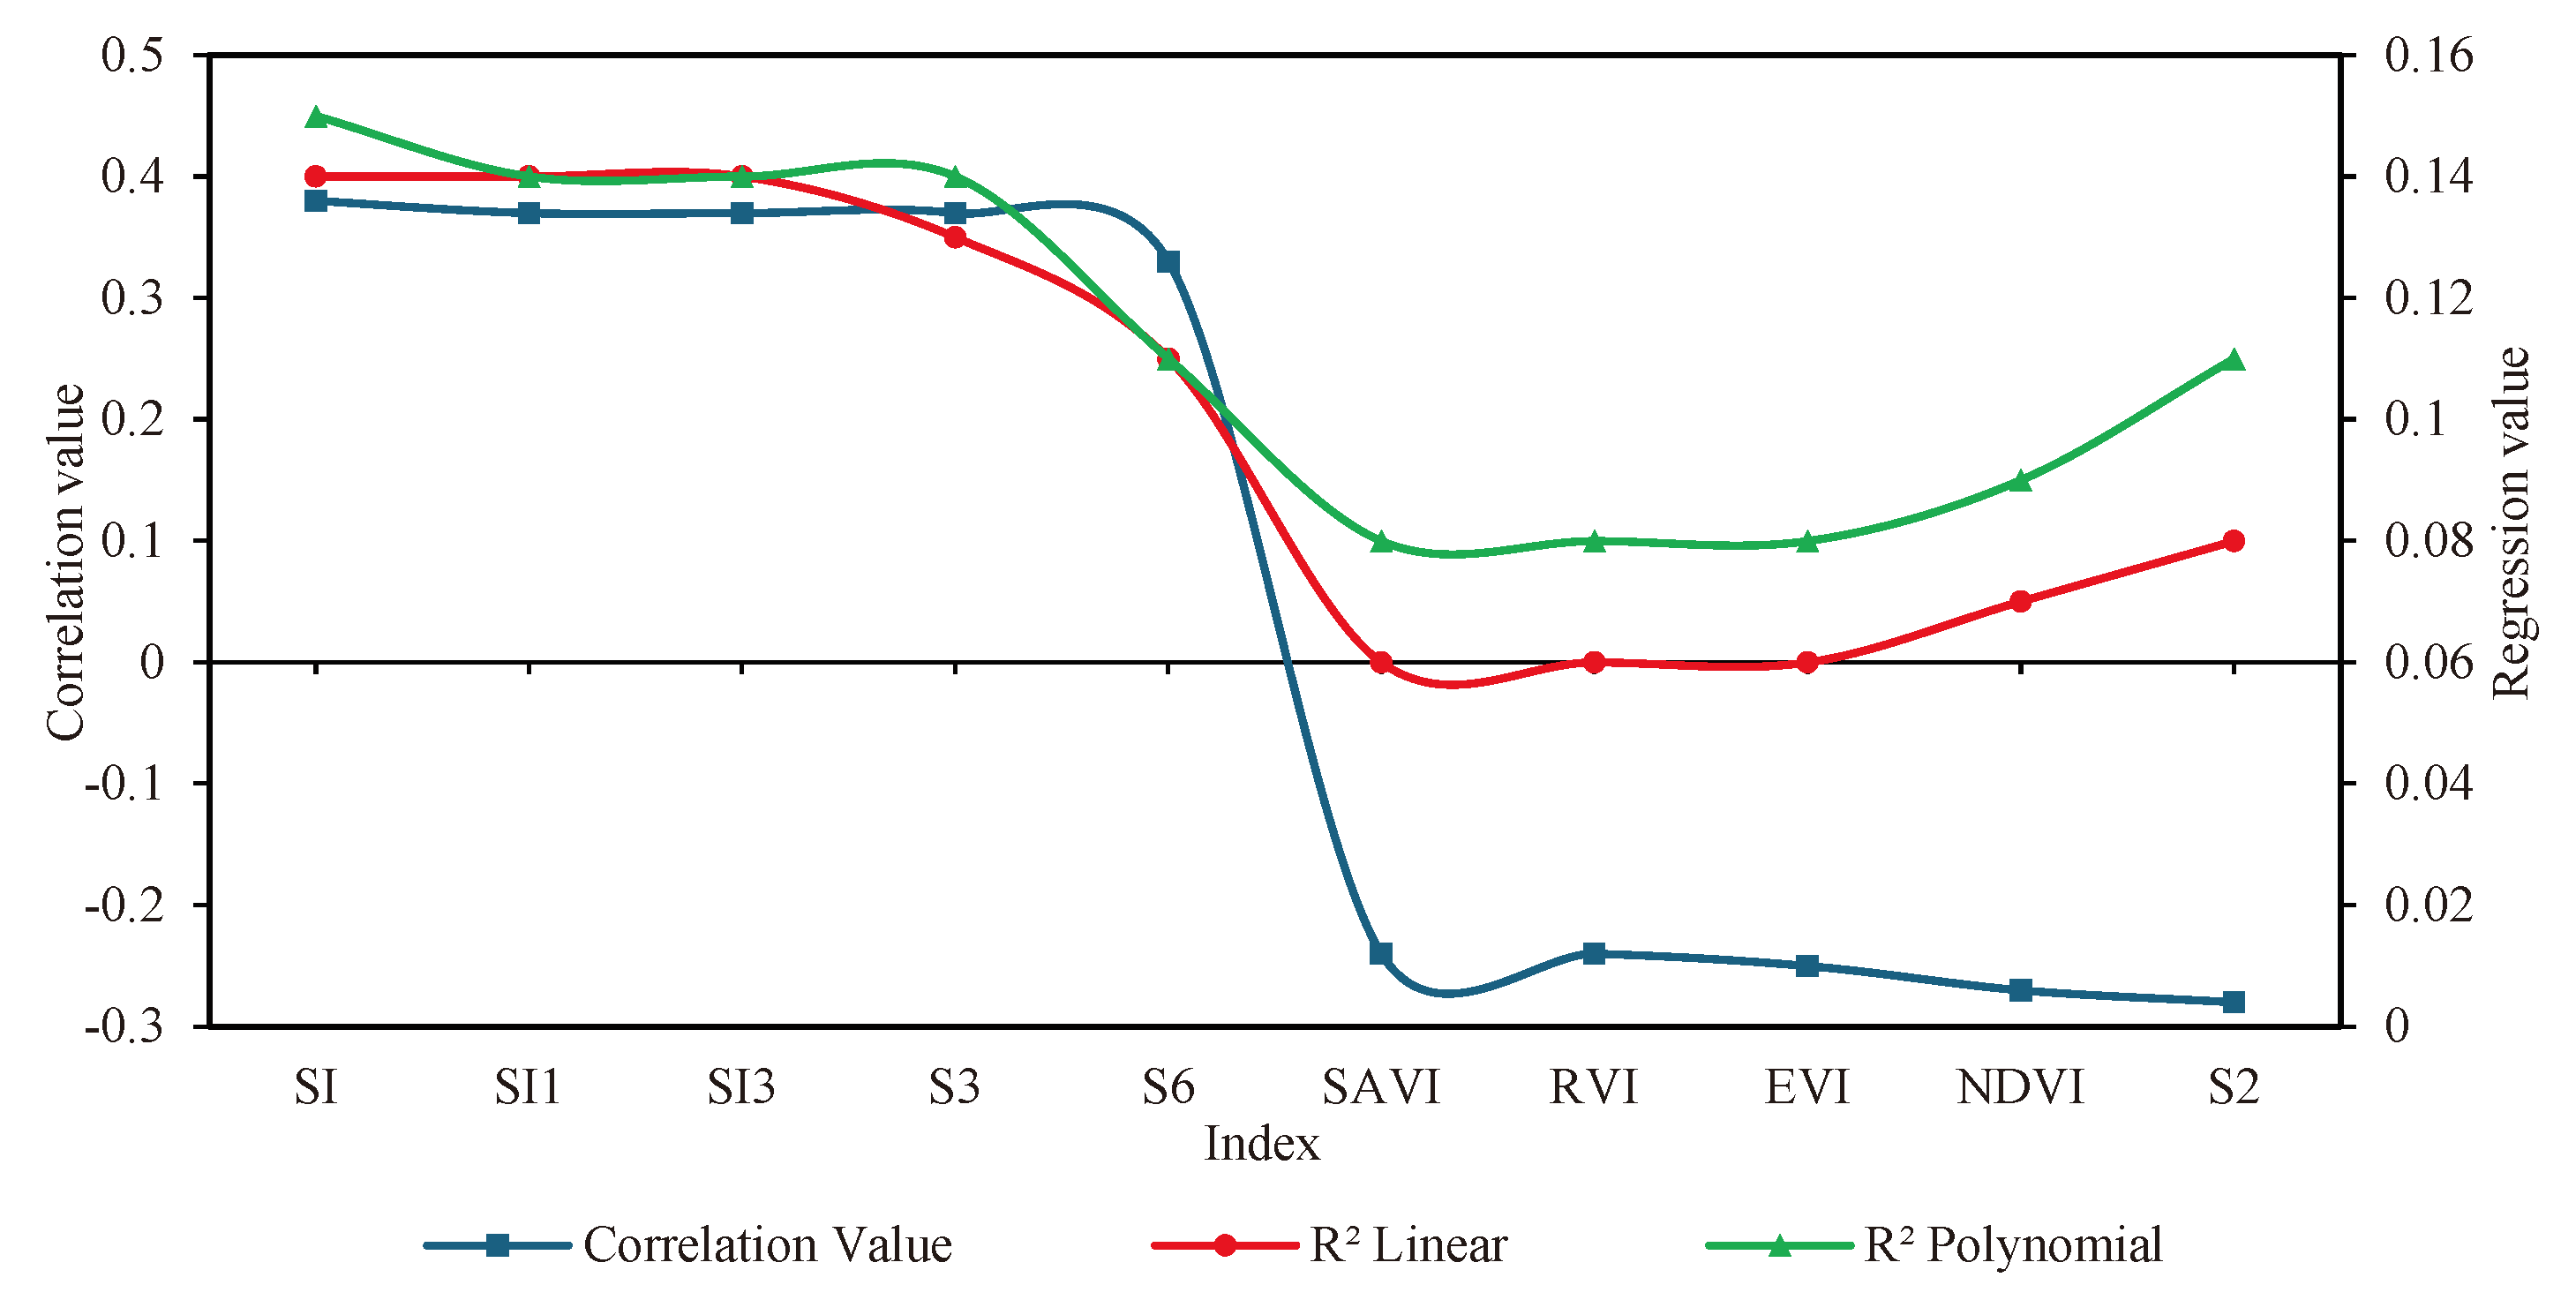
Figure 7.
Regression model equations with the highest correlation for EC and salinity indices using the second approach.
Figure 7.
Regression model equations with the highest correlation for EC and salinity indices using the second approach.
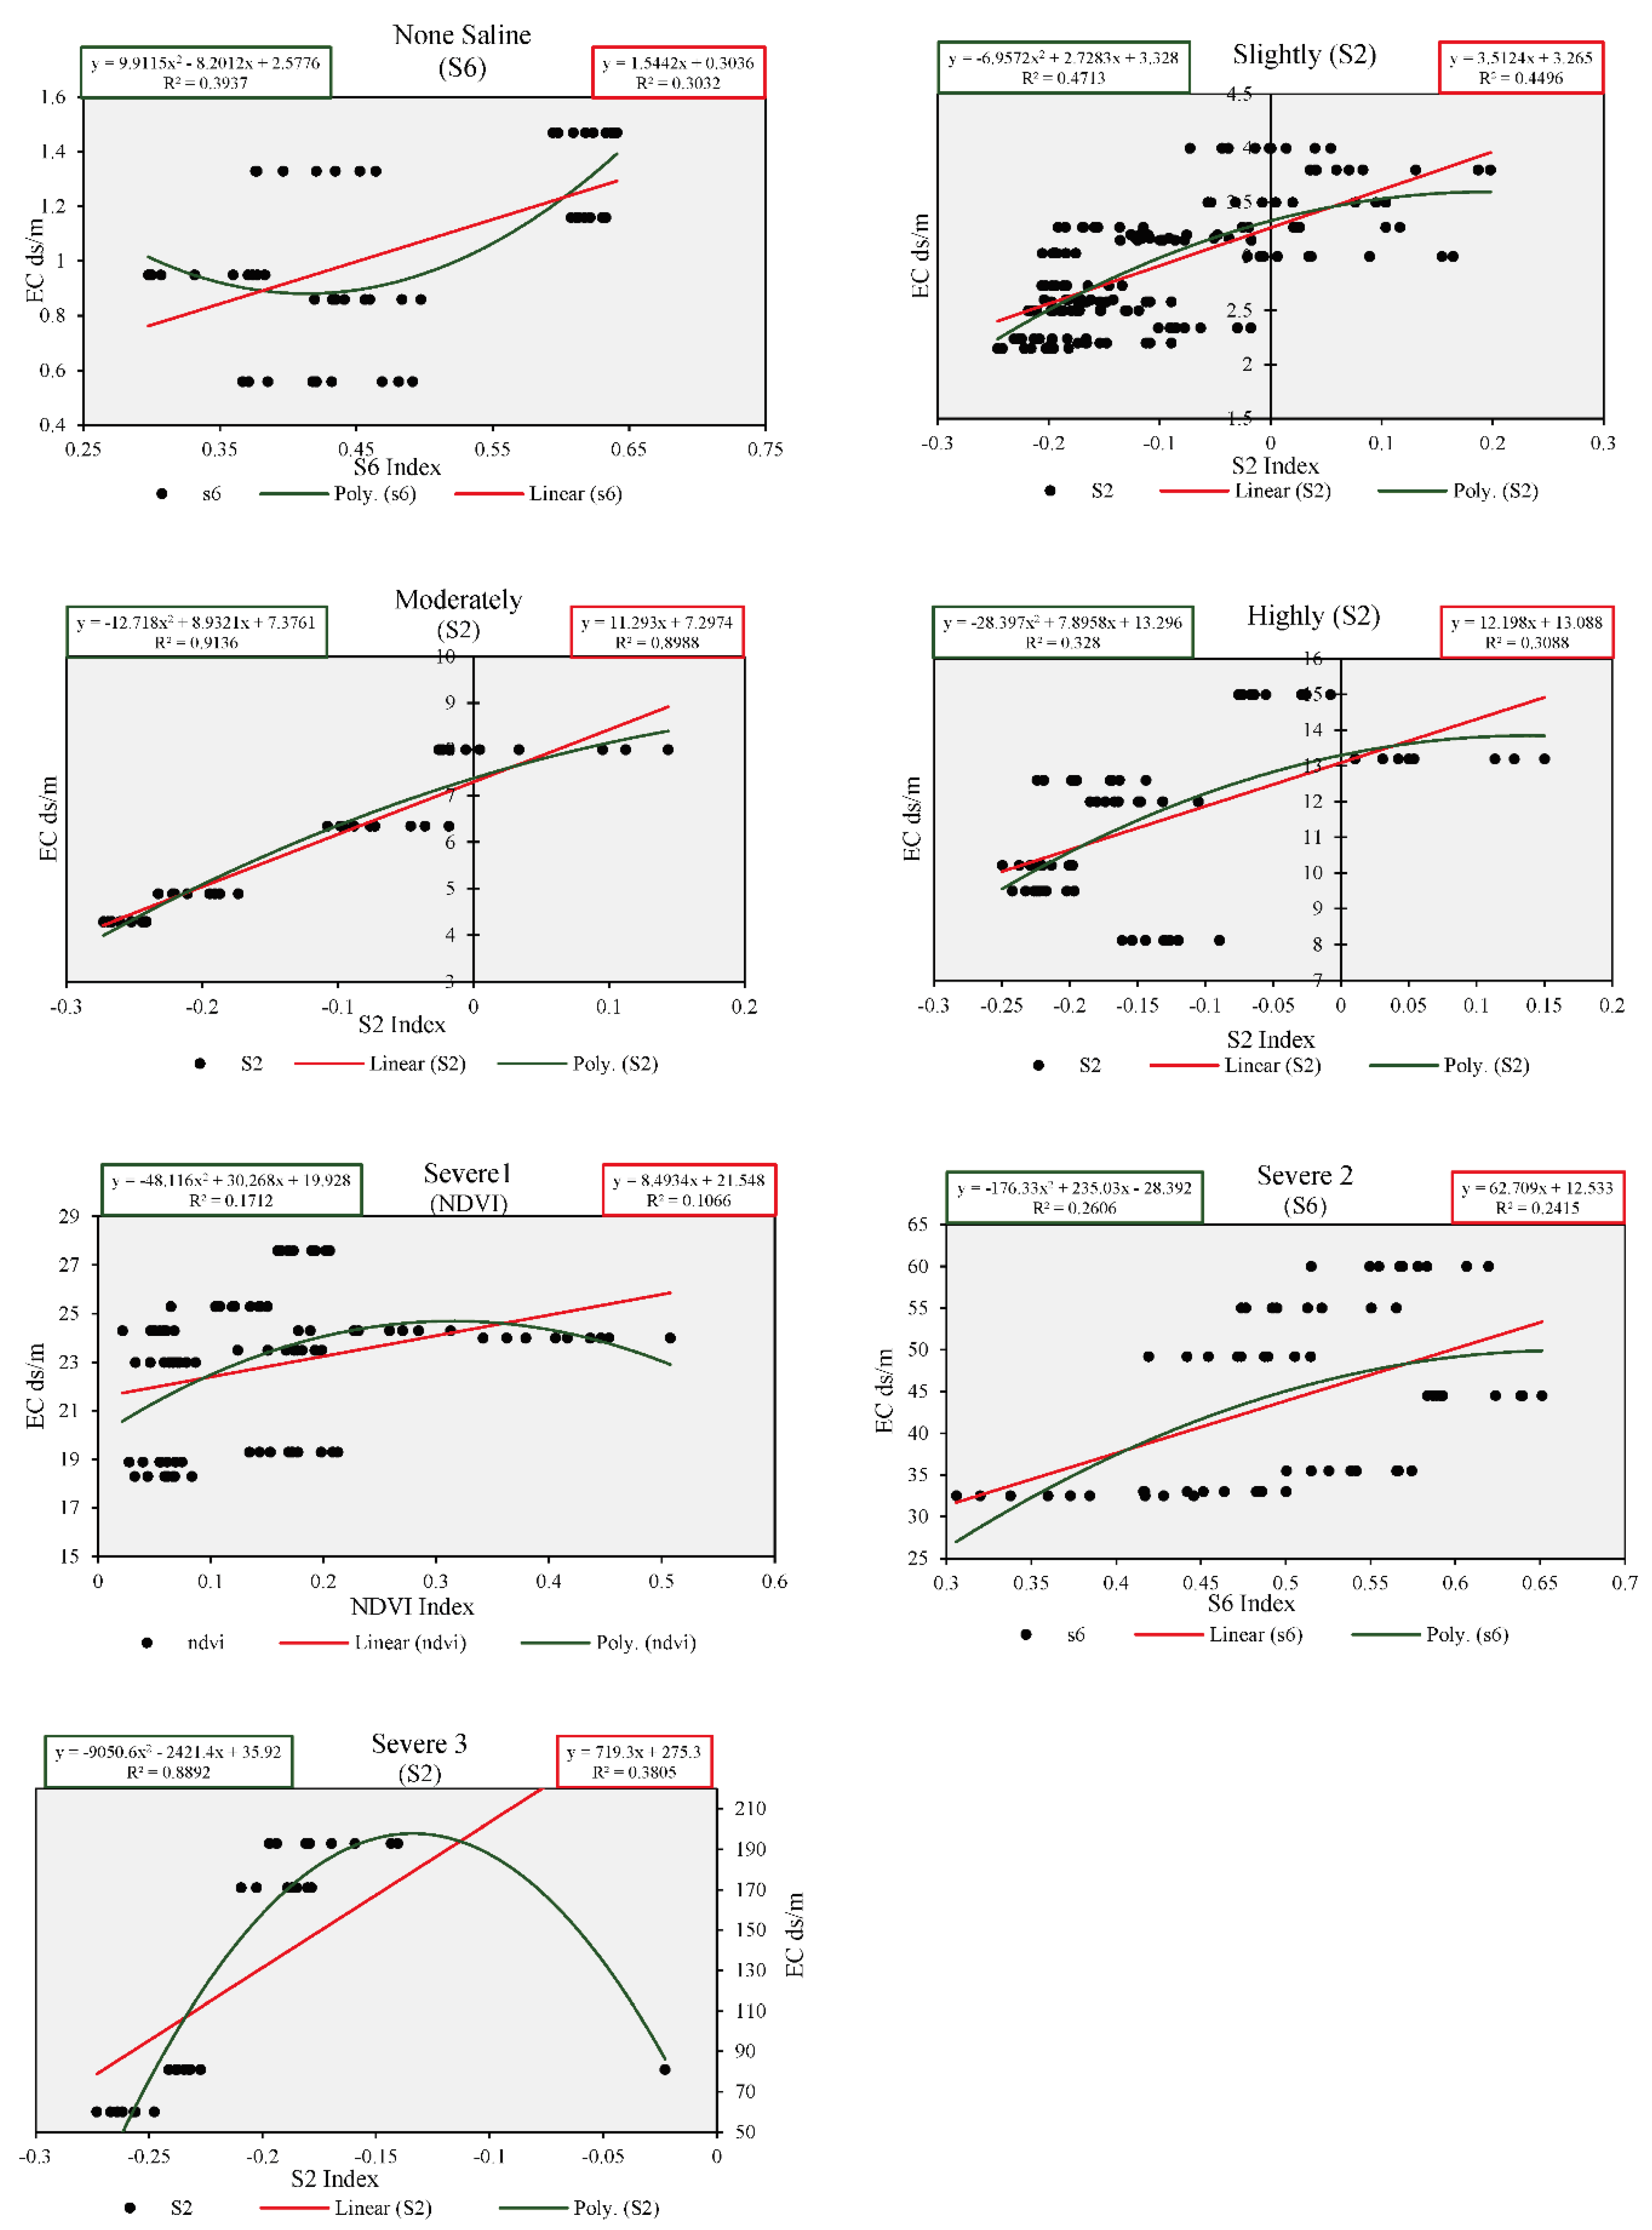
Figure 8.
Correlation and regression analysis of EC and salinity indices using the second approach.
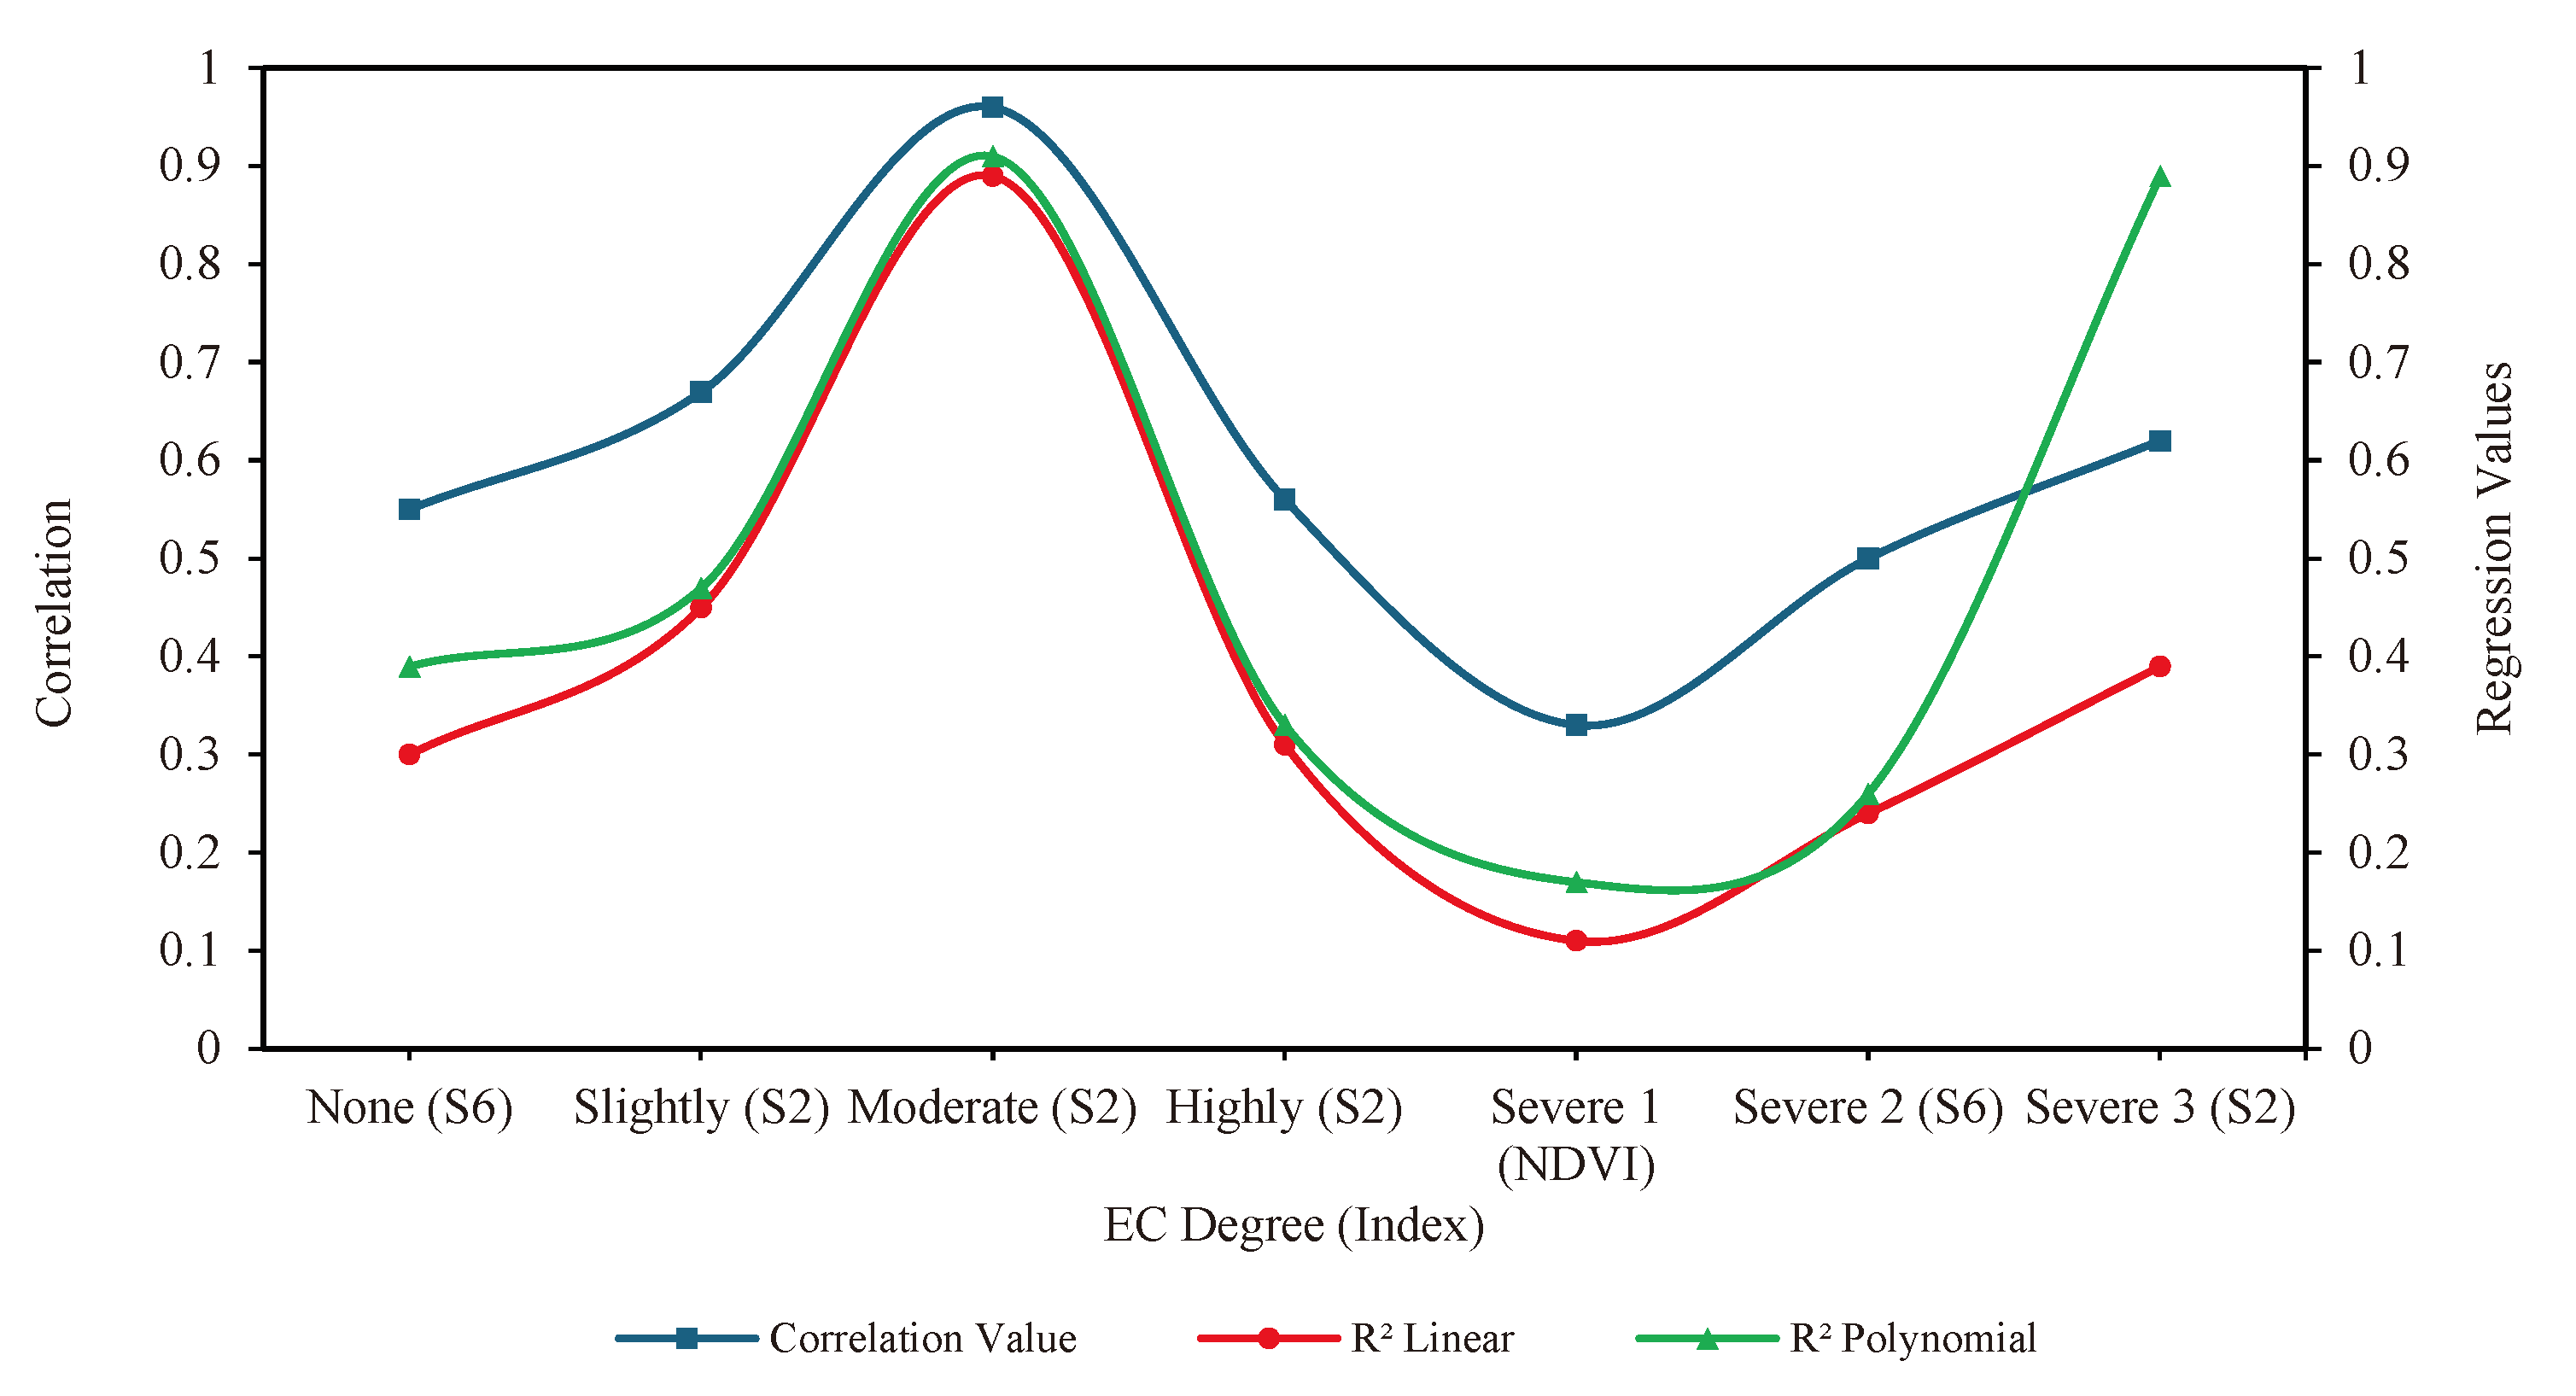
Figure 9.
Regression model equations with the highest correlation for EC and salinity indices using the third approach.
Figure 9.
Regression model equations with the highest correlation for EC and salinity indices using the third approach.
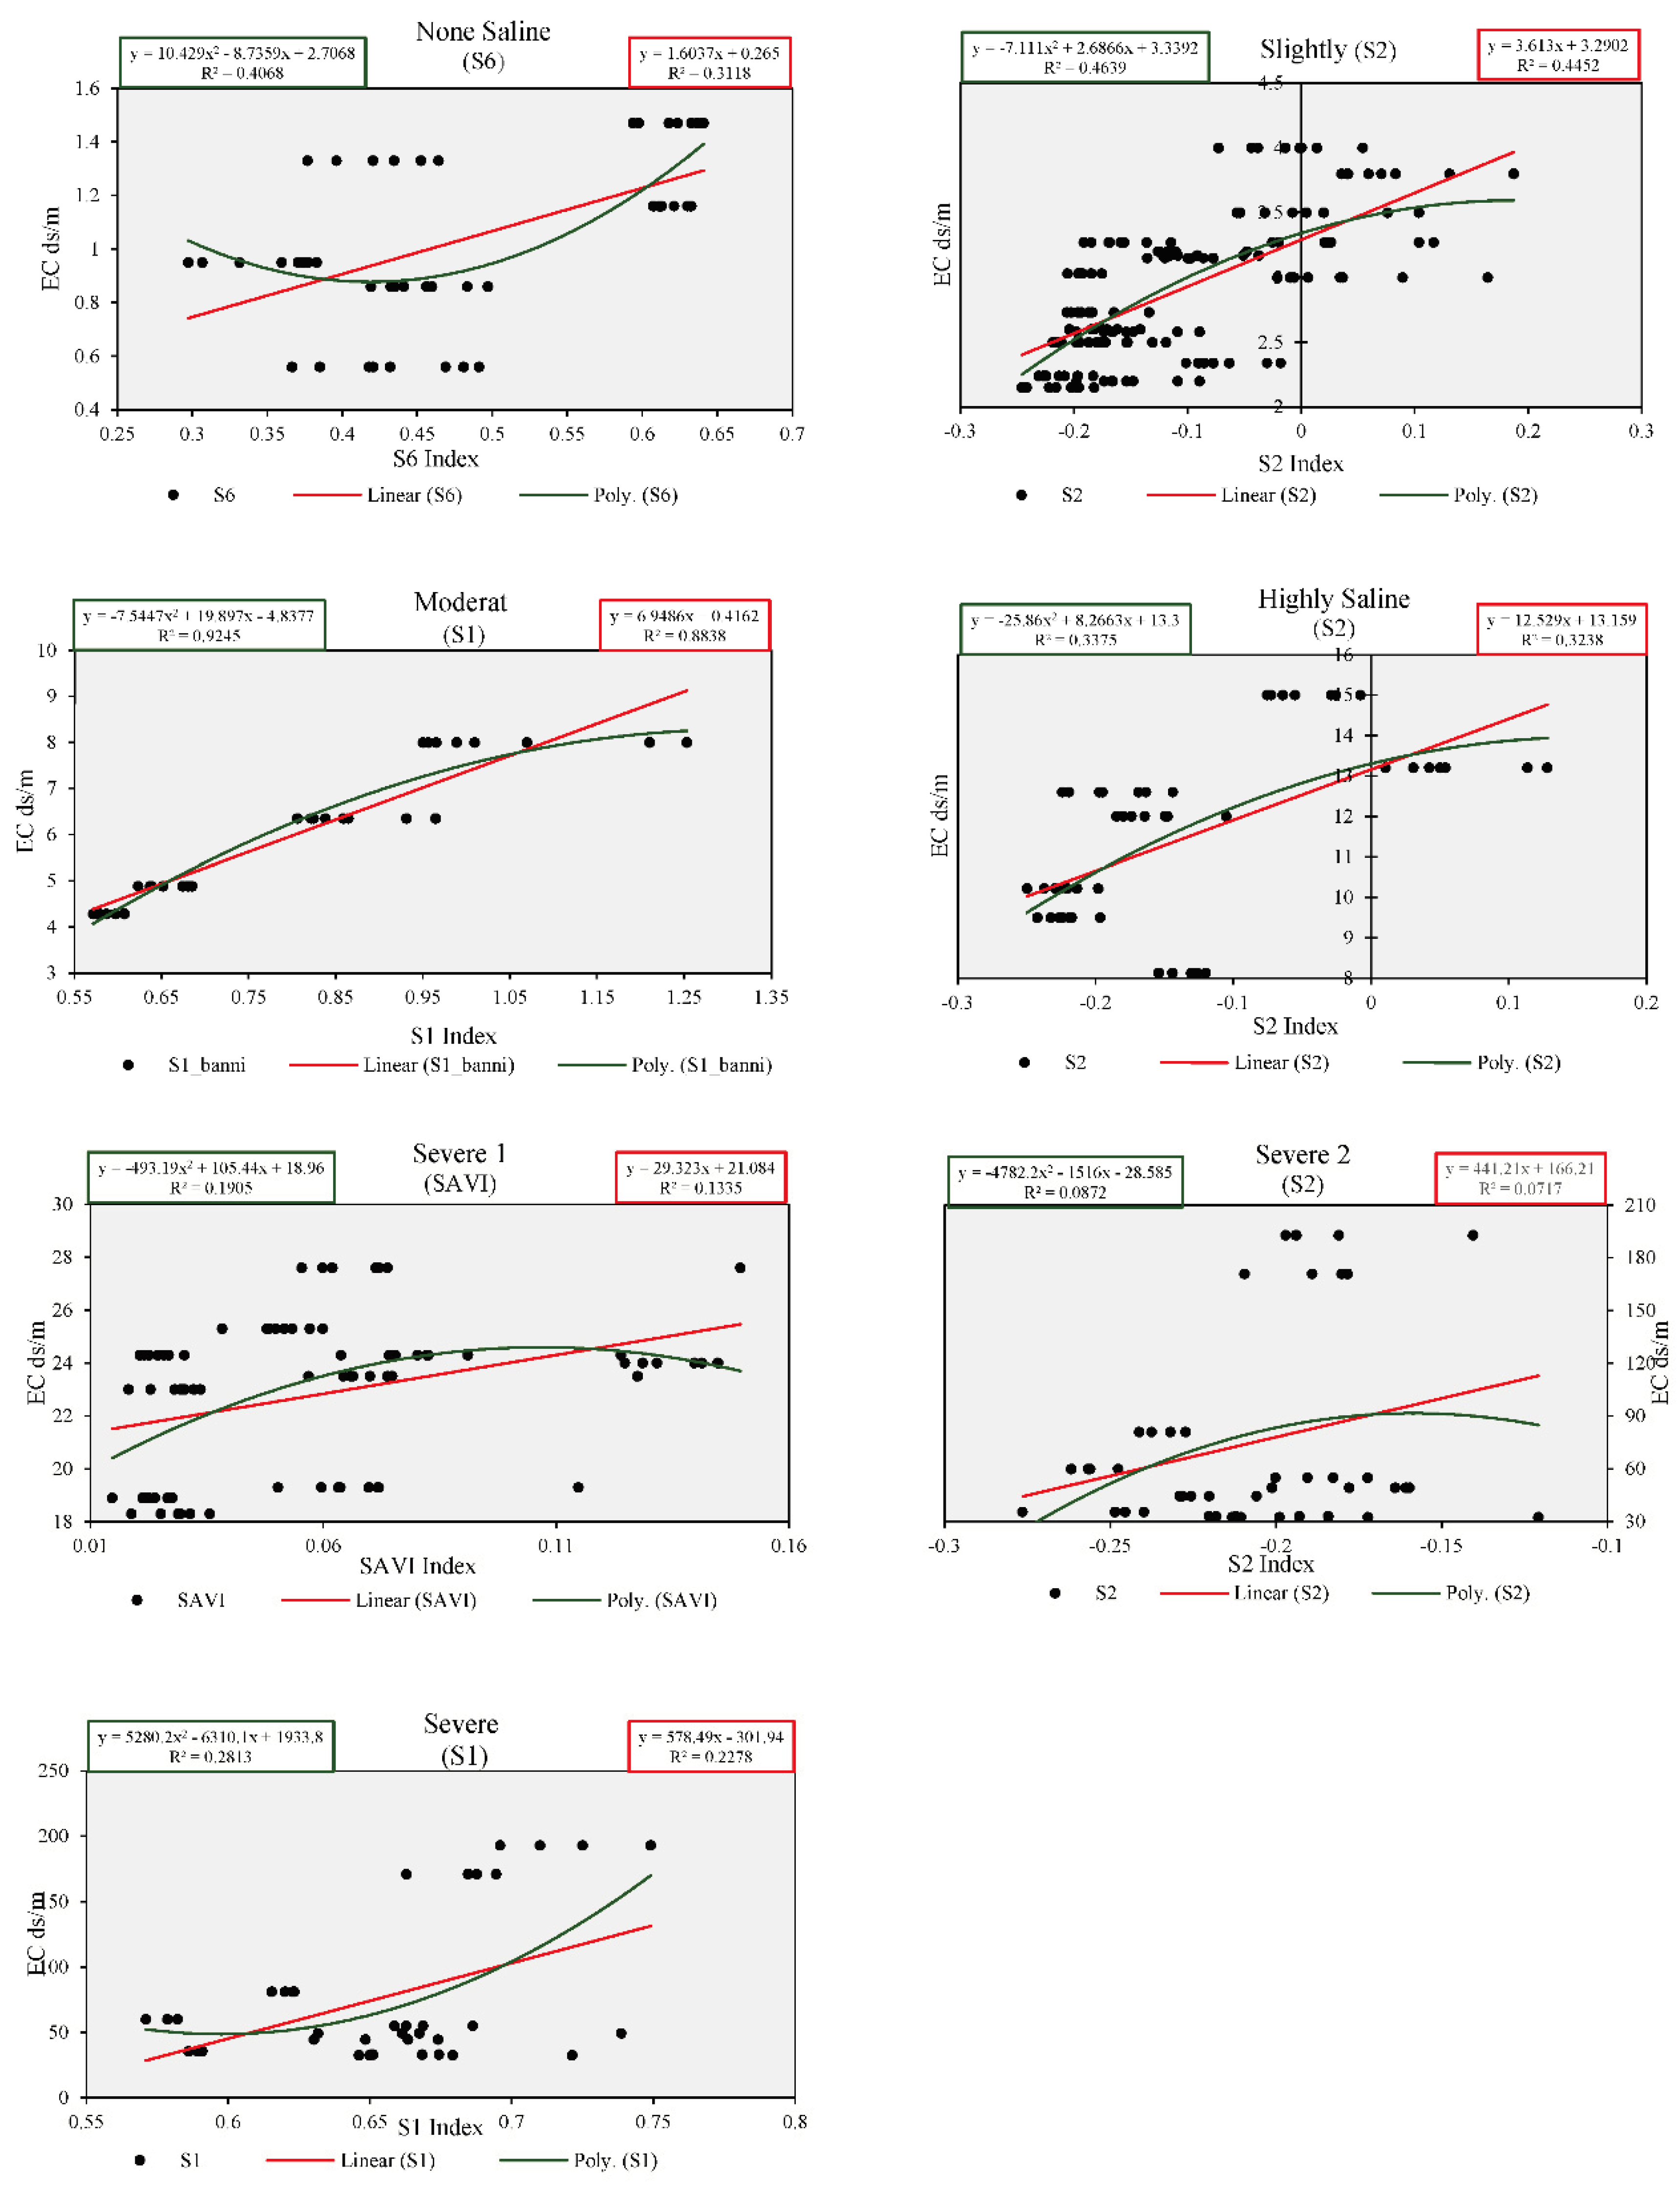
Figure 10.
Correlation and regression analysis of EC and salinity indices using the third approach.

Figure 11.
Regression model equations with the highest correlation for EC and salinity indices using the fourth approach.
Figure 11.
Regression model equations with the highest correlation for EC and salinity indices using the fourth approach.
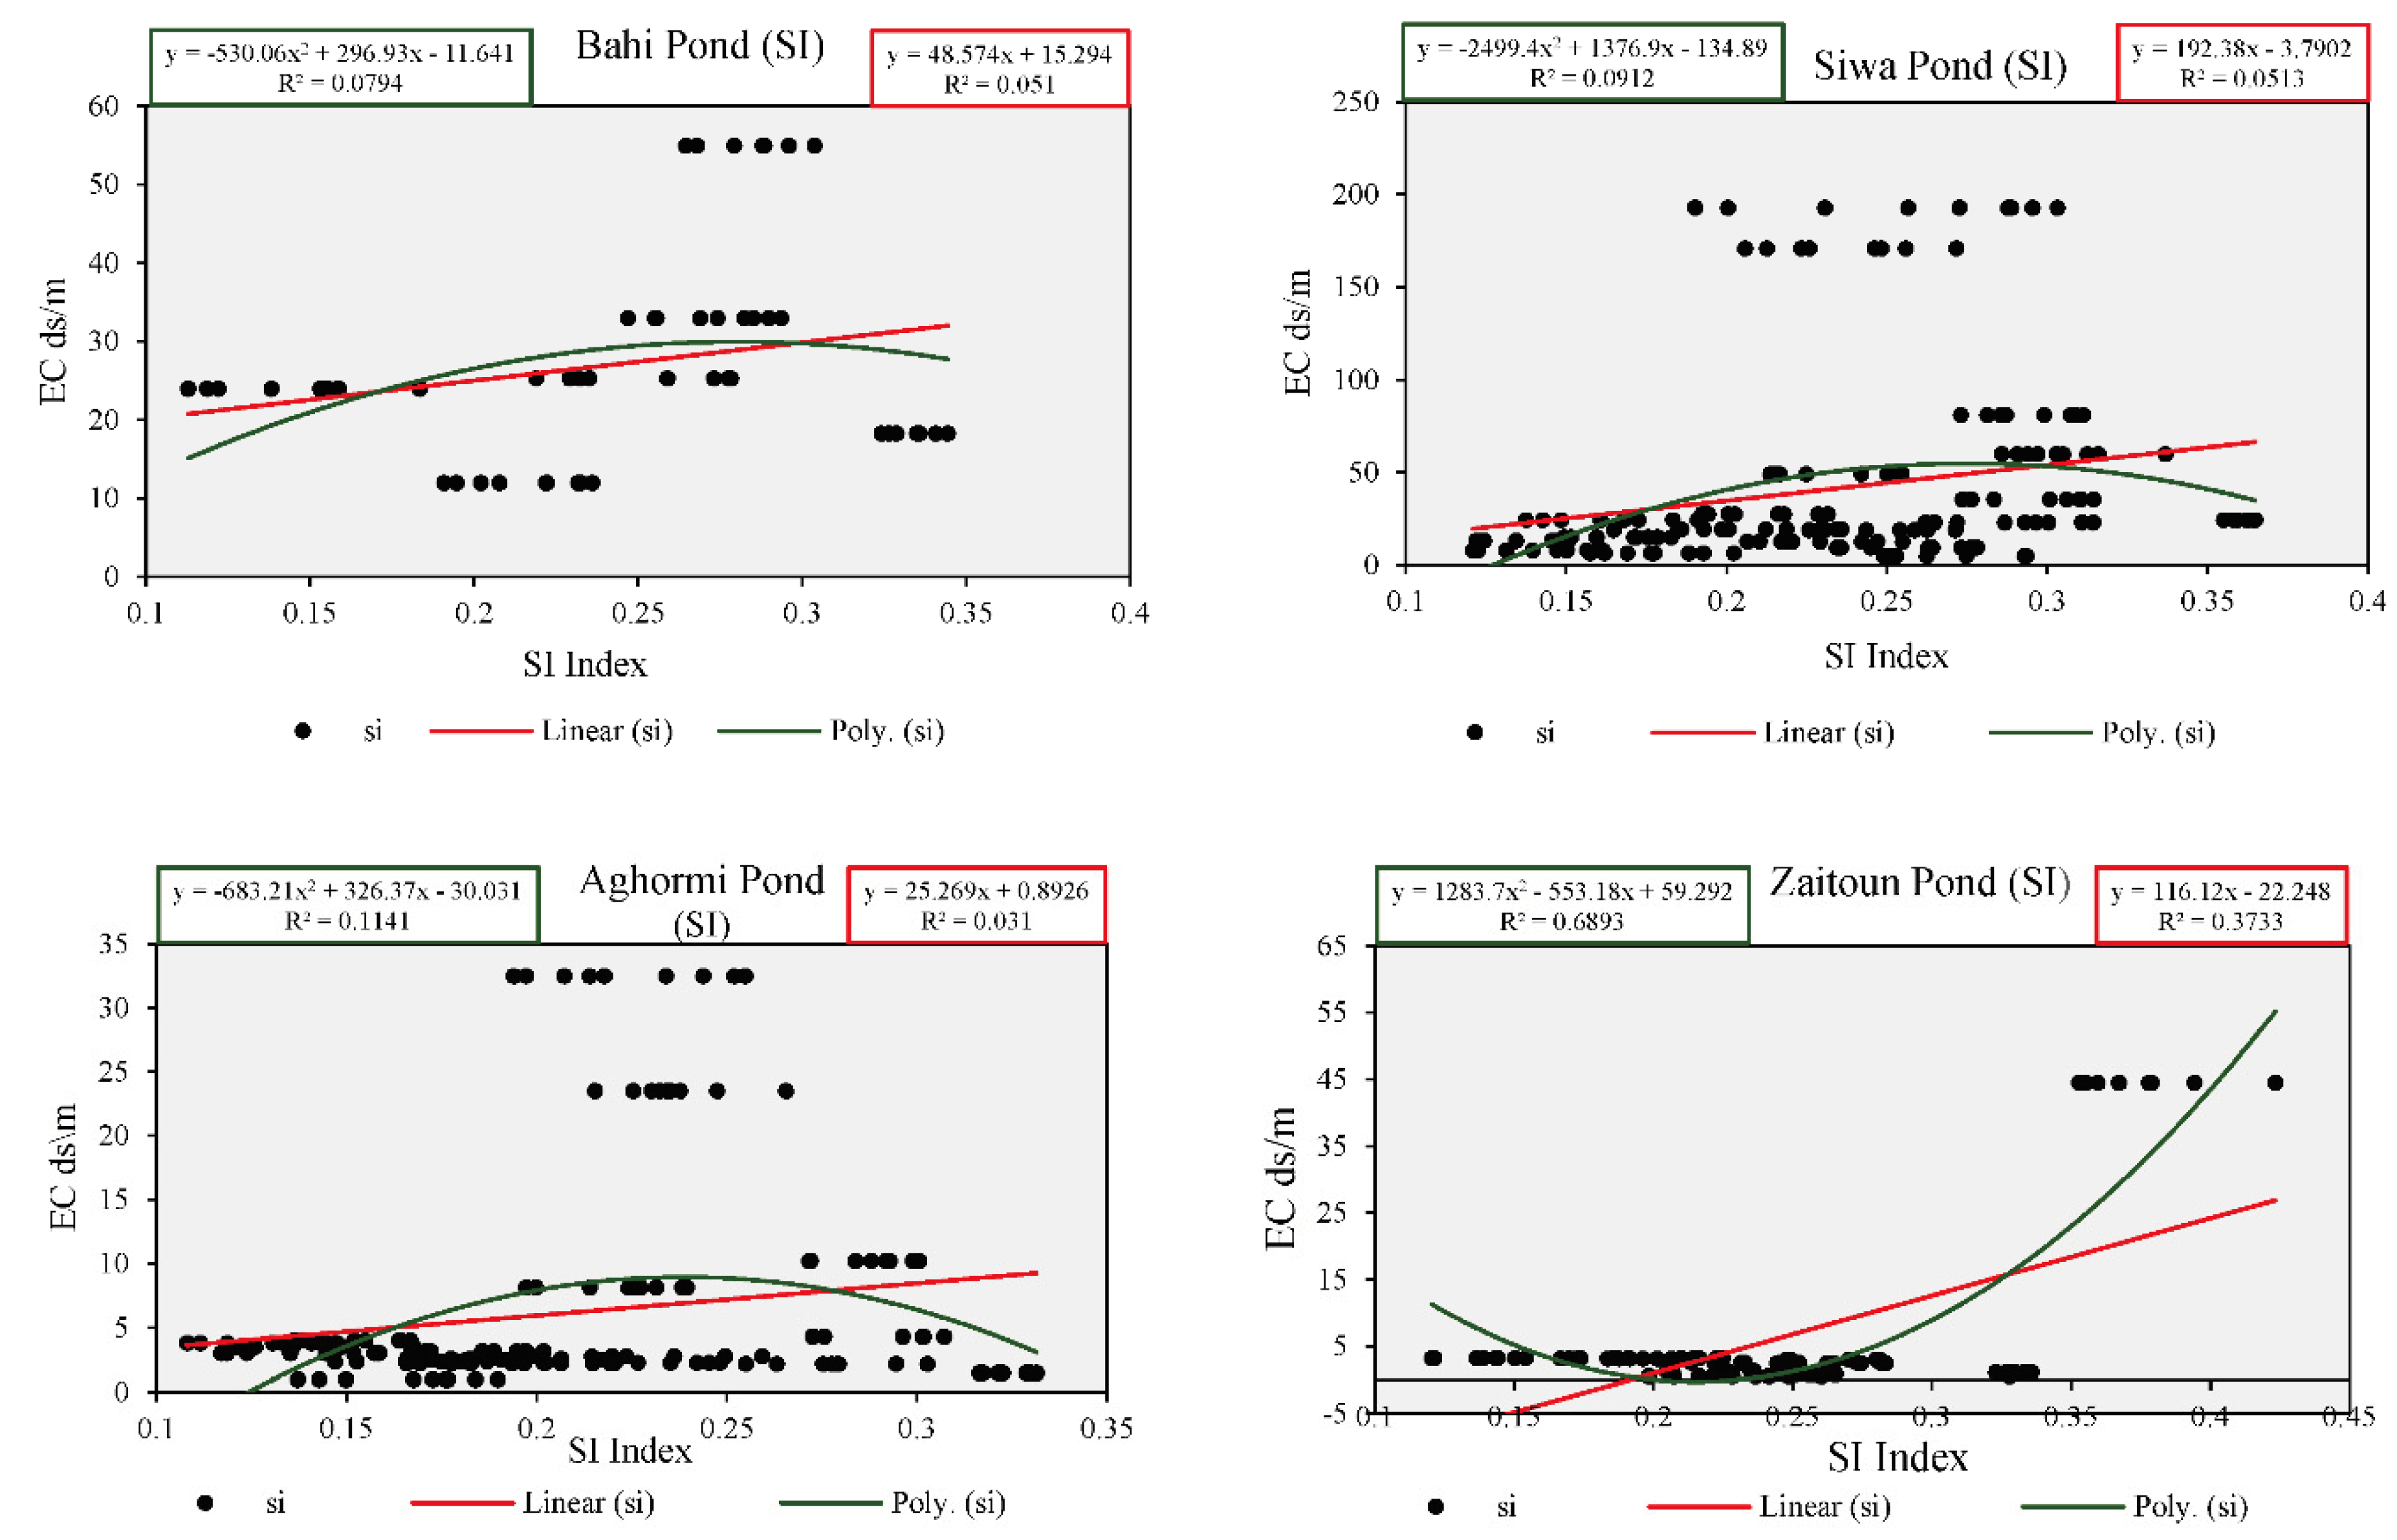
Figure 12.
Correlation and regression analysis of EC and salinity indices using the fourth approach.
Figure 12.
Correlation and regression analysis of EC and salinity indices using the fourth approach.
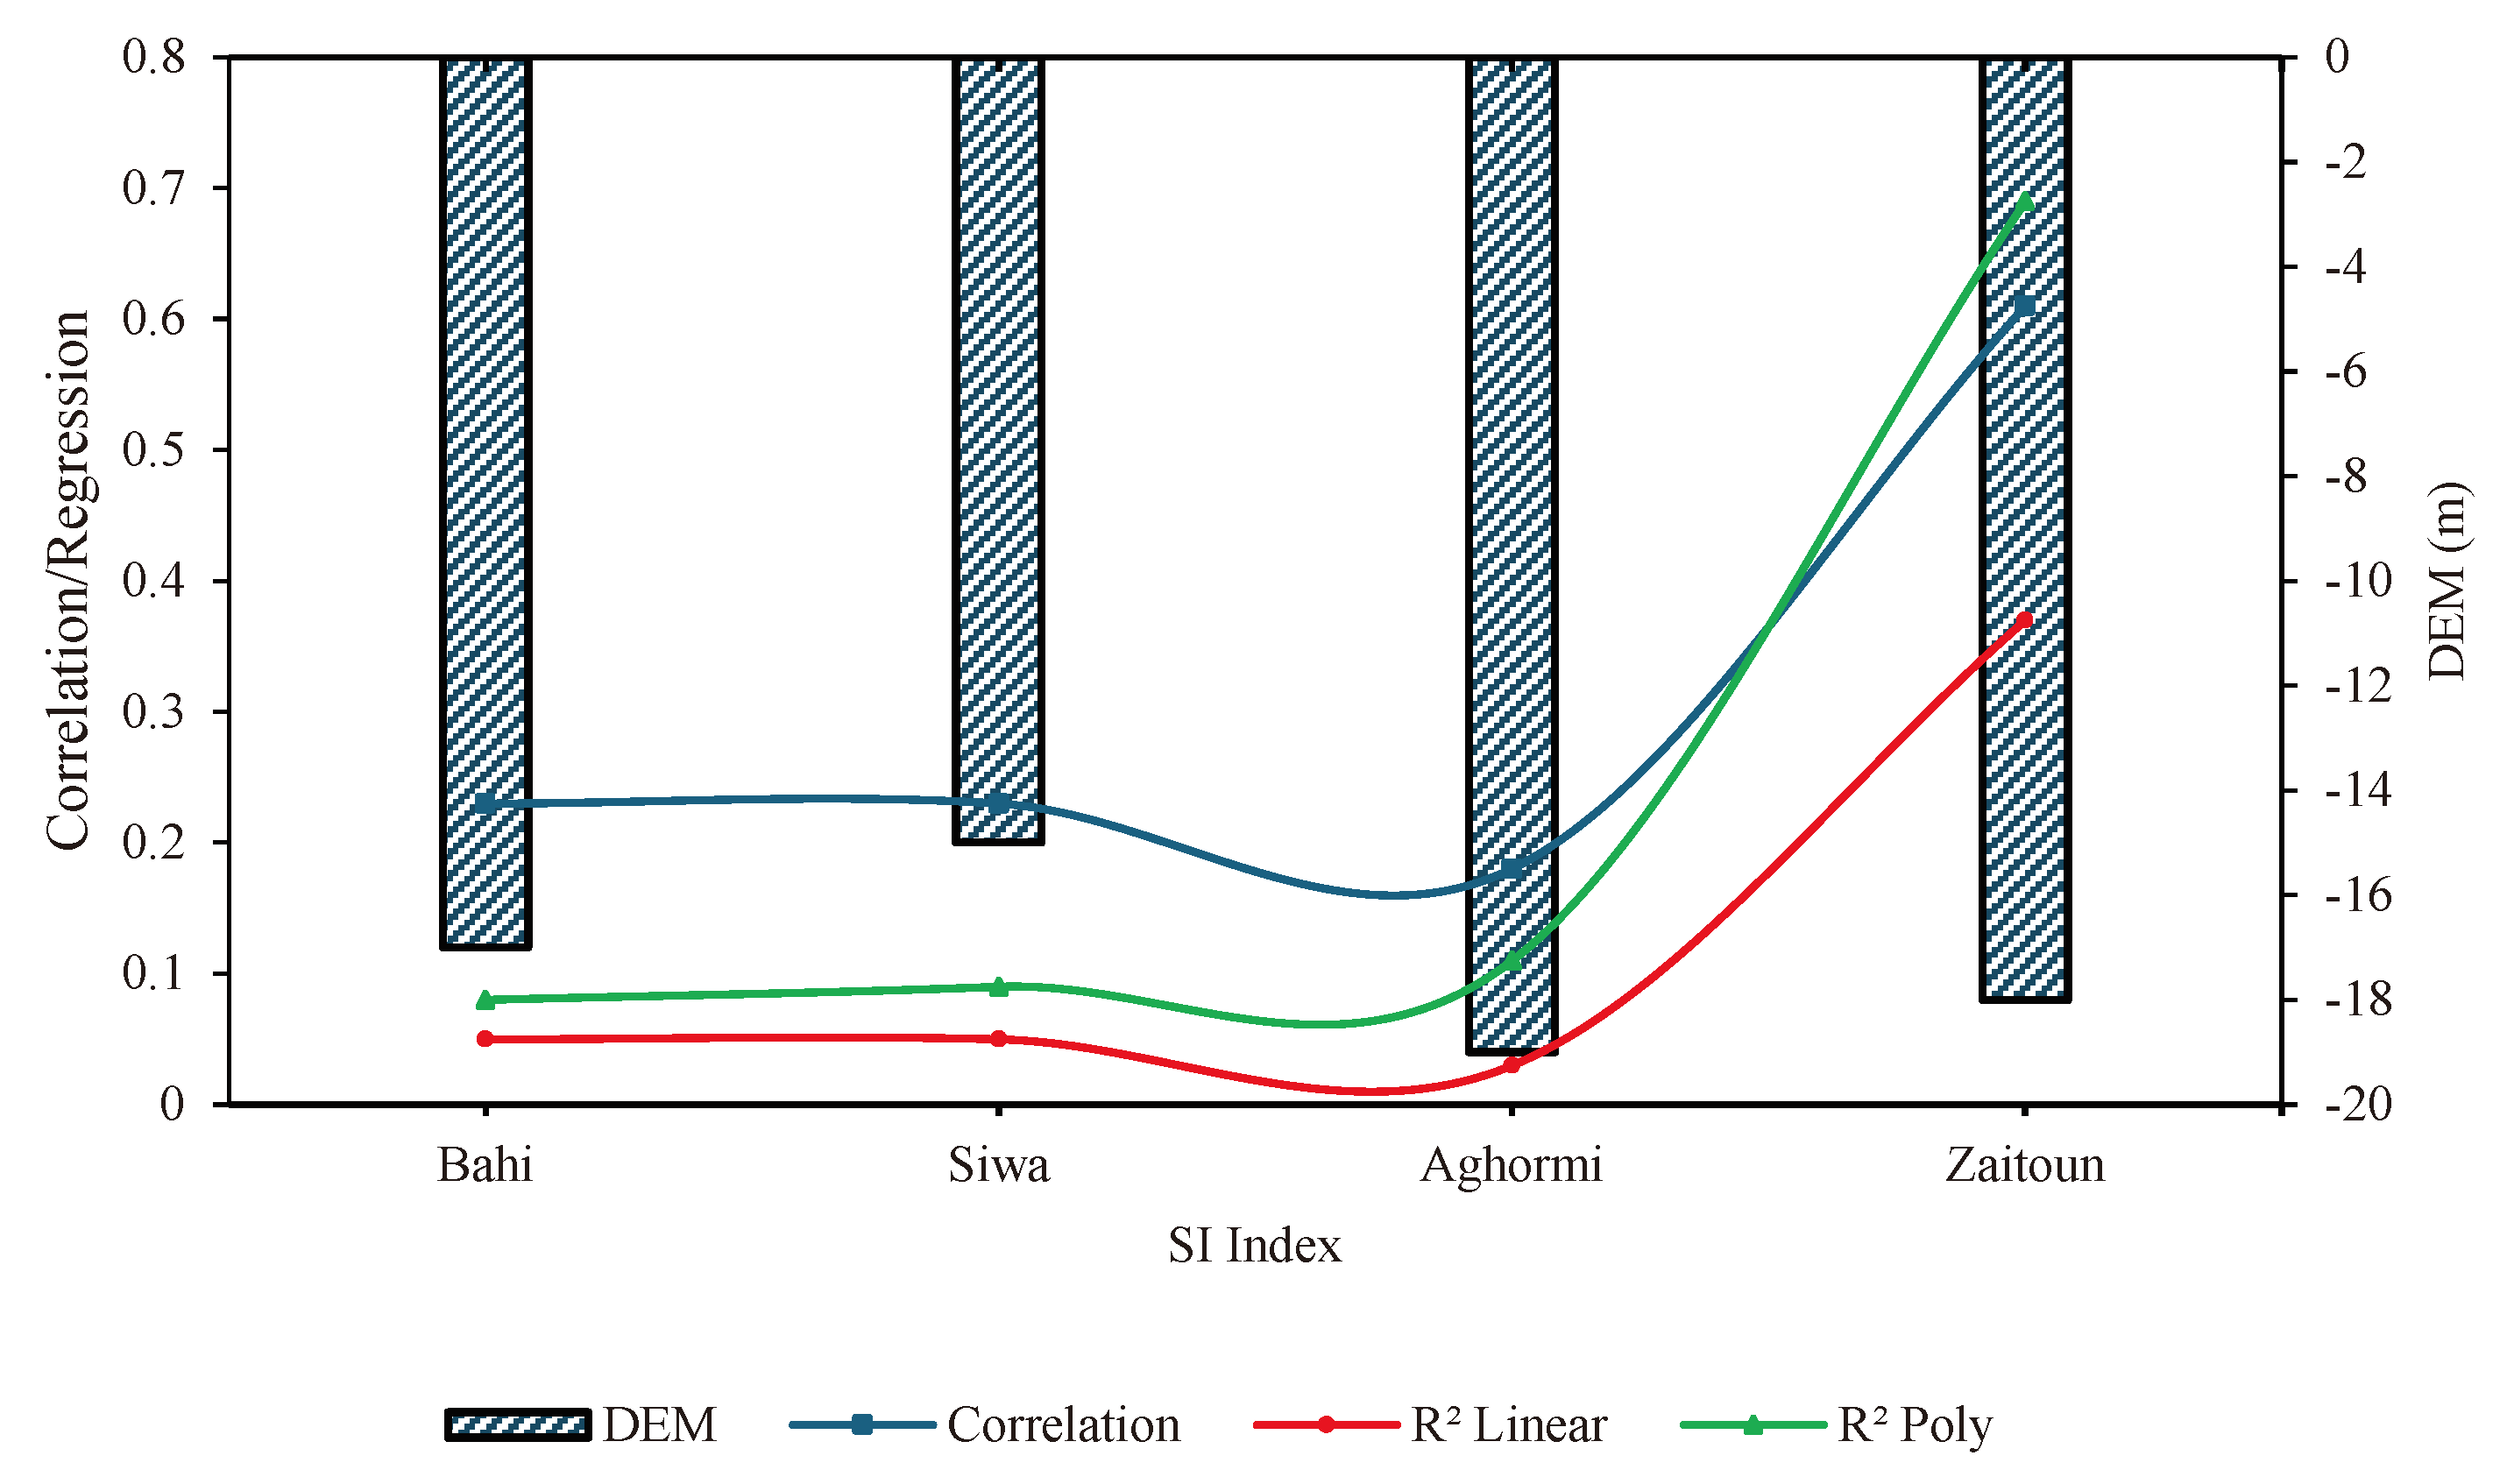
Figure 13.
Spatial distribution map of EC values for collected samples across the land cover.
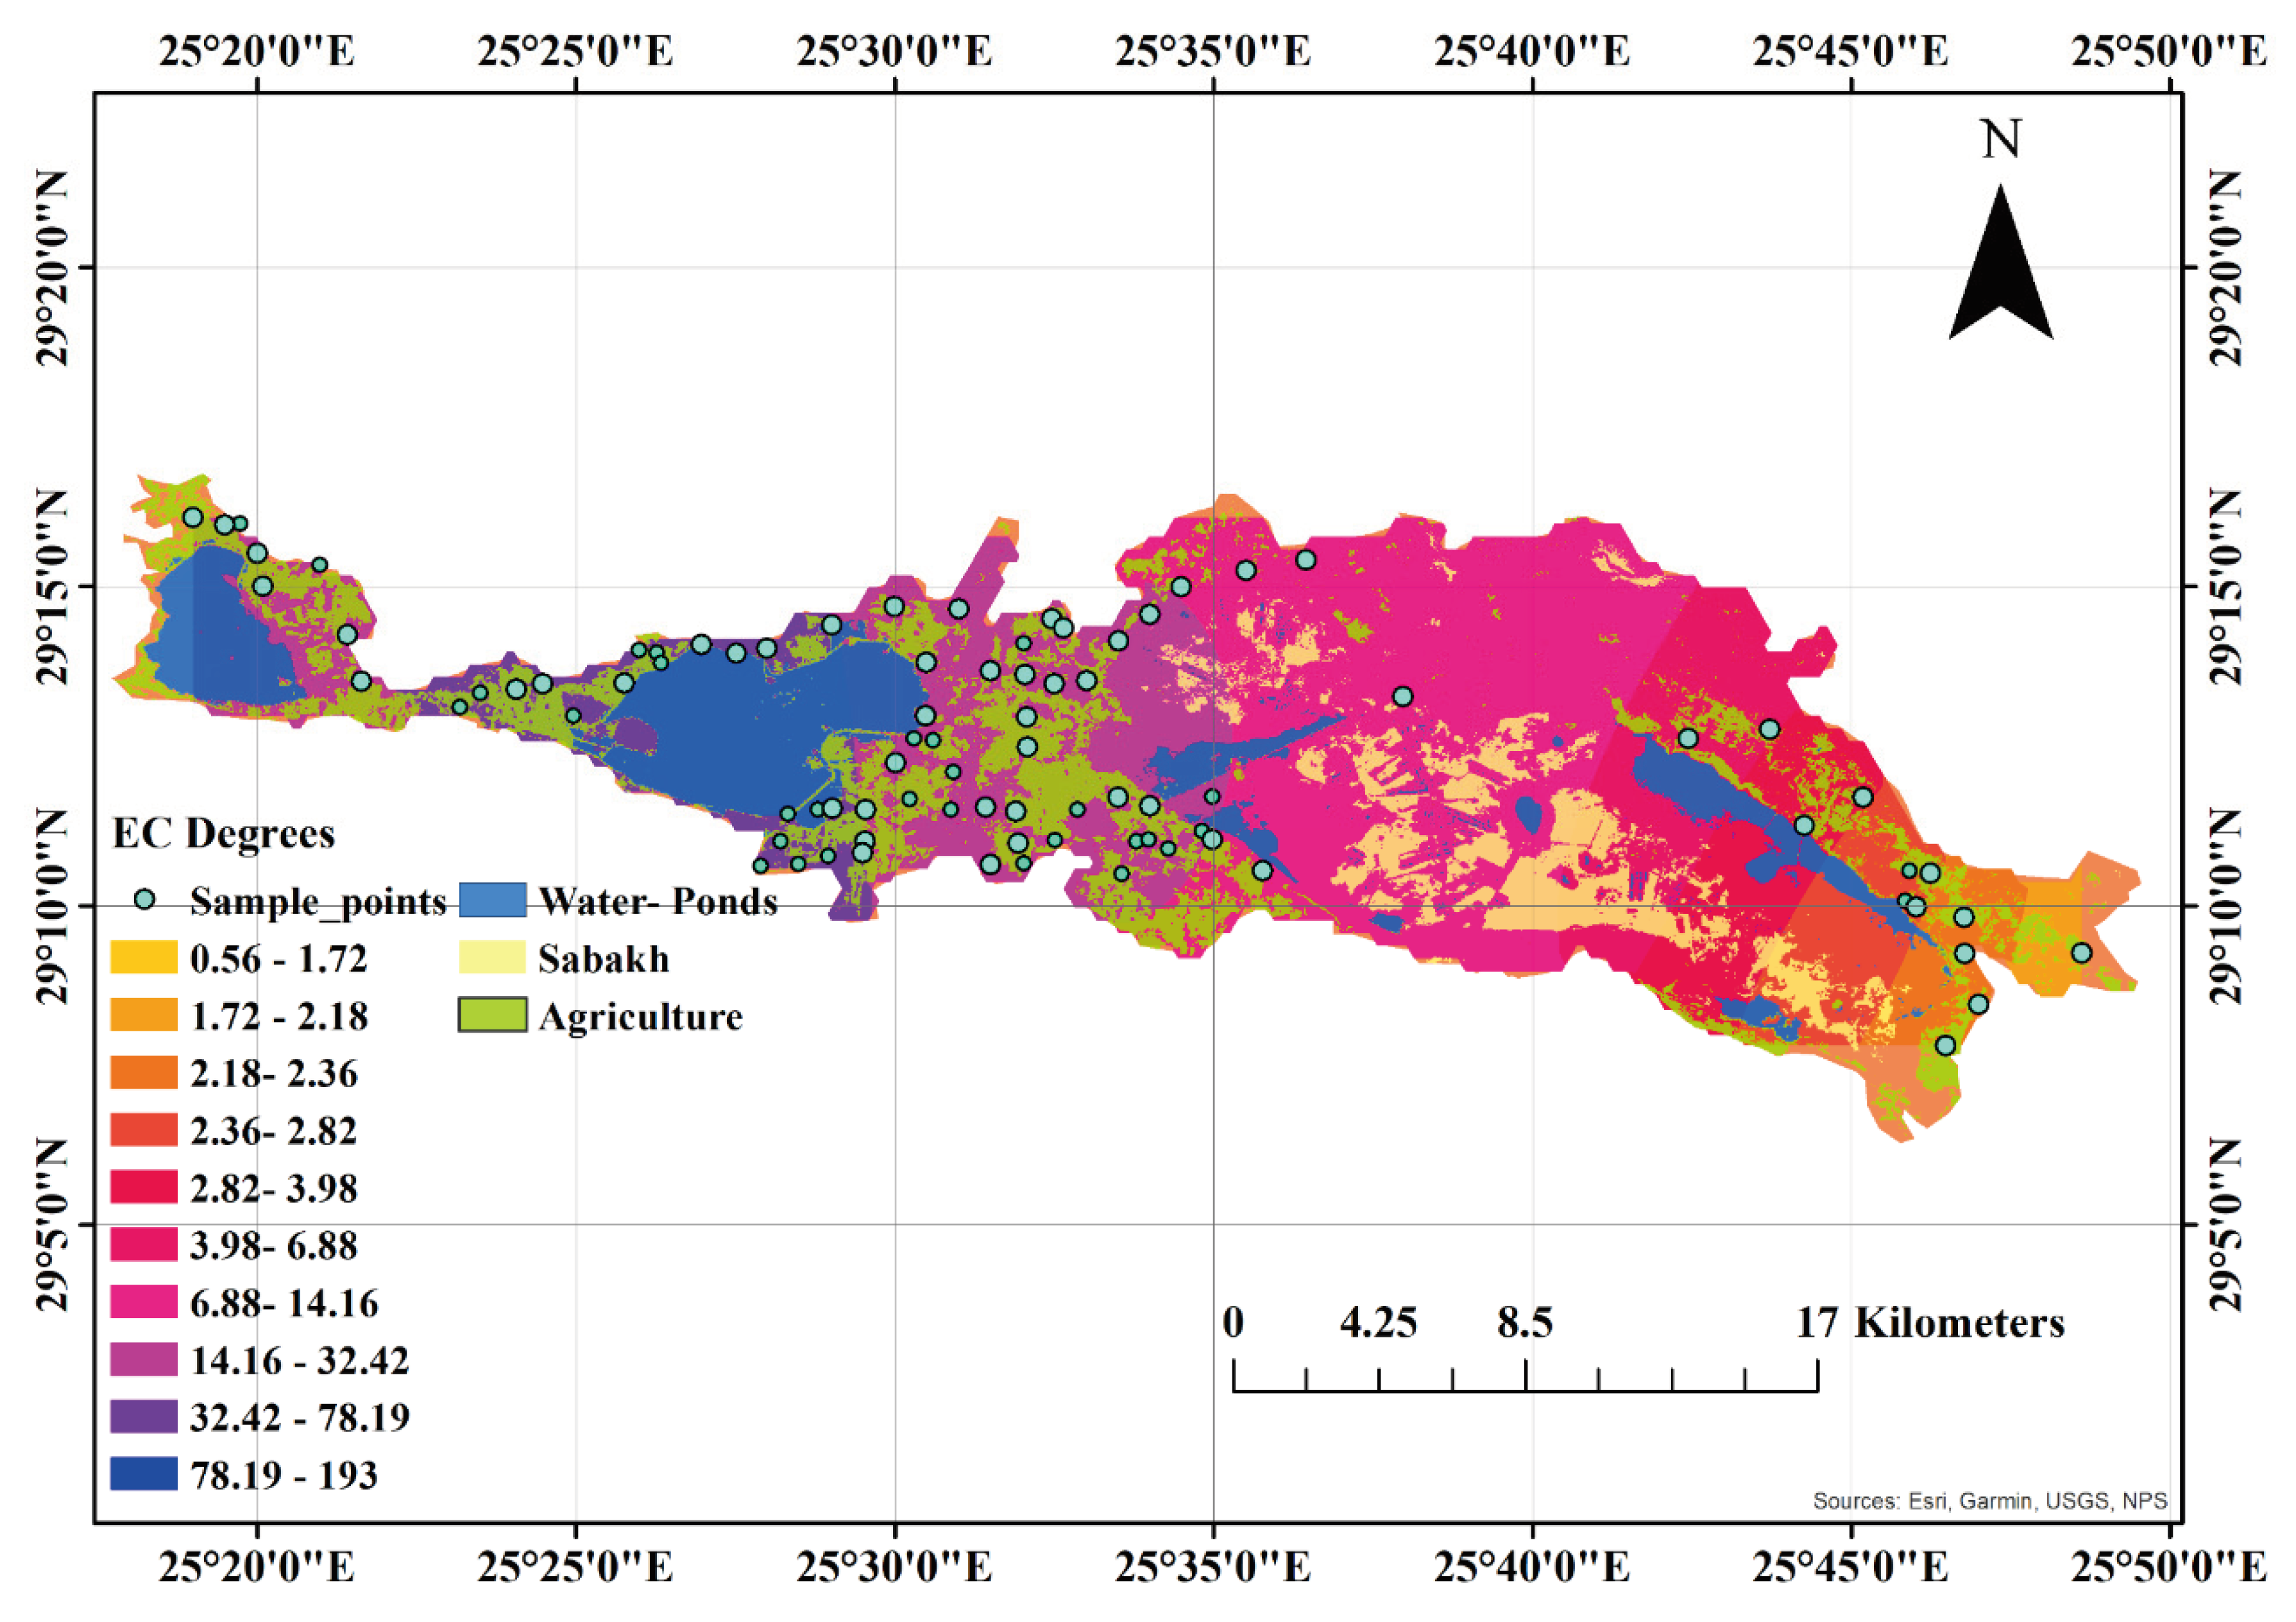
Figure 14.
Percentage of EC samples by land cover type in 2020.
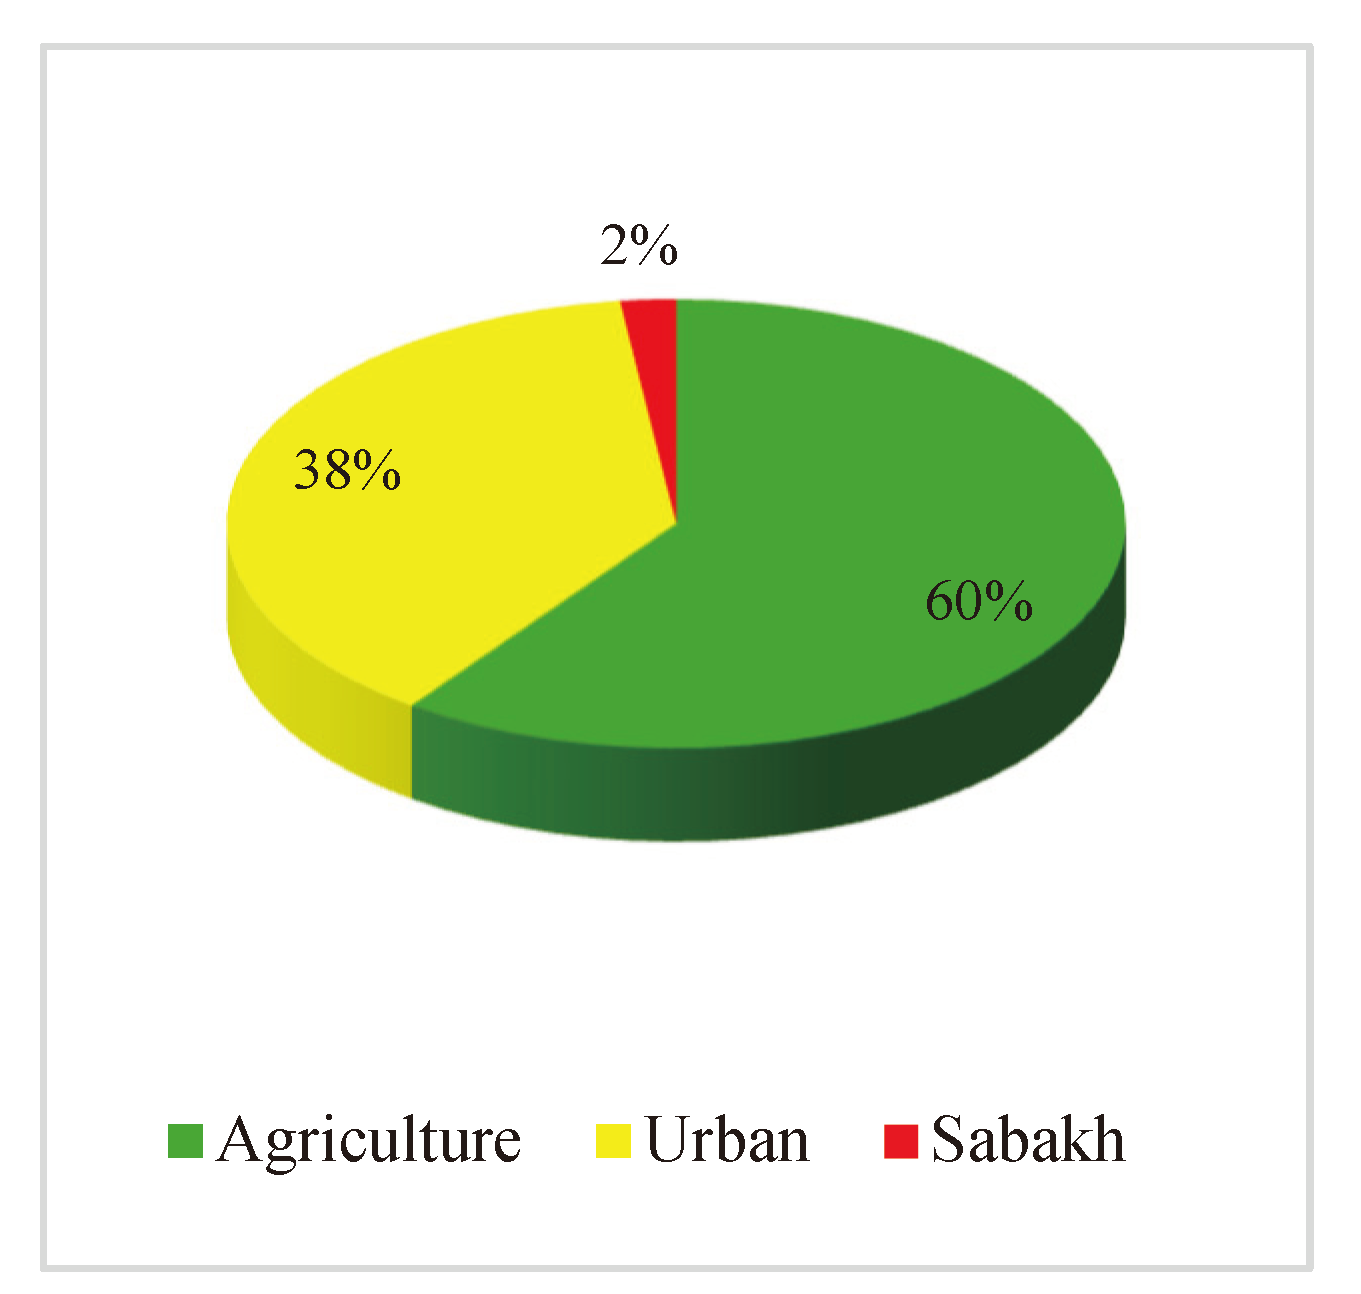
Figure 15.
Land cover change detection using Landsat 8 and 5 images in 2020 and 2003, respectively.
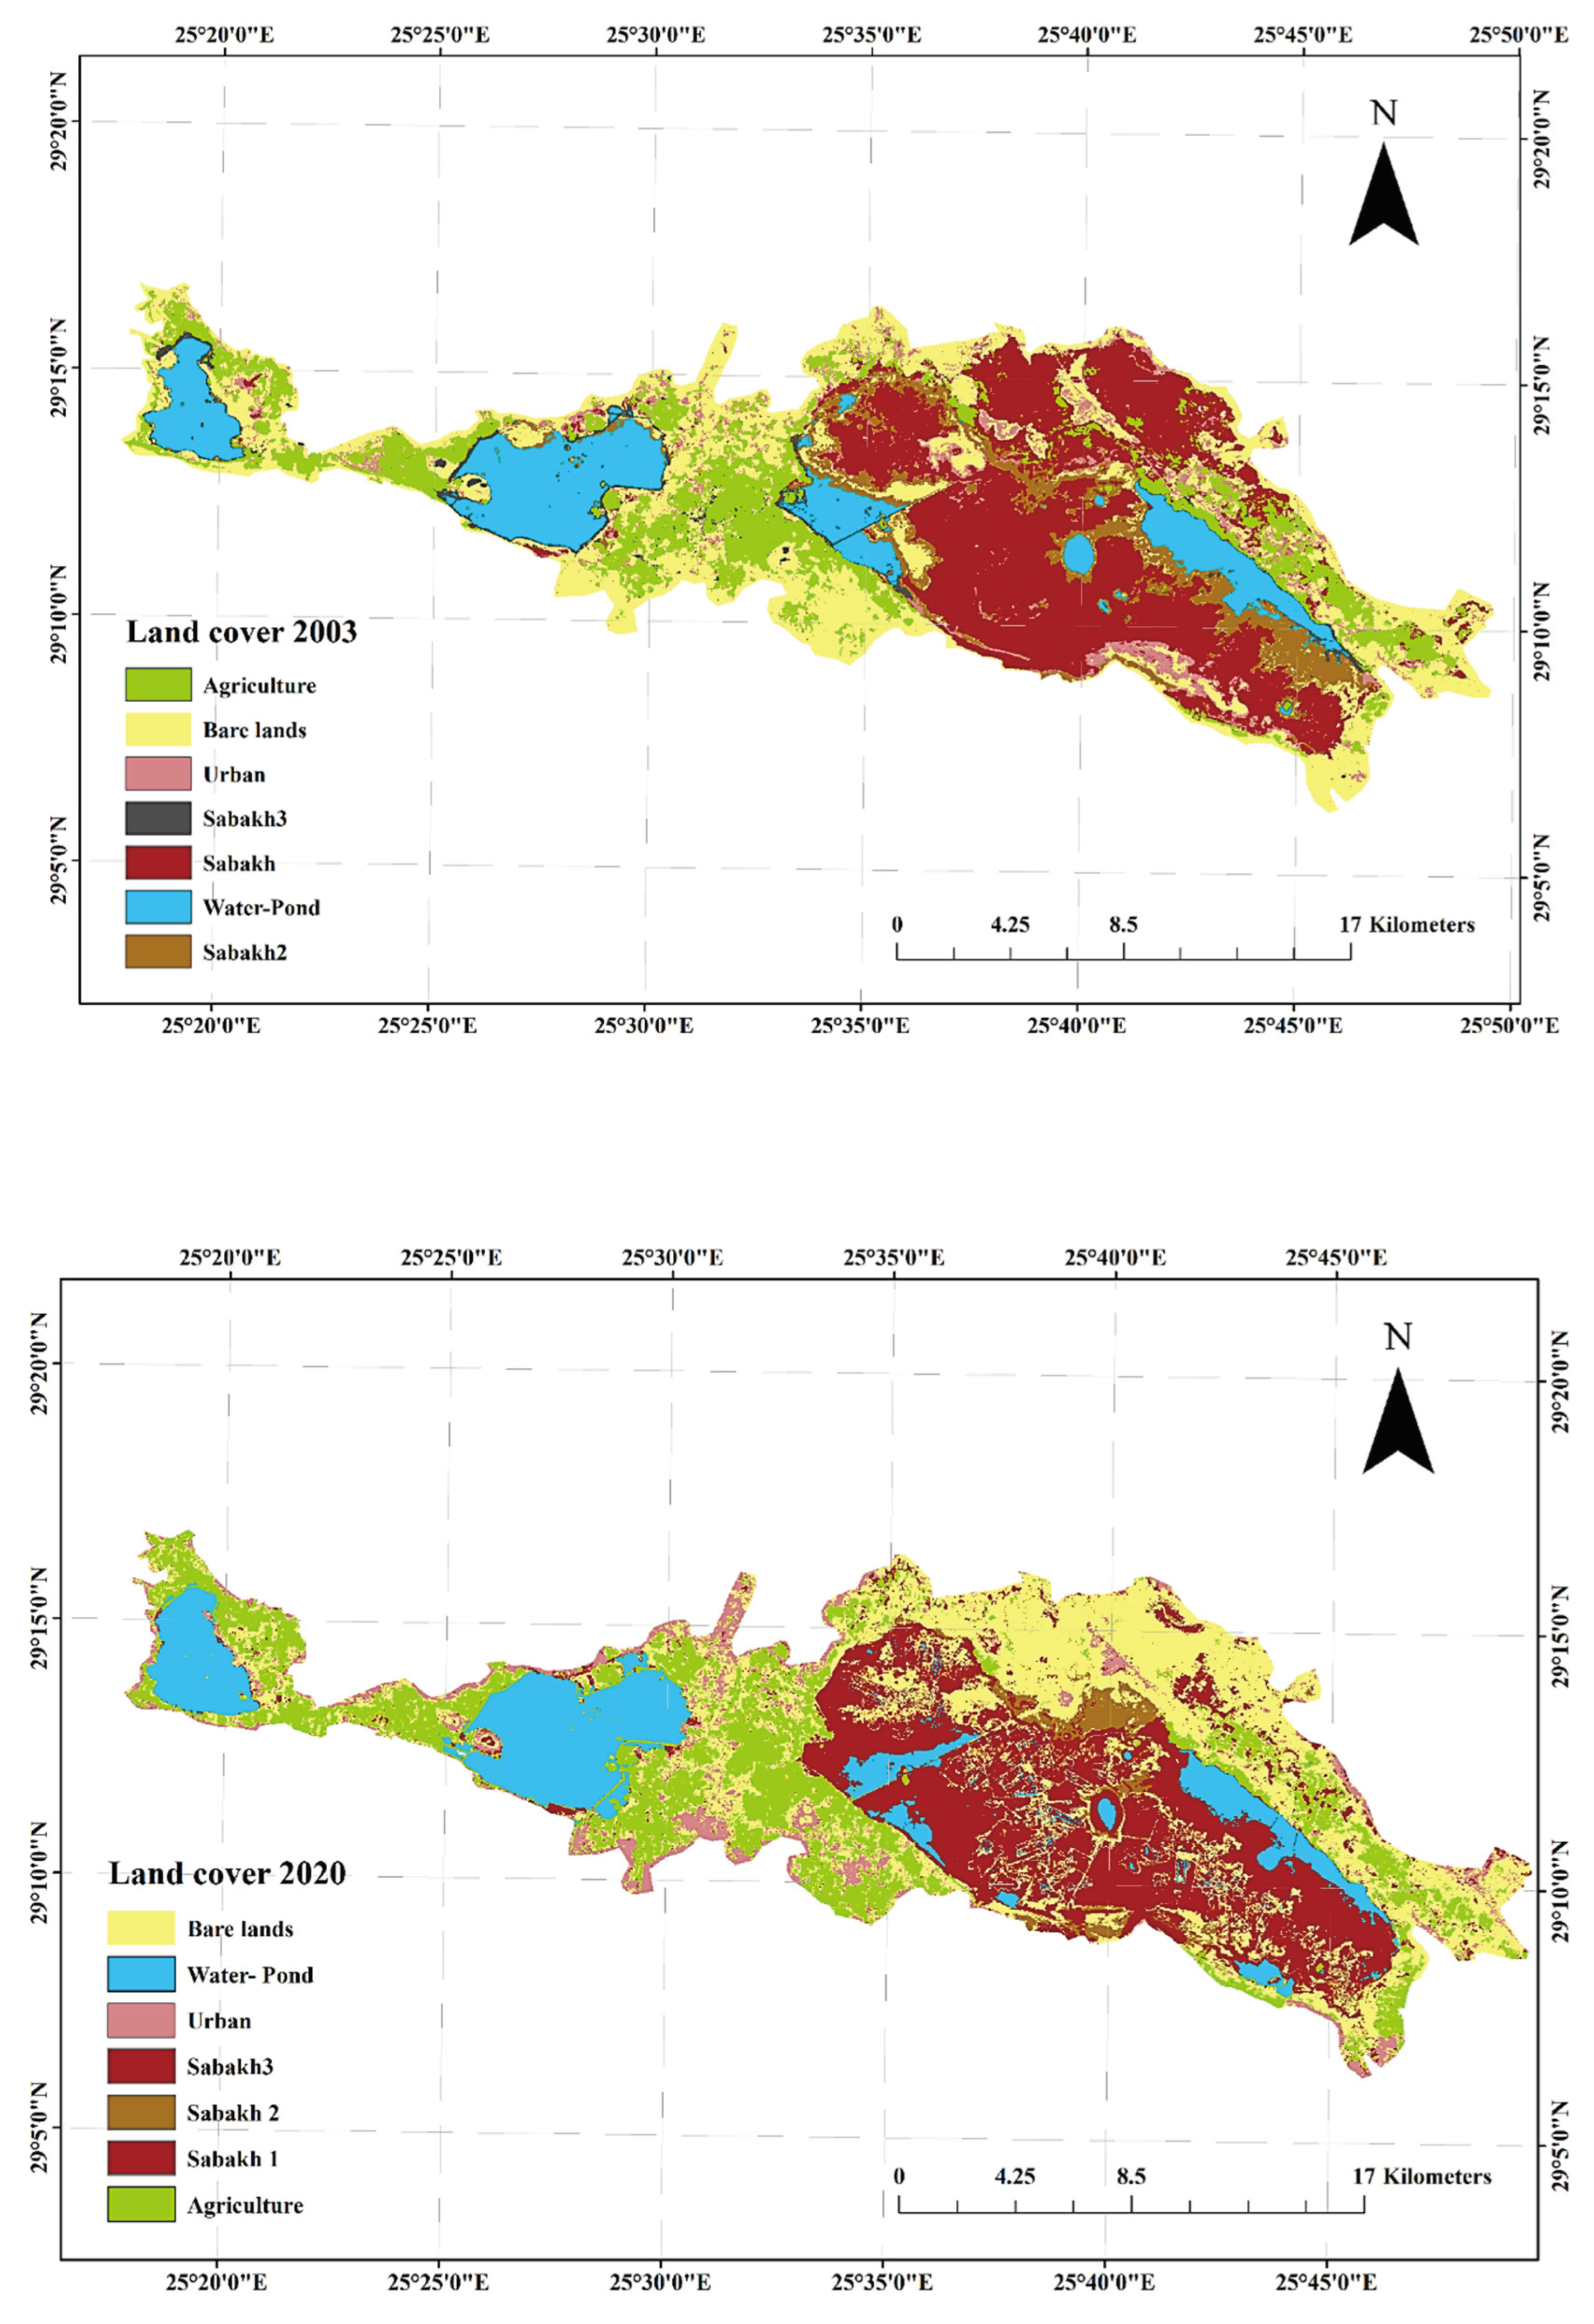
Figure 16.
Change detection area analysis from 2003 to 2020 in Siwa oasis.
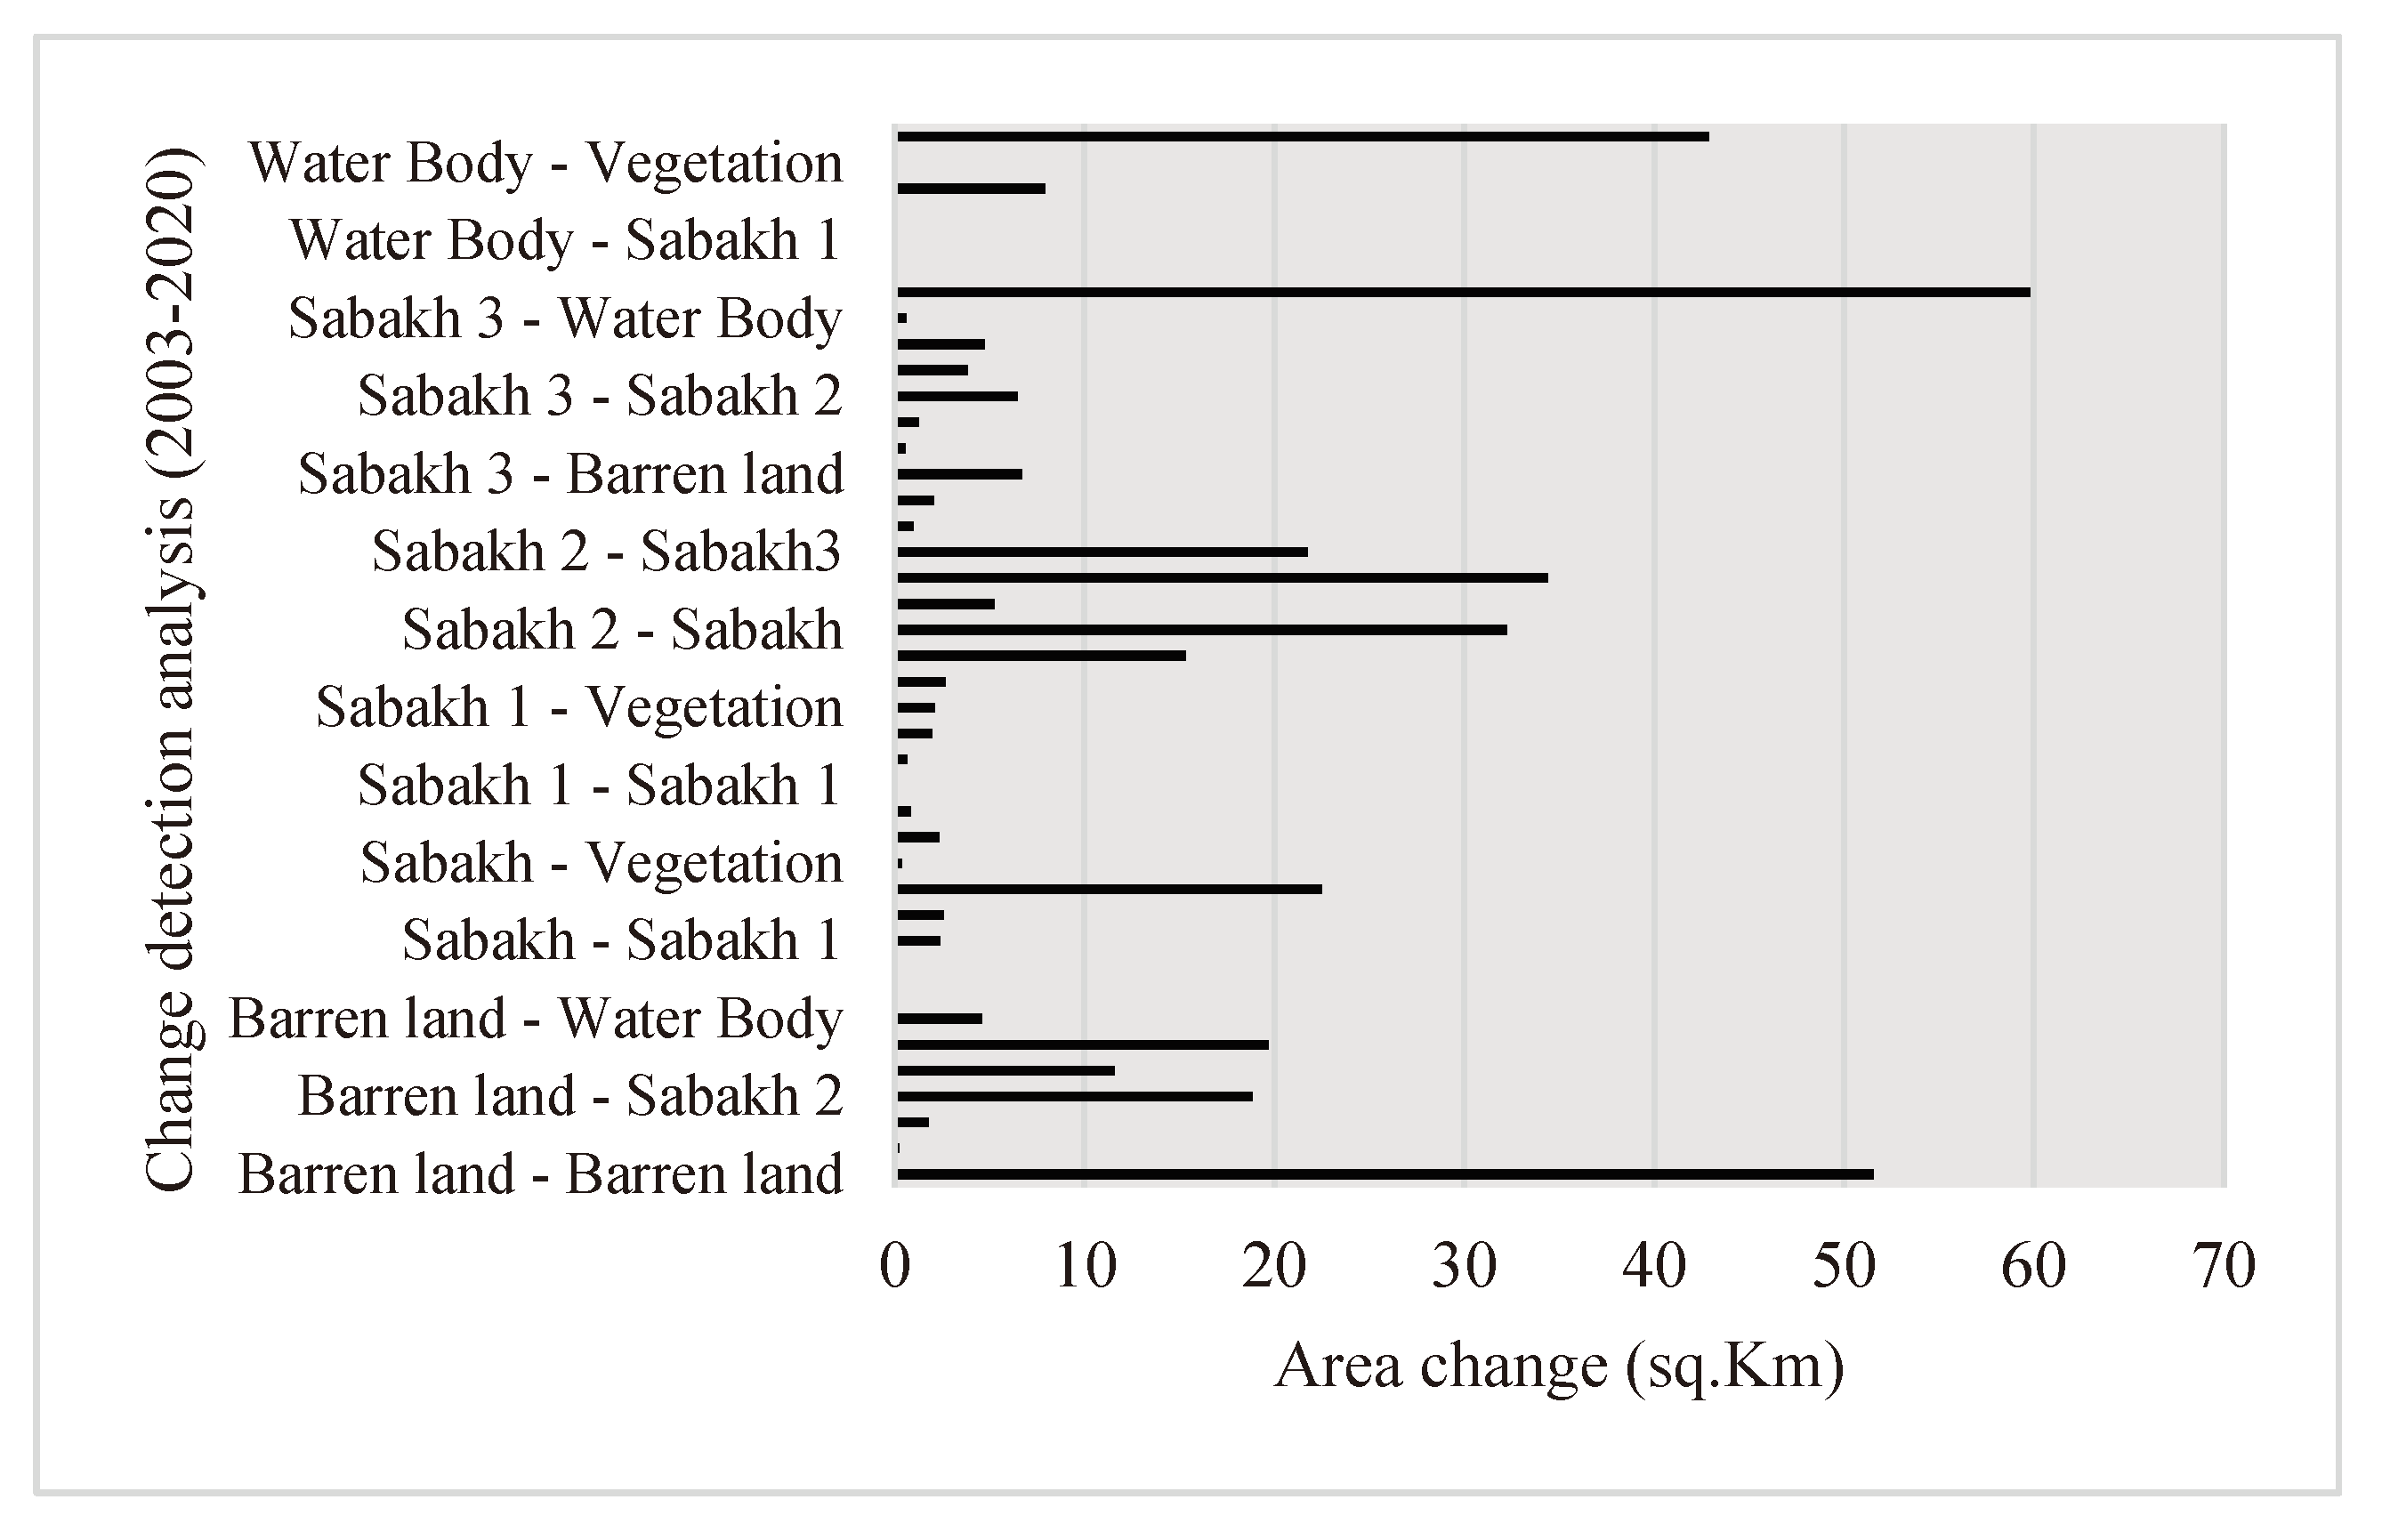
Table 1.
World soil salinity categorization degrees.
| No. | EC degree | EC dS/m [16] | FAO dS/m |
| 1 | None | < 0.15 | 0 - 2 |
| 2 | Slightly | 1.5 - 3 | 2 - 4 |
| 3 | Moderately | 3 - 6 | 4 – 8 |
| 4 | Highly | 6 -10 | 8 – 16 |
Table 3.
The first approach relationships between the applied indices and the EC.
| No. | Index | Correlation Value | R² Linear | R² Polynomial |
| 1 | SI | 0.38 | 0.14 | 0.15 |
| 2 | SI1 | 0.37 | 0.14 | 0.14 |
| 3 | SI3 | 0.37 | 0.14 | 0.14 |
| 4 | S3 | 0.37 | 0.13 | 0.14 |
| 5 | S6 | 0.33 | 0.11 | 0.11 |
| 6 | SAVI | -0.24 | 0.06 | 0.08 |
| 7 | RVI | -0.24 | 0.06 | 0.08 |
| 8 | EVI | -0.25 | 0.06 | 0.08 |
| 9 | S1 | -0.25 | 0.06 | 0.08 |
| 10 | NDVI | -0.27 | 0.07 | 0.09 |
| 11 | S2 | -0.28 | 0. 08 | 0.1 |
Table 4.
The second approach relationships between the applied indices and the EC.
| No. | EC Degree | Index | Correlation Value | R² Linear | R² Polynomial |
| 1 | None | S6 | 0.55 | 0.30 | 0.39 |
| 2 | Slightly | S2 | 0.67 | 0.45 | 0.47 |
| 3 | Moderate | S2 | 0.96 | 0.89 | 0.91 |
| 4 | Highly | S2 | 0.56 | 0.31 | 0.33 |
| 5 | Severe 1 | NDVI | 0.33 | 0.11 | 0.17 |
| 6 | Severe 2 | S6 | 0.5 | 0.24 | 0.26 |
| 7 | Severe 3 | S2 | 0.62 | 0.39 | 0.89 |
Table 5.
The third approach relationships between the applied indices and the EC.
| No. | EC Degree | Index | Correlation | Number of correlated images | R² | ||
| Highest Value | Lowest Value | Linear | Polynomial | ||||
| 1 | None | S6 | 0.72 | 0.42 | 8/9 | 0.31 | 0.41 |
| 2 | Slightly | S2 | 0.74 | 0.65 | 8/9 | 0.45 | 0.46 |
| 3 | Moderate | S1 | 0.99 | 0.99 | 8/9 | 0.88 | 0.93 |
| 4 | Highly | S2 | 0.69 | 0.49 | 7/9 | 0.32 | 0.34 |
| 5 | Severe 1 | SAVI | 0.46 | 0.27 | 8/9 | 0.13 | 0.19 |
| 6 | Severe 2 | S2 | 0.32 | 0.16 | 5/9 | 0.07 | 0.09 |
| 7 | Severe 3 | S1 | 0.62 | 0.29 | 4/9 | 0.23 | 0.28 |
Table 6.
The fourth approach relationships between the applied indices and the EC.
| No. | Pond | Elevation DEM (m) BSL | EC ds/m | Index | Correlation | R² | ||
| Lowest value | Highest value | Linear | Polynomial | |||||
| 1 | Bahi | -17 | 12 | 55 | SI | 0.23 | 0.05 | 0.08 |
| 2 | Siwa | -15 | 4.89 | 193 | SI | 0.23 | 0.05 | 0.09 |
| 3 | Aghormi | -19 | 0.95 | 32.5 | SI | 0.18 | 0.03 | 0.11 |
| 4 | Zaitoun | -18 | 0.56 | 44 | SI | 0.61 | 0.37 | 0.69 |
Table 7.
Land cover classification of collected samples after change in 2020.
| No | Class | % of Samples | EC ds/m | |
| Min | Max | |||
| 1 | Agriculture | 60% | 0.56 | 49.2 |
| 2 | Urban | 38% | 1.47 | 35.5 |
| 3 | Wet lands (Sabakh) | 2% | 44.5 | 193 |
Disclaimer/Publisher’s Note: The statements, opinions and data contained in all publications are solely those of the individual author(s) and contributor(s) and not of MDPI and/or the editor(s). MDPI and/or the editor(s) disclaim responsibility for any injury to people or property resulting from any ideas, methods, instructions or products referred to in the content. |
© 2024 by the authors. Licensee MDPI, Basel, Switzerland. This article is an open access article distributed under the terms and conditions of the Creative Commons Attribution (CC BY) license (http://creativecommons.org/licenses/by/4.0/).
Copyright: This open access article is published under a Creative Commons CC BY 4.0 license, which permit the free download, distribution, and reuse, provided that the author and preprint are cited in any reuse.


