Submitted:
18 February 2024
Posted:
20 February 2024
You are already at the latest version
Abstract
In Taiwan, mountainous areas account for approximately two-thirds of the total area. The steep terrain and concentrated rainfall during typhoons cause landslides, which pose a considerable threat to mountain settlements. Therefore, models for analyzing rainfall-induced landslide hazards are urgently required to ensure adequate land use in mountainous areas. In this study, focusing on Pingtung County in southern Taiwan, we developed a landslide hazard index (IRL) to land use. Using FORMOSA-2 and SPOT-5 satellite images, data were collected before and after four typhoons (one in 2009 and three in 2013). The ArcGIS random tree classifier was used for interpreting satellite images to explore surface changes and disasters, which were used to analyze slope disturbances. The product of the maximum 3-h rolling rainfall intensity and effective accumulated rainfall was used as a rainfall trigger index (IRT). Considering environmental and slope disturbance factors, an index of slope environmental strength potential (ISESP) was developed through logistic regression (LR). Landslide hazard to land use was estimated using IRT and ISESP. The average coefficient of agreement (Kappa) was approximately 0.71 (medium to high accuracy); the overall accuracy of slope environmental strength potential analysis was approximately 80.4%. At a constant ISESP, IRT increased with the increasing hazard potential of rainfall-induced landslides. Furthermore, IRT and ISESP were positively correlated with landslide occurrence. When large ISESP values occur (e.g., fragile environment and high land development intensity), small IRT values may induce landslides.
Keywords:
land use
; mountainous area
; rainfall
; landslide hazard
; random tree classifier
; logistic regression
; geographic information system
; Taiwan
1. Introduction
Taiwan is an island located in the North Pacific subtropical monsoon region, which is vulnerable to typhoons. More than two-thirds of Taiwan’s total area is mountainous with steep slopes. Recently, climate anomalies have resulted in frequent extreme rainfall events. The number of typhoons that hit Taiwan has increased every year, and large-scale landslides and debris flows have become likely. As stated in the 2012 White Paper on Disaster Management [1], remote mountainous settlements in Chiayi County, Kaohsiung City, Tainan City, Pingtung County in southern Taiwan account for approximately 24% of the total area in Taiwan. Recent large-scale sediment disasters due to typhoon-induced concentrated rainfall occurred mostly in the remote mountainous areas of southern Taiwan. Such disasters pose a major threat to the environmental security of the settlements in remote mountainous areas. Since Typhoon Morakot struck in 2009, the slopes of the remote mountainous areas of southern Taiwan have become highly unstable. Therefore, studies on the land use risk of the aforementioned settlements during rainfall disasters are essential.
Jan and Lee [2] used the product of effective accumulated rainfall (EAR) and rainfall intensity as a rainfall trigger index (IRT) for determining debris flow; they discovered relevant geological factors (average stream bed slope, catchment area, landslide rate, and lithology) for establishing comprehensive geological indicators. A rainfall prediction model for debris flow was constructed using the rainfall warning and comprehensive physiographic indices. For rainfall warning, the following occurrence possibilities were set: 10%, 50%, and 90%. Chen et al. [3] demonstrated that extreme rainfall events causes frequent landslide erosion; they reported that a maximum 24-h rainfall amount of >600 mm resulted in the average landslide erosion rate of 64%–79%. Jan et al. [4] mentioned that the effects of typhoon rainfall depend not only on the rainfall amount but also on its intensity. Tseng et al. [5] reported that the number and area of rainfall-induced landslides are positively correlated with the degree of land disturbance. Chen et al. [6] investigated areas with high and low susceptibility to landslides; they identified cumulative rainfall to be the primary factor for landslide occurrence in areas with high susceptibility; by contrast, in areas with low susceptibility, the rainfall intensity was found to be the key factor. Because of climate extremes, areas with high susceptibility exhibited a higher magnitude and frequency of landslides than did those with low susceptibility.
Lee et al. [7] explored the mechanisms underlying landslide disasters due to the intensity of Typhoon Soudelor–induced rainfall on the mountainous areas of northern Taiwan; they revealed that most sediment disasters occurred 1 or 2 h after peak rainfall. Moreover, the maximum rainfall occurring 3, 6, and 12 h after this event was higher than that in the 200-year return period. To estimate a rainfall alert value for landslide occurrence, Caracciolo et al. [8] analyzed historical data on the rainfall that led to a landslide as well as data on rainfall occurring 5, 15, and 30 days before a landslide in southern Sicily, Italy. Chen and Wu [9] focused on a state-owned forest land in Taiwan. They analyzed various internal (e.g., elevation, slope, terrain roughness, distance from the fault, and distance from the river) and external (total accumulated rainfall after event) factors through logistic regression (LR) to build an internal potential level without external factors; subsequently, they evaluated the changes in the potential value and rainfall to estimate a reference value for the prediction of landslides induced by rainfall. Shahabi et al. [10] combined remote sensing and geographic information system (GIS) to statistically delineate areas susceptible to landslides; for this, they considered the following factors: slope, aspect, elevation, lithology, normalized difference vegetation index, vegetation, rainfall, distance from the fault, distance from the river, and distance from the road. Tseng et al. [5] focused on the periods before and after a typhoon that recently caused a road slope landslide in the study area; through image interpretation, they identified surface changes before and after the landslide disaster and developed a model for assessing landslide susceptibility. Then, the GIS platform was used to construct landslide susceptibility maps. Among the statistical methods used for evaluating landslide susceptibility, LR analysis has been proven to be one of the most reliable approaches [11,12,13,14,15,16,17,18].
In the present study, we used the random tree classifier (RTC) to interpret and classify the images obtained for the periods before and after rainfall. The findings can provide information on surface land use and disasters, which can be used to identify the areas susceptible to sediment disasters in Sandimen and Wutai townships, Pingtung County. Considering the regional environmental characteristics and land disturbance, we further analyzed the potential of slope environmental intensity, factors associated with slope disasters, and rainfall characteristics of the study area and investigated the correlation between rainfall trigger and slope environmental strength potential to develop IRL. Our findings ensure the safe use of land in mountainous settlements.
2. Methods
2.1. Rainfall Projection
2.1.1. EAR
We referred to the rainfall analysis methods described by Seo and Funasaki [19] and Tseng et al. [5]. Concentrated rainfall is considered to be continuous if no rainfall occurred 24 h before and after the rainfall event. The rainfall field with continuous rainfall inducing a landslide is regarded as the main rainfall field. The beginning of rainfall is defined as the time point when the first rainfall reached ≥4 mm in the main rainfall field. Cumulative rainfall inducing a landslide is calculated. Cumulative rainfall is divided into previous indirect rainfall (Pb) and previous direct rainfall (Pr). Previous indirect rainfall refers to the amount of rainfall in the main rainfall field within 7 days [19]. It can be calculated using Equation (1).
Pn is the amount of rainfall (mm) in n days before the main rainfall field; k is the decreasing coefficient. In the present study, k is 0.9 [20]. EAR can be calculated as follows:
Pr is the amount of cumulative rainfall from the first rainfall in the main rainfall field from the time of the landslide disaster (a time point when the first rainfall reaches ≥4 mm) to the occurrence of the landslide.
2.1.2. Rolling Rainfall Intensity
Rain-induced landslides may be triggered by continuous rainfall for several hours. Therefore, rolling rainfall intensity can be expressed using Equation (3):
I is the rainfall intensity, m is the unit time of rain rolling, and m = 3 h [5]. ImR is the IR in m h, and It is the rainfall intensity in t h.
2.2. RTC
We used the RTC in the ArcGIS supervised image classification module to classify images. The RTC does not lead to overfitting and can process segmented images and auxiliary grid data sets [21]. The classifier can be used to construct several decision trees, and it selects a random subset of variables for each tree and uses the most frequent tree output for the overall classification. Therefore, random trees correct for the tendency of decision trees to overfit training data. Random trees are a collection of individual decision trees; each tree is generated from different subsets of sample and training data. Decisions are made in the order of the importance of each pixel being classified. An image is drawn for a certain pixel appears as a tree branch. After the entire data set is processed, each branch forms a whole tree; this is the concept of random trees. In the operation of random trees, each tree has decision-making power; this process reduces overfitting. In the random tree method, analogically, many trees continue to grow; the changes in the trees of a forest are projected into randomly selected subspaces through training data, and each node’s decision is optimized through a random process [21].
2.3. LR
In regression analysis, dependent variables serve as categorical variables, whereas independent variables serve as continuous or dummy variables. Dummy variables represent categorical data; the corresponding numerical values are the basis for classification and have no comparative significance. The primary feature of LR is that dependent variables are categorical variables, whereas independent variables can be continuous or categorical variables [22].
LR is used for analyzing dichotomous dependent variables. One or more independent variables may be included in the model. Response variables can be categorical or continuous variables. Previously, landslide susceptibility was analyzed mostly considering the distribution patterns of binary variables [23]. Through a statistical induction method, a set of regression patterns may be identified to differentiate between landslide and nonlandslide. The value range of the logistic distribution function is 0–1, and the distribution of the value range follows an S-shaped curve [24].
As shown in Equation (4), linear regression assumes a linear function and includes dependent and independent variables (and random residual values) [22].
Y is a dependent variable; x1, x2, and x3 are independent variables; and e represents a residual value. β0+β1x1+β2x2+β3x3 is a linear function between expectation E(Y) and the three independent variables.
LR is used to construct practical and reasonable allocation models for predicting the correlations between a dependent variable (y) and a set of independent variables (x). The relationship usually refers to the relationship between a set of independent variables (xs), which is used to predict the probability of the dependent variable being equal to 1, such as the probability of landslide occurrence. The ratio of the probability of event occurrence to that of event nonoccurrence is called the event odds. A linear function can be obtained using its natural logarithm, which is the logit model, as shown in Equation (5) [22].
P is an independent variable; x1, x2,….xk are the probabilities of event occurrence. In this study, y indicates the probability of landslides, and the aforementioned x parameters represent various independent variables. A logistic curve can be constructed using the logit function; its mathematical formula is shown in Equation (6).
In general, the probability threshold is set at .5. A predicted probability (p) of ≥.5 indicates the likelihood of a landslide event; by contrast, if p < 0.5, a landslide event is not expected to occur.
3. Study Area
This study was conducted in Sandimen Township and certain mountainous areas of Wutai Township in Pingtung County in southern Taiwan (Figure 1). Pingtung County is located in the south of the Tropic of Cancer. Except for elevated mountainous areas, the county has a tropical monsoon climate. The temperature does not vary substantially throughout the year. The annual average temperature is approximately 25.5°C. It is humid and rainy in summer. However, because of the barrier between the Dawu Mountain Range and the Central Mountain Range, the cold northeast monsoon is blocked from entering the county; this blockage combined with a low latitude and sufficient sunshine reduces the intensity of winter in Pingtung, where the average high and low temperatures are 24–27°C and 16–19°C, respectively [25,26]. In Sandimen and Wutai townships, most of the strata are Chaozhou and Bilushan formations; low contents of alluvial and grounding deposits are observed. Lithologically, the study area is mainly interbedded with hard shale, slate, and sandy shale. In addition, low contents of gravel, sand, clay, and slate interbedded with metamorphic sandstone and metamorphic igneous rock lens, mud, sand, and gravel, lenticular sandstone bodies are noted [27]. Sandimen Township is located at an altitude of 100–2,159 m and at the intersection of mountains and plains and features mostly hilly terrain. Wutai Township is located in the northeast area of Pingtung County (in the Central Mountain Range). This township has steep terrain and is located at an average altitude of >1,000 m. The largest tributary flowing through the study area is Ailiao River, which is the largest tributary of Gaoping River. Its farthest source stream is Eluowu River, which flows south to Babanaban River and then turns southwest to Laibuan River (where it is called Ailiao North Stream); subsequently, it turns south to join Hayou Creek and Qiaoguo Laci Creek (among others) and finally turns south to converge into Ailiao South Stream in Dalai Village; it is called Ailiao Creek in Sandimen Township. The main rivers in Wutai Township are Erchong and Ailiao Beixi, whereas the main rivers in Wutai Township are Ailiao Beixi and Qiaoguolaci [25].
In Sandimen Township, Sandi and Dalai villages have the highest (n = 1,683) and lowest (n = 402) populations. In Wutai Township, Wutai and Jilu villages have the highest (n = 1,325) and lowest (n = 210) populations [28]. The residents of Sandimen Township are mainly Paiwan individuals (Taiwan aborigines); some Rukai individuals also reside in this township, such as in Qingye Village, which has recently been included in the Maolin National Scenic Area. The main economy in Sandimen Township is agriculture, and the main agricultural products are sweet potato, millet, taro, mango, pineapple, red quinoa, and coffee [29]. The residents of Wutai Township are mainly Rukai individuals [30]. The main agricultural products of the township are love jade, red quinoa, millet, coffee, taro, and sweet potato [31].
4. Image Interpretation and Classification
4.1. Preprocessing of Satellite Images
FORMOSA 2 (FS-2) or SPOT-5 satellite images of the areas affected by typhoons or rainstorms were acquired. Data on the 2009 Typhoon Morakot, 0517 rainfall in 2013, 2013 Typhoon Soulik, and 2013 Typhoon Kongrey were obtained to explore the land development types and landslide lands in the study area. We used six satellite images with image resolutions of 8 m × 8 m and 10 m × 10 m (Table 1).
The FS-2 and SPOT-5 satellite images are multispectral and contain four spectral bands [32]. FS-2 spectral bands are red, green, blue, and near-infrared (NIR), whereas SPOT-5 spectral bands are red, green, NIR, and short-wave infrared. The telemetry image processing software ERDAS IMAGINE [33] was used to fuse and locate the images.
4.2. Selection of Satellite Imagery Classifications
In this study, FS-2 or SPOT-5 satellite images of four typhoons or rainstorms were selected as the base map. Using GIS ArcGIS, each classification factor was manually digitized and circled. We compared the Tiff files of the satellite images (resolution, 2 m × 2 m) of the study area to increase the accuracy of sampling area delineation; furthermore, we selected the following eight classifications suitable for the scope of this study: river, road, building, farmland, forest, meadow, streamway, and bare land (Figure 2).
4.3. Interpretation of Images and Assessment of Accuracy
Considering the aforementioned eight classifications, the RTC module was used with the results of texture analysis to interpret the images. The research scope was interpreted using a total of six satellite images obtained before and after the 2009 Typhoon Morakot, 0517 rainfall in 2013, 2013 Typhoon Soulik, and 2013 Typhoon Kongrey. Figure 3 depicts the results of image interpretation. To confirm the accuracy of the interpretation results, we randomly selected a total of 25 points (interpretation grids; checkpoints) for each classification and compared them with high-resolution aerial photos and on-site survey data. The most common accuracy evaluation method is the error matrix [34], which is used to calculate the coefficient of agreement (Kappa index) and overall accuracy. The value of the Kappa index proposed by Cohen [35] ranges from 0 to 1. Kappa values of <0.4, 0.4–0.8, and >0.8 indicate low, medium, and high accuracies, respectively. Table 2 summarizes OAs before and after the rainfall events in the study area. In this study, the average Kappa value of each satellite image was approximately 0.71, and the average overall accuracy was approximately 74% (medium to high accuracy).
4.4. Identification of Landslides Through Image Interpretation
After image classification, to identify rainfall-induced landslides in the study area, we subtracted bare land grids before and after rainfall events by using the image subtraction method. The river, streamway, and bare land classifications with a slope percentage of <5% were deducted. High-resolution aerial photos of the study area were compared, and manual inspection was performed to identify landslides; then, the locations of the rainfall-induced landslides in the study area were obtained (Figure 4). The 2009 Typhoon Morakot resulted in the highest rainfall and the largest landslide area (1,313.12 ha). The areas of landslides induced by the other events were as follows: 0517 rainfall in 2013, 813.92 ha; Typhoon Kongrey, 789.44 ha; and Typhoon Soulik, 635.04 ha).
5. Development of a Model for Assessing Rainfall-Induced Landslide Susceptibility
5.1. Selection of Factors Associated With Landslide
Landslides can be attributed to factors such as artificial slope land use, environment, and rainfall triggers. Human activities may negatively affect water and soil conservation on slope lands, which compromises the safety of slope land. Therefore, referring to studies of Chen et al. [36] and Tseng et al. [5], we divided the aforementioned factors into the following three categories: environmental, slope disturbance, and rainfall trigger factors. The environmental factors assessed in this study included elevation, slope, aspect, slope roughness, terrain roughness, distance from the river, and geology. The slope disturbance factors included road density, building density, farmland planting rate, forest density, grassland density, and bare density. The rainfall trigger factor was the product of EAR and the maximum 3-h rolling rainfall intensity (I3R,max).
The digital elevation model (DEM) was used to analyze the environmental factors using ArcGIS Spatial Analyst. A basic grid of 40 m × 40 m was constructed for the factors related to landslide occurrence, followed by the development of a GIS database of the study area. The hazard factors are described below.
5.1.1. Environmental Factors
5.1.1.1. Elevation
The elevation of a place refers to its height from the sea level. In Taiwan, the elevation datum comprises the mean sea level of Keelung Port, and the elevation of the terrain is called the elevation difference. When other factors are constant, higher degrees of elevation are associated with a higher sliding force. We used a 20 m × 20 m DEM for analysis. The elevation of the study area is 78–2,437 m, which was divided into a total of seven grades and coded. Table 3 presents the elevation classification codes, ranging from an elevation of <350 m coded as 1 to an elevation of >2,100 m coded as 7.
5.1.1.2. Slope
Here, slope indicates the inclination of a slope. Higher degrees of inclination indicate steeper slopes and vice versa. High inclination as well as poor soil and water conservation may facilitate the development of landslides. In this study, the slope value of each grid was obtained through DEM and ArcGIS slope analysis. According to the Classification Standards for Land Utilization Limits of Hillside Lands outlined in the Regulations of Soil and Water Conservation [37], we graded and coded slopes (Table 4). A first-grade slope was coded as 1, whereas a seventh-grade slope was coded as 7.
5.1.1.3. Slope Roughness
Slope roughness reflects the changes in a slope (standard deviation). Higher degrees of slope roughness indicate higher extents of changes, which may facilitate the occurrence of landslides. Cluster analysis was performed to classify the slope roughness of the study area. Slope roughness of <18.15 was coded as 1, whereas that of >63.34 was coded as 7 (Table 5).
5.1.1.4. Aspect
Each slope has a different aspect. Aspect refers to the inclination direction of a slope. It affects wind flow and rainfall distribution. In this study, using DEM and ArcGIS aspect analysis, the aspect data of each grid were obtained. The inclination angle may be as follows: north, northeast, east, southeast, south, southwest, west, northwest, and flat ground (clockwise). In this study, a flat ground was coded as 1, whereas the southwestern part of a windward side was coded as 6 (Table 6).
5.1.1.5. Surface Roughness
Surface roughness reflects the changes in a surface (standard deviation). Higher degrees of surface roughness indicate higher extents of changes, which may facilitate landslide occurrence. In the present study, cluster analysis was performed to classify the surface roughness of the study area. Surface roughness of <417.62 was coded as 1, whereas that of >2,298.55 was coded as 7 (Table 7).
5.1.1.6. Distance From the River
The distance of an area from a water body may affect the occurrence of landslides. A shorter distance is associated with higher levels of groundwater, which softens soil, thereby facilitating landslide occurrence. We used a river map to calculate the distance of each grid from a river; for this, the ArcGIS buffer analysis function was used. The analysis results were coded as shown in Table 8.
5.1.1.7. Geology
We used the geological map of the Central Geological Survey of the Ministry of Economic Affairs (2021) to obtain information on the geological conditions corresponding to each grid in the study area. On the basis of geological age and lithological data, it was divided into four strengths: very weak, medium, medium strong, and strong [38]. The highest strength was coded as 1, whereas the lowest strength was coded as 4 [36].
5.1.2. Slope Disturbance Factors
Using RTC with texture analysis for image interpretation and classification, we assessed the slope disturbance of the research area. The following six factors were included in further analysis: road density, building density, farmland planting rate, forest density, grassland density, and bare density. To quantify the slope disturbance in each basic grid, slope disturbance was defined as the area percentage ratio of each disturbance factor in each basic grid. The degree of land development of hillsides and its index were evaluated in reference to earlier studies [5,36]. Because we regarded environmental and slope disturbance factors as independent factors influencing landslides, a slope disturbance index was developed and is shown in Equation (7).
DC refers to the disturbance condition. GDC is a DC grade, which is the score corresponding to slope land use disturbance in each grid. R is the ratio of the area occupied by each slope and the utilization factor corresponding to the grid. Table 9 presents the grades corresponding to the DCs of the aforementioned six slope disturbance factors. For grading, we referred to a study conducted by Chen et al. [36].
5.1.3. Rainfall Trigger Factors
We obtained relevant data from the following 12 rainfall measurement stations within and near the study area: Weiliaoshan, Majia, Hongyeshan, Shangdewun, Dajin, Jinfeng, Ligang, Meinong, and Gusia [26] as well as Zhiben-5, Ali, and Sandimen [39]. Through inverse distance weighting (ArcGIS), the EAR and I3R,max values were calculated for each station (Table 10 and Table 11) for four rainfall events occurring in 2009 and 2013.
5.2. Analysis of Slope Environmental Strength Potential
We performed correlation analyses of environmental and slope disturbance factors. After highly correlated factors were eliminated, LR was performed to analyze slope environmental strength; thus, a slope environmental strength regression model was constructed. Then, we established the index of slope environmental strength potential (ISESP). A basic grid of 40 m × 40 m was constructed using ArcGIS; subsequently, the slope environmental strength potential value in each grid of the study area was calculated.
5.2.1. Correlation Analyses of Slope Environmental Strength Potential Factors
The slope environmental strength potential factors initially selected in this study included environmental factors such as elevation, slope, aspect, slope roughness, surface roughness, distance from the river, and geology and slope disturbance factors. To ensure that the factors are independent and exert no mutual effects, we performed correlation analyses of the selected factors before LR analysis to identify the degree of correlations between the factors. Elevation, slope, slope roughness, surface roughness, and slope disturbance index served as continuous variables, whereas aspect, distance from the river, and geology served as categorical variables. In LR, categorical variables only represent the data distribution of factor codes and not the effects of the code size on dependent variables. Hence, we focused only on continuous variables. Statistical analysis was performed using SPSS [40]. For the four rainfall events, the correlations between the factors were investigated through Pearson correlation analysis. If the absolute value of the correlation coefficient is closer to 0, the degree of correlation is weaker; by contrast, if it is closer to 1, the degree of correlation is stronger. Table 12 presents the correlations between slope environmental strength potential factors. Elevation exhibited high-level correlations with surface roughness. Slope exhibited medium-to-high-level correlation with slope roughness. The remaining factors exhibited low-level correlations. Hence, surface roughness was not included in the LR model.
5.2.2. Results of the Analysis of Slope Environmental Strength Potential
To reduce errors due to the evaluation model and subjective errors due to selection bias (human errors), we randomly sampled the same number of landslide and nonlandslide samples. After sampling, the data were randomly divided into training (70%) and test (30%) data sets. An environmental strength assessment model was constructed through LR [40].
The dependent variable was landslide or nonlandslide, and the independent variables were environmental factors, such as slope, aspect, elevation, distance from the river, slope roughness, geology, and slope disturbance factors. Through LR, a regression formula was developed for analyzing slope environmental strength potential. The formula is shown in Equation (8).
El denotes the elevation, Sl is the slope, Slr is the slope roughness, IDC is the slope disturbance index, As is the aspect grade, Dr is the distance from the river, Gs is the geological grade, β is the regression coefficient of continuous variables, and α is a constant. D represents a dummy variable, which is a value coded for the category corresponding to a factor. Substituting each regression coefficient and constant value into Equation (8) and substituting it into Equation (9), we can calculate the probability value of each grid, which represents the value of ISESP.
LR was performed to evaluate the training classification results of various rainfall events. The accuracies of classifications performed using training and test data after 2009 Typhoon Morakot were 68.3% and 68.1%, respectively. Training data were used to deduce the accuracies of classifications for the entire study area. The estimated accuracy was 65.2% (Table 13). Table 14 presents the errors in the evaluation of various rainfall events. The accuracies of classifications performed using training data after 0517 rainfall, Typhoon Soulik, and Typhoon Kongrey were 83.8%, 86.2%, and 86.4%, respectively; the corresponding values for test data sets were 84.3%, 86.4%, and 87.5%. The average accuracy of the overall classification was approximately 80.4%.
5.3. Establishment of a Landslide Hazard Index
Higher values of slope environmental strength potential are associated with larger amounts of rainfall and thus higher probabilities of landslides. By referring to the study of Jan and Lee [2], we adjusted it. IRT can be calculated as shown in Equation (10).
We established a landslide hazard index (IRL) using IRT and ISESP. The formula is shown in Equation (11).
Higher values of IRL indicate a higher probability of landslides. At a constant IRL, IRT is inversely proportional to ISESP. Thus, if ISESP is relatively stable, a large amount of rainfall would induce landslides. By contrast, if ISESP is low, only a small amount of rainfall would induce landslides. We used the following comprehensive indicators of rainfall-induced landslides [2]: IRL1, IRL10, IRL25, IRL50, and IRL90. The index development method is described below.
- IRL1: From the IRL values corresponding to the grid data of all rainfall-induced landslides in the study area, the value with a cumulative probability of 1% is selected (Weber’s method) and is indicated as IRL1. Grids with IRL values less than that of IRL1 have landslide probabilities of <1%.
- IRL10: From the IRL values corresponding to the grid data of all rainfall-induced landslides in the study area, the value with a cumulative probability of 10% is selected (Weber’s method) and is indicated as IRL10. Grids with IRL values between the values of IRL1 and IRL10 have landslide probabilities of 1%–10%.
- IRL90: Landslide and nonlandslide grids with values less than that of IRL10 are excluded. From the IRL values corresponding to the remaining grids, the value with a cumulative probability of 90% (Weber’s method) is selected and indicated as IRL90. Grids with IRL values exceeding that of IRL90 have landslide probabilities of >90%.
- IRL10–IRL90: To determine a landslide probability corresponding to a comprehensive index between IRL10 and IRL90, the relationship between the aforementioned index and landslide probability can be expressed as shown in Equation (12).
Equation (12) can be rewritten as Equation (13).
. Thus, the landslide probability corresponding to the landslide comprehensive index IRLi can be obtained.
5.4. Analysis of Landslide Hazard to Land use
5.4.1. Correlation Between Slope Environmental Strength Potential and Rainfall-Induced Landslide
We first explored the distribution of landslide and nonlandslide grids with the same IRL value for each event and performed stratified random sampling according to the ratio of the numbers of landslide and nonlandslide grids with the same IRL value. To calculate the IRL values corresponding to IRL1, IRL10, IRL25, IRL50, and IRL90, after merging the data points of each rainfall event, we sorted the landslide grids; then, using Equation (12), the IRL values corresponding to different cumulative probabilities were calculated. Table 15 presents the IRL indices and the corresponding values.
Using the IRL indices presented in Table 15, the correlation between IRT and slope environmental strength potential was calculated after merging the data points of each rainfall event (Figure 5). The product of IRT and ISESP was the closest to the grids with different cumulative probabilities. The trend line corresponding to each IRL value was drawn using the power method. As shown in Figure 5, the IRT of 2009 Typhoon Morakot was the highest among the four rainfall events; thus, most of its landslide grids were distributed above IRL50. For 0517 rainfall in 2013, the grids were mostly below IRL90. The IRT of 2013 Typhoon Soulik was the lowest among the four rainfall events; most of its landslide grids were distributed below IRL25. The IRT of 2013 Typhoon Kongrey was higher than those of Typhoon Soulik and 0517 rainfall events; for Typhoon Kongrey, the grids were distributed between IRL1 and IRL90.
5.4.2. Estimation of Landslide Hazards to Land use
After the classification of IRL indices with different cumulative probabilities, the numbers of landslide and nonlandslide grids with different ISESP grades and the landslide ratio (landslide /nonlandslide) were estimated. Considering that higher values of IRT are associated with higher values of ISESP (and higher degrees of hazard), we investigated the most reasonable average distribution of the landslide ratio in an inductive manner. Then, the degree of hazard was calculated for each distribution situation and substituted into the grids of each event. Thus, the hazard degree of rainfall-induced landslide in each grid of each event was obtained. Table 16 presents the landslide ratios (before and after induction) of various ISESP grades of different IRL indices. The same color in the table represents the same category of landslide ratio intervals (n = 8). Figure 5 illustrates the results presented in Table 16. The landslide ratio intervals were normalized using the average landslide ratio of the same interval, as shown in Equation (14).
Znorm represents the value after normalization, X represents the value to be normalized, Xmin represents the minimum value in the data, and Xmax represents the maximum value in the data. In this study, the normalized value was regarded as the degree of rainfall-induced landslide hazard. The estimated degree of hazard was substituted into the grid of each rainfall event to obtain the degree of hazard corresponding to each rainfall event grid in the study area. The normalized value is a value between 0 and 1. Landslide probabilities of (IRL) of <1% still represent the possibility of landslide. Therefore, the minimum value of IRL1 indicates its risk probability. Table 17 presents the hazard value of each landslide ratio interval. The color reference in Table 17 is the same as that in Table 16. The hazard value of each grid of each rainfall event was substituted into each grid, and hazard maps were constructed. Higher degrees of hazard indicate higher probabilities of landslide and vice versa.
The hazard value of each interval was substituted into each grid of each rainfall event, and the hazard maps of the study area after each rainfall event were constructed (Figure 6). Hazard degree was classified into eight grades, and the classification was based on the method in Table 17. The IRT of 2009 Typhoon Morakot was the highest among all rainfall events, and the number of landslide grids was 8,207; thus, the degree of landslide hazard in the study area after this typhoon was the highest. The IRT of 2013 Typhoon Kongrey was higher than that of 0517 rainfall in 2013; thus, the degree of landslide hazard after Typhoon Kongrey was higher than that after 0517 rainfall in 2013. The IRT of 2013 Typhoon Soulik was the lowest, and the number of landslide grids was also the lowest (n = 3,969); thus, the degree of landslide hazard after this typhoon was the lowest.
6. Conclusions
In the present study, we developed an index to evaluate landslide hazards to land use after four prominent rainfall events in Sandimen and Wutai townships in Pingtung County. Using RTC and texture analysis, we interpreted and classified the satellite images of the study area captured before and after four rainfall events. The average Kappa value was approximately 0.71, which indicated medium to high accuracy. A comparison of the satellite images captured before and after the rainfall events in terms of exposure revealed that the area of landslide due to 2009 Typhoon Morakot was the largest (1,313.12 ha); the areas of landslides due to the other rainfall events were as follows: 0517 rainfall in 2013, 813.92 ha; Typhoon Kongrey, 789.44 ha; and Typhoon Soulik, 635.04 ha. Environmental factors (e.g., elevation, slope, aspect, slope roughness, distance from the river, and geology) and slope disturbance factors (e.g., road density, building density, farmland planting rate, forest density, grassland density, and bare density) were assessed in this study to analyze slope environmental strength potential ISESP. The average overall classification accuracy was approximately 80.4%. IRT was calculated by multiplying EAR with I3R,max. A new comprehensive index of rainfall-induced landslide IRL (IRL = IRT × ISESP) was established for determining the hazard of rainfall-induced landslides to land use. Using the correlation between ISESP and IRT, we determined the degrees of rainfall-induced landslide hazards to land use. At a constant ISESP, higher values of IRT indicate higher degrees of landslide hazard to land use; similarly, at a constant IRT, higher values of ISESP indicate higher degrees of landslide hazard to land use. Landslide occurrence is positively correlated with IRT and ISESP. In cases of large ISESP values (e.g., fragile environment and high land development intensity), small IRT values may cause landslides.
Author Contributions
Conceptualization, C.-M.T., Y.-R.C., C.-Y.T., S.-C.H.; methodology, C.-M.T., Y.-R.C.; investigation Y.-R.C., S.-C.H.; writing—original draft preparation, C.-M.T., Y.-R.C.; writing—review, C.-M.T., Y.-R.C., C.-Y.T., S.-C.H.; editing, C.-M.T., Y.-R.C.; supervision, C.-M.T. All authors have read and agreed to the published version of the manuscript.
Funding
This research received no external funding.
Acknowledgments
This work was supported in part by grants from the Taiwan National Science and Technology Council (NSTC 111-2625-M-309-001 and NSTC 112-2625-M-006-023).
Conflicts of Interest
The authors declare no conflict of interest.
References
- Disaster Management White Paper; Central Disaster Prevention and Response Council: Executive Yuan, Taiwan, 2012.
- Jan, C.D.; Lee, M.H. A debris-flow rainfall-based warning model. Journal of Chinese Soil & Water Conservation 2004, 35, 275–285. [Google Scholar]
- Chen, Y.R.; Tsai, K.J.; Hsieh, S.C.; Ho, Y.L. Evaluation of Landslide Potential due to Land Use in the Slope. Electron. J. Geotech. Eng. 2015, 20, 4277–4292. [Google Scholar]
- Jan, C.D.; Yang, S.Y.; Su, Y.W.; Haung, W.S. Investigation about rainfall-induced shallow landslides in CYL and TWR watersheds, Taiwan. Environ. Earth Sci. 2016, 75, 898. [Google Scholar] [CrossRef]
- Tseng, C.M.; Chen, Y.R.; Wu, S.M. Scale and spatial distribution assessment of rainfall-induced landslides in a catchment with mountain roads. Nat. Hazards Earth Syst. Sci. 2018, 18, 687–708. [Google Scholar] [CrossRef]
- Chen, C.W.; Tung, Y.S.; Liou, J.J.; Li, H.C.; Cheng, C.T.; Chen, Y.M.; Oguchi, T. Assessing landslide characteristics in a changing climate in northern Taiwan. CATENA 2019, 175, 263–277. [Google Scholar] [CrossRef]
- Lee, C.F.; Chou, H.T.; Wei, L.W.; Huang, W.K.; Chi, S.Y.; Chen, S.C.; Huang, W.C. Geomorphic Evolution of The Dong-Ao Peak Landslide, North Eastern Taiwan. Journal of Chinese Soil and Water Conservation 2014, 45, 174–183. [Google Scholar]
- Caracciolo, D.; Arnone, E.; Conti, F.L.; Noto, L.V. Exploiting historical rainfall and landslide data in a spatial database for the derivation of critical rainfall thresholds. Environ. Earth Sci. 2017, 76, 222. [Google Scholar] [CrossRef]
- Chen, S.C.; Wu, C.Y. Establishment of Landslide Susceptibility Early Warning Model in National Forest Areas Based on Geo-intrinsic and Hydro-extrinsic Factors. Journal of Chinese Soil and Water Conservation 2018, 49, 89–97. [Google Scholar]
- Shahabi, H.; Khezri, S.; Ahmad, B.B.; Hashim, M. Landslide susceptibility mapping at central Zab basin, Iran: A comparison between analytical hierarchy process frequency ratio and logistic regression models. Catena 2014, 115, 55–70. [Google Scholar] [CrossRef]
- Dai, F.C.; Lee, C.F.; Ngai, Y.Y. Landslide risk assessment and management: An overview. Engeer. Geo. 2002, 64, 65–87. [Google Scholar] [CrossRef]
- Ayalew, L.; Yamagishi, H. The application of GIS-based logistic regression for landslide susceptibility mapping in the Kakuda-Yahiko Mountains, Central Japan. Geomorphology 2005, 65, 15–31. [Google Scholar] [CrossRef]
- Chau, K.T.; Chan, J.E. Regional bias of landslide data in generating susceptibility maps using logistic regression: case of Hong Kong Island. Landslides 2005, 2, 280–290. [Google Scholar] [CrossRef]
- Chen, Z.; Wang, J. Landslide hazard mapping using logistic regression model in Mackenzie Valley, Canada. Nat. Hazards 2007, 42, 75–89. [Google Scholar] [CrossRef]
- Lee, S.; Pradhan, B. Landslide hazard mapping at Selangor, Malaysia using frequency ratio and logistic regression models. Landslides 2007, 4, 33–41. [Google Scholar] [CrossRef]
- Sun, X.; Chen, J.; Bao, Y.; Han, X.; Zhan, J.; Peng, W. Landslide Susceptibility Mapping Using Logistic Regression Analysis along the Jinsha River and Its Tributaries Close to Derong and Deqin County, Southwestern China. ISPRS Int. J. Geo-Inf 2018, 7, 438. [Google Scholar] [CrossRef]
- Wubalem, A.; Meten, M. Landslide susceptibility mapping using information value and logistic regression models in Goncha Siso Eneses area, northwestern Ethiopia. SN Appl. Sci. 2020, 2, 807. [Google Scholar] [CrossRef]
- Sujatha, E.R.; Sridhar, V. Landslide Susceptibility Analysis: A Logistic Regression Model Case Study in Coonoor, India. Hydrology 2021, 8, 41. [Google Scholar] [CrossRef]
- Seo, K.; Funasaki, M. Relationship between sediment disaster (mainly debris flow damage) and rainfall. Int. J. Erosion Control Eng. 1973, 26, 22–28. [Google Scholar]
- Chen, C.Y.; Chen, T.C.; Yu, F.C.; Yu, W.H.; Tseng, C.C. Rainfall duration and debris-flow initiated studies for real-time monitoring, Environ. Geol. 2005, 47, 715–724. [Google Scholar] [CrossRef]
- ESRI. ArcGIS. 2019. Available online: https://www.esri.com/en-us/home (accessed on 01 September 2019).
- Hosmer, D.W.; Lemeshow, S. Applied Logistic Regression, 2nd ed.Wiley, 2000; ISBN 978-0-471-35632-5. [Google Scholar]
- Cox, D.R. The analysis of binary data. Methuen: London, UK, 1970. [Google Scholar]
- Ohlmacher, G.C.; Davis, J.C. Using multiple logistic regression and GIS technology to predict landslide hazard in northeast Kansas, USA. Engeer. Geo. 2003, 69, 331–343. [Google Scholar] [CrossRef]
- Pingtung County Government, TAIWAN. 2022. Available online: https://www.pthg.gov.tw/en/Default.aspx (accessed on 1 October 2022).
- Central Weather Bureau. 2021. Available online: https://www.cwb.gov.tw/eng/ (accessed on 1 January 2021).
- Central Geological Survey, Ministry of Economic Affairs. 2022. Available online: https://www.moeacgs.gov.tw/ (accessed on 1 January 2022).
- Neipu Household Registration Office, Pingtung County Government, TAIWAN. 2022. Available online: https://www.pthg.gov.tw/neipu-house/Default.aspx (accessed on 11 November 2022).
- Sandimen Township Office, Pingtung County Government, TAIWAN. 2022. Available online: https://www.pthg.gov.tw/sandimen/Default.aspx (accessed on 11 November 2022).
- Wutai Township Office, Pingtung County Government, TAIWAN. 2022. Available online: https://www.wutai.gov.tw/index.php (accessed on 11 November 2022).
- Maolin National Scenic Area Administration, Tourism Bureau, MOTC. 2022. Available online: https://www.maolin-nsa.gov.tw/EN/ (accessed on 11 November 2022).
- Lin, C.W.; Shieh, C.J.; Yuan, B.D.; Shieh, Y.C.; Huang, M.L.; Lee, S.Y. Impact of Chi-Chi earthquake on the occurrenceof landslides and debris flows: example from the Chenyulan River watershed, Nantou, Taiwan, Eng. Geol. 2004, 71, 49–61. [Google Scholar] [CrossRef]
- ERDAS. ERDAS IMAGINE® Tour Guide; ERDAS World Headquarter: Atlanta, GA, USA, 2011. [Google Scholar]
- Verbyla, D.L. Satellite Remote Sensing of Natural Resources; CRC Press: New York, NY, USA, 1995. [Google Scholar]
- Cohen, J. A coefficient of agreement for nominal scales. Educ. Psychol. Meas. 1960, 20, 37–46. [Google Scholar] [CrossRef]
- Chen, Y.R.; Chen, J.W.; Hsieh, S.C.; Ni, P.N. The Application of Remote Sensing Technology to the Interpretation of Land Use for Rainfall-Induced Landslides Based on Genetic Algorithms and Artificial Neural Networks. IEEE J. Sel. Top. Appl. Earth Obs. Remote Sens 2009, 2, 87–95. [Google Scholar] [CrossRef]
- Regulations of soil and water conservation, Soil and Water Conservation Bureau, 2022.
- ISRM. Rock Characterization, Testing and Monitoring; Pergamon Press: Oxford, UK, 1981. [Google Scholar]
- Water Resources Agency, Ministry of Economic Affairs. 2021. Available online: https://www.wra.gov.tw/ (accessed on 1 January 2021).
- SPSS. SPSS 14.0 Brief Guide; SPSS Inc.: Chicago, IL, USA, 2005. [Google Scholar]
Figure 1.
Study area.
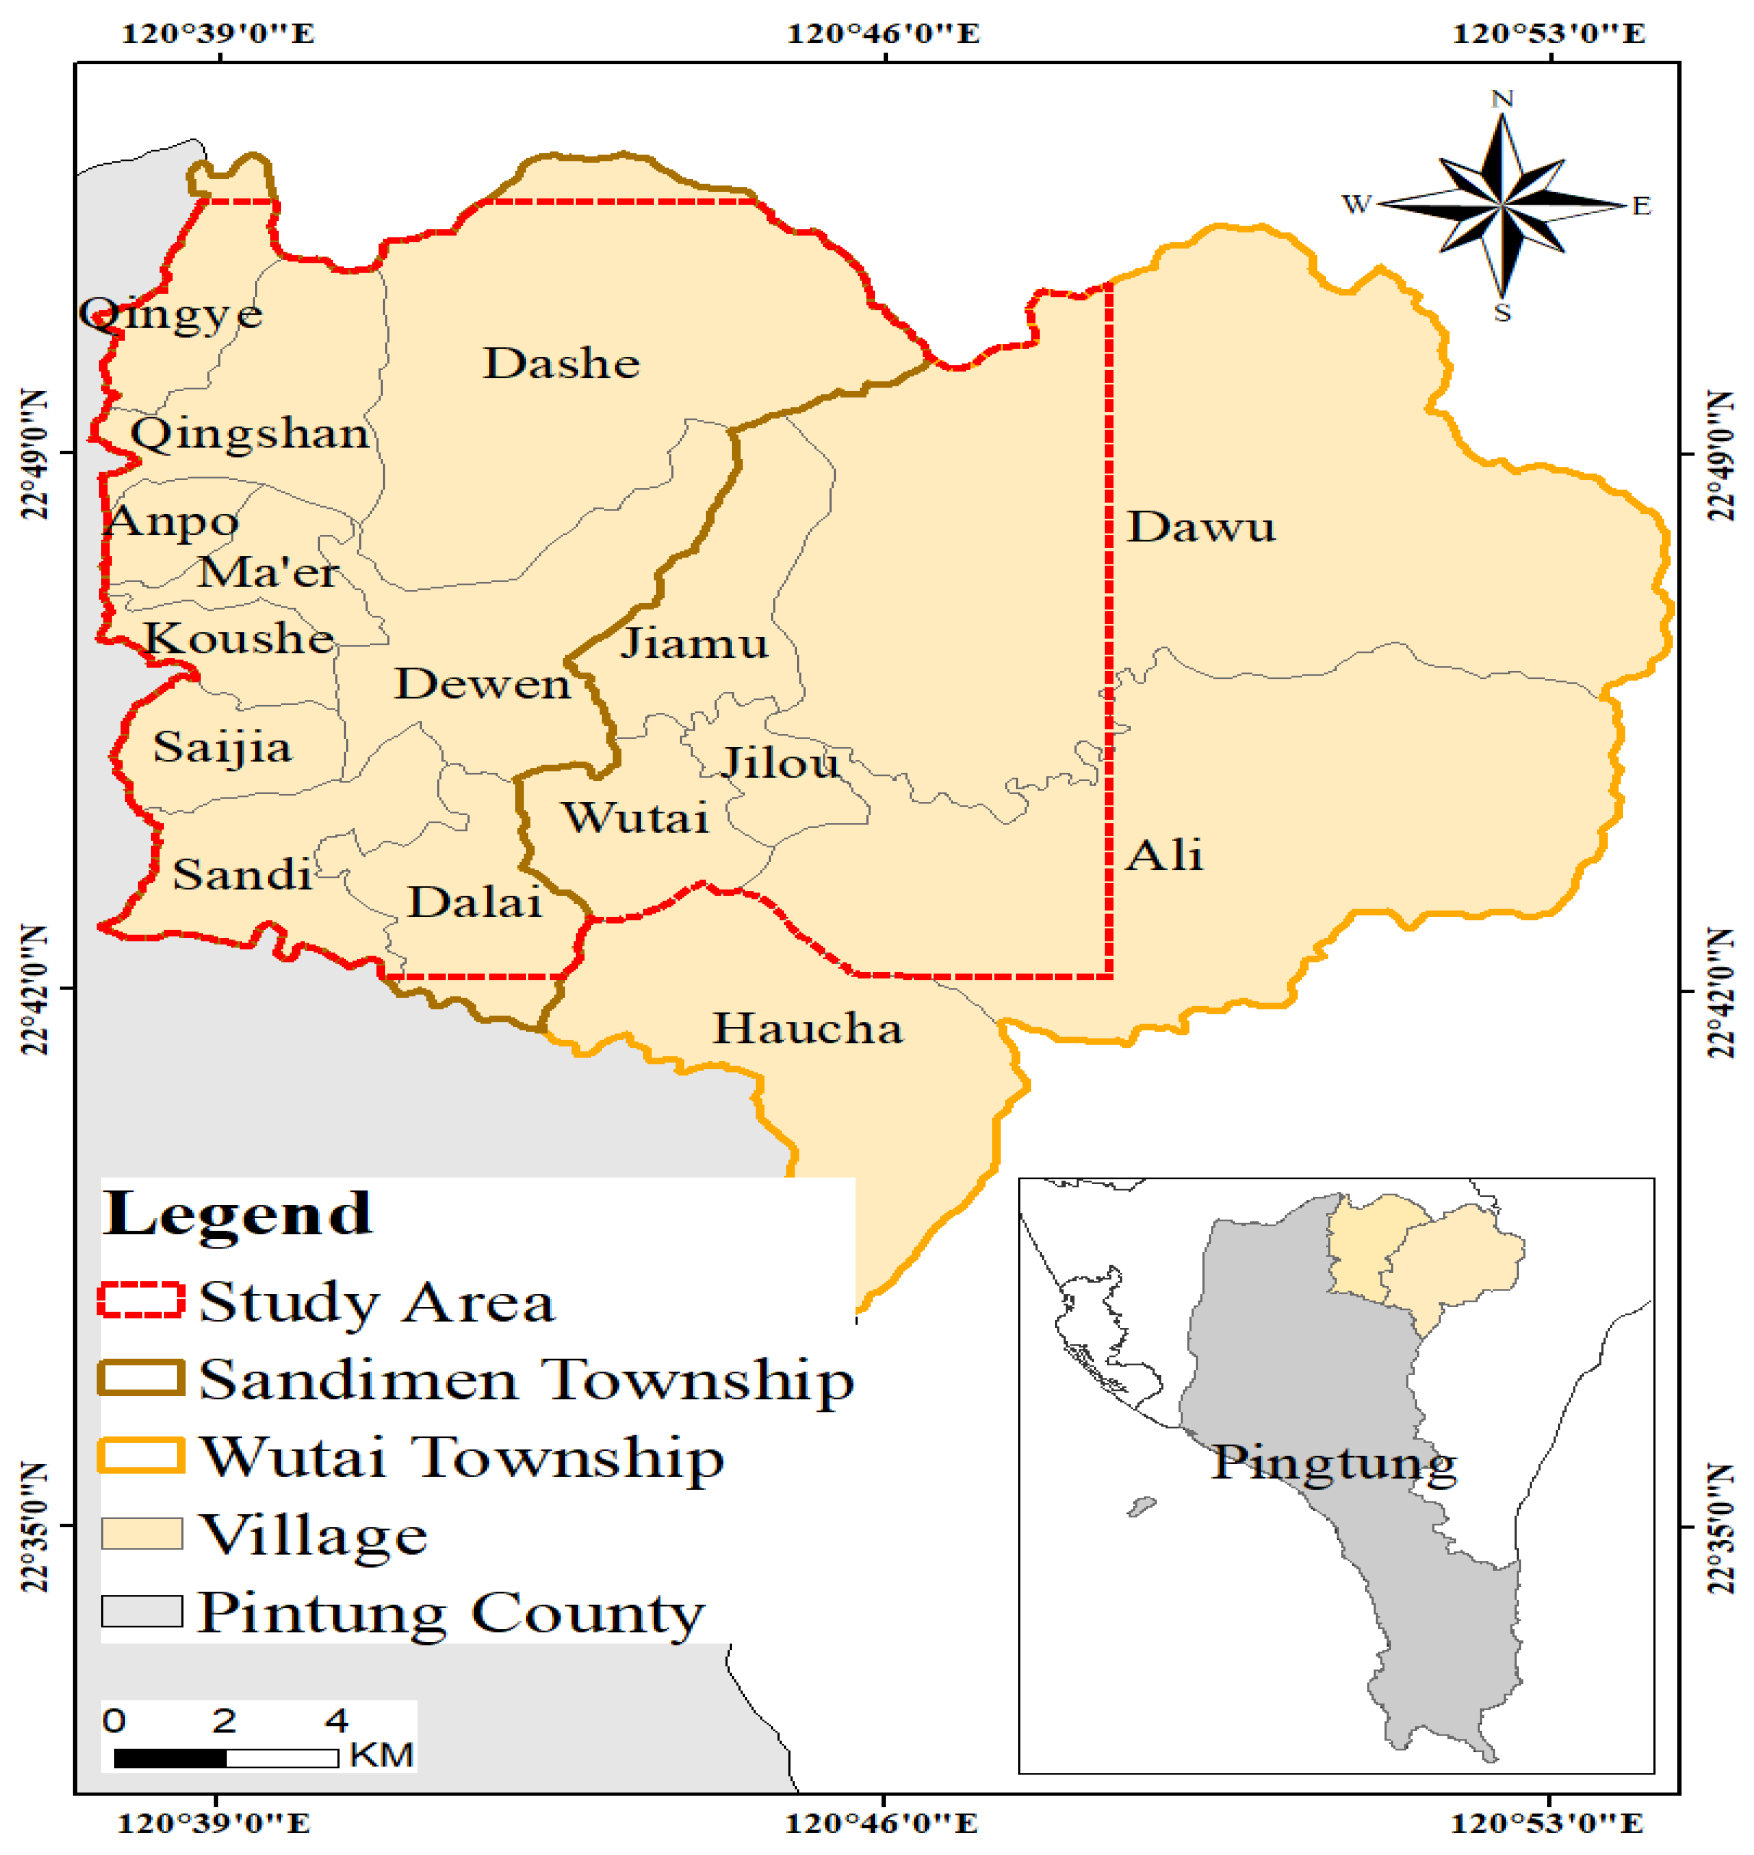
Figure 2.
Current land use in the study area.
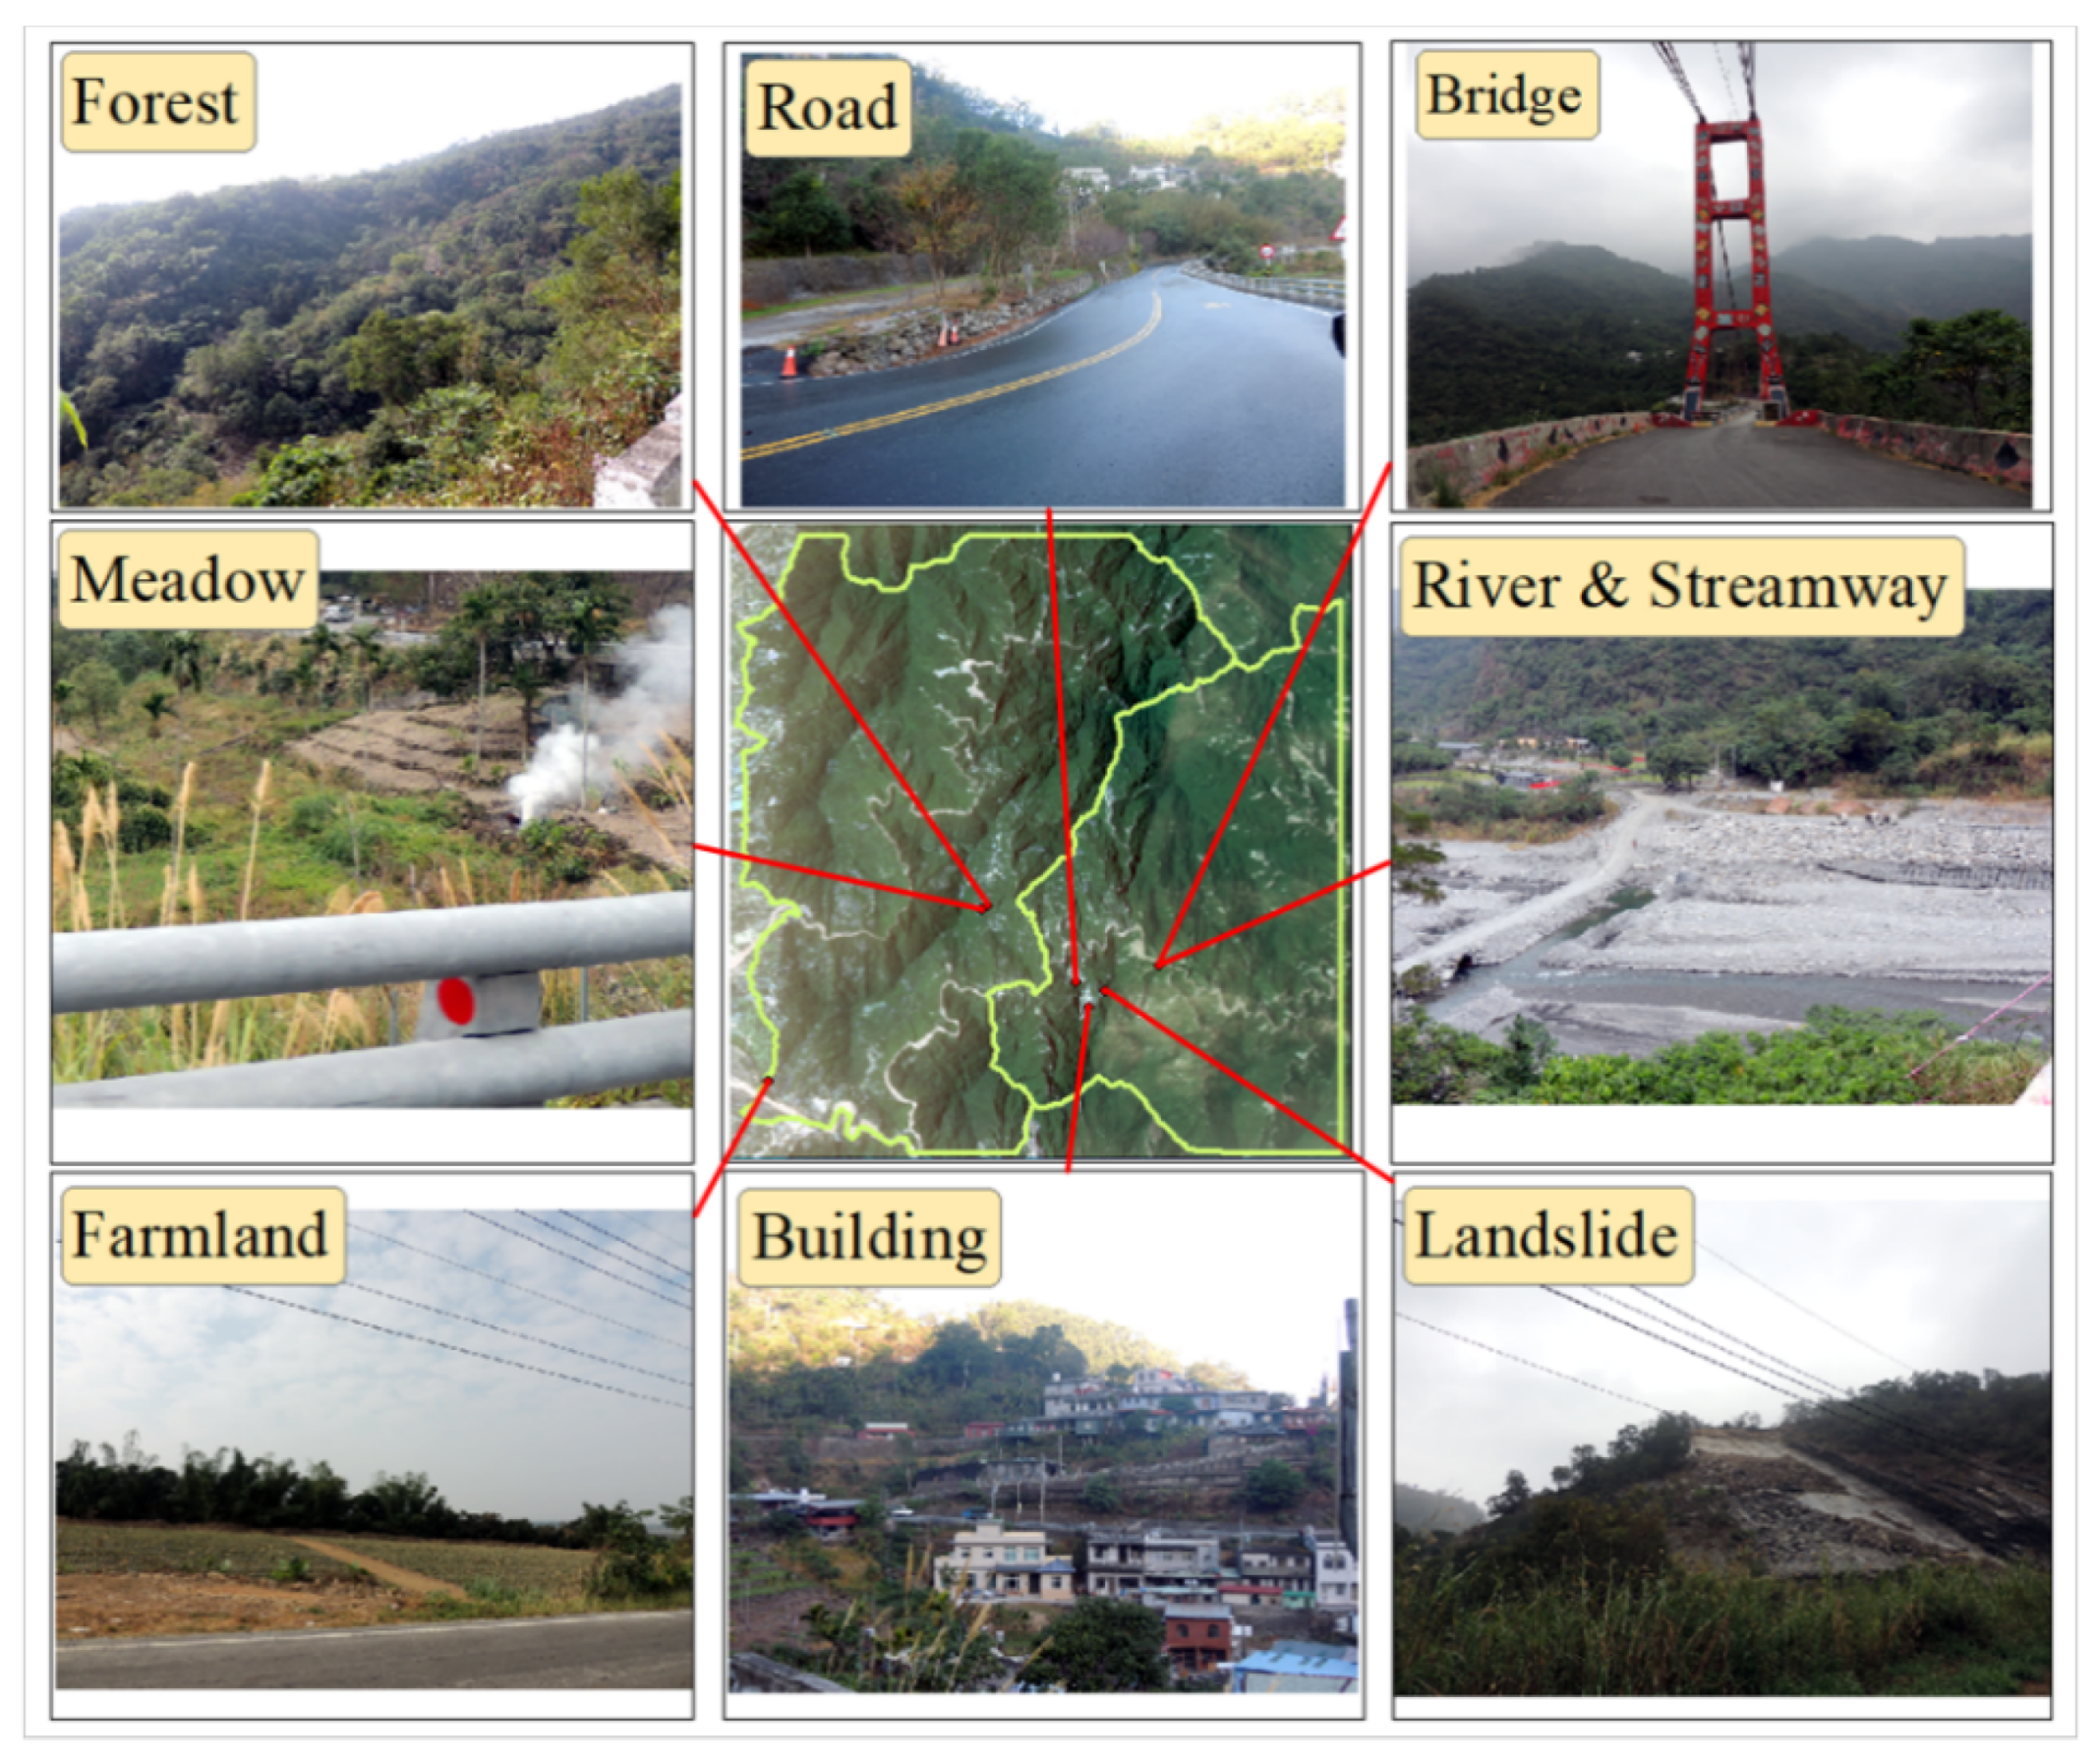
Figure 3.
Images obtained before and after various rainfall events.
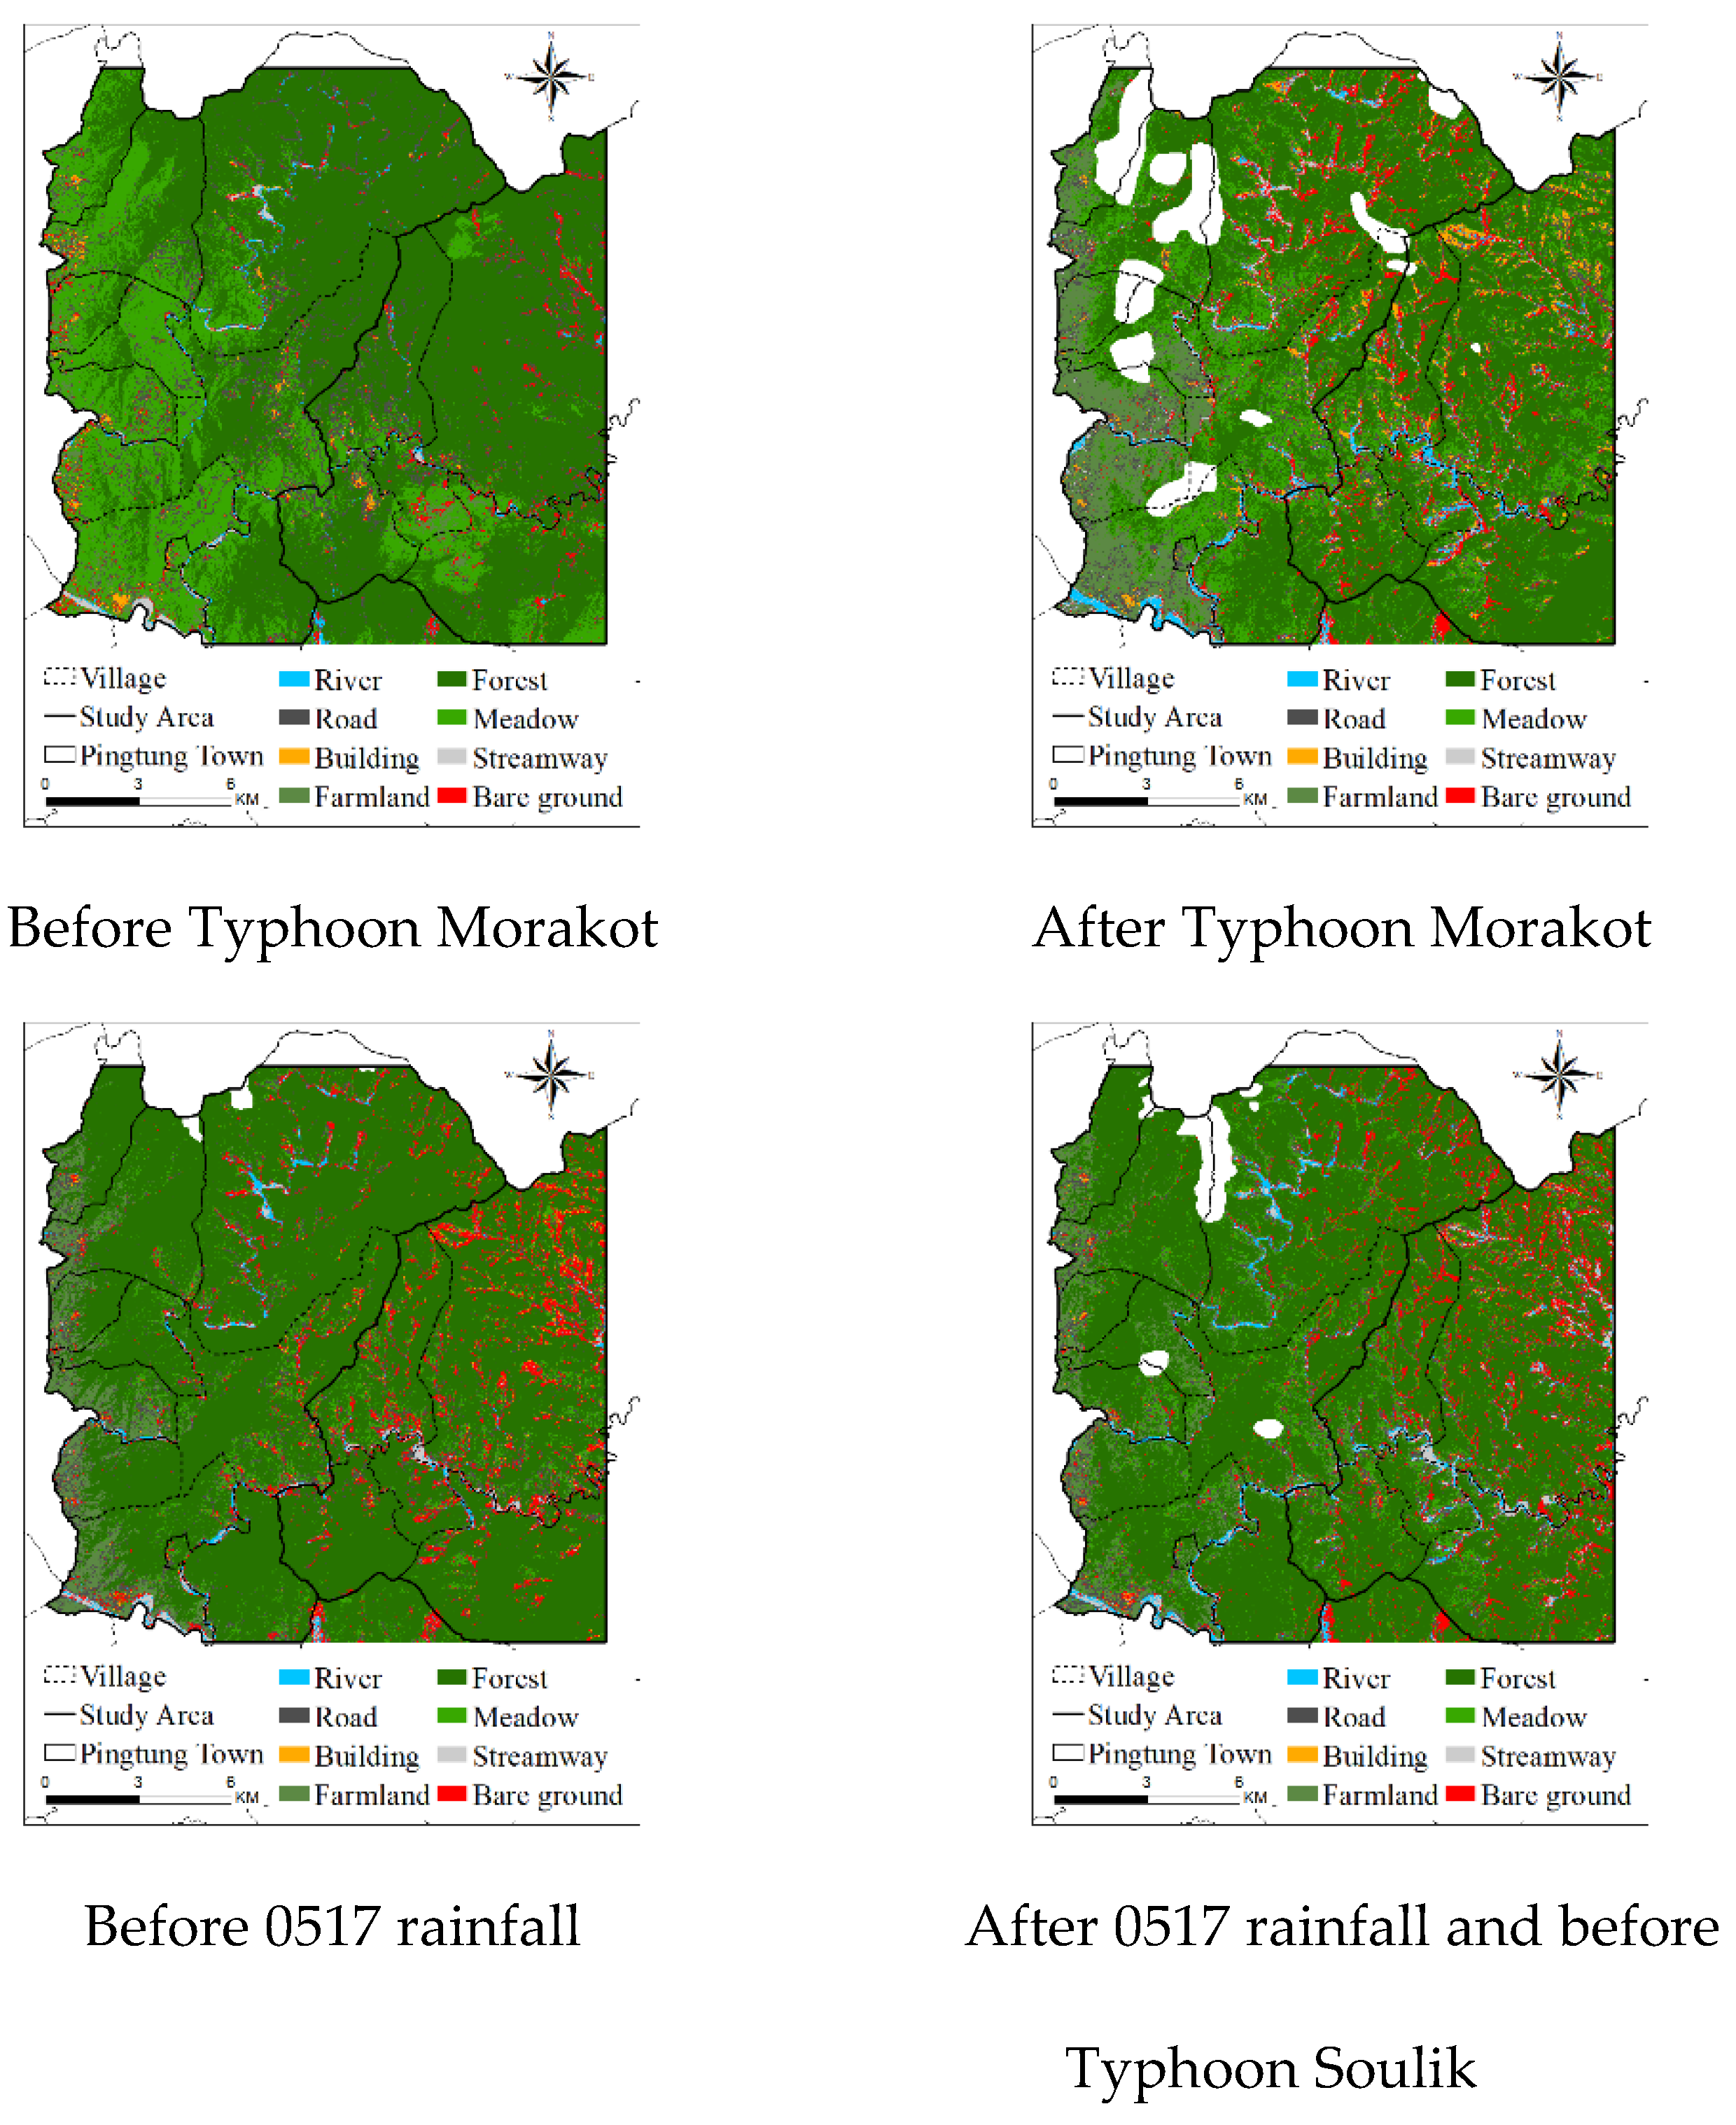
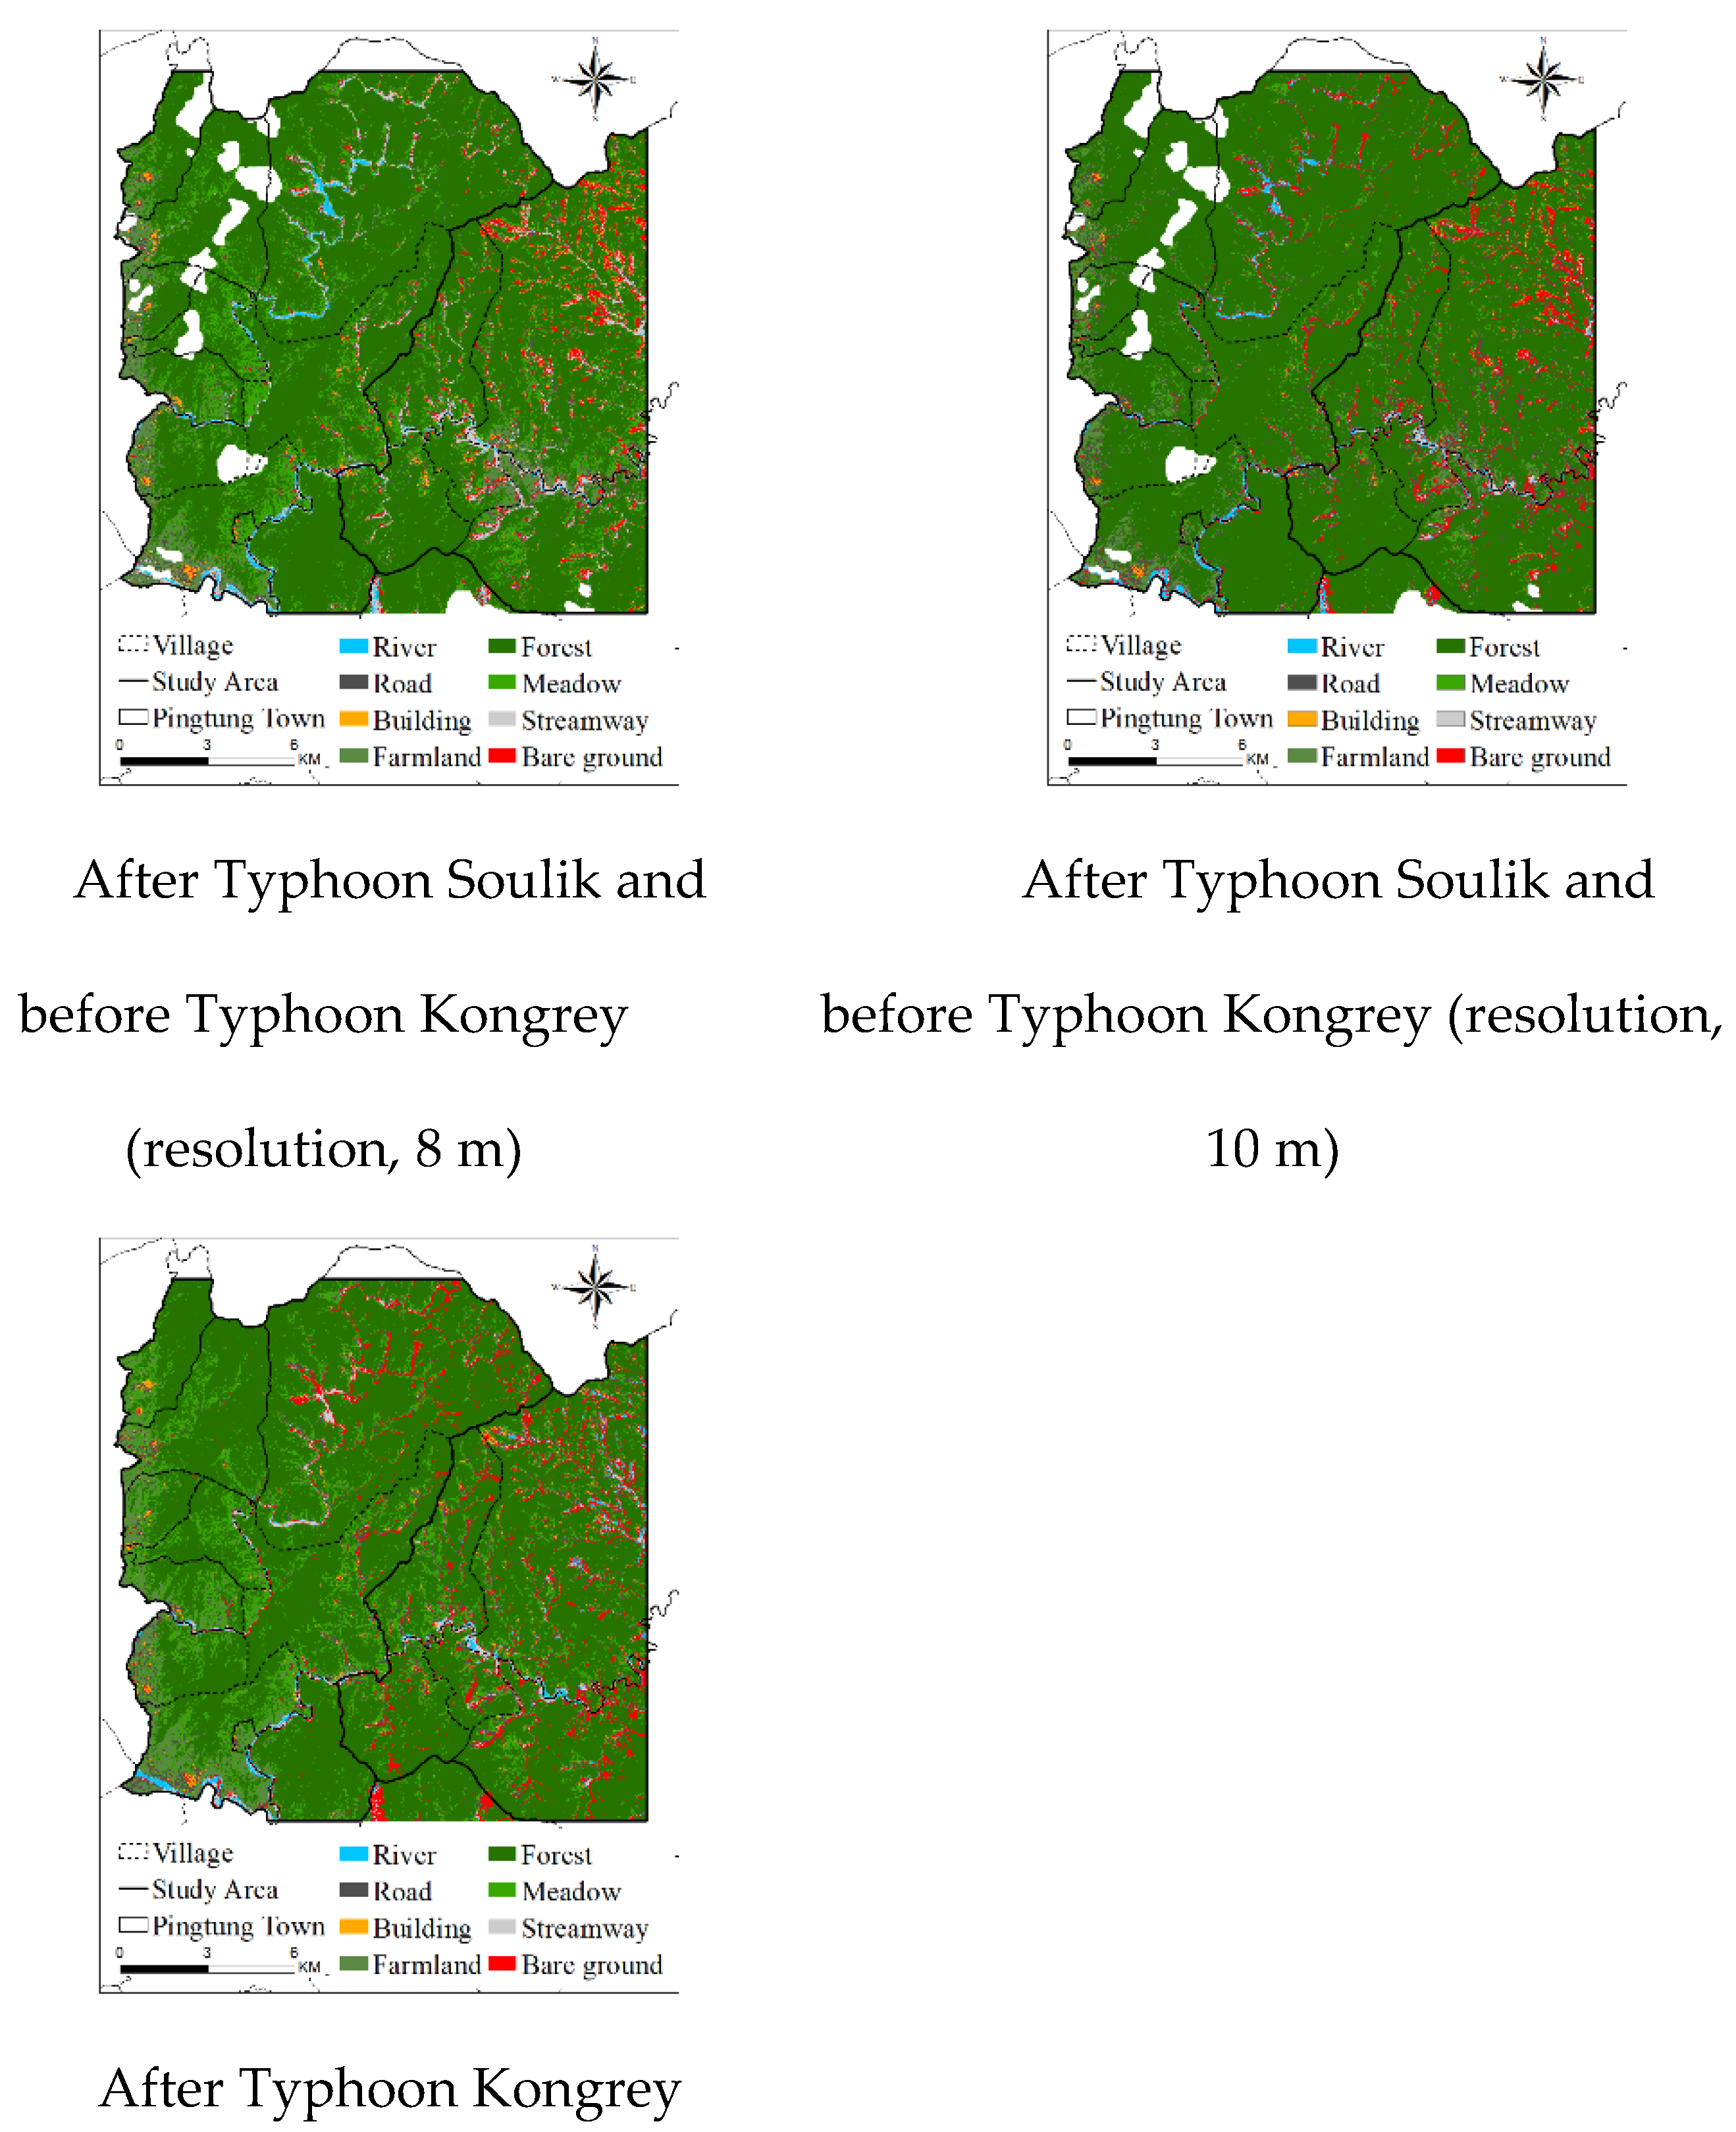
Figure 4.
Distribution map of landslides occurring after various rainfall events.
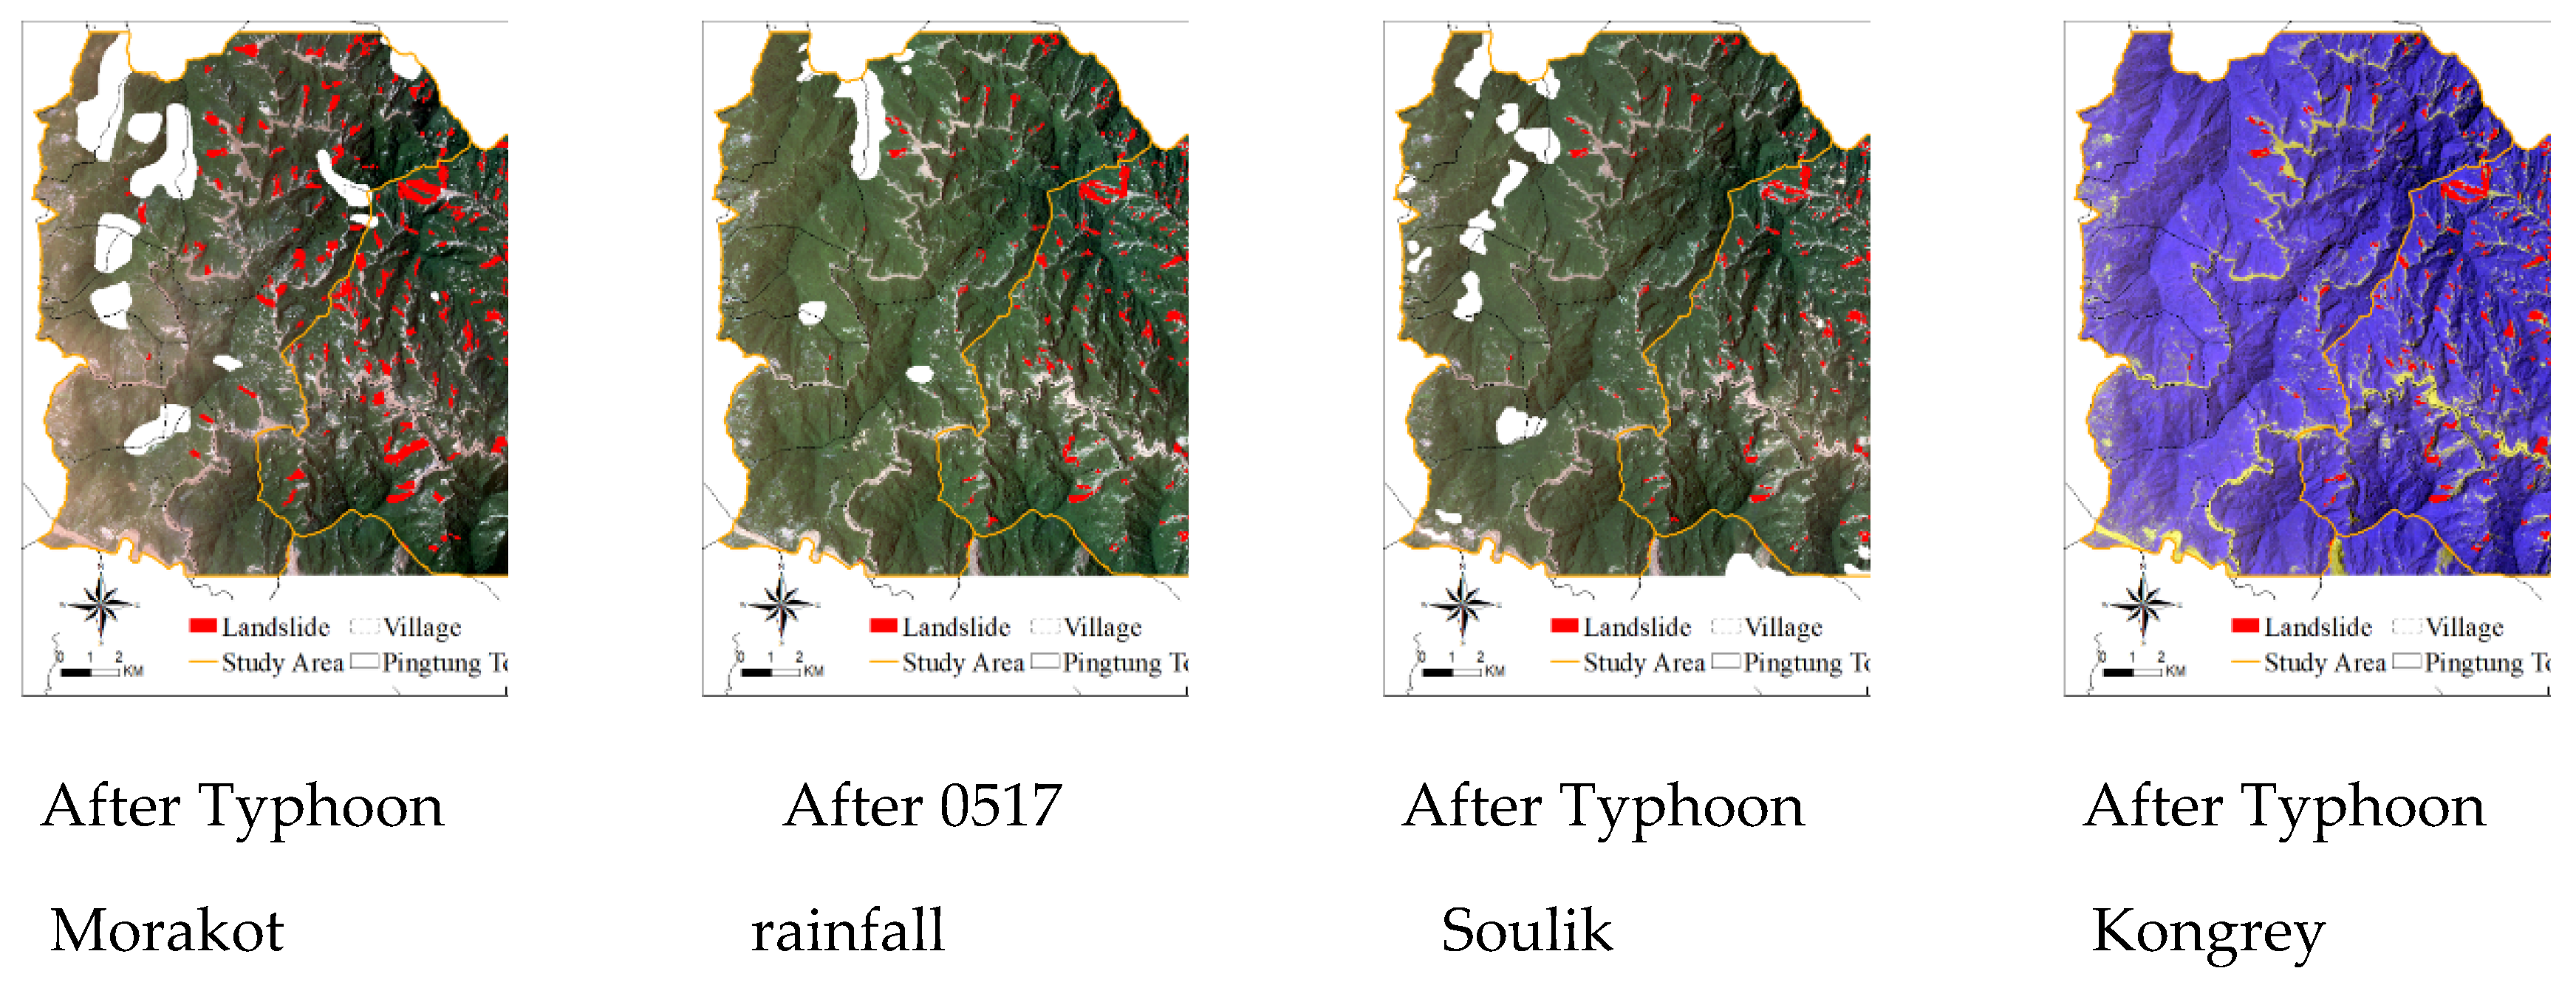
Figure 5.
Slope environmental strength potential index versus rainfall trigger index.
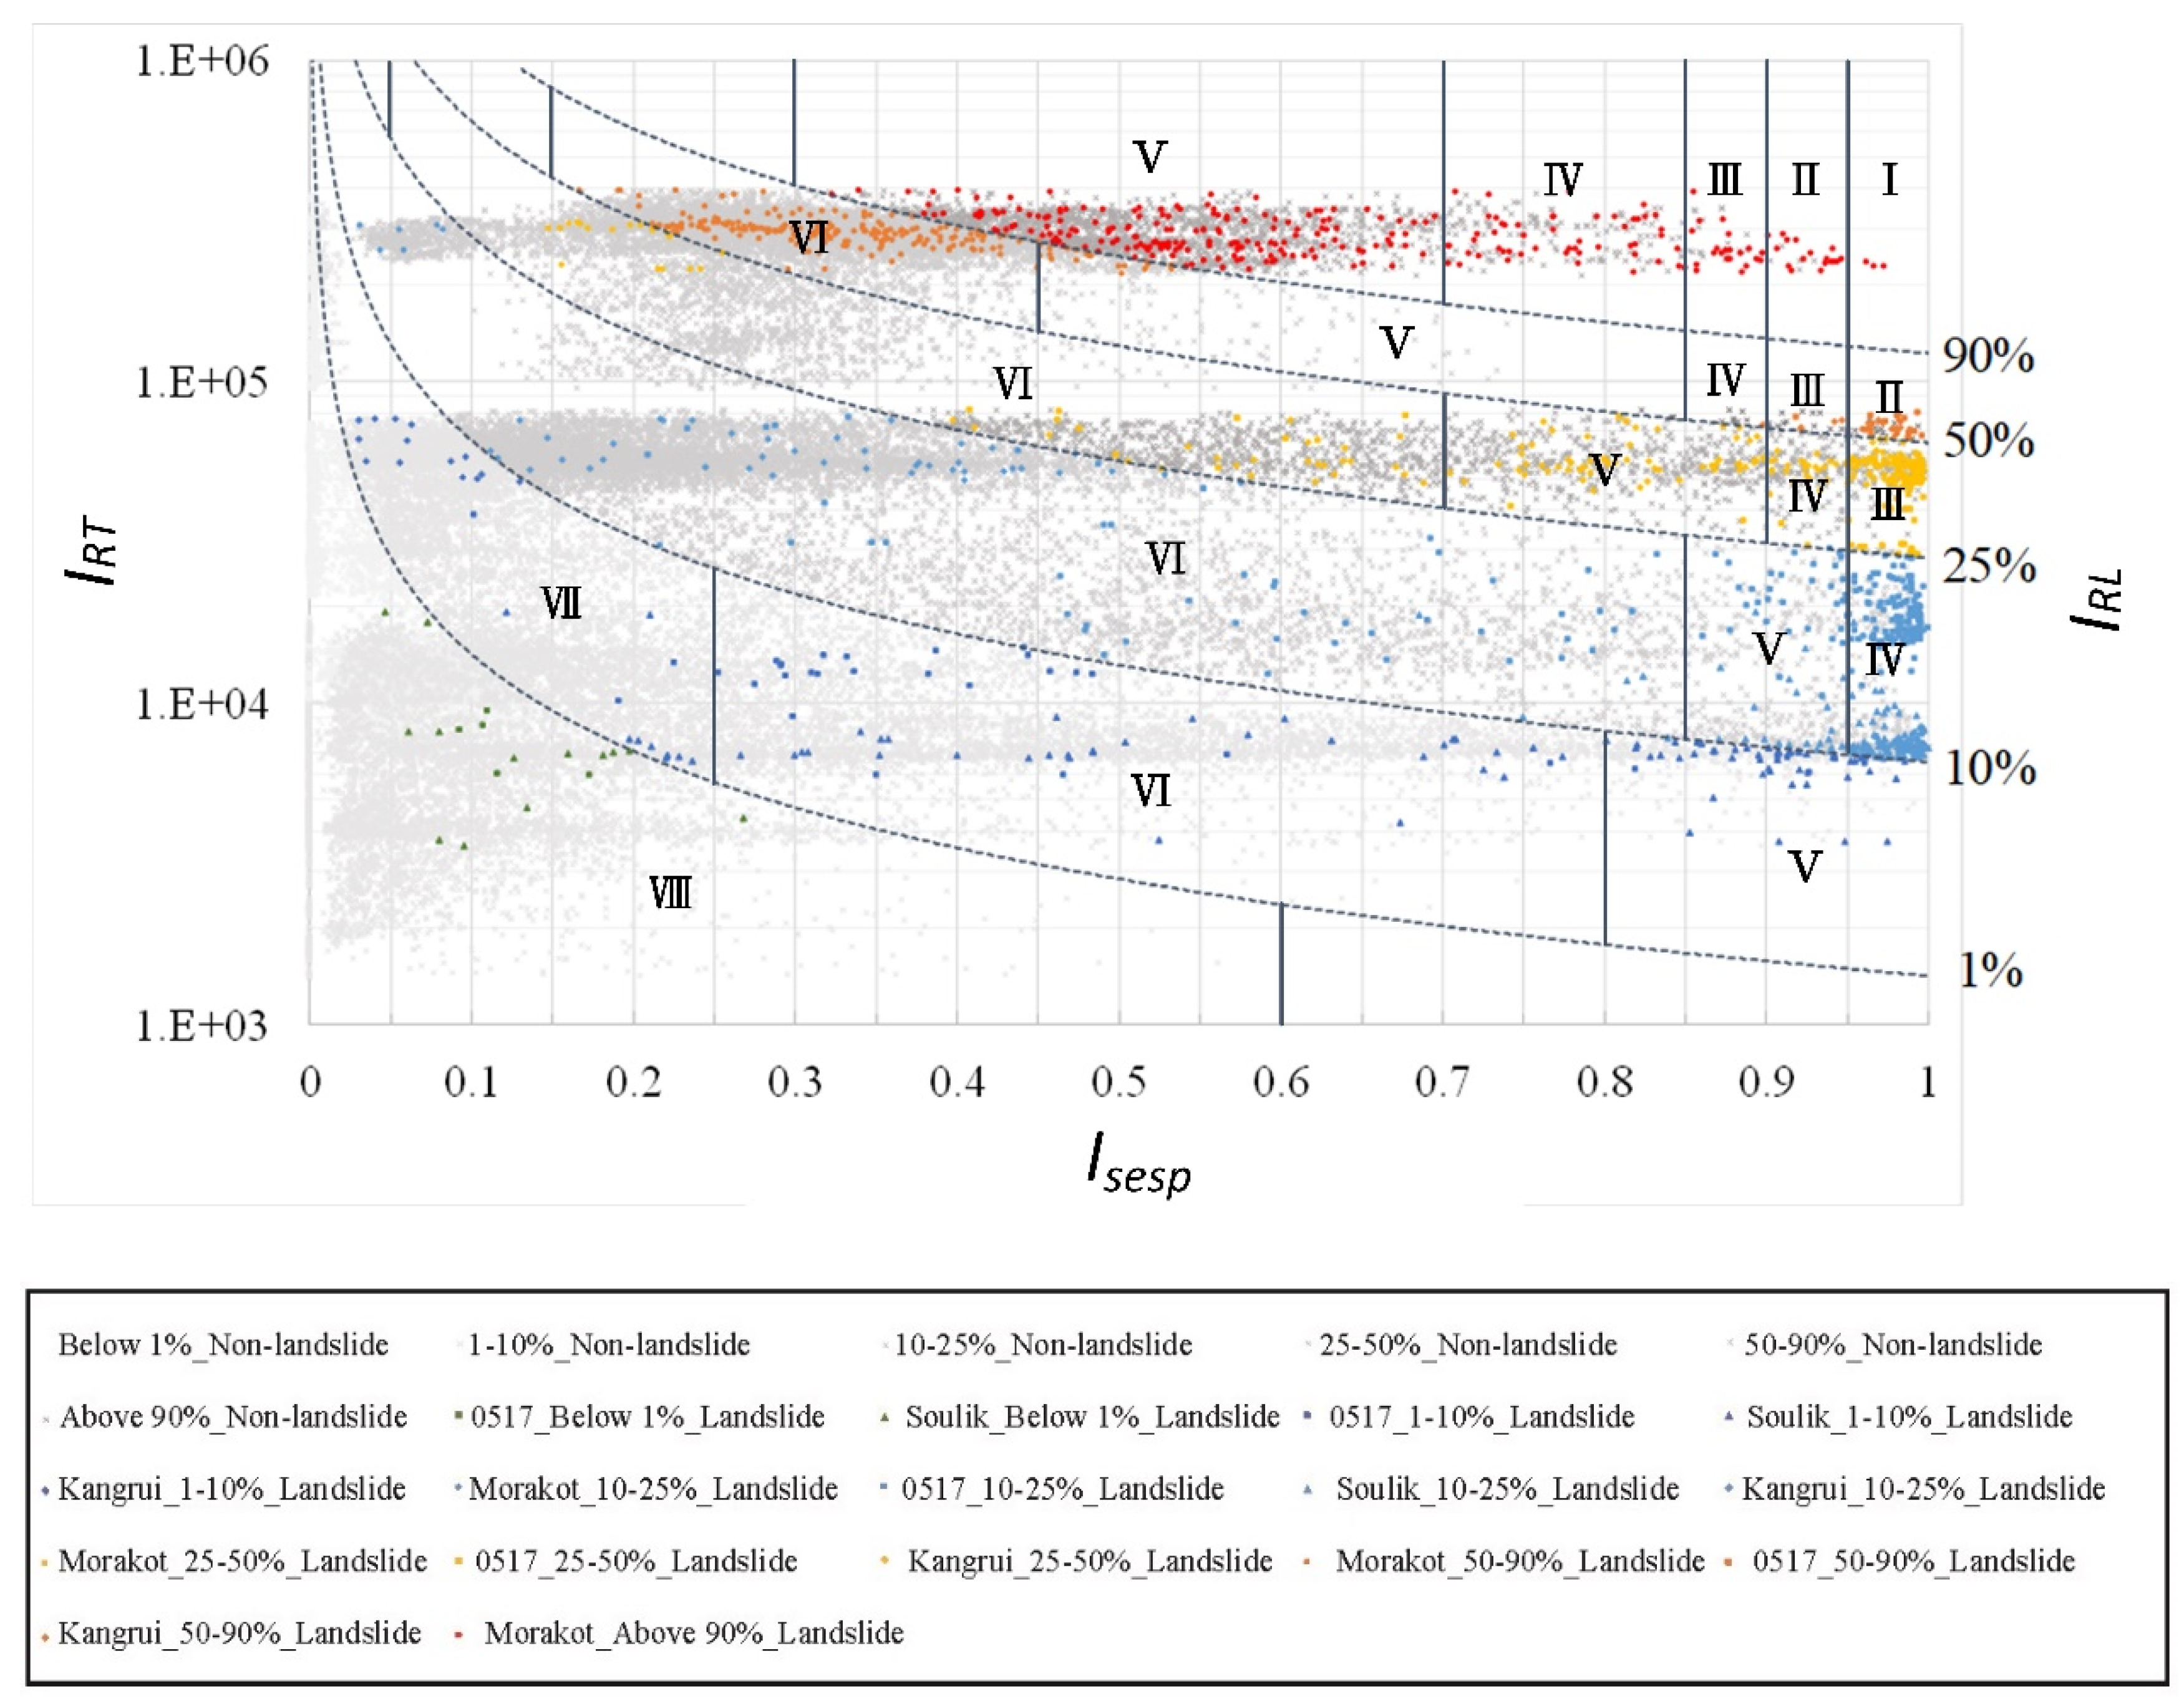
Figure 6.
Potential maps of landslide hazards to land use after various rainfall events.
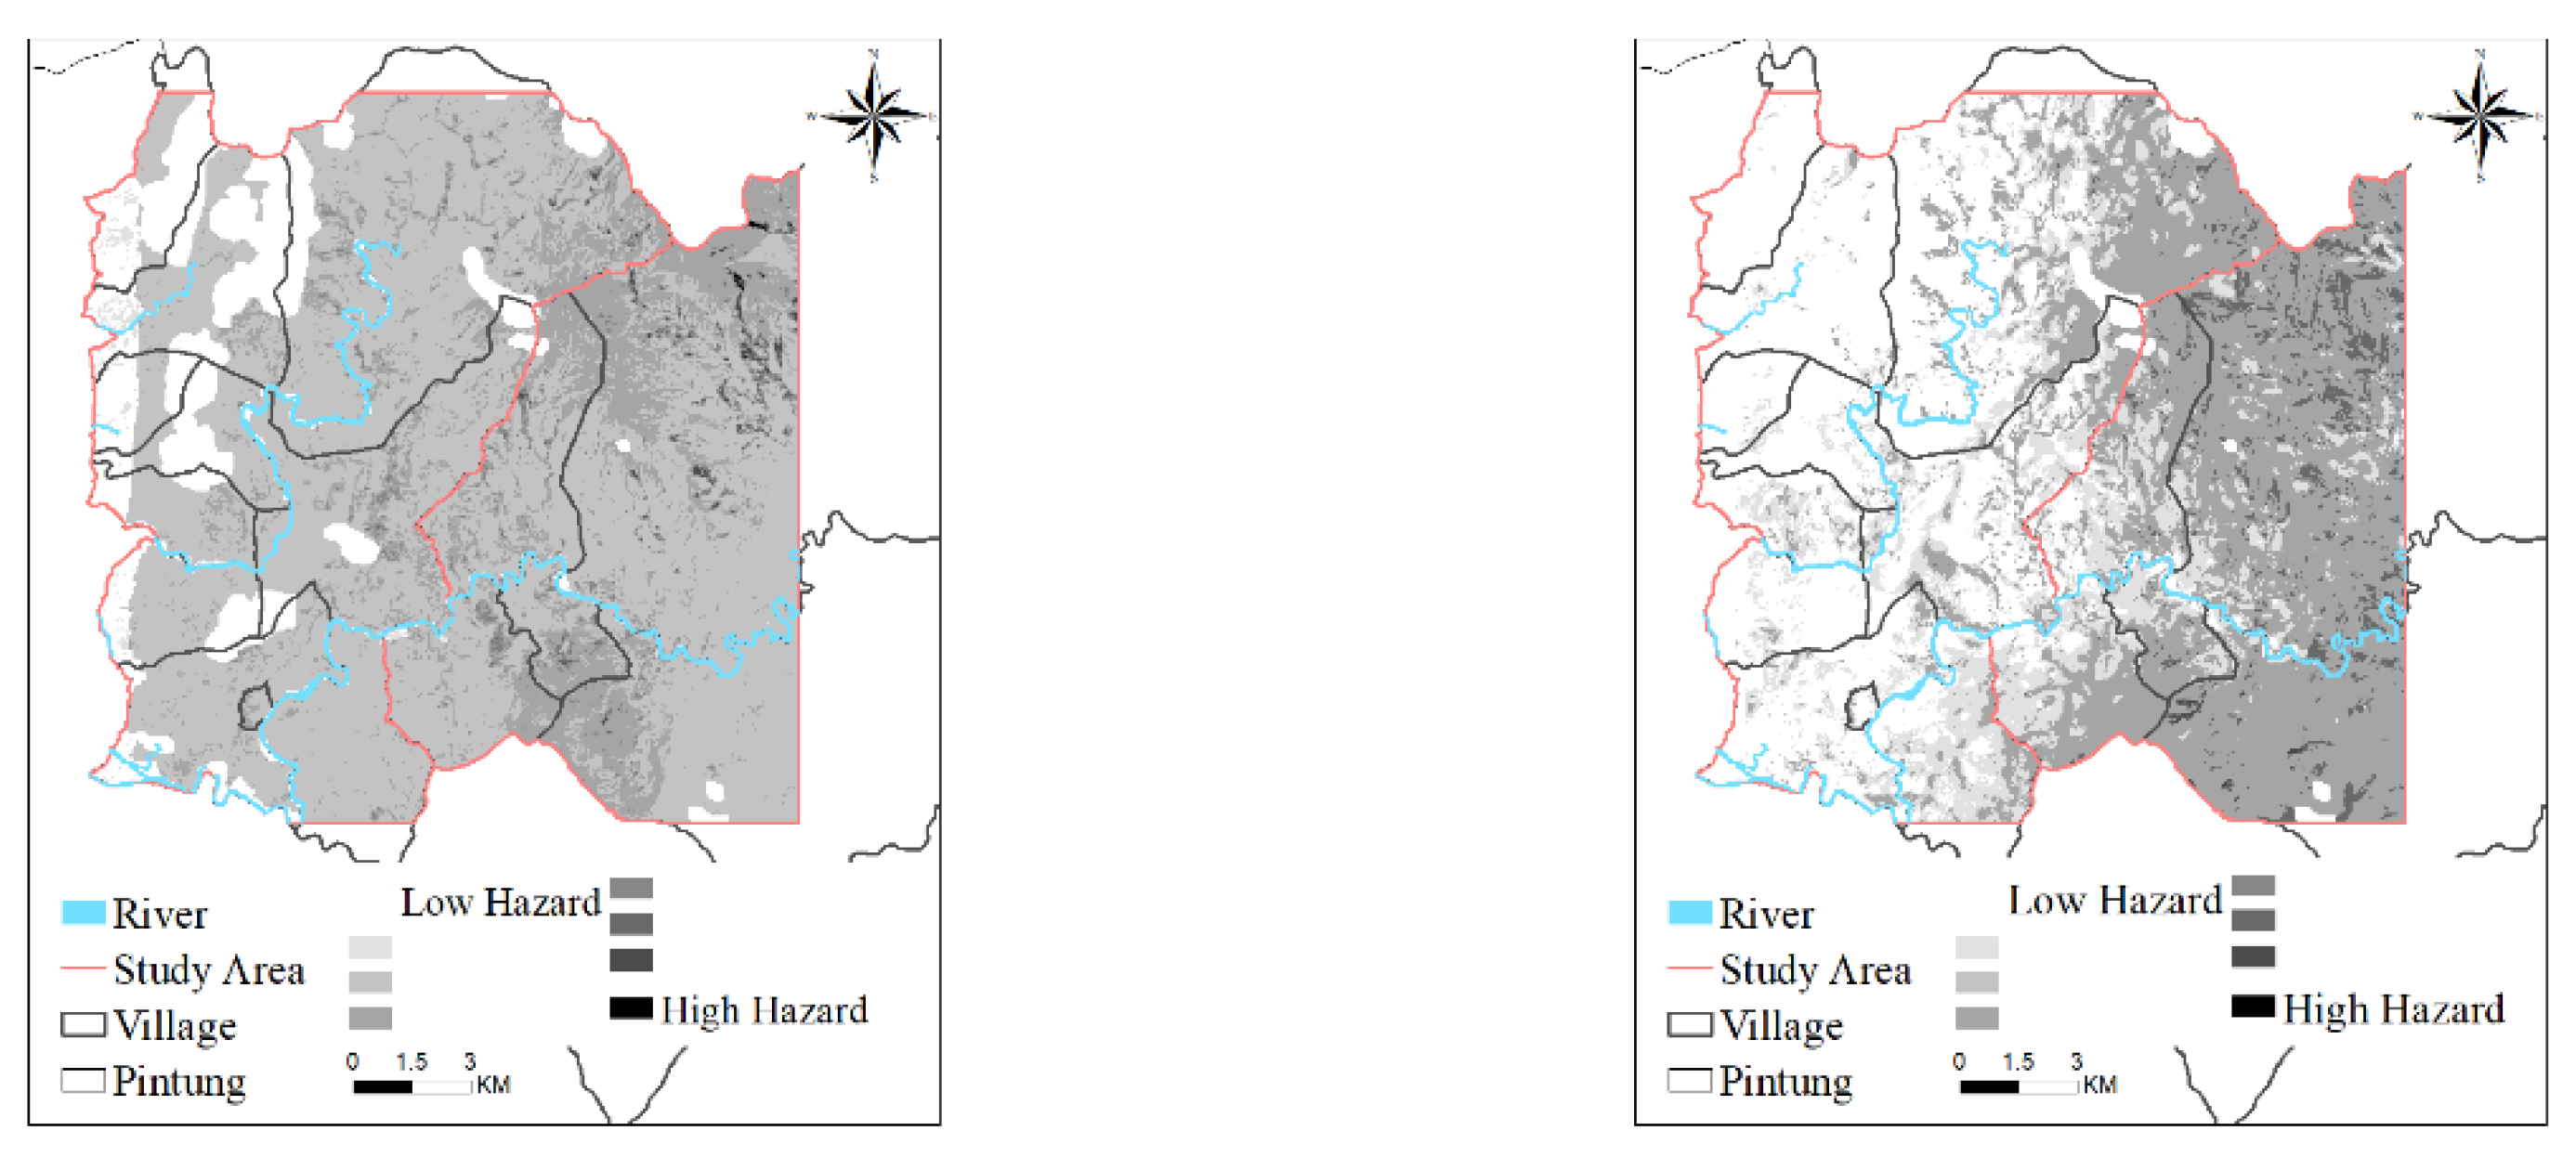
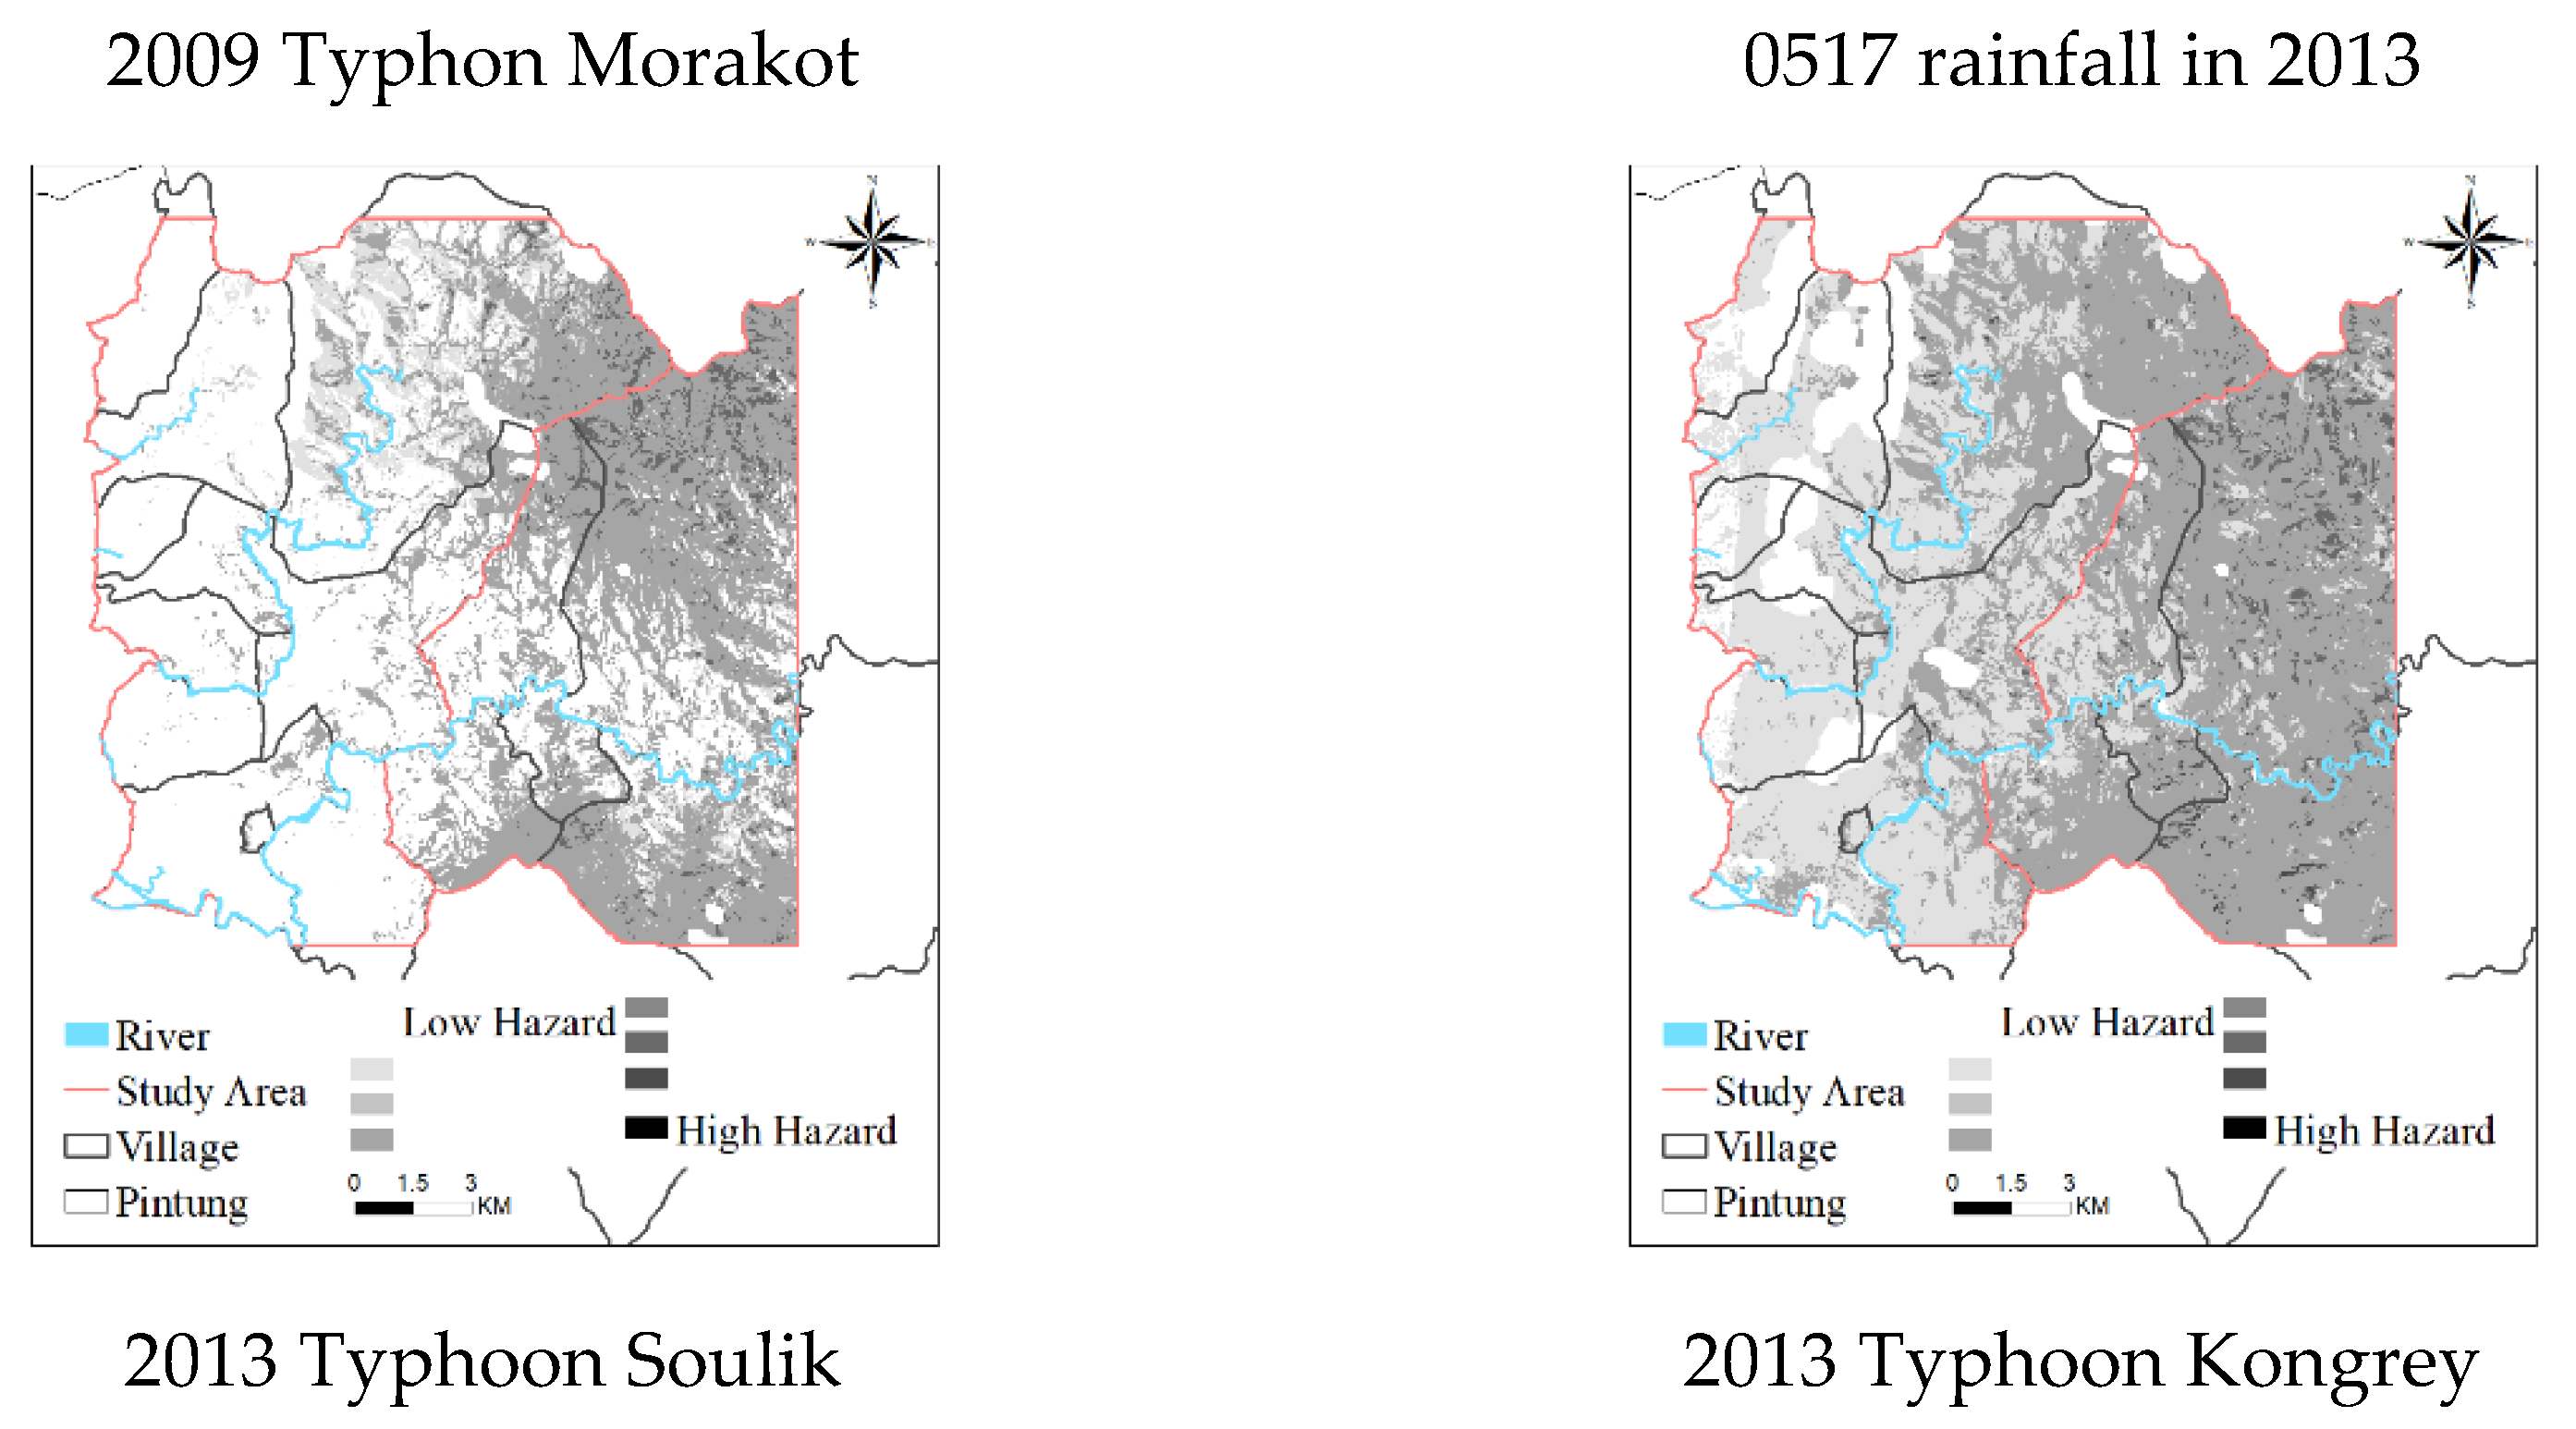

Table 1.
Basic satellite imagery data.
| Image Shooting Date | Before/after Event | Image Resolution | Type | Location | X TWD97 |
Y TWD97 |
| 2009.07.22 | Before Typhoon Morakot | 8m×8m | FS-2 | upper left bottom right |
211584 230432 |
2530416 2511176 |
| 2009.05.09 | ||||||
| 2009.08.15 | After Typhoon Morakot | 8m×8m | ||||
| 2010.01.11 | ||||||
| 2013.01.15 | Before 0517 Rainfall | 8m×8m | upper left bottom right |
211584 230424 |
2530408 2511184 |
|
| 2013.01.19 | ||||||
| 2013.06.03 | After 0517 Rainfall Before Typhoon Soulik |
8m×8m | ||||
| 2013.06.29 | ||||||
| 2013.08.27 | After Typhoon Soulik Before Typhoon Kongrey |
8m×8m | ||||
| 2013.09.11 | ||||||
| 2013.09.09 | After Typhoon Kongrey | 10m×10m | SPOT-5 | upper left bottom right |
211570 230440 |
2530430 2511160 |
Table 2.
Coefficients of agreement and overall accuracies of satellite image interpretation results.
Table 2.
Coefficients of agreement and overall accuracies of satellite image interpretation results.
| Year | Rainfall Event | Resolution | Kappa | OA(%) |
|---|---|---|---|---|
| 2009 | Before Typhoon Morakot | 8m | 0.66 | 70.0 |
| After Typhoon Morakot | 8m | 0.70 | 73.0 | |
| 2013 | Before 0517 rainfall | 8m | 0.69 | 72.5 |
| After 0517 rainfall and before Typhoon Soulik | 8m | 0.70 | 73.3 | |
| After Typhoon Soulik and Before Typhoon Kongrey | 8m | 0.78 | 79.5 | |
| After Typhoon Soulik and Before Typhoon Kongrey | 10m | 0.77 | 79.5 | |
| After Typhoon Kongrey | 10m | 0.74 | 76.5 |
Table 3.
Elevation codes.
| Grade Range of Elevation | Code |
| Above 2,101 | 7 |
| 1,751-2,100 | 6 |
| 1,401-1,750 | 5 |
| 1,051-1,400 | 4 |
| 701-1,050 | 3 |
| 351-700 | 2 |
| Below 350 | 1 |
Table 4.
Slope codes.
| Slope Grade | Grade Range of Slope (%) | Code |
| 7 | Above 100 | 7 |
| 6 | 50-100 | 6 |
| 5 | 40-55 | 5 |
| 4 | 30-40 | 4 |
| 3 | 15-30 | 3 |
| 2 | 5-15 | 2 |
| 1 | Below 5 | 1 |
Table 5.
Slope roughness codes.
| Grade Range of Slope Roughness | Code |
| Above 63.34 | 7 |
| 56.80-63.33 | 6 |
| 49.47-56.79 | 5 |
| 41.02-49.46 | 4 |
| 31.21-41.01 | 3 |
| 18.16-31.20 | 2 |
| Below 18.15 | 1 |
Table 6.
Aspect codes.
| Aspect | Inclination Angle | Code |
| Flat ground | — | 1 |
| Northeast | 22.5°-67.5° | 2 |
| East | 67.5°-112.5° | 3 |
| Southeast | 112.5°-157.5° | 4 |
| South | 157.5°-202.5° | 5 |
| Southwest | 202.5°-247.5° | 6 |
| West | 247.5°-292.5° | 5 |
| Northwest | 292.5°-337.5° | 4 |
| North | 337.5°-0° 0°-22.5° |
3 |
Table 7.
Surface roughness codes.
| Grade Range of Surface Roughness | Code |
| Above 2,298.55 | 7 |
| 2,114.26-2,298.54 | 6 |
| 1,849.33-2,114.25 | 5 |
| 1,457.87-1,849.32 | 4 |
| 957.51-1,457.86 | 3 |
| 417.63-957.50 | 2 |
| Below 417.62 | 1 |
Table 8.
Codes corresponding to the distance of an area from a water body.
| Grade Range of Distance from the River | Code |
| Below 350m | 7 |
| 351-700m | 6 |
| 701-1,050m | 5 |
| 1,051-1,400m | 4 |
| 1,401-1,750m | 3 |
| 1,751-2,100m | 2 |
| Above 2,101m | 1 |
Table 9.
Scores of various slope disturbance factors.
| Slope disturbance factor | Forest Density | Grassland Density | Farmland Planting Rate | Road Density | Building Density | Bare Density |
| Score | 1 | 2 | 3 | 4 | 5 | 6 |
Table 10.
EAR of each station after various rainfall events.
| Management Unit | Station Code | Station Name | EAR (mm) | |||
| Morakot | 0517 Rainfall | Soulik | Kongrey | |||
| CWB | C0R100 | Weiliaoshan | 1,437.03 | 85.46 | 248.38 | 417.93 |
| C0R140 | Majia | 882.32 | – | – | – | |
| C0S680 | Hongyeshan | 337.62 | 46.40 | 154.62 | 38.69 | |
| C1R120 | Shangdewun | 1,745.22 | 121.64 | – | 378.98 | |
| C1V340 | Dajin | – | 168.74 | 129.19 | – | |
| C1S820 | Jinfeng | 298.88 | 19.97 | 201.45 | 93.82 | |
| C0R590 | Ligang | 466.82 | – | – | 233.36 | |
| C0V310 | Meinong | 312.16 | 138.47 | – | 648.74 | |
| C1R110 | Gusia | 492.67 | 269.31 | 87.05 | 263.33 | |
| WRA | 01S210 | Zhiben-5 | 91.57 | 16.49 | 130.31 | 54.73 |
| 01Q910 | Ali | 1205 | 698.56 | 141.25 | 585.02 | |
| 01Q930 | Sandimen | 552.93 | 146.85 | 42.03 | 245.55 | |
Table 11.
I3R,max of each station after various rainfall events.
| Management Unit | Station Code | Station Name | I3R,max (mm/3hrs) | |||
| Morakot | 0517 Rainfall | Soulik | Kongrey | |||
| CWB | C0R100 | Weiliaoshan | 274 | 68.5 | 78 | 183.5 |
| C0R140 | Majia | 194 | – | – | – | |
| C0S680 | Hongyeshan | 75 | 27.5 | 52.5 | 21 | |
| C1R120 | Shangdewun | 206 | 83 | – | 153.5 | |
| C1V340 | Dajin | – | 84 | 81 | – | |
| C1S820 | Jinfeng | 199.5 | 12 | 108 | 25 | |
| C0R590 | Ligang | 154.5 | – | – | 97 | |
| C0V310 | Meinong | 114.5 | 61 | – | 176.5 | |
| C1R110 | Gusia | 192 | 54 | 46.5 | 82 | |
| WRA | 01S210 | Zhiben-5 | 78 | 15 | 81 | 14 |
| 01Q910 | Ali | 286 | 117 | 65 | 131 | |
| 01Q930 | Sandimen | 171 | 60 | 33 | 107 | |
Table 12.
Correlations between slope environmental strength potential factors.
| Elevation | Slope | Slope Roughness | Surface Roughness | IDC | ||
| Elevation | Correlation | 1 | ||||
| Significance (Two-tailed) | ||||||
| N | 170,651 | |||||
| Slope | Correlation | .299** | 1 | |||
| Significance (Two-tailed) | .000 | |||||
| N | 170,651 | 170,651 | ||||
| Slope Roughness | Correlation | .473** | .731** | 1 | ||
| Significance (Two-tailed) | .000 | .000 | ||||
| N | 170,651 | 170,651 | 170,651 | |||
| Surface Roughness | Correlation | 1.000** | .299** | .473** | 1 | |
| Significance (Two-tailed) | .000 | .000 | .000 | |||
| N | 170,651 | 170,651 | 170,651 | 170,651 | ||
| IDC | Correlation | -.369** | -.282** | -.363** | -.369** | 1 |
| Significance (Two-tailed) | .000 | .000 | .000 | .000 | ||
| N | 170,651 | 170,651 | 170,651 | 170,651 | 170,651 | |
| **. Correlation is significant at level 0.01 (two-tailed). | ||||||
Table 13.
Errors in the evaluation of Typhoon Morakot.
| Training | Testing | Overall | ||||||||
| Predicted | Accuracy (%) | Predicted | Accuracy (%) | Predicted | Accuracy (%) | |||||
| Nonlandslide | Landslide | Nonlandslide | Landslide | Nonlandslide | Landslide | |||||
| Actual | Nonlandslide | 4,021 | 1,692 | 70.4 | 1,787 | 712 | 71.5 | 105,419 | 57,025 | 64.9 |
| landslide | 1,946 | 3,831 | 66.3 | 858 | 1,572 | 64.7 | 2,391 | 5,816 | 70.9 | |
| Overall accuracy | 68.3 | 68.1 | 65.2 | |||||||
Table 14.
Accuracies of classifications performed using training and test data after the four rainfall events.
Table 14.
Accuracies of classifications performed using training and test data after the four rainfall events.
| Accuracy | Training (%) | Testing (%) | Overall (%) | |
| Rainfall event | ||||
| Typhoon Morakot | 68.3 | 68.1 | 65.2 | |
| 0517 Rainfall | 83.8 | 84.3 | 83.5 | |
| Typhoon Soulik | 86.2 | 86.4 | 87.3 | |
| Typhoon Kongrey | 86.4 | 87.5 | 85.7 | |
| Average accuracy | 81.2 | 81.6 | 80.4 | |
Table 15.
Various IRL values.
| Various IRL | IRL value |
| IRL1 | 1,417.30 |
| IRL10 | 6,563.47 |
| IRL25 | 28,307.89 |
| IRL50 | 64,548.59 |
| IRL90 | 122,533.70 |
Table 16.
Landslide ratios of various ISESP grades of different IRL classifications.
| ISESP | Below IRL1 | IRL1-IRL10 | IRL10-IRL25 | IRL25-IRL50 | IRL50-IRL90 | Above IRL90 | ||||||||||||
| Landslide | Non-Landslide | Landslide Ratio | Landslide | Non-Landslide | Landslide Ratio | Landslide | Non-Landslide | Landslide Ratio | Landslide | Non-Landslide | Landslide Ratio | Landslide | Non-Landslide | Landslide Ratio | Landslide | Non-Landslide | Landslide Ratio | |
| 0-<0.05 | 18 | 11,097 | 0.00162 | 26 | 6,317 | 0.00412 | 101 | 8,528 | 0.01184 | |||||||||
| 0.05-<0.10 | 53 | 2,889 | 0.01835 | |||||||||||||||
| 0.10-<0.15 | ||||||||||||||||||
| 0.15-<0.20 | 196 | 4,564 | 0.04294 | |||||||||||||||
| 0.20-<0.25 | ||||||||||||||||||
| 0.25-<0.30 | 56 | 3,987 | 0.01405 | |||||||||||||||
| 0.30-<0.35 | 184 | 1,629 | 0.11295 | |||||||||||||||
| 0.35-<0.40 | ||||||||||||||||||
| 0.40-<0.45 | ||||||||||||||||||
| 0.45-<0.50 | 20 | 317 | 0.06309 | |||||||||||||||
| 0.50-<0.55 | ||||||||||||||||||
| 0.55-<0.60 | ||||||||||||||||||
| 0.60-<0.65 | ||||||||||||||||||
| 0.65-<0.70 | ||||||||||||||||||
| 0.70-<0.75 | 63 | 507 | 0.12426 | 51 | 148 | 0.34459 | ||||||||||||
| 0.75-<0.80 | ||||||||||||||||||
| 0.80-<0.85 | 57 | 318 | 0.17925 | |||||||||||||||
| 0.85-<0.90 | 55 | 368 | 0.14946 | 1 | 7 | 0.14286 | 22 | 19 | 1.15789 | |||||||||
| 0.90-<0.95 | 27 | 131 | 0.20611 | 5 | 12 | 0.41667 | 17 | 6 | 2.83333 | |||||||||
| 0.95-<1.00 | 255 | 294 | 0.86735 | 157 | 129 | 1.21705 | 29 | 17 | 1.70588 | 3 | 0 | 3 | ||||||
Table 17.
Hazard value of each interval.
| Hazard interval | Average Landslide Ratio | Hazard value |
| Interval Ⅷ | 0.001 | 0.00001 |
| Interval Ⅶ | 0.004 | 0.00083 |
| Interval Ⅵ | 0.022 | 0.00673 |
| Interval Ⅴ | 0.125 | 0.04142 |
| Interval Ⅳ | 0.39 | 0.1296 |
| Interval Ⅲ | 0.93 | 0.30981 |
| Interval Ⅱ | 2.27 | 0.7564 |
| Interval Ⅰ | 3 | 1 |
Disclaimer/Publisher’s Note: The statements, opinions and data contained in all publications are solely those of the individual author(s) and contributor(s) and not of MDPI and/or the editor(s). MDPI and/or the editor(s) disclaim responsibility for any injury to people or property resulting from any ideas, methods, instructions or products referred to in the content. |
© 2024 by the authors. Licensee MDPI, Basel, Switzerland. This article is an open access article distributed under the terms and conditions of the Creative Commons Attribution (CC BY) license (http://creativecommons.org/licenses/by/4.0/).
Copyright: This open access article is published under a Creative Commons CC BY 4.0 license, which permit the free download, distribution, and reuse, provided that the author and preprint are cited in any reuse.


