Submitted:
17 February 2024
Posted:
19 February 2024
You are already at the latest version
Abstract
Keywords:
1. Introduction
2. Results and Discussion
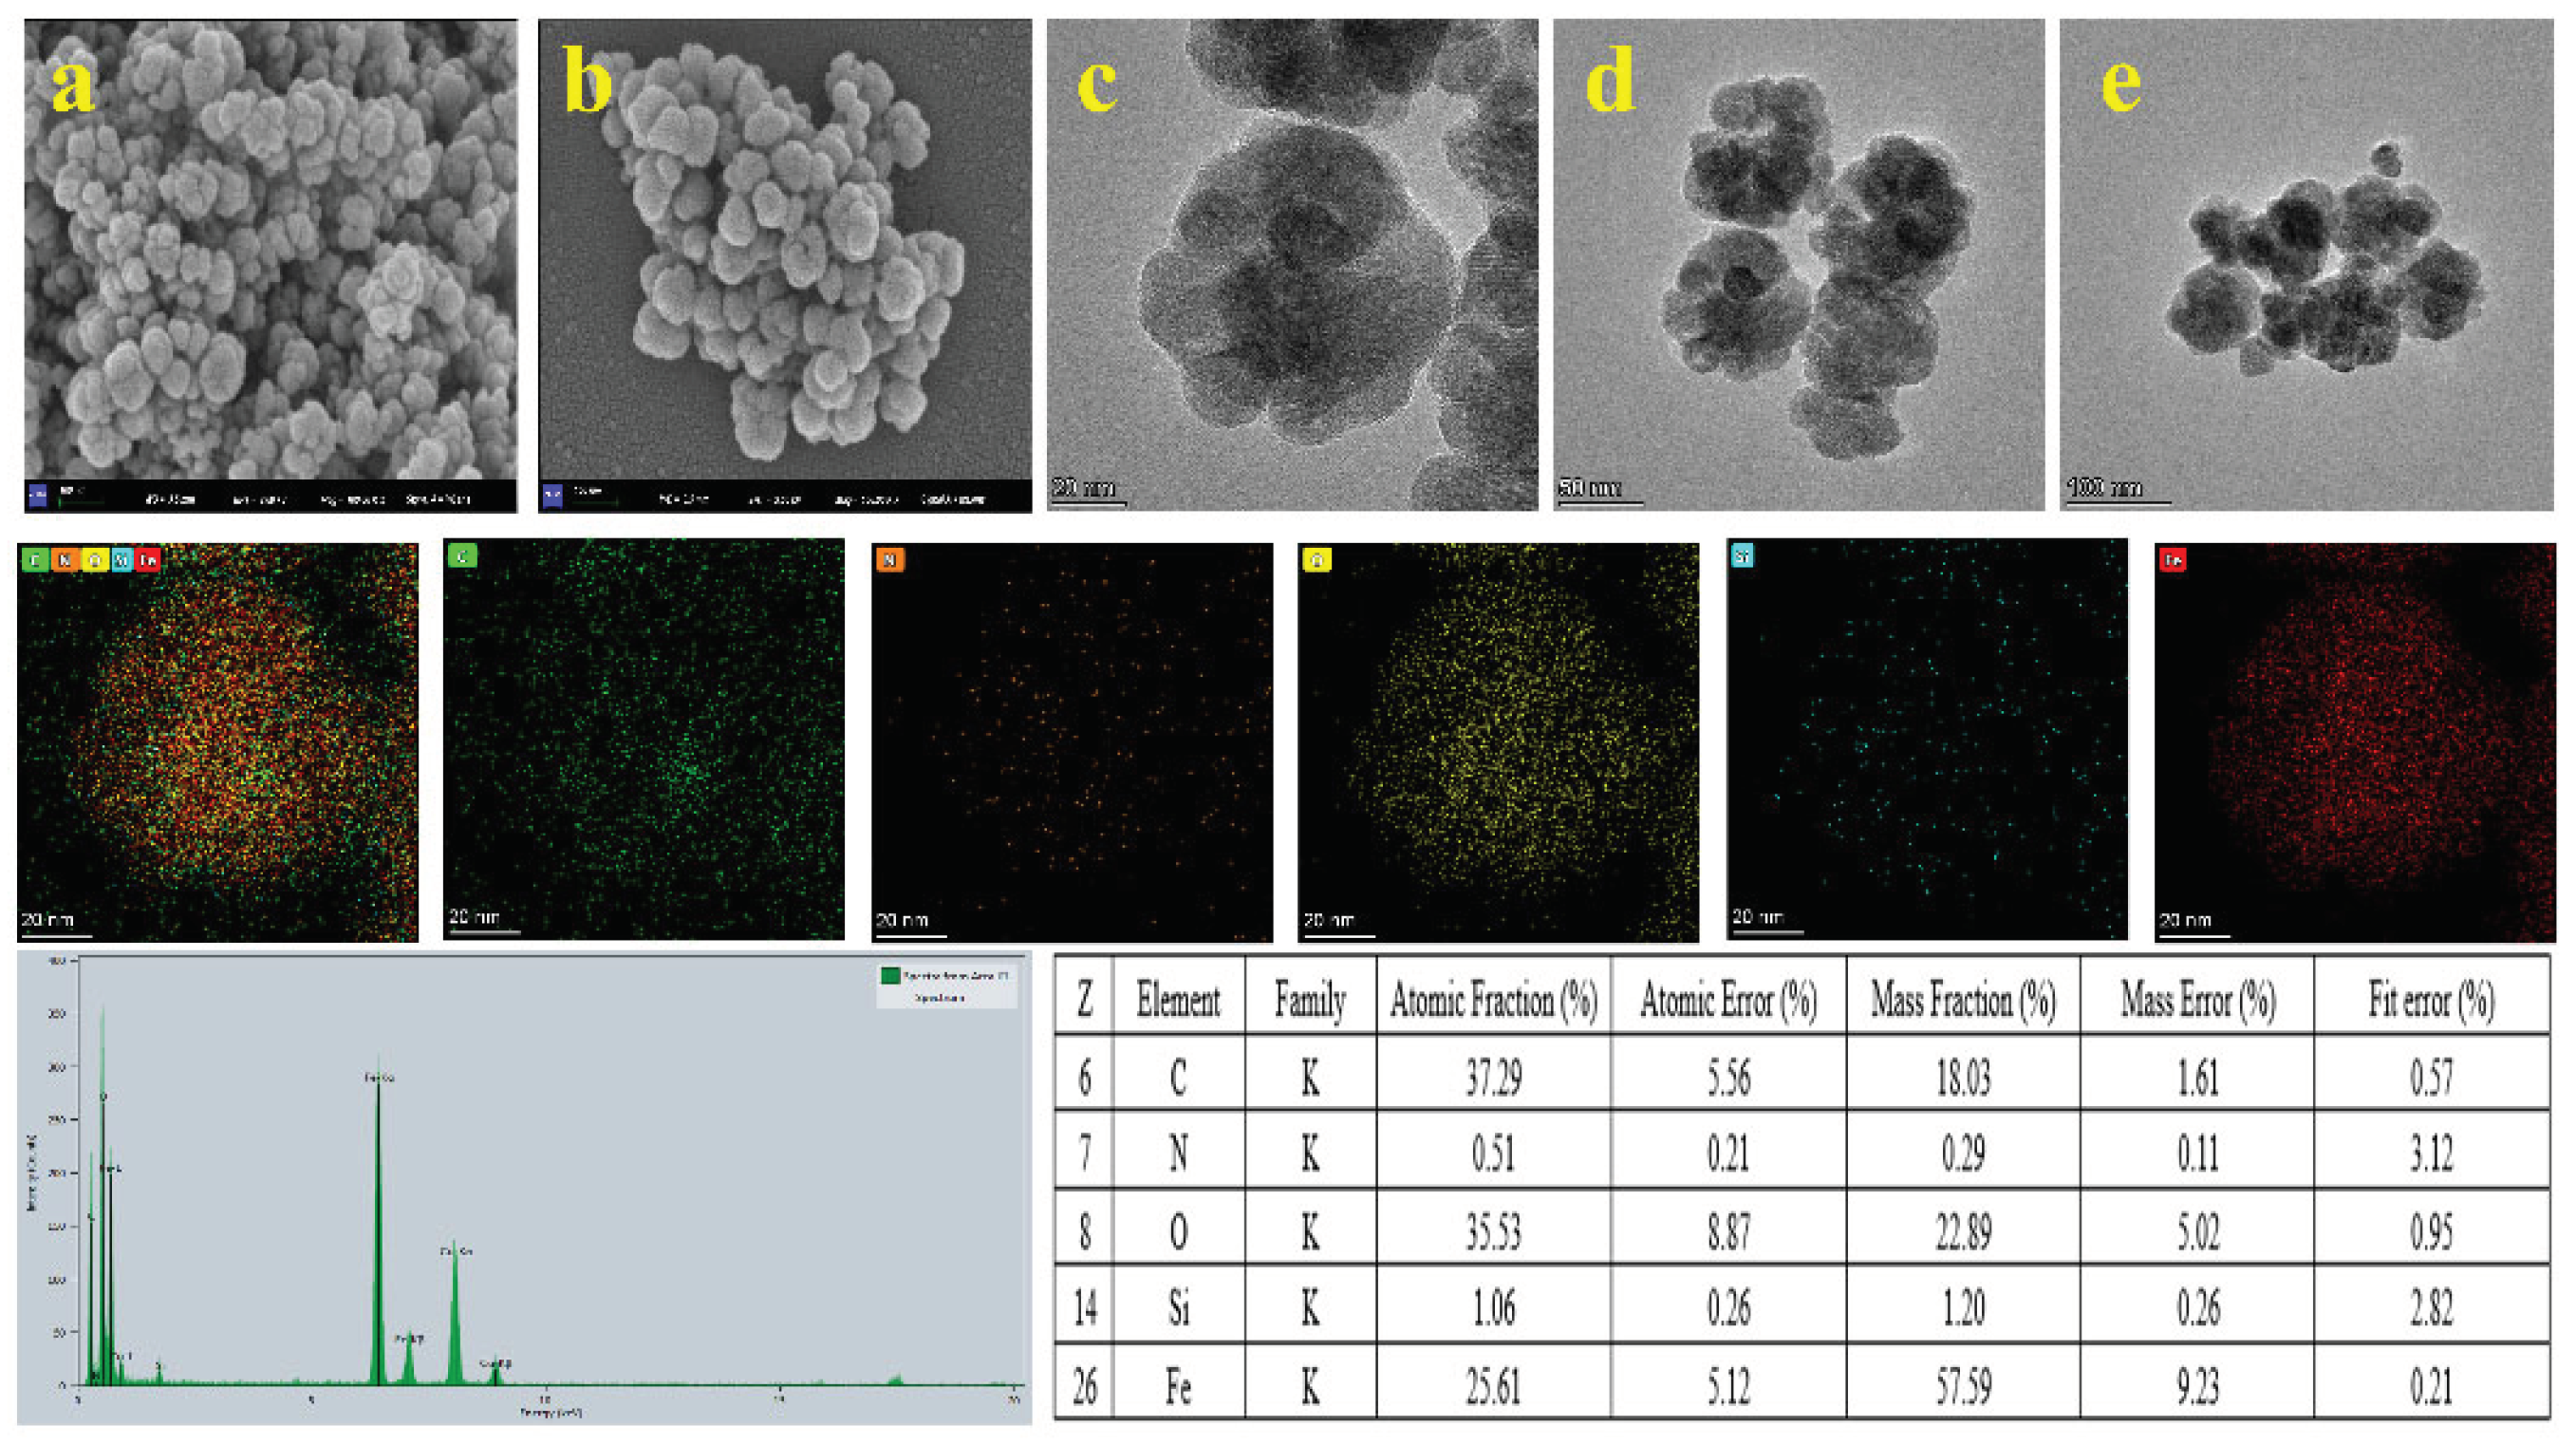
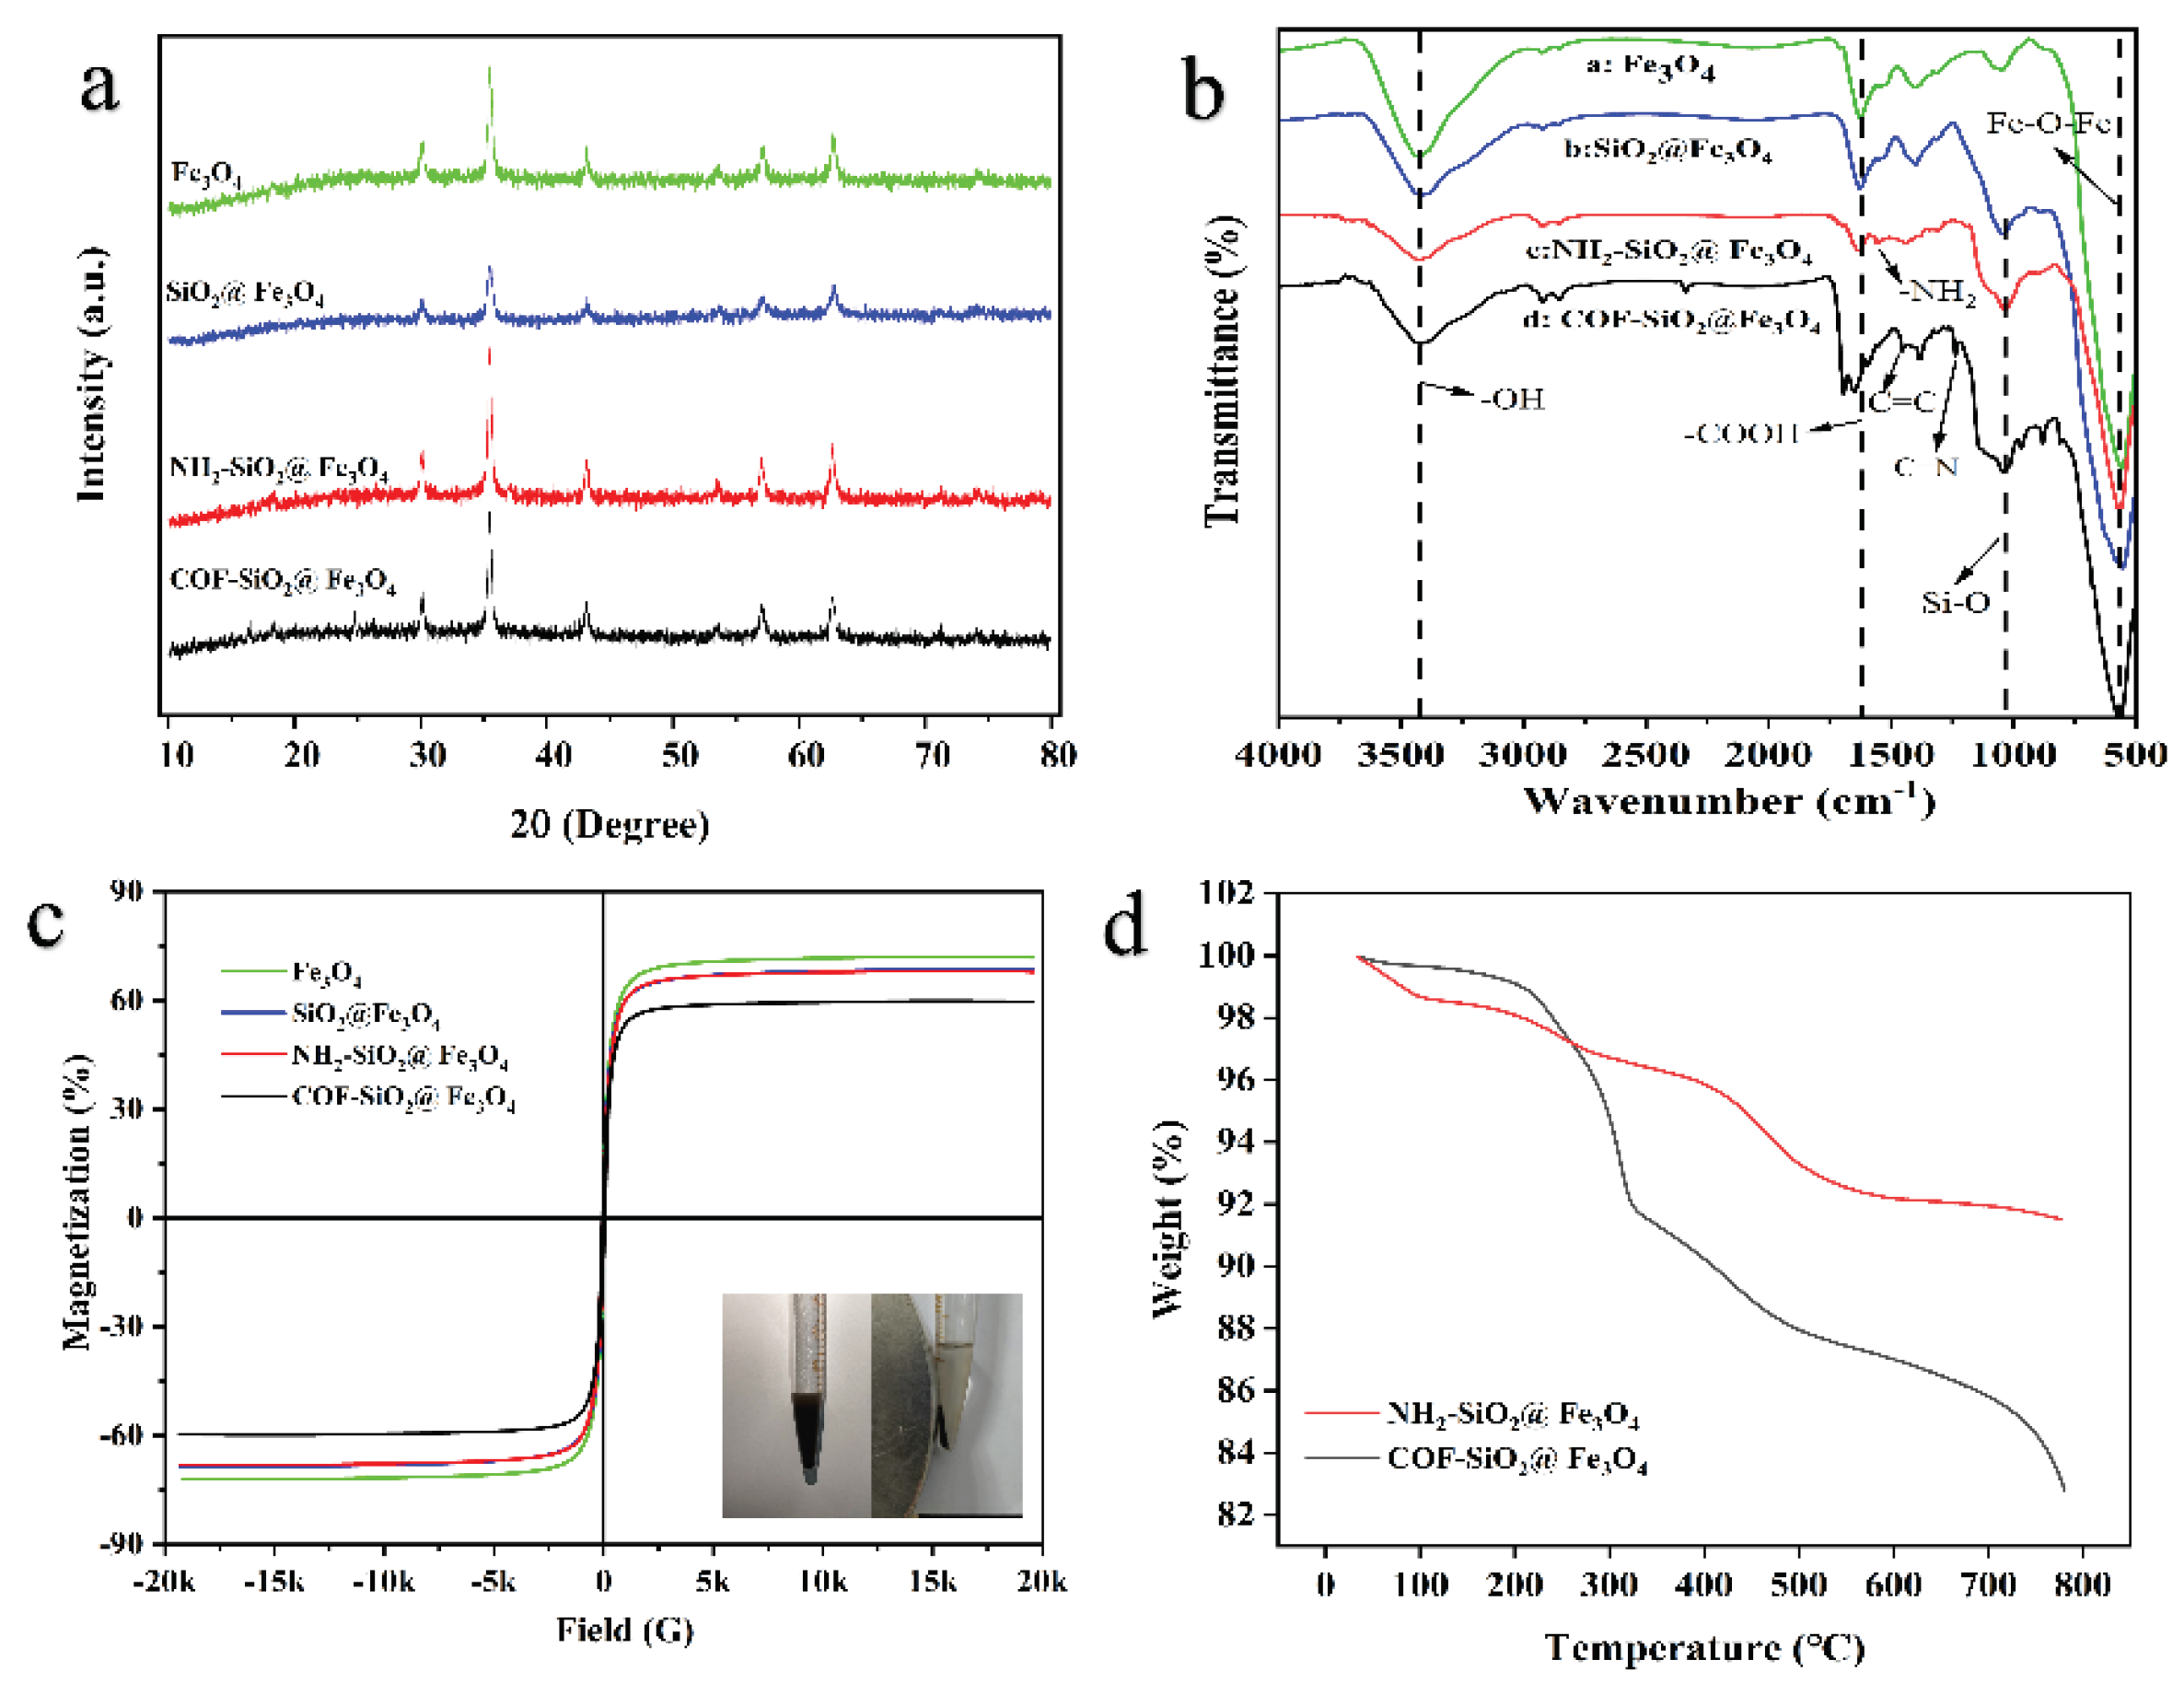
2.1. Characterization of COF-SiO2@Fe3O4
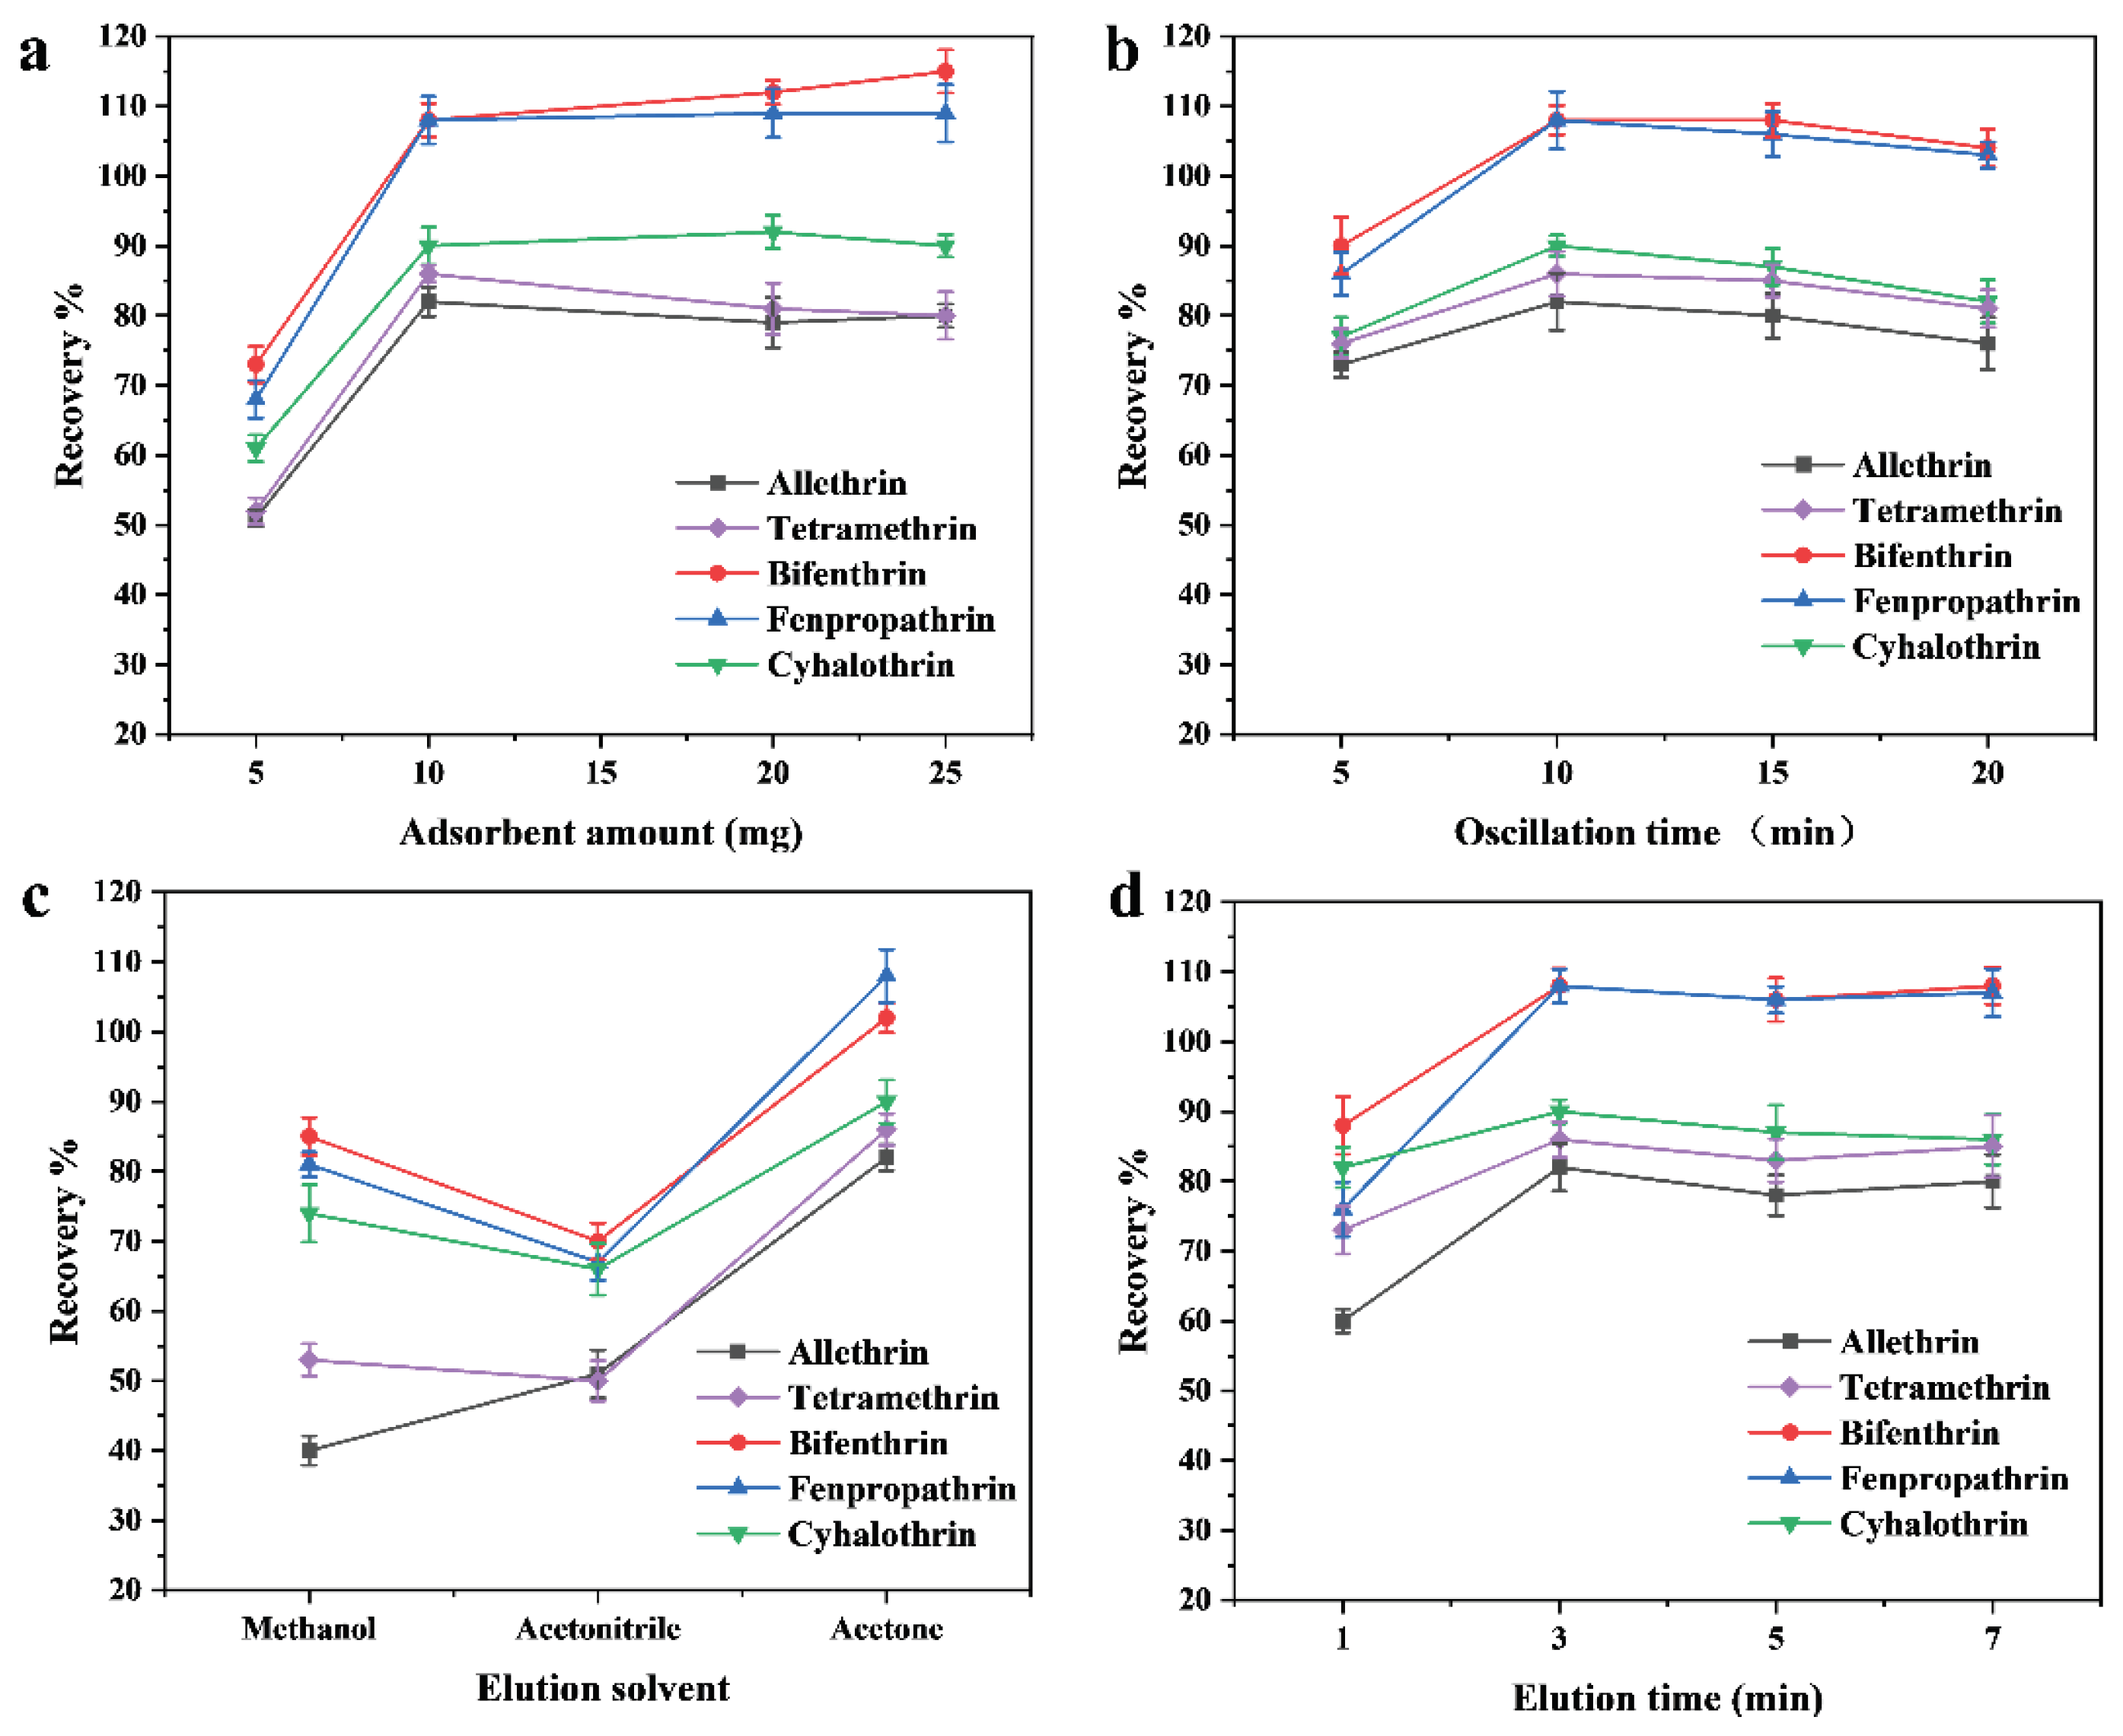
2.2. Optimization of MSPE Parameters
Effect of Adsorbent Amount
Effect of Extraction Time
Effect of Elution Solvent
Effect of Elution Time
2.3. Adsorption Mechanism of PYRs
2.4. Method Validation
2.5. Real Sample Analysis
2.6. Comparison of COF-SiO2@Fe3O4, NH2-SiO2@Fe3O4 and Fe3O4 as MSPE Adsorbents
3. Experimental
3.1. Materials and Chemicals
3.2. Equipment
3.3. Preparation of Standard Solution
3.4. Preparation of Magnetic Materials
Synthesis of Fe3O4 magnetic nanoparticles
Synthesis of SiO2@Fe3O4 Magnetic Nanospheres
Synthesis of NH2-SiO2@Fe3O4 Magnetic Nanospheres
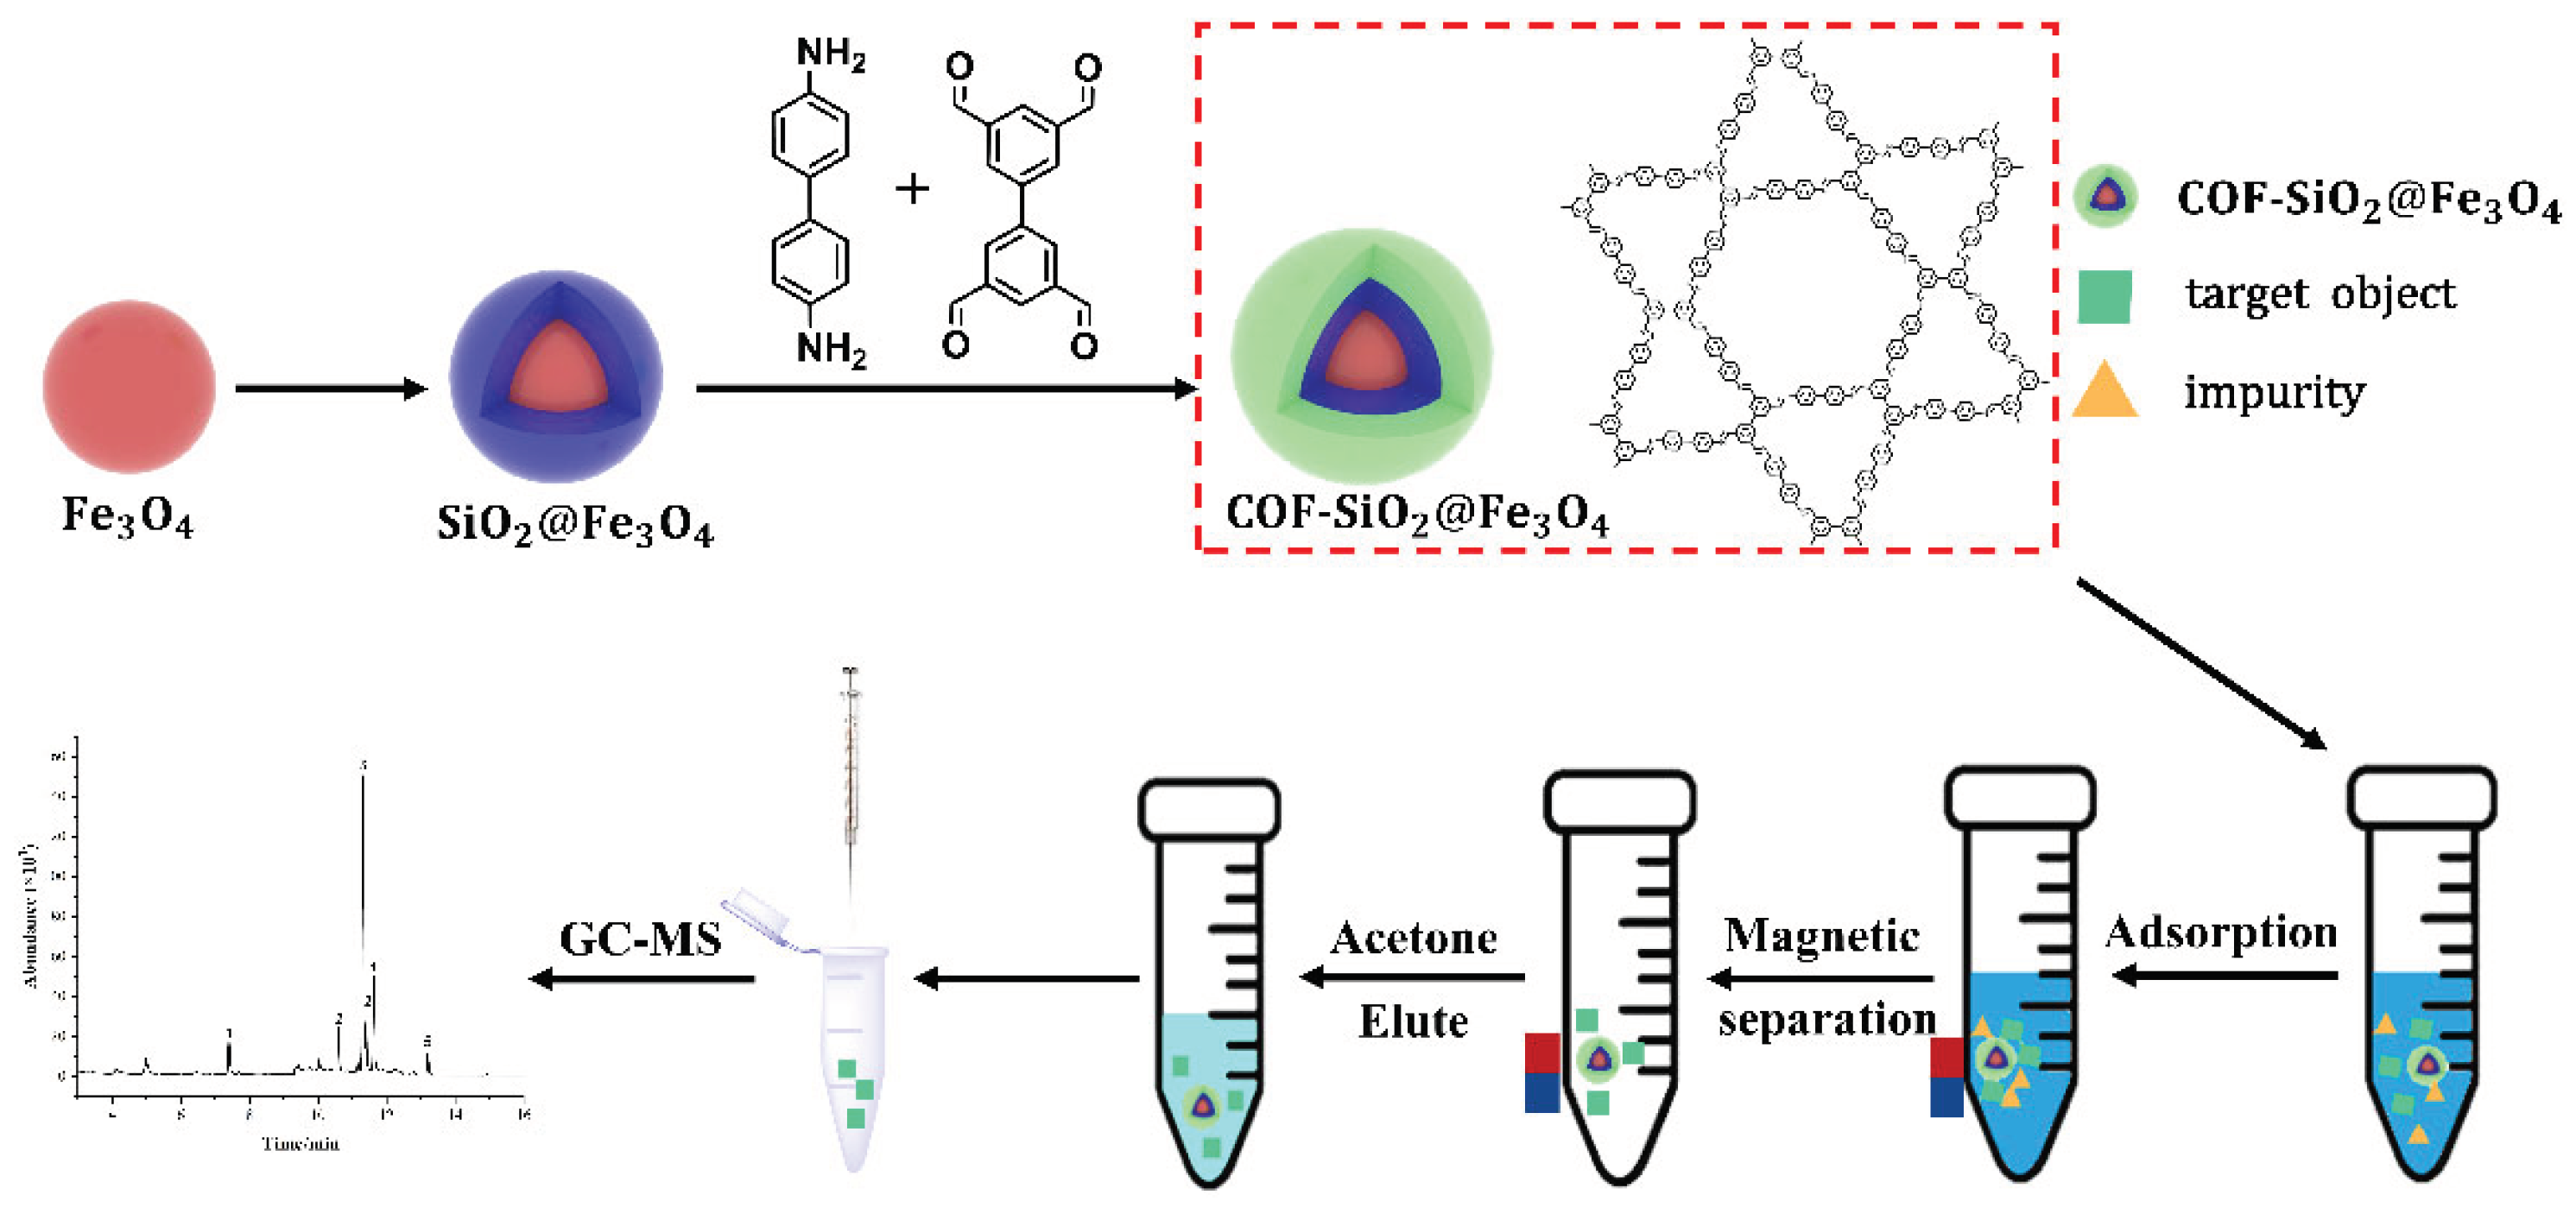
Synthesis of COF-SiO2@Fe3O4 Magnetic Nanoparticles
3.5. MSPE pretreatment
3.6. GC-MS conditions
3.7. Recovery
4. Conclusions
Author Contributions
Funding
Data Availability Statement
Conflicts of Interest
References
- Lin, X.; Mou, R.; Cao, Z.; Cao, Z.; Chen, M. Analysis of pyrethroid pesticides in Chinese vegetables and fruits by GC–MS/MS. Chem. Pap. 2018, 72, 1953–1962. [Google Scholar] [CrossRef]
- Fang, Y.; Xu,W.; Zhang,W.; Guang, C.; Mu, W. Microbial elimination of pyrethroids: specific strains and involved enzymes. Appl. Microbiol. Biot. 2022, 106, 6915-6932. [CrossRef]
- Tang, W.; Wang, D.; Wang, J.; Wu, Z.; Li, L.; Huang, M.; Xu, S.; Yan, D. Pyrethroid pesticide residues in the global environment: An overview. Chemosphere. 2018, 191, 990–1007. [Google Scholar] [CrossRef] [PubMed]
- Wang, Q.; Chen, L.; Li, Y.; Yang, J.; Yang, R. Magnetic nanocomposite-based TpPa-NO2 covalent organic framework for the extraction of pyrethroid insecticides in water, vegetable, and fruit samples. Food Anal. Method. 2022, 16, 71–82. [Google Scholar] [CrossRef]
- Wu, C.; Yang, S; Meng, Y. Investigation of pH-switchability of hydrophobic deep eutectic solvents for the extraction and preconcentration of triazine herbicides in water samples. Microchem. J. 2023, 194, 109198. [CrossRef]
- Manzanares, N.; Perez, J.; Campana, A.; Gracia, L. Simple methodology for the determination of mycotoxins in pseudocereals, spelt and rice. Food Control 2014, 36, 94–101. [Google Scholar] [CrossRef]
- Xie, Y.; Wu, X.; Song, Y.; Sun, Y.; Tong, K.; Yu, X.; Fan, C.; Chen, H. Screening of 258 pesticide residues in silage using modified QuEChERS with liquid-and gas chromatography-quadrupole/orbitrap mass spectrometry. Agriculture, 2022, 12, 1231. [CrossRef]
- Erarpat, S.; Bodur, S.; Bakırdere, S. Nanoparticles based extraction strategies for accurate and sensitive determination of different pesticides. Crit. Rev. Anal.Chem. 2022, 52, 1370–1385. [Google Scholar] [CrossRef]
- Lin, X.; Wang, X.; Wang, J.; Yuan, Y.; Di, S.; Wang, Z.; Xu, H.; Zhao. H.; Zhao, C.; Ding, W.; Qi, P. Magnetic covalent organic framework as a solid-phase extraction absorbent for sensitive determination of trace organophosphorus pesticides in fatty milk. J. Chromatogr. A. 2020, 1627, 461387. [CrossRef]
- Hamidi S. Recent advances in solid-phase extraction as a platform for sample preparation in biomarker assay. Crit. Rev. Anal.Chem. 2023, 53, 199–210. [CrossRef]
- Fu, Q.; Li, J.; Wang, X.; Sun-Waterhouse, D.; Sun, X.; Waterhouse, G.; Wu, P. Covalent organic framework-based magnetic solid-phase extraction coupled with gas chromatography-tandem mass spectrometry for the determination of trace phthalate esters in liquid foods. Microchim. Acta 2023, 190, 1–11. [Google Scholar] [CrossRef]
- Wu, G.; Zhang, C.; Liu, C.; Li, X.; Cai, Y.; Wang, M.; Chu, D.; Liu, L.; Meng, T.; Chen, Z. Magnetic tubular nickel@silica-graphene nanocomposites with high preconcentration capacity for organothiophosphate pesticide removal in environmental water: Fabrication, magnetic solid-phase extraction, and trace detection. J. Hazard. Mater. 2023, 457, 131788. [Google Scholar] [CrossRef] [PubMed]
- Nasiri, M.; Ahmadzadeh, H.; Amiri, A. Organophosphorus pesticides extraction with polyvinyl alcohol coated magnetic graphene oxide particles and analysis by gas chromatography-mass spectrometry: Application to apple juice and environmental water. Talanta 2021, 227, 122078. [Google Scholar] [CrossRef] [PubMed]
- Wei, D.; Pan, A.; Zhang, C.; Guo, M.; Lou, C.; Zhang, J.; Wu, H.; Wang, X. Fast extraction of aflatoxins, ochratoxins and enniatins from maize with magnetic covalent organic framework prior to HPLC-MS/MS detection. Food Chem. 2023, 404, 134464. [Google Scholar] [CrossRef]
- Zhao, Y.; Bai, X.; Liu, Y.; Liao, X. Determination of fipronil and its metabolites in egg samples by UHPLC coupled with Q-Exactive high resolution mass spectrometry after magnetic solid-phase extraction. Microchem. J. 2021, 169, 106540. [Google Scholar] [CrossRef]
- Liang, S.; Shi, F.; Zhao, Y.;Wang, W. Determination of local anesthetic drugs in human plasma using magnetic solid-phase extraction coupled with high-performance liquid chromatography. Molecules 2022, 27, 5509. [CrossRef]
- Cui, S.; Mao, X.; Zhang, H.;Zeng, H.; Lin, Z.; Zhang, X.; Qi, P. Magnetic solid-phase extraction based on magnetic sulfonated reduced graphene oxide for HPLC–MS/MS analysis of illegal basic dyes in foods. Molecules 2021, 26, 7427. [CrossRef]
- Jiang, H.;Yang, S.; Miao, H; Tian,H.; Sun, B. Ultrasonic synthesis of magnetic covalent organic frameworks and application magnetic solid phase extraction for rapid adsorption of trace bisphenols in food samples. Food Chem. 2024, 440, 138264. [CrossRef]
- Asl, A.; Rafati, A.; Khazalpour, S. Highly sensitive molecularly imprinted polymer-based electrochemical sensor for voltammetric determination of Adenine and Guanine in real samples using gold screen-printed electrode. J. Mol. Liq. 2023, 369, 120942. [Google Scholar] [CrossRef]
- Huang, Y.; Li, Y.; Luo, Q.; Huang, X. One-pot strategy as a green and rapid method to fabricate magnetic molecularly imprinted nanoparticles for selective capture of sulfonylurea herbicides. ACS. Appl. Mater. Interfaces. 2021, 13, 37280–37288. [Google Scholar] [CrossRef] [PubMed]
- Elancheziyan, M.; Prakasham, K.; Eswaran, M.; Duraisamy, M.; Ganesan, S.; Lee, S.; Ponnusamy, V. Eco-friendly fabrication of nonenzymatic electrochemical sensor based on cobalt/polymelamine/nitrogen-doped graphitic-porous carbon nanohybrid material for glucose monitoring in human blood. Environ. Res. 2023, 223, 115403. [Google Scholar] [CrossRef]
- Li, P.; Huang, D.; Huang, J.; Tang, J.; Zhang, P.; Meng, F. Development of magnetic porous carbon nano-fibers for application as adsorbents in the enrichment of trace Sudan dyes in foodstuffs. J.Chromatogr. A 2020, 1625, 461305. [Google Scholar] [CrossRef] [PubMed]
- Yu, H.; Bi, X.; He, Y.; Cui, Y.; Yang, C. Microporous organic network: superhydrophobic coating to protect metal–organic frameworks from hydrolytic degradation. ACS. Appl. Mater. Interfaces 2023, 15, 36822–36830. [Google Scholar] [CrossRef] [PubMed]
- Li, Z.; Hu, C.; Hu, Z.; Fu, Y.; Chen, Z. Facile synthesis of novel multifunctional β-cyclodextrin microporous organic network and application in efficient removal of bisphenol A from water. Carbohyd. Polym. 2022, 276, 118786. [Google Scholar] [CrossRef] [PubMed]
- Abdelhai Senosy, I.; Guo, H.; OuYang, M.; Lu, Z.; Yang, Z.; Li, J. Magnetic solid-phase extraction based on nano-zeolite imidazolate framework-8-functionalized magnetic graphene oxide for the quantification of residual fungicides in water, honey and fruit juices. Food Chem. 2020, 325, 126944. [Google Scholar] [CrossRef]
- Safari, M.; Yamini, Y.; Masoomi, M.; Morsali, A.; Mani-Varnosfaderani, A. Magnetic metal-organic frameworks for the extraction of trace amounts of heavy metal ions prior to their determination by ICP-AES. Microchim. Acta. 2017, 184, 1555–1564. [Google Scholar] [CrossRef]
- Wang, J.; Huang, Q.; Guo, W.; Guo, D.; Han, Z.; Nie, D. Fe3O4@ COF (TAPT–DHTA) nanocomposites as magnetic solid-phase extraction adsorbents for simultaneous determination of 9 mycotoxins in fruits by UHPLC–MS/MS. Toxins 2023, 15, 117. [Google Scholar] [CrossRef]
- Zhang, X.; Gao, Y.; Li, J.; Yan, J.; Liu, P.; Fan, X.; Song, W. A novel TAPP-DHTA COF cathodic photoelectrochemical immunosensor based on CRISPR/Cas12a-induced nanozyme catalytic generation of heterojunction. Electrochim. Acta. 2023, 441, 141771. [Google Scholar] [CrossRef]
- Gao, R.; Bai, J.; Shen, R.; Hao, L.; Huang, C.; Wang ,L.; Li, X. 2D/2D covalent organic framework/CdS Z-scheme heterojunction for enhanced photocatalytic H2 evolution: Insights into interfacial charge transfer mechanism. J. Mater. Sci. Technol. 2023, 137, 223-231. [CrossRef]
- Zhang, Y.; Zhang, W.; Gong, H.; Jia, Q.; Zhang, W.; Zhang, Z. Fabrication a sensor based on sulfonate-based COF for humidity sensing. Mater. Lett. 2022, 328, 133123. [Google Scholar] [CrossRef]
- Ren, X.; Liao, G.; Li, Z.; Qiao, H.; Zhang, Y.; Yu, X.; Wang, B.; Tan, H.; Shi, L.; Qi, X.; Zhang, H. Two-dimensional MOF and COF nanosheets for next-generation optoelectronic applications. Coordin. Chem. Rev. 2021, 435, 213781. [Google Scholar] [CrossRef]
- Zhang, W.; Li, Y.; Xing, Z.; Zhao, M.; Fu, Y.; Wang, S.; Ma, H. Ionic COF composite membranes for selective perfluoroalkyl substances separation. Macromol. Rapid. Comm. 2023, 44, 2200718. [Google Scholar] [CrossRef] [PubMed]
- Han, S.; You, W.; Lv, S.; Du, C.; Zhang, X.; Zhang, E.; Zhu, J.; Zhang, Y. Ionic liquid modified COF nanosheet interlayered polyamide membranes for elevated nanofiltration performance. Desalination 2023, 548, 116300. [Google Scholar] [CrossRef]
- Lu, J.; Zhou, Y.; Ling, L.X.; Zhou, Y.B. Enhanced activation of PMS by a novel Fenton-like composite Fe3O4/S-WO3 for rapid chloroxylenol degradation. Chem. Eng. J. 2022, 446, 137067. [Google Scholar] [CrossRef] [PubMed]
- Chen, L.; He, Y.; Lei, Z.; Gao, C.; Xie, Q.; Tong, P.; Lin, Z. Preparation of core-shell structured magnetic covalent organic framework nanocomposites for magnetic solid-phase extraction of bisphenols from human serum sample. Talanta 2018, 181, 296–304. [Google Scholar] [CrossRef] [PubMed]
- Mojtaba, S.; Mehdi, F.;Seyed, A.; Hajir, K. Tetraethylenepentamine-enriched magnetic graphene oxide as a novel Cr(VI) removal adsorbent. React. Funct. Polym. 2022, 180, 105410. [CrossRef]
- Wang, Q.; Chen, L.; Cui, X.; Zhang, J.; Wang, Y.; Yang, X. Determination of trace bisphenols in milk based on Fe3O4@NH2-MIL-88 (Fe)@TpPa magnetic solid-phase extraction coupled with HPLC. Talanta 2023, 256, 124268. [Google Scholar] [CrossRef] [PubMed]
- Zhong, X.; Liang, W.; Lu, Z.; Lu, Z.; Hu, B. Highly efficient enrichment mechanism of U (VI) and Eu (III) by covalent organic frameworks with intramolecular hydrogen-bonding from solutions. Appl. Surf. Sci. 2020, 504, 144403. [Google Scholar] [CrossRef]
- Deng, H.; Li, X.; Peng, Q.; Wang, X.; Chen, J.; Li, Y. Monodisperse magnetic single-crystal ferrite microspheres. Angew. Chem. Int. Edit. 2005, 44, 2782–2785. [Google Scholar] [CrossRef]
|
Analytes |
Regression equation |
Linear ranges /(μg⋅L-1) |
r |
LODs /(μg⋅kg-1) |
LOQs /(μg⋅kg-1) |
EF | RSD(%) |
Batch to batch (n=3) |
|||||
| Inter-day (n=5) Intra-day (n=6) | |||||||||||||
| 5 | 10 | 20 | 5 | 10 | 20 | ||||||||
| Allethrin | y = 616.9x -1255.5 | 5-100 | 0.9991 | 1.5 | 4.5 | 4.4 | 3.1 | 2.5 | 2.1 | 3.4 | 2.8 | 2.7 | 4.2 |
| Tetramethrin | y = 780.02x+754.75 | 5-100 | 0.9997 | 1.5 | 4.5 | 5.0 | 5.3 | 2.3 | 2.2 | 6.5 | 3.2 | 3.6 | 3.3 |
| Bifenthrin | y=4775.3x-3182.1 | 1-100 | 0.9990 | 0.3 | 0.9 | 12.4 | 2.1 | 6.2 | 4.8 | 2.3 | 2.3 | 4.1 | 2.5 |
| Fenpropathrin | y=1077.2x + 195.48 | 2.5-100 | 0.9991 | 1.0 | 3.0 | 10.7 | 2.6 | 3.7 | 2.4 | 3.1 | 3.0 | 2.9 | 2.6 |
| Cyhalothrin | y =451.16x-561.9 | 5-100 | 0.9995 | 1.5 | 4.5 | 11.0 | 2.2 | 2.6 | 1.9 | 2.7 | 2.6 | 7.0 | 3.0 |
| Analytes |
Spiked level / (μg⋅kg-1) |
cucumber Recovery (%, RSD%) |
Chinese cabbage Recovery (%, RSD%) | Lettuce Recovery (%, RSD%) |
|---|---|---|---|---|
| Allethrin | 5 | 80.2 (3.5) | 81.7 (3.1) | 85.3 (7.0) |
| 10 | 90.1 (2.9) | 91.3 (3.9) | 87.3 (5.8) | |
| 20 | 96.4 (3.4) | 102.4 (4.1) | 103.5 (6.1) | |
| Tetramethrin | 10 | 116.5 (6.1) | 89.1 (5.3) | 116.1 (4.5) |
| 20 | 97.2 (4.6) | 107.6 (4.9) | 110.2 (5.7) | |
| 50 | 111.0 (6.1) | 114.7 (5.7) | 109.6 (4.8) | |
| Bifenthrin | 10 | 89.2 (5.4) | 92.9 (2.1) | 97.3 (3.6) |
| 20 | 96.6 (2.3) | 95.3 (3.2) | 94.2 (2.4) | |
| 50 | 97.4 (3.9) | 102.7 (4.2) | 93.7 (3.4) | |
| Fenpropathrin | 10 | 112.5 (6.7) | 107.5 (3.7) | 116.7 (5.7) |
| 20 | 93.1 (5.8) | 106.9 (5.6) | 109.8 (3.2) | |
| 50 | 107.8 (3.6) | 105.2 (6.5) | 107.1 (5.1) | |
| Cyhalothrin | 10 | 97.3 (2.9) | 87.4 (6.8) | 81.6 (6.5) |
| 20 | 89.9 (4.7) | 108.5 (6.5) | 89.3 (5.6) | |
| 50 | 90.1 (5.1) | 92.3 (5.3) | 93.4 (5.4) |
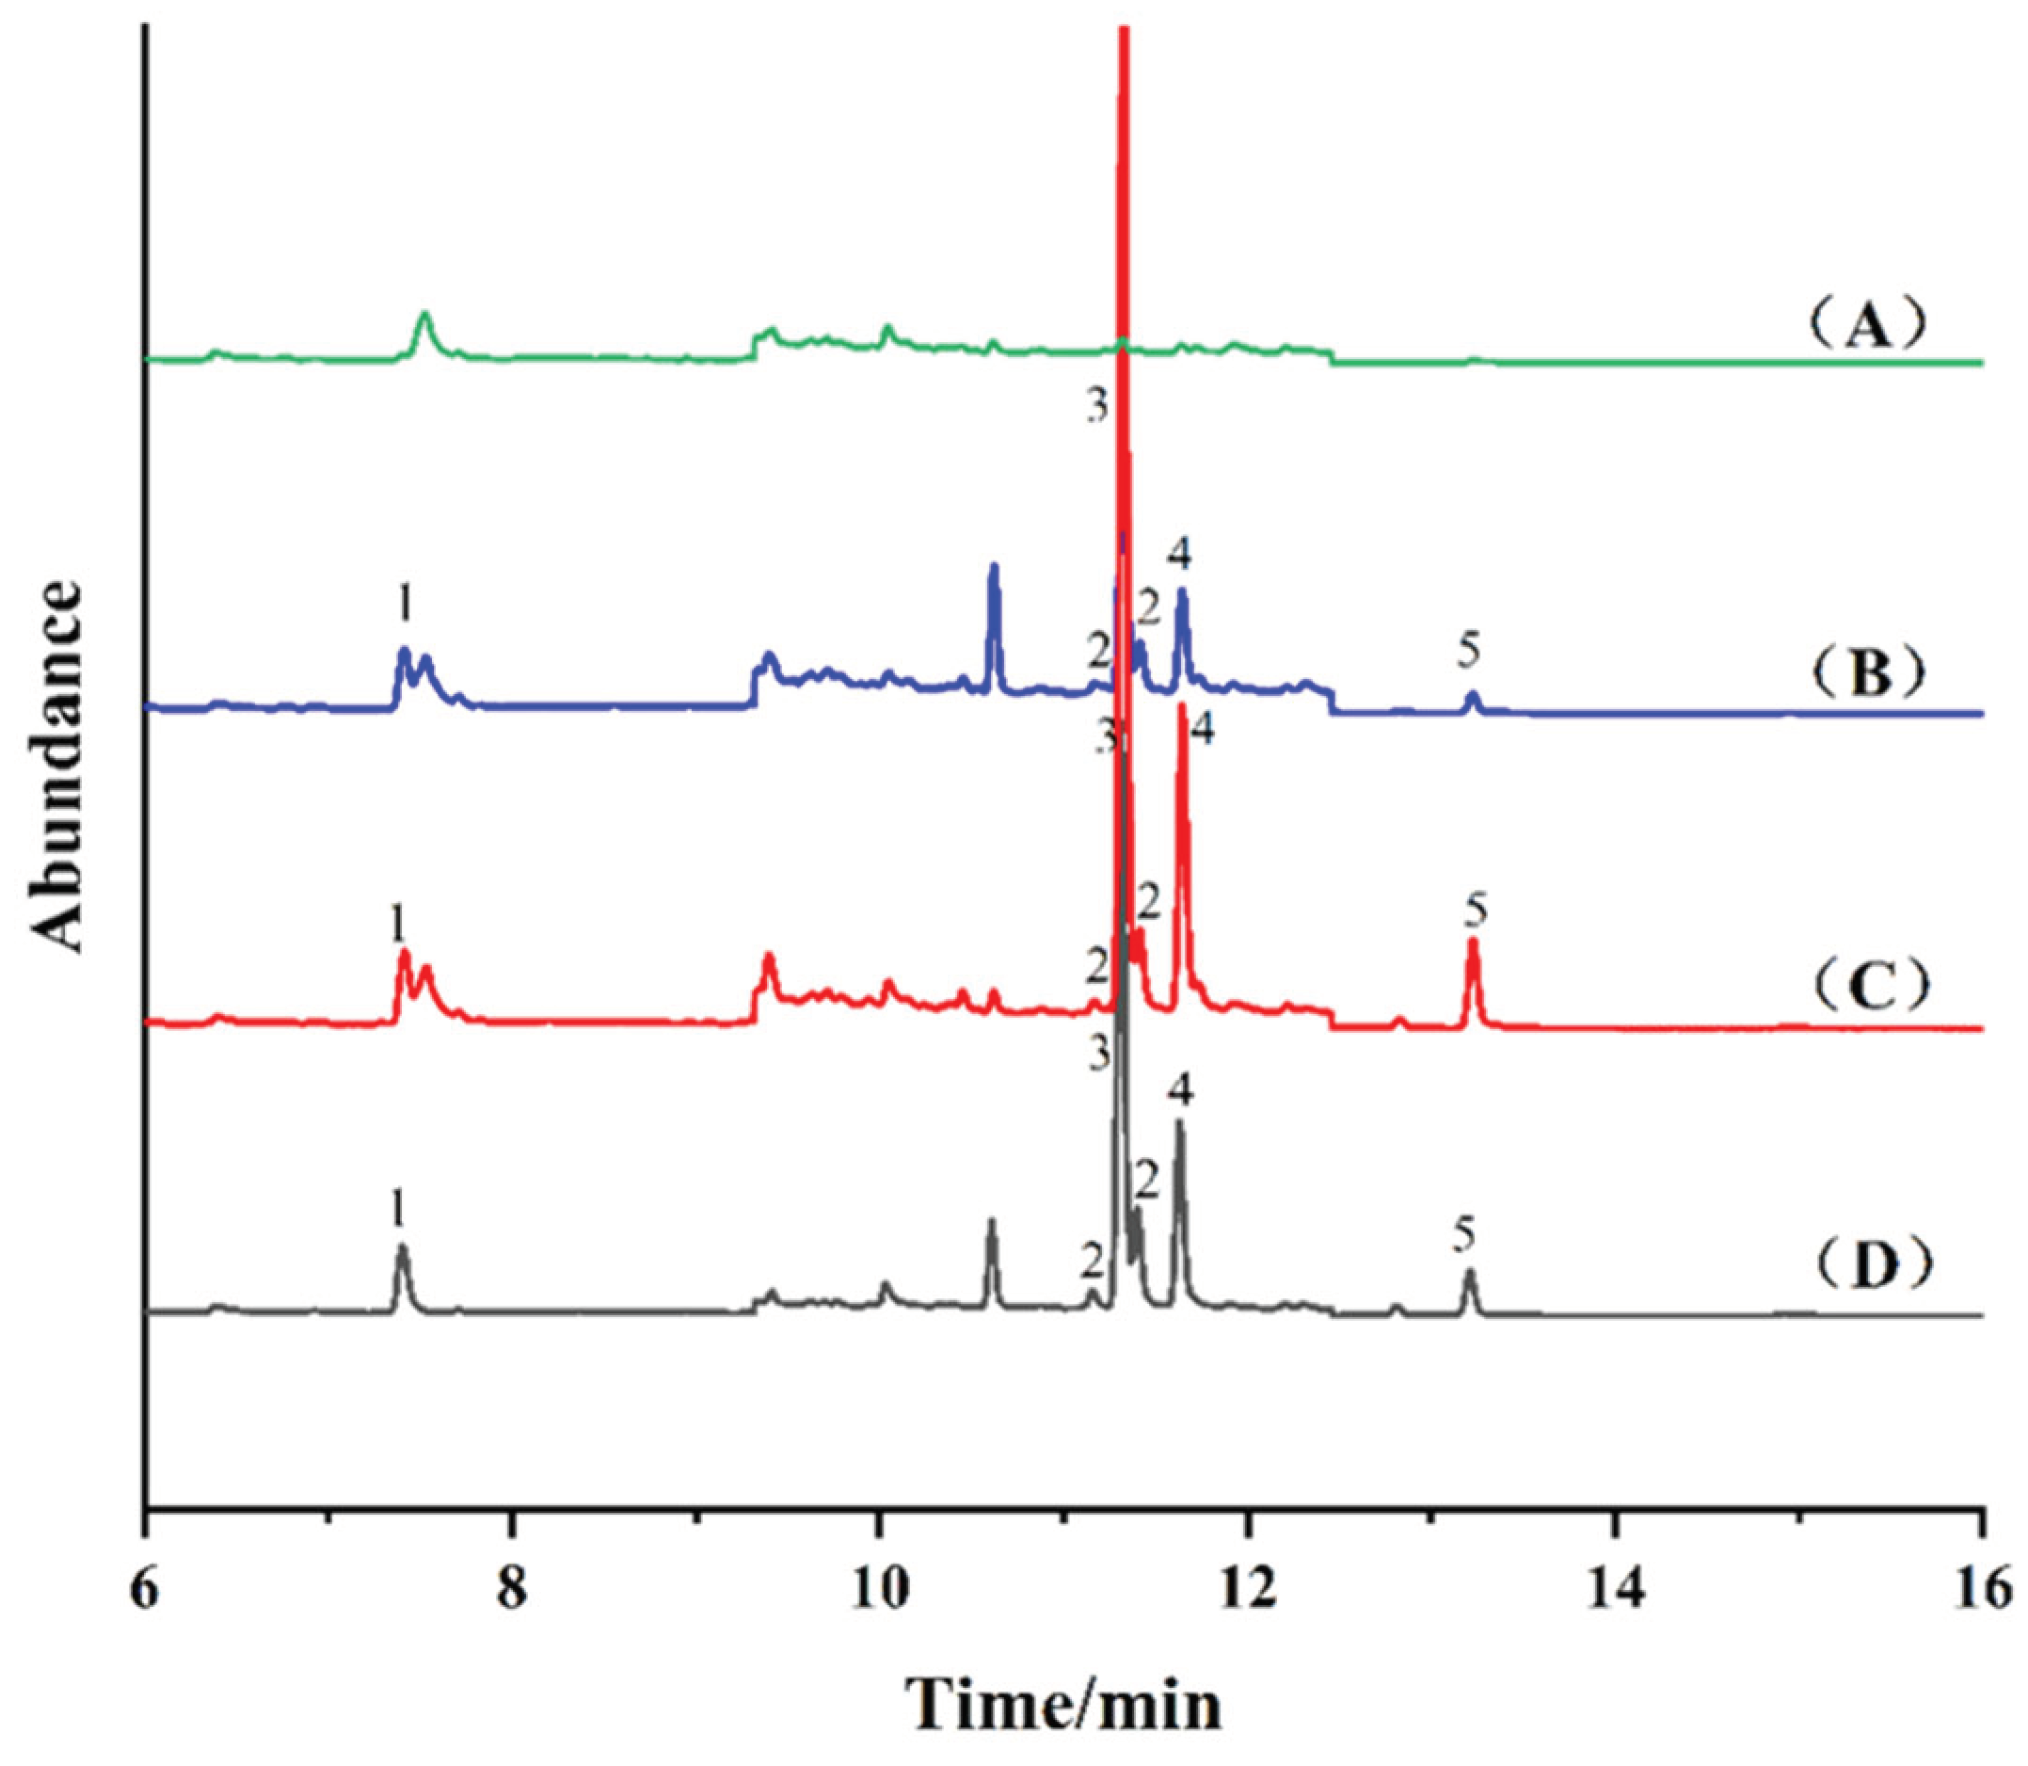
| Peak number | Compound | Retention time (min) | Mass-to-charge ratio( m/z) Quantitative ion Qualitative ion |
|
| 1 | Allethrin | 7.440 | 123 | 123, 79, 81 |
| 2 | Tetramethrin 1 | 11.195 | 164 | 164, 123, 81 |
| 3 | Bifenthrin | 11.340 | 181 | 181, 166, 165 |
| 2 | Tetramethrin 2 | 11.440 | 164 | 164, 123, 81 |
| 4 | Fenpropathrin | 11.670 | 97 | 97, 55, 181 |
| 5 | Cyhalothrin | 13.255 | 181 | 181, 197, 208 |
Disclaimer/Publisher’s Note: The statements, opinions and data contained in all publications are solely those of the individual author(s) and contributor(s) and not of MDPI and/or the editor(s). MDPI and/or the editor(s) disclaim responsibility for any injury to people or property resulting from any ideas, methods, instructions or products referred to in the content. |
© 2024 by the authors. Licensee MDPI, Basel, Switzerland. This article is an open access article distributed under the terms and conditions of the Creative Commons Attribution (CC BY) license (http://creativecommons.org/licenses/by/4.0/).


