Submitted:
15 February 2024
Posted:
16 February 2024
You are already at the latest version
Abstract
Tandem mass spectrometry (MS/MS) for diagnosing inborn errors of metabolism (IEM) is recognized as an ethical, safe, simple, and reliable screening test. Presented bibliometric analysis aims to describe the network structure of the scientific community in the study area at the level of countries, institutions, authors, papers, keywords, and sources; scientific productivity, directions, and collaboration efforts in a considered period (1991–2023.) Using the PRISMA method, we conducted a systematic search for articles reporting using MS/MS to screen for inherited metabolic disorders and inborn errors of metabolism collected from the Web of Science Core Collection (WOSCC.) A total of 451 articles out of 546, by 2,682 authors, published in 190 journals, with 15,440 citations in 8,181 citing articles, with an average citation of 34.24 per article, and an H-index of 64 were retrieved from the WOSCC. The research status of MS/MS in IEM screening was identified. The most relevant current research directions and future areas of interest were revealed: "selective screening for IEM," "new treatments for IEM," "new disorders considered for MS/MS testing," "ethical issues associated with newborn screening," "new technologies that may be used for newborn screening," "use of a combination of MS/MS and gene sequencing," etc.
Keywords:
tandem mass spectrometry
; inborn errors of metabolism
; newborn screening
; selective screening
; scientometrics
; bibliometric analysis
; visualization
; VOSviewer
1. Introduction
Tandem mass spectrometry (MS/MS) as a tool for diagnosing inborn errors of metabolism (IEM) was introduced in the 90s [1,2,3] and recognized as an ethical, safe, simple, and reliable screening test [4,5]. In the same decade, tandem mass spectrometry protocols for newborn screening were developed in the USA [6,7,8]. In the 1990s, MS/MS made it possible to detect more than 30 inborn errors in the metabolism of amino acids, fatty acids, and other organic acids [2]. Further, the number of metabolites analyzed in one cycle consecutively increased [7,9]. Over the subsequent decade, laboratories testing for metabolic disorders have implemented tandem mass spectrometry into their newborn screening programs [10,11,12,13,14,15,16,17]. Expanded newborn screening (ENBS) using MS/MS has become a mandatory public health strategy in most countries [18].
IEM constitutes a group of phenotypically and genotypically heterogeneous metabolic disorders caused by gene mutations encoding metabolic pathway enzymes or receptors. Deficiency or changes in the activity of essential enzymes or other proteins in intermediate metabolic pathways lead to the accumulation or deficiency of corresponding metabolites in cells or body fluids, manifesting in a wide range of diseases with clinical heterogeneity, complicating their diagnosis [18].
IEMs are classified, considering the biochemical nature of the metabolites accumulated in each disease, into disorders related to carbohydrates, amino acids, organic acids, fatty acids, hormones, and cholesterol [19]. Collectively, they account for more than a thousand individual genetic disorders, resulting in a significant social and financial burden overwhelming families, communities, and health authorities worldwide [20].
Although these disorders are rare, they are collectively numerous [21]. There are population differences in the incidence of IEM [22,23,24]. Many IEMs do not have specific clinical signs and are difficult to diagnose using clinical manifestations or routine laboratory tests alone [22]. IEM typically results in irreversible neurological and psychological impairment and/or disability or death in affected children. Early diagnosis of IEM can significantly reduce the risk of death and may prevent long-term neurological complications [25,26]. There are now many reasonably effective treatments available and improved early diagnosis, and treatment can significantly reduce the mortality and morbidity associated with these disorders [19,22,27].
Many genetic diseases, especially inborn errors of metabolism, are rare, so developing a newborn screening test for every disease is impractical. This obstacle was overcome through MS/MS technology [28]. MS/MS is more sensitive, specific, reliable, and comprehensive than traditional assays. The outdated classical screening methods of one test, one metabolite, and one disease were replaced by a single test, many metabolites, and many diseases approach, first in the USA, Canada, Australia, and European countries (late 20th - early 21st century), then in some Eastern countries. MS/MS also facilitates adding new disorders to newborn screening panels [6,13,14]. The advantages of this detection system are speed, the ability to analyze many different compounds in a single assay, and minimal requirement for assay auxiliary reagents [2]. The sensitivity and specificity of this method can reach 99% and 99.995%, respectively, for most amino acid disorders, organic acidemias, and fatty acid oxidation defects [18].
MS/MS opened up the concept of multiple metabolite analysis to detect various metabolic disorders in a single analytical run. Using several analytes to detect biochemical disorders allows for constructing a metabolic profile [13,29,30]. The adverse consequences of false-positive results are negligible regarding the health-economic benefits provided by ENBS and can be minimized through increased education, improved communication, and enhanced technology [18].
Screening using tandem mass spectrometry diagnoses more IEM cases than classical clinical screening [31]. Thus, according to Wilcken et al., in a cohort of newborns examined using MS/MS, the prevalence of congenital errors was almost two times higher than in four previous four-year cohorts using clinical screening methods [15].
Typically, diagnosis of IEM using MS/MS involves the use of a series of confirmatory tests when IEM is suspected. For this purpose, particular guidelines have been developed [32]. The ENBS program typically uses a two-tier system, classifying results as “borderline” or “diagnostic.” Infants with an initial borderline result are rescreened. Infants with diagnostic or two borderline results are referred for confirmatory testing [3]. Next-generation sequencing (NGS) is now included in confirmatory testing in many countries [33,34].
ENBS entails many interrelated variables that must be carefully assessed and optimized. More reports worldwide are needed to comprehensively evaluate various populations’ possible benefits, harms, and costs [35]. The impact of the programs has been assessed in terms of screening effectiveness, costs, and clinical outcome [2,4,14,36,37]). Screening additional MS/MS-based IEM for 23 IEM was found to approximately double their detection rate compared with conventional methods used in Germany [39]. The introduction of MS/MS technology has significantly increased the detection of inherited metabolic disorders, including those not previously covered, with predictable improvements in outcomes for some disorders [40,41]. Pilot financial data comparing late diagnosis of treatable IEM with early diagnosis using MS/MS and subsequent treatment suggested that expanded screening with MS/MS would result in reduced morbidity and significant savings in chronic disease and critical care annual costs [42].
According to researchers, MS/MS in IEM screening allows the diagnosis and treatment of diseases before the onset of symptoms and thus represents a preventive medicine strategy [35,39,43]. Cost-effectiveness studies have confirmed that the savings achieved through expanded NBS programs significantly exceed the costs of their implementation [18]. Screening with tandem mass spectrometry has been found to provide better long-term outcomes for patients aged six years, with fewer deaths and fewer clinically significant impairments [36].
One of the considerable challenges in neonatal screening today is differentiating the disorders that would benefit most from ENBS using MS/MS, allowing screening programs to be adjusted accordingly [44].
Evaluating the cost-effectiveness of MS/MS for neonatal screening in low and middle-income countries (LMICs) is particularly important. Khneisser et al. assessed the cost-effectiveness of IEM newborn screening in Lebanon as a model for similar countries. According to Khneisser et al., it can be argued that the direct and indirect costs saved by early detection of IEM are essential enough to justify publicly funded universal screening, especially in LMICs with high consanguinity rates, as illustrated by data from Lebanon. Direct treatment costs were shown to be diminished by half, reaching an average of US$ 31,631 per case identified. This difference more than covers the cost of starting a newborn screening program [45].
Improvements in MS/MS technology are why the authors of several studies have presented the detected IEM frequency as higher than in earlier studies [46,47].
Nowadays, reports on the current status of neonatal screening traditionally divide the world into five regions (North America, Europe, the Middle East and North Africa, Latin America, and Asia Pacific), assessing the current situation with NBS in each region and analyzing the activities undertaken in recent years [48]. However, the problem with IEM screening and using MS/MS as a screening tool may vary within each region.
The application of MS/MS for IEM screening can be studied using bibliometric analysis methods. Bibliometric analysis uses mathematical and statistical methods to evaluate the structure, growth, development, and productivity of publications related to a specific topic. Recent advances in large-scale data analysis, advanced visualization techniques, and network analysis provide well-established tools and techniques for analysis and help to understand the structure and mechanisms of the field under study [49]. A bibliometric review, using scientometric data processing methods, has advantages over a conventional literature review because it allows for identifying critical issues in the field under study and key directions for future research.
Presented bibliometric analysis aims to describe the network structure of the scientific community in the study area at the level of countries, institutional organizations, authors, and sources; their scientific productivity, directions, and collaboration efforts in a given period (1991–2023).
2. Materials and Methods
2.1. Data Sourses and Search Strategies
In late October 2023, we conducted a systematic search for articles reporting using tandem mass spectrometry to screen for inherited metabolic disorders (Figure 1). Complete records of all relevant publications were collected from the Web of Science Core Collection (WOSCC). Web of Science is traditionally considered one of the most comprehensive and authoritative database platforms and is most often used for bibliometric research [50,51,52].
In the current study, the search terms were: “tandem mass spectrometry” AND “screening” AND “inborn errors of metabolism” (Title), OR “tandem mass spectrometry” AND “screening” AND “inborn errors of metabolism” (Abstract), OR “tandem mass spectrometry” AND “screening” AND “inborn errors of metabolism” (Topic).
As tandem mass spectrometry was first described as a potentially new method for screening inherited metabolic diseases in 1991 by Millington et al. [53], the search date was set from January 1, 1991, to October 17, 2023.
Proceeding papers, book chapters, meeting abstracts, editorial materials, early access articles, letters, and notes were excluded at the next screening stage. The language of the publications was limited to English.
Eventually, of the 546 studies identified in the initial search, 451 met the screening criteria and were included for further analysis. The bibliometric data of the retrieved literature was downloaded as a “full record and citation” from the WoSCC database in the form of a plain text file for further analysis. Bibliometric data included publication year, title, author names, country of origin, institutional affiliation, abstract, keywords, number of citations, journal title, journal impact factor (IF), and an H-index.
2.2. Bibliometric Analysis and Visualization
Data from studies selected from the Web of Science were analyzed using the bibliometric software package RStudio (Version 2023.06.2 + 561, PBC, Boston, MA) (http://www.bibliometrix.org; access date: 18 October 2023) [54], and Biblioshiny web applications. The software tool VOSviewer (version 1.6.19) (https://www.vosviewer.com. access date: 18 October 2023) was used to build and visualize bibliometric networks created based on citations, bibliographic linkage, shared citations, or co-authorship relationships [55]. Using these applications allows for the visualization of accumulated scientific knowledge in structure, distribution, and connections between them to create visualization maps that reflect progress and trends in the field under study.
We set the numerical threshold of each node (item, according to the VOSviewer terminology) of visualizations created in VOSviewer to three for country, institutional, author, and journal analysis. Thus, only elements with a number greater than three were displayed on the graphs. The size of the items (nodes) reflects the strength of each element, such as the number of citations or articles, and the distance between items (nodes) demonstrates the strength of the connection between them. The broader the communication lines between items (nodes), the stronger the cooperation.
The number of publications was considered to identify the core of journals that contributed most to citations in the field under study, and Bradford’s law was used. Bibliometric relationships, co-authorship, author countries, institutional affiliations, citations, and keywords were visualized as maps.
Top authors and institutions were ranked based on the percentage of articles they wrote. The ten countries that made the most significant contribution to writing articles in the area under consideration were also identified. Patterns of collaboration between authors, institutions, and countries were visualized.
A temporal frequency analysis of keywords was carried out. The most frequently occurring keywords and trends in using keywords in the described time interval are presented and visualized. Thematic analysis identified time trends in the selected publications.
No ethical approval was required for this study.
3. Results
A total of 451 articles by 2,682 authors were retrieved from the WOS Core Collection database in the timespan from 1991 to October 17, 2023, on research in the field of tandem mass spectrometry for screening hereditary metabolic disorders, published in 190 journals, with 15,440 citations in 8,181 citing articles, with an average citation of 34.24 per article, and an H-index of 64.
According to data provided by Biblioshiny, the completeness of bibliographic metadata was characterized as “Excellent” for the categories Author, Cited References, Document Type, Journal, Language, Number of Cited References, Publication Year, Science Categories, Title, and Description. Categories Affiliation, Corresponding Author, Abstract, Keywords Plus, and DOI had the status “Good,” which corresponded to a slight lack of information on them in the submitted publications, and only the Keywords category was characterized as “Poor” (missing information in articles on keywords was 25.50%).
Web of Science classified the publications into 25 categories. Most articles were classified into the Genetics Heredity category (136 articles, 30.155%). The Pediatrics category included 108 articles (23.947%). Eighty-four articles were classified as Medicine Research Experimental (18.625%). Additionally, the top ten categories included Endocrinology Metabolism (83, 18.404%), Medical Laboratory Technology (58; 12.860%), Chemistry Analytical (41; 9.091%), Medicine General Internal (36; 7.982%), Biochemical Research Methods (28; 6.208%), Public Environmental Occupational Health (21; 4.656%) and Biochemistry Molecular Biology (20; 4.435%) (Figure 2).
3.1. Publication Trends and Citations
Two stages can be distinguished when assessing the dynamics of publications on the use of MS/MS for screening hereditary metabolic disorders. The first corresponds to the last decade of the 20th century, and during this period, there was a slow increase in the number of publications and their citations. The beginning of the second stage corresponds to the start of national programs of expanded newborn screening using MS/MS in North America [13,16,29,56,57], Europe [11,14,39,58], Australia [10,15], and some Asian countries [59,60,61] at the beginning of the 21st century. The most significant number of articles was published in 2020 (n=31); the same year corresponds to the most extensive total citations (n=1,320). The most significant number of citations per article was noted in 2023 (n=56.44), which indicates a steady increase in interest in this topic. Although a substantial number of countries are now using MS/MS for expanded newborn screening programs for IEM, in LMICs, the use of MS/MS is associated with financial challenges [45,62,63,64,65]. This makes selective screening programs relevant for them and explains the growing interest in the issue of using MS/MS in this area over time [23,66,67,68].
Figure 3 shows polynomial regression models fitted to determine the trend in the number of publications on the use of MS/MS in IEM screening (Figure 3A) and their citations (Figure 3B). Both models indicate significant correlations between the year and the number of articles published (R2 = 0.828) and between the year and the number of articles cited (R2 = 0.949). Models predict continued growth in publications and citations of articles in this area, which confirms that interest in this topic will naturally increase over time.
3.2. Analysis of Productivity and Cooperation for Countries, Institutions, and Authors
3.2.1. Country Analysis
3.2.1.1. Top Countries within the Countries’ Performance Analysis
The 451 articles included in the bibliometric analysis were published in 58 different countries spanning Asia, Europe, North America, South America, and Oceania (Figure 4A), with the top 10 countries accounting for more than 71% and the top 20 countries accounting for almost 90% of the total number of articles.
It is worth noting that the “Biblioshiny” web application of the R-studio software offers two options for determining the inclusion of contributing countries: counting the total number of authors from different countries and assessing the countries of the corresponding authors. The second way seems optimal as the number of authors per article varies and does not accurately reflect a country’s productivity.
Research into the use of MS/MS in IEM screening is mainly concentrated in high-income countries (Figure 4A,B). The US ranks first in the number of articles with 111 (24.61%), followed by China (76; 16.85%) and Germany (28; 6.21%).
The most frequently mentioned country was the United States (6,057), followed by Germany (1,486) and Australia (1,266) (Table 1). However, the distribution of positions based on average article citations places the US in 4th position (54.6), with the top three occupied by Australia (70.3), Saudi Arabia (69.4), and Austria (57.7) (Table 1).
When assessing the publishing activity of authors from different countries between 1991 and 2023, it is noticeable that publishing activity began to increase in the early 2000s (Figure 4B). In the decade preceding 2000, the few works were presented primarily by USA and Great Britain authors. The number of publications increased sharply when the era of national neonatal screening programs using MS/MS began. The leading countries in the number of publications and citations include the USA, China, Germany, Italy, Australia, Japan, Great Britain, Canada, Saudi Arabia, and Egypt (Table 1, Figure 4A,B).
3.2.1.2. Maps of Cooperation between Countries
The issue of IEM early diagnosis is of high importance for public health in all countries. Authors from 58 countries demonstrate global collaboration trends in research on using tandem mass spectrometry for IEM screening (Figure 5A,B).
The Multiple Countries Publication (MCP) is an essential indicator of international cooperation. MCP indicates the number of documents with at least one co-author from another country for each country, thus measuring the intensity of collaboration between countries. The ratio between SCP (Single Country Publication) and MCP determines the MCP Ratio, a high value that indicates intensive collaboration between authors from different countries when writing articles. Thus, the Netherlands, Germany, Saudi Arabia, Korea, Canada, and Austria have high MCP and MCP Ratios, according to Figure 5B. In contrast, the MCP for Turkey, India, Brazil, and Slovenia is zero, reflecting their low levels of international cooperation activity.
The collaboration map created in Vosviewer visualizes the cooperation situation between the leading countries. Out of 58 countries, Vosviewer showed 34 countries with more than three publications (Figure 6A,B). However, three countries (Greece, Iran, and Slovenia) had no connections with others and were not reflected on the visualization map. Thus, the final number of countries included in the analysis was 31.
The USA, Germany, Great Britain, and Canada have the highest intensity of cooperation. Maps of collaboration between countries represent 7 clusters, including the USA (orange), European countries (red, yellow, blue), Southeast Asia (blue), and Oceania (purple). The green cluster includes the Middle East and Canada (Figure 6A). Figure 6B, besides presenting the number of documents from collaborating countries, reflects their average citations. This parameter is highest in Australia and Saudi Arabia despite the smaller number of published articles.
In the analysis of collaboration between countries with more than three publications (Figure 6A), clusters are identified by color. Item (node) sizes correspond to the number of publications, and the distance between them indicates the strength of the co-authorship relationship. In Figure 6B, the item (nodes) sizes correspond to the number of publications, the color of the items (nodes) varies from dark blue to yellow according to the average article citations parameter, and the distance between them shows the strength of the connection according to the “Co-authorship” parameter.
3.2.2. Institutional analysis
3.2.2.1. Leading Institutions
Eight hundred fifty-nine institutions worldwide participated in IEM screening studies using MS/MS. Thirty-eight institutions had 10 or more articles, fifteen published 15 or more articles, and five leading institutions had more than 20 publications.
As shown in Figure 7A, Egyptian Knowledge Bank (EKB) (n 39; 8.65%) has the highest number of publications, followed by Cairo University (n 24; 5.32%), while the University Medical Center Hamburg-Eppendorf, University of Hamburg and the University of Sydney (n 21; 4.66%) rank third. Also in the top 10 most productive institutions are the Mayo Clinic (20), G. D’Annunzio University of Chieti-Pescara (19), National Taiwan University (18), the University of California System (18), and the University of Washington Seattle (18). Of the top 10 leading organizations, the most productive are the Egyptian Knowledge Bank (EKB) and Cairo University, even though the country they are located ranks 12th in productivity ranking.
An analysis of the scientific output distribution in the period under consideration shows that a surge of interest in using MS/MS in IEM screening in different organizations occurred at different times. Some universities have been involved in neonatal screening programs since the early 2000s, while others have been doing so in the last five years, such as Cairo University, Egyptian Knowledge Bank (EKB), and G. D’Annunzio the University of Chieti-Pescara (Figure 7B).
3.2.2.2. Maps of Institutions Cooperation
An analysis of collaborations between 859 institutions belonging to 58 countries is presented in the co-authorship collaboration map created in Vosviewer. The visualization map initially included 104 institutions with more than three publications. However, 13 were not included in the final visualization map because they had no connections with other organizations. Thus, only 91 organizations are represented on the cooperation map (Figure 8A,B).
Maps of collaboration between organizations in the field of co-authorship represent 12 clusters (Figure 8A). Institutions in Europe and the USA have the highest intensity of cooperation. Of particular note is that Egyptian institutions, which have the most significant number of publications in the field under consideration, are not included in the cooperation map.
In the analysis of collaboration between institutions with more than three publications (Figure 8A), clusters are identified by color, the size of the items (nodes) corresponds to the number of publications, and the distance between them shows the strength of the relationship regarding co-authorship. In Figure 8B, the sizes of the items correspond to the number of documents, and the distance between them shows the strength of the connection according to the “Citation” parameter.
Figure 8B shows the strength of the connection between the formed 6 clusters of organizations based on the “Citation” indicator. There is a tendency to include mainly territorially close institutions in clusters; for example, blue and cyan clusters mainly include organizations in Northern Europe, yellow – in Southern Europe, red – in Southeast Asia, purple – in North America, and green – in Australia. However, within each cluster, there are also quite geographically distant institutions, demonstrating trends in international cooperation between organizations and mutual interest in publishing articles.
3.2.3. Analysis by Authors
3.2.3.1. Authors’ Productivity Analysis
Two thousand six hundred eighty-two authors have published literature on using MS/MS in IEM screening, and five have published more than ten articles. Eighteen authors submitted papers written without co-authors. The average number of authors per document was 8.29. International author collaborations amounted to 17.74%.
Collectively, the top 10 authors published 109 papers, representing 24.2% of all publications in the field. The number of publications and citation rates of the ten most productive authors are summarized in Table 2.
The three authors with the most publications were Dietrich Matern (14), Georg F. Hoffmann (13), and Jerry Vockley (13). No less than the number of articles, the author’s publication activity is characterized by the indicator of fractional frequency or fractionalized number of authored documents (Table 2). Fractional authorship quantifies an individual author’s contributions to a published set of papers [54]. For instance, fractional frequency by Donald H. Chace is several times higher than the corresponding indicator of other top ten authors.
The indicators of total (Table 2) and local citations (Figure 9A) are also essential in assessing the author’s productivity. Three authors in the current selection had a total citation score above 1,000. The most frequently cited authors were Bridget Wilcken (1,372), Donald H. Chace (1,103), and Georg F. Hoffmann (1,024) (Table 2). In addition, the author’s local impact by H, G, and M indexes were analyzed (Table 2). The H- and G- indexes reflect authors’ productivity and citation rates. In contrast, the M-index demonstrates the relationship between the productivity and citation of the author and the number of years of intensive activity.
The productivity of the top 10 authors throughout their activity was also analyzed using the R package bibliometric matrix shown in Figure 9B. The graph represents periods of authors’ careers in the field described and allows for evaluating the productivity and citation of authors from the top ten.
The authors’ productivity in studying the use of MS/MS in IEM screening is described by Lotka’s law. Lotka’s law is an approximate inverse-square law, where the number of authors publishing a certain number of articles is a fixed ratio to the number of authors publishing a single article. In our case, the number of authors wrote one article on using MS/MS in IEM screening is 2,136, or 79.6% of the total authors (Figure 9C). The minority of authors who published many articles (in this case, four documents) is 4.1%.
3.2.3.2. Author Collaboration Maps
Figure 10A shows a visualization of collaboration between authors who have published at least three articles investigating the use of MS/MS in IEM screening. These authors formed 31 clusters. Collaboration between authors is reflected in the number of connections within clusters but is minimal between separate clusters. This is easily explained if we remember that there are few authors (amounting to about 4%) with more than four articles and, thus, more significant collaboration opportunities (Fig 9C). We found four authors who were not co-authors of any studies and worked alone.
Figure 10B visualizes a map of collaboration between authors by the “Citation” dimension created in Vosviewer. An Overlay Visualization layer was applied to evaluate the weights and scores of the “Citation among Authors” parameter. The normalized citation parameter is used to represent scores. The normalized number of citations for a document equals the number divided by the average number of citations of all documents published in one year and included in the data provided by VOSviewer. Normalization corrects for the fact that older documents had more time to be cited than more recent documents [69].
In Figure 10A, clusters are identified by color, the size of the items (nodes) corresponds to the number of publications, and the distance between them shows the strength of the connection according to the “Co-authorship” parameter. In Figure 10B, the sizes of the nodes correspond to the number of citations of the author; the color range of the node from dark blue to yellow shows the score for the normalized citation parameter.
3.3. Analysis by Journals
3.3.1. Prominent Journals
All articles (451) were published in 190 journals belonging to 78 publishing houses. The top three publishers that issued more than half of the articles reviewed were Elsevier (130 articles; 28.83%), Springer Nature (59; 13.08%), and Wiley (52; 11.53%).
Core sources by Bradford’s law and sources’ productivity over time are displayed in Figure 11A,B.
According to Bradford’s Law, journals are ranked in descending order of articles on a topic, forming sequential zones. In line with Bradford’s Law, the first zone included eight journals that published articles on the use of MS/MS in IEM screening that can be considered the best choice for researchers in the field.
The performance of the eight leading journals in the field of publications on the role of MS/MS in screening for IEM, defined according to Bradford’s Law, over the period 1991-2023, is presented in Figure 11B. This graph reflects the steady increase in interest to the designated problem in the scientific world. The increase in growth since 2011 is apparently due to the successful implementation of national neonatal screening programs for IEM using MS/MS in several countries, mainly LMICs, and the publication of research results. 2013, the Journal of Pediatric Endocrinology & Metabolism was introduced, and in 2018, the International Journal of Neonatal Screening. Both are currently included in the Core Sources defined according to the Bradford Law.
Table 3 shows the top 15 journals ranked by number of publications on using MS/MS for IEM screening.
To better assess the significance of these journals in studying the problem of using MS/MS in IEM screening, Table 3 also includes indicators of total citations, H-index, G-index, and M-index. Based on the totality of data, the most influential journal in this area is the Journal of Molecular Genetics and Metabolism (articles 41; total citation 1,226; H-index 23). Regarding total citations, Molecular Genetics and Metabolism are inferior to journals, occupying 2nd and 3rd places in the top list but with higher G and M indexes.
In addition to Molecular Genetics and Metabolism, the top five journals that published the most significant number of studies included the Journal of Inherited Metabolic Disease (24 publications; 1,397 citations), Clinical Chemistry (18; 1,865), Clinica Chimica Acta (18; 619), and International Journal of Neonatal Screening (14; 88). The total citation rate is the highest in Clinical Chemistry and the Journal of Inherited Metabolic Disease. However, these journals also have a more extended period of publication, from 1997 and 1998, respectively, which increases the total citation rate for published articles. On the contrary, the International Journal of Neonatal Screening, with a relatively low total citation index (88), has the highest M-index (1.167), which is due to high productivity and citation rates over a short period of activity (since 2018) comparing to other journals.
3.3.2. Journal Collaboration Maps
Figure 12A visualizes a map of collaborations between journals that have published at least three articles investigating the use of MS/MS in IEM screening. Thirty-two journals formed 6 clusters identified by color. The item (node) size corresponds to the number of publications. It is determined by the leading journals in each cluster: Molecular Genetics and Metabolism in the green cluster, Journal of Inherited Metabolic Disease in yellow, Clinical Chemistry in blue, Pediatrics in red, and Clinica Chimica Acta in purple. The distance between journals shows the strength of the connection according to the “Citation” parameter. The presence in the same cluster also demonstrates the collaboration between them in the field of citations.
Figure 12B shows interactions between journals based on citations of published papers on the topic under consideration. Similar to Figure 12A, the distance between journals serves as an estimate of the relationship between them based on citations. However, this visualization also allows for evaluating the level of total citation of sources by the size of items (nodes) and the parameter of normalized citation by their color. The nodes’ sizes correspond to the journal’s total number of citations of the journal; the color range of the node from dark blue to yellow shows the score for the “Normalized citation” parameter.
Co-citation relationships between journals are also visualized in Figure 12C, which shows how 108 journals form 5 clusters. The Journal of Inherited Metabolic Disease ranks first out of 2,350 co-cited journals (1,461 co-citations), followed by Clinical Chemistry (1,021) and Molecular Genetics and Metabolism (821).
3.4. Analysis by Papers
3.4.1. Highly Cited Papers. Analysis of Citation
Overall, 35 documents out of 451 analyzed have more than 100 citations. Table 4 includes the 15 most cited articles on MS/MS for IEM screening. The total number of citations for these 15 articles ranged from 148 to 483. The total citations are visualized in Figure 13 (ABCD) section A. The 15 most cited articles were published in 10 journals. Although the presented 15 articles are ranked by total citation, the “Local citation” indicator, the “Total citation,” and the LC/GC Ratio associated with these parameters are of great significance (Table 4, Figure 13B).
It is known that the “Global citation” (GC) parameter measures the impact of documents in the whole bibliographic database. It means any documents from the database (in our case, Web of Science) not included in the studied sample, represented by 451 articles, can be included in the citation. In contrast, the “Local citation” (LC) measures the number of citations a document has received from papers included in the analyzed collection. In that sense, “Local citation” more accurately measures a document’s impact in the studied sample.
For instance, the paper “Screening newborns for inborn errors of metabolism by tandem mass spectrometry,” which has the highest global citation rate, is also ranked first in the local citation. However, some of the 15 most cited articles have low local citations. Among them, “Neonatal screening for lysosomal storage disorders: feasibility and incidence from a national study in Austria” (8), “Untargeted metabolomic analysis for the clinical screening of inborn errors of metabolism” (8), “Natural history, outcome, and treatment efficacy in children and adults with glutaryl-CoA dehydrogenase deficiency” (9), and “Disorders of mitochondrial long-chain fatty acid oxidation and the carnitine shuttle” (0).
3.4.2. Analysis of Co-Citation
When constructing visualization maps in VOSviewer, we used methods for assessing co-citation and bibliographic coupling, allowing for building significantly denser networks than networks of co-authorship or direct citation. Using co-citation maps and bibliographic coupling, the thematic and semantic structure of the studied topic, “Application of MS/MS in IEM screening,” can be presented more clearly. The co-citation map (Figure 13C) shows sources that have been co-cited more than 20 times. The sample of 451 articles contains 46 such papers combined into 3 clusters on the visualization map.
In the co-citation map of publications from the study sample (N 451), presented in Figure 13C, the co-citation indicator is visualized as the frequency with which other papers cite two articles together. The frequency of co-citation determines the semantic proximity of publications.
On the bibliographic coupling visualization map (Figure 13D), the proximity of two publications is determined by the citation of the same sources in them. Similar sets of references in articles increase the strength of the connection between them and indicate proximity within the topic being studied.
3.5. Analysis of Keywords
3.5.1. Authors’ and Additional (Plus) Keywords
The authors’ and additional keywords have been studied using Biblioshiny and VOSviewer.
A total of 1,655 keywords are analyzed in this study. The top 20 author keywords and the top 20 additional keywords with the highest frequency of matches are displayed in Figure 14A–D, sections A, and B.
Among the authors’ keywords, “newborn screening” (150) has the highest frequency of occurrence, followed by “inborn errors of metabolism” (116) and “tandem mass spectrometry” (111). Among the additional keywords, “tandem mass spectrometry” (241) has the highest frequency of occurrence, followed by “inborn errors” (214) and “metabolism” (175). The cumulative frequencies of occurrence of the authors’ and additional keywords are presented in sections A and B in Figure 14, while sections C and D present a chronological analysis of the most significant keywords. The following keywords have the highest frequency of occurrence: newborn screening (192), mass spectrometry (116), inborn errors (96), expanded newborn (42), and blood spots (32).
Trending topics of keywords and the evolution of the authors’ keywords are presented in Figure 15A,B. The peak citations of the abovementioned keywords occurred between 2011 and 2015 (Figure 15, section A), corresponding to when national neonatal screening programs for IEM using MS/MS were actively conducted and reported in most European countries, the USA, Australia, and some Asian countries. However, screening programs have only been successfully implemented in high-income countries. Financial problems associated with expensive neonatal screening programs made their implementation problematic in LMICs, necessitating the search to solve these challenges by implementing selective screening programs for IEM. As such, the current priority is to obtain screening results for IEM in developing countries, as evidenced by the fact that “developing countries” is the most commonly used term in 2023 (Figure 15B).
3.5.2. Keywords Co-occurrence Maps and Relationships between Authors, Keywords, and Sources
The co-occurrence of keywords was analyzed using the visual mapping program VOSviewer (Figure 16A–D, section A). The authors’ keywords and keywords plus were analyzed together. For the 1,655 original and additional keywords found in the articles’ texts, the minimum occurrence threshold was set to 5 times, which resulted in 140 extractions. The largest items (nodes) among the seven clusters in Figure 16A are Tandem mass-spectrometry, Inborn errors of metabolism, and newborn screening, which coincides with the topic of the presented study. After removing keywords such as Tandem mass-spectrometry, mass spectrometry, Inborn errors of metabolism, inborn error of metabolism, Inborn errors of metabolism (IEM), metabolic disorders, inborn errors, inherited metabolic diseases screening, which could affect the analysis, 128 keywords formed seven clusters again. However, the nodal keywords were Newborn screening, Metabolism, Disorders, Dried blood spots, Deficiency, Diagnosis, and Acylcarnitines (Figure 16B).
Additionally, an analysis of keywords extracted from the titles of the analyzed articles and their abstracts was carried out. After removing keywords such as Tandem mass-spectrometry, mass spectrometry, Inborn errors of metabolism, inborn error of metabolism, Inborn errors of metabolism (IEM), metabolic disorders, inborn errors, inherited metabolic diseases screening, out of 10,123 keywords, 171 overcome the established threshold of occurrence in 20 words. The most relevant 60% (95) were included in the final analysis (Figure 16C).
Three-field plots were constructed in Bibliometrix to evaluate relationships between authors, keywords, and journals (Figure 16D). The most significant number of references to trending keywords such as newborn screening (9), Tandem mass-spectrometry (5), and Inborn errors of metabolism (5) was provided by the author Wang Y. The most significant number of communications with journals that published articles on the topic under consideration (6) was noted in Wang Y., La Marca G., and Matern D.
4. Discussion
The last decade of the 20th century was marked by publications proposing MS/MS as a new screening tool for inherited metabolic diseases, including neonatal screening. The first publication revealing the potential of MS/MS in the field of screening was the publication of a short report by Millington et al. in the Proceedings Papers of the 1989 Annual Meeting of the Society for the Study of Inborn Errors of Metabolism (not included in the present study) [70]. The first article in the sample under review, published in 1991, analyzing diagnostic markers of genetic disorders in human blood and urine using tandem mass spectrometry, was also by Millington et al. [53]. The first papers on using MS/MS in IEM screening were published in the USA. At the first stage of publications in this area, which corresponds to the 90s of the 20th century, and at the second, in the 21st century, the leadership of the United States is undeniable (Figure 4B).
Pilot studies of MS/MS use for newborn screening were first initiated in the USA, in Pennsylvania, Ohio, North Carolina, and Louisiana in 1992-1999 [71]. A pilot project using universal tandem mass spectrometry for newborn screening began in North Carolina in 1997 to determine the frequency and feasibility of screening for fatty acid oxidation disorders, organic acids, and selected amino acids [3]. As of 1998, twenty-six US states used MS/MS to screen for IEM in newborns [38], and this moment corresponds to the surge in publications in 1997-1999 (Figure 3A,B). However, it is worth noting the involvement of Saudi Arabia in the use of MS/MS as a screening tool (Figure 4A, Table 1), which was especially evident at an early stage in the 90s, owing to the publications of Rashed et al. [1,72,73,74]. Involvement at the level of countries, institutional communities, and individual authors in the problem under study is undoubtedly determined by the current capabilities, including financial and technical ones, and the need to use the IEM diagnostic method. Thus, Saudi Arabia’s involvement may be due to the significance of increasing the frequency of IEM in the Middle East region due to the high degree of consanguinity and the country’s financial capabilities to implement screening programs for IEM using MS/MS [61,68,75,76].
The US leadership in the field of IEM screening using MS/MS is implicated by differences in approaches to the number of diseases included in the neonatal screening panel and, in general, differences in the pace of screening programs in the USA and other countries, including Europe. In Europe, initially, only certain diseases were recommended for inclusion in the neonatal screening panel for MS/MS, such as phenylketonuria (PKU), glutaric aciduria type 1 (GA1), and medium-chain acyl-coenzyme A dehydrogenase deficiency (MCAD) [4,12,14,38]. In Great Britain, at the beginning of the 21st century, laboratories routinely used MS/MS to screen for phenylketonuria, and only laboratories participating in the 2-year pilot study screened for MCAD. In general, the ability of MS/MS to detect other IEMs was questioned [77]. In the analyzed articles’ texts, “Phenylketonuria,” “CoA dehydrogenase deficiency,” and “Medium-chain acyl-CoA” were among the most frequently used original (Figure 14A,C) and additional keywords (Figure 14B,D). In Germany, the number of IEMs subject to screening was limited compared to the US during that period. On the contrary, an extensive range of IEM was recommended in the USA, including rare ones or those with unproven clinical significance [57]. In the USA, MS/MS has been widely used for newborn screening for up to 55 abnormal biochemical conditions, while in Germany, the UK, and Switzerland, for the limited detection of only a few diseases [9,78].
Australia should also be considered a leader in the use of MS/MS in IEM screening (Figure 4A, Table 1), which is especially significant at the first stage of the MS/MS introduction in neonatal screening, in the 90s of the 20th century (Figure 4B). The University of Sydney tops the list of significant affiliations (Figure 7A,B). Australia’s leading position is mainly due to the high citation rates of B. Wilcken’s papers (Table 2), in particular, Wilcken et al. [15], which ranks first in the list of the 15 most cited articles on the topic under study and has the highest Total Citation index 483, average citations per year (TC per Year) 23.0, and Local Citations 130 (Table 4).
MS/MS technology has offered a new vision for newborn screening programs, allowing the detection of dozens of metabolic abnormalities in a single test from a single small spot of dried blood. In the first decade of the 21st century, after several million newborns worldwide were screened and more than 500 cases of inherited metabolic diseases were identified, screening newborns with MS/MS has proven its advantages as a clinical screening technology [13,29]. This marked a new phase in the use of MS/MS for IEM screening, and the early 2000s saw a sharp rise in the number of studies on this topic (Figure 3A,B). Undoubtedly, a significant contribution, especially at the initial stage, to the promotion of the use of MS/MS in IEM screening was made by publications in the field of clinical and analytical chemistry and clinical biochemistry (Figure 2) [1,30,56,79], published in the journals Clinica Chimica Acta, Clinical Biochemistry, Analytical Chemistry, included in the 15 most relevant journals that published papers on the topic under study (Table 3) and in 8 journals that formed the first zone according to Bradford’s Law (Figure 11A).
Newborn screening deals with rare diseases and its benefits cannot be easily demonstrated without extensive studies [80]. The adoption of national neonatal screening programs has resulted in the publication of study results [10,15,16,31,59,81,82,83,84,85], case reports [86,87,88], systematic reviews and meta-analyses [89,90], and expert reports and opinions [38,91,92,93], development of methodological recommendations [94,95,96] and clinical guidelines [32,94]. Many papers on the topic under consideration have high rates of global and local citations (Table 4, Figure 13A,B). Interest in using MS/MS for IEM screening continues to increase, with publications and citations peaking in 2020 (Figure 3A,B).
National newborn screening programs based on MS/MS and other newborn screening technologies show significant variation in the screening panel’s number and types of diseases [31,35]. Pilot neonatal screening programs using MS/MS have been launched in Europe [2,31,97,98], Australia [10,15], Asia - Japan [59], Korea [60], China [85,99], Taiwan [84] already at the end of the 20th – beginning of the 21st century.
The implementation of MS/MS in neonatal screening programs in a significant part of developed countries was completed in the 2010s in Europe - in Germany [35,100], Austria [98,101], Italy [41,102,103], Spain [104], Portugal [105], Denmark [31], in Asia - Taiwan [84,106] and Singapore [107].
Currently, neonatal screening programs for MS/MS are actively implemented in European countries: Germany [108,109], Slovenia [25,34,110], Italy [111,112], Spain [113], as well as in China [46,47,114,115,116,117,118,119,120] (Figure 4A,B). The outcome of these programs is to estimate the incidence of various IEMs in newborns and the geographic distribution of these disorders. The incidence varies within different racial and ethnic groups, with the predominance of one or another IEM in certain groups [25]. Differences in the frequency of certain IEMs determine the inclusion of different IEMs in national screening panels [19,23,119,121]. This, in turn, determines differences in the relevance and frequency of using different keywords in different regions, countries, and periods (Figure 14C,D and Figure 15A,B).
In China, the most common hereditary diseases, especially in newborns/infants, are hyperphenylalaninemia (HPA), citrine deficiency, primary carnitine deficiency (PCD), methylmalonic acidemia (MMA), and multiple-CoA dehydrogenase deficiency (MADD) [19,115,117]. MMA has been frequently detected in Japan, China, and India. ENBS found differences in overall IEM rates across countries: 1:8,557 in Japan, 1:7,030 in Taiwan, 1:13,205 in South Korea, and 1:2,200 in Germany. Frequently detected diseases included propionic acidemia (PA) and PKU in Japan, 3-methylcrotonyl-CoA carboxylase deficiency (MCCD) and PKU in Taiwan, MCCD and citrullinemia type I citrullinemia I (CIT I) in South Korea, as well as PKU and MCAD in Germany.
Thus, the incidence rate of IEM varies among countries. Moreover, the disease spectra of inherited metabolic diseases (IMD) detected by selective screening differ from those detected by expanded newborn screening [23]. The overall incidence of fatty acid oxidation disorders (FAOD) in Asians is much lower than in Caucasians. The significant prevalence and apparent benefit of ENBS for MCAD screening has only been demonstrated in countries with a high percentage of Caucasians [93]. This determines the focus of individual countries, organizations, and authors on the development of diagnostics of some IEM groups relevant to them and the formation of collaborations between authors (Figure 10A,B), organizations (Figure 8A,B), and countries (Figure 5A,B and Figure 6A,B) based on these interests.
It is noteworthy that even within the same country, the degree of formation and development of neonatal screening programs may vary. In China, the spread of MS/MS technology in neonatal screening in some regions, particularly the North [122], Midwest [85,123], and Hong Kong [85,124], was implemented later than in other parts of mainland China.
In some countries, selective screening programs for IEM using MS/MS have been implemented concurrently with expanded newborn screening. This IEM screening strategy has been actively used in China [87,88,125,126,127], Korea [60], Slovenia [25,34,110], India [64], Turkey [21], and Egypt [128].
It should be noted that there are some financial issues with carrying out ENBS using MS/MS, in particular, in South-Eastern European countries [129]. In India, financial constraints in the health care system have prevented the implementation of a full-scale enhanced neonatal screening program. Pilot studies using MS/MS to assess the prevalence of IEM have been initiated in Andhra Pradesh as early as 2004 [64,130], and selective screening for IEM in India continues to this day [131,132]. There is a high prevalence of IEMs, but more extensive studies are required to estimate their true prevalence in India. One of the problems associated with IEM screening programs in India is the lack of international collaboration in conducting research and publishing its results, as reflected by the high SCP (Single Country Publication) and zero MCP (Multiple Countries Publication) (Figure 5B) and lack of representation India on the international cooperation visualization map (Figure 6A,B).
Many developing countries do not yet have national neonatal screening programs [63]. In most developing countries, there are financial challenges to implementing expanded neonatal screening programs. Pilot programs with limited observations or selective screening programs are being implemented in these settings. Pilot programs for expanded newborn screening have been implemented in Turkey [76] and Malaysia [133]. Some progress in government support and expansion of neonatal screening programs has recently been achieved in India [134]. Training in genetic counseling has been expanding in Asia and Africa [63].
An expanded neonatal program requires an expanded infrastructure for interpreting findings, reporting, treatment, and counseling [38]. Well-organized logistics of the screening program, from the screening laboratory to central clinical management, are essential [31]. This may be why there is little information about newborn screening efforts in Nepal, Cambodia, Laos, and Pacific Island countries, and no organized screening efforts are reported from there. As approximately half of the world’s births occur in the Asia-Pacific region, it is necessary to continue ongoing efforts to introduce and expand screening programs there so that children can achieve the same health status as children in more developed parts of the world [135].
A series of selective screening programs have been implemented in Egypt [67,68], Saudi Arabia [75], and Morocco [136]. In countries with high rates of consanguineous marriage, the incidence of many IEMs is significantly higher than in countries without such a problem [61,68,76]. Pilot studies performed in some Middle Eastern countries show that the incidence of inborn metabolic disorders is higher in the region than anywhere else in the world due to consanguinity. This problem is relevant in Bahrain [62], Turkey [21,76], Egypt [67,68], Saudi Arabia [75], Lebanon [45], India [132,134], and Oman [61]. Using authors’ and additional keywords in visualization maps confirms a relatively high frequency of the term “consanguinity” (Figure 15A - green cluster, Figure 15B - orange cluster).
Analysis of authors’ and additional keywords, as well as keywords extracted from the articles’ abstracts and titles included in the current study, indicates their multiplicity, which is associated with both the wide range of IEMs and the rarity of IEMs in general (Figure 14A,B and Figure 15A,B). Keywords show changes in frequency of use associated with time trends (Figure 14C,D and Figure 15A,B), which is related to changes in the relevance of individual keywords, reflecting different directions in using MS/MS as an IEM screening tool over different periods.
One of the current trends in IEM is the development of new or improved diagnostic and treatment methods. The clinical effectiveness of MS/MS screening is unquestionable in some conditions but absent in others. The assessment of rarer diseases is more complex [20,137]. Next-generation sequencing in the form of whole exome and whole genome analysis is now strongly proposed as a potential alternative to mass spectrometric screening of newborns for IEM [20,138,139,140]. These methods have the advantages of high throughput, high accuracy, and the potential ability to detect all types of genetic disorders, even beyond IEMs, with almost equal sensitivity and specificity. However, major limiting factors include data interpretation dilemmas and the relatively high cost of such methods. As an alternative, a combination of MS/MS and sequencing is proposed [114,116,127,141,142]. This trend is reflected in the increasing frequency of use the term “next-generation sequencing,” as shown by visualization maps of the occurrence of keywords (Figure 15A - blue cluster, Figure 15B - red cluster), a graph of the evolution of authors’ keywords (Figure 15B) and a three-field graph, reflecting the relationship between authors, author keywords and sources (Figure 16D). Besides, the frequency of use the term “molecular genetics” in publications on MS/MS in IEM screening, has increased in recent years (Figure 15A).
One option for using MS/MS for IEM selective screening is the retrospective analysis of dry blood spots (DBS) stored after neonatal screening. This option is used in developing countries with financial constraints, and expanded newborn screening using MS/MS is impossible. In this regard, the issue of storing stains and their storage conditions is being studied. Among the papers on this topic are those from Asia because storage conditions for DBS in hot and humid climates are critical [134,143]. However, the issue of storage conditions for DBS and the development of references and correction factors for metabolites is relevant not only for developing countries due to recent trends in the creation of biobanks and using stored samples for metabolomic studies, including disease prediction and understanding the basic molecular mechanisms of disease development [144,145,146].
Thus, different regions and countries are currently at entirely different stages regarding using MS/MS in neonatal IEM screening. Some countries do not provide any data on screening for IEM, as research in this direction has not been carried out (Figure 4A). Developed countries have undergone pilot and experimental studies, and neonatal screening using MS/MS is now part of their national health programs.
Expanding screening programs has resulted in high heterogeneity in the IEMs included in different ENBS programs. In this regard, two unified screening panels have been proposed by competent organizations in the USA and the European Union [147]. Currently, attention in developed countries is focused on the special considerations and limitations of newborn screening in sick and premature infants and some of the ethical issues associated with newborn screening. New disorders being considered for testing and new technologies that may be used for newborn screening are also discussed [116,148,149]. New therapeutic modalities, such as enzyme replacement therapy and substrate reduction therapy, are being developed for many inborn errors of metabolism [20].
Some countries are at the stage of introducing MS/MS screening into public health programs. Some low-income countries have piloted expanded newborn screening programs or sporadic selective screening programs for IEM. In Latin America [96,150,151,152,153,154], some countries in Africa [67,68,136], the Middle East [45,62,75,76], and the Asia-Pacific region [24,133,135,155], there are some pockets of activity where new NBS programs are designed by partnerships between governments, non-governmental organizations, academia, the private sector, and civil society [156].
Thus, the performed bibliographic analysis highlighted substantial unevenness in the development of screening programs based on MS/MS on a global scale. However, the data obtained made it possible to identify the main directions for future screening technologies to detect inherited metabolic diseases. These positive aspects of the study can be referred to as undoubtful advantages. To our knowledge, we are the first researchers who tried to analyze the current bibliography on MS/MS neonatal screening at such a comprehensive level across countries, institutions, authors, journals, papers, and keywords.
Along with that, the study had inevitable limitations:
- We used only the core WOS collection to search for relevant sources. The current study did not consider other databases, such as Scopus and MEDLINE. WOS is the most commonly used database in scientometrics, and Biblioshiny and VOSviewer have identified a format for recording metadata from WOS.
- Only articles in English were included.
- Proceeding papers, book chapters, meeting abstracts, editorial materials, early access articles, letters, and notes were not included in the study.
- The total citation rate for newer articles is lower, which can be considered a manifestation of the methodological weakness of the bibliometric analysis. However, this is covered by the average citation indicator per period (year).
- Bibliometric and scientometric analysis of articles indexed in the WOS database focused only on metadata, not their content. Analysis of the full text of the included articles and their scientific content was not the purpose of the research as being beyond the scope of this article. Besides, analyzing the textual content of the abstracts was also not the purpose of our study. Article metadata were sources of information about authors and their countries/institutions to assess their productivity, collaboration, and keyword trends.
- The textual content of some images displayed by Biblioshiny and VOSviewer is incomplete.
5. Conclusions
As mentioned, this study was the first to explore trends in the use of MS/MS in IEM screening from 1991 to 2023 through detailed bibliometric analysis. We identified publication and citation trends based on 451 articles retrieved from WoS. We analyzed the productivity and collaboration of countries, organizations, authors, and sources to identify the research status of MS/MS utilization for IEM screening. Keywords’ and co-citation analysis identified the most relevant current research directions and future areas of interest.
Based on the presented analysis, future research areas could include “screening for IEM in developing countries,” “selective screening for IEM,” “new treatments for IEM,” “new NBS programs,” “new disorders considered for MS/MS testing,” “ethical issues related to newborn screening,” “new technologies that may be used in the future for newborn screening,” and the “use of MS/MS and gene sequencing combination.”
Supplementary Materials
No supplementary materials are provided for the present article. The project in which the present bibliographic analysis has been performed was registered on clinicaltrials.gov (https://www.clinicaltrials.gov/study/NCT05910151) on 16 June 2023. All supporting information relevant to the project is in the clinicaltrials.gov Register (https://www.clinicaltrials.gov/study/NCT05910151) [accessed on 16 June 2023] and in a publicly available repository, osf.io (https://osf.io/cmrh7/) [accessed on 16 July 2023.]
Author Contributions
Conceptualization, V.K., and G.Z.; methodology, V.K., and G.Z.; software, S.B., and V.K.; validation, G.Z., V.K., and S.B.; formal analysis, G.B.; investigation, A.T., Y.K., and Z.Z.; resources, L.S.; data curation, A.T., Y.K., and L.S.; writing—original draft preparation, V.K.; writing—review and editing, V.K., G.Z., and S.B.; visualization, L.S.; supervision, G.Z.; project administration, V.K.; funding acquisition, G.B., and A.T. All authors have read and agreed to the published version of the manuscript.
Funding
The project was funded by the Science Committee of the Ministry of Science and Higher Education of the Republic of Kazakhstan, grant No. AP14869996. The APC is funded by the Science Committee of the Ministry of Science and Higher Education.
Institutional Review Board Statement
Not applicable for bibliometric analysis.
Informed Consent Statement
Not applicable.
Data Availability Statement
The data obtained in the project on selective screening for inborn errors of metabolism using tandem mass spectrometry in West Kazakhstan children is openly available at (https://www.clinicaltrials.gov/study/NCT05910151) [accessed on 16 June 2023] and in a repository osf.io (https://osf.io/cmrh7/) [accessed on 16 July 2023.]
Conflicts of Interest
The authors declare no conflicts of interest.
Abbreviations
- CIT I, citrullinemia I
- DBS, dry blood spot
- ENBS, expanded newborn screening
- FAOD, fatty acid oxidation disorders
- GA I, glutaric aciduria type I, glutaryl-CoA dehydrogenase deficiency
- GC-MS, gas chromatography-mass spectrometry
- НРА, hyperphenylalaninemia
- IEM, inborn errors of metabolism
- IMD, inherited metabolic diseases
- LC-MS/MS, liquid chromatography-tandem mass spectrometry
- MADD, multiple-CoA dehydrogenase deficiency
- MCAD, medium-chain acyl-coenzyme A dehydrogenase deficiency;
- MCCD, 3-methylcrotonyl-CoA carboxylase deficiency
- MCP, multiple countries’ publication
- MMA, methylmalonic acidemia
- MS/MS, tandem mass spectrometry
- NGS, next-generation sequencing
- PA, propionic acidemia
- PKU, phenylketonuria
- PCD, primary carnitine deficiency
- SCP, single country publication
References
- Rashed, M.S.; Bucknall, M.P.; Little, D.; Awad, A.; Jacob, M.; Alamoudi, M.; Alwattar, M.; Ozand, P.T. Screening blood spots for inborn errors of metabolism by electrospray tandem mass spectrometry with a microplate batch process and a computer algorithm for automated flagging of abnormal profiles. Clin Chem. 1997, 43(7), 1129–1141. [Google Scholar] [CrossRef] [PubMed]
- Simonsen, H.; Jensen, U.G.; Brandt, N.J.; Christensen, E.; Skovby, F.; Nørgaard-Pedersen, B. Design of a pilot study to evaluate tandem mass spectrometry for neonatal screening. Southeast Asian J Trop Med Public Health 1999, 30 (Suppl. 2), 166–169. [Google Scholar] [PubMed]
- Frazier, D.M.; Millington, D.S.; McCandless, S.E.; Koeberl, D.D.; Weavil, S.D.; Chaing, S.H.; Muenzer, J. The tandem mass spectrometry newborn screening experience in North Carolina: 1997-2005. J Inherit Metab Dis. 2006, 29(1), 76–85. [Google Scholar] [CrossRef] [PubMed]
- Seymour, C.A.; Thomason, M.J.; Chalmers, R.A.; Addison, G.M.; Bain, M.D.; Cockburn, F.; et al. Newborn screening for inborn errors of metabolism: a systematic review. Health Technol Assess (Winchester, England) 1997, 1(11), i–95. [Google Scholar] [CrossRef]
- Jones, P.M.; Bennett, M.J. The changing face of newborn screening: diagnosis of inborn errors of metabolism by tandem mass spectrometry. Clin Chim Acta 2002, 324(1-2), 121–128. [Google Scholar] [CrossRef] [PubMed]
- Chace, D.H.; Kalas, T.A.; Naylor, E.W. The application of tandem mass spectrometry to neonatal screening for inherited disorders of intermediary metabolism. Annu Rev Genomics Hum Genet. 2002, 3, 17–45. [Google Scholar] [CrossRef] [PubMed]
- Garg, U.; Dasouki, M. Expanded newborn screening of inherited metabolic disorders by tandem mass spectrometry: clinical and laboratory aspects. Clin Biochem. 2006, 39(4), 315–332. [Google Scholar] [CrossRef] [PubMed]
- Therrell, B.L.; Adams, J. Newborn screening in North America. J Inherit Metab Dis. 2007, 30(4), 447–465. [Google Scholar] [CrossRef] [PubMed]
- Rinaldo, P.; Tortorelli, S.; Matern, D. Recent developments and new applications of tandem mass spectrometry in newborn screening. Curr Opin Pediatr. 2004, 16(4), 427–433. [Google Scholar] [CrossRef] [PubMed]
- Pitt, J.J.; Eggington, M.; Kahler, S.G. Comprehensive screening of urine samples for inborn errors of metabolism by electrospray tandem mass spectrometry. Clin Chem. 2002, 48(11), 1970–1980. [Google Scholar] [CrossRef]
- Mueller, P.; Schulze, A.; Schindler, I.; Ethofer, T.; Buehrdel, P.; Ceglarek, U. Validation of an ESI-MS/MS screening method for acylcarnitine profiling in urine specimens of neonates, children, adolescents and adults. Clin Chim Acta 2003, 327(1-2), 47–57. [Google Scholar] [CrossRef] [PubMed]
- Carpenter, K.H.; Wiley, V. Application of tandem mass spectrometry to biochemical genetics and newborn screening. Clin Chim Acta 2002, 322(1-2), 1–10. [Google Scholar] [CrossRef] [PubMed]
- Chace, D.H.; Kalas, T.A.; Naylor, E.W. Use of tandem mass spectrometry for multianalyte screening of dried blood specimens from newborns. Clin Chem. 2003, 49(11), 1797–1817. [Google Scholar] [CrossRef] [PubMed]
- Pandor, A.; Eastham, J.; Beverley, C.; Chilcott, J.; Paisley, S. Clinical effectiveness and cost-effectiveness of neonatal screening for inborn errors of metabolism using tandem mass spectrometry: a systematic review. Health Technol Assess (Winchester, England) 2004, 8(12), iii–121. [Google Scholar] [CrossRef] [PubMed]
- Wilcken, B.; Wiley, V.; Hammond, J.; Carpenter, K. Screening newborns for inborn errors of metabolism by tandem mass spectrometry. N Engl J Med. 2003, 348(23), 2304–2312. [Google Scholar] [CrossRef] [PubMed]
- Marsden, D. Expanded newborn screening by tandem mass spectrometry: the Massachusetts and New England experience. Southeast Asian J Trop Med Public Health 2003, 34 (Suppl. 3), 111–114. [Google Scholar] [PubMed]
- Raghuveer, T.S.; Garg, U.; Graf, W.D. Inborn errors of metabolism in infancy and early childhood: an update. Am Fam Physician 2006, 73(11), 1981–1990. [Google Scholar] [PubMed]
- Mak, C.M.; Lee, H.C.; Chan, A.Y.; Lam, C.W. Inborn errors of metabolism and expanded newborn screening: review and update. Crit Rev Clin Lab Sci. 2013, 50(6), 142–162. [Google Scholar] [CrossRef] [PubMed]
- Han, L.; Han, F.; Ye, J.; Qiu, W.; Zhang, H.; Gao, X.; Wang, Y; Ji, W.; Gu, X. Spectrum analysis of common inherited metabolic diseases in Chinese patients screened and diagnosed by tandem mass spectrometry. J Clin Lab Anal. 2015, 29(2), 162–168. [Google Scholar] [CrossRef]
- Elmonem, M.A.; and van den Heuvel, L.P. Editorial: Newborn Screening for Inborn Errors of Metabolism: Is It Time for a Globalized Perspective Based on Genetic Screening? Front Genet. 2021, 12, 758142. [Google Scholar] [CrossRef]
- Ozben, T. Expanded newborn screening and confirmatory follow-up testing for inborn errors of metabolism detected by tandem mass spectrometry. Clin Chem Lab Med. 2013, 51(1), 157–176. [Google Scholar] [CrossRef] [PubMed]
- Champion, M.P. An approach to the diagnosis of inherited metabolic disease. Arch Dis Child Educ Pract Ed. 2010, 95(2), 40–46. [Google Scholar] [CrossRef] [PubMed]
- Shibata, N.; Hasegawa, Y.; Yamada, K.; Kobayashi, H.; Purevsuren, J.; Yang, Y.; Dung, V.C.; Khanh, N.N.; Verma, I.C.; Bijarnia-Mahay, S.; et al. Diversity in the incidence and spectrum of organic acidemias, fatty acid oxidation disorders, and amino acid disorders in Asian countries: Selective screening vs. expanded newborn screening. Mol Genet Metab Rep. 2018, 16, 5–10. [Google Scholar] [CrossRef] [PubMed]
- Sarker, S.K.; Islam, M.T.; Biswas, A.; Bhuyan, G.S.; Sultana, R.; Sultana, N.; Rakhshanda, S.; Begum, M.N.; Rahat, A.; Yeasmin, S.; et al. Age-Specific Cut-off Values of Amino Acids and Acylcarnitines for Diagnosis of Inborn Errors of Metabolism Using Liquid Chromatography Tandem Mass Spectrometry. Biomed Res Int. 2019, 2019, 3460902. [Google Scholar] [CrossRef] [PubMed]
- Lampret, B.R.; Murko, S.; Tanšek, M.Ž.; Podkrajšek, K.T.; Debeljak, M.; Šmon, A.; Battelino, T. Selective Screening for Metabolic Disorders in the Slovenian Pediatric Population. J Med Biochem. 2015, 34(1), 58–63. [Google Scholar] [CrossRef] [PubMed]
- Dietzen, D.J.; Bennett, M.J.; Lo, S.F.; Grey, V.L.; Jones, P.M. Dried Blood Spot Reference Intervals for Steroids and Amino Acids in a Neonatal Cohort of the National Children’s Study. Clin Chem. 2016, 62(12), 1658–1667. [Google Scholar] [CrossRef]
- van Karnebeek, C.D.; Stockler-Ipsiroglu, S. Early identification of treatable inborn errors of metabolism in children with intellectual disability: The Treatable Intellectual Disability Endeavor protocol in British Columbia. Paediatr Child Health. 2014, 19(9), 469–471. [Google Scholar] [CrossRef] [PubMed]
- Hwu, W.L.; Chien, Y.H.; Lee, N.C.; Wang, S.F.; Chiang, S.C.; Hsu, L.W. Application of mass spectrometry in newborn screening: about both small molecular diseases and lysosomal storage diseases. Top Curr Chem. 2014, 336, 177–196. [Google Scholar] [CrossRef] [PubMed]
- Chace, D.H.; Kalas, T.A. A biochemical perspective on the use of tandem mass spectrometry for newborn screening and clinical testing. Clin Biochem. 2005, 38(4), 296–309, Erratum in: Clin Biochem. 2005, 38(5), 495. [Google Scholar] [CrossRef]
- Chace, D.H. Mass spectrometry in newborn and metabolic screening: historical perspective and future directions. J Mass Spectrom. 2009, 44(2), 163–170. [Google Scholar] [CrossRef]
- Lund, A.M.; Hougaard, D.M.; Simonsen, H.; Andresen, B.S.; Christensen, M.; Dunø, M.; Skogstrand, K.; Olsen, R.K.; et al. Biochemical screening of 504,049 newborns in Denmark, the Faroe Islands and Greenland--experience and development of a routine program for expanded newborn screening. Mol Genet Metab. 2012, 107(3), 281–293. [Google Scholar] [CrossRef]
- Dietzen, D.J.; Rinaldo, P.; Whitley, R.J.; Rhead, W.J.; Hannon, W.H.; Garg, U.C.; Lo, S.F.; Bennett, M.J. National academy of clinical biochemistry laboratory medicine practice guidelines: follow-up testing for metabolic disease identified by expanded newborn screening using tandem mass spectrometry; executive summary. Clin Chem. 2009, 55(9), 1615–1626. [Google Scholar] [CrossRef] [PubMed]
- Bhattacharya, K.; Wotton, T.; Wiley, V. The evolution of blood-spot newborn screening. Transl Pediatr. 2014, 3(2), 63–70. [Google Scholar] [CrossRef] [PubMed]
- Lampret, B.R.; Remec, Ž.I.; Torkar, A.D.; Tanšek, M.Ž.; Šmon, A.; Koračin, V.; Čuk, V.; Perko, D.; Ulaga, B.; Jelovšek, A.M.; et al. Expanded Newborn Screening Program in Slovenia using Tandem Mass Spectrometry and Confirmatory Next Generation Sequencing Genetic Testing. Zdr Varst. 2020, 59(4), 256–263. [Google Scholar] [CrossRef] [PubMed]
- Lindner, M.; Gramer, G.; Haege, G.; Fang-Hoffmann, J.; Schwab, K.O.; Tacke, U.; Trefz, F.K.; Mengel, E.; Wendel, U.; Leichsenring, M.; et al. Efficacy and outcome of expanded newborn screening for metabolic diseases--report of 10 years from South-West Germany. Orphanet J Rare Dis. 2011, 6, 44. [Google Scholar] [CrossRef] [PubMed]
- Wilcken, B.; Haas, M.; Joy, P.; Wiley, V.; Bowling, F.; Carpenter, K.; Christodoulou, J.; Cowley, D.; Ellaway, C.; Fletcher, J.; et al. Expanded newborn screening: outcome in screened and unscreened patients at age 6 years. Pediatrics 2009, 124(2), e241–248. [Google Scholar] [CrossRef] [PubMed]
- Norman, R.; Haas, M.; Chaplin, M.; Joy, P.; Wilcken, B. Economic evaluation of tandem mass spectrometry newborn screening in Australia. Pediatrics 2009, 123(2), 451–457. [Google Scholar] [CrossRef] [PubMed]
- 38. Medical Advisory Secretariat. Neonatal screening of inborn errors of metabolism using tandem mass spectrometry: an evidence-based analysis. Ont Health Technol Assess Ser 2003, 3(3), 1–36.
- Schulze, A.; Lindner, M.; Kohlmüller, D.; Olgemöller, K.; Mayatepek, E.; Hoffmann, G.F. Expanded newborn screening for inborn errors of metabolism by electrospray ionization-tandem mass spectrometry: results, outcome, and implications. Pediatrics 2003, 111 Pt 1, 1399–1406. [Google Scholar] [CrossRef] [PubMed]
- Dionisi-Vici, C.; Deodato, F.; Röschinger, W.; Rhead, W.; Wilcken, B. ‘Classical’ organic acidurias, propionic aciduria, methylmalonic aciduria and isovaleric aciduria: long-term outcome and effects of expanded newborn screening using tandem mass spectrometry. J Inherit Metab Dis. 2006, 29(2-3), 383–389. [Google Scholar] [CrossRef]
- Messina, M.; Meli, C.; Raudino, F.; Pittalá, A.; Arena, A.; Barone, R.; Giuffrida, F.; Iacobacci, R.; Muccilli, V.; Sorge, G.; et al. Expanded Newborn Screening Using Tandem Mass Spectrometry: Seven Years of Experience in Eastern Sicily. Int J Neonatal Screen. 2018, 4(2), 12. [Google Scholar] [CrossRef]
- Filiano, J.J.; Bellimer, S.G.; Kunz, P.L. Tandem mass spectrometry and newborn screening: pilot data and review. Pediatr Neurol. 2002, 26(3), 201–204. [Google Scholar] [CrossRef]
- 43. Centers for Disease Control and Prevention (CDC). CDC Grand Rounds: Newborn screening and improved outcomes. MMWR. Morb Mortal Wkly Rep. 2012, 61(21), 390–393.
- Landau, Y.E.; Waisbren, S.E.; Chan, L.M.; Levy, H.L. Long-term outcome of expanded newborn screening at Boston children’s hospital: benefits and challenges in defining true disease. J Inherit Metab Dis. 2017, 40(2), 209–218. [Google Scholar] [CrossRef]
- Khneisser, I.; Adib, S.; Assaad, S.; Megarbane, A.; Karam, P. Cost-benefit analysis: newborn screening for inborn errors of metabolism in Lebanon. J Med Screen. 2015, 22(4), 182–186. [Google Scholar] [CrossRef] [PubMed]
- Ma, S.; Guo, Q.; Zhang, Z.; He, Z.; Yue, A.; Song, Z.; Zhao, Q.; Wang, X.; Sun, R. Expanded newborn screening for inborn errors of metabolism by tandem mass spectrometry in newborns from Xinxiang city in China. J Clin Lab Anal. 2020, 34(5), e23159. [Google Scholar] [CrossRef]
- Yang, C.; Zhou, C.; Xu, P.; Jin, X.; Liu, W.; Wang, W.; Huang, C.; Jiang, M.; Chen, X. Newborn screening and diagnosis of inborn errors of metabolism: A 5-year study in an eastern Chinese population. Clin Chim Acta 2020, 502, 133–138. [Google Scholar] [CrossRef] [PubMed]
- Therrell, B.L.; Padilla, C.D.; Loeber, J.G.; Kneisser, I.; Saadallah, A.; Borrajo, G.J.; Adams, J. Current status of newborn screening worldwide: 2015. Semin Perinatol. 2015, 39(3), 171–187. [Google Scholar] [CrossRef]
- Zupic, I.; Čater, T. Bibliometric methods in management and organization. Organ Res Methods 2015, 18(3), 429–472. [Google Scholar] [CrossRef]
- Marx, W.; Bornmann, L. On the causes of subject-specific citation rates in Web of Science. Scientometrics 2015, 102(2), 1823–1827. [Google Scholar] [CrossRef]
- Powell, T.H.; Kouropalatis, Y.; Morgan, R.E.; Karhu, P. Mapping knowledge and innovation research themes: Using bibliometrics for classification, evolution, proliferation and determinism. Int J Entrep Innov Manag. [CrossRef]
- Fang, Z.; Costas, R.; Tian, W.; Wang, X.; Wouters, P. An extensive analysis of the presence of altmetric data for Web of Science publications across subject fields and research topics. Scientometrics 2020, 124(3), 2519–2549. [Google Scholar] [CrossRef] [PubMed]
- Millington, D.S.; Kodo, N.; Terada, N.; Roe, D.S.; Chace, D.H. The analysis of diagnostic markers of genetic disorders in human blood and urine using tandem mass spectrometry with liquid secondary ion mass spectrometry. Int J Mass Spectrom Ion Processes 1991, 111, 211–228. [Google Scholar] [CrossRef]
- Aria, M.; Cuccurullo, C. Bibliometrix: An R-tool for comprehensive science mapping analysis. J Informetr. 2017, 11, 959–975. [Google Scholar] [CrossRef]
- van Eck, N.J.; Waltman, L. Software survey: VOSviewer, a computer program for bibliometric mapping. Scientometrics 2010, 84(2), 523–538. [Google Scholar] [CrossRef] [PubMed]
- Zytkovicz, T.H.; Fitzgerald, E.F.; Marsden, D.; Larson, C.A.; Shih, V.E.; Johnson, D.M.; Strauss, A.W.; Comeau, A.M.; Eaton, R.B.; Grady, G.F. Tandem mass spectrometric analysis for amino, organic, and fatty acid disorders in newborn dried blood spots: a two-year summary from the New England Newborn Screening Program. Clin Chem. 2001, 47(11), 1945–1955. [Google Scholar] [CrossRef] [PubMed]
- Pollitt, R.J. International perspectives on newborn screening. J Inherit Metab Dis. 2006, 29(2-3), 390–396. [Google Scholar] [CrossRef] [PubMed]
- Sander, J.; Janzen, N.; Sander, S.; Steuerwald, U.; Das, A.M.; Scholl, S.; Trefz, F.K.; Koch, H.G.; Häberle, J.; Korall, H.; et al. Neonatal screening for citrullinaemia. Eur J Pediatr. 2003, 162(6), 417–420. [Google Scholar] [CrossRef] [PubMed]
- Shigematsu, Y.; Hirano, S.; Hata, I.; Tanaka, Y.; Sudo, M.; Sakura, N.; Tajima, T.; Yamaguchi, S. Newborn mass screening and selective screening using electrospray tandem mass spectrometry in Japan. J Chromatogr B Analyt Technol Biomed Life Sci. 2002, 776(1), 39–48. [Google Scholar] [CrossRef] [PubMed]
- Yoon, H.R.; Lee, K.R.; Kang, S.; Lee, D.H.; Yoo, H.W.; Min, W.K.; Cho, D.H.; Shin, S.M.; Kim, J.; Song, J.; et al. Screening of newborns and high-risk group of children for inborn metabolic disorders using tandem mass spectrometry in South Korea: a three-year report. Clin Chim Acta 2005, 354(1-2), 167–180. [Google Scholar] [CrossRef] [PubMed]
- Joshi, S.N.; Venugopalan, P. Clinical characteristics of neonates with inborn errors of metabolism detected by Tandem MS analysis in Oman. Brain Dev. 2007, 29(9), 543–546. [Google Scholar] [CrossRef]
- Golbahar, J.; Al-Jishi, E.A.; Altayab, D.D.; Carreon, E.; Bakhiet, M.; Alkhayyat, H. Selective newborn screening of inborn errors of amino acids, organic acids and fatty acids metabolism in the Kingdom of Bahrain. Mol Genet Metab. 2013, 110(1-2), 98–101. [Google Scholar] [CrossRef]
- Therrell, B.L. Jr.; Padilla, C.D. Newborn screening in the developing countries. Curr Opin Pediatr. 2018, 30(6), 734–739. [Google Scholar] [CrossRef]
- Sahai, I.; Zytkowicz, T.; Rao Kotthuri, S.; Lakshmi Kotthuri, A.; Eaton, R.B.; Akella, R.R. Neonatal screening for inborn errors of metabolism using tandem mass spectrometry: experience of the pilot study in Andhra Pradesh, India. Indian J Pediatr. 2011, 78(8), 953–960. [Google Scholar] [CrossRef]
- Verma, I.C.; Bijarnia-Mahay, S.; Jhingan, G.; Verma, J. Newborn screening: need of the hour in India. Indian J Pediatr. 2015, 82(1), 61–70. [Google Scholar] [CrossRef]
- Pollitt, R.J. Newborn mass screening versus selective investigation: benefits and costs. J Inherit Metab Dis. 2001, 24(2), 299–302. [Google Scholar] [CrossRef] [PubMed]
- Selim, L.A.; Hassan, S.A.; Salem, F.; Orabi, A.; Hassan, F.A.; El-Mougy, F.; Mahmoud, I.G.; El-Badawy, A.; Girgis, M.Y.; Elmonem, M.A.; et al. Selective screening for inborn errors of metabolism by tandem mass spectrometry in Egyptian children: a 5 year report. Clin Biochem. 2014, 47(9), 823–828. [Google Scholar] [CrossRef] [PubMed]
- Magdy, R.M.; Abd-Elkhalek, H.S.; Bakheet, M.A.; Mohamed, M.M. Selective screening for inborn errors of metabolism by tandem mass spectrometry at Sohag University Hospital, Egypt. Arch Pediatr. 2022, 29(1), 36–43. [Google Scholar] [CrossRef]
- Van Eck, N.J.; Waltman, L. Visualizing bibliometric networks. In Measuring scholarly impact: Methods and practice; Ding, Y., Rousseau, R., Wolfram, D., Eds.; Springer: Cham, Switzerland, 2014; pp. 285–320. [Google Scholar] [CrossRef]
- Millington, D.S.; Kodo, N.; Norwood, D.L.; Roe, C.R. Tandem mass spectrometry: a new method for acylcarnitine profiling with potential for neonatal screening for inborn errors of metabolism. J Inherit Metab Dis. 1990, 13(3), 321–324. [Google Scholar] [CrossRef] [PubMed]
- Naylor, E.W.; Chace, D.H. Automated tandem mass spectrometry for mass newborn screening for disorders in fatty acid, organic acid, and amino acid metabolism. J Child Neurol. 1999, 14 Suppl 1, S4–S8. [Google Scholar] [CrossRef]
- Rashed, M.S.; Özand, P.; Harrison, M.E.; Watkins, P.J.; Evans, S.; Baillie, T.A. Electrospray tandem mass spectrometry in the diagnosis of organic acidemias. Rapid Commun Mass Spectrom. 1994, 8(1), 129–133. [Google Scholar] [CrossRef]
- Rashed, M.S.; Özand, P.T.; Bucknall, M.P.; Little, D. Diagnosis of inborn errors of metabolism from blood spots by acylcarnitines and amino acids profiling using automated electrospray tandem mass spectrometry. Pediatr Res. 1995, 38(3), 324–331. [Google Scholar] [CrossRef]
- Rashed, M.S.; Rahbeeni, Z.; Özand, P.T. Application of electrospray tandem mass spectrometry to neonatal screening. Semin Perinatol. 1999, 23(2), 183–193. [Google Scholar] [CrossRef]
- Alfadhel, M.; Benmeake, M.; Hossain, M.A.; Al Mutairi, F.; Al Othaim, A.; Alfares, A.A.; Al Balwi, M.; Alzaben, A.; Eyaid, W. Thirteen year retrospective review of the spectrum of inborn errors of metabolism presenting in a tertiary center in Saudi Arabia. Orphanet J Rare Dis. 2016, 11(1), 126. [Google Scholar] [CrossRef]
- Demirelce, Ö.; Aksungar, F.B.; Saral, N.Y.; Kilercik, M.; Serteser, M.; Unsal, I. Institutional experience of newborn screening for inborn metabolism disorders by tandem MS in the Turkish population. J Pediatr Endocrinol Metab. 2020, 33(6), 703–711. [Google Scholar] [CrossRef]
- Thomason, M.J.; Lord, J.; Bain, M.D.; Chalmers, R.A.; Littlejohns, P.; Addison, G.M.; Wilcox, A.H.; Seymour, C.A. A systematic review of evidence for the appropriateness of neonatal screening programmes for inborn errors of metabolism. J Public Health Med. 1998, 20(3), 331–343. [Google Scholar] [CrossRef]
- Parini, R.; Corbetta, C. Metabolic screening for the newborn. J Matern Fetal Neonatal Med. 2011, 24 Suppl 2, 6–8. [Google Scholar] [CrossRef]
- Chace, D.H.; Hillman, S.L.; Van Hove, J.L.; Naylor, E.W. Rapid diagnosis of MCAD deficiency: quantitative analysis of octanoylcarnitine and other acylcarnitines in newborn blood spots by tandem mass spectrometry. Clin Chem. 1997, 43(11), 2106–2113. [Google Scholar] [CrossRef]
- Wilcken, B.; Wiley, V. Newborn screening. Pathology 2008, 40(2), 104–115. [Google Scholar] [CrossRef] [PubMed]
- Loukas, Y.L.; Soumelas, G.S.; Dotsikas, Y.; Georgiou, V.; Molou, E.; Thodi, G.; Boutsini, M.; Biti, S.; Papadopoulos, K. Expanded newborn screening in Greece: 30 months of experience. J Inherit Metab Dis. 2010, 33 Suppl 3, S341–S348. [Google Scholar] [CrossRef]
- Ensenauer, R.; Vockley, J.; Willard, J.M.; Huey, J.C.; Sass, .J.O.; Edland, S.D.; Burton, B.K.; Berry, S.A.; Santer, R.; Grünert, S.; et al. A common mutation is associated with a mild, potentially asymptomatic phenotype in patients with isovaleric acidemia diagnosed by newborn screening. Am J Hum Genet. 2004, 75(6), 1136–1142. [Google Scholar] [CrossRef] [PubMed]
- Pasquali, M.; Monsen, G.; Richardson, L.; Alston, M.; Longo, N. Biochemical findings in common inborn errors of metabolism. Am J Med Genet C Semin Med Genet. 2006, 142C(2), 64–76. [Google Scholar] [CrossRef]
- Niu, D.M.; Chien, Y.H.; Chiang, C.C.; Ho, H.C.; Hwu, W.L.; Kao, S.M.; Chiang, S.H.; Kao, C.H.; Liu, T.T.; Chiang, H.; et al. Nationwide survey of extended newborn screening by tandem mass spectrometry in Taiwan. J Inherit Metab Dis. 2010, 33 Suppl 2, S295–S305. [Google Scholar] [CrossRef]
- Shi, X.T.; Cai, J.; Wang, Y.Y.; Tu, W.J.; Wang, W.P.; Gong, L.M.; Wang, D.W.; Ye, Y.T.; Fang, S.G.; Jing, P.W. Newborn screening for inborn errors of metabolism in mainland china: 30 years of experience. JIMD Rep. 2012, 6, 79–83. [Google Scholar] [CrossRef]
- Smith, W.E.; Millington, D.S.; Koeberl, D.D.; Lesser, P.S. Glutaric acidemia, type I, missed by newborn screening in an infant with dystonia following promethazine administration. Pediatrics 2001, 107(5), 1184–1187. [Google Scholar] [CrossRef] [PubMed]
- Han, L.S.; Ye, J.; Qiu, W.J.; Gao, X.L.; Wang, Y.; Gu, X.F. Selective screening for inborn errors of metabolism on clinical patients using tandem mass spectrometry in China: a four-year report. J Inherit Metab Dis. 2007, 30(4), 507–514. [Google Scholar] [CrossRef] [PubMed]
- Huang, X.; Yang, L.; Tong, F.; Yang, R.; Zhao, Z. Screening for inborn errors of metabolism in high-risk children: a 3-year pilot study in Zhejiang Province, China. BMC Pediatr. 2012, 12, 18. [Google Scholar] [CrossRef] [PubMed]
- Moorthie, S.; Cameron, L.; Sagoo, G.S.; Bonham, J.R.; Burton, H. Systematic review and meta-analysis to estimate the birth prevalence of five inherited metabolic diseases. J Inherit Metab Dis. 2014, 37(6), 889–898. [Google Scholar] [CrossRef] [PubMed]
- Fingerhut, R.; Olgemöller, B. Newborn screening for inborn errors of metabolism and endocrinopathies: an update. Anal Bioanal Chem. 2009, 393(5), 1481–1497. [Google Scholar] [CrossRef] [PubMed]
- CDC. Using tandem mass spectrometry for metabolic disease screening among newborns. A report of a work group. MMWR Recomm Rep. 2001, 50(RR-3), 1–34. [Google Scholar]
- Vist, G.E.; Frønsdal, K.B.; Johansen, M.; Hofmann, B.; Fretheim, A. Newborn Screening for Inborn Errors of Metabolism [Internet]. Oslo, Norway: Knowledge Centre for the Health Services at The Norwegian Institute of Public Health (NIPH), 2007, Report from Norwegian Knowledge Centre for the Health Services (NOKC) No. 22-2007. Available online: https://www.ncbi.nlm.nih.gov/books/NBK464885/ (accessed on 20 December 2023).
- Lindner, M.; Hoffmann, G.F.; Matern, D. Newborn screening for disorders of fatty-acid oxidation: experience and recommendations from an expert meeting. J Inherit Metab Dis. 2010, 33(5), 521–526. [Google Scholar] [CrossRef]
- McCandless, S.E. A primer on expanded newborn screening by tandem mass spectrometry. Prim Care 2004, 31(3), 583–604,ix-x. [Google Scholar] [CrossRef] [PubMed]
- American College of Medical Genetics Newborn Screening Expert Group. Newborn screening: toward a uniform screening panel and system--executive summary. Pediatrics 2006, 117 Pt 2, S296–S307. [Google Scholar] [CrossRef]
- Fernández-Lainez, C.; Aguilar-Lemus, J.J.; Vela-Amieva, M.; Ibarra-González, I. Tandem mass spectrometry newborn screening for inborn errors of intermediary metabolism: abnormal profile interpretation. Curr Med Chem. 2012, 19(26), 4511–4522. [Google Scholar] [CrossRef] [PubMed]
- Baumgartner, C.; Baumgartner, D. Biomarker discovery, disease classification, and similarity query processing on high-throughput MS/MS data of inborn errors of metabolism. J Biomol Screen. 2006, 11(1), 90–99. [Google Scholar] [CrossRef] [PubMed]
- Kasper, D.C.; Ratschmann, R.; Metz, T.F.; Mechtler, T.P.; Möslinger, D.; Konstantopoulou, V.; Item, C.B.; Pollak, A.; Herkner, K.R. The national Austrian newborn screening program - eight years experience with mass spectrometry. past, present, and future goals. Wien Klin Wochenschr. 2010, 122(21-22), 607–613. [Google Scholar] [CrossRef]
- Maitusong, R.; Japaer, R.; Zhao, Z.Y.; Yang, R.L.; Huang, X.L.; Mao, H.Q. Newborn screening in Zhejiang, China. Chin Med J. 2012, 125(4), 702–704. [Google Scholar] [PubMed]
- Harms, E.; Olgemöller, B. Neonatal screening for metabolic and endocrine disorders. Dtsch Arztebl Int. 2011, 108(1-2), 11–21. [Google Scholar] [CrossRef]
- Pollak, A.; Kasper, D.C. Austrian Newborn Screening Program: a perspective of five decades. J Perinat Med. 2014, 42(2), 151–158. [Google Scholar] [CrossRef]
- la Marca, G.; Malvagia, S.; Casetta, B.; Pasquini, E.; Donati, M.A.; Zammarchi, E. Progress in expanded newborn screening for metabolic conditions by LC-MS/MS in Tuscany: update on methods to reduce false tests. J Inherit Metab Dis. 2008, 31 (Suppl. 2), S395–S404. [Google Scholar] [CrossRef]
- Focardi, M.; Pinchi, V.; Defraia, B.; Gualco, B.; Varvara, G.; Norelli, G.A. Newborn screening of inherited metabolic disorders: the Italian situation. J Biol Regul Homeost Agents 2016, 30(3), 909–914. [Google Scholar]
- Couce, M.L.; Castiñeiras, D.E.; Bóveda, M.D.; Baña, A.; Cocho, J.A.; Iglesias, A.J.; Colón, C.; Alonso-Fernández, J.R.; Fraga, J.M. Evaluation and long-term follow-up of infants with inborn errors of metabolism identified in an expanded screening programme. Mol Genet Metab. 2011, 104(4), 470–475. [Google Scholar] [CrossRef]
- Vilarinho, L.; Rocha, H.; Sousa, C.; Marcão, A.; Fonseca, H.; Bogas, M.; Osório, R.V. Four years of expanded newborn screening in Portugal with tandem mass spectrometry. J Inherit Metab Dis. 2010, 33 Suppl 3, S133–S138. [Google Scholar] [CrossRef]
- Huang, H.P.; Chu, K.L.; Chien, Y.H.; Wei, M.L.; Wu, S.T.; Wang, S.F.; Hwu, W.L. Tandem mass neonatal screening in Taiwan--report from one center. J Formos Med Assoc. 2006, 105(11), 882–886. [Google Scholar] [CrossRef]
- Lim, J.S.; Tan, E.S.; John, C.M.; Poh, S.; Yeo, S.J.; Ang, J.S.; Adakalaisamy, P.; Rozalli, R.A.; Hart, C.; Tan, E.T.; et al. Inborn Error of Metabolism (IEM) screening in Singapore by electrospray ionization-tandem mass spectrometry (ESI/MS/MS): An 8 year journey from pilot to current program. Mol Genet Metab. 2014, 113(1-2), 53–61. [Google Scholar] [CrossRef]
- Lüders, A.; Blankenstein, O.; Brockow, I.; Ensenauer, R.; Lindner, M.; Schulze, A.; Nennstiel, U. screening laboratories in Germany. Neonatal Screening for Congenital Metabolic and Endocrine Disorders–Results From Germany for the Years 2006–2018. Dtsch Arztebl Int. 2021, 118(7), 101–108. [Google Scholar] [CrossRef]
- Spiekerkoetter, U.; Krude, H. Target Diseases for Neonatal Screening in Germany. Dtsch Arztebl Int. 2022, 119(17), 306–316. [Google Scholar] [CrossRef]
- Smon, A.; Repic Lampret, B.; Groselj, U.; Zerjav Tansek, M.; Kovac, J.; Perko, D.; Bertok, S.; Battelino, T.; Trebusak Podkrajsek, K. Next generation sequencing as a follow-up test in an expanded newborn screening programme. Clin Biochem. 2018, 52, 48–55. [Google Scholar] [CrossRef]
- Villani, G.R.D.; Albano, L.; Caterino, M.; Crisci, D.; Di Tommaso, S.; Fecarotta, S.; Fisco, M.G.; Frisso, G.; Gallo, G.; Mazzaccara, C.; et al. Hypermethioninemia in Campania: Results from 10 years of newborn screening. Mol Genet Metab Rep. 2019, 21, 100520. [Google Scholar] [CrossRef]
- Ruoppolo, M.; Malvagia, S.; Boenzi, S.; Carducci, C.; Dionisi-Vici, C.; Teofoli, F.; Burlina, A.; Angeloni, A.; Aronica, T.; Bordugo, A.; et al. Expanded Newborn Screening in Italy Using Tandem Mass Spectrometry: Two Years of National Experience. Int J Neonatal Screen. 2022, 8(3), 47. [Google Scholar] [CrossRef]
- Martín-Rivada, Á.; Palomino Pérez, L.; Ruiz-Sala, P.; Navarrete, R.; Cambra Conejero, A.; Quijada Fraile, P.; Moráis López, A.; Belanger-Quintana, A.; Martín-Hernández, E.; Bellusci, M.; et al. Diagnosis of inborn errors of metabolism within the expanded newborn screening in the Madrid region. JIMD Rep. 2022, 63(2), 146–161. [Google Scholar] [CrossRef] [PubMed]
- Wang, T.; Ma, J.; Zhang, Q.; Gao, A.; Wang, Q.; Li, H.; Xiang, J.; Wang, B. Expanded Newborn Screening for Inborn Errors of Metabolism by Tandem Mass Spectrometry in Suzhou, China: Disease Spectrum, Prevalence, Genetic Characteristics in a Chinese Population. Front Genet. 2019, 10, 1052. [Google Scholar] [CrossRef]
- Guo, K.; Zhou, X.; Chen, X.; Wu, Y.; Liu, C.; Kong, Q. Expanded Newborn Screening for Inborn Errors of Metabolism and Genetic Characteristics in a Chinese Population. Front Genet. 2018, 9, 122. [Google Scholar] [CrossRef] [PubMed]
- Yang, Y.; Wang, L.; Wang, B.; Liu, S.; Yu, B.; Wang, T. Application of Next-Generation Sequencing Following Tandem Mass Spectrometry to Expand Newborn Screening for Inborn Errors of Metabolism: A Multicenter Study. Front Genet. 2019, 10, 86. [Google Scholar] [CrossRef] [PubMed]
- Lin, Y.; Zheng, Q.; Zheng, T.; Zheng, Z.; Lin, W.; Fu, Q. Expanded newborn screening for inherited metabolic disorders and genetic characteristics in a southern Chinese population. Clin Chim Acta 2019, 494, 106–111. [Google Scholar] [CrossRef]
- Yang, N.; Gong, L.F.; Zhao, J.Q.; Yang, H.H.; Ma, Z.J.; Liu, W.; Wan, Z.H.; Kong, Y.Y. Inborn errors of metabolism detectable by tandem mass spectrometry in Beijing. J Pediatr Endocrinol Metab. 2020, 33(5), 639–645. [Google Scholar] [CrossRef] [PubMed]
- Deng, K.; Zhu, J.; Yu, E.; Xiang, L.; Yuan, X.; Yao, Y.; Li, X.; Liu, H. Incidence of inborn errors of metabolism detected by tandem mass spectrometry in China: A census of over seven million newborns between 2016 and 2017. J Med Screen. 2021, 28(3), 223–229. [Google Scholar] [CrossRef] [PubMed]
- Li, X.; He, J.; He, L.; Zeng, Y.; Huang, X.; Luo, Y.; Li, Y. Spectrum Analysis of Inherited Metabolic Disorders for Expanded Newborn Screening in a Central Chinese Population. Front Genet. 2022, 12, 763222. [Google Scholar] [CrossRef] [PubMed]
- Kaku, N.; Ihara, K.; Hirata, Y.; Yamada, K.; Lee, S.; Kanemasa, H.; Motomura, Y.; Baba, H.; Tanaka, T.; Sakai, Y.; et al. Diagnostic potential of stored dried blood spots for inborn errors of metabolism: a metabolic autopsy of medium-chain acyl-CoA dehydrogenase deficiency. J Clin Pathol. 2018, 71(10), 885–889. [Google Scholar] [CrossRef] [PubMed]
- Liu, G.; Liu, X.; Lin, Y. Newborn screening for inborn errors of metabolism in a northern Chinese population. J Pediatr Endocrinol Metab. 2023, 36(3), 278–282. [Google Scholar] [CrossRef] [PubMed]
- Yang, C.J.; Wei, N.; Li, M.; Xie, K.; Li, J.Q.; Huang, C.G.; Xiao, Y.S.; Liu, W.H.; Chen, X.G. Diagnosis and therapeutic monitoring of inborn errors of metabolism in 100,077 newborns from Jining city in China. BMC Pediatr. 2018, 18(1), 110. [Google Scholar] [CrossRef] [PubMed]
- Lee, H.C.; Mak, C.M.; Lam, C.W.; Yuen, Y.P.; Chan, A.O.; Shek, C.C.; Siu, T.S.; Lai, C.K.; Ching, C.K.; Siu, W.K.; et al. Analysis of inborn errors of metabolism: disease spectrum for expanded newborn screening in Hong Kong. Chin Med J (Engl). 2011, 124(7), 983–989. [Google Scholar] [PubMed]
- Sun, W.; Wang, Y.; Yang, Y.; Wang, J.; Cao, Y.; Luo, F.; Lu, W.; Peng, Y.; Yao, H.; Qiu, P. The screening of inborn errors of metabolism in sick Chinese infants by tandem mass spectrometry and gas chromatography/mass spectrometry. Clin Chim Acta 2011, 412(13-14), 1270–1274. [Google Scholar] [CrossRef] [PubMed]
- Wang, H.; Wang, X.; Li, Y.; Dai, W.; Jiang, D.; Zhang, X.; Cui, Y. Screening for inherited metabolic diseases using gas chromatography-tandem mass spectrometry (GC-MS/MS) in Sichuan, China. Biomed Chromatogr. 2017, 31(4). [Google Scholar] [CrossRef] [PubMed]
- Tan, J.; Chen, D.; Chang, R.; Pan, L.; Yang, J.; Yuan, D.; Huang, L.; Yan, T.; Ning, H.; Wei, J.; Cai, R. Tandem Mass Spectrometry Screening for Inborn Errors of Metabolism in Newborns and High-Risk Infants in Southern China: Disease Spectrum and Genetic Characteristics in a Chinese Population. Front Genet. 2021, 12, 631688. [Google Scholar] [CrossRef] [PubMed]
- Hassan, F.A.; El-Mougy, F.; Sharaf, S.A.; Mandour, I.; Morgan, M.F.; Selim, L.A.; Hassan, S.A.; Salem, F.; Oraby, A.; Girgis, M.Y.; et al. Inborn errors of metabolism detectable by tandem mass spectrometry in Egypt: The first newborn screening pilot study. J Med Screen. 2016, 23(3), 124–129. [Google Scholar] [CrossRef] [PubMed]
- Groselj, U.; Tansek, M.Z.; Smon, A.; Angelkova, N.; Anton, D.; Baric, I.; Djordjevic, M.; Grimci, L.; Ivanova, M.; Kadam, A.; et al. Newborn screening in southeastern Europe. Mol Genet Metab. 2014, 113(1-2), 42–45. [Google Scholar] [CrossRef] [PubMed]
- Rama Devi, A.R.; Naushad, S.M. Newborn screening in India. Indian J Pediatr. 2004, 71(2), 157–160. [Google Scholar] [CrossRef] [PubMed]
- Patial, A.; Saini, A.G.; Kaur, R.; Kapoor, S.; Sharda, S.; Kumar, P.; Singhi, S.; Singhi, P.; Dwivedi, I.; Malik, V.S.; et al. Detection of IEMs by Mass Spectrometry Techniques in High-Risk Children: A Pilot Study. Indian J Pediatr. 2022, 89(9), 885–893. [Google Scholar] [CrossRef] [PubMed]
- Nagaraja, D.; Mamatha, S.N.; De, T.; Christopher, R. Screening for inborn errors of metabolism using automated electrospray tandem mass spectrometry: study in high-risk Indian population. Clin Biochem. 2010, 43(6), 581–588. [Google Scholar] [CrossRef]
- Yunus, Z.M.; Rahman, S.A.; Choy, Y.S.; Keng, W.T.; Ngu, L.H. Pilot study of newborn screening of inborn error of metabolism using tandem mass spectrometry in Malaysia: outcome and challenges. J Pediatr Endocrinol Metab. 2016, 29(9), 1031–1039. [Google Scholar] [CrossRef]
- Tamrakar, A.; Kale, A.; Magar, S.; Kale, A.; Ingale, V.; Shewale, N.; Engade, M.; Shelke, M. Spectrum of Common and Rare Small Molecule Inborn Errors of Metabolism Diagnosed in a Tertiary Care Center of Maharashtra, India. Cureus 2022, 14(7), e27104. [Google Scholar] [CrossRef]
- Padilla, C.D.; Therrell, B.L. Newborn screening in the Asia Pacific region. J Inherit Metab Dis. 2007, 30(4), 490–506. [Google Scholar] [CrossRef]
- Meiouet, F.; El Kabbaj, S.; Abilkassem, R.; Boemer, F. Moroccan Experience of Targeted Screening for Inborn Errors of Metabolism by Tandem Mass Spectrometry. Pediatr Rep. 2023, 15(1), 227–236. [Google Scholar] [CrossRef]
- Wilcken, B. Newborn screening: how are we travelling, and where should we be going? J Inherit Metab Dis. 2011, 34(3), 569–574. [Google Scholar] [CrossRef] [PubMed]
- Narravula, A.; Garber, K.B.; Askree, S.H.; Hegde, M.; Hall, P.L. Variants of uncertain significance in newborn screening disorders: implications for large-scale genomic sequencing. Genet Med. 2017, 19(1), 77–82. [Google Scholar] [CrossRef] [PubMed]
- Adhikari, A.N.; Gallagher, R.C.; Wang, Y.; Currier, R.J.; Amatuni, G.; Bassaganyas, L.; Chen, F.; Kundu, K.; Kvale, M.; Mooney, S.D.; et al. The role of exome sequencing in newborn screening for inborn errors of metabolism. Nat Med. 2020, 26(9), 1392–1397. [Google Scholar] [CrossRef] [PubMed]
- Wojcik, M.H.; Zhang, T.; Ceyhan-Birsoy, O.; Genetti, C.A.; Lebo, M.S.; Yu, T.W.; Parad, R.B.; Holm, I.A.; Rehm, H.L.; Beggs, A.H.; et al.; BabySeq Project Team Discordant results between conventional newborn screening and genomic sequencing in the BabySeq Project. Genet Med. 2021, 23(7), 1372–1375. [Google Scholar] [CrossRef]
- Qian, J.; Wang, X.; Liu, J.; Zhong, J.; Le, Y.; Melchior Tellier, L.C.A.; Liu, C.; Jiang, P.; Gao, R.; Wang, Y. Applying targeted next generation sequencing to dried blood spot specimens from suspicious cases identified by tandem mass spectrometry-based newborn screening. J Pediatr Endocrinol Metab. 2017, 30(9), 979–988. [Google Scholar] [CrossRef]
- He, X.; Kuang, J.; Lai, J.; Huang, J.; Wang, Y.; Lan, G.; Xie, Y.; Shi, X. A retrospective analysis of MS/MS screening for IEM in high-risk areas. BMC Med Genomics 2023, 16(1), 57. [Google Scholar] [CrossRef]
- Golbahar, J.; Altayab, D.D.; Carreon, E. Short-term stability of amino acids and acylcarnitines in the dried blood spots used to screen newborns for metabolic disorders. J Med Screen. 2014, 21(1), 5–9. [Google Scholar] [CrossRef]
- Strnadová, K.A.; Holub, M.; Mühl, A.; Heinze, G.; Ratschmann, R.; Mascher, H.; Stöckler-Ipsiroglu, S.; Waldhauser, F.; Votava, F.; Lebl, J.; Bodamer, O.A. Long-term stability of amino acids and acylcarnitines in dried blood spots. Clin Chem. 2007, 53(4), 717–722. [Google Scholar] [CrossRef] [PubMed]
- Shimada, Y.; Kawano, N.; Goto, M.; Watanabe, H.; Ihara, K. Stability of amino acids, free and acyl-carnitine in stored dried blood spots. Pediatr Int. 2022, 64(1), e15072. [Google Scholar] [CrossRef] [PubMed]
- van Rijt, W.J.; Schielen, P.C.J.I.; Özer, Y.; Bijsterveld, K.; van der Sluijs, F.H.; Derks, T.G.J.; Heiner-Fokkema, M.R. Instability of Acylcarnitines in Stored Dried Blood Spots: The Impact on Retrospective Analysis of Biomarkers for Inborn Errors of Metabolism. Int J Neonatal Screen. 2020, 6(4), 83. [Google Scholar] [CrossRef] [PubMed]
- Martínez-Morillo, E.; Prieto García, B.; Álvarez Menéndez, F.V. Challenges for Worldwide Harmonization of Newborn Screening Programs. Clin Chem. 2016, 62(5), 689–698. [Google Scholar] [CrossRef] [PubMed]
- Fabie, N.A.V.; Pappas, K.B.; Feldman, G.L. The Current State of Newborn Screening in the United States. Pediatr Clin North Am. 2019, 66(2), 369–386. [Google Scholar] [CrossRef]
- Pajares, S.; Arranz, J.A.; Ormazabal, A.; Del Toro, M.; García-Cazorla, Á.; Navarro-Sastre, A.; López, R.M.; Meavilla, S.M.; de Los Santos, M.M.; García-Volpe, C.; et al. Implementation of second-tier tests in newborn screening for the detection of vitamin B12 related acquired and genetic disorders: results on 258,637 newborns. Orphanet J Rare Dis. 2021, 16(1), 195. [Google Scholar] [CrossRef]
- Ibarra-González, I.; Rodríguez-Valentín, R.; Lazcano-Ponce, E.; Vela-Amieva, M. Metabolic screening and metabolomics analysis in the Intellectual Developmental Disorders Mexico Study. Salud Publica Mex. 2017, 59(4), 423–428. [Google Scholar] [CrossRef] [PubMed]
- Céspedes, N.; Valencia, A.; Echeverry, C.A.; Arce-Plata, M.I.; Colón, C.; Castiñeiras, D.E.; Hurtado, P.M.; Cocho, J.A.; Herrera, S.; Arévalo-Herrera, M. Reference values of amino acids, acylcarnitines and succinylacetone by tandem mass spectrometry for use in newborn screening in southwest Colombia. Colomb Med (Cali) 2017, 48(3), 113–119. [Google Scholar] [CrossRef] [PubMed]
- Márquez-Caraveo, M.E.; Ibarra-González, I.; Rodríguez-Valentín, R.; Ramírez-García, M.Á.; Pérez-Barrón, V.; Lazcano-Ponce, E.; Vela-Amieva, M. Brief Report: Delayed Diagnosis of Treatable Inborn Errors of Metabolism in Children with Autism and Other Neurodevelopmental Disorders. J Autism Dev Disord. 2021, 51(6), 2124–2131. [Google Scholar] [CrossRef]
- Wajner, M.; Sitta, A.; Kayser, A.; Deon, M.; Groehs, A.C.; Coelho, D.M.; Vargas, C.R. Screening for organic acidurias and aminoacidopathies in high-risk Brazilian patients: Eleven-year experience of a reference center. Genet Mol Biol. 2019, 42(1 suppl 1), 178–185. [Google Scholar] [CrossRef]
- Vargas, C.R.; Ribas, G.S.; da Silva, J.M.; Sitta, A.; Deon, M.; de Moura Coelho, D.; Wajner, M. Selective Screening of Fatty Acids Oxidation Defects and Organic Acidemias by Liquid Chromatography/tandem Mass Spectrometry Acylcarnitine Analysis in Brazilian Patients. Arch Med Res. 2018, 49(3), 205–212. [Google Scholar] [CrossRef] [PubMed]
- Thiboonboon, K.; Leelahavarong, P.; Wattanasirichaigoon, D.; Vatanavicharn, N.; Wasant, P.; Shotelersuk, V.; Pangkanon, S.; Kuptanon, C.; Chaisomchit, S.; Teerawattananon, Y. An Economic Evaluation of Neonatal Screening for Inborn Errors of Metabolism Using Tandem Mass Spectrometry in Thailand. PLoS ONE 2015, 10(8), e0134782. [Google Scholar] [CrossRef] [PubMed]
- Howson, C.P.; Cedergren, B.; Giugliani, R.; Huhtinen, P.; Padilla, C.D.; Palubiak, C.S.; Santos, M.D.; Schwartz, I.V.D.; Therrell, B.L.; Umemoto, A.; Wang, J.; Zeng, X.; et al. Universal newborn screening: A roadmap for action. Mol Genet Metab. 2018, 124(3), 177–183, Erratum in: Mol Genet Metab. 2019, 127(3), 216–217. [Google Scholar] [CrossRef]
Figure 1.
The flow chart of the screening process using PRISMA.
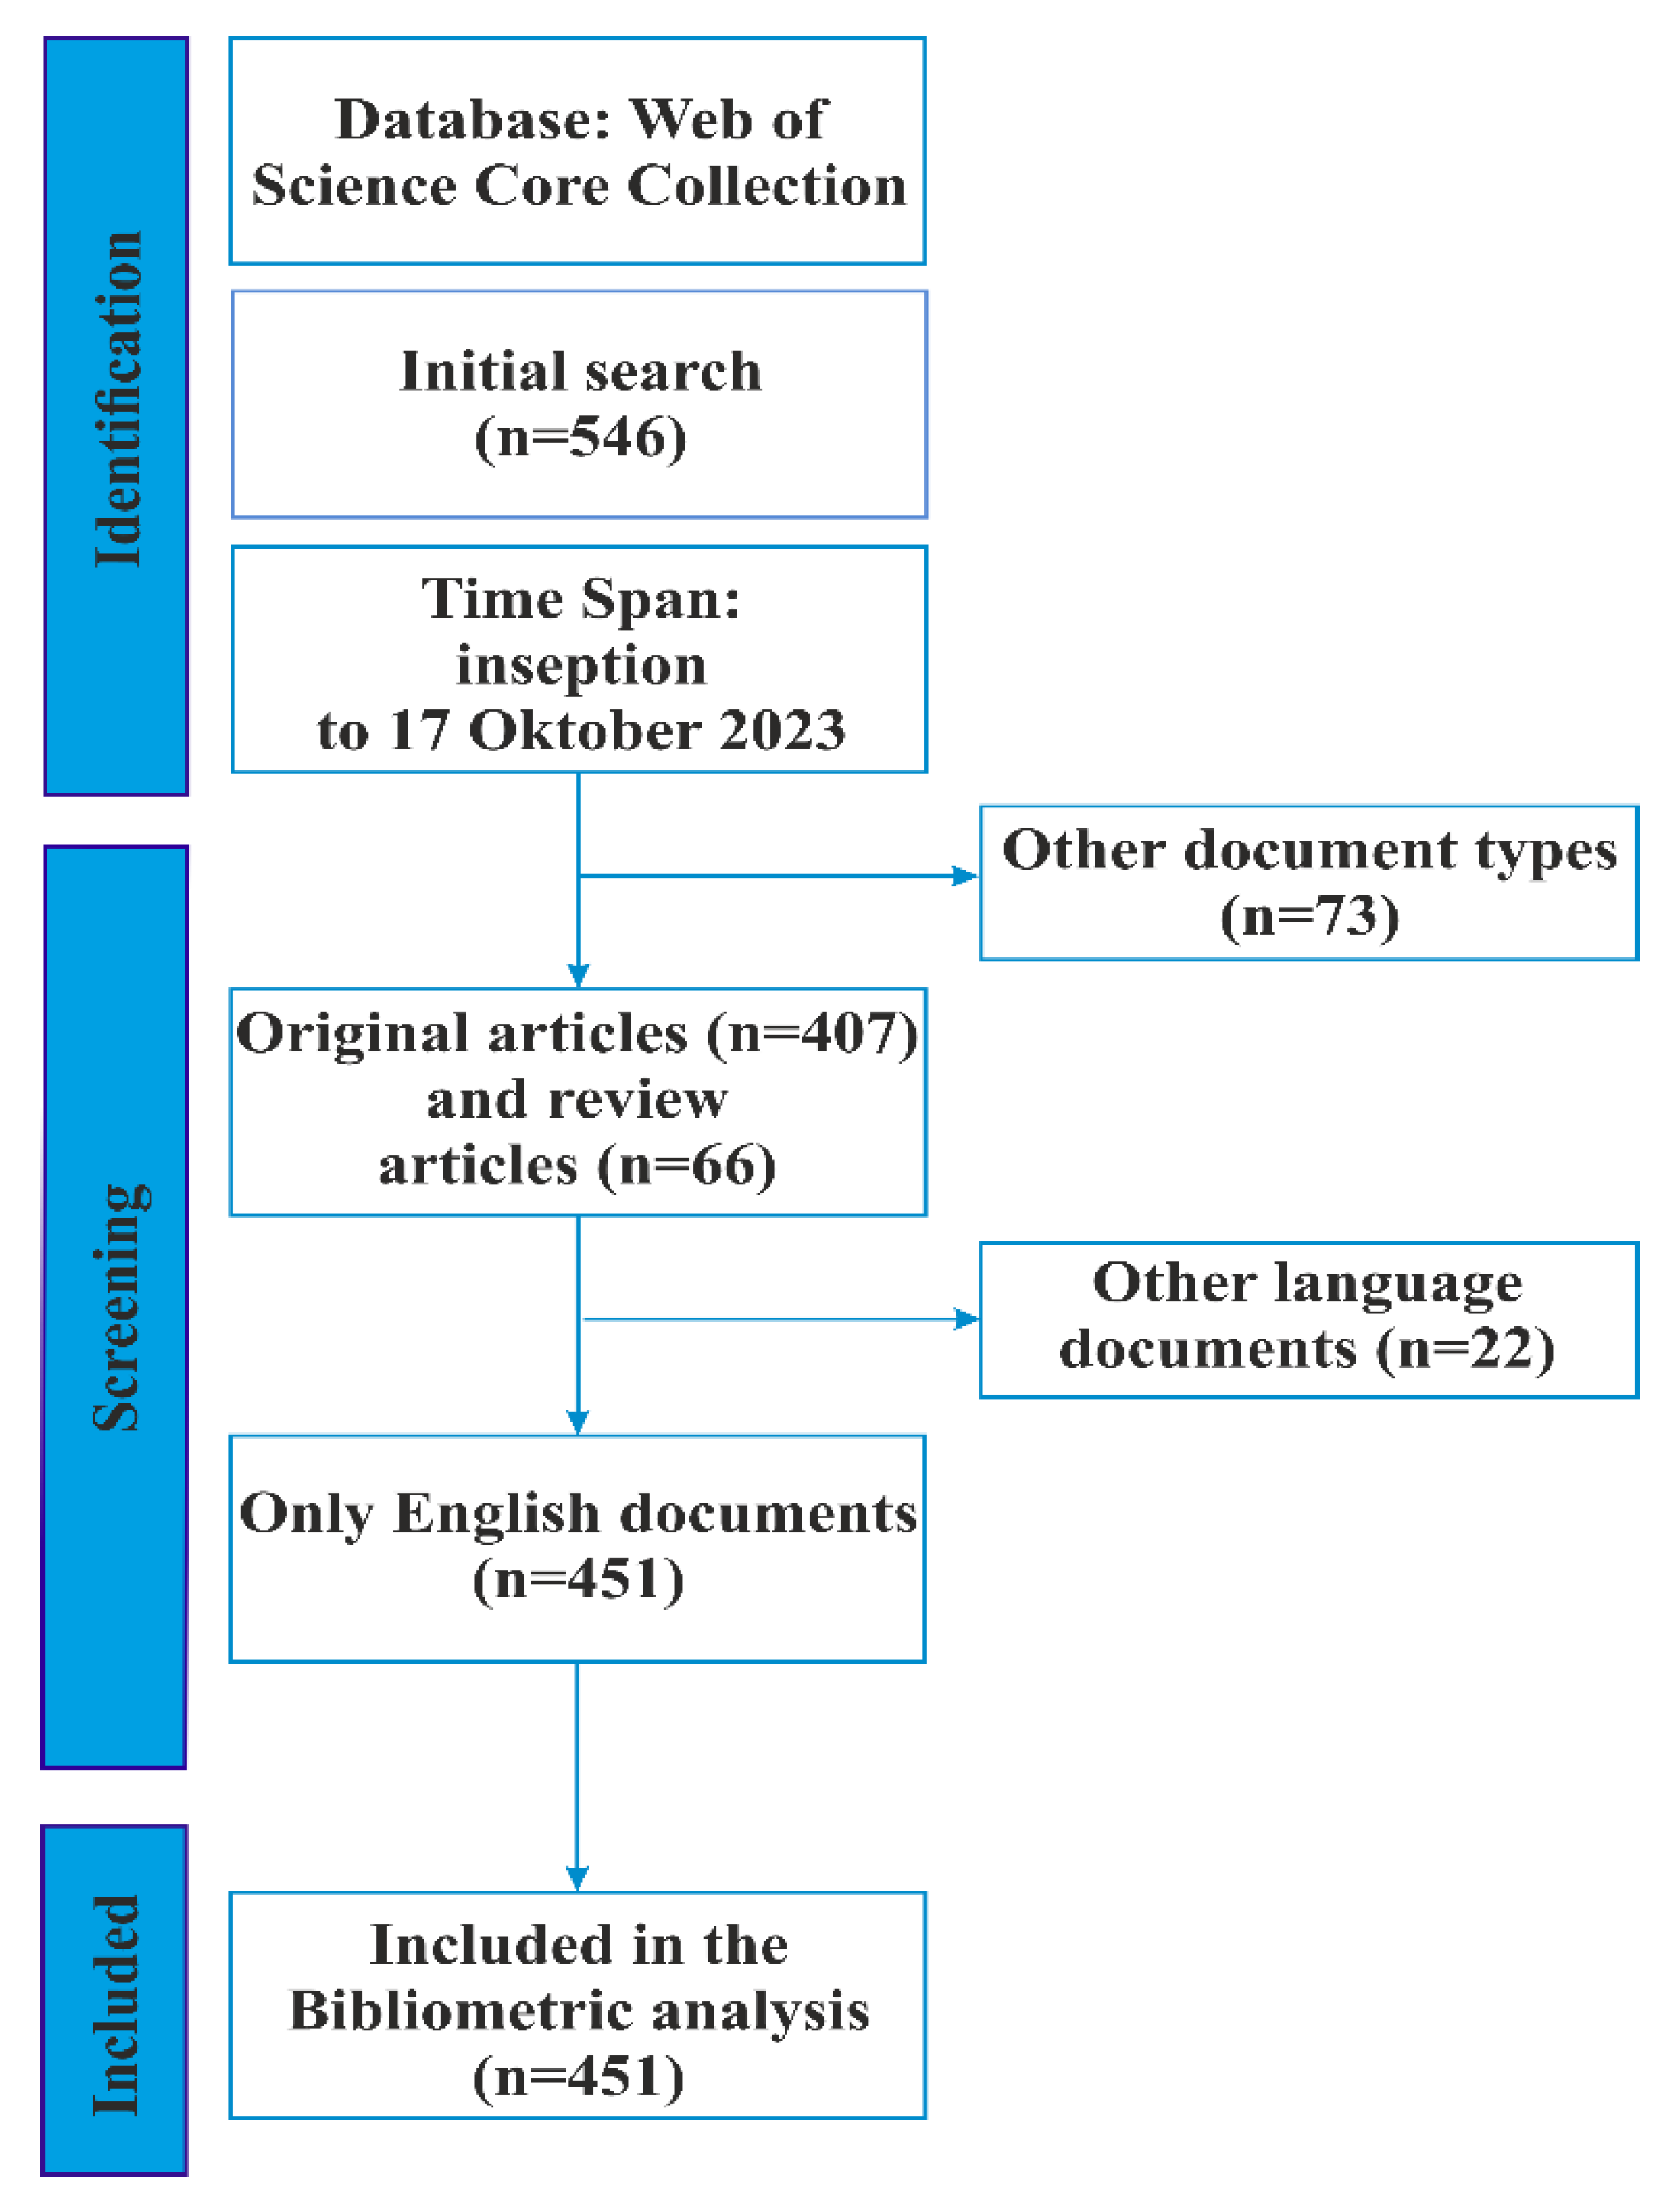
Figure 2.
Web of Science Categories.
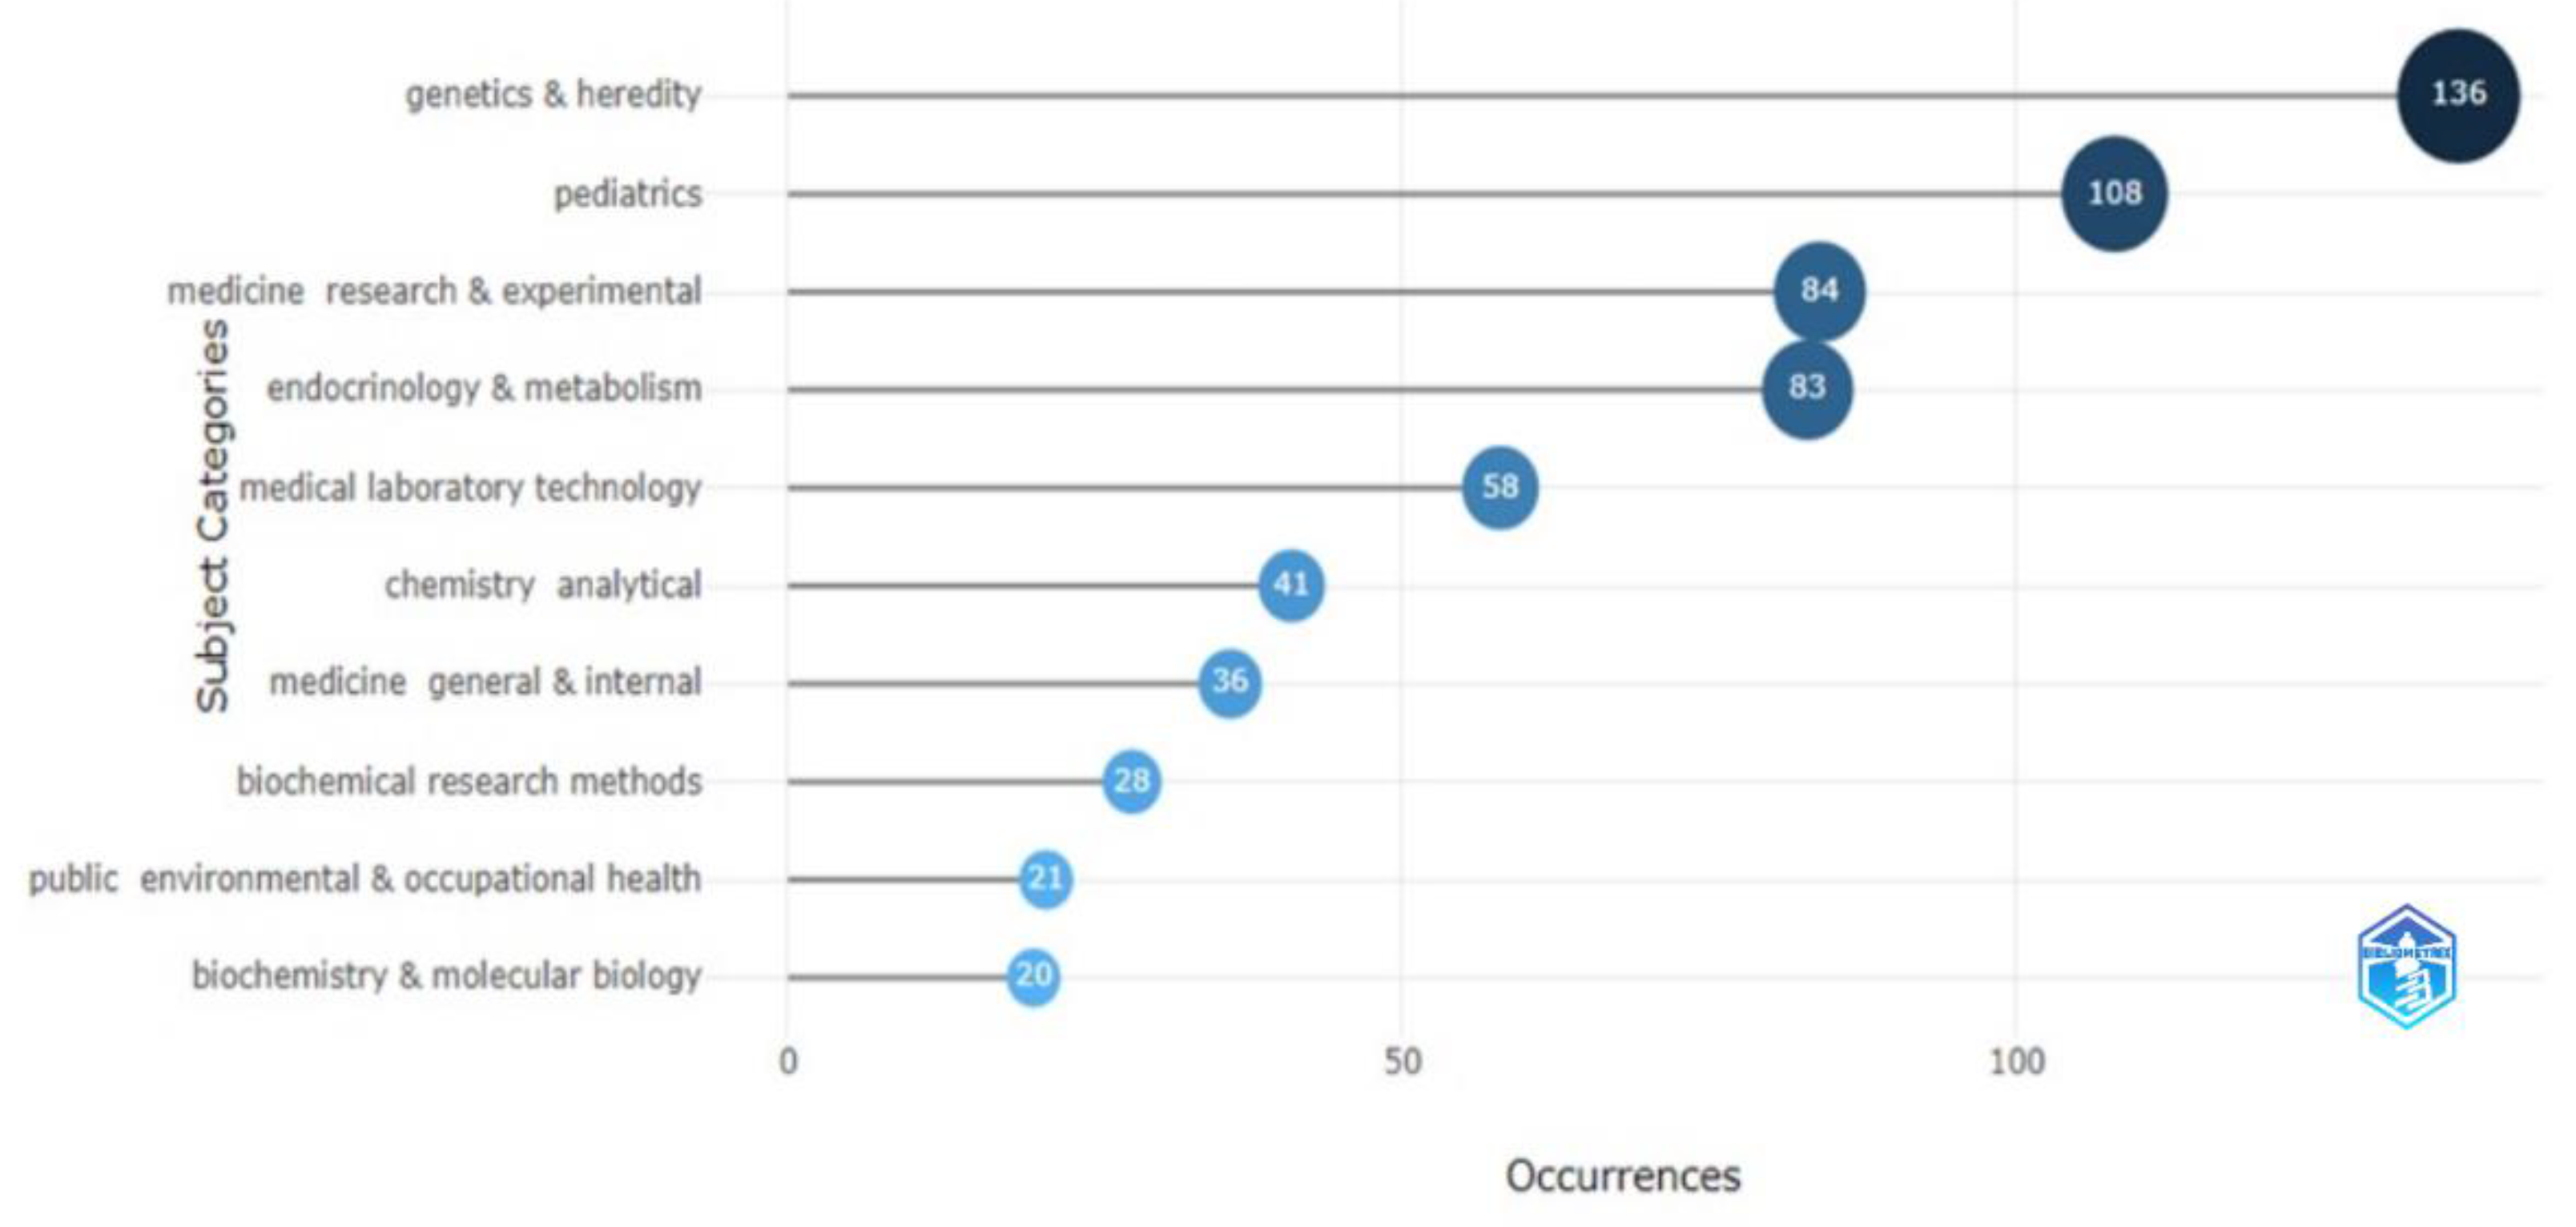
Figure 3.
(A,B) Dynamics of publications (A) and citations (B) on using MS/MS for IEM screening from 1991 to 2023 *. *The upper part of the figures shows polynomial regression models.
Figure 3.
(A,B) Dynamics of publications (A) and citations (B) on using MS/MS for IEM screening from 1991 to 2023 *. *The upper part of the figures shows polynomial regression models.
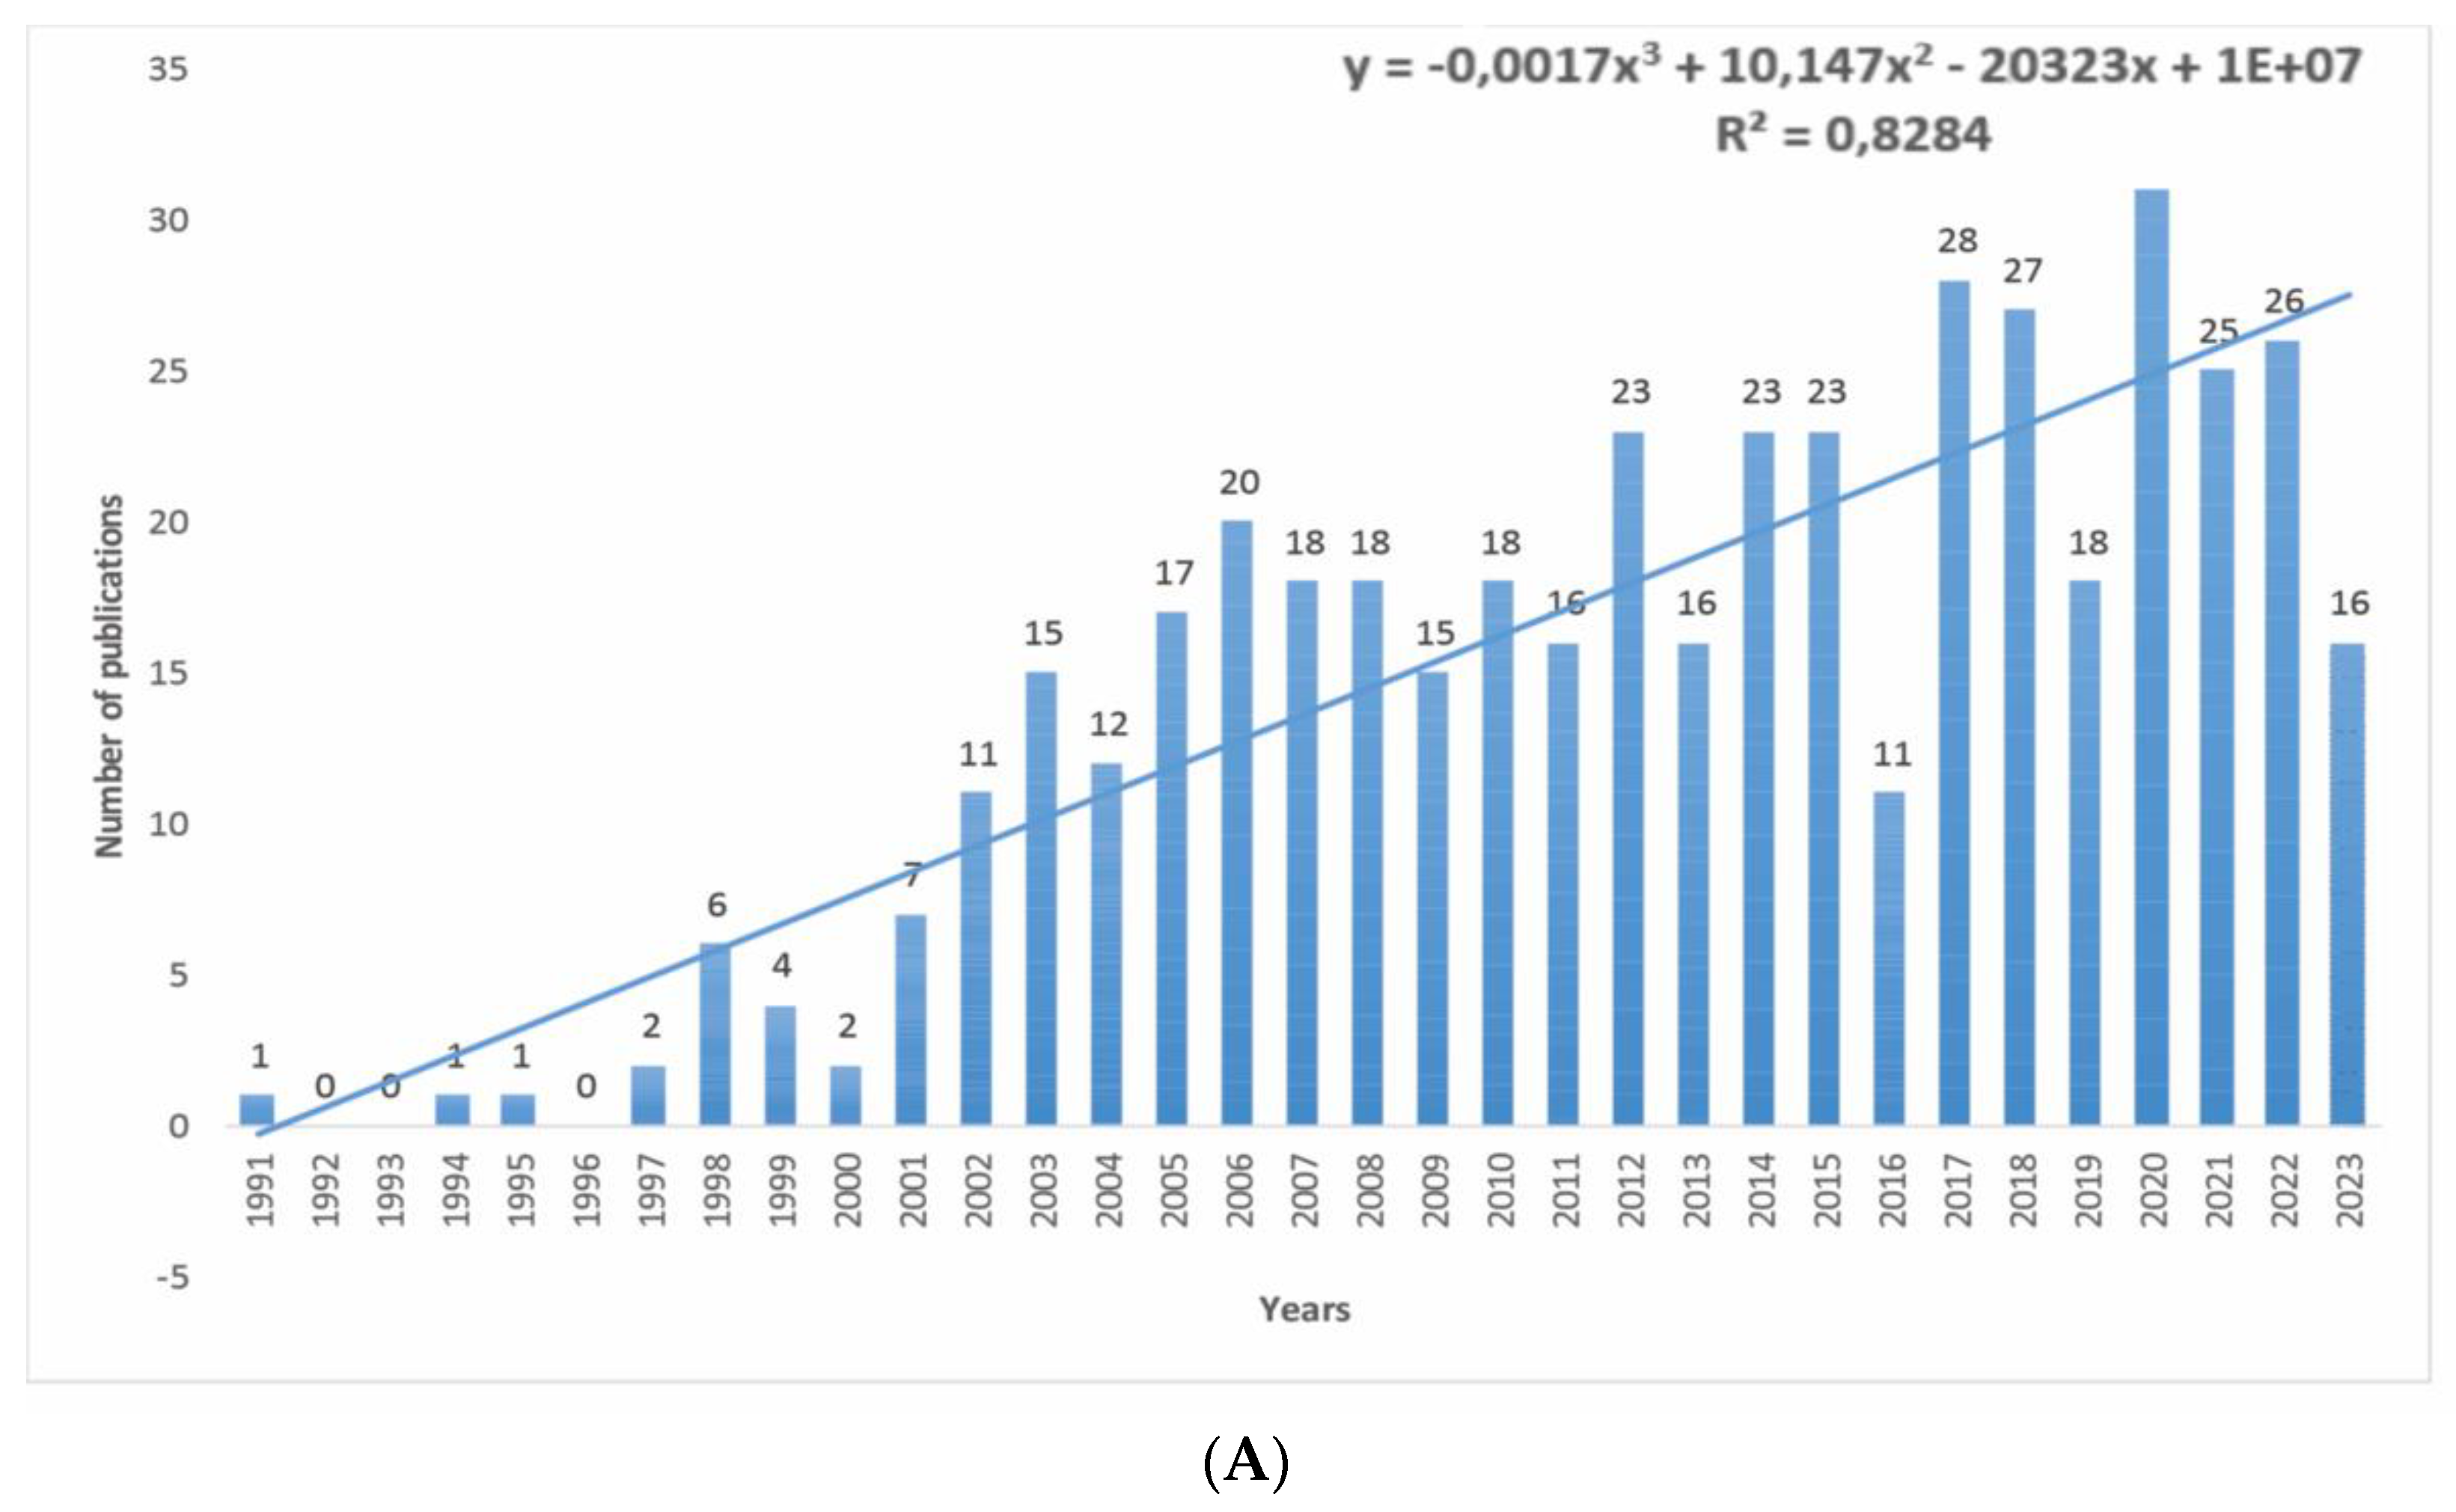
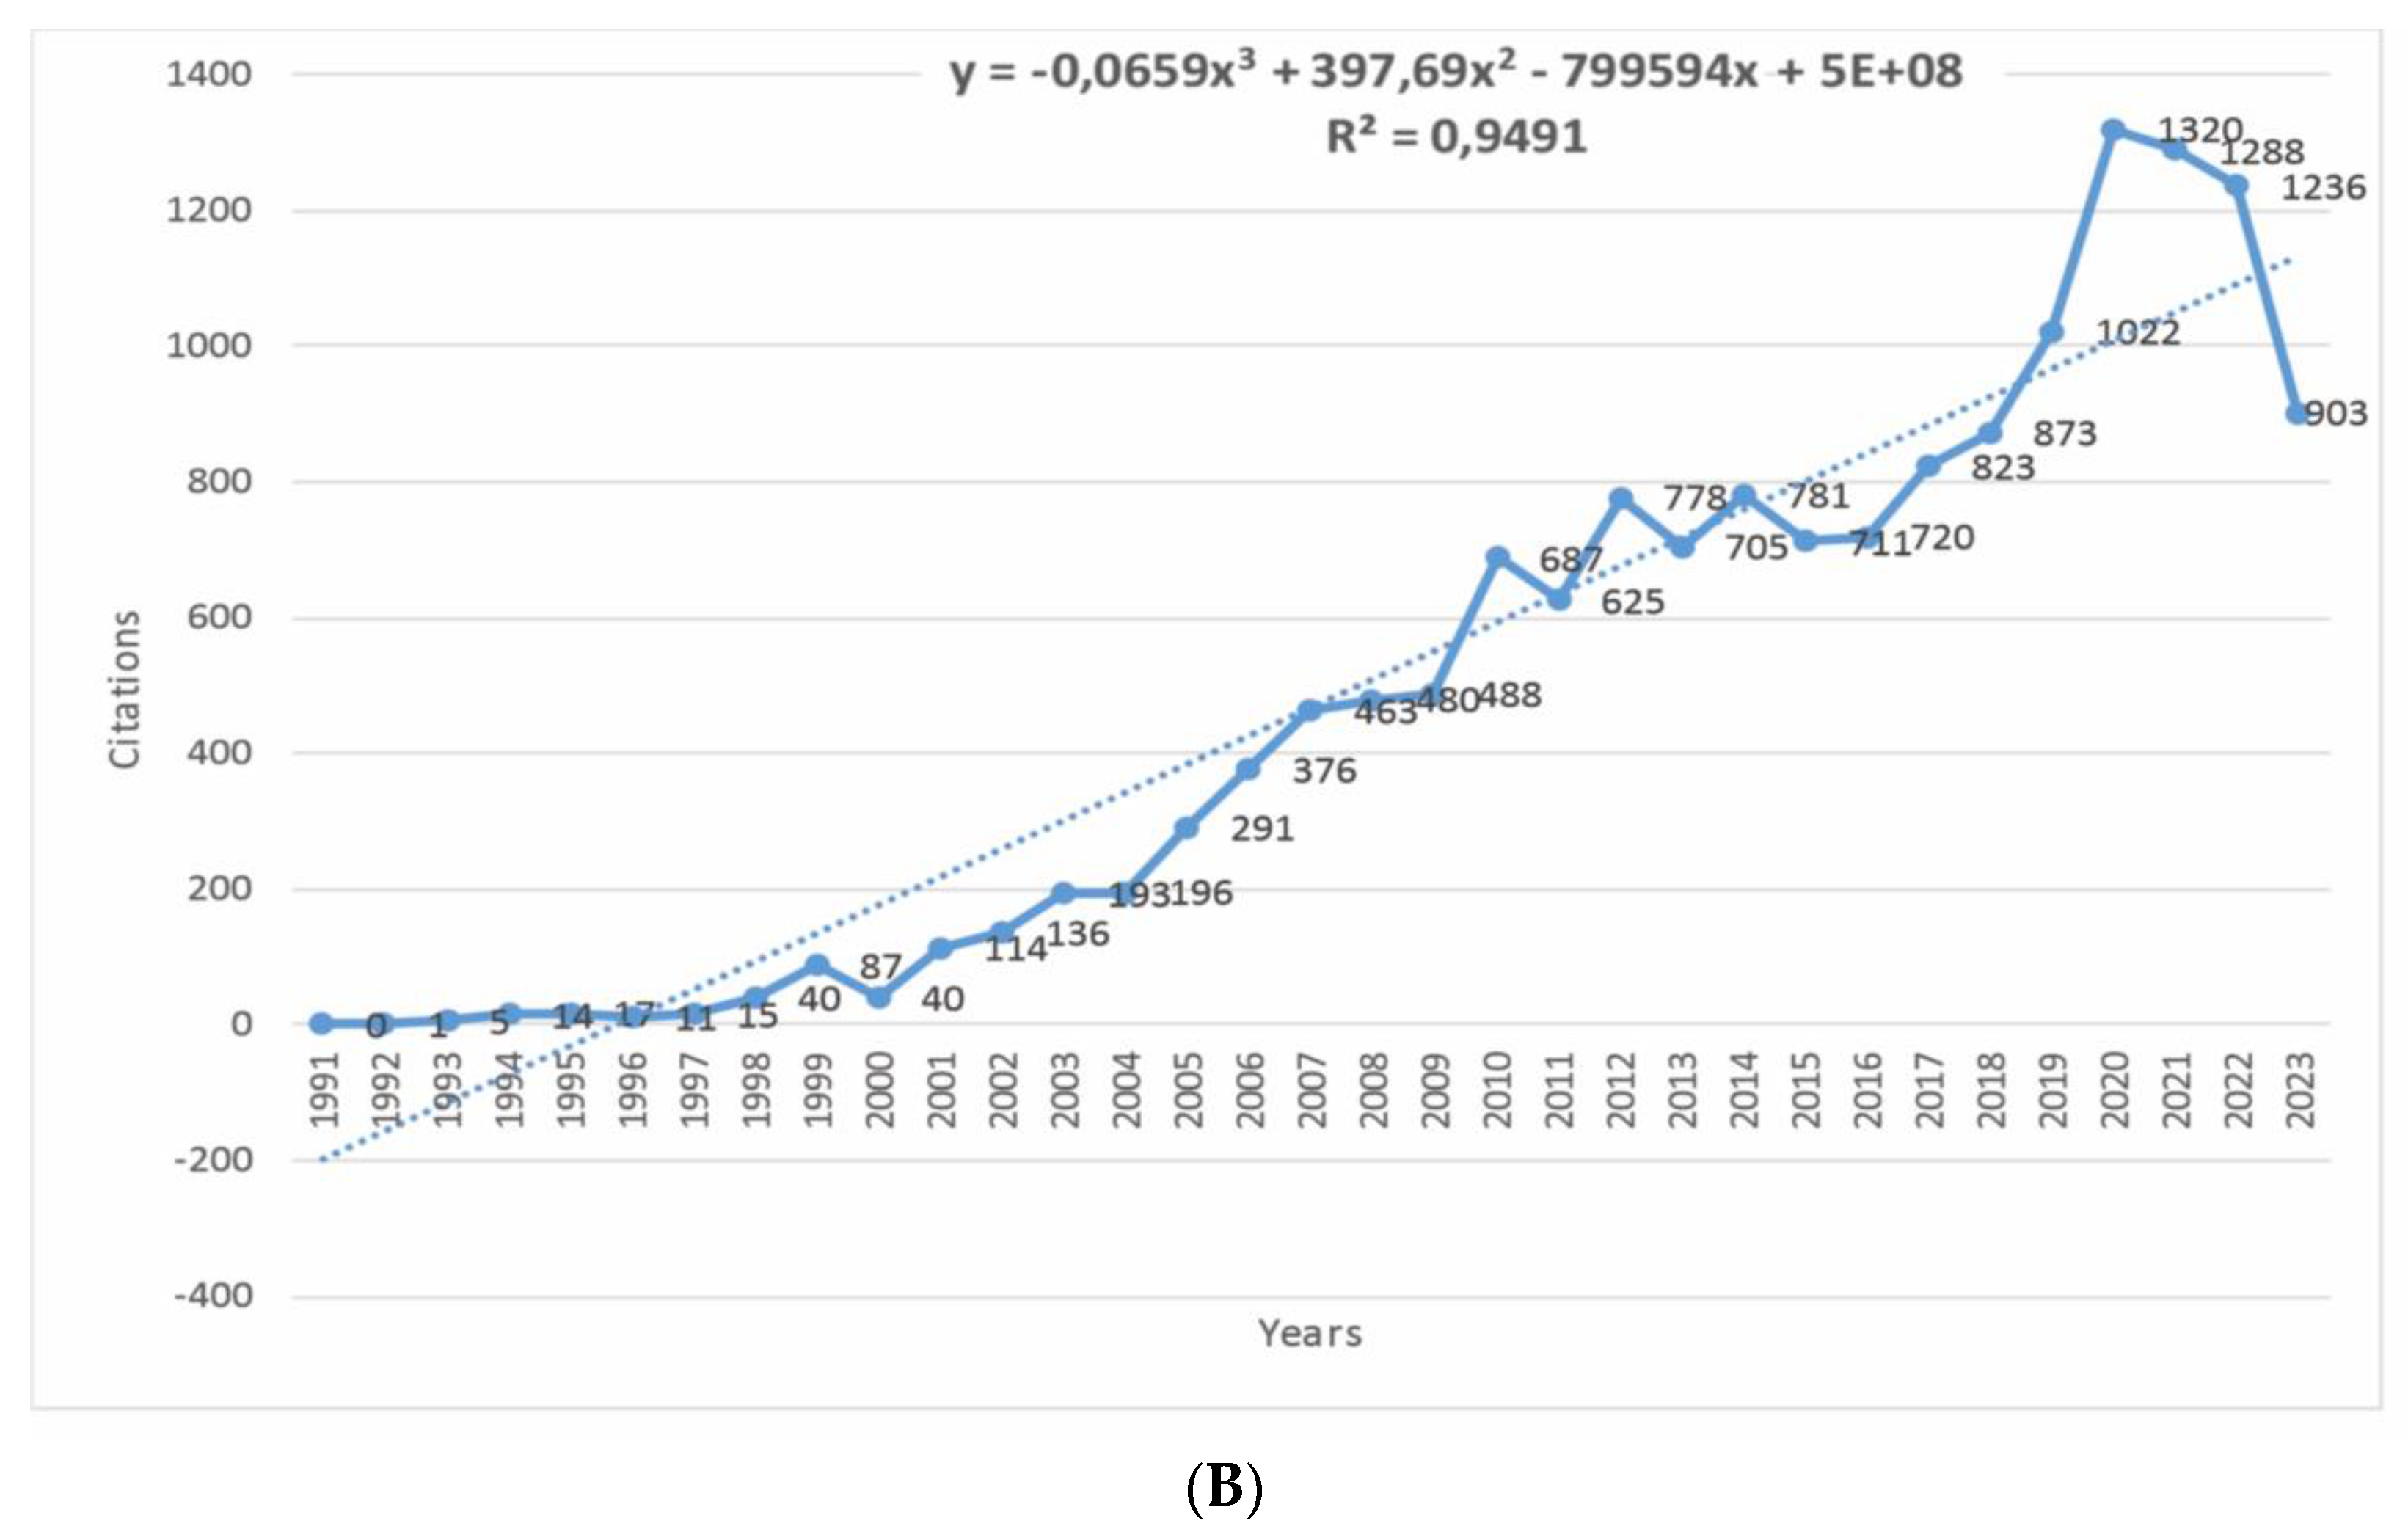
Figure 4.
(A,B) Countries’ scientific production (A) and performance over time (B)..
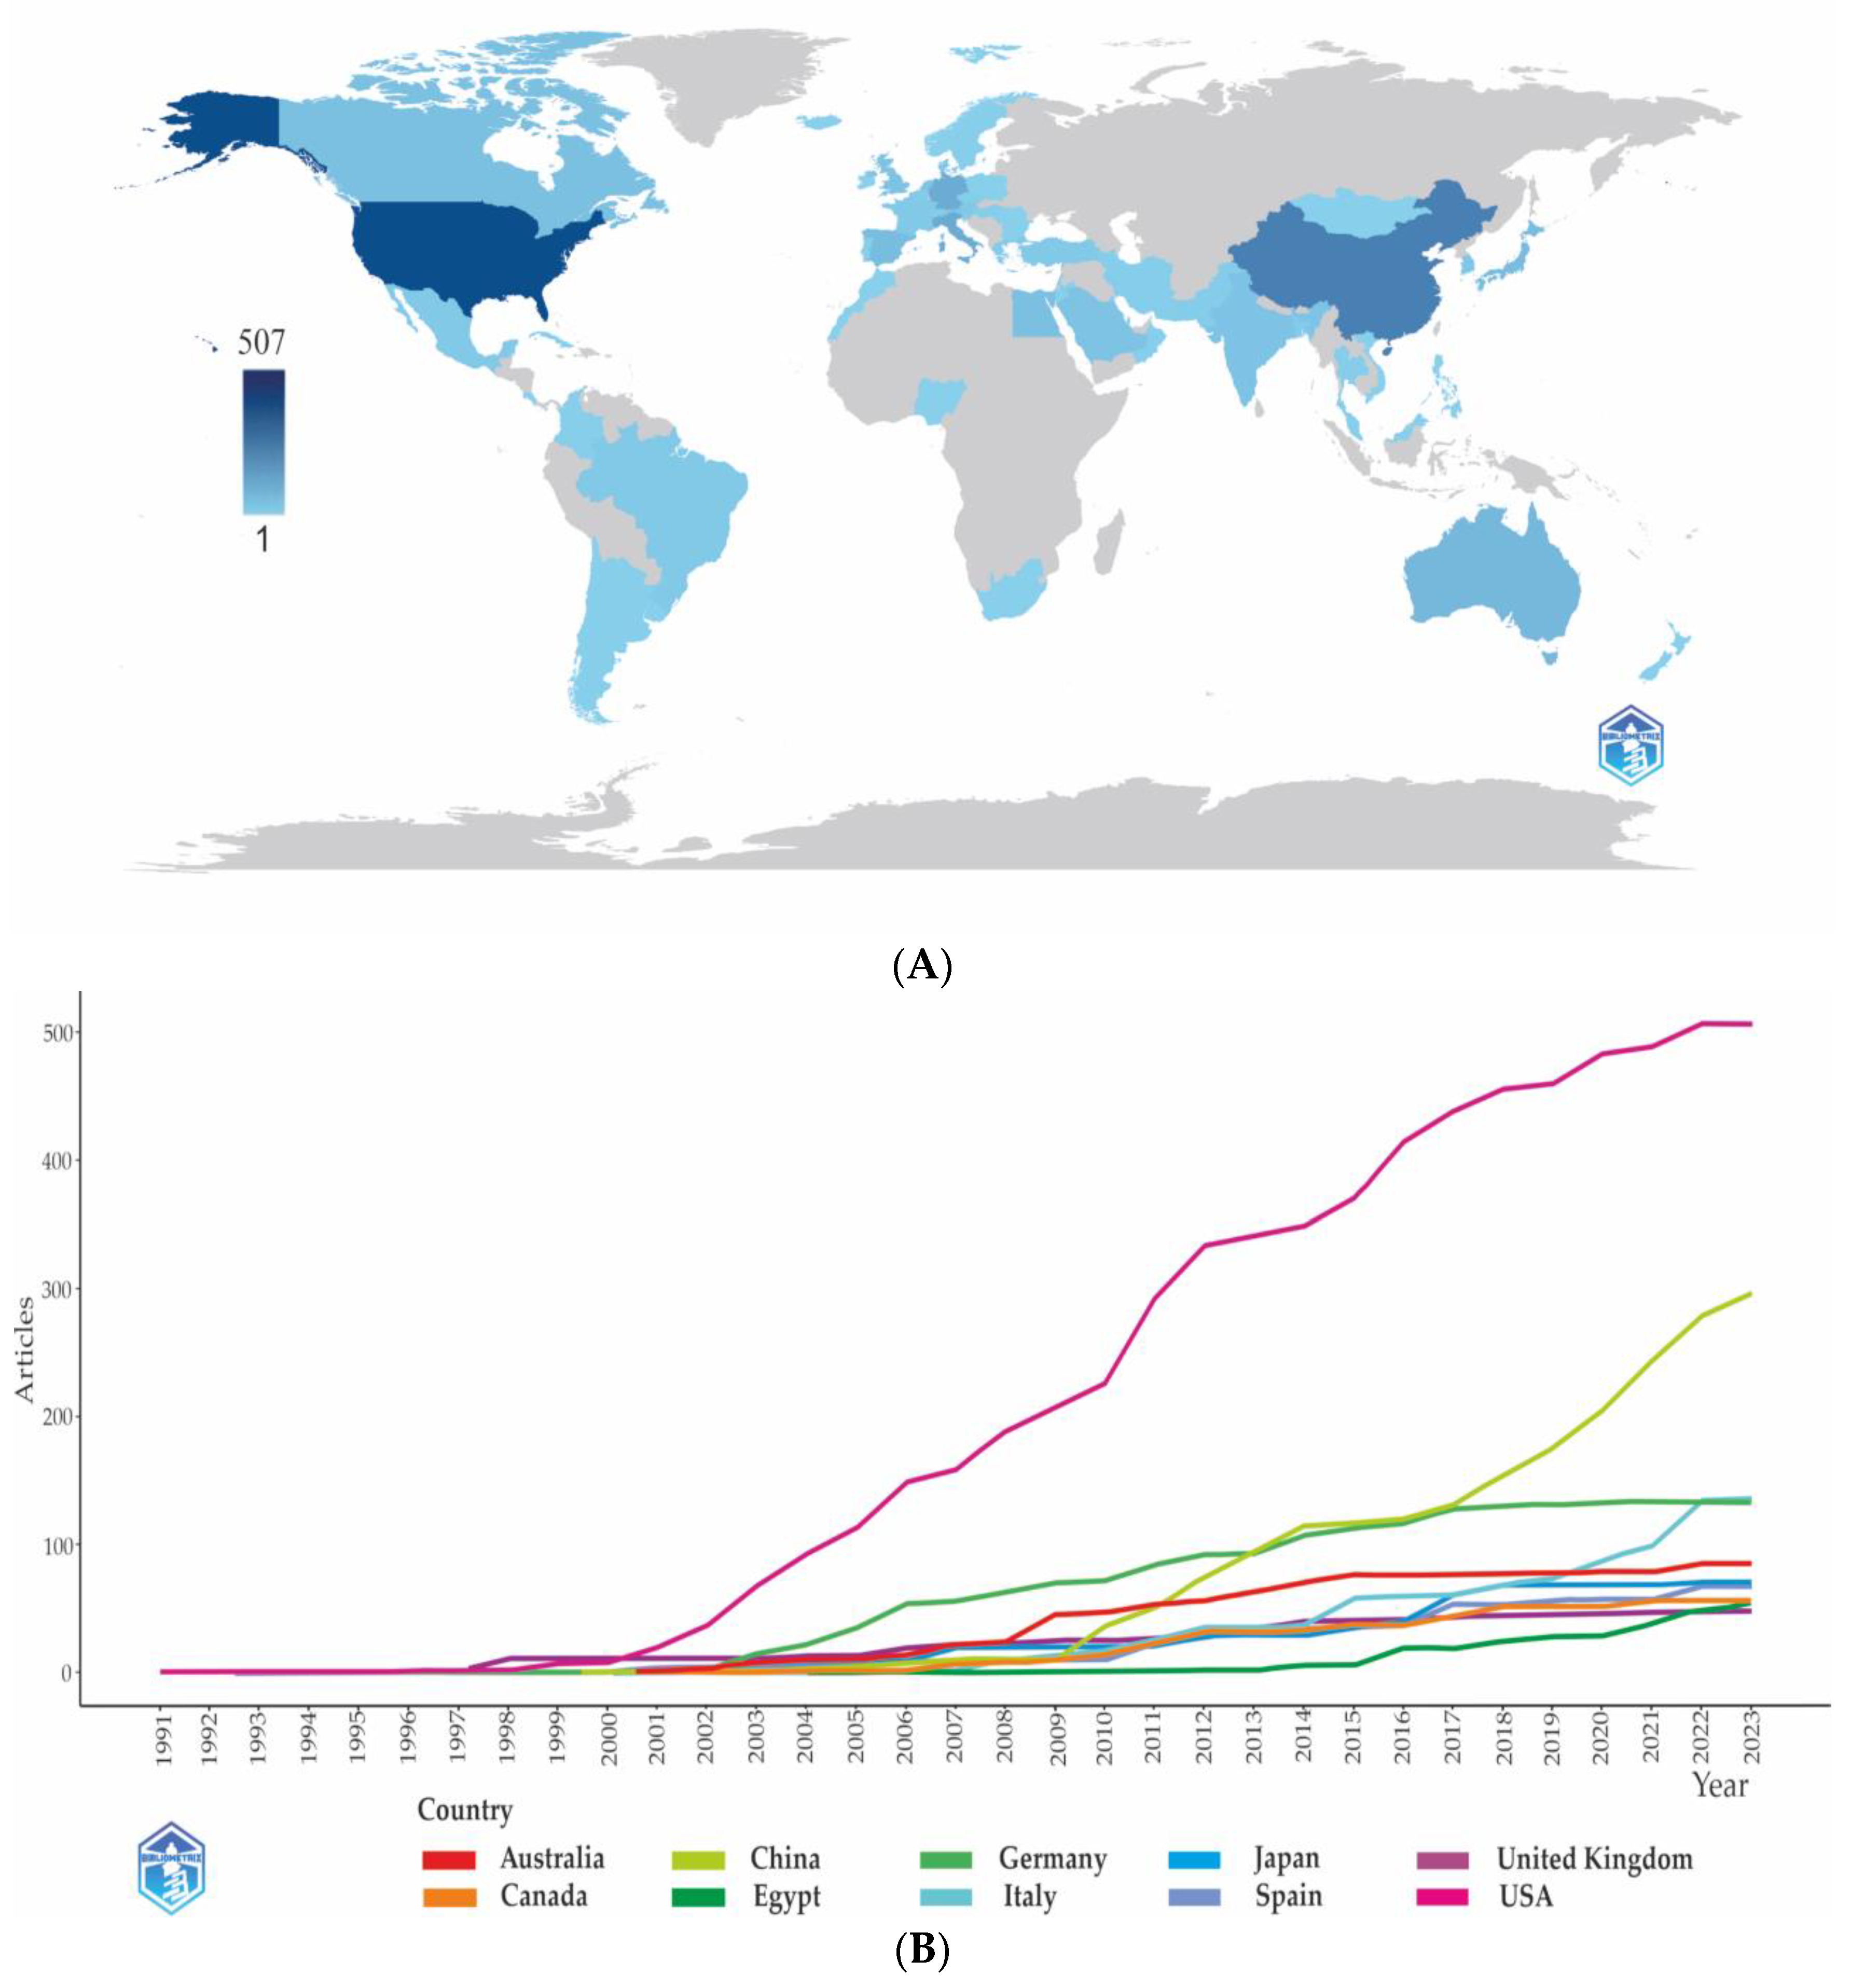
Figure 5.
(A,B) Collaboration network on a world map* (A) and Corresponding authors’ countries (B). *The dark blue color indicates a higher level of cooperation; the broader the line of communication, the higher the level of collaboration between two countries.
Figure 5.
(A,B) Collaboration network on a world map* (A) and Corresponding authors’ countries (B). *The dark blue color indicates a higher level of cooperation; the broader the line of communication, the higher the level of collaboration between two countries.
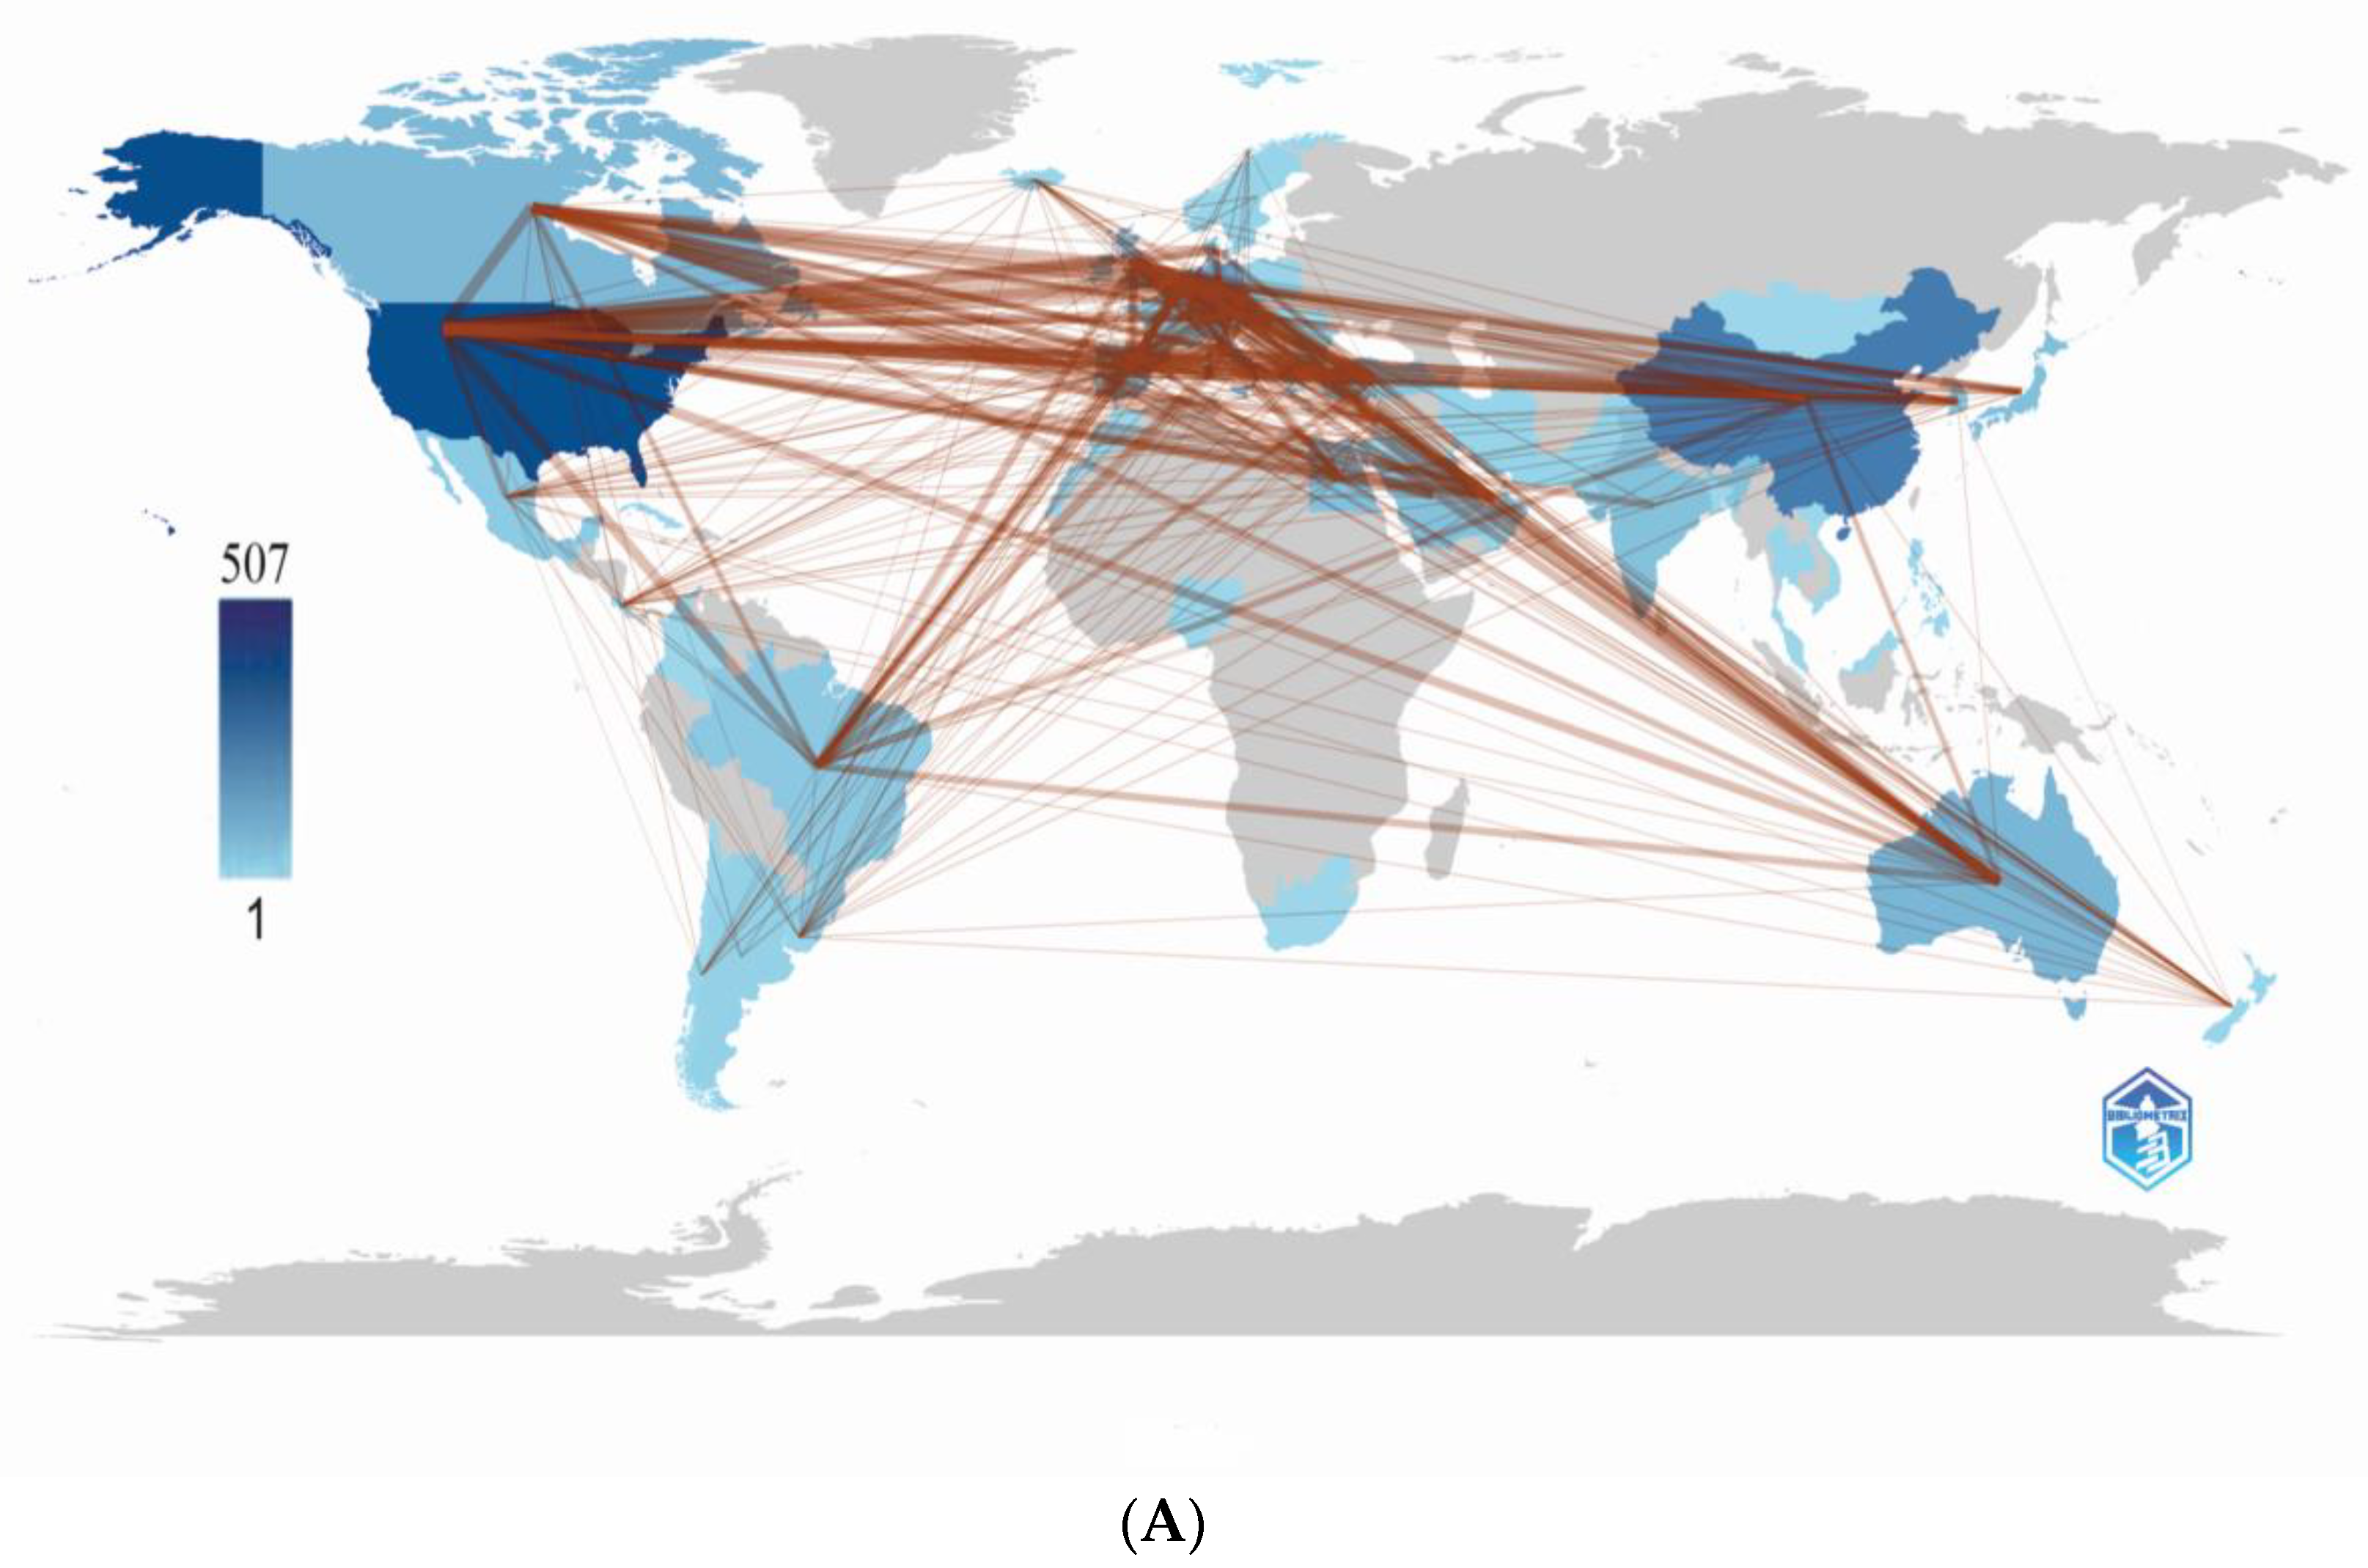
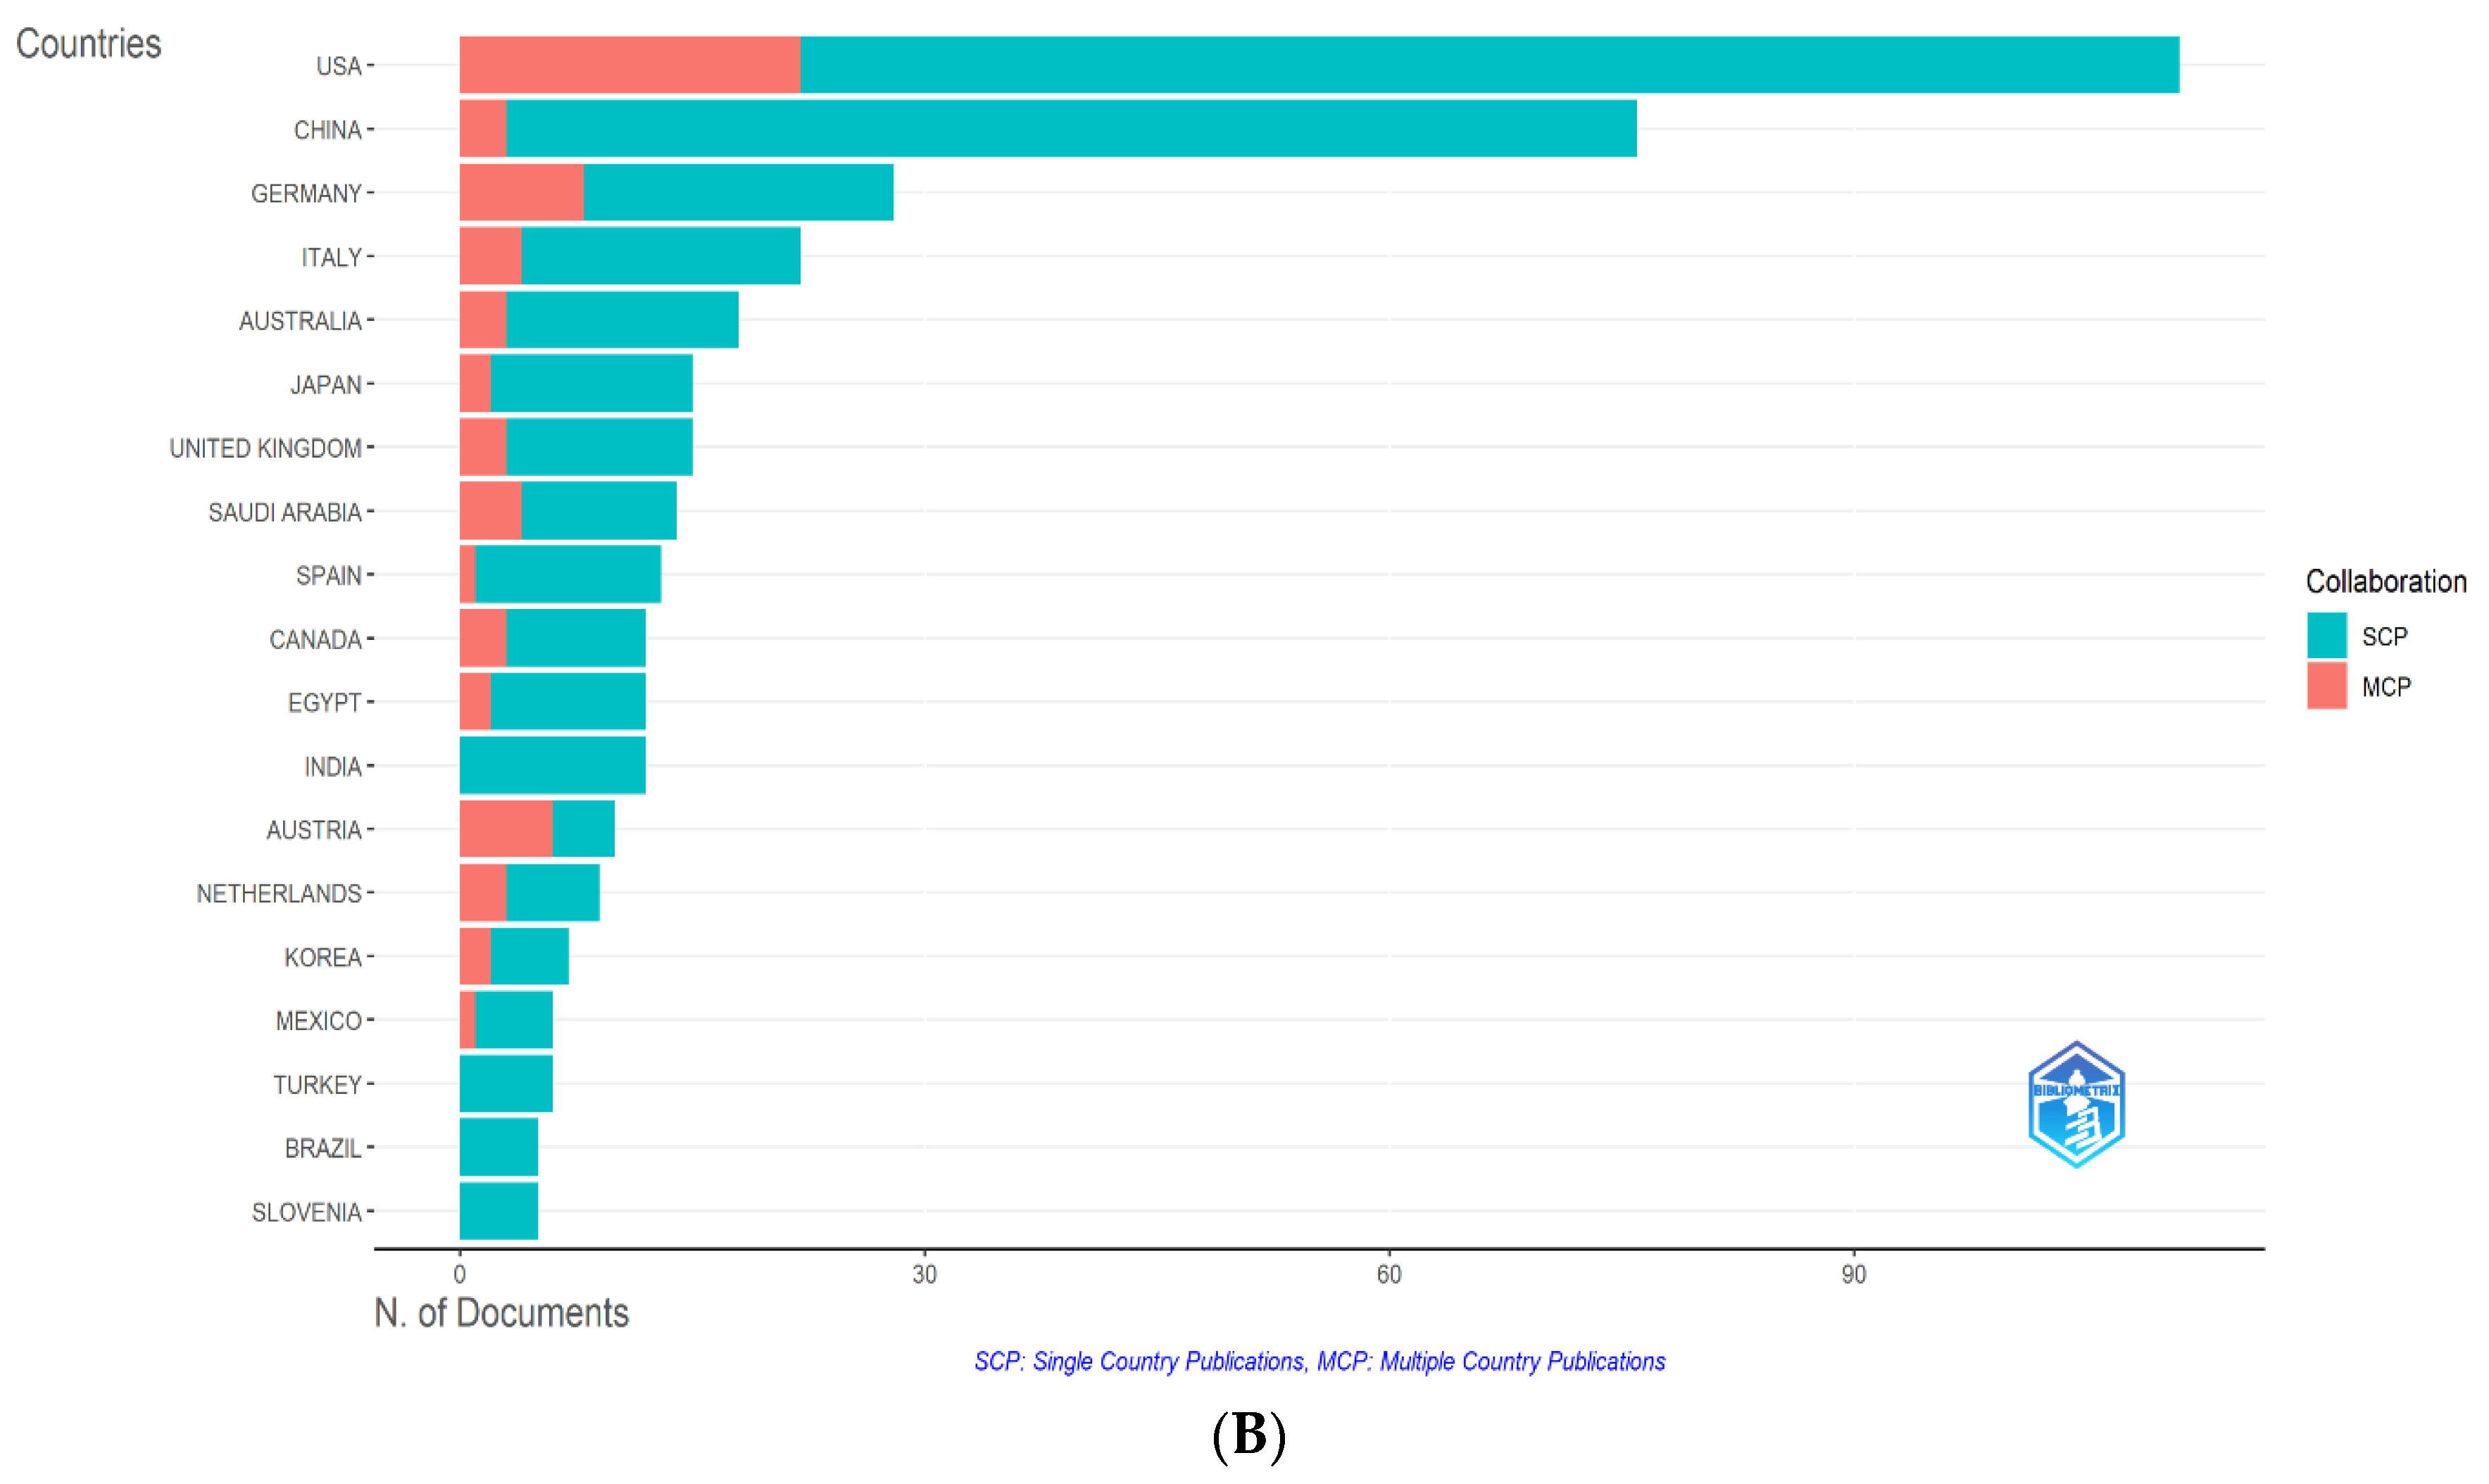
Figure 6.
(A,B) Cooperation of the leading countries. Distribution of co-authors’ collaborations by countries of their origin. Countries with more than three publications by clusters (A). The number of documents from collaborating countries and their average citations (B).
Figure 6.
(A,B) Cooperation of the leading countries. Distribution of co-authors’ collaborations by countries of their origin. Countries with more than three publications by clusters (A). The number of documents from collaborating countries and their average citations (B).
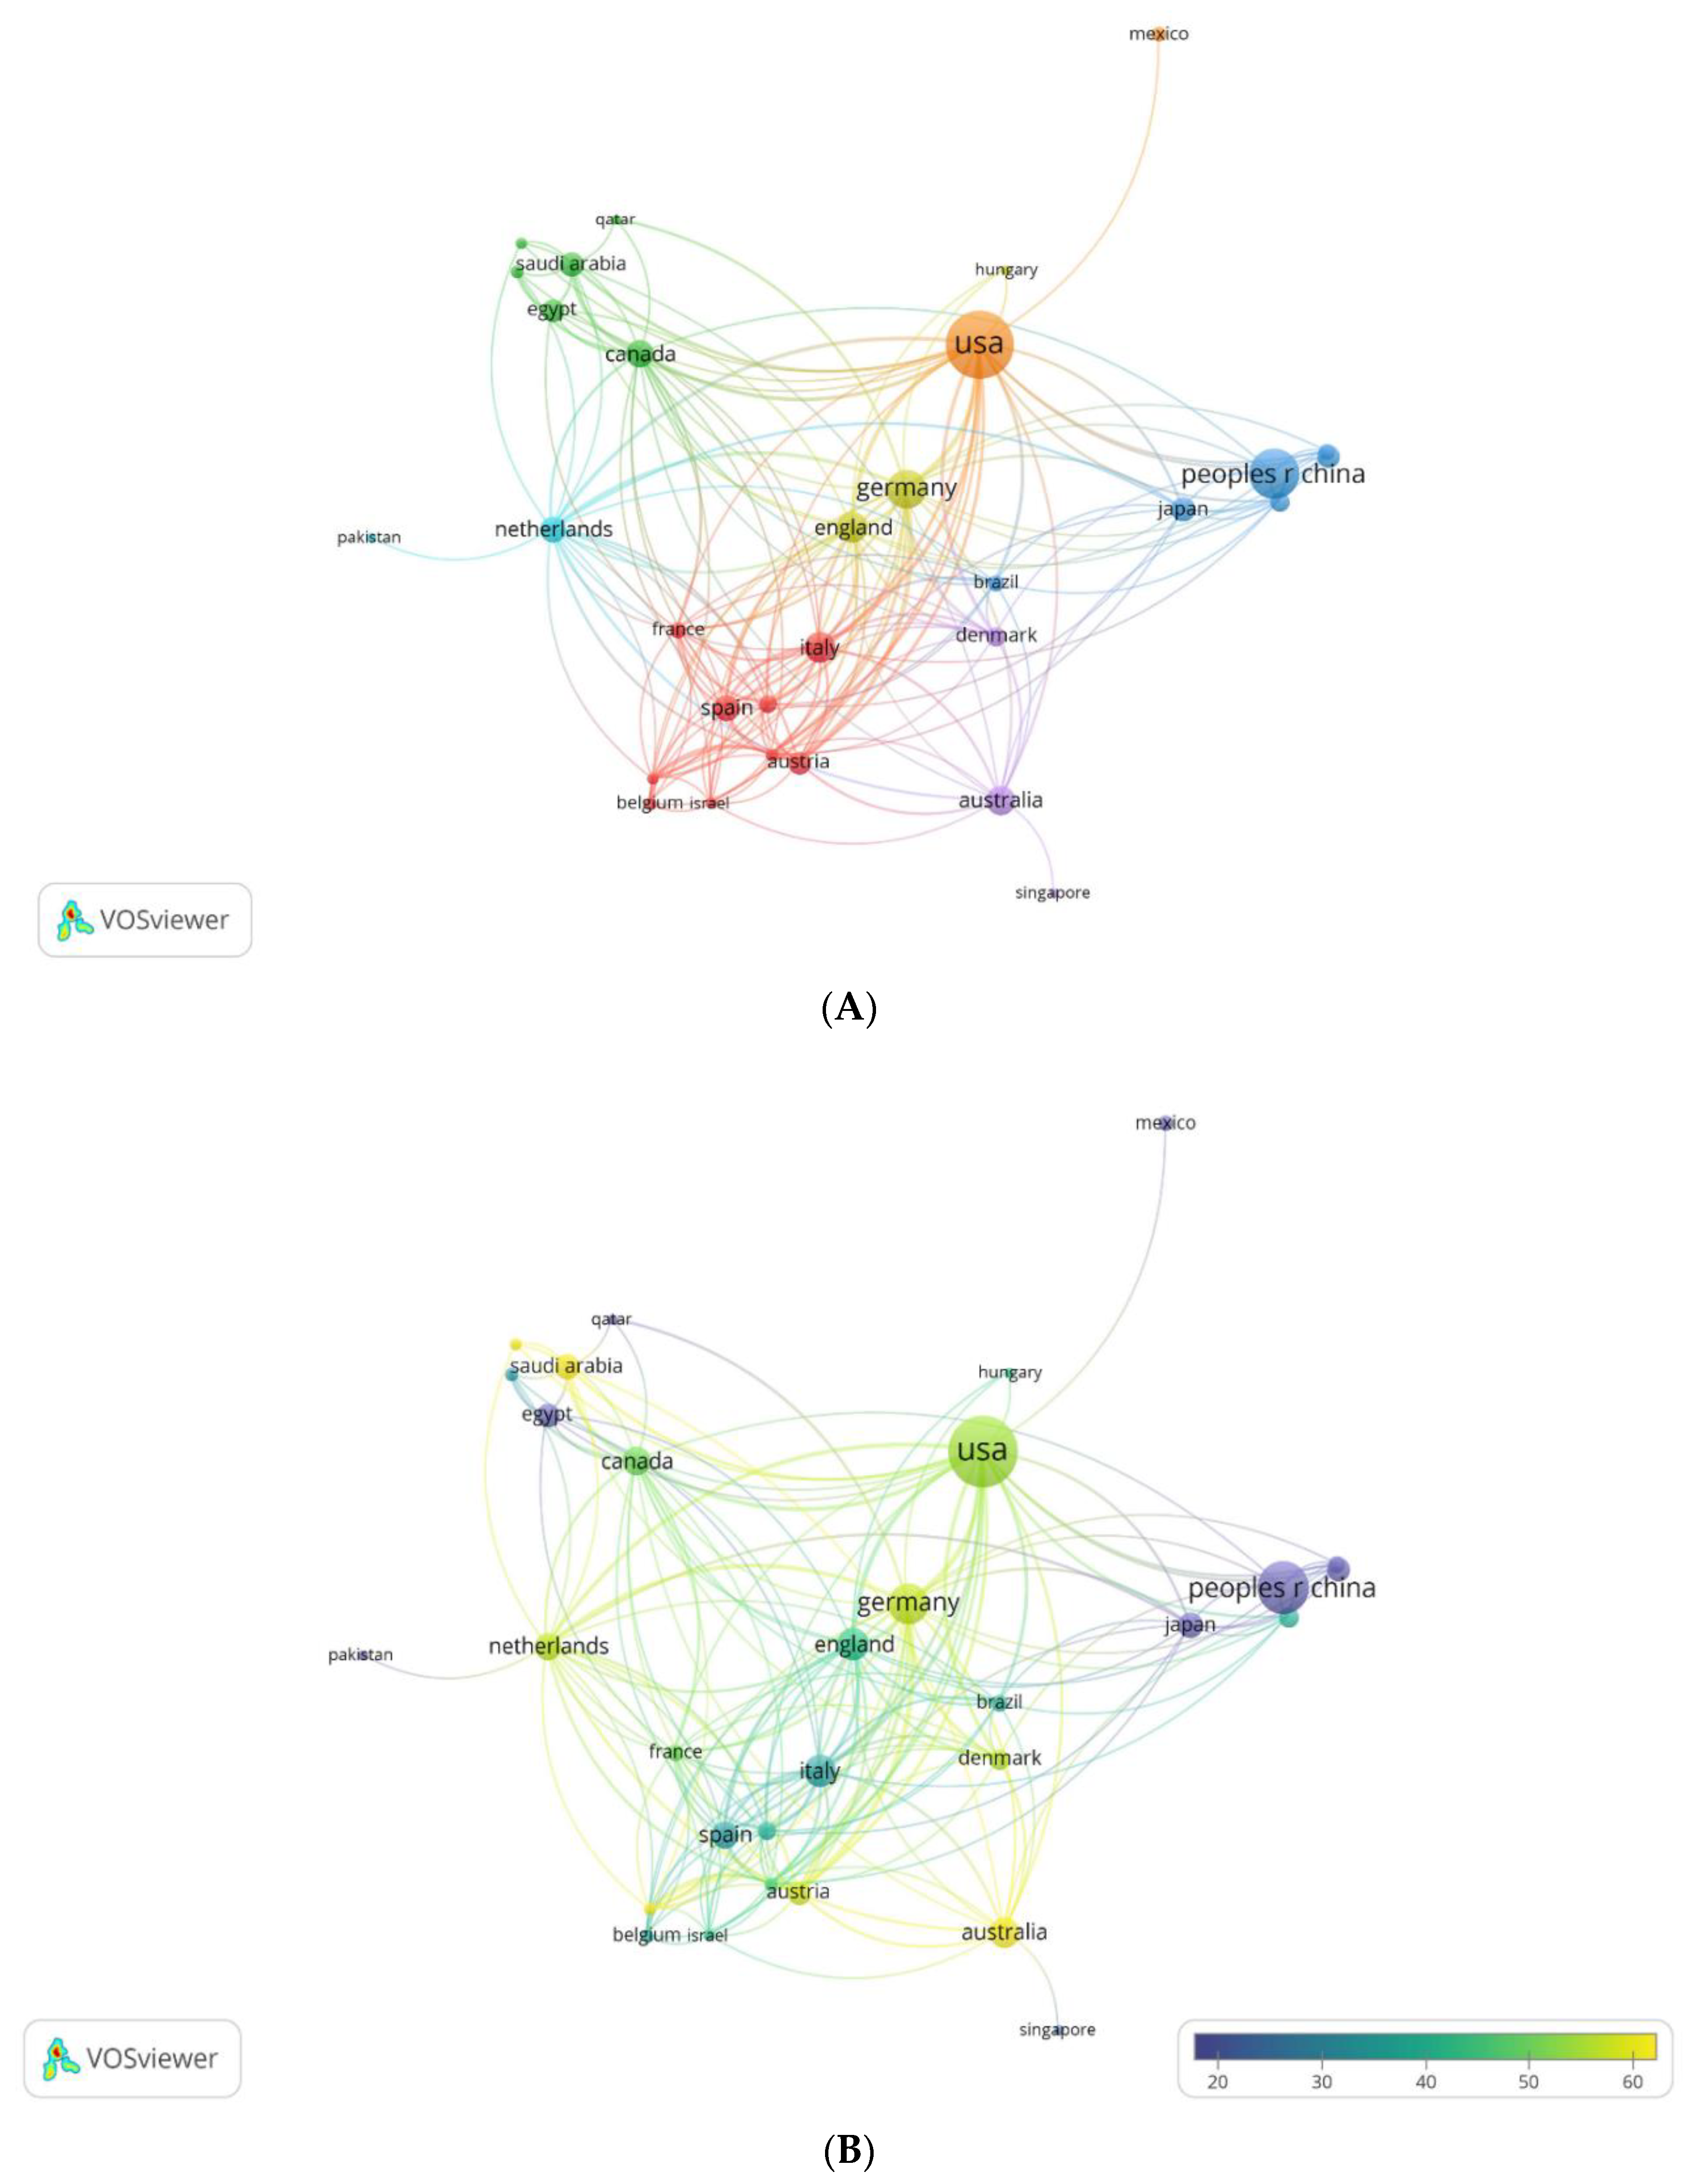
Figure 7.
(A,B) Most relevant affiliations (A) and affiliations’ performance over time (B).
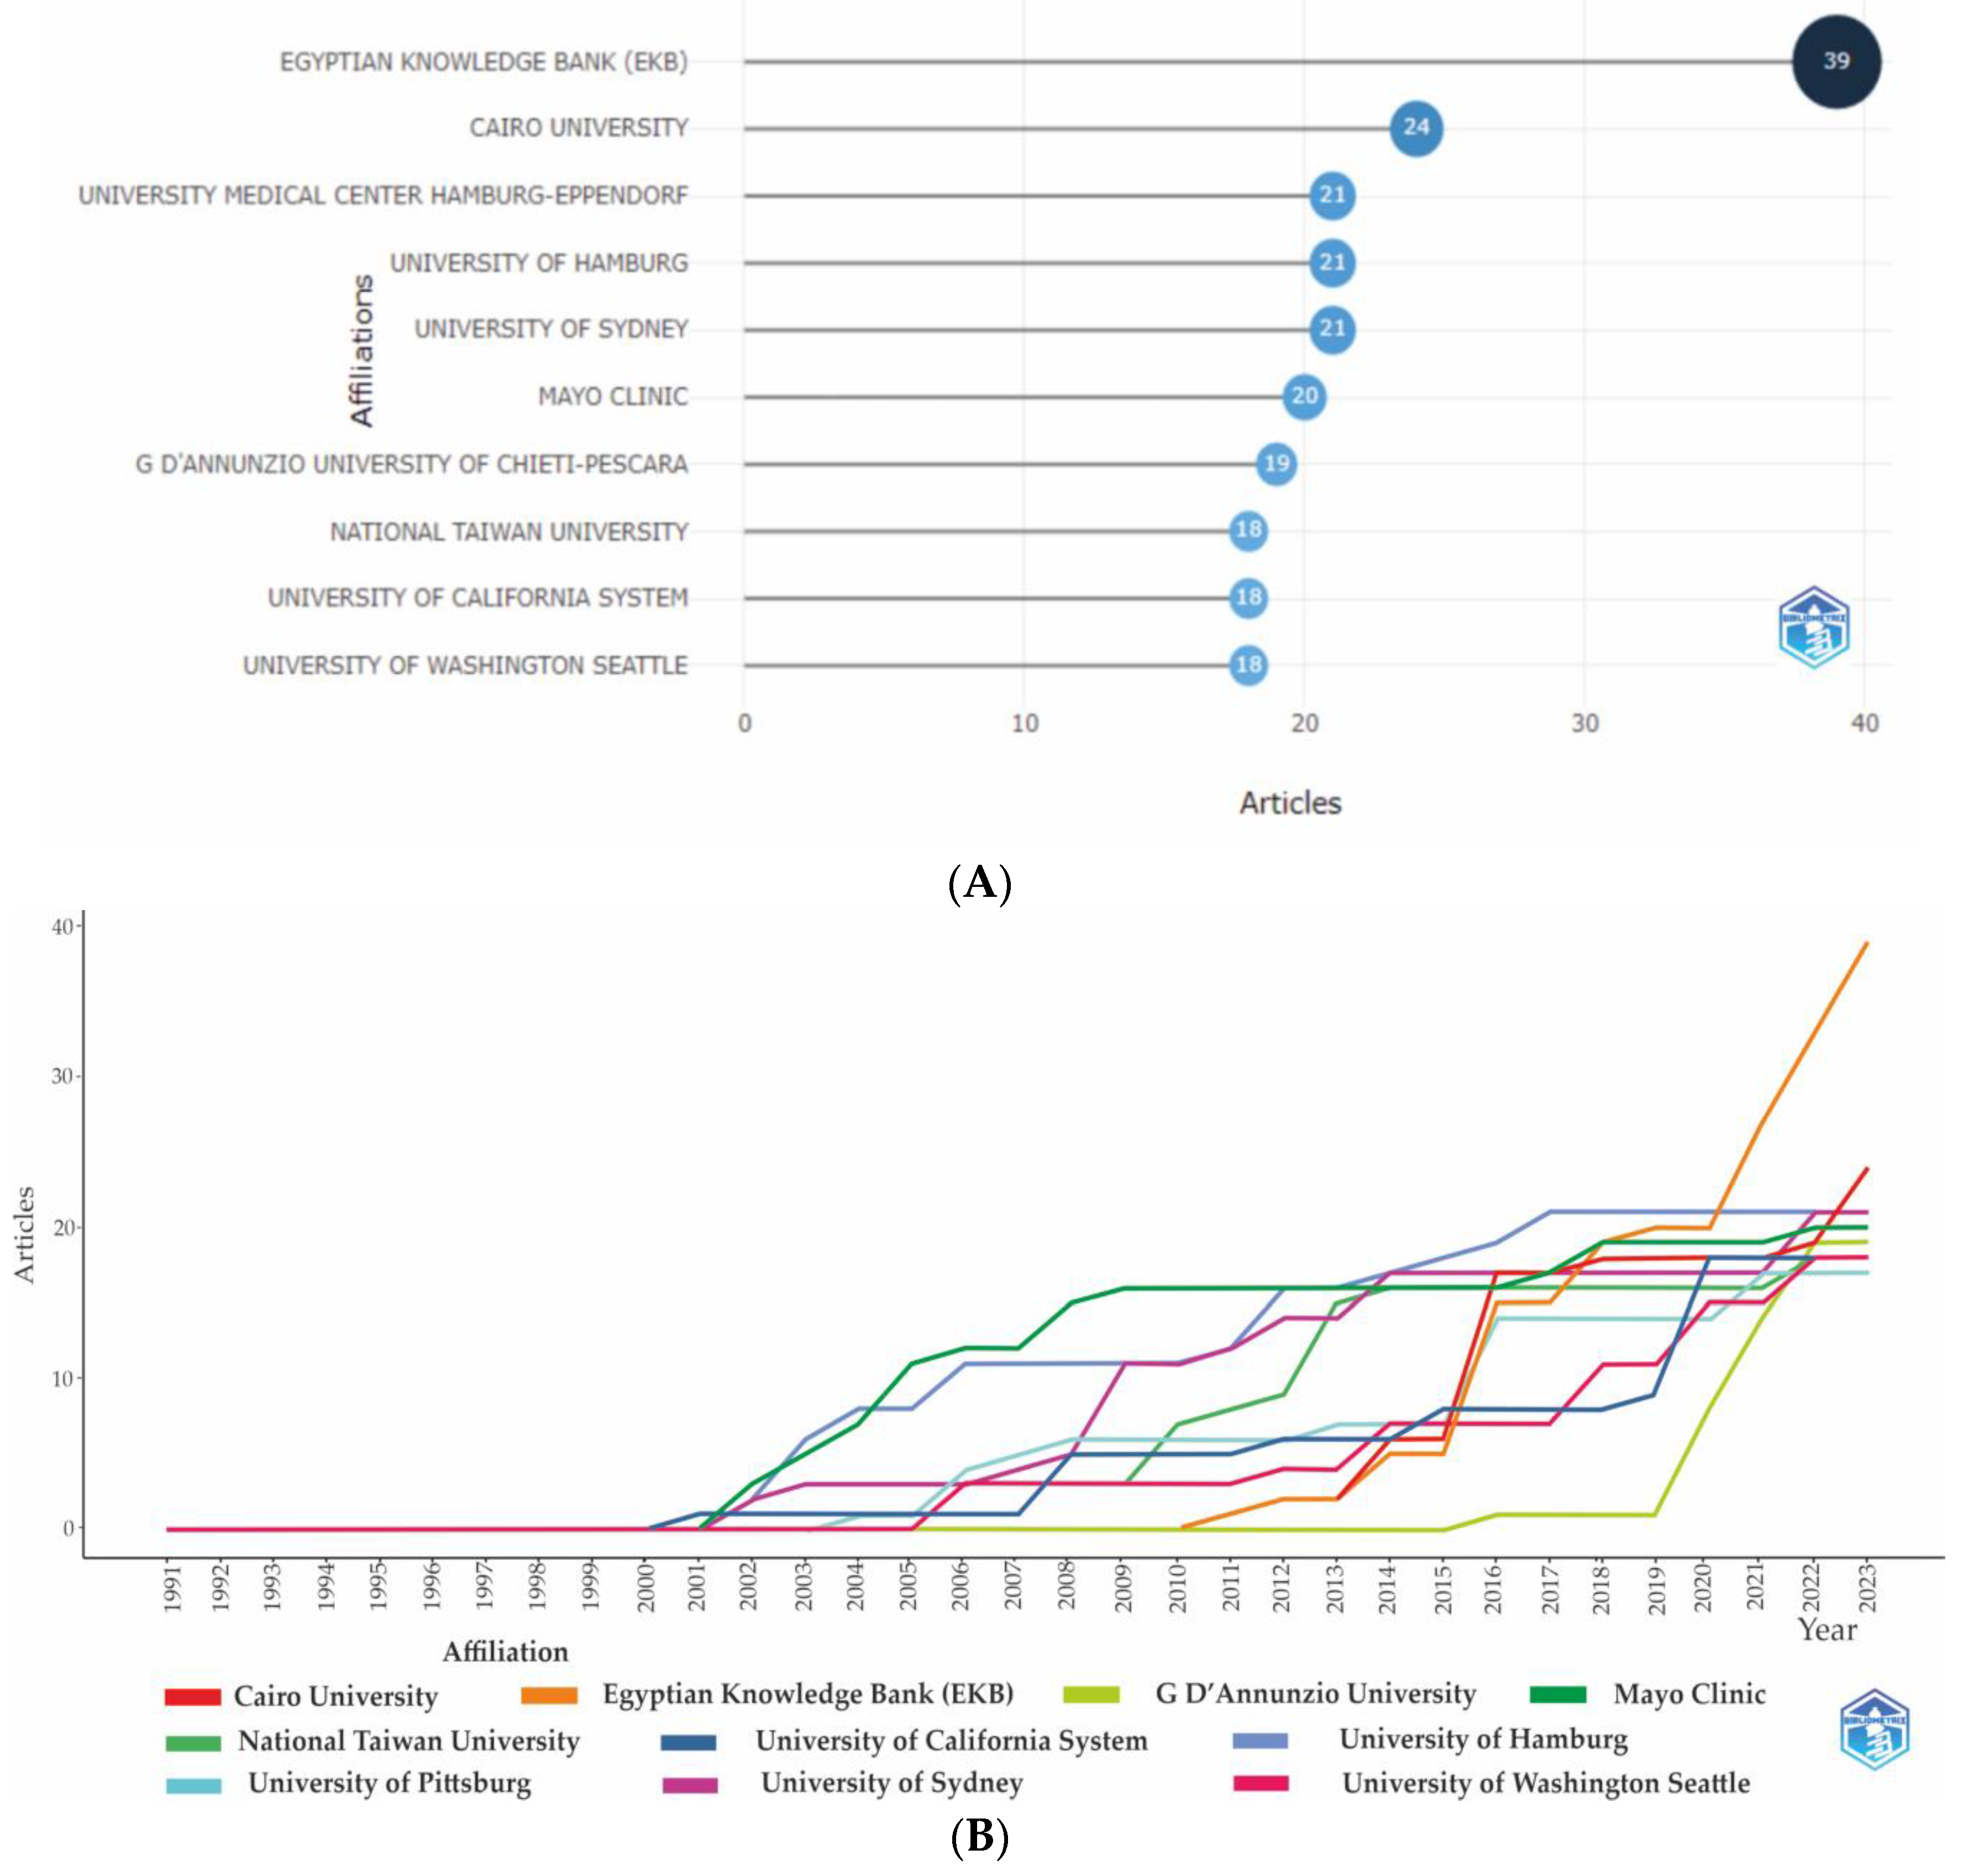
Figure 8.
(A,B) Maps of institutions’ cooperation. Collaboration between organizations in terms of co-authorship by clusters (A). Connection between the formed 6 clusters of organizations based on the “Citation” indicator (B).
Figure 8.
(A,B) Maps of institutions’ cooperation. Collaboration between organizations in terms of co-authorship by clusters (A). Connection between the formed 6 clusters of organizations based on the “Citation” indicator (B).
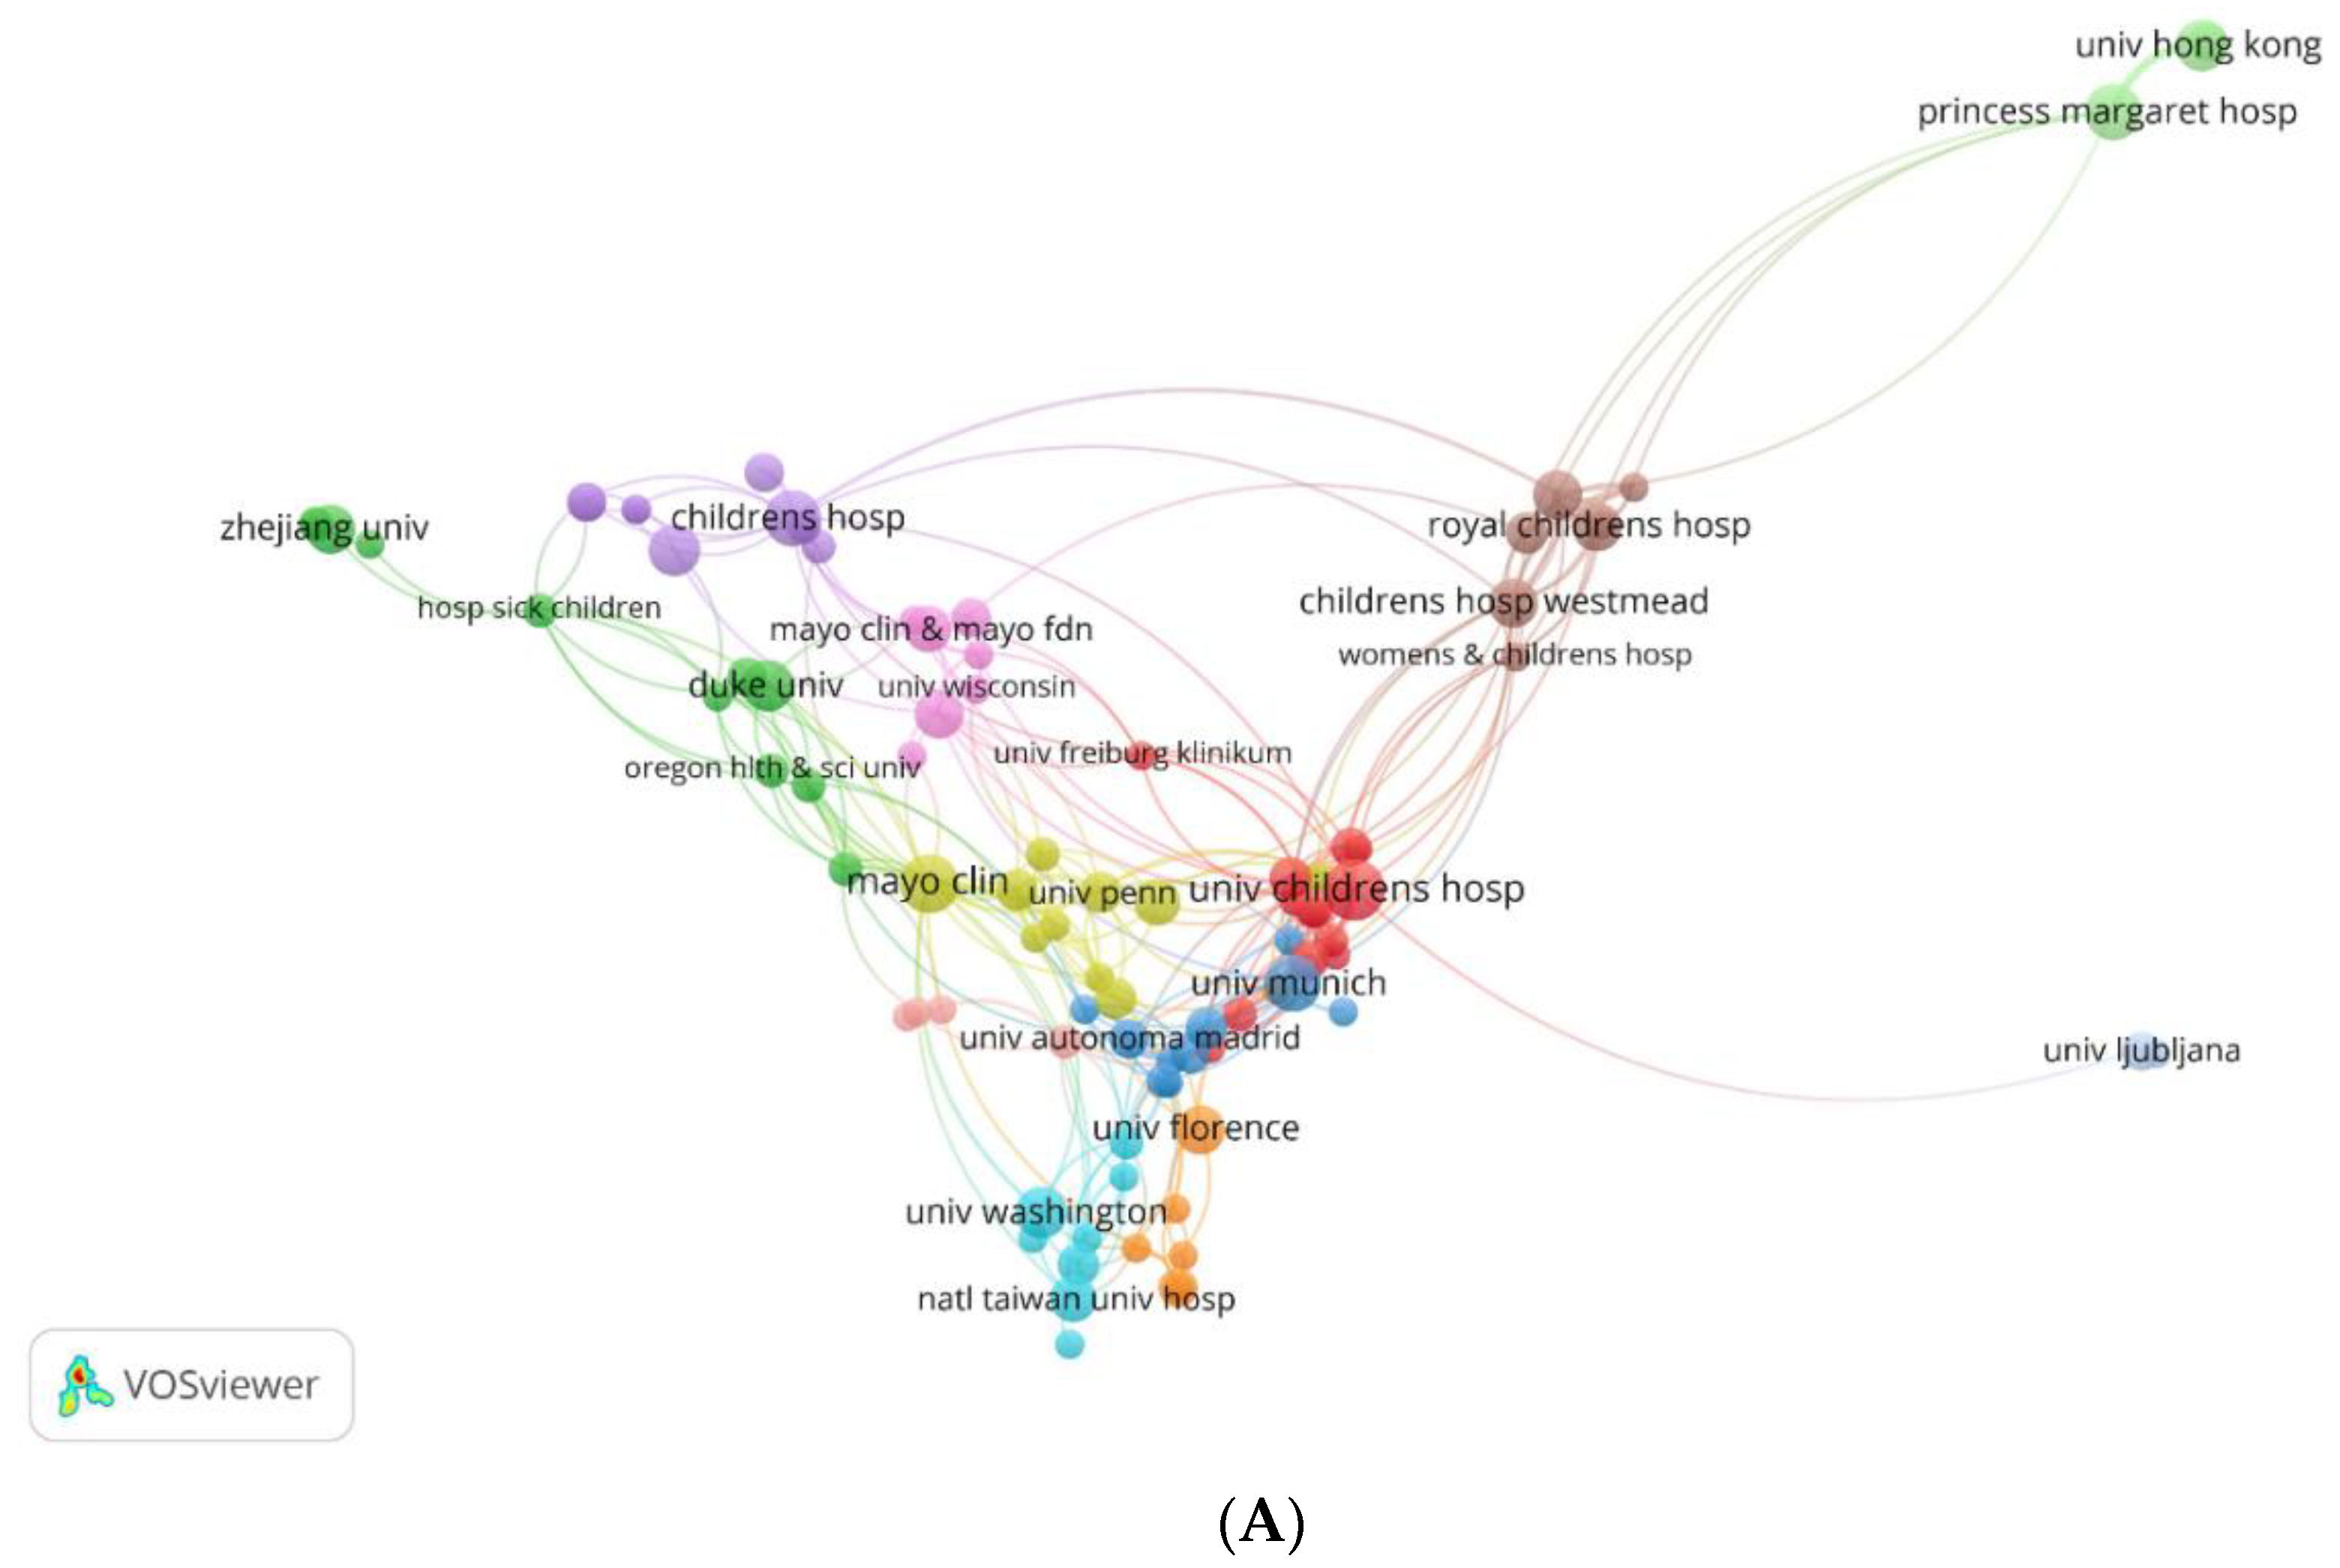
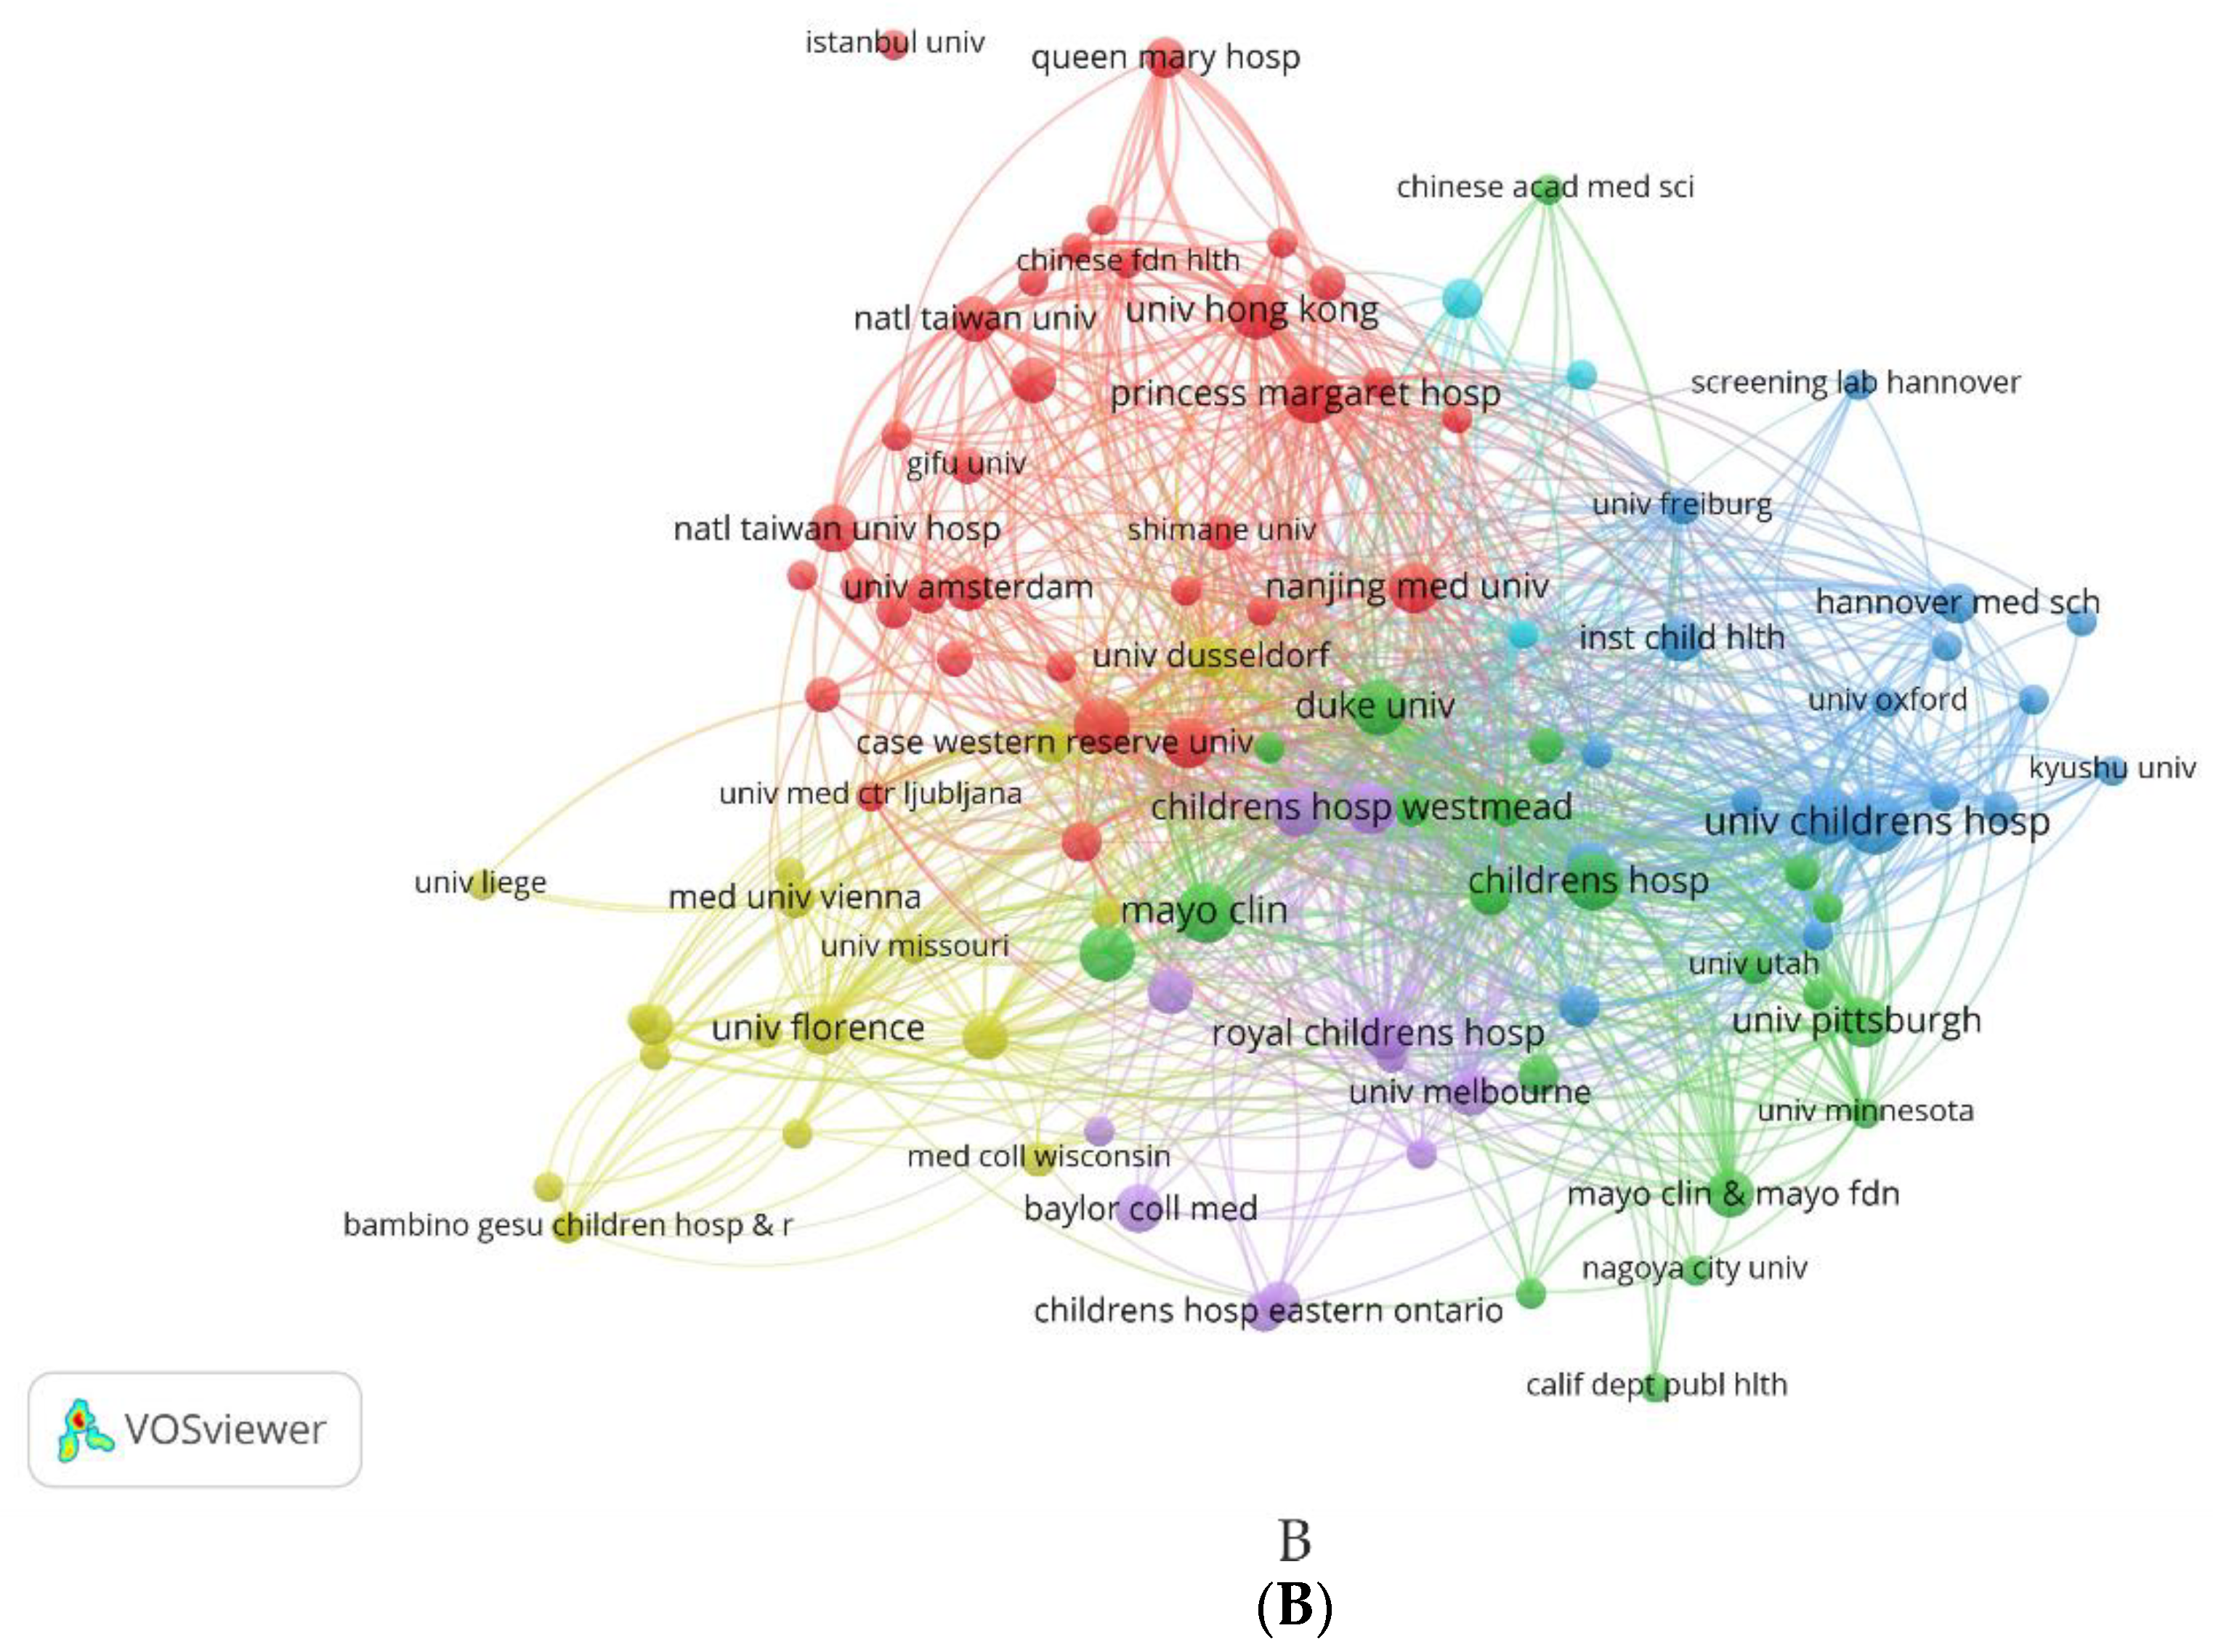
Figure 9.
(A,B,C) Authors’ Productivity Analysis. Most locally cited authors (A); Authors’ production over time* (B); and Author productivity by Lotka’s law. *The color intensity is proportional to the total citations per year. The bubble size is proportional to the number of documents. The line represents an author’s timeline.
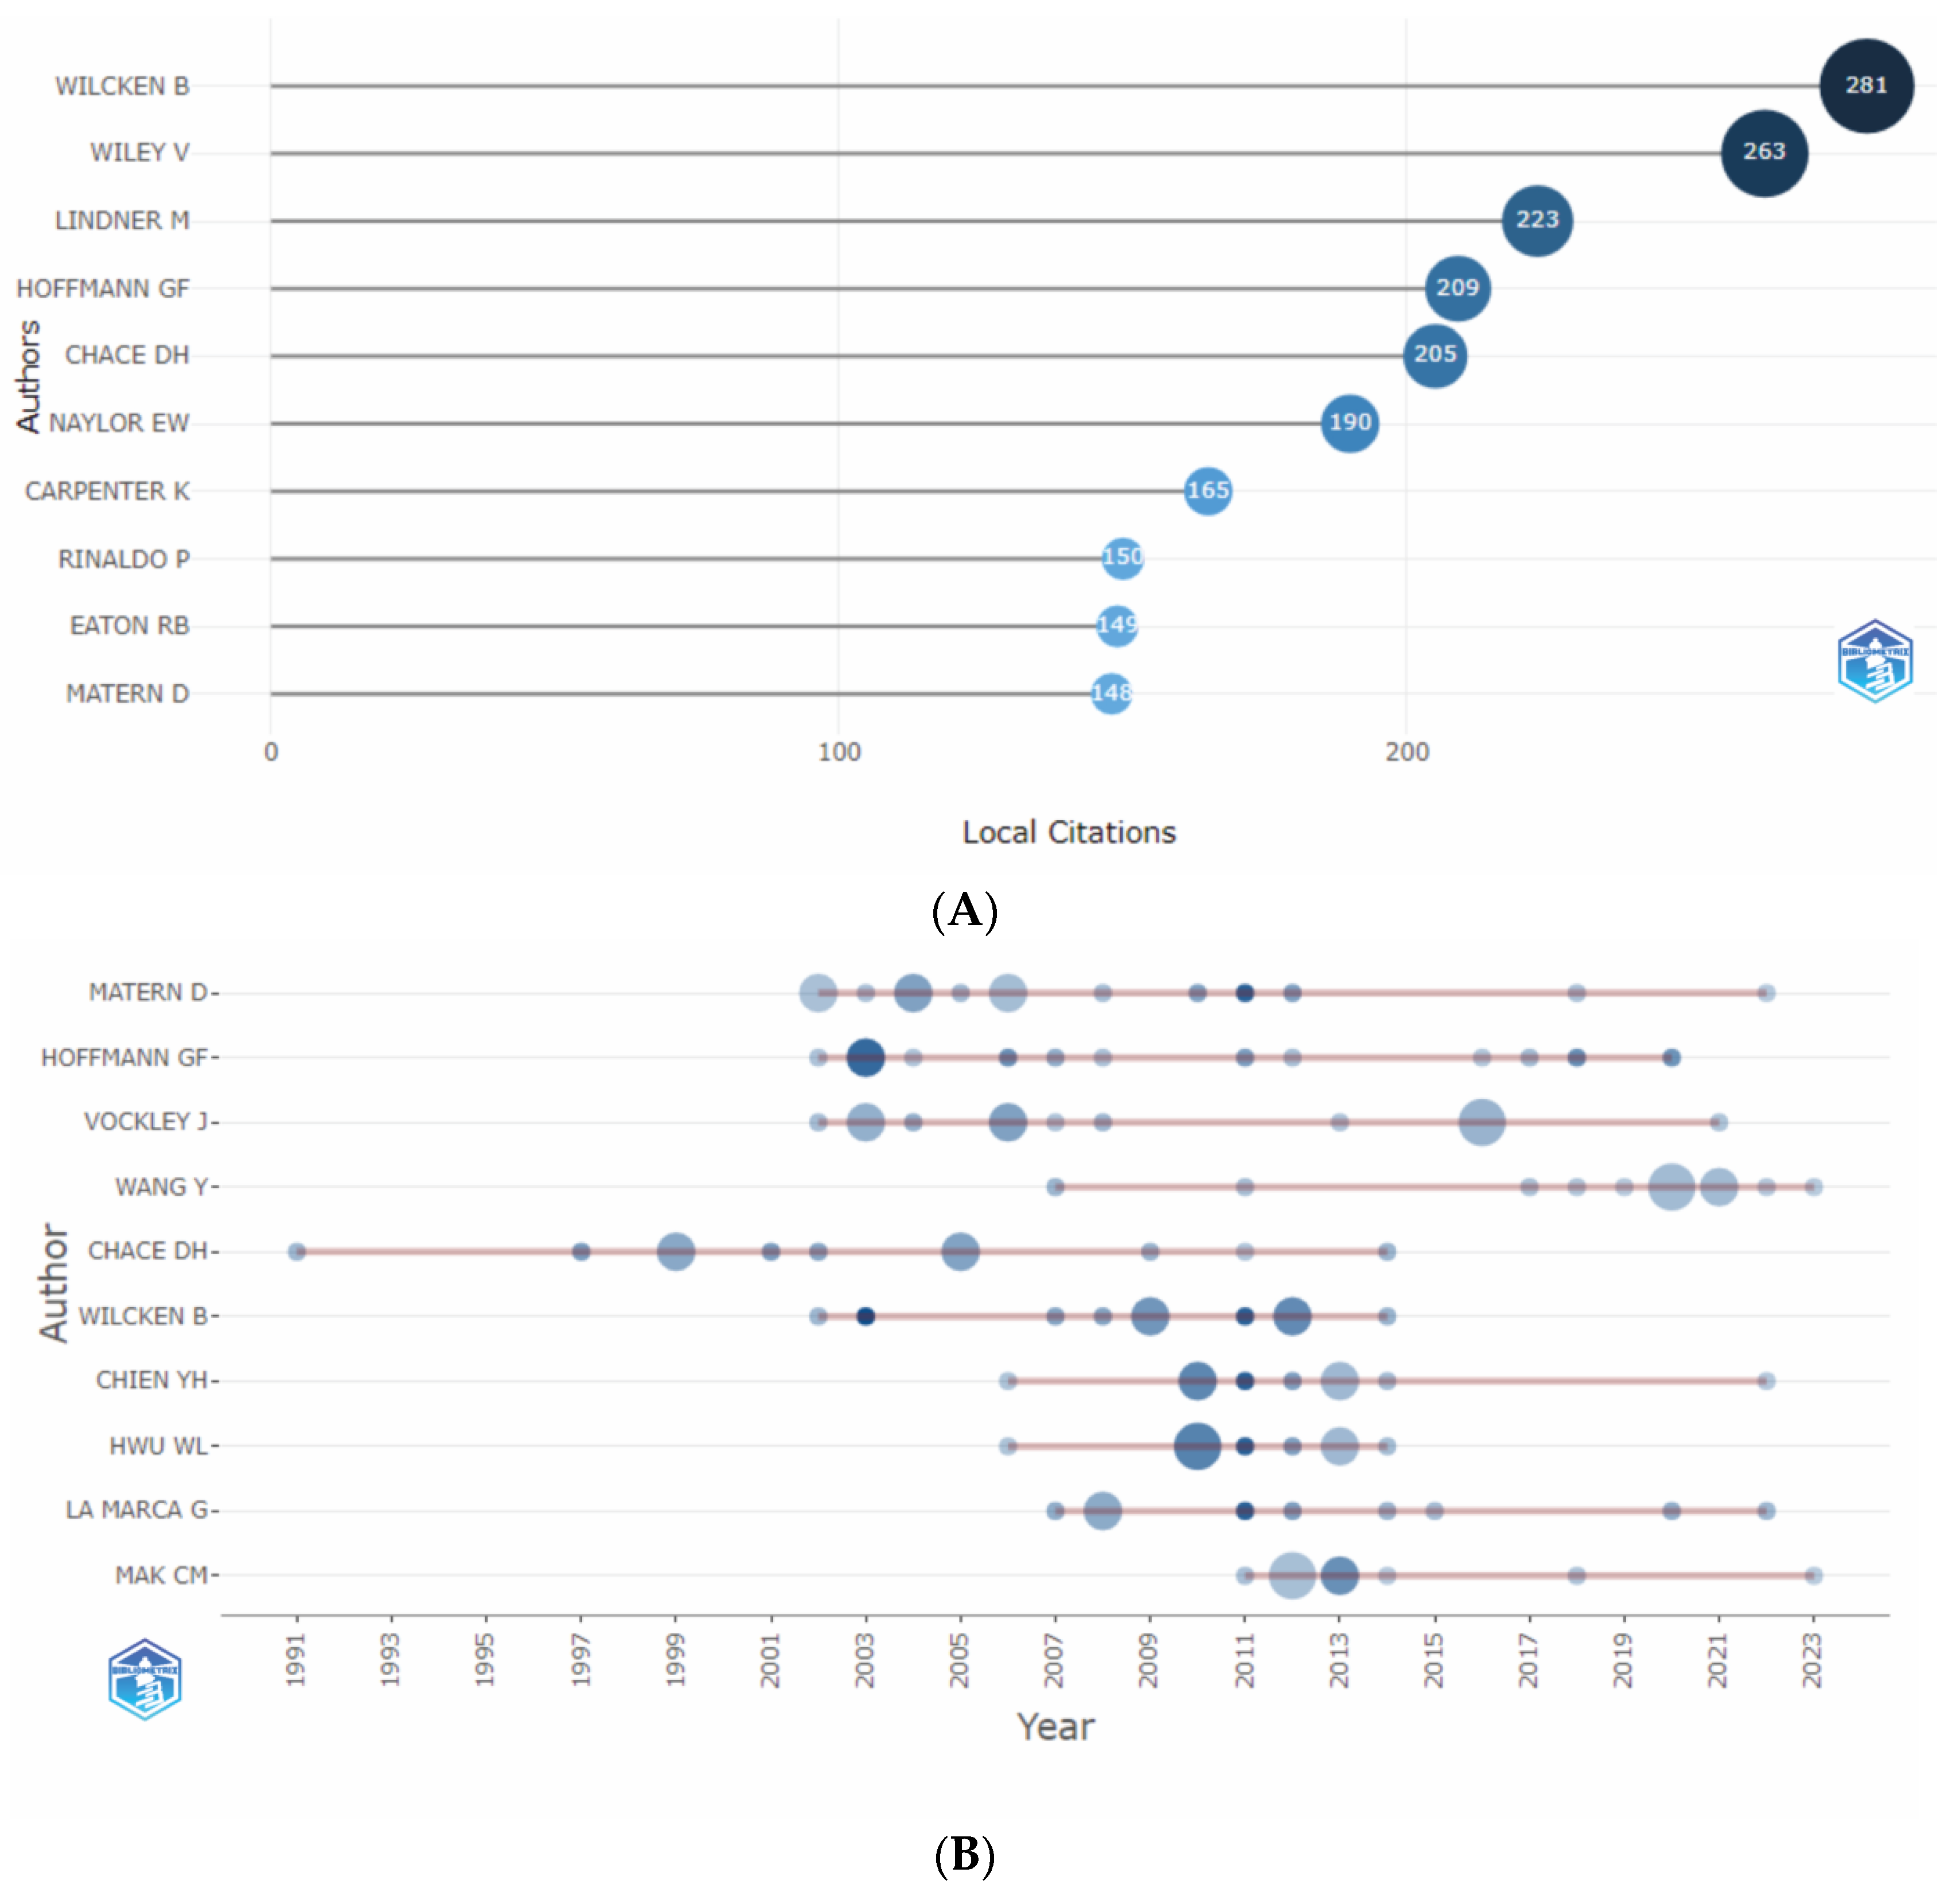
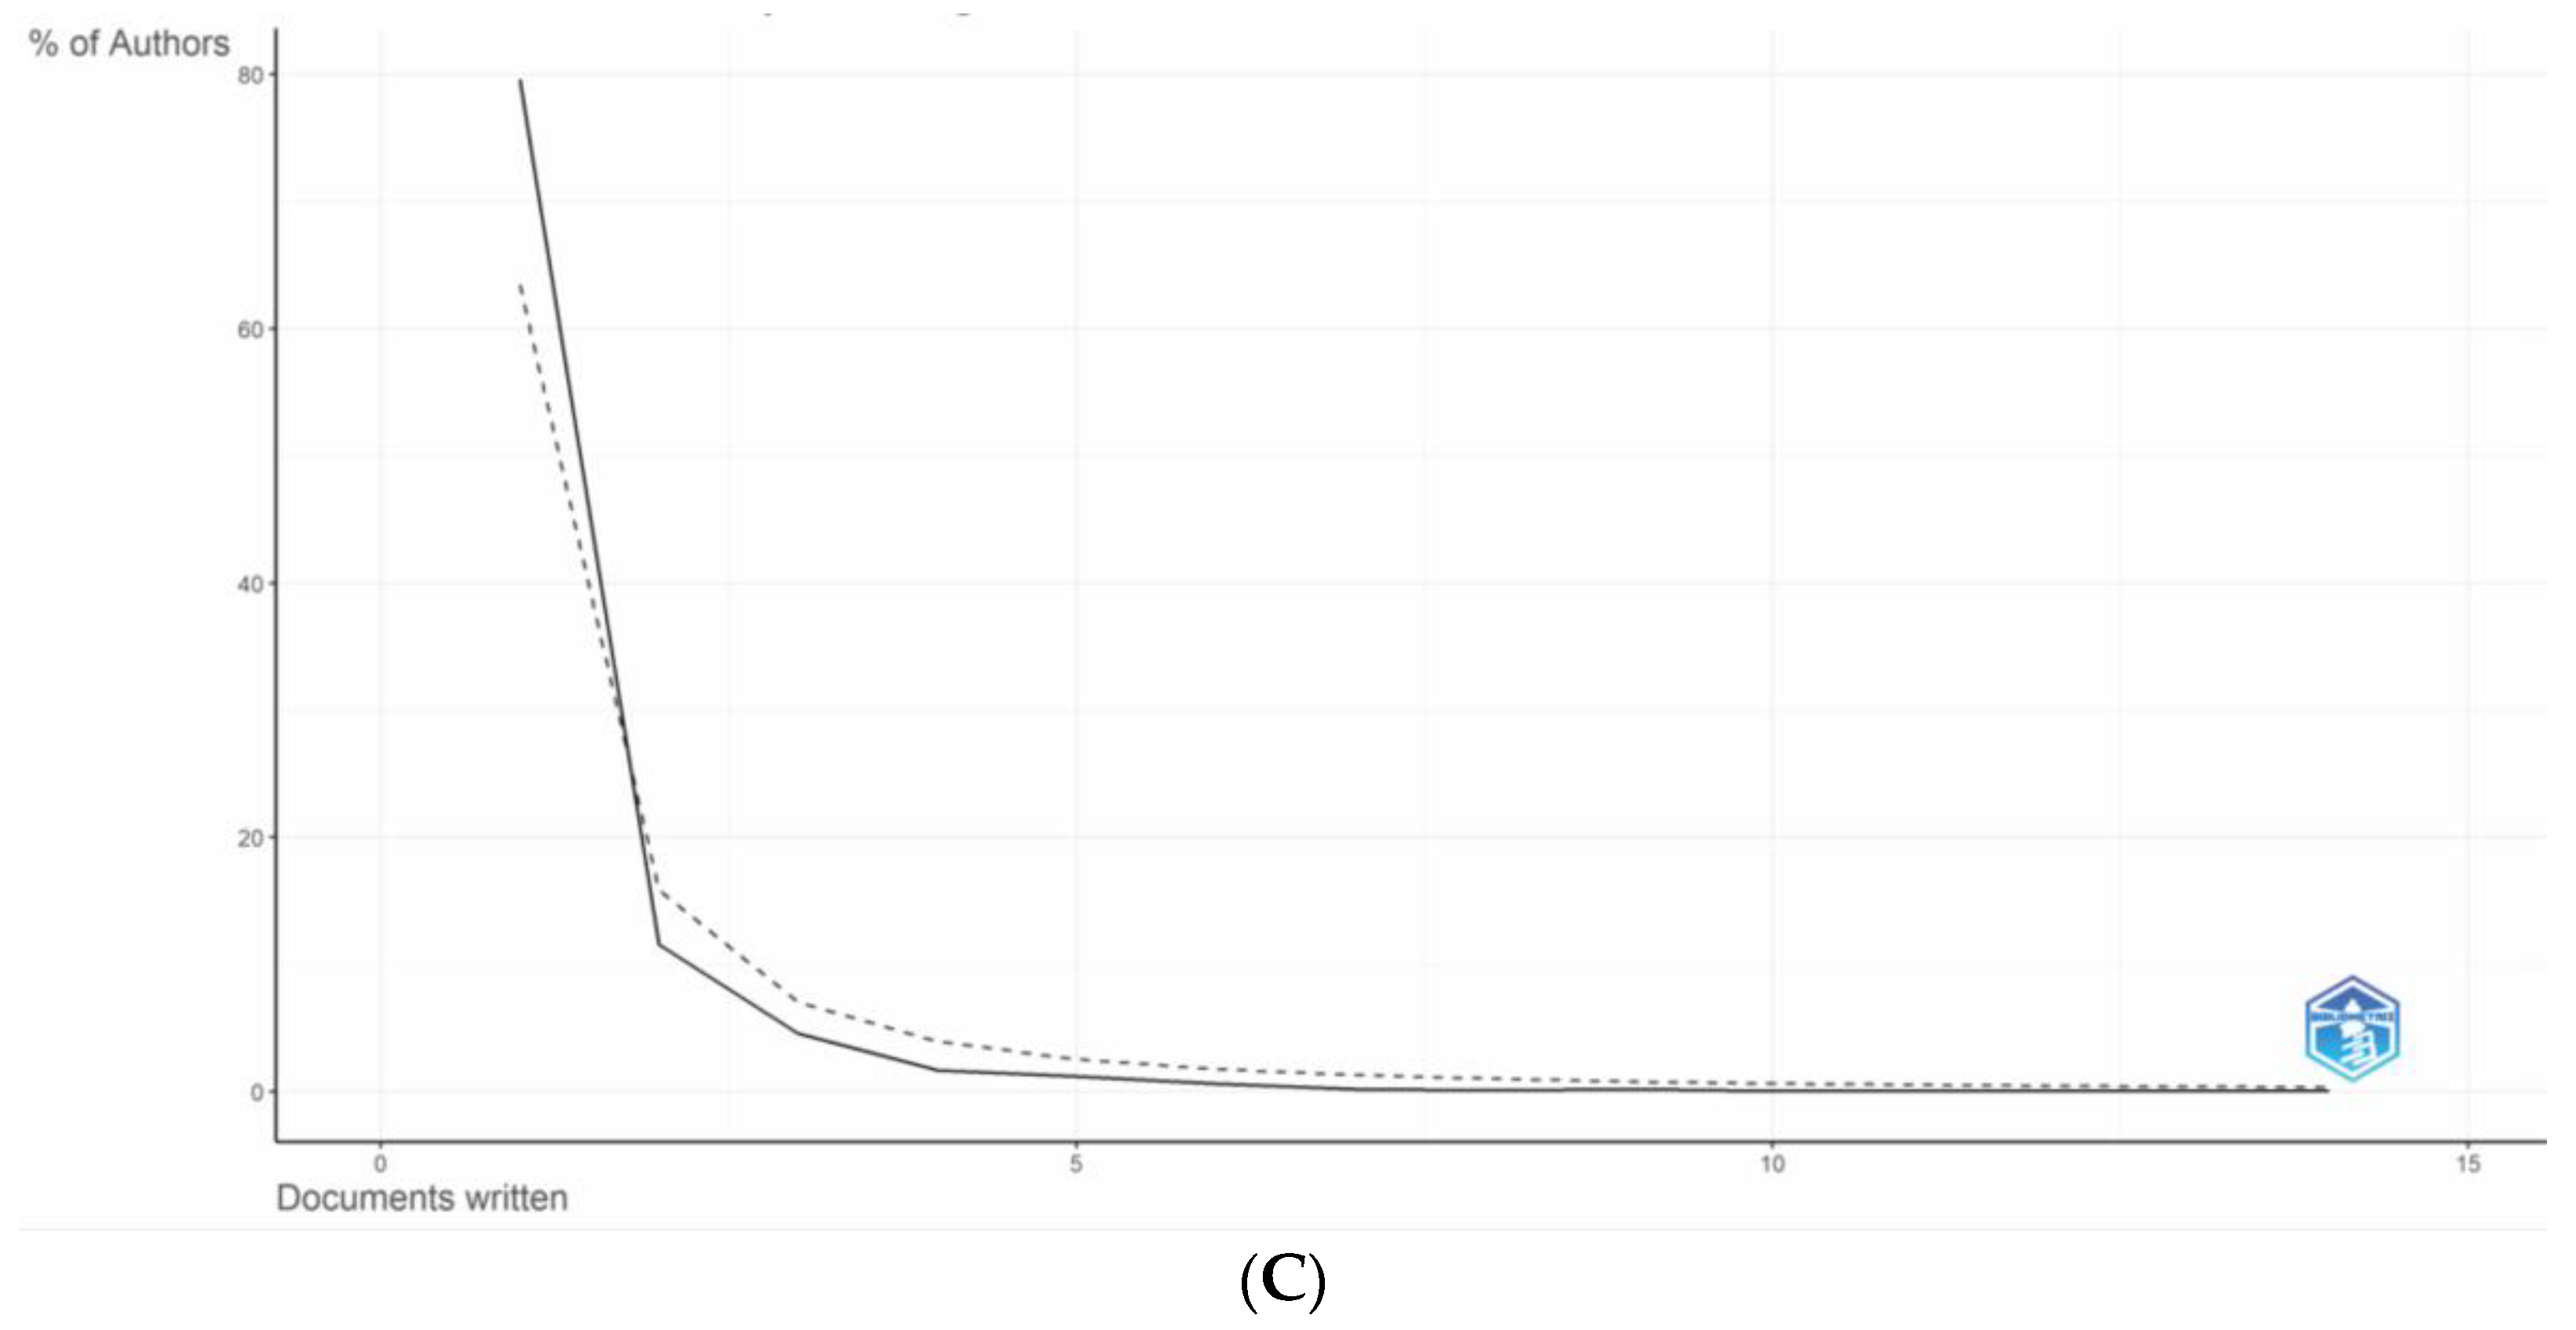
Figure 10.
(A,B) Distribution of co-authors’ collaborations. Cluster analysis of collaboration between authors with more than three publications (A). Collaboration between authors by the “Citation” dimension created in Vosviewer (B).
Figure 10.
(A,B) Distribution of co-authors’ collaborations. Cluster analysis of collaboration between authors with more than three publications (A). Collaboration between authors by the “Citation” dimension created in Vosviewer (B).
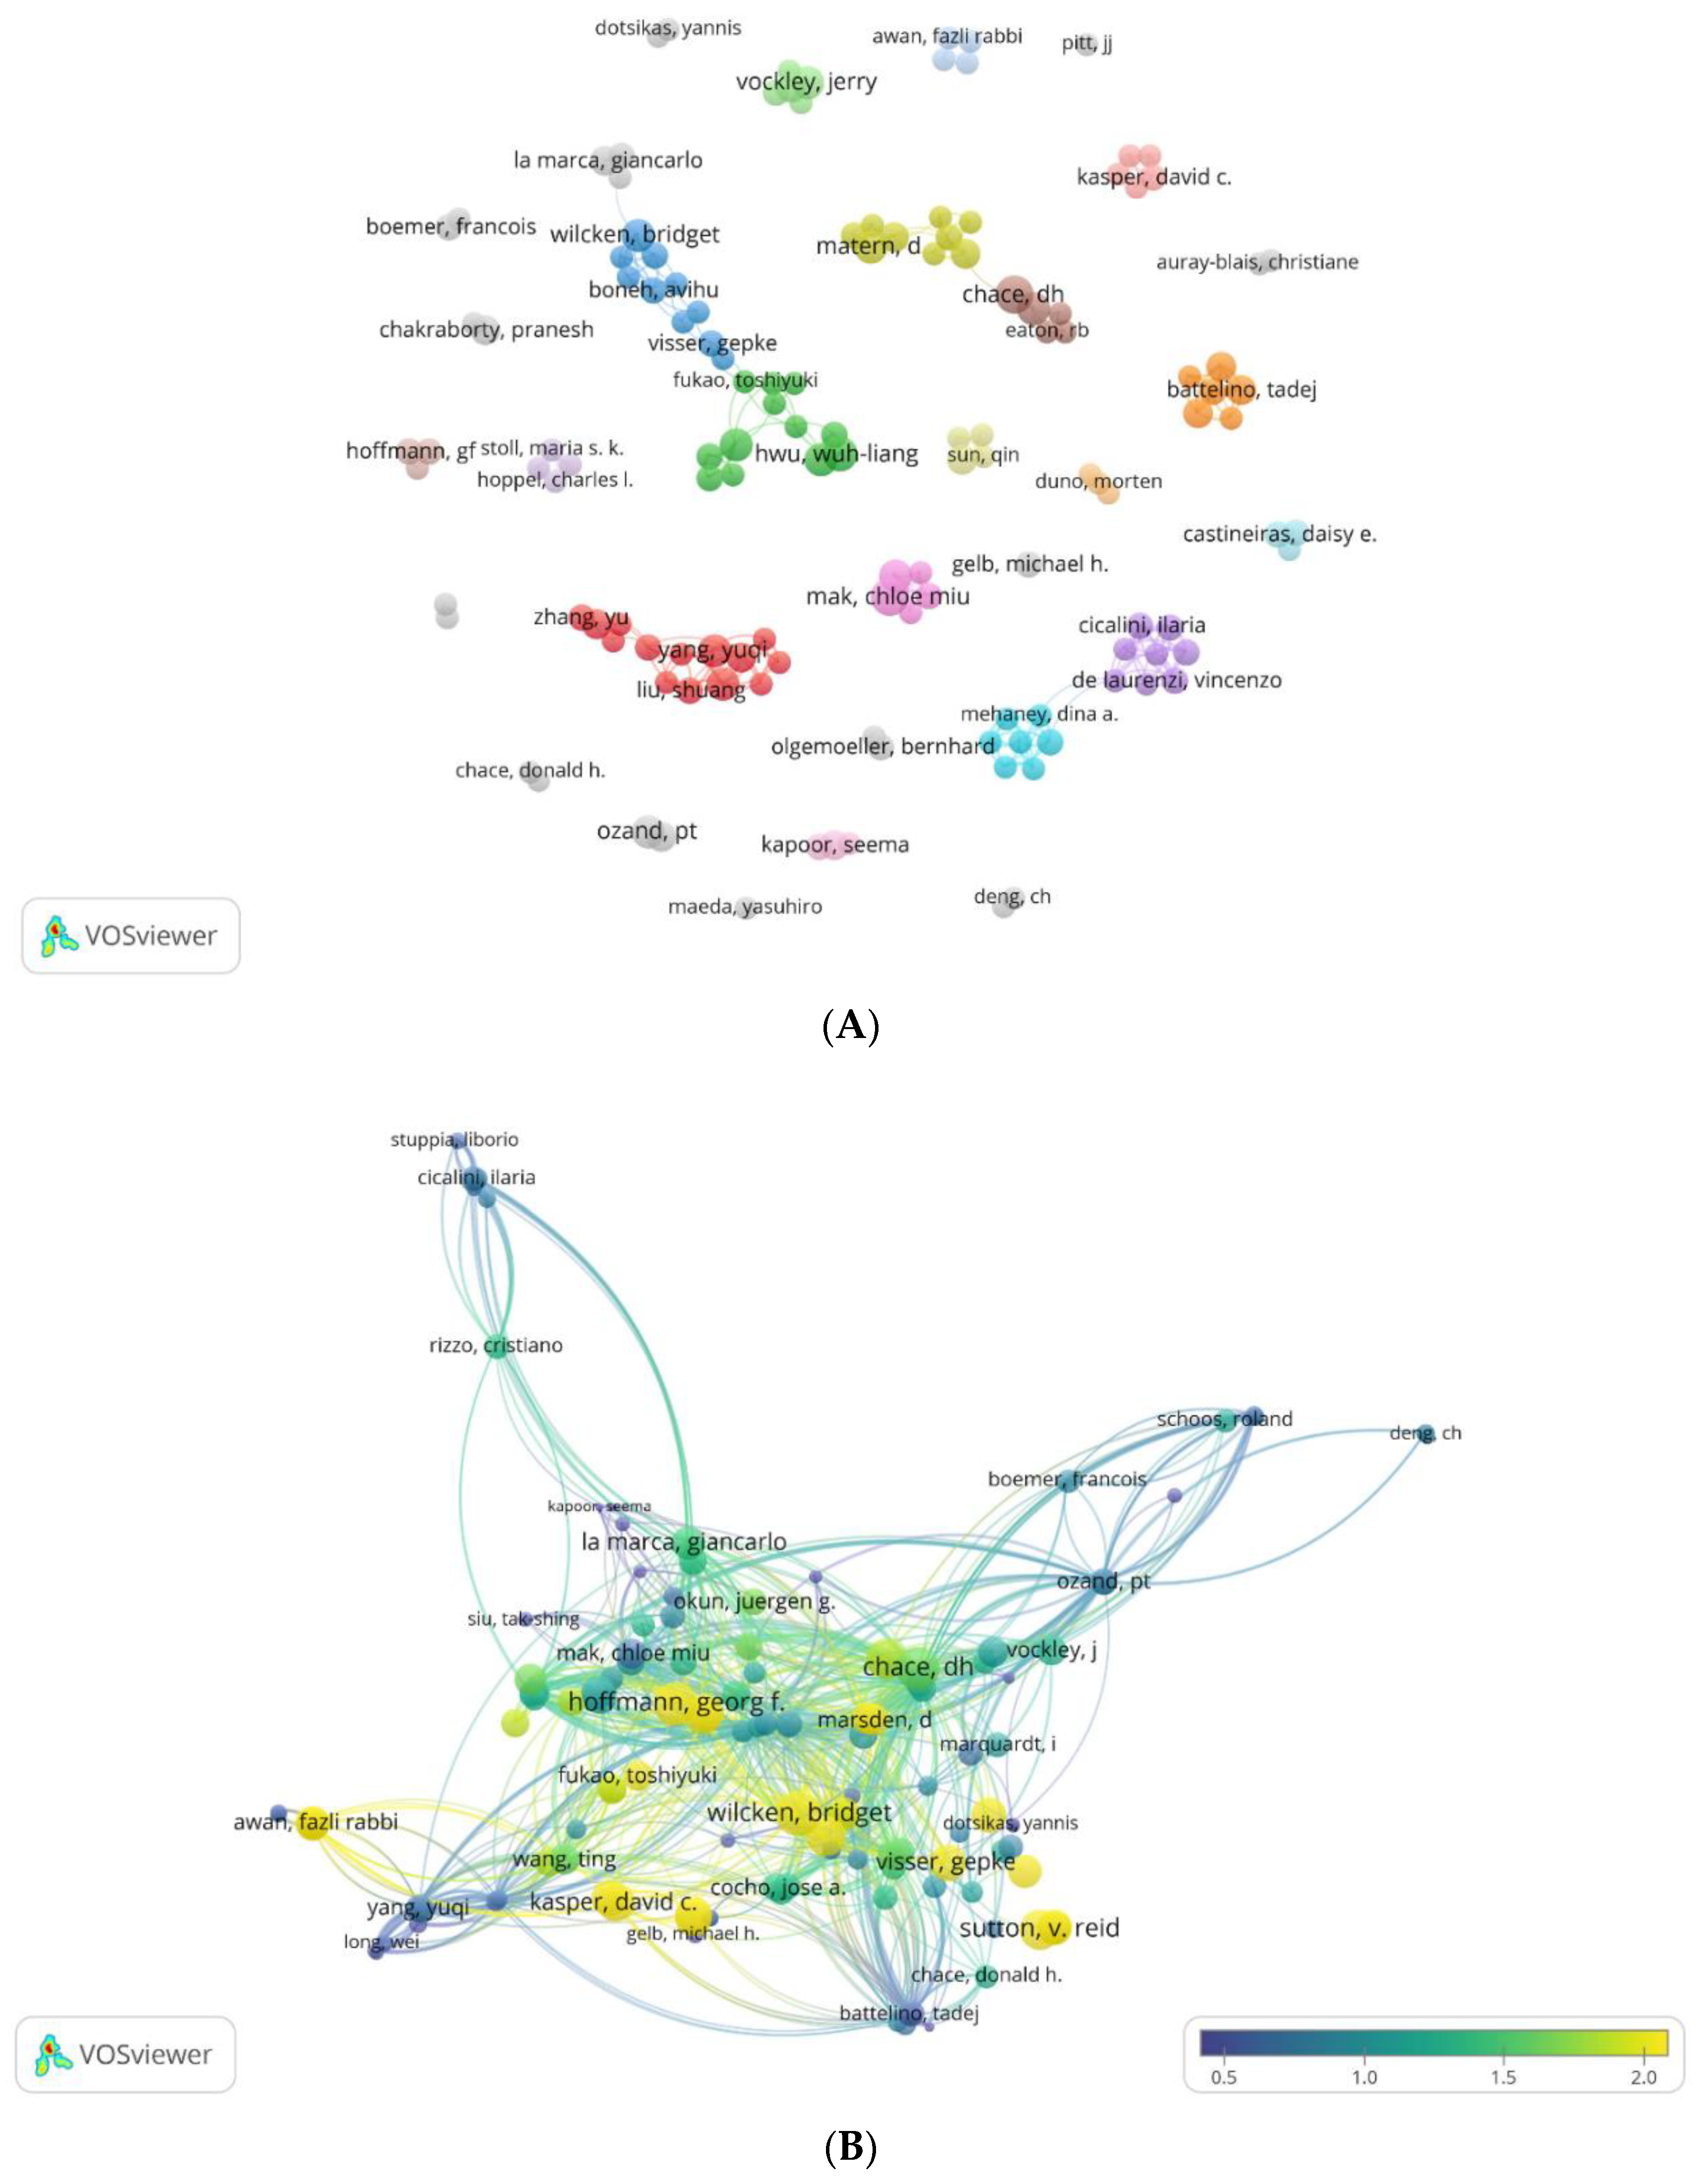
Figure 11.
(A,B) Core sources by Bradford’s Law (A) and sources’ productivity over time (B).
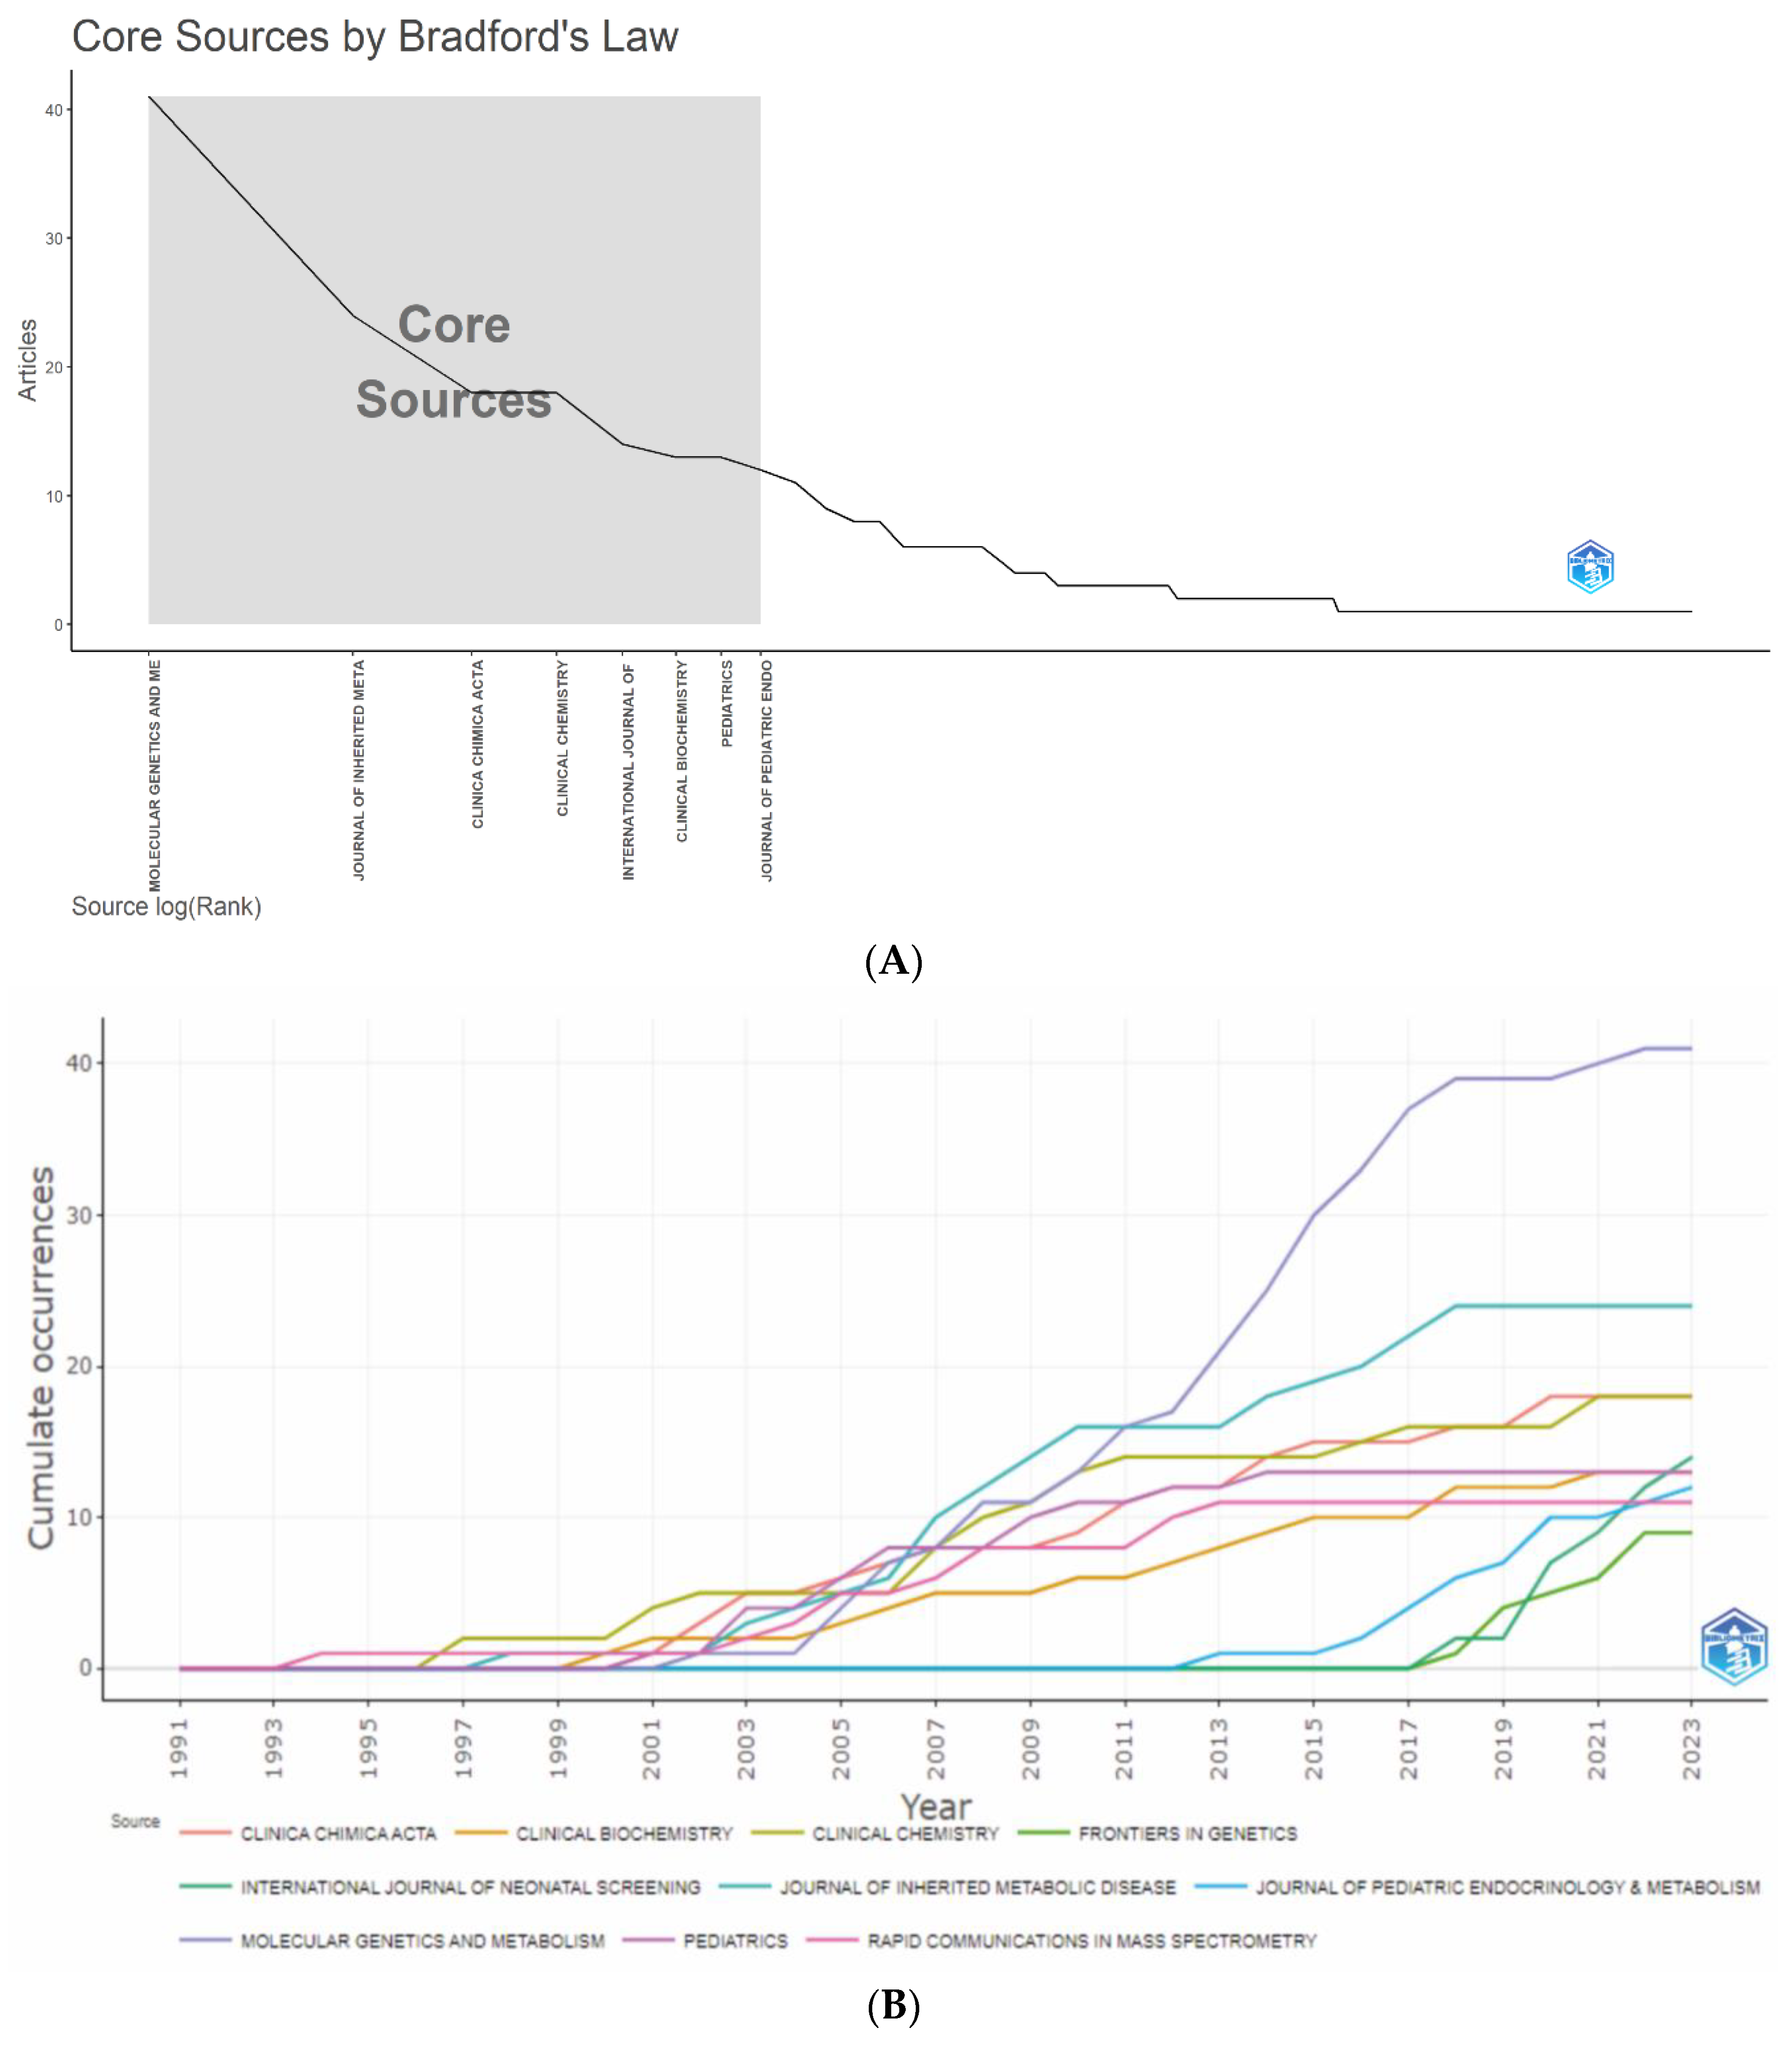
Figure 12.
(A,B,C) Journal Collaboration Maps. Collaboration map of journals that have published at least three articles studying the use of MS/MS in IEM screening (A); Interactions between journals based on citations of papers published in them on the topic under consideration (B); Co-citation relationships between journals (C).
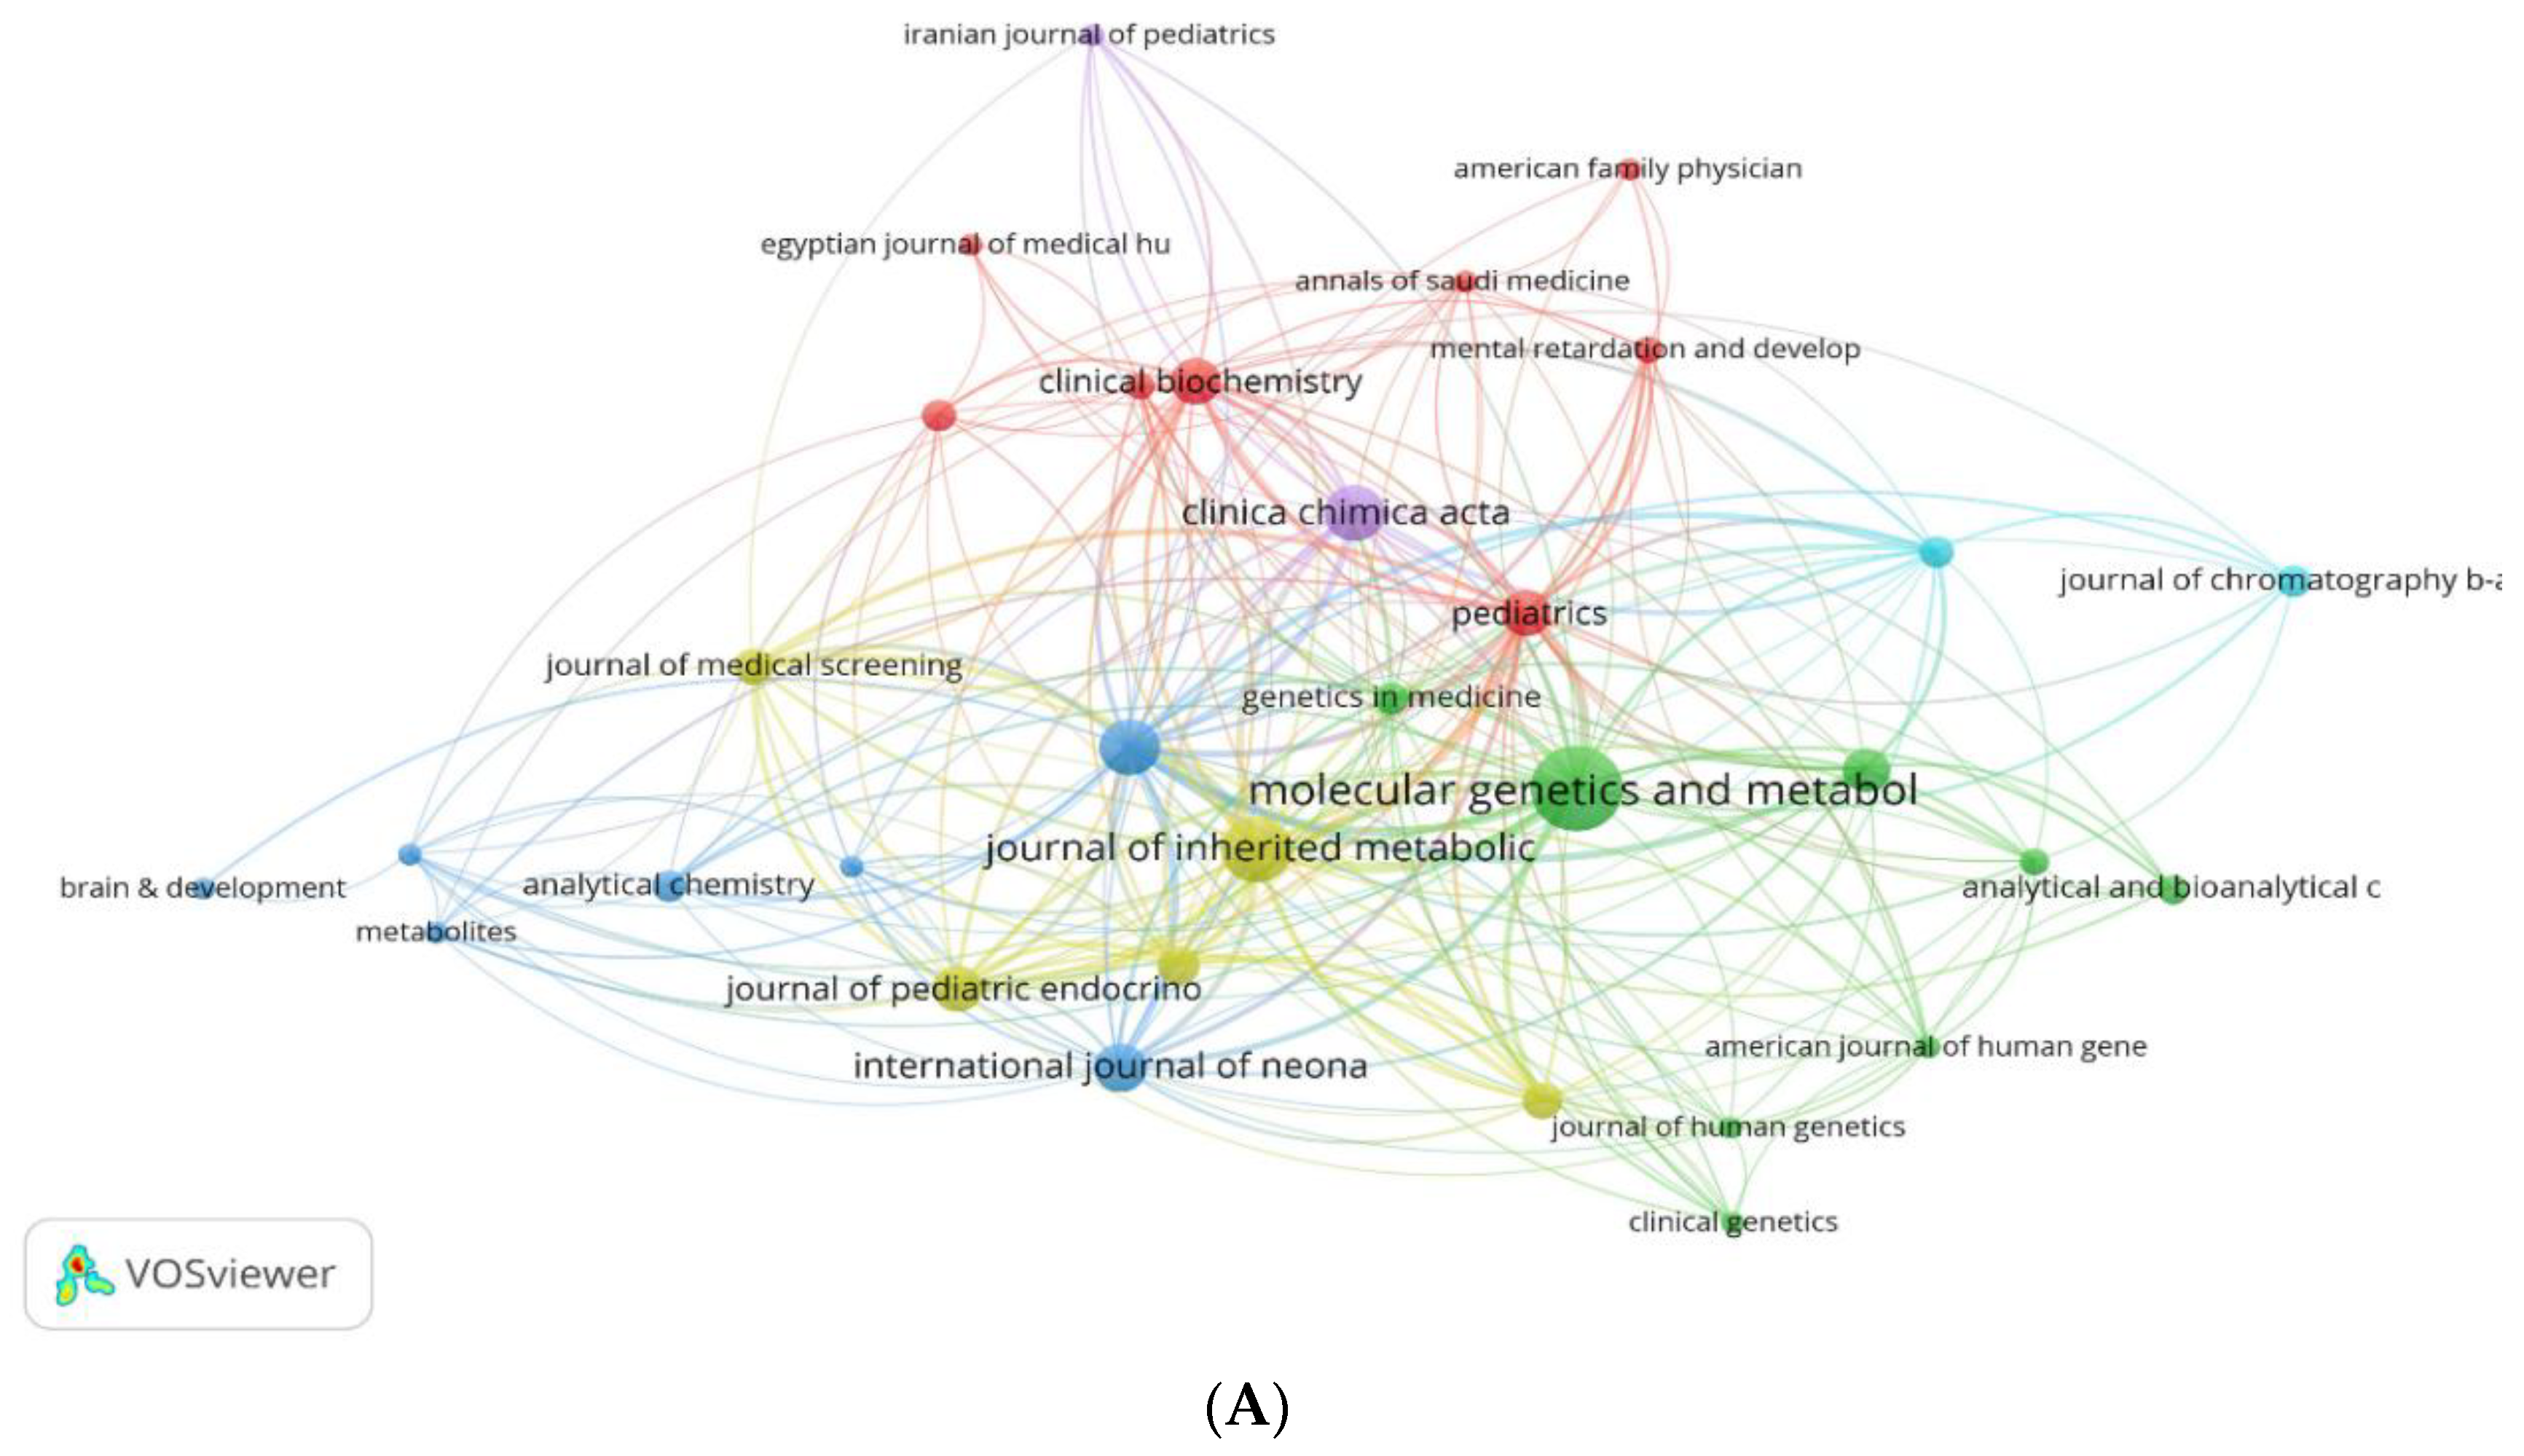
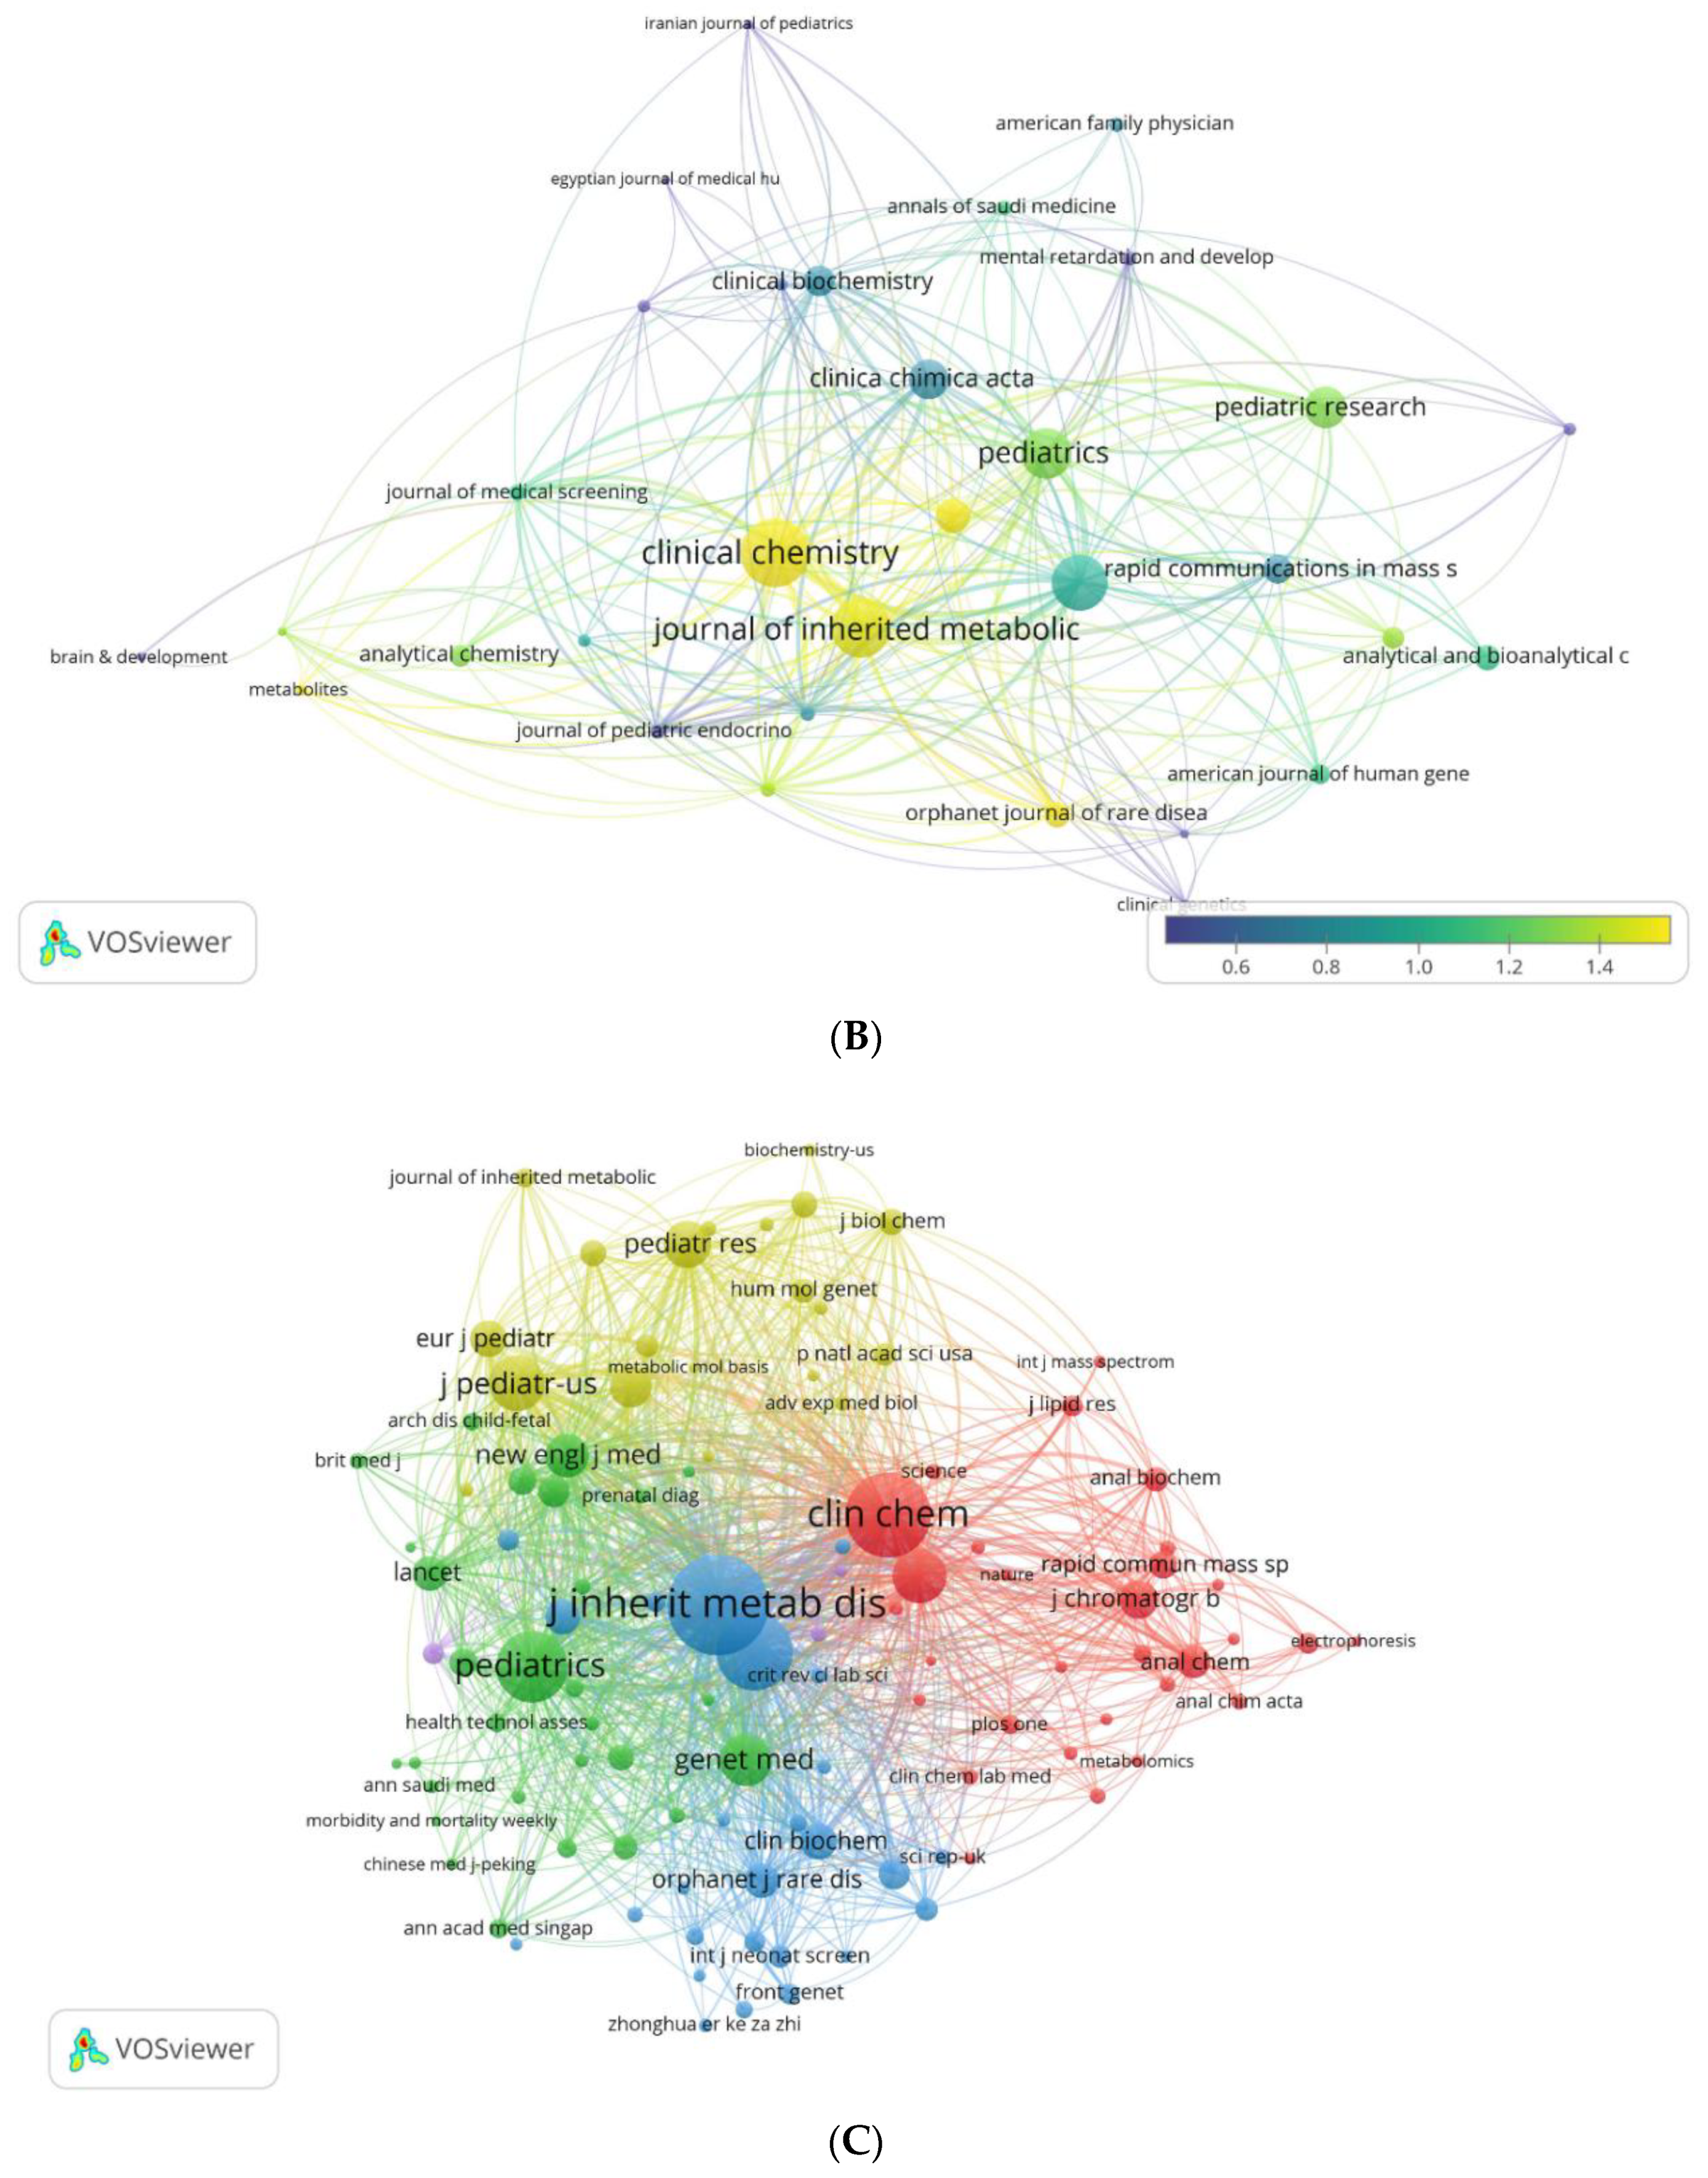
Figure 13.
(ABCD.) Analysis of citation. Visualization map of total citations for articles on MS/MS in IEM screening1 (A). Most local cited documents (B). Visualization map of co-citations for articles on MS/MS in IEM screening2 (C). Visualization map of bibliographic coupling of articles on MS/MS in IEM screening3 (D). 1The minimum number of total citations is 50; 84 articles that meet this condition are included. The size and color of the item (node) correspond to the number of total links. 2Clusters are identified by color, with node sizes corresponding to the number of local document citations. The distance and thickness of the lines between items (nodes) show the strength of the connection between documents according to the “Co-citation” parameter and correspond to the number of documents citing them together. 3The minimum number of total citations for a document is 30; 147 articles that meet this condition are included. Clusters are identified by color (8), the sizes of the items (nodes) correspond to the number of total citations, the distance between them and the thickness of the lines show the strength of the connection between documents according to the “Bibliographic coupling” parameter and correspond to the number of matching links in the papers.
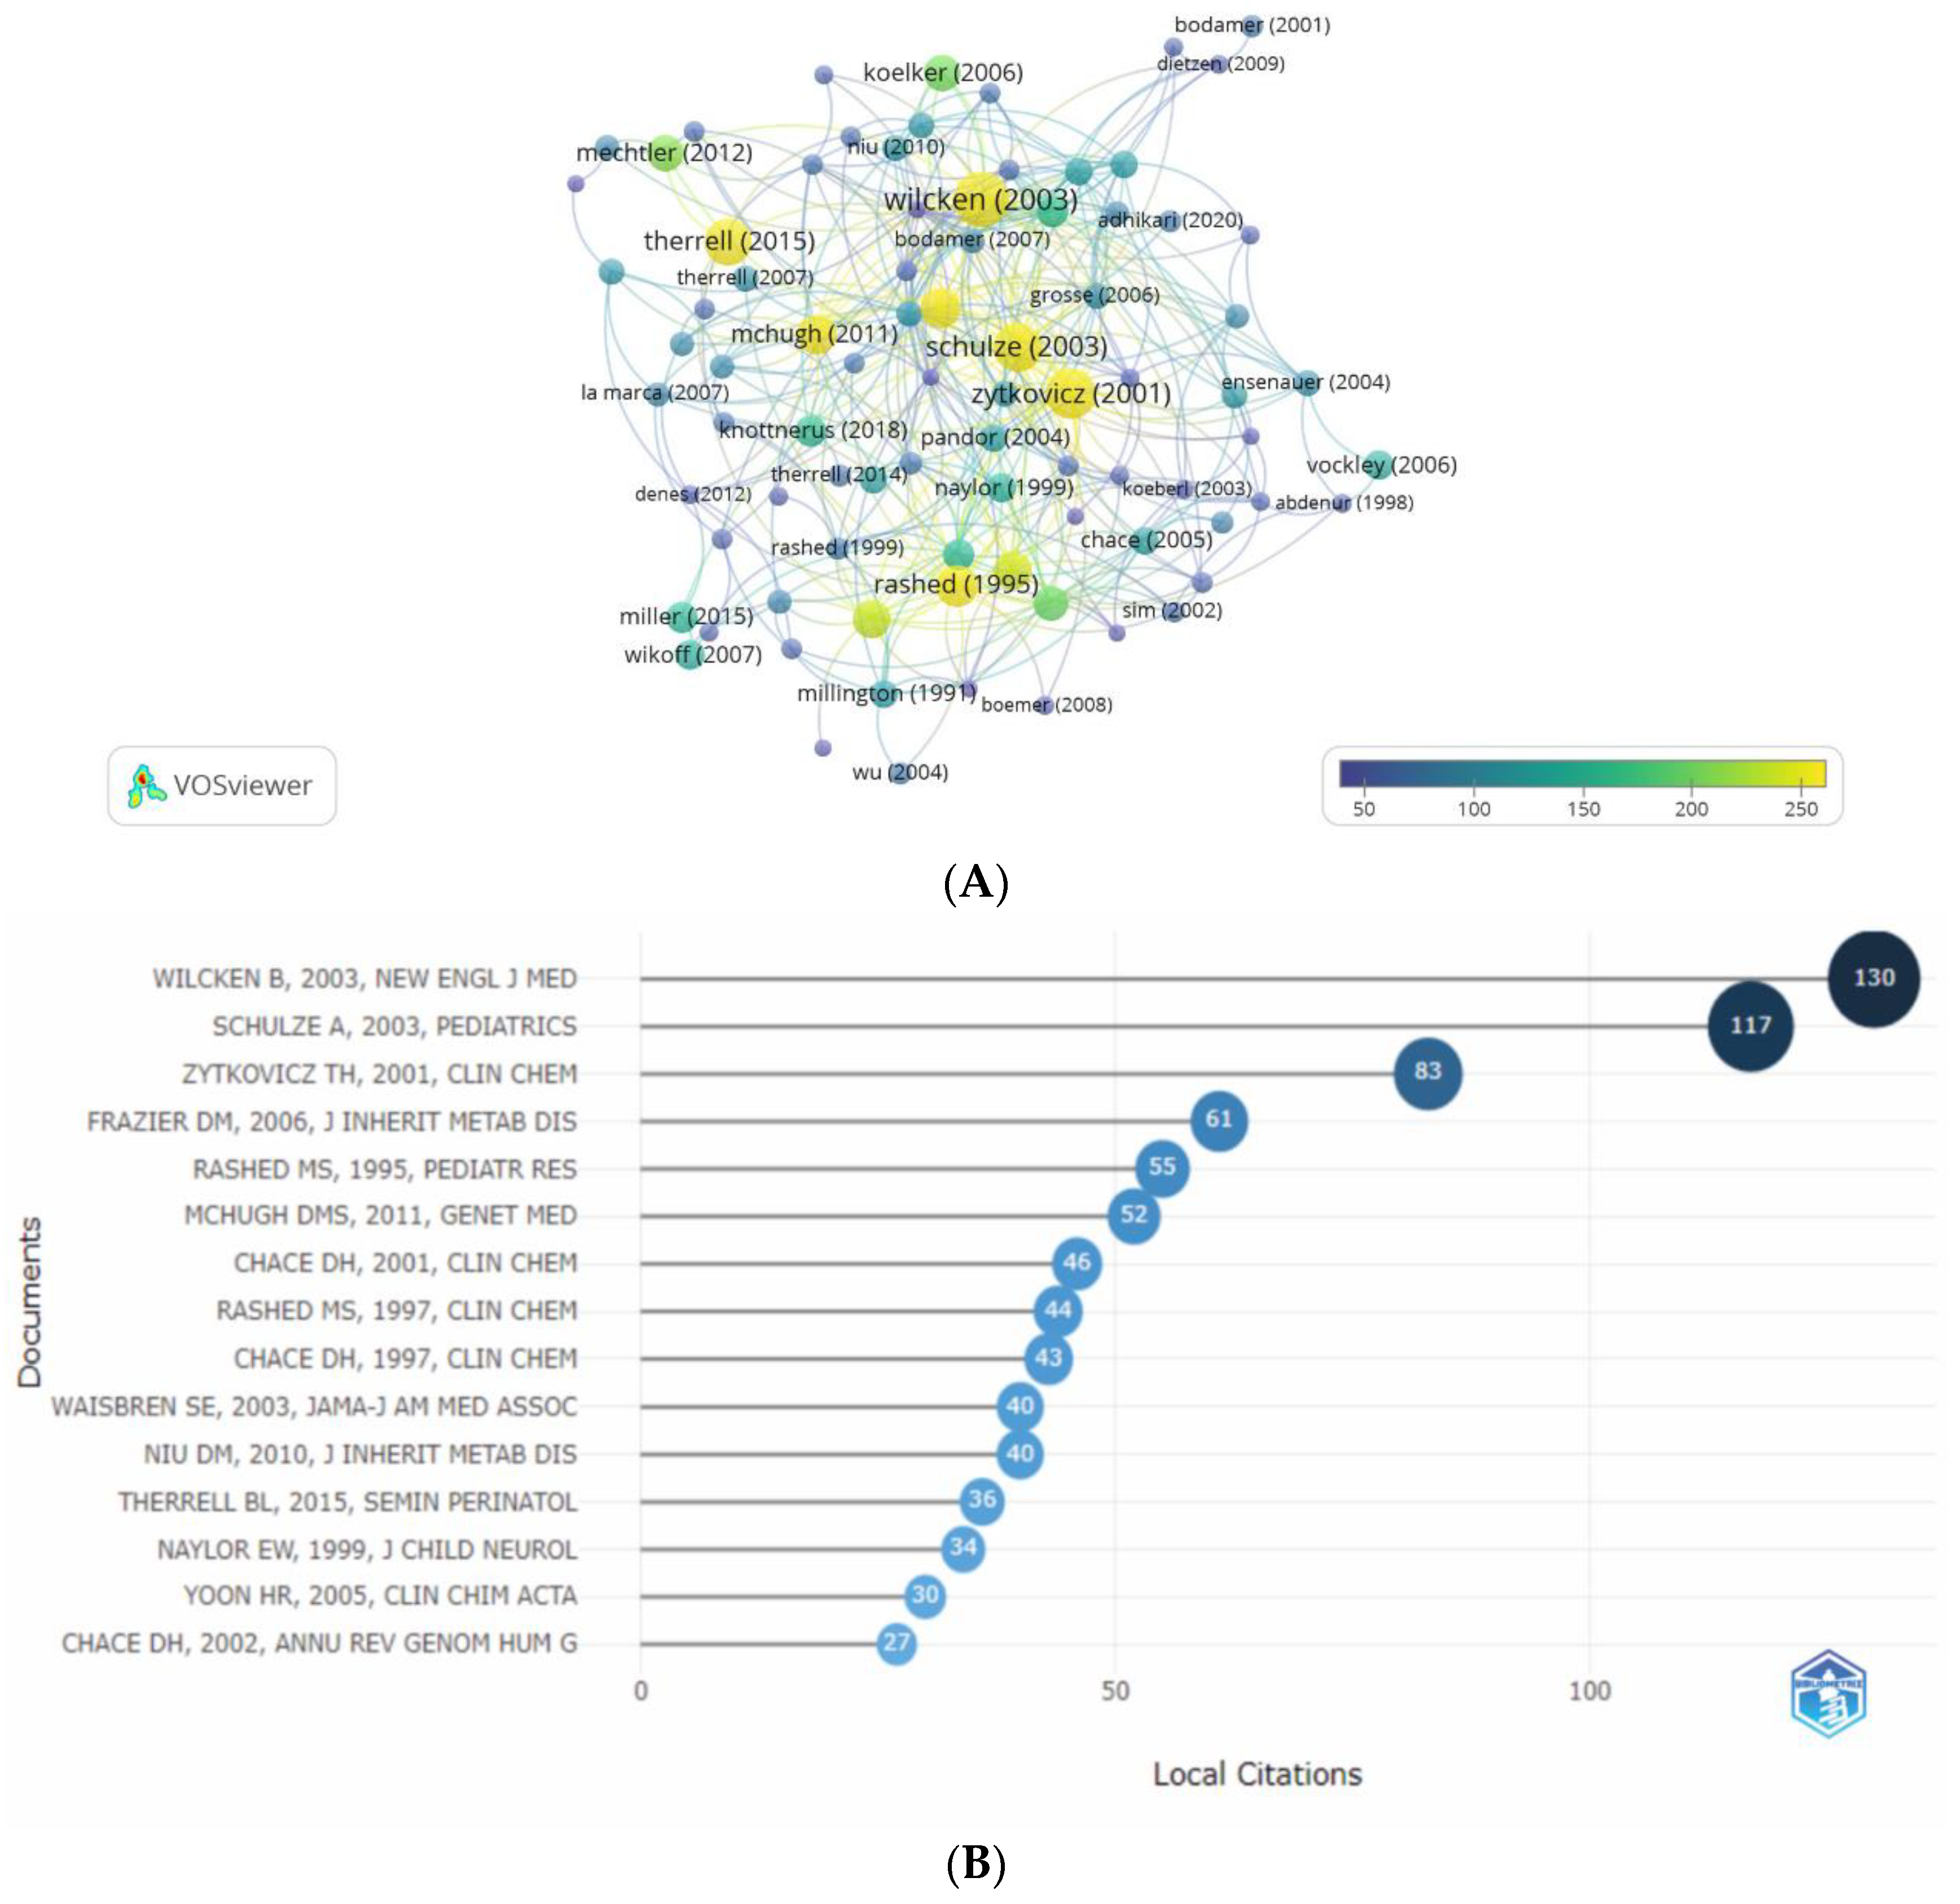
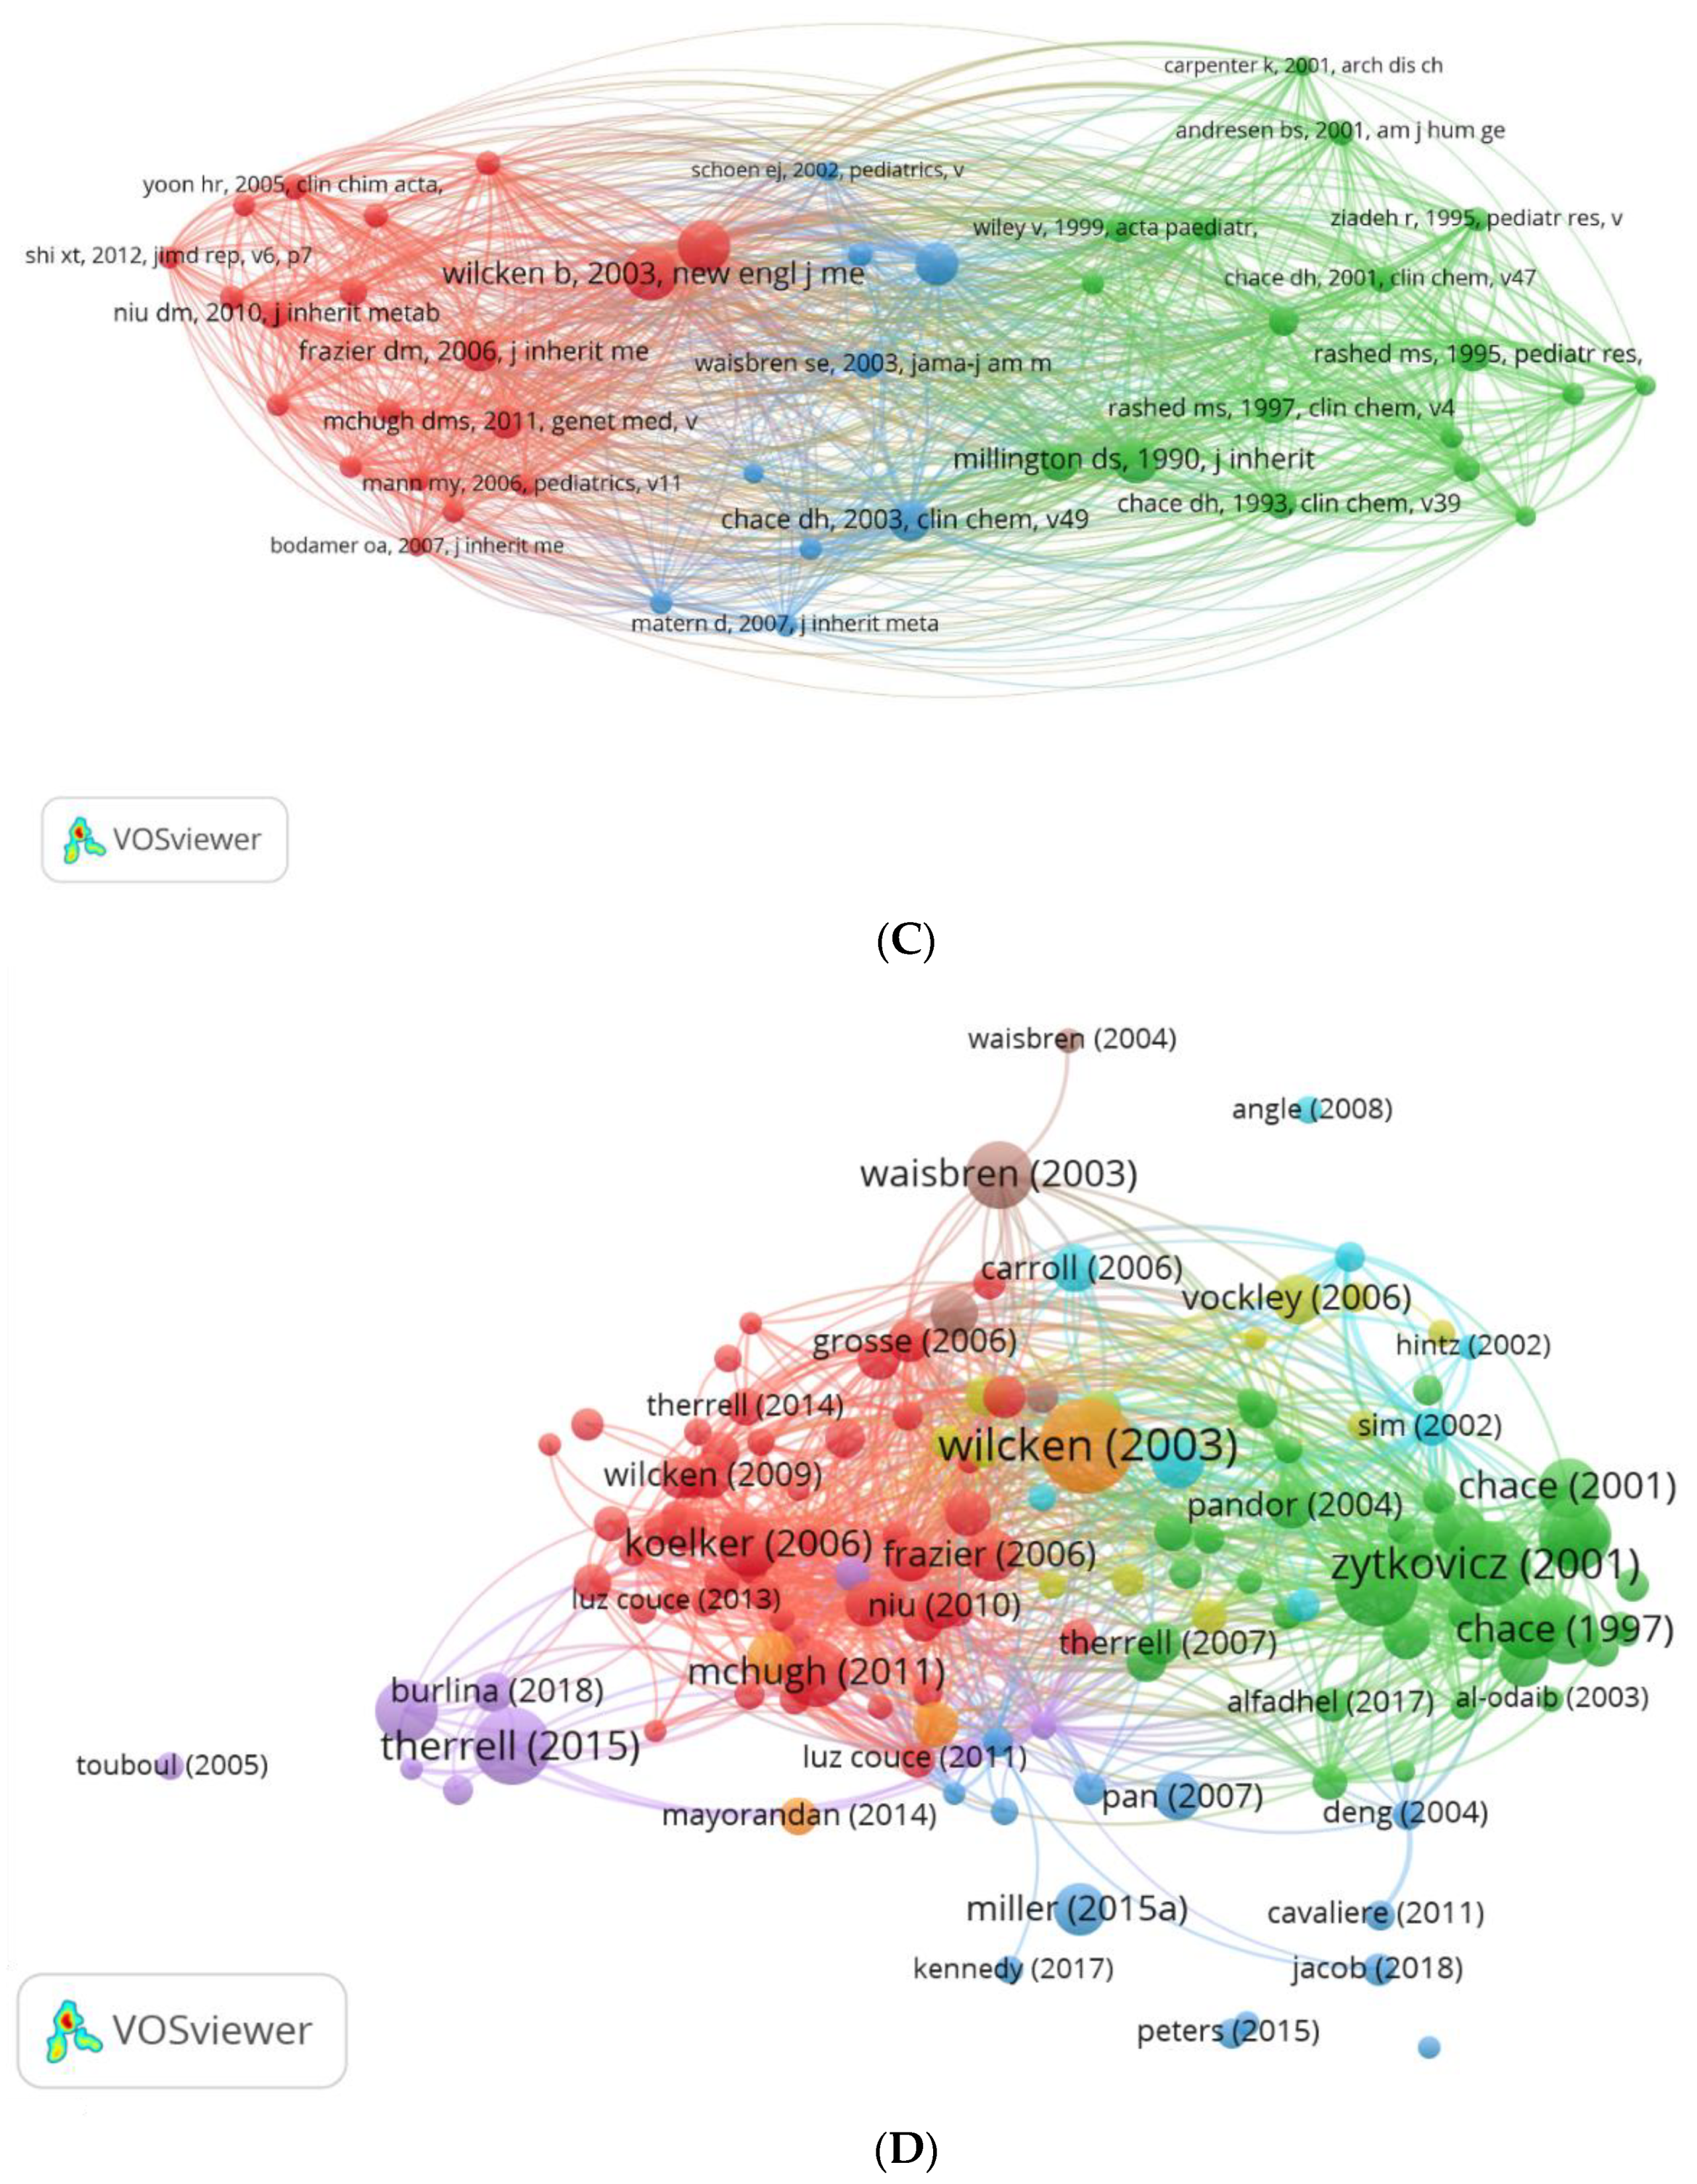
Figure 14.
(ABCD.) Analysis of authors’ keywords. Most frequent authors’ keywords (A). Most frequent additional keywords (B). Word frequency in authors’ keywords over time (C). Frequency of keywords plus over time (D).
Figure 14.
(ABCD.) Analysis of authors’ keywords. Most frequent authors’ keywords (A). Most frequent additional keywords (B). Word frequency in authors’ keywords over time (C). Frequency of keywords plus over time (D).
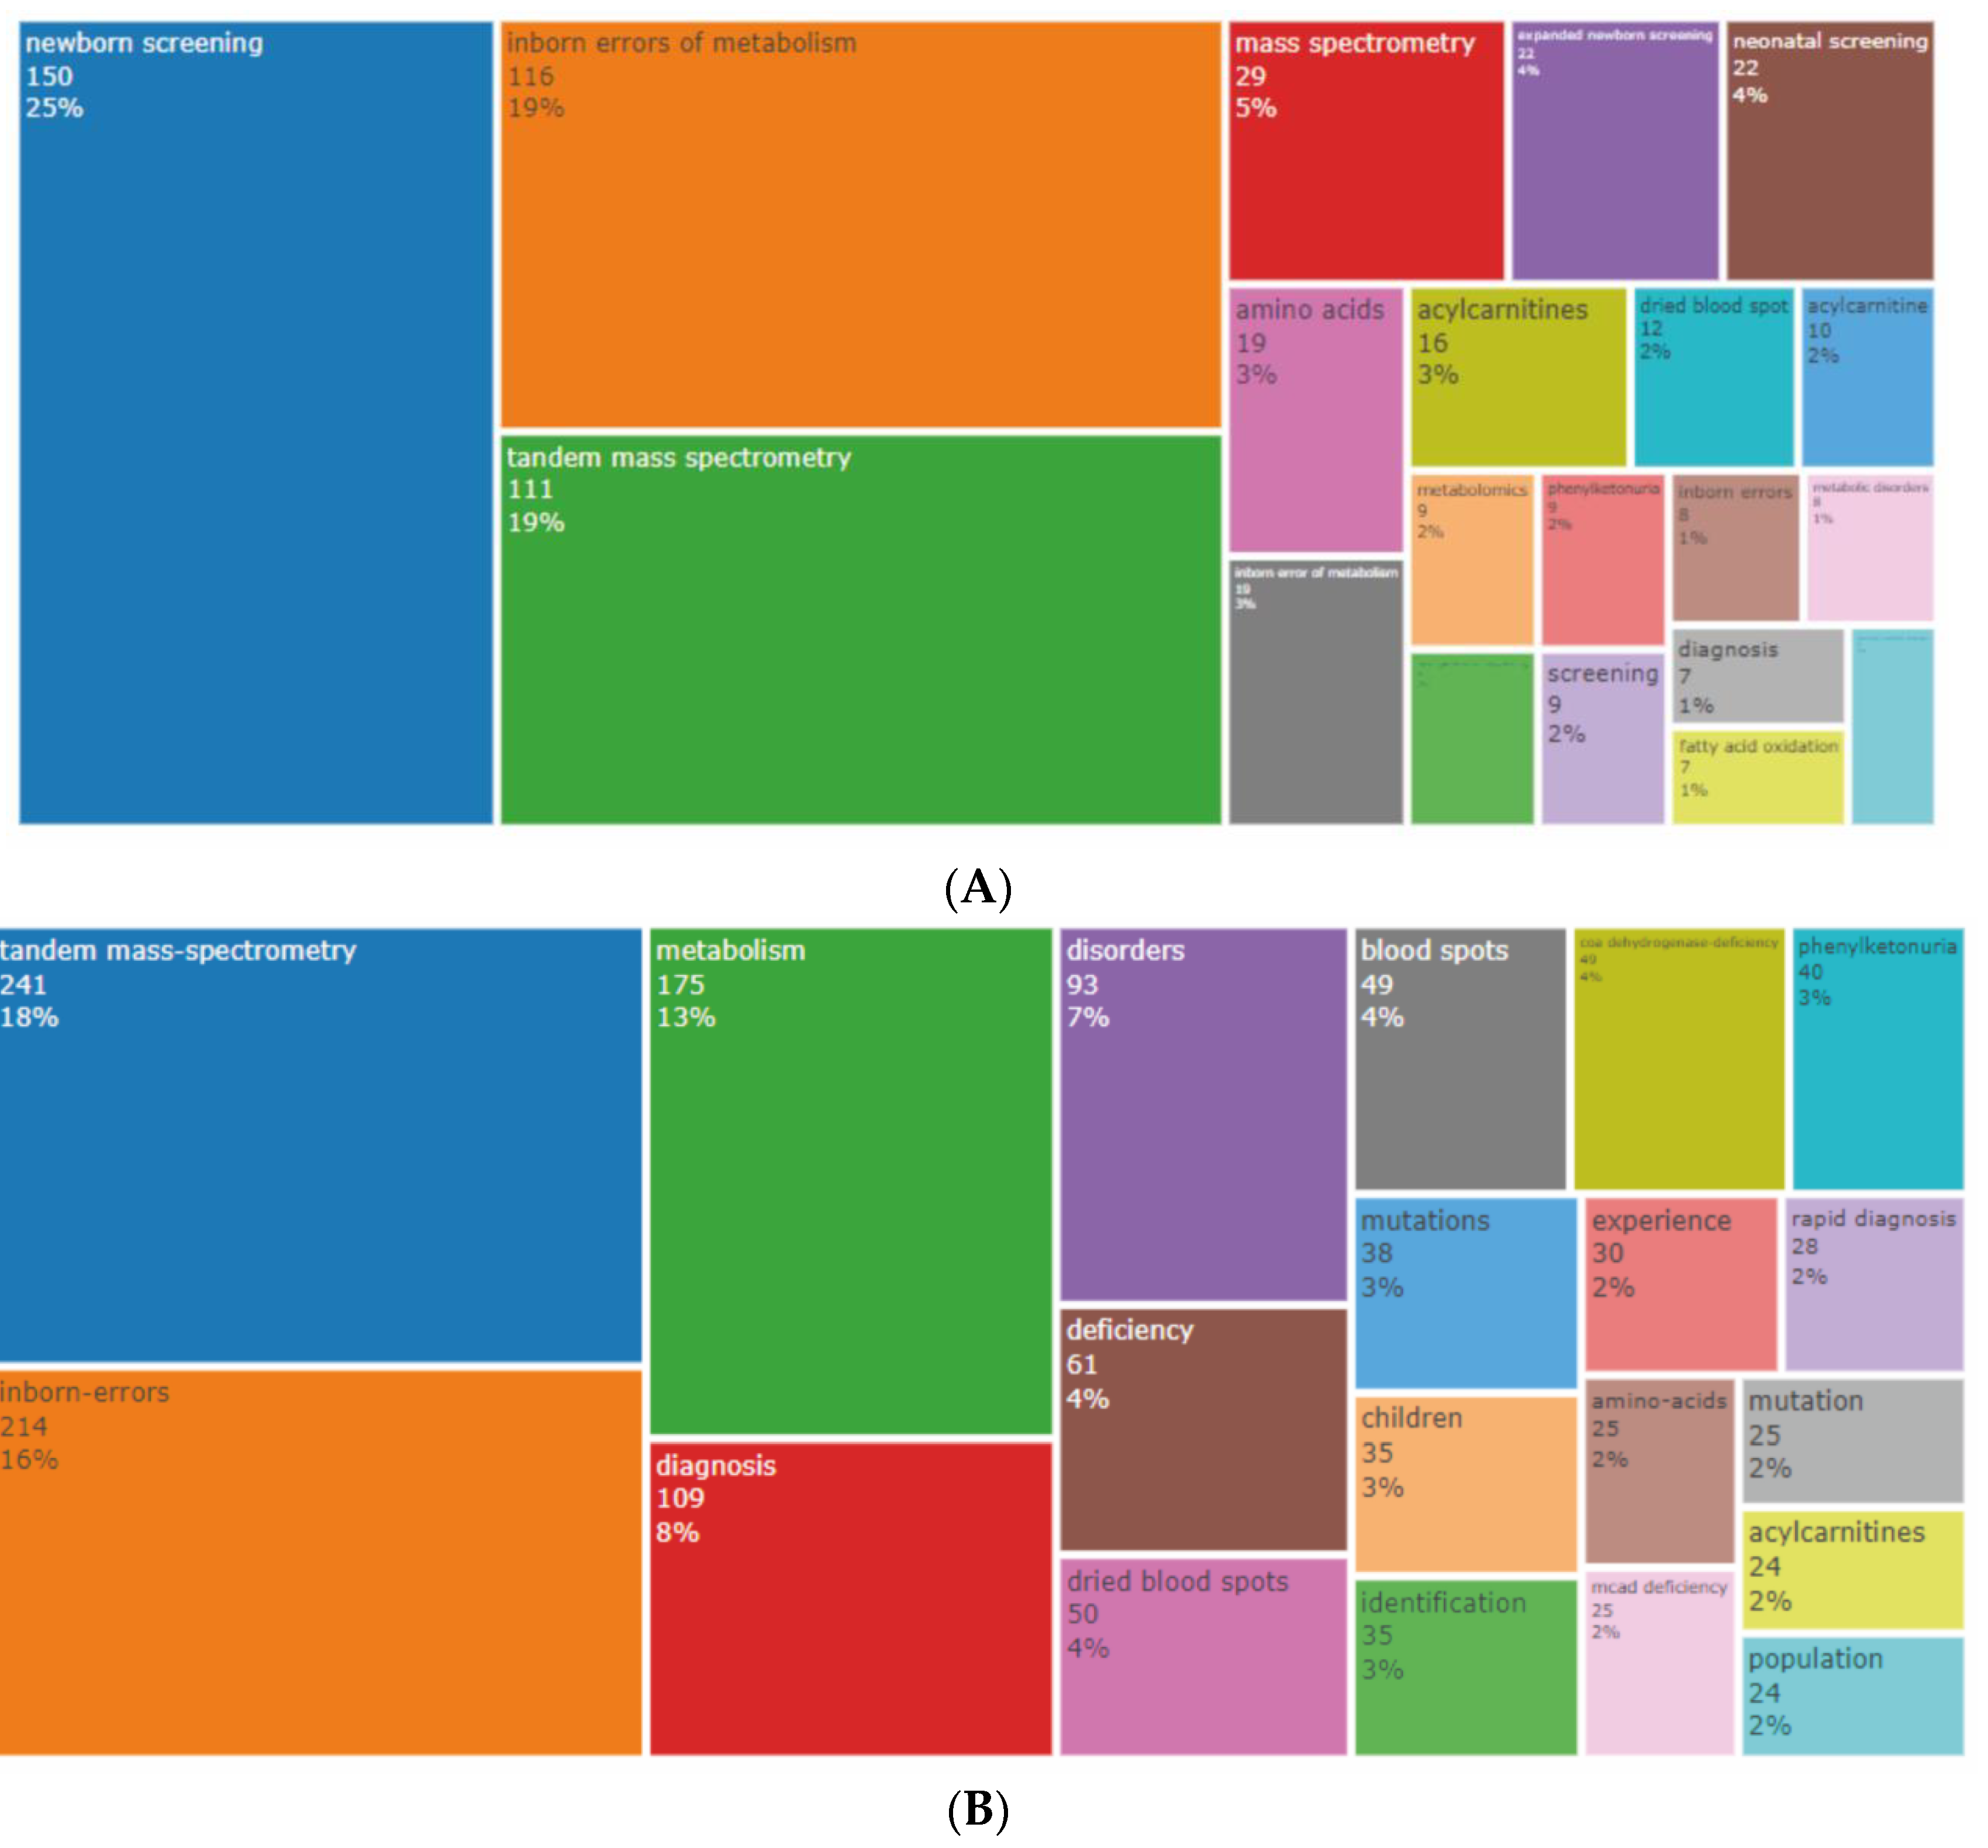
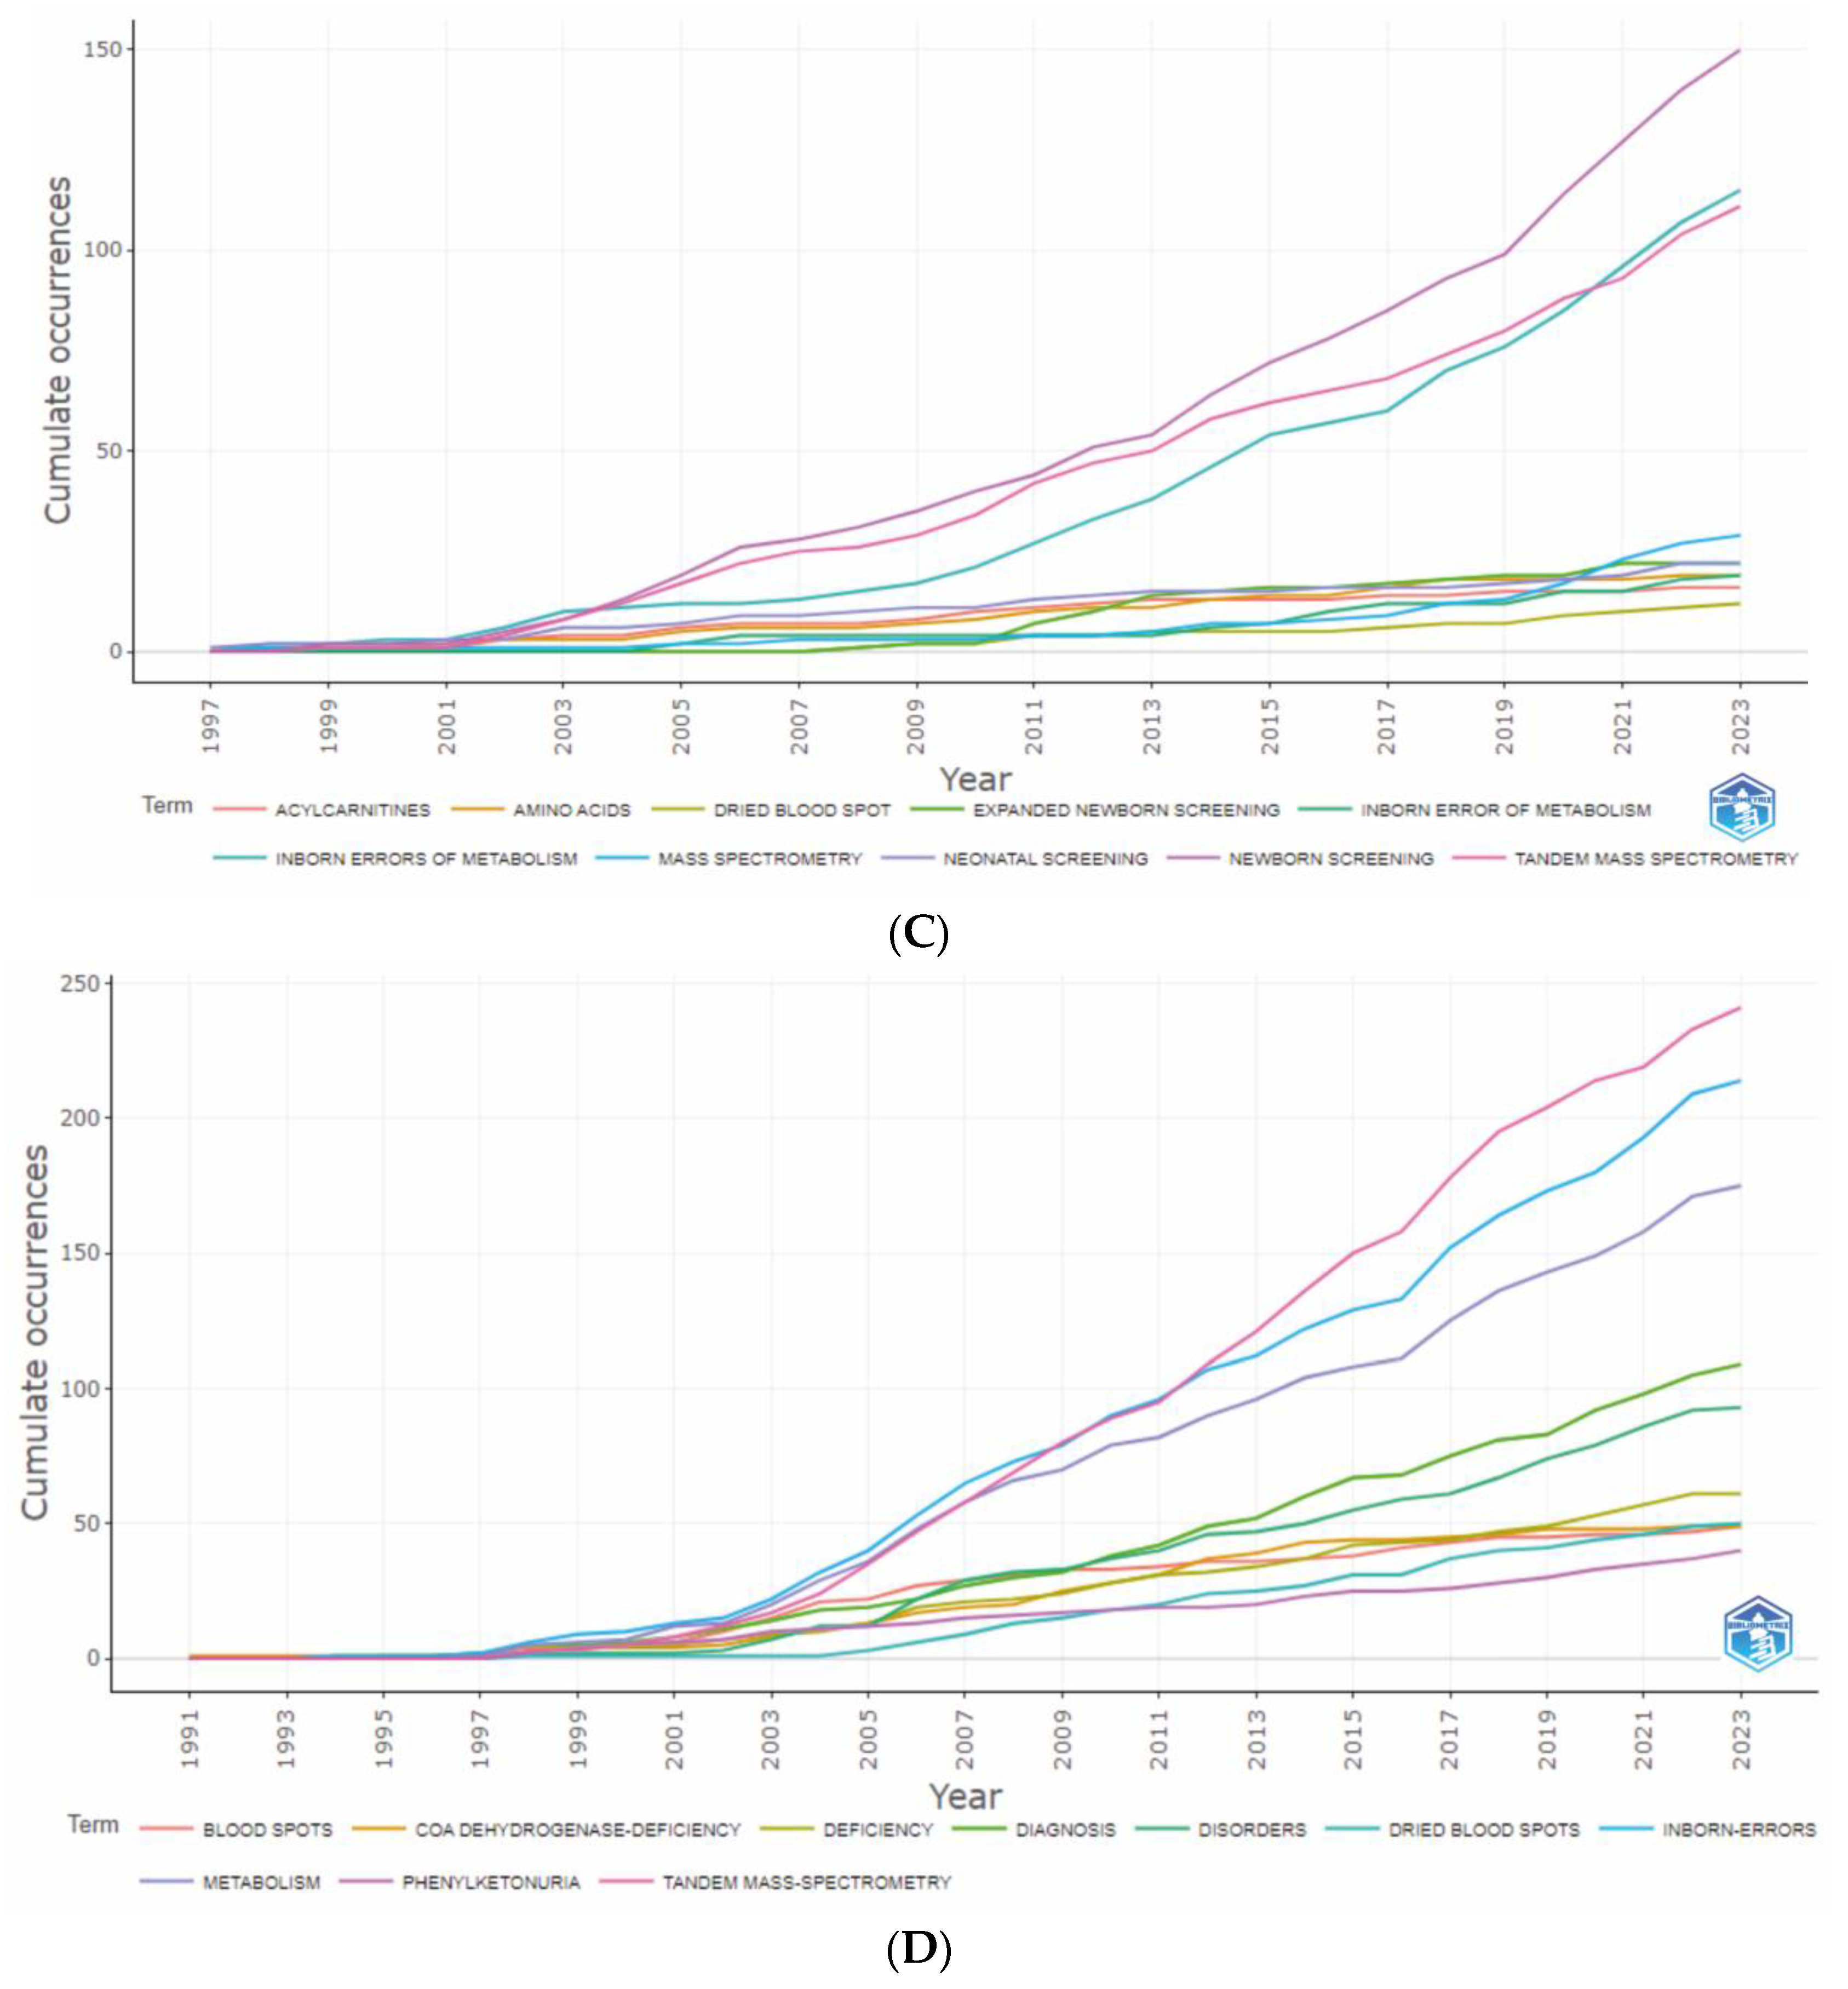
Figure 15.
(AB.) Trending topics of authors’ keywords (A). The evolution of the authors’ keywords (B).
Figure 15.
(AB.) Trending topics of authors’ keywords (A). The evolution of the authors’ keywords (B).
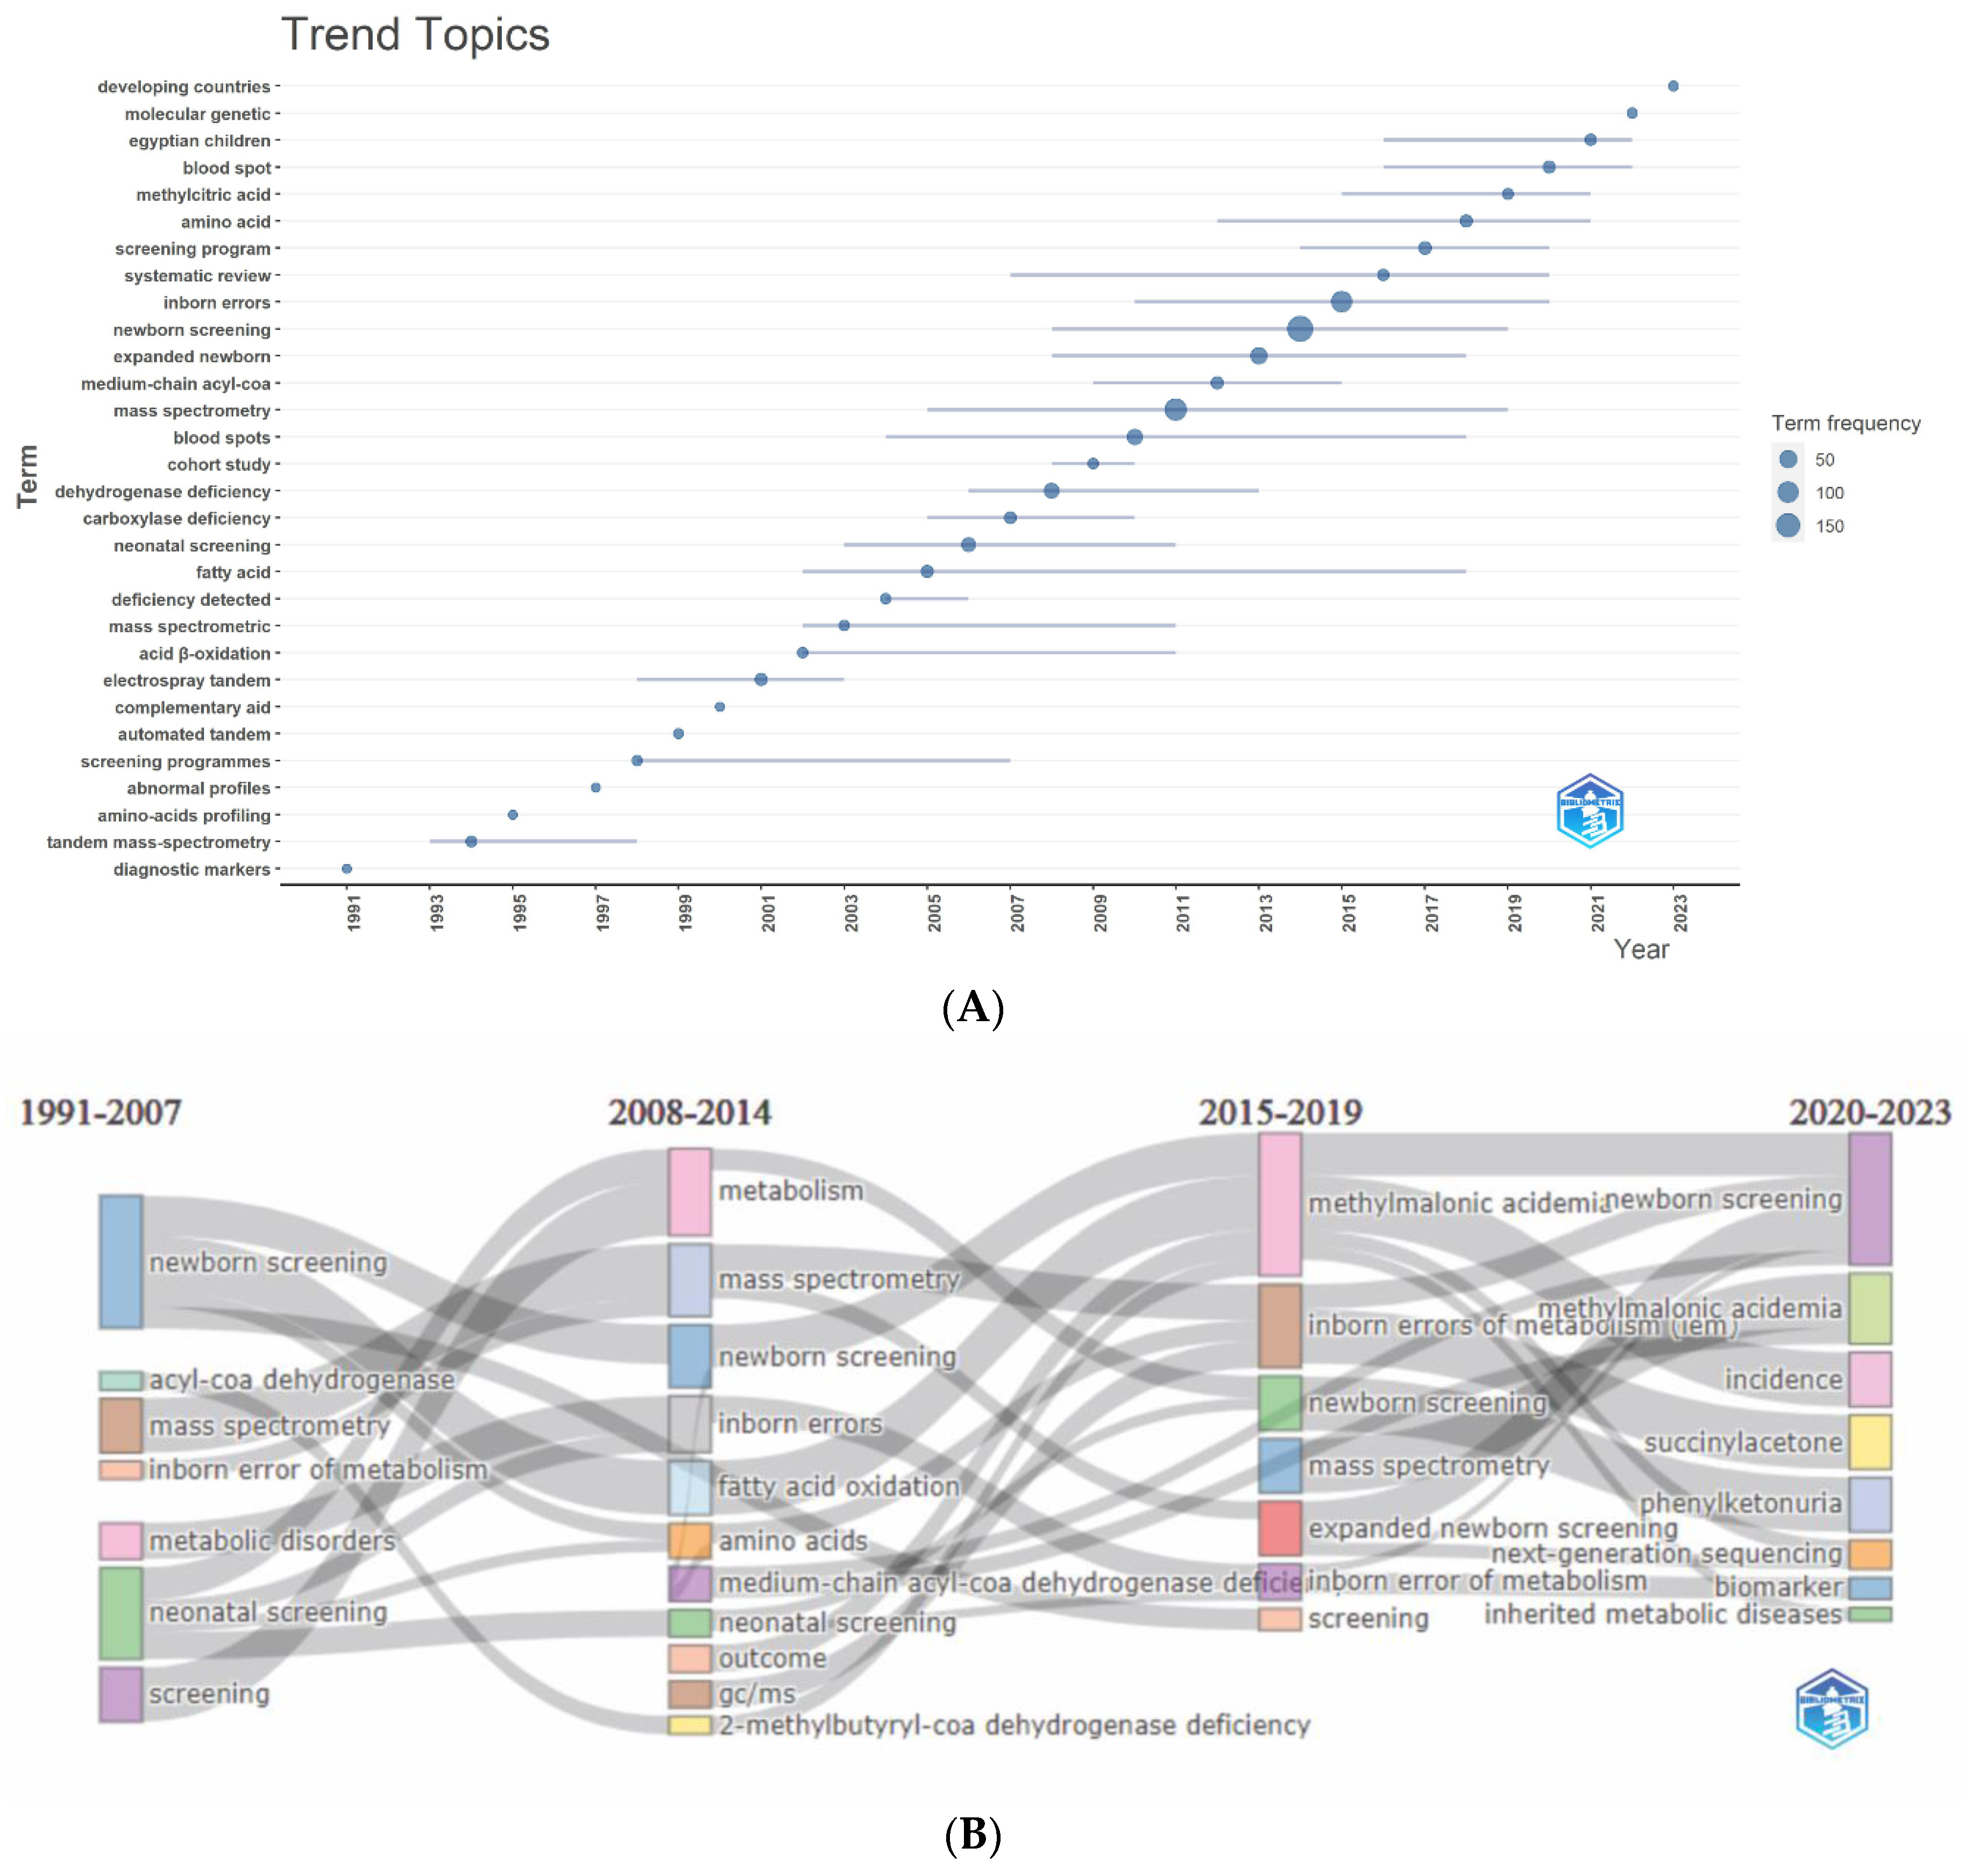
Figure 16.
(ABCD.) Keywords’ co-occurrence maps and relationships between authors, keywords, and sources. Сo-occurrence maps of the authors’ and additional (plus) keywords1 (A). Сo-occurrence maps of the authors’ and additional keywords (plus) after removing some keywords from the list2 (B). Map of the occurrence of keywords extracted from the articles’ titles and abstracts after removing some keywords from the list3 (C). Three-field graph of relationships between authors, authors’ keywords, and sources (journals) (D). 1Minimal frequency of occurrence 5. Seven clusters, 140 keywords. The item (node) size corresponds to the frequency of occurrence; the distance between nodes and the thickness of the lines show the strength of the connection between keywords according to the “co-occurrence” parameter and corresponds to the number of conjoint utilizing. 2Deleted keywords: Tandem mass-spectrometry, mass spectrometry, Inborn errors of metabolism, inborn error of metabolism, Inborn errors of metabolism (IEM), metabolic disorders, inborn errors, inherited metabolic diseases screening). Minimal frequency of occurrence 5. Seven clusters, 128 keywords. 3Deleted keywords: Tandem mass-spetrometry, mass spectrometry, Inborn errors of metabolism, inborn error of metabolism, Inborn errors of metabolism (IEM), metabolic disorders, inborn errors, inherited metabolic diseases screening). Minimal frequency of occurrence 20. Three clusters, 95 keywords.
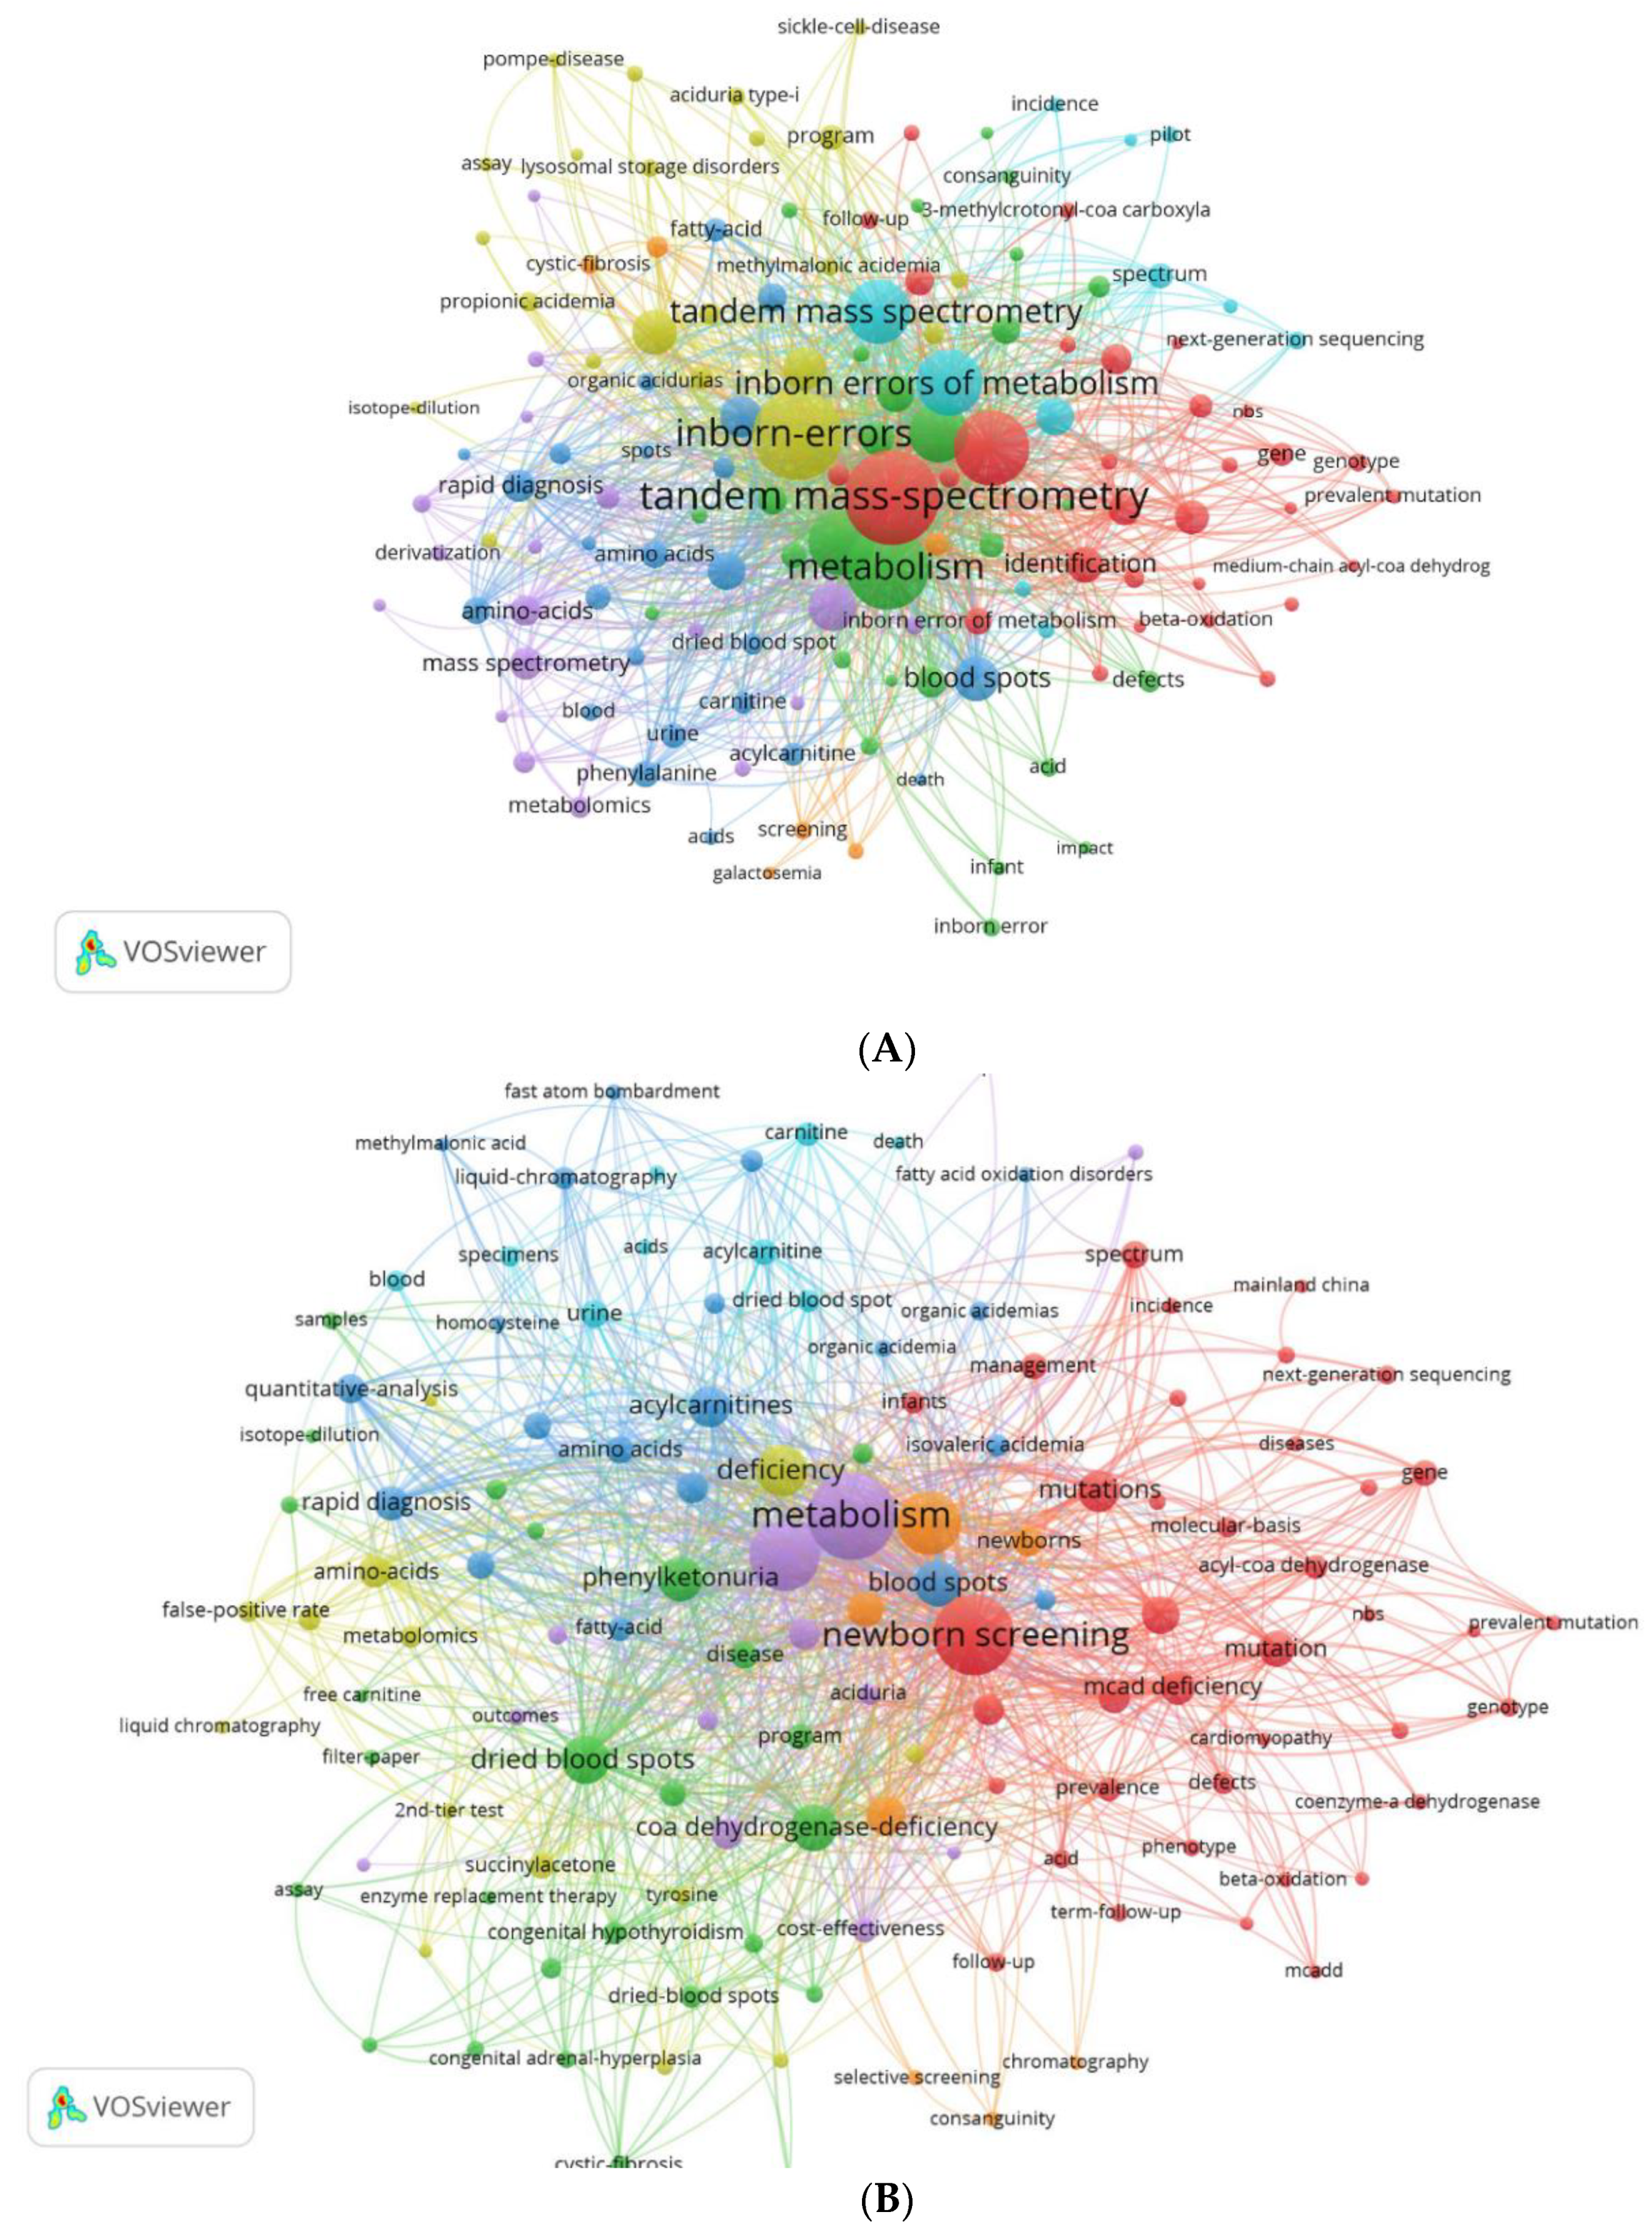
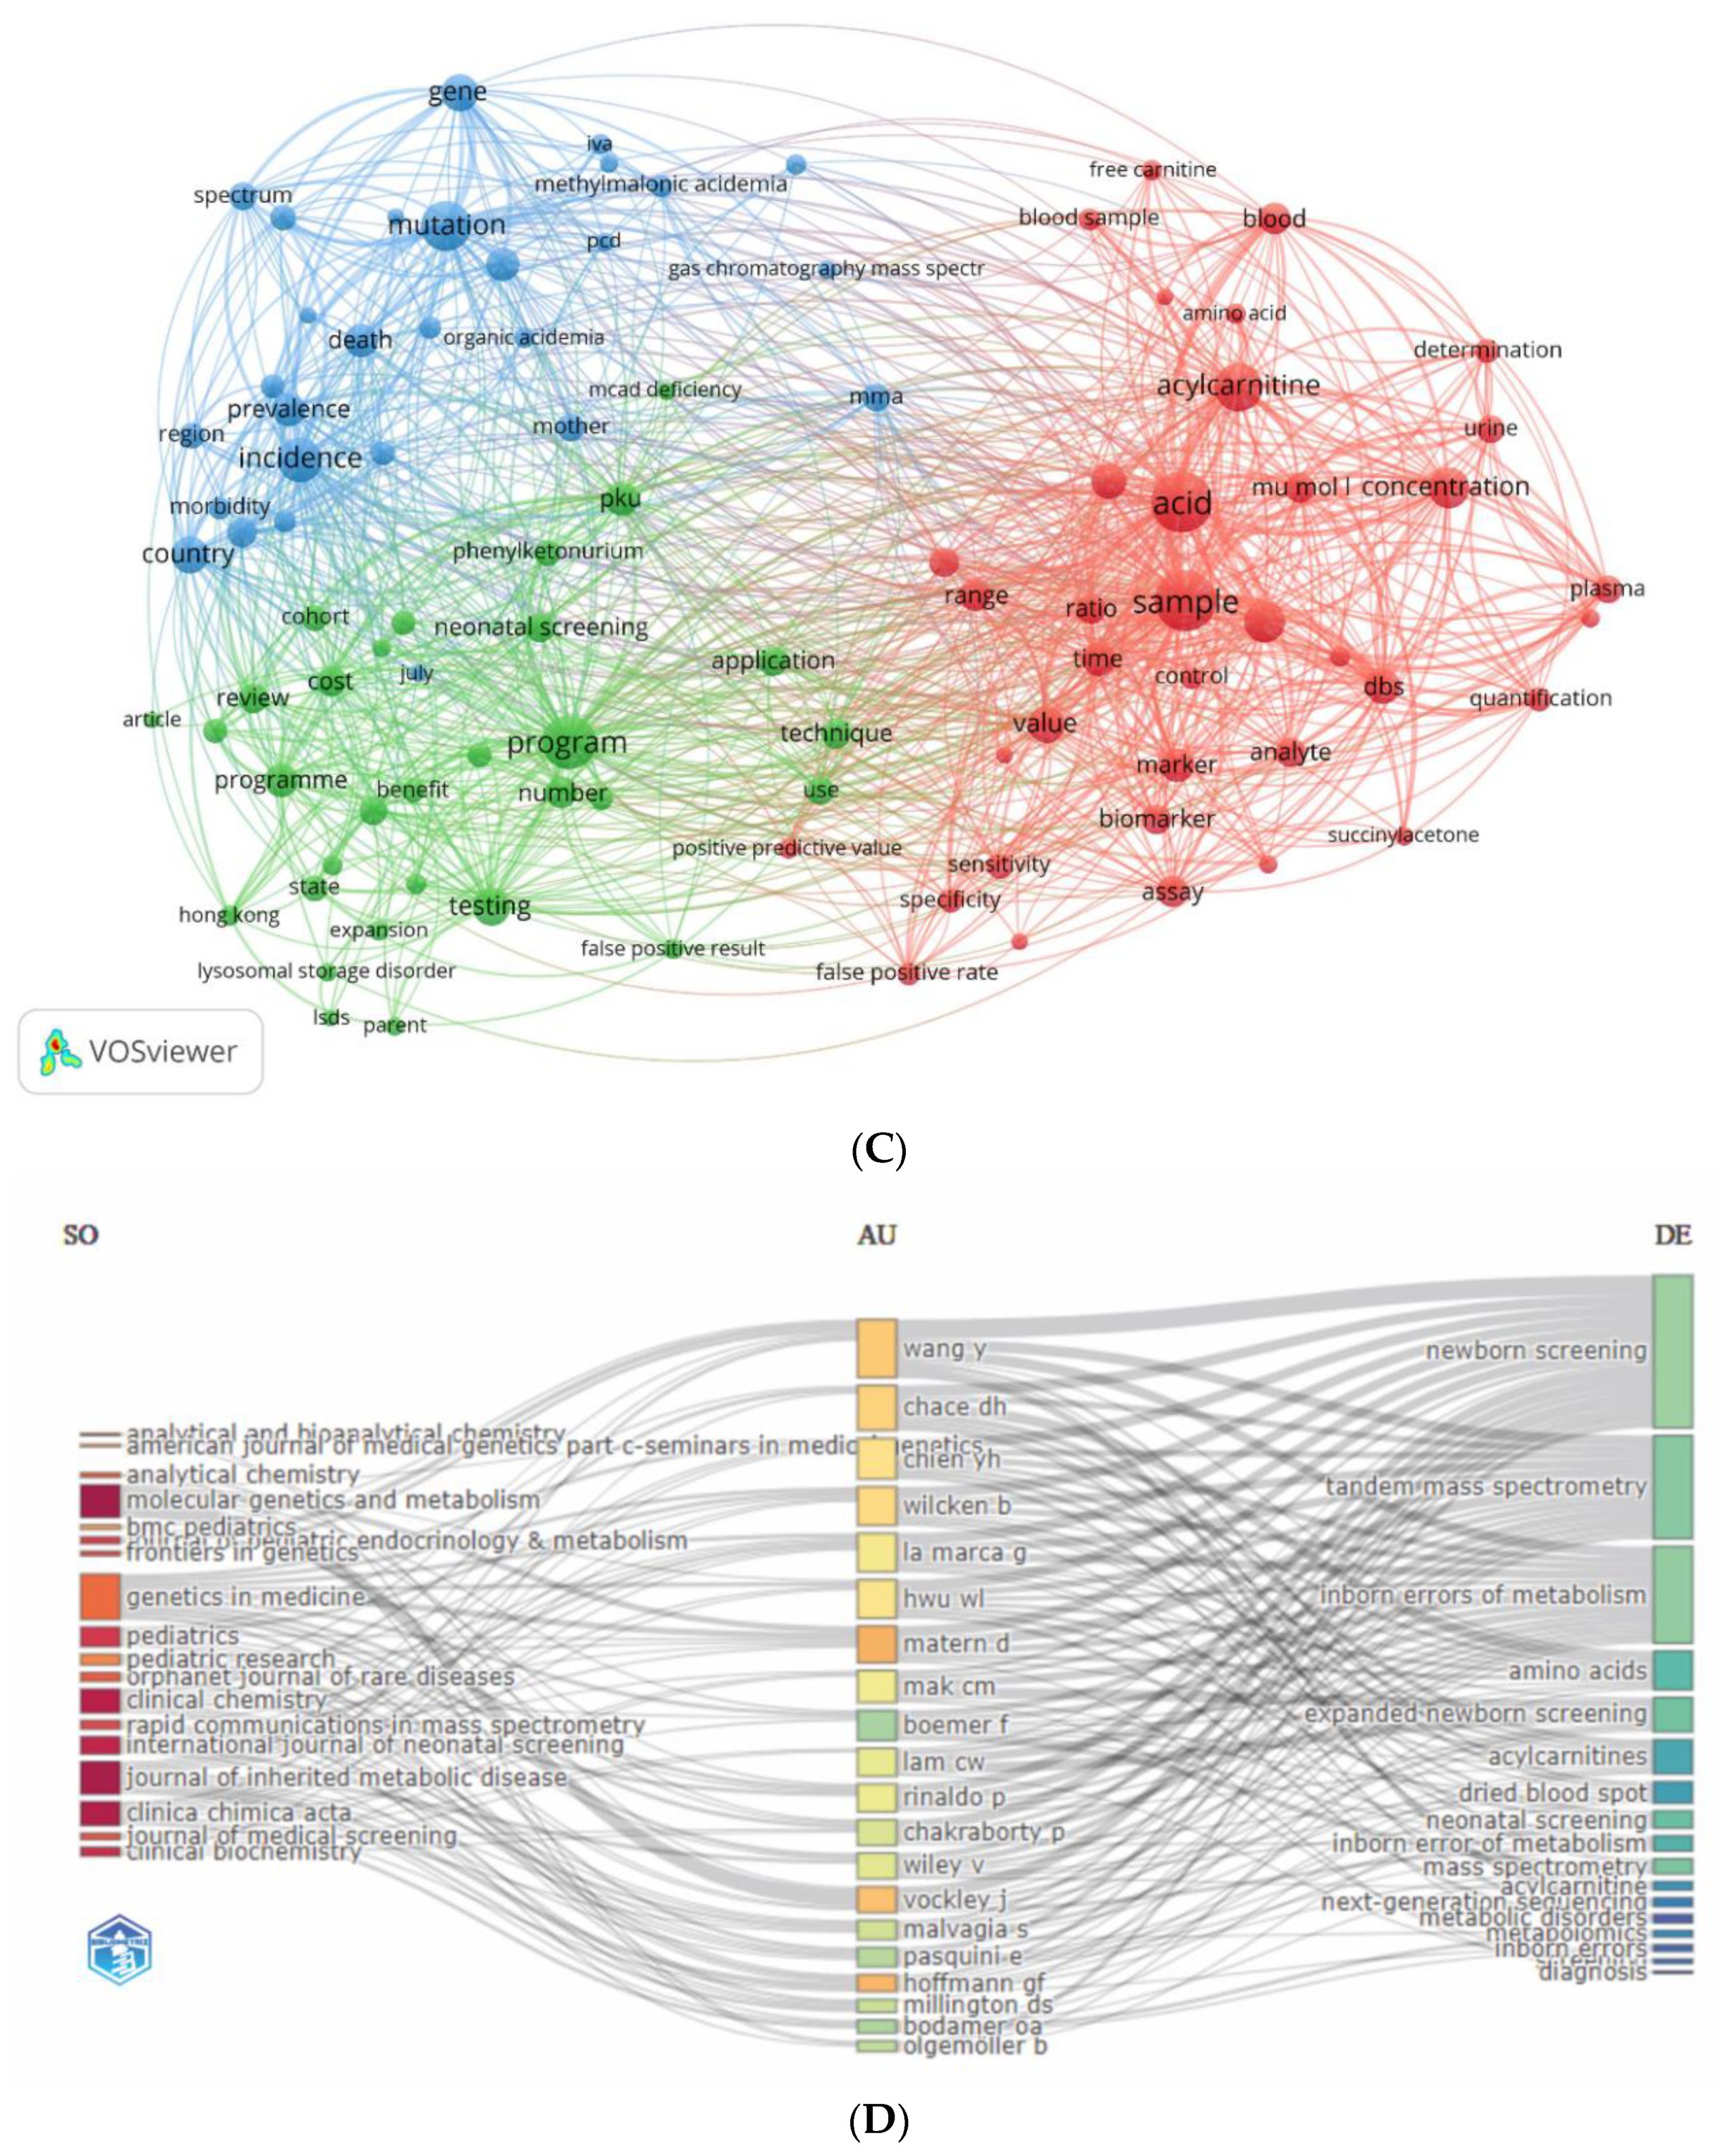

Table 1.
Most cited countries.
| Country | Total Citations | Average Article Citations |
|---|---|---|
| USA | 6,057 | 54.60 |
| Germany | 1,486 | 53.10 |
| Australia | 1,266 | 70.30 |
| China | 1,236 | 16.30 |
| Saudi Arabia | 971 | 69.40 |
| Italy | 616 | 28.00 |
| Austria | 577 | 57.70 |
| United Kingdom | 562 | 37.50 |
| Netherlands | 379 | 42.10 |
| Japan | 279 | 18.60 |
Table 2.
Most relevant authors.
| Rank | Author | Articles / % of 451 |
Articles Fractionalized | Total number of citations | H- index | G- index | M- index | Publishing since |
|---|---|---|---|---|---|---|---|---|
| 1 | Matern D. | 14 (3.104%) | 2.72 | 865 | 11 | 14 | 0.5 | 2002 |
| 2 | Hoffmann G.F. | 13 (2.882%) | 1.65 | 1,024 | 12 | 13 | 0.545 | 2002 |
| 3 | Vockley J. | 13 (2.882%) | 2.27 | 528 | 10 | 13 | 0.455 | 2002 |
| 4 | Wang Y. | 12 (2.661%) | 1.66 | 136 | 5 | 11 | 0.294 | 2007 |
| 5 | Chace D.H. | 11 (2.439%) | 4.45 | 1,103 | 11 | 11 | 0.333 | 1991 |
| 6 | Wilcken B. | 10 (2.217%) | 1.68 | 1,372 | 10 | 10 | 0.455 | 2002 |
| 7 | Chien Y.H. | 9 (1.996%) | 0.83 | 610 | 8 | 9 | 0.444 | 2006 |
| 8 | Hwu W.L. | 9 (1.996%) | 0.85 | 621 | 9 | 9 | 0.5 | 2006 |
| 9 | La Marca G. | 9 (1.996%) | 1.82 | 625 | 8 | 9 | 0.471 | 2007 |
| 10 | Mak C.M. | 9 (1.996%) | 1.10 | 185 | 6 | 9 | 0.462 | 2011 |
Table 3.
Most relevant journals.
| Rank | Journal | N of Publications / % of 451 | Total N of citations | H-index | G-index | M-index | Publishing since |
|---|---|---|---|---|---|---|---|
| 1 | Molecular Genetics and Metabolism | 41 (9.09) | 1,226 | 23 | 34 | 1.045 | 2002 |
| 2 | Journal of Inherited Metabolic Disease | 24 (5.32) | 1,397 | 21 | 24 | 0.808 | 1998 |
| 3 | Clinical Chemistry | 18 (3.99) | 1,865 | 15 | 18 | 0.556 | 1997 |
| 4 | Clinica Chimica Acta | 18 (3.99) | 619 | 14 | 18 | 0.609 | 2001 |
| 5 | International Journal of Neonatal Screening | 14 (3.10) | 88 | 7 | 8 | 1.167 | 2018 |
| 6 | Clinical Biochemistry | 13 (2.88) | 368 | 9 | 13 | 0.375 | 2000 |
| 7 | Pediatrics | 13 (2.88) | 1,054 | 12 | 13 | 0.522 | 2001 |
| 8 | Journal of Pediatric Endocrinology & Metabolism | 12 (2.66) | 89 | 6 | 9 | 0.545 | 2013 |
| 9 | Rapid Communications in Mass Spectrometry | 11 (2.44) | 360 | 10 | 11 | 0.333 | 1994 |
| 10 | Frontiers in Genetics | 9 (1.99) | 85 | 4 | 9 | 0.667 | 2018 |
| 11 | Journal of Medical Screening | 8 (1.77) | 112 | 6 | 8 | 0.6 | 2014 |
| 12 | Orphanet Journal of Rare Diseases | 8 (1.77) | 279 | 6 | 8 | 0.462 | 2011 |
| 13 | Analytical Chemistry | 6 (1.33) | 194 | 6 | 6 | 0.4 | 2009 |
| 14 | Genetics in Medicine | 6 (1.33) | 490 | 6 | 6 | 0.333 | 2006 |
| 15 | Indian Journal of Pediatrics | 6 (1.33) | 78 | 5 | 6 | 0.385 | 2011 |
Table 4.
Most cited articles.
| Rank | Article Title | Journal | Year | First Author | Total Cita- tions |
TC per Year | Norma-lized TC | Local Cita- tions |
LC/GC Ratio (%) |
|---|---|---|---|---|---|---|---|---|---|
| 1 | Screening newborns for inborn errors of metabolism by tandem mass spectrometry |
New England Journal of Medicine | 2003 | Wilcken, B | 483 | 23.0 | 4.66 | 130 | 5.48 |
| 2 | Tandem mass spectrometric analysis for amino, organic, and fatty acid disorders in newborn dried blood spots: A two-year summary from the New England newborn screening program |
Clinical Chemistry |
2001 | Zytkovicz, TH | 394 | 17.13 | 3.56 | 83 | 21.07 |
| 3 | Expanded newborn screening for inborn errors of metabolism by electrospray ionization-tandem mass spectrometry: Results, outcome, and implications |
Pediatrics |
2003 | Schulze, A | 355 | 16.90 | 3.42 | 117 | 32.96 |
| 4 | Current status of newborn screening worldwide: 2015 |
Seminars in Perinatology | 2015 | Therrell, BL | 329 | 36.56 | 8.30 | 36 | 10.94 |
| 5 | Diagnosis of inborn-errors of metabolism from blood spots by acylcarnitines and amino-acids profiling using automated electrospray tandem mass spectrometry | Pediatric Research |
1995 | Rashed, MS | 277 | 9.55 | 1.00 | 55 | 19.86 |
| 6 | Clinical validation of cutoff target ranges in newborn screening of metabolic disorders by tandem mass spectrometry: A worldwide collaborative project |
Genetics in Medicine |
2011 | McHugh, DMS | 253 | 19.46 | 5.73 | 52 | 2.55 |
| 7 | Effect of expanded newborn screening for biochemical genetic disorders on child outcomes and parental stress |
Jama - Journal of the American Medical Association | 2003 | Waisbren, SE | 253 | 12.05 | 2.44 | 40 | 15.81 |
| 8 | Rapid diagnosis of MCAD deficiency: quantitative analysis of octanoylcarnitine and other acylcarnitines in newborn blood spots by tandem mass pectrometry |
Clinical Chemistry |
1997 | Chace, DH | 233 | 8.63 | 1.01 | 43 | 18.45 |
| 9 | Screening blood spots for inborn errors of metabolism by electrospray tandem mass spectrometry with a microplate batch process and a computer algorithm for automated flagging of abnormal profiles |
Clinical Chemistry |
1997 | Rashed, MS | 229 | 8.48 | 0.99 | 44 | 19.21 |
| 10 | Neonatal screening for lysosomal storage disorders: feasibility and incidence from a nationwide study in Austria |
Lancet |
2012 | Mechtler, TP | 205 | 17.08 | 6.85 | 8 | 3.90 |
| 11 | Natural history, outcome, and treatment efficacy in children and adults with glutaryl-CoA dehydrogenase deficiency | Pediatric Research |
2006 | Koelker, S | 197 | 10.94 | 2.68 | 9 | 4.57 |
| 12 | Electrospray tandem mass spectrometry for analysis of acylcarnitines in dried postmortem blood specimens collected at autopsy from infants with unexplained cause of death |
Clinical Chemistry |
2001 | Chace, DH | 192 | 8.32 | 1.74 | 46 | 23.96 |
| 13 | The tandem mass spectrometry newborn screening experience in North Carolina: 1997-2005 |
Journal of Inherited Metabolic Disease | 2006 | Frazier, DM | 154 | 8.56 | 2.10 | 61 | 39.61 |
| 14 | Disorders of mitochondrial long-chain fatty acid oxidation and the carnitine shuttle |
Reviews in Endocrine & Metabolic Disorders | 2018 | Knottnerus, SJG | 151 | 25.17 | 5.44 | 0 | 0 |
| 15 | Untargeted metabolomic analysis for the clinical screening of inborn errors of metabolism |
Journal of Inherited Metabolic Disease | 2015 | Miller, MJ | 148 | 16.44 | 3.73 | 8 | 5.41 |
Disclaimer/Publisher’s Note: The statements, opinions and data contained in all publications are solely those of the individual author(s) and contributor(s) and not of MDPI and/or the editor(s). MDPI and/or the editor(s) disclaim responsibility for any injury to people or property resulting from any ideas, methods, instructions or products referred to in the content. |
© 2024 by the authors. Licensee MDPI, Basel, Switzerland. This article is an open access article distributed under the terms and conditions of the Creative Commons Attribution (CC BY) license (http://creativecommons.org/licenses/by/4.0/).
Copyright: This open access article is published under a Creative Commons CC BY 4.0 license, which permit the free download, distribution, and reuse, provided that the author and preprint are cited in any reuse.


