Submitted:
14 February 2024
Posted:
15 February 2024
You are already at the latest version
Abstract
Inappropriate expression of histone deacetylase (HDAC6) and deregulation of the phosphatidylinositol 3-kinase (PI3K) signaling pathway are common aberrations observed in cancers. LASSBio-2208, was previously described as a dual inhibitor in the nanomolar range of HDAC6 and PI3Kα, being three times more potent in inhibiting HDAC-6. In this paper we described the cytotoxic and antiproliferative potency of LASSBio-2208 on different tumour cell lines, its possible synergism effect in association with PI3K and HDAC-6 inhibitors, and its DMPK in vitro profile. Our studies have demonstrated that LASSBio-2208 has moderate cytotoxic potency on MCF-7 (IC50 = 23 µM), CCRF-CEM (IC50 = 8.54 µM) and MOLT-4 (IC50 = 7.15 µM), with no cytotoxic effect on hPBMC. In addition, it has a good antiproliferative effect on MCF-7 cells (IC50 = 5.44 µM), low absorption by PAMPA-GIT and low permeation through the blood-brain barrier by PAMPA-BBB, exhibiting high metabolic stability in rat plasma. Moreover, LASSBio-2208 exhibited synergism when combined with getadolisib and tubastatin A, using the concentration corresponding to their CC50 values on MOLT-4 and CCRF-CEM cells.
Keywords:
cancer
; PI3K
; HDAC6
; cytotoxicity
; antiproliferative
; synergism
; DMPK
1. Introduction
Genetic mutations and aberrant epigenetic changes are the stimulus for carcinogenesis. Inadequate expression of histone deacetylases (HDACs), epigenetic modifiers, and deregulation of the signaling pathway of the phosphatidylinositol-3 kinases (PI3K) are common aberrations observed in human diseases, particularly cancers. Therefore, the simultaneous inhibition of HDACs and PI3Ks appears to exhibit synergistic therapeutic efficacy and has encouraged the development of dual inhibitors of both biochemical pathways [1,2,3,4,5].
Among the several hybrid compounds designed as dual inhibitors of HDAC and PI3K, CUDC-907 (1) has gained prominence. It is a small molecule with good oral bioavailability and to able of simultaneously inhibit PI3K and HDAC. It was designed by introduction of hydroxamic acid group, as the zinc-binding pharmacophore of HDAC, and the morpholinopyrimidine subunit, as the pharmacophore to hinge binding of PI3K. Both separated by an appropriate spacer, as shown in Figure 1 [6].
Considering the data in the literature that point to the potentiation of the cytotoxic effect as a result of the synergism promoted by the simultaneous inhibition of HDACs and PI3K inhibitors, we have previously described the design, synthesis and in vitro evaluation of the pharmacological profile of a series of N-arylhydrazones, planned as dual HDAC6/8 and PI3K inhibitors [7]. The design concept of this series was based on the molecular hybridization between the morpholinopyrimidine fragment (coloured red) of PI-103 (2) and the acylhydrazone functionalized by a hydroxamic acid (coloured blue) framework present in LASSBio-1911 (3) (Figure 1). From this series, LASSBio-2208 (4) has stood out. This compound inhibited HDAC6 with a potency (IC50) of 15.3 nM and PI3Kα with IC50 of 46.3 nM. It also inhibited PI3Kβ, PI3Kδ and HDAC8 with an IC50 of 72.8 nM, 72.4 nM and 67.6 nM, respectively (Figure 1). This lead-compound displayed good lipophilicity, with a calculated logP value of 1.96, and low aqueous solubility (1.81 μM) [7]. The cytotoxic effect of LASSBio-2208 (4) was partially studied and published by Guerra and coworkers [8], using the PC3 prostate carcinoma cell line. The tests were carried out using the 24h and 48h MTT method. It was observed that after 24 hours of treatment with LASSBio-2208 (4) at concentrations of 0.01 µM, 0.05 µM, 0.1 µM, 0.5 µM, 1 µM and 5 µM, cell viability was reduced by almost 50% at the highest concentration studied. However, after 48 hours of treatment, at the same concentrations, there was no effect on cell viability. Its cytotoxic potency has not been determined. Next, the authors observed through flow cytometry assays that LASSBio-2208 (4) led to initial cell apoptosis in 60-66% of the cell population and favored cell cycle arrest in the G2/M phase, in the 24 h assay [8].
In this paper, we described the cytotoxic potency of LASSBio-2208 (4) in different tumour cells lines, its antiproliferative profile, the study of pharmacological synergism between LASSBio-2208(4) with gedatolisib (PI3K and mTOR inhibitor) or tubastatin A (HDAC6 inhibitor) or LASSBio-1911 (3) (HDAC6/8 inhibitor), and the attempts to determine its in vitro DMPK profile.
2. Results and Discussion
2.1. Pharmacological Experiments
2.1.1. Cell Viability by MTT and CC50 Determination
To determine the cytotoxic effect of LASSBio-2208 (4), using the MTT assay, four human cell lines with mutations in the PI3K pathway were selected: PC-3 (human prostate cancer cell line), MOLT-4 (T lymphoblast cell line), CCRF-CEM (human leukemia cell line) and MCF-7 (breast cancer cell line). Three controls were used in our experiments: the dual PI3K and mTOR inhibitor gedatolisib, the HDAC6 inhibitor tubastatin A and the HDAC6/8 inhibitor LASSBio-1911. The MTT studies were performed at 24h, 48h and 72h.
As demonstrated in Table 1, gedatolisib displayed a time-dependent cytotoxic effect on all four tumor cell lines studied. The best results were found in the 48h MTT and were maintained in the 72h MTT assay. Considering the cell viability studies in the MTT of 72h, gedatolisib displayed average cytotoxic concentration (CC50) values of 0.86 µM, 70 nM, 90 nM and 60 nM to PC-3, MOLT-4, CCRF-CEM and MCF-7, respectively. These results were like the values of 0.54 µM, 20 nM, 30 nM e 70 nM, respectively, previously described by Costa et. al [9] to gedatolisib against the same tumor cell lines (Table 1). It is worth noting that our work is the first to describe the cytotoxic effect of gedatolisib in 24h and 48h MTT assays on PC-3 and MCF-7 tumour cell lines.
Unlike to gedatolisib (a classical pan inhibitor of PI3K and mTOR), tubastatin A (a selective inhibitor of HDAC6) did not show any cytotoxic activity in the 24-hour MTT assay on solid tumour cell lines. At longer times (48h and 72h) it showed low cytotoxic potency on the PC3 and MCF7 lines, ranging from 34.89 to 65.94 μM for PC3 and 83.56 to >100 μM for MCF-7 (Table 1). However, it proved to be equipotent in inhibiting leukaemia strains (CCRF-CEM and MOLT-4), exhibiting CC50 varying from 5.65μM to 12.51 μM.
The third standard used in our experiments was the compound LASSBio-1911, described as an inhibitor of HDAC6 and HDAC 8. As expected, this inhibitor had a cytotoxic action profile like tubastatin A, showing greater cytotoxic potency on human leukaemia cell lines, with CC50 ranging from 5.27 μM to 13.75μM (Table 1).
Having studied the cytotoxic response of the standards gedatolisib, tubastatin A and LASSBio-1911 on the two solid tumour cell lines and two selected leukaemia cell lines, we began studies to determine the cytotoxic potency of LASSBio-2208. As demonstrated in Table 2, LASSBio-2208 was inactive in the PC3 strain in the 24h, 48h and 72h MTT assays. However, it showed a CC50 of 31.71 and 23.0 on MCF-7 cells in the 48h and 72h MTT assays (respectively), although with a low maximum cytotoxic response (Emax of 57.3% and 60.7%, respectively).
LASSBio-2208 cytotoxic effect against leukaemia cell lines was quite better. On MOLT-4 cells it exhibited a CC50 of less than 10 μM at all times studied. As shown in Table 2, it exhibited a CC50 of 7.14 μM, 8.26 μM and 7.15μM on MOLT-4 in the MTT assays at 24h, 48h and 72h, respectively. Nice results also were found on CCRF-CEM, exhibiting CC50 of 27.75 μM (24h), 8.68 μM (48h) and 8.54μM (72h).
The results obtained with LASSBio-2208 reveal a cytotoxic action profile in a phenotypic model very similar to tubastatin A and different from gedatolisib. Unlike gedatolisib, the cytotoxic effect of LASSBio-2208 does not appear to be time-dependent and exhibits little or no cytotoxic effect on selected solid tumour cell lines, which overexpress the PI3K pathway (PTEN-deficient PC3 and MCF7 with PIK3CA mutation) [10,11]. Considering that LASSBio-2208 is preferentially a dual inhibitor of PI3Kα and HDAC6, these results can be considered unexpected. However, it must be considered that LASSBio-2208 is three times more potent at inhibiting HDAC-6 (IC50 = 15.3 nM) than at inhibiting PI3Kα (IC50 = 46.3 nM) [7]. This data, together with its very low aqueous solubility (thermodynamic solubility = 1.81 μM) [7], may indicate that under the conditions of the experiment the soluble fraction of LASSBio-2208 could reach concentrations at which it would only or preferentially inhibit HDAC-6.
The observation of a time-independent cytotoxic effect for tubastatin A and LASSBio-2208 may at first seem unexpected, but it is not. Histone deacetylases (HDACs) are epigenetic modifiers, but HDAC6 has a greater presence in the cytosol of the cell, being found in smaller quantities in the cell nucleus [12,13,14]. Therefore, the cellular responses mediated by HDAC-6 and its inhibitors are mostly non-genomic.
2.1.2. Determination of Selectivity Index (SI) by MTT Assay
To determine the cytotoxic selectivity index of LASSBio-2208 and the standards tubastatin A and LASSBio-1911, we performed a MTT assay of 48h using human Peripheral Blood Mononuclear Cells (hPBMC), as a model of non-tumor cells. The SI indicates how selective a compound is for a tumour cell line compared to a non-tumour cell line [15].
Both LASSBio-1911 and LASSBio-2208, even at the highest concentration tested (100 µM), showed no cytotoxic effect on hPBMC. At this concentration (100 µM) they showed a maximum cytotoxic response of 31.1% and 29.9% (respectively), therefore, the value of their CC50 cannot be determined (Table 3). Comparatively, tubastatin A proved to be more cytotoxic to human non-tumor cells, exhibiting a CC50 of 85.66 μM and a maximum cytotoxic response (Emax) of 58.2% (Table 3).
Table 3 shows the comparative results of the cytotoxic effect, measured in a 48-hour MTT test, for LASSBio-1911, tubastatin A and LASSBio-2208 on human non-tumour cells (i.e., hPBMC) and human tumour cell lines PC3, MCF-7, MOLT-4 and CCRF-CEM. The cytotoxic selectivity index was calculated by the ratio of CC50 on non-tumour cells to CC50 on tumour cells [15].
Tubastatin A showed a cytotoxic selectivity index (SI) of 11.4 and 9.1 for MOLT-4 and CCRF-CEM, which means that it needs a concentration 11.4 and 9.1 times higher to kill the non-tumor cells (hPBMC) than the tumor cell lines MOLT-4 and CCRF-CEM, respectively. LASSBio-1911 and LASSBio-2208 did not have their SI calculated, since it was not possible to determine their CC50 on hPBMC.
2.1.3. Cell Viability and Antiproliferative Profile by SRB Assay
Considering the limitations of the MTT assay [16], we decided to investigate LASSBio-2208 antiproliferative profile against the PC-3, MCF-7, CCRF-CEM and MOLT-4 cell lines, using the SRB assay at 48 hours. For comparison purposes, the standards gedatolisib, tubastatin A and LASSBio-1911 were subjected to the same tests.
As can be seen by comparing the results shown in Table 1, Table 2 and Table 4, all the compounds are much less antiproliferative than cytotoxic. In PC-3 cells, none of the compounds showed a maximum antiproliferative response (Emax) of more than 60%, when tested at the highest concentration of 100 μM. The CC50 for LASSBio-1911 and tubastatin A in the SRB assay on the PC-3 was not calculated, since they displayed a maximum response inferior to 35% at 100 μM. Gedatolisib and LASSBio-2208 that exhibited maximum response greater than 50% at a concentration of 100 μM, were selected for determination of the CC50. LASSBio-2208 showed an antiproliferative potency 16 times lower than gedatolisib (CC50 = 98.93 μM versus 6.16 μM, respectively) (Table 4).
When the test was carried out with the second human solid tumour cell line MCF-7, very different behavior was observed. Tubastatin A and LASSBio-1911 displayed a CC50 of 66.01 µM and 39.14 µM, respectively, and a maximum effect of over 70% for the first and over 80% for the second. LASSBio-2208 was 7 to 12 times more potent than LASSBio-1911 and tubastatin A, respectively. But it was 181 times less potent than gedatolisib, which showed a CC50 of 0.03 µM (Table 4).
Surprisingly, the antiproliferative effect of LASSBio-2208 on human leukaemia cell lines (CCRF-CEM and MOLT-4) was null. This inactivity cannot be correlated to the compound’s mechanism of action, given that the standards gedatolisib (PI3K inhibitor), tubastatin A (HDAC6 inhibitor) and LASSBio-1911 (HDAC6/8 inhibitor) exhibited antiproliferative effect with CC50 of 0.78 µM, 9.69 µM and 25.18 µM (respectively) on CCRF-CEM, and CC50 of 3.68 µM, 10.45µM and 53.09 µM (respectively) on MOLT 4 (Table 4).
2.1.4. Synergism Study by MTT on CCRF-CEM Cell Line
To investigate the synergistic effect of LASSBio-2208 with inhibitors of PI3K (gedatolisib), HDAC6 (tubastatin A) and HDAC6/8 (LASSBio-1911) we carried out the 48h MTT test, using different combinations of concentrations of the target compounds. The proportions of combinations (based on the CC50 values obtained for each target compound) were established in the 48-hour MTT assay on CCRF-CEM cell lines. The combination indices (CI) were obtained using the COMPUSYN software, which was developed to allow the analysis of combinations of compounds that act by modulating different targets or pathways [17], which were classified according to the parameters indicated in the literature as synergism, addition and/or antagonism [18].
The first combination evaluated was an association of gedatolisib and LASSBio-1911. We observed that in combinations below the CC50 value, moderate antagonistic effects were detected. However, as the proportional combination of CC50 was increased, a synergistic effect was detected between them (Table 5). The second combination investigated was between gedatolisib and tubastatin A for which we observed additive effects in combinations using lower concentrations of the compounds, while there was a prevalence of the synergistic effect as the concentrations increased (Table 5). Our results are in agreement with literature data [19,20], which describe that the combination of PI3K and HDAC6 inhibitors has synergistic effects, resulting in an increase in the cytotoxic activity of the combination when compared to the cytotoxic effect of the species alone, as we have found for gedatolisib and tubastatin A (Table 5).
LASSBio-2208, previously described as an inhibitor of PI3Kα (IC50= 46.3 nM), PI3Kβ (IC50 = 72.8 nM), PI3Kδ (IC50= 72.4 nM) and HDAC6 (IC50= 15.3 nM) (Figure 1), displayed both synergistic and additive effects, when combined with gedatolisib and tubastatin A. As demonstrated in Table 5, the combination of LASSBio-2208 using its CC50 value and the one calculated for gedatolisib or tubastatin A resulted in a synergic response. A strong synergism was observed when combining LASSBio-2208 and getadolisib at concentrations 4 times higher than their CC50 values (Table 5). On the other hand, the combination using concentrations 4 times higher than the CC50 values of LASSBio-2208 and tubastatin A resulted in an additive effect. Using this same combination of concentrations (4 x CC50 values), the combination of the pairs LASSBio-2208 and LASSBio-1911 and getatolisib with tubastatin A, resulted in a nearly additive effect (Table 5).
2.1.5. Synergism Study by MTT on MOLT-4 Cell Line
Continuing the synergism studies, trials were carried out with the second acute lymphoblastic leukaemia strain, MOLT-4. Combination of gedatolisib and tubastatin A showed a synergistic effect when the individual concentrations were set at values ranging from 0.25 to 2 times the value of their CC50. However, antagonism was observed when both standard drugs were combined using concentrations 4 times higher than their CC50 values (Table 6). At the highest combined concentration (4 x CC50 value), gedatolisib also had an additive effect when combined with LASSBio-1911, and a synergistic effect when combined with LASSBio-2208. Regarding LASSBio-2208, it exhibited synergism when combined with all the standards studied (gedatolisib, LASSBio-1911 and tubastatin A), using the concentration corresponding to their CC50 values on MOLT-4 cells or values 2 times higher than their CC50 (Table 7). Its combination with tubastatin A using 1/4 of the concentration estimated for its CC50 or 4 times greater than the CC50 resulted in the indication of pharmacological antagonism between LASSBio-2208 and tubastatin A. Similar results were found for the combination of LASSBio-2208 with LASSBio-1911, at concentrations 1/4 of the CC50 or 4 times higher than the CC50.
2.2. In Vitro DMPK Studies
2.2.1. Parallel Artificial Membrane Permeability Assay (PAMPA)
To obtain information on the permeability potential of LASSBio-2208 on cell membranes, this derivative was tested using the Parallel Artificial Membrane Permeability Assay (PAMPA) that is used as an in vitro model of passive diffusion and transcellular permeation [21,22]. In this model was measured the permeability across two artificial membranes: Brain lipid from pig extract in dodecane (called PAMPA-BBB) and L-α soy phosphatidylcholine in dodecane (called PAMPA-TGI). The experiments were carried out in comparison with the gedatolisib, tubastatin A and LASSBio-1911 standards (Table 7).
As demonstrated in Table 7, gedatolisib was insoluble under the experimental conditions used to determine permeability in PAMPA-BBB. Unlike tubastatin A, which was shown to be able to permeate the artificial membrane that mimics the blood-brain barrier and was therefore predicted to be able to permeate it (CNS+); LASSBio-2208 and LASSBio-1911 showed low permeation on PAMPA-BBB (Table 7). Therefore. they were predicted to be unable to permeate the blood-brain barrier (CNS -).
The permeation profile of the four compounds in PAMPA-GIT was somewhat different. LASSBio-2208 and LASSBio-1911 exhibited a low probability of absorption by the gastrointestinal tract, with Pe= 0.39 x 10⁻⁶ cm/s and Pe= 0.3592 x 10⁻⁶ and fraction absorbed of 13.78% and 20.15%, respectively. While gedatolisib and tubastatin A displayed medium probability of absorption by the gastrointestinal tract with Pe= 1.74 x 10⁻⁶ cm/s and Pe= 1.982 x 10⁻⁶ and fraction absorbed of 48.4% and 52.9%, respectively.

Table 7.
Parallel artificial membrane permeability assay (PAMPA) for blood-brain barrier (BBB) and gastrointestinal tract (GIT).
Table 7.
Parallel artificial membrane permeability assay (PAMPA) for blood-brain barrier (BBB) and gastrointestinal tract (GIT).
| Compounds | Pe. Exp. BBB (10-6 cm/s) |
Classification BBB | Pe. Exp. GIT (10-6 cm/s) |
Fraction absorbed (%) | Classification GIT |
|---|---|---|---|---|---|
| LASSBio-2208 | 0.69 | CNS - | 0.39 | 13.78 | Low |
| LASSBio-1911 | 0.29 | CNS - | 0.592 | 20.15 | Low |
| Gedatolisib | Insoluble | 1.74 | 48.40 | Medium | |
| Tubastatin A | 5.54 | CNS + | 1.982 | 52.93 | Medium |
2.2.2. Metabolic Stability
Further, the metabolic stability of LASSBio-2208 was studied using rat plasma and rat liver microsomes (RLM).
Considering that both LASSBio-2208 and LASSBio-1911 have in their structures the N-acylhydrazone and hydroxamic acid fragments, both susceptible to metabolic hydrolysis [23,24,25], metabolic stability in plasma was conducted with both compounds. As demonstrated in Table 8, both compounds showed a low rate of metabolization and high half-life, indicating high metabolic stability in rat plasma.
However, attempts to study the metabolic stability of LASSBio-2208 in rat liver microsomes were all unsuccessful. Although it was possible to visualize the disappearance of the signal corresponding to LASSBio-2208 in the chromatograms from different times of the metabolic stability experiment in RLM, it was not possible to observe the emergence of any new signal, characteristic of metabolite formation. This atypical pattern could be associated with the ability of hydroxamic acid to exhibit strong cation chelating properties including with the iron atom of the CYP450 proteins [26,27]. Another hypothesis to explain the results would be linked to the potential ability of LASSBio-2208 to form nonspecific bonds to membrane lipid-proteins of microsomal fraction. Once such bonds are formed, the bound fraction would become incapable of being metabolized. To corroborate or refute this hypothesis, we carried out the nonspecific microsome binding assay [28] with LASSBio-2208, and with the standards gedatolisib, tubastatin A and LASSBio-1911.
As exemplified in Table 10, the methodology was validated using tolbutamide as a standard. In our experiments it was found unbound fraction (ƒu(mic)) in the nonspecific microsomal binding for tolbutamine of 1.113, similar the value previously described in the literature by McLure et al. [28]. Then, the unbound fraction in the nonspecific microsomal binding assay for compounds LASSBio-2208, LASSBio-1911, gedatolisib and tubastatin A were determined. The extent of free drug, i.e. not bound to microsomal membrane is depicted in Table 10. In general, the more lipid-soluble a compound is, the more bound to membrane lipid-proteins it could be. In our results, tubastatin A and LASSBio-1911 bound extensively to microsomal membrane, exhibiting a ƒu(mic) = 0.131 and 0.004, respectively. While gedatolisib showed a medium binding rate (ƒu(mic) = 0.503). On the other hand, LASSBio-2208 exhibited the smaller extension of nonspecific microsomal binding (ƒu(mic) = 0.937), with more than 93% unbounded, therefore, available to be metabolized. Taken together, these results refute the hypothesis that there was no metabolic conversion of LASSBio-2208 in RLM due to possible non-specific binding to microsomal proteins, resulting in a low fraction of free drug under the experimental conditions. Studies to investigate the potential of LASSBio-2208 to inhibit CYP isoforms and therefore prevent its own metabolism need to be carried out further.
3. Materials and Methods
3.1. Cell Culture
The tumor cell lines used in this study were CCRF-CEM (acute lymphoblastic leukemia with mutation in PTEN), MOLT-4 (acute lymphoblastic leukemia with mutation in PTEN and PI3KR1), MCF-7 (breast cancer with mutation in PI3KCA) and PC-3 (prostate cancer with mutation in PTEN), these cells were thawed and maintained in RPMI-1640 medium supplemented with 10% fetal bovine serum (FBS), with 1% penicillin antibiotic (100 U/mL) and streptomycin (100 µg/mL) in an oven at 37 °C and 5% CO2. The concentration of the compounds used for the tests ranged from 0.003 µM - 100 µM with DMSO at 1%, except for gedatolisib where the maximum concentration evaluated was 50 µM.
Human peripheral blood mononuclear cells (PBMCs) were used to determine the selectivity index (SI) and were obtained from healthy volunteers under a protocol approved by the Ethics Committee CAAE: 38257914.7.0000.5259. Immortalized cells were also obtained from the Rio de Janeiro Cell Bank (BCRJ).
3.2. Cell Viability Assay by MTT
The cells were plated in a 96-well plate (3×10⁴ cell/well), after which the test compounds were added at the concentrations mentioned above to be incubated for 24h, 48h and 72h in an oven at 37 °C and 5% CO2. After the incubation time, the plate was centrifuged (Universal centrifuge 320R Hettich) at 440×g, 10 min and 4 °C, then 110 µL of supernatant was removed and 10 µL of MTT solution was added and left to incubate for 3.5 hours in the oven at 37 °C and 5% CO2. Finally, to dissolve the formazan crystals, 100 µL of SDS-HCl (sodium dodecyl sulphate - hydrochloric acid) detergent was added and left to dissolve until the following day to be read on the Molecular devices Spectramax M5 plate reader at a wavelength of 595 nm. The CC50 was calculated using the GraphPad Prism 9.0 program. Each sample was tested in triplicate in three independent experiments (N3) [29,30].
3.3. PBMC Viability Assay by MTT
First, 8 mL of blood from each healthy donor (3 people) was collected in a tube with EDTA in a 1:20 ratio to prevent the blood from clotting. In a 15 mL Falcon tube containing 4 mL of Ficoll-Paque, the 8 mL of blood collected was slowly added, letting it fall down the walls of the tube. It was centrifuged (Universal centrifuge 320R Hettich) for 40 min at 750×g at 21 °C with acceleration 1 and brake 0. After centrifugation, in order to extract the ring of mononuclear cells, the supernatant above it was first carefully discarded so as not to disturb the ring. The ring was then slowly removed and placed in another 15 mL Falcon tube to which pure RPMI-1640 medium was added in a 1:1 ratio and centrifuged for 10 minutes at 580×g and 21 °C with acceleration 8 and brake 9 [31,32].
The supernatant was discarded, and the pellet was resuspended in 1 mL of RPMI-1640 medium supplemented with 10% SBF and 1% antibiotic. 20 µL of cells were taken from the mixture and added to 380 µL of trypan blue dye for counting in the Neubauer chamber. Considering that 80% of PBMCs are lymphocytes and the rest are monocytes [33], the cells were plated with the aim of having 105 cell/well. The 96-well plate was left in the oven at 37 °C and 5% CO2 for 1 hour, so that the monocytes adhered to the bottom of the plate; after this time, the supernatant containing the lymphocytes was transferred to another plate and the protocol established for the MTT assay indicated in point 3.2 was continued.
3.4. Cell Viability Assay by SRB
The cells were first plated in a 96-well plate (3×10⁴ cell/well) and incubated in the oven at 37 °C and 5% CO2 for 24 hours. The test compounds were then added at the concentrations indicated in point 3.1 and the plate was incubated again for 48 hours. After 48 hours, in order to fix the cells, they were centrifuged (Universal centrifuge 320R Hettich) at 440×g for 10 min at 4 °C and trichloroacetic acid (TCA) was added. For adherent cells, all the supernatant was removed and 100 µL of 10% TCA was added to each well, keeping the plate in the fridge at 4 °C for 1 h. For the cells in suspension, without removing the supernatant, 50 µL of 80% TCA was added to each well and the plate kept in the refrigerator at 4 °C for 2h [34,35].
After the fixation time, the TCA was discarded in the sink and the wells washed four times with distilled water. The plate was dried at room temperature and then stained with 100 µL of sulforhodamine B (SRB) at 0.057 % m/v solubilized in 1% acetic acid, and the plate was left to stand in the dark for 30 minutes. After this time, the excess SRB was discarded and washed with 1% acetic acid (4 times of 15 mL) [35,36].
After drying at room temperature, the dry plate was taken to the Spectramax M5 plate reader from Molecular Devices to read the absorbance at 510 nm. Before reading, the SRB had to be dissolved in a Tris-base solution (pH 10.5). In this way, 100 µL of the solution was added to each well and the plate was gently shaken for 15 min. Once this time had elapsed, the readings were taken. The results obtained were analysed using GraphPad Prism 9.0.
3.5. Synergism Assay by MTT
The MTT test was used to evaluate synergism between the target compounds, adapting the experimental procedures already described in section 3.2 in order to include the choice of compound concentrations, as indicated by the developers of the COMPUSYN software. To determine the concentrations used in the experiment, it was first necessary to determine the CC50 f the compounds. Once this stage had been completed, tests were carried out on combinations with concentrations proportional to the CC50 for each target compound (i.e. 0,25× CC50, 0,5× CC50, 01× CC50, 02× CC50, 4× CC50) [17,18].
3.6. Parallel Artificial Membrane Permeability Assay (PAMPA)
To perform permeability assay have used a donor plate where the compounds (tests or controls) are diluted in a buffered medium, which is characterized by the presence of a synthetic membrane of PVDF (polyvinylidene fluoride) impregnated with a lipid solution, forming a barrier through which the compounds migrate through a diffusion process to the lower plate called the receptor.
The lipid mixture that impregnates the filter has a different constitution for the permeability tests for the blood-brain barrier (Brain lipid from pig extract in dodecane) and gastrointestinal tract (L-α soy phosphatidylcholine in dodecane). In the PAMPA BBB and TGI assays, the optical density values obtained in the reading at each selected wavelength, for each of the compounds were analysed in comparison with the values of several controls. In the case of the BBB, these values were used to elaborate an equation and determine the permeability coefficient (Pe), using a previously elaborated spreadsheet, and, for the TGI, these values were used to determine the absorbed fraction (Fa%), both using the Excel program. The permeability result for PAMPA-TGI classifies the compounds according to the percentage of absorbed fraction (Fa%), as: high intestinal permeability (70–100%), medium permeability (30–69%) or low permeability (0–29%), and the samples were diluted from stock solution of 10 mM. The PAMPA-BHE model classifies the compounds only as: permeable (CNS+) or non-permeable (CNS-) and the assay were made from stock solution of 1 mg for each compound [22,37,38,39].
3.7. Plasma Stability
LASSBio-2208 and LASSBio-1911, in a final concentration of 10 μM from stock solution of 1 mM, was added in 50 μL of rat plasma solution diluted in 250 μL with phosphate buffer (pH 7.4) and was placed in a shaker at 37 ºC under vigorous stirring for 0, 30, 60, 120 and 240 minutes. After each reaction time, 1 mL of cold acetonitrile containing 2 uM internal standard were added to the wells to stop the reaction. The solution was mixed and centrifuged at 24500×g for 15 min (Universal centrifuge 320R Hettich) [40,41]. The supernatant (1 mL) was filtrated and placed in vials to be analysed by HPLC.
3.8. Microsomal Stability
To evaluate microsomal stability, was added 10 µM of a 1 mM stock solution of LASSBio-2208 and LASSBio-1911 to a mixture containing rat liver microsomes at a concentration of 1 mg/mL of proteins. This mixture was supplemented with the essential cofactors for activating the NADPH-generating system, including 1.3 mM MgCl2, 0.4 mM NADP+, 3.5 mM glucose 6-phosphate, and 0.5 U/mL glucose 6-phosphate dehydrogenase, all diluted in 0.1 M phosphate buffer (pH 7.4) to a final volume of 250 µL [42].
The samples were then subjected to a pre-incubation at 37 °C, followed by incubation at the same temperature with constant agitation for varying time intervals (0, 15, 30, 45, 60 minutes). Subsequently, the reaction was halted by adding 1 mL of an acetonitrile-methanol solution (1:1) containing 2 µM of the internal standard, enabling the extraction of compounds and precipitation of proteins. The samples were then centrifuged at 24500×g for 15 minutes at 4 °C to separate the components of the mixture. The resulting supernatant (1 mL) was carefully collected, filtered, and subsequently analyzed by HPLC. This procedure was conducted both in the presence and absence of the enzyme cofactors and replicated in triplicate [42].
3.9. Non-Specific Microsome Protein Binding
Liver microsomes were diluted with PBS pH 7.4 to a concentration of 0.5 mg protein/mL and 3 µL at 1 mM of working test compound solutions were mixed with 357 µL of liver microsome suspension. After mixing, duplicate 200 µL aliquots were immediately removed another microtubule to act as the control samples (T 0 hour) and quenched with 400 µL of cold acetonitrile containing analytical internal standards. The other samples were incubated at 37 °C at 100 rpm, for 60 minutes with the same subsequent treatment. After this, all samples were centrifuged at 3220 g for 30 minutes at room temperature, the supernatant was collected and analyzed by HPLC. The results were obtained by peak area ratio was derived via normalizing to an analytical internal standard and the unbound fraction (fu(mic)) of drug in microsomal compartment was expressed as the free drug concentration (peak area in time 0 minutes) divided by the total drug concentration (peak area in time 60 minutes) [43,44].
4. Conclusions
Our studies revealed that LASSBio-2208 has moderate cytotoxic potency on the human tumour cell lines MCF-7 (IC50 = 23 μM), CCRF-CEM (IC50 = 8.54 μM) and MOLT-4 (IC50 = 7.15 μM), with no cytotoxic effect on non-tumor cells (hPBMC), at the highest concentration studied of 100μM. Our data also point to the possibility of a synergistic effect by increasing LASSBio-2208 cytotoxic activity if combined with gedatolisib or tubastatin A. In addition, it has a good antiproliferative effect on MCF-7 cells (IC50 = 5.44 μM), low absorption by PAMPA-GIT and low permeation through the blood-brain barrier by PAMPA-BBB, exhibiting high metabolic stability in rat plasma. Further studies should be conducted to optimize the pharmacodynamic and pharmacokinetic properties of this important lead compound.
Supplementary Materials
The following supporting information can be downloaded at the website of this paper posted on Preprints.org.
Author Contributions
Conceptualization, L.M.L; methodology, R.M.P-M, W.L.G. and G.B.; software, R.M.P-M.; formal analysis, R.M.P-M and G.B..; investigation, R.M.P-M, G.B. and W.L.G.; resources, L.M.L., C.A.M.F. and E.J.B.; writing—original draft preparation, R.M.P-M. and G.B.; writing—review and editing, R.M.P-M., W.L.G and L.M.L.; supervision, L.M.L.; project administration, L.M.L.; funding acquisition, L.M.L, CAMF, and E.J.B. All authors have read and agreed to the published version of the manuscript.
Data Availability Statement
Data is contained within the article.
Acknowledgments
The authors thanks support from INCT-INOFAR, CNPq, FAPERJ and CAPES.
Conflicts of Interest
The authors declare no conflicts of interest.
References
- Ranganna, K.; Selvam, C.; Shivachar, A.; Yousefipour, Z. Histone deacetylase inhibitors as multitarget-directed epi-drugs in blocking pi3k oncogenic signaling: A polypharmacology approach. Int. J. Mol. Sci. 2020, 21:8198. [CrossRef]
- Li, Y.; Seto, E. HDACs and HDAC inhibitors in cancer development and therapy. Cold Spring Harb. Perspect Med. 2016, 6: a026831. [CrossRef]
- Seto, E.; Yoshida, M. Erasers of histone acetylation: The histone deacetylase enzymes. Cold Spring Harb. Perspect. Biol. 2014, 6: a018713. [CrossRef]
- Liu, P.; Cheng, H.; Roberts, T. M.; Zhao, J. J. Targeting the phosphoinositide 3-kinase pathway in cancer. Nat. Rev. Drug Discov. 2009, 8, 627–644. [CrossRef]
- Vanhaesebroeck, B.; Perry, M. W. D.; Brown, J. R.; André, F.; Okkenhaug, K. PI3K inhibitors are finally coming of age. Nat. Rev. Drug Discov. 2021, 20, 741-769. [CrossRef]
- Qian, C.; Lai, C. J.; Bao, R.; Wang, D. G.; Wang, J.; Xu, G. X.; Atoyan, R.; Qu, H.; Yin, L.; Samson, M.; et al. Cancer network disruption by a single molecule inhibitor targeting both histone deacetylase activity and phosphatidylinositol 3-kinase signaling. Clin. Cancer Res. 2012, 18, 4104–4113. [CrossRef]
- Rodrigues, D. A.; Guerra, F. S.; Sagrillo, F. S.; De Sena M. Pinheiro, P.; Alves, M. A.; Thota, S.; Chaves, L. S.; Sant’Anna, C. M. R.; Fernandes, P. D.; Fraga, C. A. M. Design, Synthesis, and Pharmacological Evaluation of First-in-Class Multitarget N-Acylhydrazone Derivatives as Selective HDAC6/8 and PI3Kα Inhibitors. J. Med. Chem. 2020, 15, 539–551. [CrossRef]
- Guerra, F. S.; Rodrigues, D. A.; Fraga, C. A. M.; Fernandes, P. D. Novel single inhibitor of hdac6/8 and dual inhibitor of pi3k/hdac6 as potential alternative treatments for prostate cancer. Pharmaceuticals 2021, 14:387. [CrossRef]
- Costa, C.M.X.; Aparecida-Silva, C.; Gamba, L.E.R.; de Melo, T.N.; Barbosa, G.; Moraes Junior, M.O.d.; de Oliveira, V.R.T.; de Amorim, C.S.; Moraes, J.A.; Barreiro, E.J.; et al. Design, Synthesis and Phenotypic Profiling of Simplified Gedatolisib Analogues. Pharmaceuticals 2023, 16, 209. [CrossRef]
- Vlietstra, R. J.; van Alewijk, D. C.; Hermans, K. G.; van Steenbrugge, G. J.; Trapman, J. Frequent inactivation of PTEN in prostate cancer cell lines and xenografts. Cancer Res. 1998, 58, 2720–2723.
- 11. Beaver J.A.; Gustin J.P.; Yi K.H.; Rajpurohit A.; Thomas M.; Gilbert S.F.; Rosen D.M.; Ho Park B.; Lauring J. PIK3CA and AKT1 mutations have distinct effects on sensitivity to targeted pathway inhibitors in an isogenic luminal breast cancer model system. Clin. Cancer Res. 2013, 19, 5413-5422. [CrossRef]
- Yang, C. J.; Liu, Y. P.; Dai, H. Y.; Shiue, Y. L.; Tsai, C. J.; Huang, M. S.; Yeh, Y. T. Nuclear HDAC6 inhibits invasion by suppressing NF-kB/MMP2 and is inversely correlated with metastasis of non-small cell lung cancer. Oncotarget 2015, 6, 30263–30276. [CrossRef]
- Hubbert, C.; Guardiola, A.; Shao, R.; Kawaguchi, Y.; Ito, A.; Nixon, A.; Yoshida, M.; Wang, X.; Yao, T. HDAC6 is a microtubule-associated deacetylase. Nature 2002, 417, 455–458. [CrossRef]
- Verdel, A.; Curtet, S.; Brocard, M. P.; Rousseaux, S.; Lemercier, C.; Yoshida, M.; Khochbin, S. Active maintenance of mHDA2/mHDAC6 histone-deacetylase in the cytoplasm. Curr. Biol. 2000, 10, 747–749. [CrossRef]
- Citalingam, K.; Abas, F.; Lajis, N. H.; Othman, I.; Naidu, R. Anti-proliferative effect and induction of apoptosis in androgen-independent human prostate cancer cells by 1,5-bis(2-hydroxyphenyl)-1,4-pentadiene-3-one. Molecules 2015, 20, 3406–3430. [CrossRef]
- Ghasemi, M.; Turnbull, T.; Sebastian, S.; Kempson, I. The MTT Assay: Utility, Limitations, Pitfalls, and Interpretation in Bulk and Single-Cell Analysis. Int. J. Mol. Sci. 2021, 22, 12827. [CrossRef]
- Chou, T.-C.; Talalay, P. Quantitative analysis of dose-effect relationships: the combined effects of multiple drugs or enzyme inhibitors. Adv. Enzyme Regul. 1984, 22, 27–55. [CrossRef]
- 18. Chou, T.-C.; Martin, N. CompuSyn For Drug Combinations: User’s Guide: a computer program for quantitation of synergism and antagonism in drug CompuSyn for drug combinations, and the determination of IC50 and ED50 Values. 2004. CombuSyn. Available online: https://www.combosyn.com/register.html (accessed on 11/01/2024).
- Zhi L.; Can Z.; Ge H.; Yujie W.; Yang W.; Xiaodong M. Identification of PI3K/HDAC Dual-targeted inhibitors with subtype selectivity as potential therapeutic agents against solid Tumors: Building HDAC6 potency in a Quinazolinone-based PI3Kδ-selective template. Bioorganic & Medicinal Chemistry 2022, 73, 117028. [CrossRef]
- Yamada, T.; Horinaka, M.; Shinnoh, M.; Yoshioka, T.; Miki, T.; Sakai, T. A novel HDAC inhibitor OBP-801 and a PI3K inhibitor LY294002 synergistically induce apoptosis via the suppression of survivin and XIAP in renal cell carcinoma. Int. J. Oncol. 2013, 43, 1080–1086. [CrossRef]
- Fortuna, A.; Alves, G.; Soares-da-Silva, P.; Falcão, A. Optimization of a parallel artificial membrane permeability assay for the fast and simultaneous prediction of human intestinal absorption and plasma protein binding of drug candidates: application to dibenz[b,f]azepine-5-carboxamide derivatives. J. Pharm. Sci. 2012, 101, 530–540. [CrossRef]
- Pérez, D. I.; Pistolozzi, M.; Palomo, V.; Redondo, M.; Fortugno, C.; Gil, C.; Felix, G.; Martinez, A.; Bertucci, C. 5-Imino-1,2-4-thiadiazoles and quinazolines derivatives as glycogen synthase kinase 3β (GSK-3β) and phosphodiesterase 7 (PDE7) inhibitors: Determination of blood–brainbarrier penetration and binding to human serum albumin. Eur. J. Pharm. Sci. 2012, 45, 677-684. [CrossRef]
- Peng, S. X.; Strojnowski, M. J.; Hu, J. K.; Smith, B. J.; Eichhold, T. H.; Wehmeyer, K. R.; Pikul, S.; Almstead, N. G. Gas chromatographic-mass spectrometric analysis of hydroxylamine for monitoring the metabolic hydrolysis of metalloprotease inhibitors in rat and human liver microsomes. J. Chromatogr. B. Biomed. Sci. Appl. 1999, 724, 181–187. [CrossRef]
- Singh, A.; Gao, M.; Beck, M. W. Human carboxylesterases and fluorescent probes to image their activity in live cells. RSC Med. Chem. 2021, 12, 1142-1153. [CrossRef]
- Hermant, P.; Bosc, D.; Piveteau, C.; Gealageas, R.; Lam, B.; Ronco, C.; Roignant, M.; Tolojanahary, H.; Jean, L.; Renard, P. Y.; et.al. Controlling Plasma Stability of Hydroxamic Acids: A MedChem Toolbox. J. Med. Chem. 2017, 60, 9067–9089. [CrossRef]
- Halouska, S.; Fenton, R. J.; Zinniel, D. K.; Marshall, D. D.; Barletta, R. G.; Powers, R. Metabolomics analysis identifies d-Alanine-d-Alanine ligase as the primary lethal target of d-Cycloserine in mycobacteria. J. Proteome Res. 2014, 13, 1065–1076. [CrossRef]
- Zhang, J.; Zhong, Q. Histone deacetylase inhibitors and cell death. Cell. Mol. Life Sci. 2014, 71, 3885–3901. [CrossRef]
- McLure, J. A.; Miners, J. O.; Birkett, D. J. Nonspecific binding of drugs to human liver microsomes. Br. J. Clin. Pharmacol., 2000, 49, 453–461. [CrossRef]
- Koyanagi, M.; Kawakabe, S.; Arimura, Y. A comparative study of colorimetric cell proliferation assays in immune cells. Cytotechnology 2015, 68, 1489–1498. [CrossRef]
- Mosmann, T. Rapid Colorimetric Assay for Cellular Growth and Survival: Application to Proliferation and Cytotoxicity Assays. J. lmmunol. Methods. 1983, 65, 55–63. [CrossRef]
- Lan, K.; Verma, S. C.; Murakami, M.; Bajaj, B.; Robertson, E. S. Isolation of Human Peripheral Blood Mononuclear Cells (PBMCs). Curr. Protoc. Microbiol. 2007, A4C.1-A4C.9. [CrossRef]
- Riedhammer, C.; Halbritter, D.; Weissert, R. Peripheral blood mononuclear cells: Isolation, freezing, thawing, and culture. Methods. Mol. Biol. 2015, 1304, 53–61. [CrossRef]
- Kleiveland, C. Peripheral blood mononuclear cells. In: The Impact of Food Bioactives on Health: In Vitro and Ex Vivo Models; Verhoeckx, K., Cotter, P., López-Expósito, I., Kleiveland, C., Lea, T., Mackie, A., Requena, T., Swiatecka, D., Wichers, H., Eds.; Springer Open, 2015, pp. 161–167. [CrossRef]
- 34. Orellana, E.; Kasinski, A. Sulforhodamine B (SRB) Assay in Cell Culture to Investigate Cell Proliferation. Bio-Protocol. 2016, 6, 21. [CrossRef]
- Skehan, P.; Storeng, R.; Scudiero, D.; Monks, A.; Mcmahon, J.; Vistica, D.; Warren, J. T.; Bokesch, H.; Kenney, S.; Boyd, M. R. New Colorimetric Cytotoxicity Assay for Anticancer-Drug Screening. J. Natl. Cancer Inst. 1990, 82, 1107–1112. [CrossRef]
- Vichai, V.; Kirtikara, K. Sulforhodamine B colorimetric assay for cytotoxicity screening. Nat. Protoc. 2006, 1, 1112–1116. [CrossRef]
- Chen, X.; Murawski, A.; Patel, K.; Crespi, C. L.; Balimane, P. V. A Novel Design of Artificial Membrane for Improving the PAMPA Model. Pharm. Res. 2008, 25, 1511–1520. [CrossRef]
- Kansy, M.; Senner, F.; Gubernator, K. Physicochemical High Throughput Screening: Parallel Artificial Membrane Permeation Assay in the Description of Passive Absorption Processes. J. Med. Chem. 1998, 41, 1007–1010. [CrossRef]
- Di, L.; Kerns, E. H.; Fan, K.; McConnell, O. J.; Carter, G. T. High throughput artificial membrane permeability assay for blood–brain barrier. Eur. J. Med. Chem. 2003, 38, 223–232. [CrossRef]
- de Queiroz, A. C.; Barbosa, G.; de Oliveira, V. R. T.; de Mattos Alves, H.; Alves, M. A.; Carregaro, V.; da Silva, J. S.; Barreiro, E.J.; Alezandre-Moreira, M. S.; Lima, L. M. Pre-clinical evaluation of LASSBio-1491: From in vitro pharmacokinetic study to in vivo leishmanicidal activity. PLoS ONE 2022, 17, e0269447. [CrossRef]
- Alves, M. A.; de Queiroz, A. C.; Leite, A. B.; Martins, F. T.; Doriguetto, A. C.; Barreiro, E. J.; Alexandre, M. S.; Lima, L. M. Carbamoyl-N-aryl-imine-urea: a new framework to obtain a putative leishmanicidal drug-candidate. RSC Adv. 2020, 10, 12384–12394. [CrossRef]
- Cabrera, M.; Lavaggi, M. L.; Hernández, P.; Merlino, A.; Gerpe, A.; Porcal, W.; Boiani, M.; Ferreira, A.; Monge, A.; de Cerain, A. L.; et al. Cytotoxic, mutagenic and genotoxic effects of new anti-T. cruzi 5-phenylethenylbenzofuroxans. Contribution of phase I metabolites on the mutagenicity induction. Toxicol. Lett. 2009, 190, 140–149. [CrossRef]
- Gardner, I.; Xu, M.; Han, C.; Wang, Y.; Jiao, X.; Jamei, M.; Khalidi, H.; Kilford, P.; Neuhoff, S.; Southall, R.; et al. Non-specific binding of compounds in in vitro metabolism assays: a comparison of microsomal and hepatocyte binding in different species and an assessment of the accuracy of prediction models. Xenobiotica 2022, 52, 943-956. [CrossRef]
- Obach, R. S.; Baxter, J. G.; Liston, T. E.; Silber, B. S.; Jones, B. C. The Prediction of Human Pharmacokinetic Parameters from Preclinical and In Vitro Metabolism Data. J. Pharmacol. Exp. Ther. 1997, 283, 46–58.
Figure 1.
(A) Structure of the dual PI3K and HDACs inhibitors CUDC-097; (B) Design conception of LASSBio-2208 as a hybrid between PI-103 and LASSBio-1911.
Figure 1.
(A) Structure of the dual PI3K and HDACs inhibitors CUDC-097; (B) Design conception of LASSBio-2208 as a hybrid between PI-103 and LASSBio-1911.
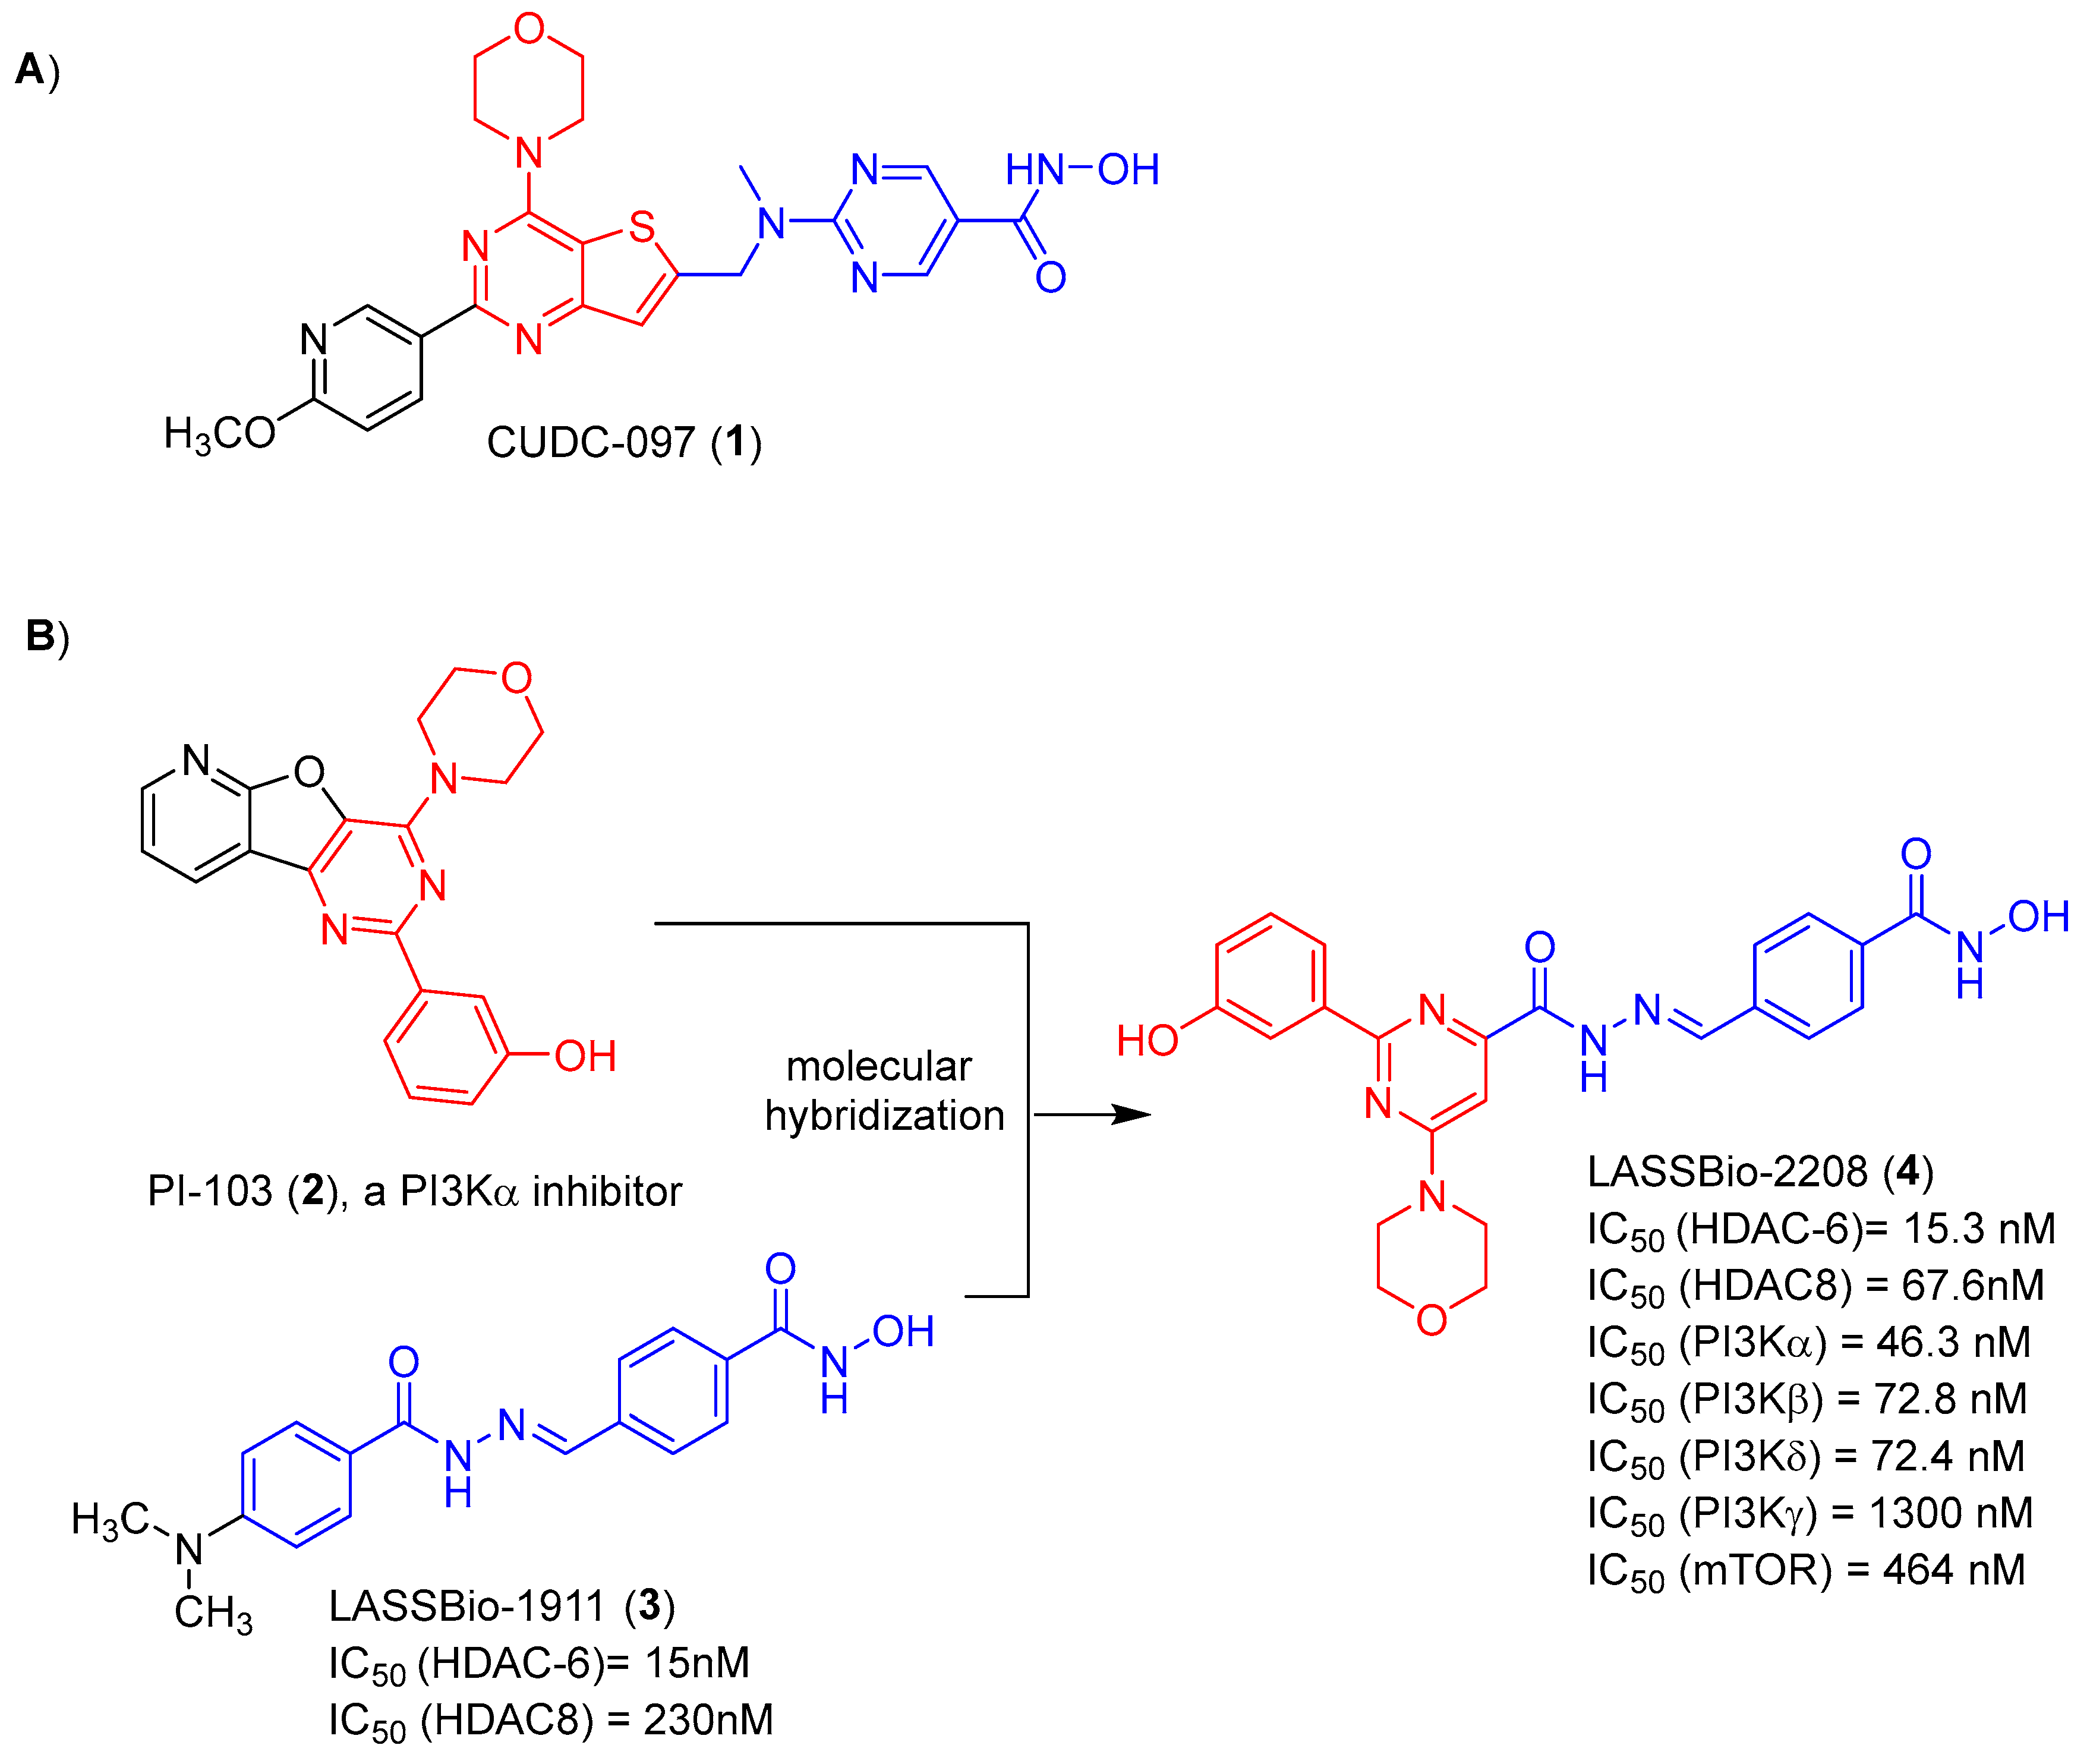
Table 1.
CC50 values of the standards gedatolisib, tubastatin A and LASSBio-1911 in the MTT viability assay at 24h, 48h and 72h.
Table 1.
CC50 values of the standards gedatolisib, tubastatin A and LASSBio-1911 in the MTT viability assay at 24h, 48h and 72h.
| Cell line | Gedatolisib CC50 (µM) |
Tubastatin A CC50 (µM) |
LASSBio-1911 CC50 (µM) |
|
|---|---|---|---|---|
| 24 h | PC-3 | >50 (26.49 – 149.4) Emax = 48% |
>100 Emax = 41.8% |
>100 Emax = 26.4% |
| MCF-7 | 5.04 (2.86 – 8.88) Emax = 79.9% |
>100 Emax = 40.1% |
>100 Emax = 21.6% |
|
| CCRF-CEM | 0.31 (0.24 – 0.41) Emax = 98.6% |
12.51 (5.95 – 26.31) Emax = 95.8% |
9.69 (8.07 – 11.64) Emax = 98% |
|
| MOLT-4 | 0.35 (0.25 – 0.47) Emax = 97.2% |
5.67 (3.95 – 8.12) Emax = 94.6% |
13.75 (2.55 – 74.05) Emax = 96.5% |
|
| 48 h | PC-3 | 5.05 (2.59 – 9.82) Emax = 60.5% |
65.94 (57.29 – 75.88) Emax = 67.8% |
>100 Emax = 42.6% |
| MCF-7 | 0.21 (0.13 – 0.34) Emax = 96.8% |
>100 Emax = 48.2% |
42.62 (30.76 – 59.05) Emax = 65.4% |
|
| CCRF-CEM | 0.085 (0.07 – 0.11) Emax = 99.5% |
9.38 (5.18 – 17.03) Emax = 99.1% |
6.98 (4.28 – 11.37) Emax = 98.8% |
|
| MOLT-4 | 0.08 (0.07 – 0.11) Emax = 99.3% |
7.50 (5.79 – 9.70) Emax = 98.2% |
6.15 (4.24 – 8.90) Emax = 98.9% |
|
| 72 h | PC-3 | 0.86 (0.59 – 1.25) Emax = 81.1% |
34.89 (30.83 – 39.47) Emáx = 83.6% |
77.10 (63.96 – 92.95) Emax = 59.2% |
| MCF-7 | 0.06 (0.04 – 0.08) Emax = 99.3% |
83.56 (70.22 – 99.42) Emax = 56.8% |
38.43 (31.37 – 47.06) Emax = 75.4% |
|
| CCRF-CEM | 0.09 (0.08 – 0.11) Emax = 100% |
7.11 (3.32 – 15.19) Emax = 99.3% |
6.92 (2.97 – 16.08) Emax = 97.1% |
|
| MOLT-4 | 0.07 (0.06 – 0.08) Emax = 99.8% |
5.65 (3.51 – 9.09) Emax = 98.7% |
5.27 (3.45 – 8.03) Emax = 99.2% |
Data expressed at 95% confidence interval. Emax represents the maximum effect of the compound at its maximum concentration used.
Table 2.
CC50 values of the 24h, 48h and 72h MTT viability assay of LASSBio-2208.
| Cell line | LASSBio-2208 CC50 (µM) 24 h |
LASSBio-2208 CC50 (µM) 48 h |
LASSBio-2208 CC50 (µM) 72 h |
|---|---|---|---|
| PC-3 | >100 Emax = 18.4% |
>100 Emax = 39.3% |
>100 Emax = 42.1% |
| MCF-7 | >100 Emax = 29.5% |
31.71 (19.45 – 51.69) Emax = 57.3% |
23.0 (15.50 – 34.14) Emax = 60.7% |
| CCRF-CEM | 27.75 (21.70 – 35.50) Emax = 69.4% |
8.68 (6.99 – 10.30) Emax = 91.7% |
8.54 (6.30 – 11.57) Emax = 90.4% |
| MOLT-4 | 7.14 (3.51 – 14.54) Emax = 84.1% |
8.26 (5.82 – 11.71) Emax = 83.2% |
7.15 (5.20 – 9.81) Emax = 91.2% |
Data expressed at 95% confidence interval. Emax represents the maximum effect of the compound at its maximum concentration used.
Table 3.
CC50 values and Selectivity Index (SI) of LASSBio-1911, tubastatin A and LASSBio-2208 on hPBMC and on human tumour cell lines PC-3, MCF-7, MOLT-4 and CCRF-CEM, determined in the MTT assay of 48h.
Table 3.
CC50 values and Selectivity Index (SI) of LASSBio-1911, tubastatin A and LASSBio-2208 on hPBMC and on human tumour cell lines PC-3, MCF-7, MOLT-4 and CCRF-CEM, determined in the MTT assay of 48h.
| Cell line | LASSBio-1911 | Tubastatin A | LASSBio-2208 | |||
|---|---|---|---|---|---|---|
| CC50 (µM) 48 h |
SI | CC50 (µM) 48 h |
SI | CC50 (µM) 48 h |
SI | |
| Human PBMC | >100 Emax = 31.1% |
N.A. | 85.66 (39.7 – 184.8) Emax = 58.2% |
N.A. | >100 Emax = 29.9% |
N.A. |
| PC-3 | >100 Emax = 42.6% |
N.D. | 65.94 (57.29 – 75.88) Emax = 67.8% |
1.29 | >100 Emax = 39.3% |
N.D. |
| MCF-7 | 42.62 (30.76 – 59.05) Emax = 65.4% |
N.D. | >100 Emax = 48.2% |
N.D. | 31.71 (19.45 – 51.69) Emax = 57.3% |
N.D. |
| MOLT-4 | 6.15 (4.24 – 8.90) Emax = 98.9% |
N.D. | 7.50 (5.79 – 9.70) Emax = 98.2% |
11.42 | 8.26 (5.82 – 11.71) Emax = 83.2% |
N.D. |
| CCRF-CEM | 6.98 (4.28 – 11.37) Emax = 98.8% |
N.D. | 9.38 (5.18 – 17.03) Emax = 99.1% |
9.13 | 8.68 (6.99 – 10.30) Emax = 91.7% |
N.D. |
Data expressed at 95% confidence interval. Emax represents the maximum effect of the compound at its maximum concentration used. SI.: Selectivity index, N.A.: Not applicable, N.D.: Not determined.
Table 4.
CC50 values calculated from cell viability tests on immortalized PC3, MCF-7, CCRF-CEM and MOLT-4 cell lines using the SRB test (48-hour incubation).
Table 4.
CC50 values calculated from cell viability tests on immortalized PC3, MCF-7, CCRF-CEM and MOLT-4 cell lines using the SRB test (48-hour incubation).
| Cell line | Gedatolisib CC50 (µM) |
LASSBio-1911 CC50 (µM) |
Tubastatin A CC50 (µM) |
LASSBio-2208 CC50 (µM) |
|---|---|---|---|---|
| PC-3 | 6.16 (1.42 – 26.7) Emax = 56.2% |
>100 Emax = 34.04% |
>100 Emax = 39.3% |
98.93 (85.02 – 115.1) Emax = 51.4% |
| MCF-7 | 0.03 (0.01 – 0.06) Emax = 95.7% |
39.14 (29.36– 52.17) Emax = 86.9% |
66.01 (57.45– 75.95) Emax = 71.2% |
5.44 (3.15– 9.41) Emax = 67.4% |
| MOLT-4 | 3.68 (2.04– 6.62) Emax = 69.2% |
53.09 (34.03– 82.84) Emax = 61% |
10.45 (1.43– 76.18) Emax = 54.4% |
>100 |
| CCRF-CEM | 0.78 (0.25 – 2.37) Emax = 66.2% |
25.18 (16.61 – 38.18) Emax = 69.2% |
9.69 (4.39 – 21.39) Emax = 69.5% |
>100 |
Data expressed at 95% confidence interval. Emax represents the maximum effect of the compound at its maximum concentration used.
Table 5.
Combination index (CI) determined from the combination of gedatolisib, LASSBio-1911, tubastatin A and LASSBio-2208 in CCRF-CEM using the MTT assay at 48h of incubation.
Table 5.
Combination index (CI) determined from the combination of gedatolisib, LASSBio-1911, tubastatin A and LASSBio-2208 in CCRF-CEM using the MTT assay at 48h of incubation.
| Combinations: X×CC50 (A) + X×CC50 (B) |
Gedatolisib (A) + LASSBio-1911 (B) |
Gedatolisib (A) + Tubastatin A (B) |
Gedatolisib (A) + LASSBio-2208 (B) |
LASSBio-2208 (A) + LASSBio-1911 (B) |
Tubastatin A (A) + LASSBio-2208 (B) |
|---|---|---|---|---|---|
| X = 0.25 | Moderate antagonism (CI = 1.25) |
Nearly additive (CI = 1.05) |
Moderate antagonism (CI = 1.24) |
Moderate antagonism (CI = 1.23) |
Slight synergism (CI = 0.86) |
| X = 0.5 | Moderate antagonism (CI =1.27) |
Moderate antagonism (CI =1.32) |
Slight synergism (CI = 0.89) |
Moderate synergism (CI = 0.81) |
Antagonism (CI =1.53) |
| X = 1 | Nearly additive (CI = 0.96) |
Synergism (CI = 0.48) |
Synergism (CI = 0.63) |
Synergism (CI = 0.56) |
Synergism (CI = 0.38) |
| X = 2 | Synergism (CI = 0.53) |
Synergism (CI = 0.51) |
Synergism (CI = 0.33) |
Synergism (CI = 0.61) |
Synergism (CI = 0.48) |
| X = 4 | Moderate synergism (CI = 0.77) |
Nearly additive (CI = 1.01) |
Strong synergism (CI = 0.15) |
Nearly additive (CI = 0.96) |
Nearly additive (CI = 0.97) |
CI: Combination index. (A) and (B) are the compounds that were combined in “X×CC50” proportion.
Table 6.
Combination index (CI) determined for the combination of the compounds gedatolisib, LASSBio-1911, tubastatin A and LASSBio-2208 in the immortalized MOLT-4 cell lines using the MTT assay (48-hour incubation).
Table 6.
Combination index (CI) determined for the combination of the compounds gedatolisib, LASSBio-1911, tubastatin A and LASSBio-2208 in the immortalized MOLT-4 cell lines using the MTT assay (48-hour incubation).
| Combinations: X×CC50 (A) + X×CC50 (B) |
Gedatolisib (A) + LASSBio-1911 (B) |
Gedatolisib (A) + Tubastatin A (B) |
Gedatolisib (A) + LASSBio-2208 (B) |
LASSBio-2208 (A) + LASSBio-1911 (B) |
Tubastatin A (A) + LASSBio-2208 (B) |
|---|---|---|---|---|---|
| X = 0.25 | Moderate antagonism (CI = 1.21) |
Moderate synergism (CI = 0.72) |
Moderate synergism (CI = 0.77) |
Moderate antagonism (CI = 1.28) |
Strong antagonism (CI = 3.69) |
| X = 0.5 | Nearly additive (CI = 0.91) |
Synergism (CI =0.69) |
Slight synergism (CI = 0.65) |
Slight antagonism (CI = 1.18) |
Nearly additive (CI =1.02) |
| X = 1 | Synergism (CI = 0.49) |
Synergism (CI = 0.41) |
Synergism (CI = 0.44) |
Synergism (CI = 0.54) |
Synergism (CI = 0.53) |
| X = 2 | Synergism (CI = 0.54) |
Moderate synergism (CI = 0.80) |
Synergism (CI = 0.34) |
Synergism (CI = 0.64) |
Slight synergism (CI = 0.87) |
| X = 4 | Nearly additive (CI = 1.03) |
Antagonism (CI = 1.59) |
Synergism (CI = 0.47) |
Moderate antagonism (CI = 1.31) |
Antagonism (CI = 1.86) |
CI: Combination index. (A) and (B) are the compounds that were combined in “X×CC50” proportion.
Table 8.
Pharmacokinetic parameters calculated for the plasma stability assay to LASSBio-2208 and LASSBio-1911.
Table 8.
Pharmacokinetic parameters calculated for the plasma stability assay to LASSBio-2208 and LASSBio-1911.
| Compounds | Metabolization rate (%) | Elimination rate constant (k) | t1/2 (min) | Recovery (%) |
|---|---|---|---|---|
| LASSBio-2208 | 20.61 | 0.0008 | 866.25 | 75.47 |
| LASSBio-1911 | 36.14 | 0.0018 | 385.00 | 73.36 |
Table 10.
Determination of the unbound fraction (ƒu(mic)) in the nonspecific microsomal binding.
| Compounds | Percentage of ƒu(mic) |
|---|---|
| Tolbutamide* | 1.113 |
| LASSBio-2208 | 0.937 |
| LASSBio-1911 | 0.004 |
| Gedatolisib | 0.503 |
| Tubastatin A | 0.131 |
*Literature value: 0.97 [28].
Disclaimer/Publisher’s Note: The statements, opinions and data contained in all publications are solely those of the individual author(s) and contributor(s) and not of MDPI and/or the editor(s). MDPI and/or the editor(s) disclaim responsibility for any injury to people or property resulting from any ideas, methods, instructions or products referred to in the content. |
© 2024 by the authors. Licensee MDPI, Basel, Switzerland. This article is an open access article distributed under the terms and conditions of the Creative Commons Attribution (CC BY) license (http://creativecommons.org/licenses/by/4.0/).
Copyright: This open access article is published under a Creative Commons CC BY 4.0 license, which permit the free download, distribution, and reuse, provided that the author and preprint are cited in any reuse.


