Introduction
Drosophila suzukii Matsamura (Diptera: Drosophilidae) is a polyphagous, commercially relevant pest of thin-skinned fruits and berries. The first reports of the fly originate from Japan, where it was observed as early as 1916 (Kanzawa 1939). In the last 15 to 20 years, the area of distribution of the insect has expanded dramatically and the fly is now present in large parts of North America and Europe, including Austria (Hauser, 2011; Cini et al., 2012). D. suzukii thus fulfils the definition of a neozoon as an animal that is not indigenous to a particular area and arrived there with the help of humans after 1492 AD (the year of the discovery of America) and lives or has lived here without human care (Essl & Rabitsch, 2002, modified).
The females of D. suzukii have a strong, serrated ovipositor with which they can slit the skin of healthy, undamaged berries and fruits and lay their eggs underneath. The larvae that develop from these eggs feed on the fruit flesh under the skin, which leads to extensive fruit decay; this also causes significant secondary damage from other pests such as further vinegar fly species, fungi and bacteria. The reproductive potential of the fly is considerable. There can be 10-15 generations per year, with each female laying an average of 380 eggs, which means that very large populations can build up in a short time under favourable climatic conditions (Walsh et al., 2011).
The host species, their varieties and the stage of ripeness influence the attractiveness for the flies, as well as the suitability for oviposition and larval development (Burrack et al., 2013). In addition to cultivated plants, many wild plant species and cultivated ornamental plants serve as hosts. Tiefenbrunner et al. (2017) observed a higher abundance of D. suzukii adults on forest edges compared to vineyards. The forest probably plays an important role for overwintering (Pelton et al. 2016); fly reproduction in mistletoe berries in winter and spring has already been demonstrated (Briem et al., 2016).
Observations by Saguez et al. (2013) and Van Timmeren and Isaacs (2014) indicate that the dipteran species is able to complete its life cycle on the grapevine (wine and table grapes). According to Lee et al. 2016, the probability of oviposition increases when the fruit skin resistance to ovipositor penetration force decreases and the pH increases during ripening. Ioriatti et al. (2015) investigated the infestation potential of D. suzukii on grape berries and found that the risk of oviposition during ripening increased with increasing sugar content and decreasing values of acidity, skin resistance and, in agreement with the latter, skin hardness. Skin hardness was identified as a critical component in the host selection of D. suzukii among grape varieties. The authors concluded that although grapevine berries are in most cases not an ideal host for the development of D. suzukii, the species poses a serious threat to grape and wine production. In line with this finding, Entling et al. (2018) identified berry skin resistance as a key factor in oviposition preference between cultivars.
Ioratti et al (2018) pointed out that the presence of D. suzukii, but especially the oviposition of this species, increases the concentration of acetic acid bacteria on berries exponentially. The infestation of grapes with D. suzukii also facilitates the proliferation of D. melanogaster, another diptera that spreads acetic acid bacteria by seeking out the damaged berries to lay its eggs. The same applies to the closely related D. simulans (the females can only be distinguished eidonomically by a marking on the mesonotum, although the marking is only well developed in autumn animals), which is often more common in the vineyard than D. melanogaster. This could be due to the fact that D. simulans prefers more exposed habitats compared to D. melanogaster and is less sensitive to direct sunlight (David et al. 2004). D. simulans is considered to be somewhat more heat-loving and becomes rarer in Central Europe towards the north (Bächli & Burla 1985).
Attractants are often used to monitor populations in vineyards, as the sense of smell is very well developed in Drosophila (Vosshall et al. 2000, Couto et al. 2005, Franco et al. 2011, Saberi & Seyed-Allaei 2015). In addition to commercially available ones, mixtures of apple cider vinegar and red wine (and possibly acetone) have also been suggested. Tiefenbrunner & Tiefenbrunner 2017 compared the efficiency of different attractants that were applied in bottle traps at the boundary between forest and vineyard in autumn for a period of one week in one to three replicates. Different grape juices from Vitis vinifera (Traminer from two vineyards, Welschriesling and Pinot Noir) and interspecies hybrid vines (Ripatella and Delaware) were compared, as well as red wine and “Uhudler” (= wine of hybrid vines), plus alcohol (10%) and vinegar (5%). The interspecies hybrid grape juice and wine were used because of the content of methyl anthranilate, which is used as a bird repellent and may also deter D. melanogaster (Kain et al. 2013) and is also thought to be effective against D. suzukii. The trap arrangement was similar to that described in the methods section.
The authors observed that not a single individual of the 1164 Drosophila specimens caught in the attractant traps was found in the alcohol (10%) and vinegar (5%). The conclusion is that these substances are not attractive in the concentration used or perhaps even act as repellents. An above-average number of Drosophilidae were found in the Uhudler grape juice attractant traps, for D. suzukii these were comparable to the White Burgundy grape juice traps, for D. subobscura and D. melanogaster/D. simulans they even had a significantly higher attractiveness than the latter. The authors concluded that the methyl anthranilate contained in Uhudler grape juice showed no repellent effect, although Kain et al. 2013 characterised several anthranilates (ethyl-, butyl- and methyl N,N-dimethyl-) as potential repellents for D. melanogaster. It is also worth mentioning that Renkema et al. 2016 recognised peppermint and thyme oil as repellents for D. suzukii.
Grape juice or wine appeared to be about equally attractive to D. suzukii and D. melanogaster. Keesey et al. 2015, on the other hand, observed that both species prefer the odour of fermented fruit to that of fresh fruit.
Many species of the genus Drosophila feed on yeast cells as adults (including D. melanogaster, D. simulans and D. suzukii) and therefore, in connection with the observation described above, the question arises as to whether berry or fruit juice is more attractive during fermentation than before or after the fermentation process. The experiment described below is intended to clarify this.
The experiments were already carried out in 2019, but the pandemic delayed the evaluation of the results.
Method
Location of the attractant traps and experimental set-up: To the north of Eisenstadt (Austria, Burgenland), between a very young vineyard and a forest immediately to the east of it, 25 attractant traps were applied after the autumn harvest in series at intervals of ca. half a metre along a wildlife protection fence (
Figure 1). There were some wild cherries in the mixed deciduous tree population and nearby blackberries underneath a neighbouring high-voltage power line. There was a fairly high shrub layer in the immediate vicinity of the fence, so the traps were placed at a height just above this layer so that the attractant was 85 cm above the ground, with the "entrance holes" of the traps slightly higher still. The GPS coordinates of the location are N 47.857°, E 16.521°.
Attractant traps: Plastic bottles 15cm high and 6cm in diameter were used, into which 30 holes with a cross-section of 3mm had been drilled at a height of 8cm and 9cm respectively. Immediately before the start of the experiment, 75ml of the attractant was poured in. The traps remained in place for two to three days (they were emptied either in the late afternoon of the second or early morning of the third) per trial date, whereby three dates were used:
- 1)
02.10.2019 – 04.10.2019.
- 2)
16.10.2019 – 17.10.2019
- 3)
23.10.2019 – 24.10.2019
A total of five attractant variants were used in a fivefold repetition (= five blocks). Due to a possible neighbourhood effect of the traps in the series, all variants were used within a block (five adjacent traps), but the sequence of the variants was changed randomly from one block to the next (with five intensively shuffled cards). The result is shown in
Figure 2.
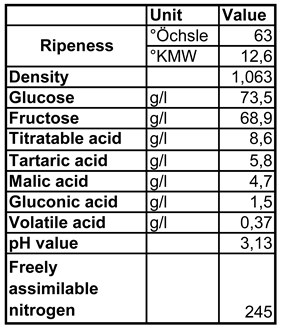
Attractant: A Pinot Blanc grape juice with the basic characterisation shown in
Table 1 was inoculated in a 2l Erlenmayer flask with the
Saccharomyces cerevisiae pure culture yeast Pannonia (EGH 2, Lallemand GmbH), initiating the fermentation, which was carried out at a constant temperature of 20°C.
During the first 20 days of fermentation, 50ml samples were taken daily from this Erlenmayer flask for gas chromatographic analysis. At the same time, the same grape juice was fermented with the same yeast in 300ml conical flasks, with the start of fermentation staggered by two days in order to produce the five test variants. The start of fermentation for the three test dates was as follows (
Table 2):
The weather at the time the experiment was carried out at the trial location: For a field trial, knowledge of the weather data during the trial period is of course important. The data comes from the Eisenstadt/Northeast climate station (1.39 km from the trial location) of the Central Institute for Meteorology and Geodynamics (ZAMG) and is summarised in
Table 3:
During the first trial, average temperatures were between 11°C and 15°C with a range of 7°C to 18°C, it rained lightly on the first day of the trial and the humidity was correspondingly high (90%). After that there was no more precipitation and the humidity dropped to around 50%. The wind speed was moderate to slightly problematic at 6km/h to 28km/h and the cloud cover was high on the first two days (at 2pm).
At the time of the second trial, the daily mean temperature was 14°C to 15°C, with a range of 7°C to 21°C. Humidity was below 50%, there was very little precipitation, wind strength was low and cloud cover was around 50%.
On the third trial, temperatures were higher, between 17°C and 19°C, with a range of 10°C to 25°C. There was no rain on either day and humidity was only above 50% on the first day (about 70%). The wind strength was somewhat problematic on the second day (from the point of view of a very small flying animal). Cloud cover was 100% on the first trial day (at 2 pm), whereas the sky was clear on the second day.
Identification of the Drosophildae: The determination was mainly based on Bächli & Burla 1985, but Markow & O'Grady 2006 was also used. A binocular (Stemi 2000-C; Zeiss, Oberkochen, Germany) was used to recognise the characteristics described in the identification keys.
Analysis of the aroma composition of the fermenting grape juice: A gas chromatography-mass spectrometry system, quadrupole mass spectrometer from Shimadzu Austria (Korneuburg, Austria) GC/MS QP2010, Ultra, was used to analyse the volatile aroma components of the fermenting grape juice. A polar capillary column from Zebron (Aschaffenburg, Germany), ZB-WAX plus, length 60m, film thickness 0.50μm, inner diameter 0.25mm, was used as the separation column.
Analyte enrichment was performed by solid phase microextraction (SPME). An 8 ml sample was used and mixed with internal standard (3-decanol). After equilibration (40°C/5 minutes) in the autosampler from CTC Analytics (Zwingen, Switzerland), the adsorption of analyte molecules on the SPME fibre (a 2cm long C/DVB/PDMS fibre carboxene/divinylbenzene/polydimtheylsiloxane, 50μm/30μm) in the gas phase (headspace analysis) was carried out for 30 minutes. This was followed by the actual analysis. The injector temperature was held at 50°C for 3 minutes before being increased by 4°C per minute to 180°C and then to 230°C at a rate of 25°C/min and then held at this temperature for a further 7.5 minutes. The entire cycle lasted 45 minutes. Helium was used as the carrier gas at a constant flow rate of 1.0 ml/min. The result of this procedure is not the concentrations of the flavour components, but their specific ion trace (mass fragment) areas (SIM areas). 68 flavour-active substances were investigated.
Statistical analysis: In order to compare the frequencies of the Drosophila species in the attractant traps for the different variants, ANOVA and Multiple Range Test (95% LSD) were carried out as parametric test procedures. Statgraphics Centurion Version XV (Statgraphics Technologies, Inc., Virginia, USA) offers the Levene test, among others, to check the test requirement 'homogeneity of variance'. To check whether the data are normally distributed, the skewness and excess of the sample were examined. Both must lie within a specified range that is consistent with the normal distribution. If one of the two test requirements was not met, the result of the Kruskal-Wallis test was taken into account, and, alternatively, data transformation of the type y=ln(x+1) was performed and the procedure was repeated. If this also failed to fulfil the test requirements for the parametric test procedures, a random-resample rank test was carried out in addition to the Kruskal-Wallis test to compare the variants in pairs. The analysis was used both for data pooled across all test dates (75) and for those of a single date (25 each), as well as either for the species as a whole or the single species. In the second case the analysis was carried out separately for the sexes and for both together as well.
Principal component analysis was used to investigate the flavour composition of the must at different stages of fermentation.
Results
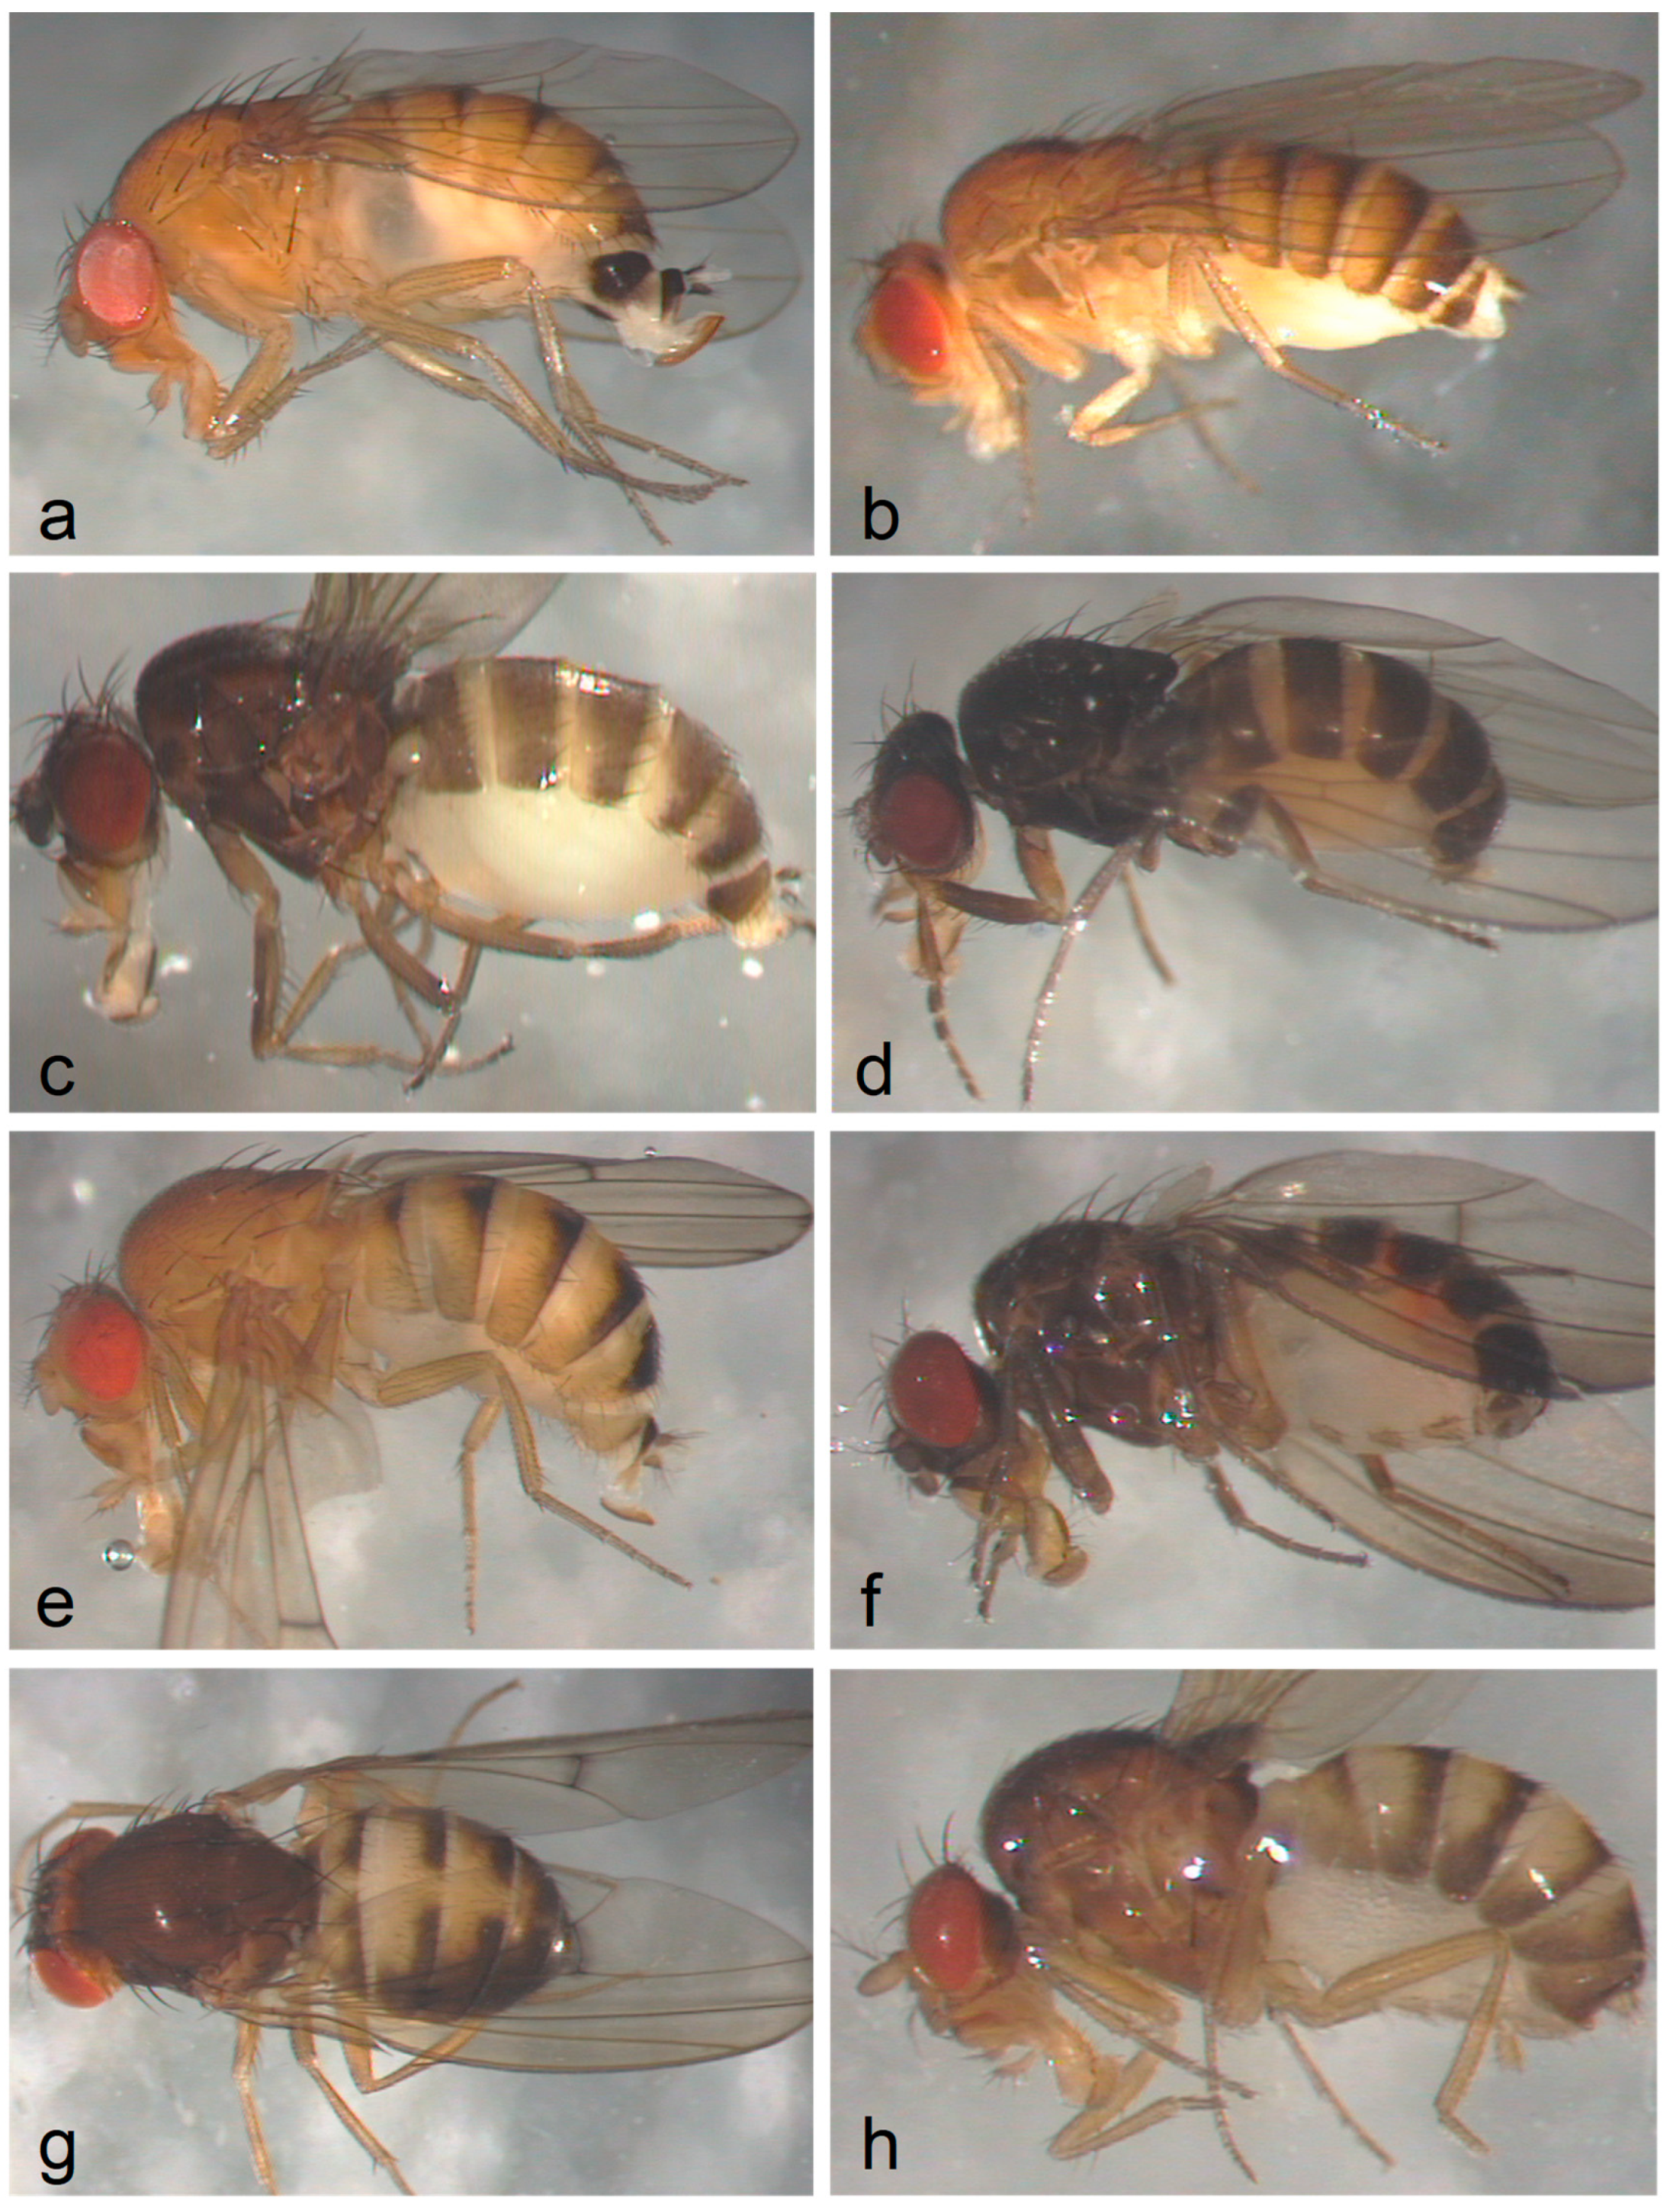
Drosophilidae species: During the first experimental period, seven species of the genus Drosophila were captured, D. immigrans (one female individual), D. kuntzei (3 specimens; 1 ♂, 2 ♀), D. melanogaster (5 ♂), D. obscura (2 ♂), D. simulans (142 specimens, 64 ♂ and 78 ♀), D. subobscura (10; 3 ♂, 7 ♀) and D. suzukii (136 individuals, of these 58 ♂ and 78 ♀).
Within the time span of the second experiment, six species were found, D. kuntzei (12; 3 ♂, 9 ♀), D. melanogaster (12; 9 ♂, 3♀), D. simulans (58; 28 ♂ and 30 ♀), D. subobscura (34; 15 ♂, 19 ♀), D. suzukii (209; 92 ♂ and 117 ♀) and D. testacea (5; 3 ♂, 2 ♀).
The following six species were detected in the third experiment:
D. kuntzei (4; 3 ♂, 1 ♀),
D. melanogaster (2; 1 ♂, 1♀),
D. simulans (51; 25 ♂ and 26 ♀),
D. subobscura (6; 6 ♀),
D. suzukii (42; 19 ♂ and 23 ♀) and
D. tristis (1♂). A total of nine species were caught (
Figure 3).
A sufficient number of individuals for a statistical analysis was only available for the two species
D. simulans and
D. suzukii, which, apart from
D. melanogaster, are also the species of greatest importance for wine production. For
D. simulans, the first test date is particularly important, as more individuals were caught here than in the other two combined. The sex ratio is relatively balanced, with slightly more females caught overall. Most individuals of
D. suzukii were collected on the second date and the females clearly predominated. However, almost the same number of individuals of
D. suzukii were caught on the first date as of
D. simulans.
D. suzukii is therefore the most common species in the traps overall, but not necessarily in the habitat, as the attractant traps were presumably differently appealing to the different species. The comparison of the arithmetic mean in
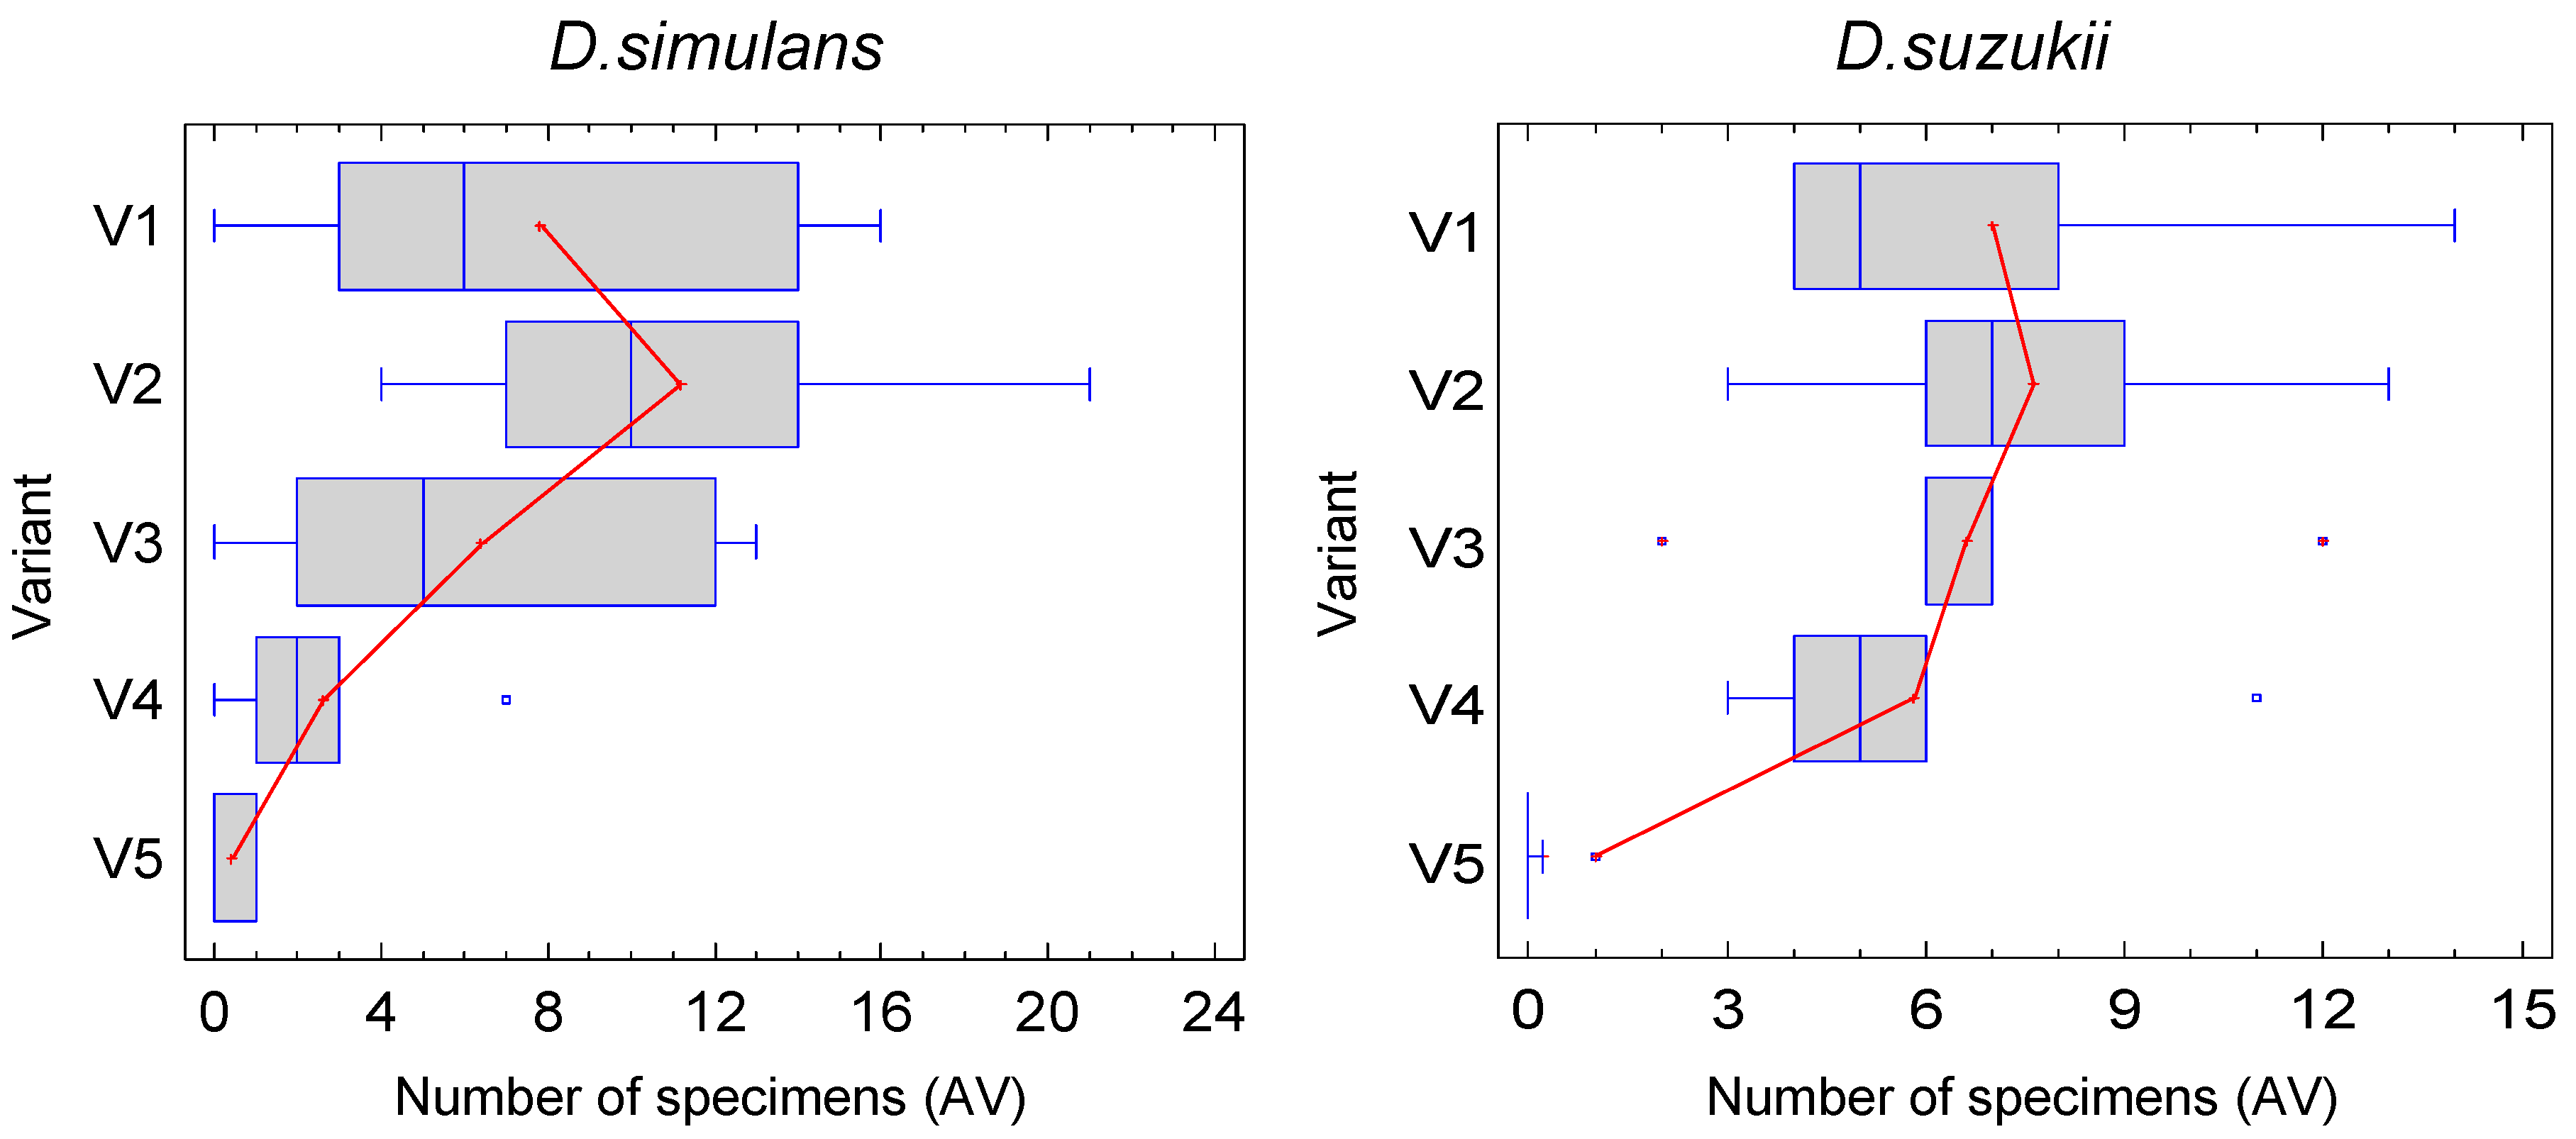
Figure 4 suggests for the two most common species that the number of individuals caught and thus presumably the attractiveness of the attractant increases with increasing fermentation time up to the eighth day, after which there tends to be a decrease.
However, the figures also show that the range of variation is quite high and the difference between the median and arithmetic mean is often significant, which indicates that the data are often not normally distributed. A precise statistical analysis is therefore required, the results of which are presented in the supplement and summarised in the following. Females and males should also be analysed separately, because although both are searching for food, males are also actively searching for females and mated females for laying sites, i.e. different preferences may exist.
Comparison of the variants for all species and all dates: A total of five replicates per variant, five variants and three dates are available, i.e. the sample consists of 75 data and 15 per variant. In variant 5 (V5) an average of 2.53 individuals were collected, in variant 4 (V4) an average of nine and in the others an average of more than 11.6 specimens. According to ANOVA, there is a highly significant difference between the variants (Supplement 1), the Multiple Range Test (95% LSD) recognises two homogeneous groups, V5 on the one hand and all others on the other, i.e. V5 differs from all other variants at the significance level of 0.05.
The mean number of males per variant is of course lower, 1.2 for V5, between 4.13 and 4.87 for V1, V3 and V4. V2 has the most males per sample with an average of 7.13. In general, there is a highly significant difference between the variants (ANOVA), with V5 differing significantly from all others, as well as V2 from V4.
The mean value of captured females for V5 is 1.33, for V4 five and for all others 6.8 or more. ANOVA shows a highly significant difference and the Multiple Range Test shows that V5 differs significantly from all other variants. A total of 735 individuals were caught.
Comparison of the variants for all species at the first date: the sample size here is 25. The mean number of individuals per sample is less than one for V5, nine for V4 and more than 13.8 for all others, with V2 representing the highest value with an average of more than 20 specimens per sample. With p=0.0, ANOVA recognises an extremely clear difference between the variants, with V5 differing significantly from all other variants, V2 additionally from V4.
In V5 no males of Drosophila sp. were caught, in V4 on average 3.8, in V3 about five, in V4 seven and in V2 10.6. According to ANOVA (p=0.0) the variants differed highly significantly from each other, V5 significantly from all others, furthermore V2 from V3 and V4 (Multiple Range Test).
V5 traps contained on average less than one female, V4 on average 5.4, V3 and V1 8.6 and V2 ten individuals. The variants differed highly significantly (ANOVA p=0.0004), although only V5 stood out clearly from the others (multiple mean comparison for transformed data).
A total of 299 individuals were collected on the first date.
Comparison of the variants for all species at the second date: The sample size is 25. On average, three specimens were caught in the V5 traps on this date, and 15 to more than 16 in the others. ANOVA and multiple mean comparison show that V5 differs highly significantly from all other variants. This difference between the variants also remains when males and females are considered separately. 330 individuals were caught on the second date in all samples.
Comparison of the variants for the species as a whole on the third date: 25 sample values are available. The lowest average number of individuals on this date was not found in V5 (four specimens), but in V4 (2.2 individuals), although the highest number was again found in V2 (6.2 individuals on average). According to ANOVA, however, this difference is not significant (p=0.055 for transformed data). This contradicts the Multiple Range Test, which found a significant difference between V1 and V2, V2 and V4, and V3 and V4.
The discrepancy in the test results is also evident if only the males are considered. According to ANOVA, p=0.28 (for transformed data p=0.14), i.e. clearly not significant, while the Multiple Range Test recognises a significant difference between V2 and V4.
As far as the females are concerned, however, there is no contradiction in the evaluation of the two test methods; there is no significant difference between the variants.
On the third date, a total of 106 individuals belonging to the genus Drosophila were found in all samples.
Of this species, 142 specimens were caught on the first test date, 58 on the second and 51 on the third (total: 251).
Comparison of the variants for D. simulans and all dates ("pooled" data): The sample size is 75, with variant 5 having the lowest mean number of individuals (0.8) and V2 the highest, with more than an average of six specimens per sample. V4 is slightly below V3 and V1 in terms of the mean number of individuals. ANOVA indicates a very significant difference between the variants (p=0.0016 for transformed data). V5 differs significantly from V1 to V3, and additionally V2 from V4.
As the data concerning the males of this species are neither normally distributed nor homogeneous in variance (not even the transformed ones), the Kruskal-Wallis test is used here. The variants accordingly differ significantly (p=0.001). The random-resample rank test for the pairwise comparison indicates significant differences for V1 vs. V5 (p=0.011), V2 vs. V3 (p=0.021), V2 vs. V4 (p=0.01) and V2 vs. V5 (p=0.0). Here, too, V2 (particularly high values) and V5 (particularly low) are clearly different from the others.
The variants also differ significantly with regard to the females (ANOVA p=0.033 for transformed data). Significant differences are found after the Multiple Range Test for all variants compared to V5 with the exception of V4.
Comparison of the variants for D. simulans at the first date: The sample size is 25 for five variants. The mean number of individuals caught per trap differs greatly between the variants; it is less than one specimen in V5 and more than eleven specimens in V2 (
Figure 3). The difference is significant (ANOVA p=0.011 for transformed data). The Multiple Range Test recognises significance between V5 and V1 to V3 on the one hand and between V2 and V4 on the other.
Not a single male was caught in the V5 traps, whereas an average of 6.6 were caught in those of V2. The variants differed significantly in terms of frequency (ANOVA for transformed data p=0.0018). Pair differences that are statistically significant are found for V5 and V1 to V3 on the one hand, and for V2 and V3 or V4 on the other.
In contrast, the capture frequencies of the females in the variants are not significantly different (ANOVA for transformed data p=0.06), although here too there is a discrepancy with the Multiple Range Test, which calculates significant differences for the pairs V5 vs. V1, V5 vs. V2 and V5 vs. V3. As more females were caught (78) than males (64), the less pronounced difference in the females is certainly not due to insufficient capture numbers.
Comparison of the variants for D. simulans on the second date: Considerably fewer D. simulans were caught in the second trial (58) than in the first (142) and the conditions for a statistical evaluation are correspondingly less favourable. The diversity of the variants is less pronounced and the average number of individuals caught only varies between 0.4 for V5 and 3.2 for V1 and V4. There is no significant difference for the total number of individuals, neither for the transformed nor for the original data after ANOVA, although for the former the Multiple Range Test for V1 vs. V5, as well as for V4 vs. V5 recognises significance.
The test requirements are not met for the males, not even for the transformed data, and therefore only the Kruskal-Wallist test is meaningful. According to this test, the variants differ significantly from each other (p=0.0022). The random-resample rank test shows significant differences for V5 and all other variants, with the exception of V2; p=0.055 for this pair and p=0.016 for all others.
Although approximately the same number of females (30) as males (28) were caught, none of the tests showed a significant difference between two variants for females. The Multiple Range Test therefore only recognises one homogeneous group, V1-V5.
Comparison of the variants for D. simulans at the third date: even fewer individuals of this species were caught at this time than at the previous dates, namely only 51. The differences are nevertheless somewhat more pronounced, with an average of 0.6 individuals caught in V5 traps and four in V2 traps. According to ANOVA, the discrepancy is significant (p=0.036 for the original data). It is primarily V2 that differs significantly from all others with the exception of V3.
However, if the sexes are analysed separately, ANOVA finds no significant differences between the variants. For the males, the Multiple Range Test between the variants V2 and V4 recognises significance, for the females both for V2 vs. V4 and for V2 vs. V5.
Of this species, 136 specimens were caught on the first trial date, 209 on the second and 42 on the third (total: 387).
Comparison of the variants for D. suzukii and all dates ("pooled" data): In V5 traps there are on average about one and a half animals, in all others about six. V2 is not the variant with the most animals. ANOVA for the transformed data shows that there is a significant difference between the variants (p=0.003), with only variant five standing out from all others according to the Multiple Range Test.
With regard to the males of this species, the test results are inconsistent, as on the one hand ANOVA for the transformed data (the original data do not fulfil all test requirements) does not detect any significant differences between the variants (p=0.052), but on the other hand the Multiple Range Test shows statistical differences, namely between V5 vs. V1 to V3.
The situation is clearer for the females. A significant difference is confirmed for both the original and the transformed data (for the latter more clearly: p=0.0036). Once again, it is variant five that differs from all others.
Comparison of the variants for D. suzukii at the first date: At the time of the first experimental repetition, V2 dominated in terms of the mean number of individuals per trap with 7.6 individuals, although not very clearly, and V5 with 0.2 individuals (maximum: 1) showed the lowest density, followed by V4 with 5.8 (
Figure 4, right). The test requirements for parametric test procedures are not met for either the original data or the transformed data, so that only the Kruskal-Wallis test is meaningful. The result is a moderate significance of p=0.015. This analysis was supplemented by a non-parametric pairwise comparison (random-resample rank test), according to which V5 differs significantly from all other variants, but there are no significant differences beyond this.
Not a single male was found in the fifth variant and accordingly this also differs significantly from all others. There are no further statistic differences. The significance value of ANOVA for the transformed data is p=0.0001.
With regard to the frequency of females, only the Kruskal-Wallis test is meaningful because neither the original nor the transformed data are normally distributed. The variants accordingly differ significantly (p=0.02). A rank test (random-resample) was carried out for the pair comparison and showed that the variants V1 to V4 differ significantly from V5 (least V4 vs. V5: p=0.016, otherwise p=0.008). Although the differences between the variants are somewhat less pronounced in the females, this is not a consequence of the capture numbers, which reached 78 specimens for the females but only 58 individuals for the males.
Comparison of the variants for D. suzukii on the second date: Variant 5 had an average of only two individuals, whereas with the exception of variant 2 (eight specimens), the others had more than ten. For the transformed data, there is a very significant difference between the variants when males and females are considered together (ANOVA p=0.0019). V5 differs significantly from all other variants (Multiple Range Test 95% LSD), there are no other significant differences.
When analysing the males alone, there are contradictions in the results between the test methods. ANOVA shows that there are no significant differences between the variants, whereas the Multiple Range Test shows a statistically significant difference between V3 and V5.
For the females, ANOVA shows a highly significant difference between the variants (p=0.0004 for the transformed data), with only V5 differing significantly from the rest of the variants (Multiple Range Test).
Comparison of the variants for D. suzukii on the third date: Regardless of whether males and females are analysed together or separately, no significant difference can be found between the variants for D. suzukii on the third date. This may be at least partly due to the small number of only 42 individuals caught.
The following
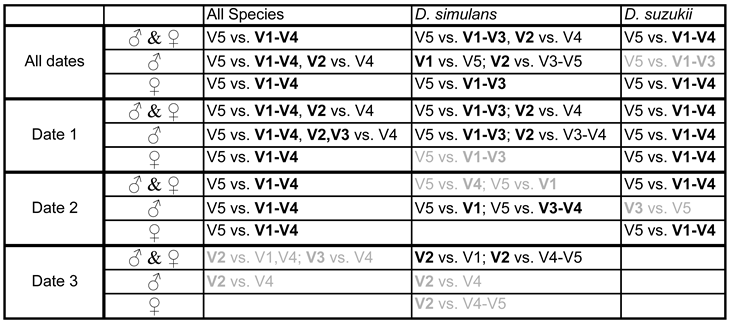
Table 4 summarises the results of the statistical analyses.
It is possible that the males of D. simulans and the females of D. suzukii react more strongly to the difference between the variants, but further investigations are certainly necessary to clarify this. V5 is the grape juice that is still unfermented or at the beginning of fermentation. For D. simulans, but possibly not for D. suzukii, V2 seems to be particularly attractive, at least for the males of this species. In this variant, the grape juice was transferred on the seventh day after fermentation began at 20°C in the laboratory, to the field, where it remained for one and a half days, albeit at lower temperatures. At this point, the fermenting liquid no longer smells distinctly of grape juice and stormy fermentation has usually already begun. In any case, it follows from what has been discussed so far that if grape juice is used as an attracting liquid, wine yeast should be added to it and it should not be applied right at the start of fermentation unless the trap remains in the field for a long time.
Table 4 also shows that the trial date had an influence on the test result, with the third date being the least significant. If this is weather-related, it is not due to the temperature, as this was highest on the third date, while the total capture numbers were lowest. The cloud cover was highest during the first date, which may have had a positive effect, as did the light precipitation. The wind may also have played a role, albeit an ambivalent one; at higher speeds, the navigation of the very small animals may be impaired, but on the other hand, if the wind is blowing in the right direction, the aromatic substances are dispersed further with the air and can thus attract them over greater distances. On the first trial date, the prevailing wind direction in the early afternoon and evening was from north-west to south-east or from west to east, i.e. towards the herbaceous vegetation and foliage which was mainly east of the traps; as was the case on the first day of the second trial date, but not on the following day, when the wind had blown from east to west and thus the aromatic substances towards the open area of the vineyard edge. On the third date, the wind was generally from the east, i.e. away from the tall vegetation at the edge of the forest. The wind speed was generally moderate (
Table 3), up to 28km/h. It was lowest on the second date.
In addition to the weather during the experimental period, other factors can also influence the attractiveness, e.g. malfermentation in the attractant or changing preferences of successive generations over the course of the year, which could perhaps be caused by the decreasing day length.
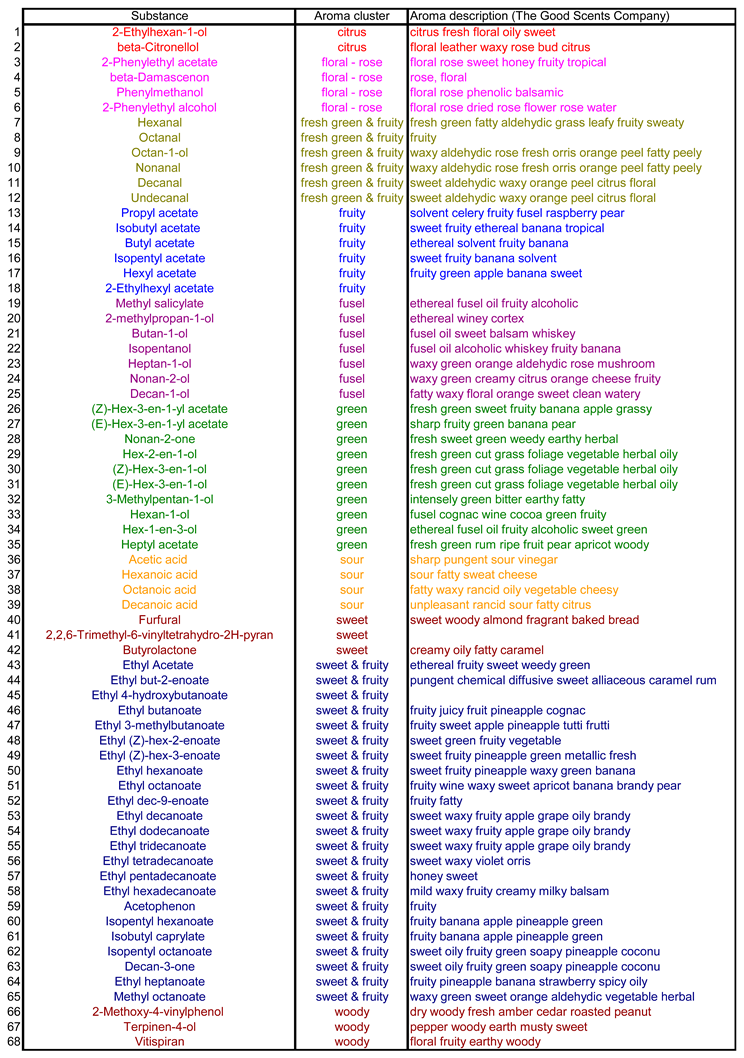
The aroma composition of the fermenting grape juice: 68 volatile substances were selected for the aroma analysis of the Pinot Blanc grape juice as well as the wine and the intermediate stages produced during fermentation and used in the field trials (
Table 5). In chemical terms, these are aldehydes, terpenes, ketones, ethers, alcohols, carboxylic acids, methyl and ethyl esters, acetic acid and other esters. In
Table 5, they are classified according to the odour perception that they trigger in isolation in the majority of humans - almost nothing is known about the perception of
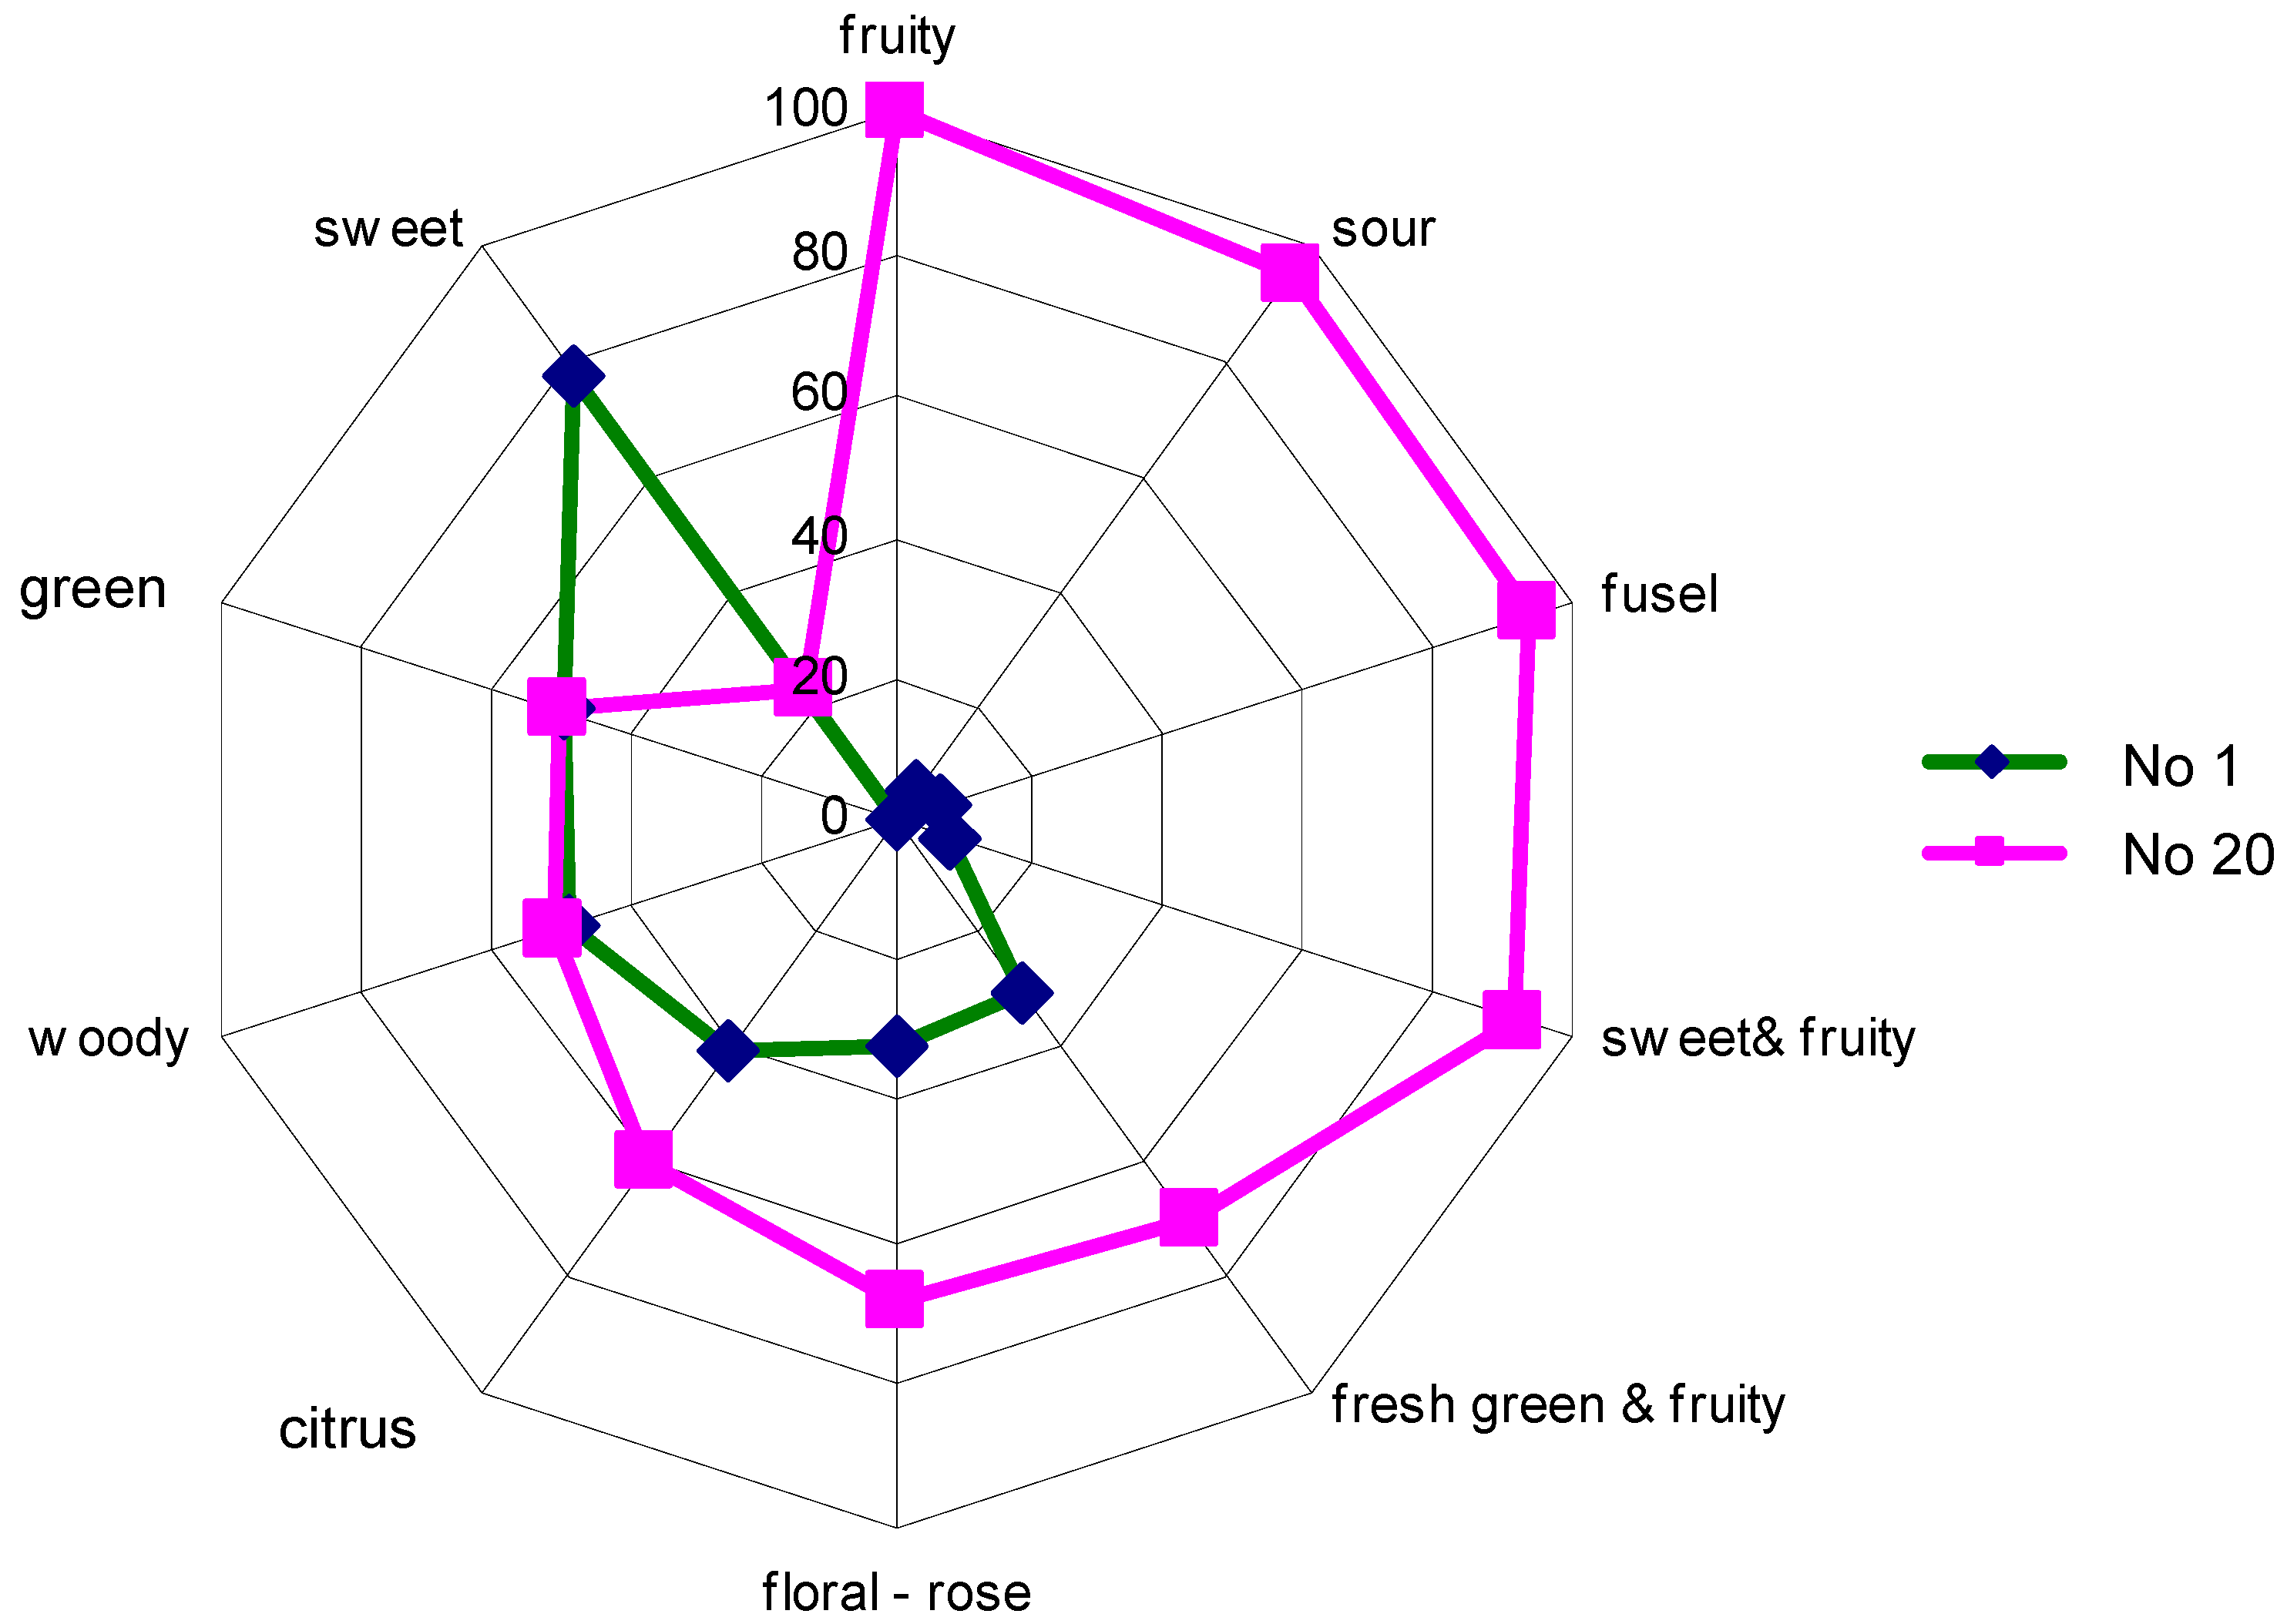
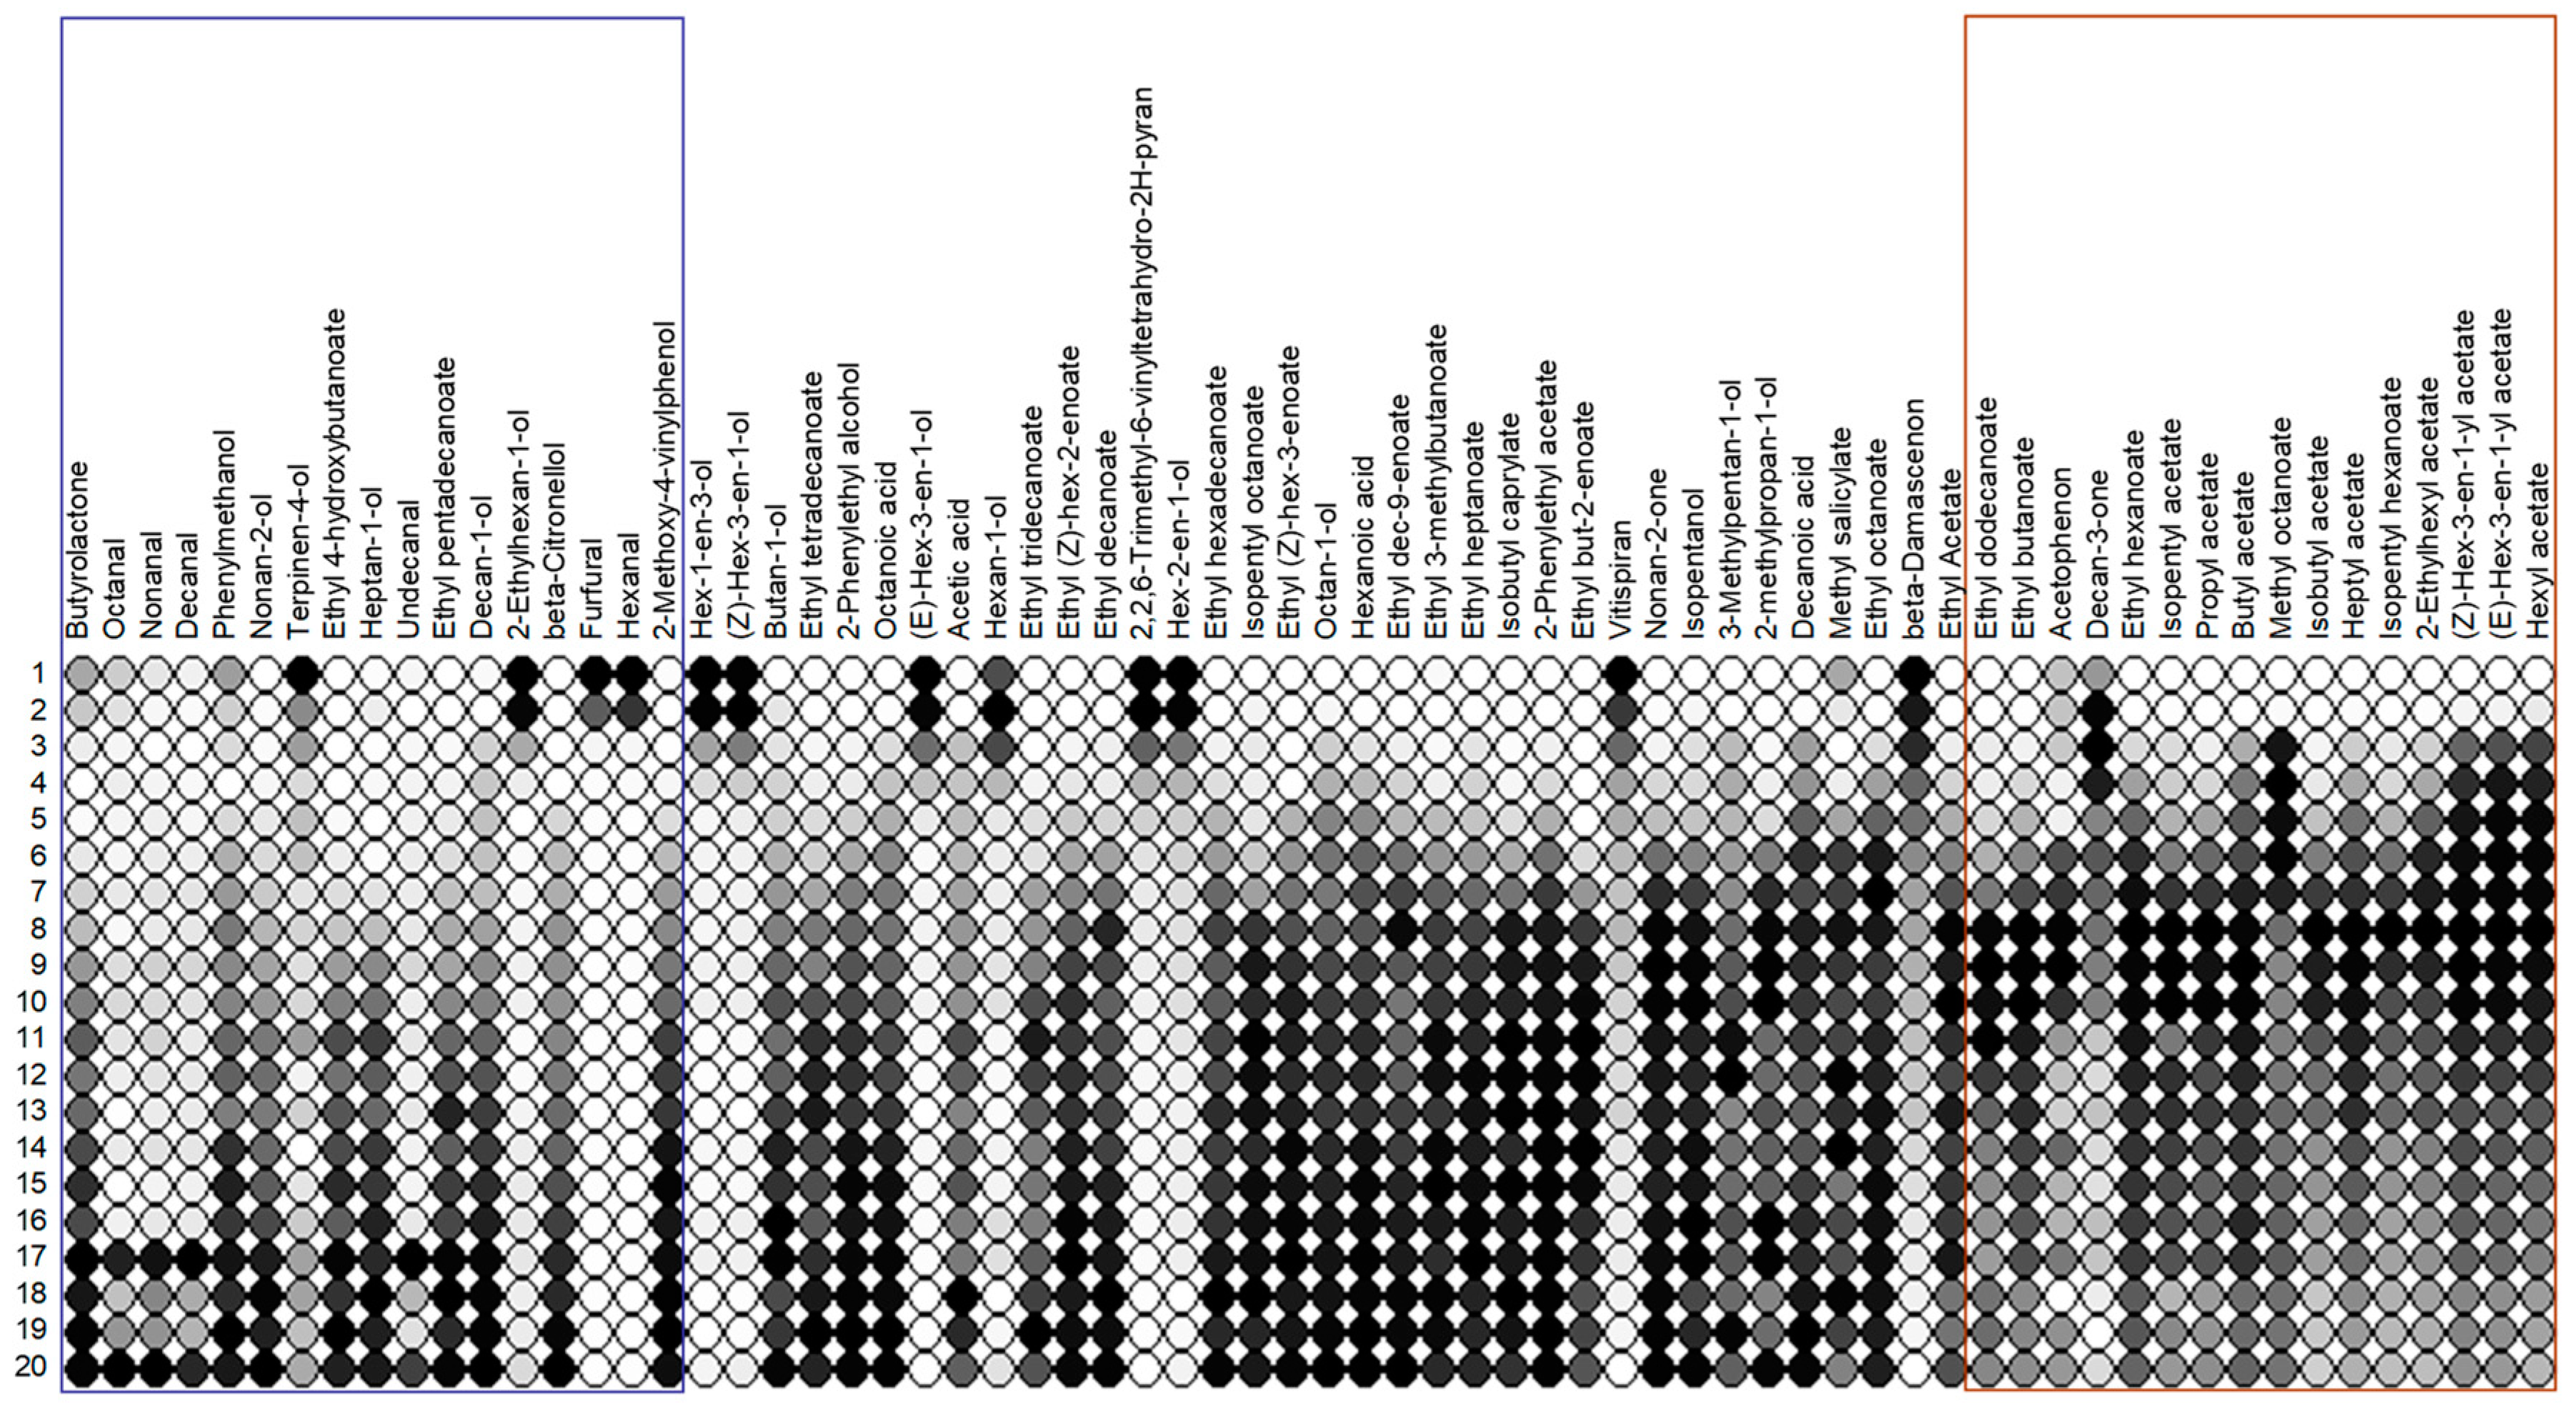
Drosophila. The samples were taken daily for 20 days, numbered consecutively (No. 1 is the unfermented grape juice) and analysed as described in the methods section. The change in the flavour spectrum before and after fermentation was reconstructed according to
Table 5 and is shown in
Figure 5.
As can be seen, the flavour develops into greater variety, with fruity notes in particular, but a less desirable component is also present ("fusel").
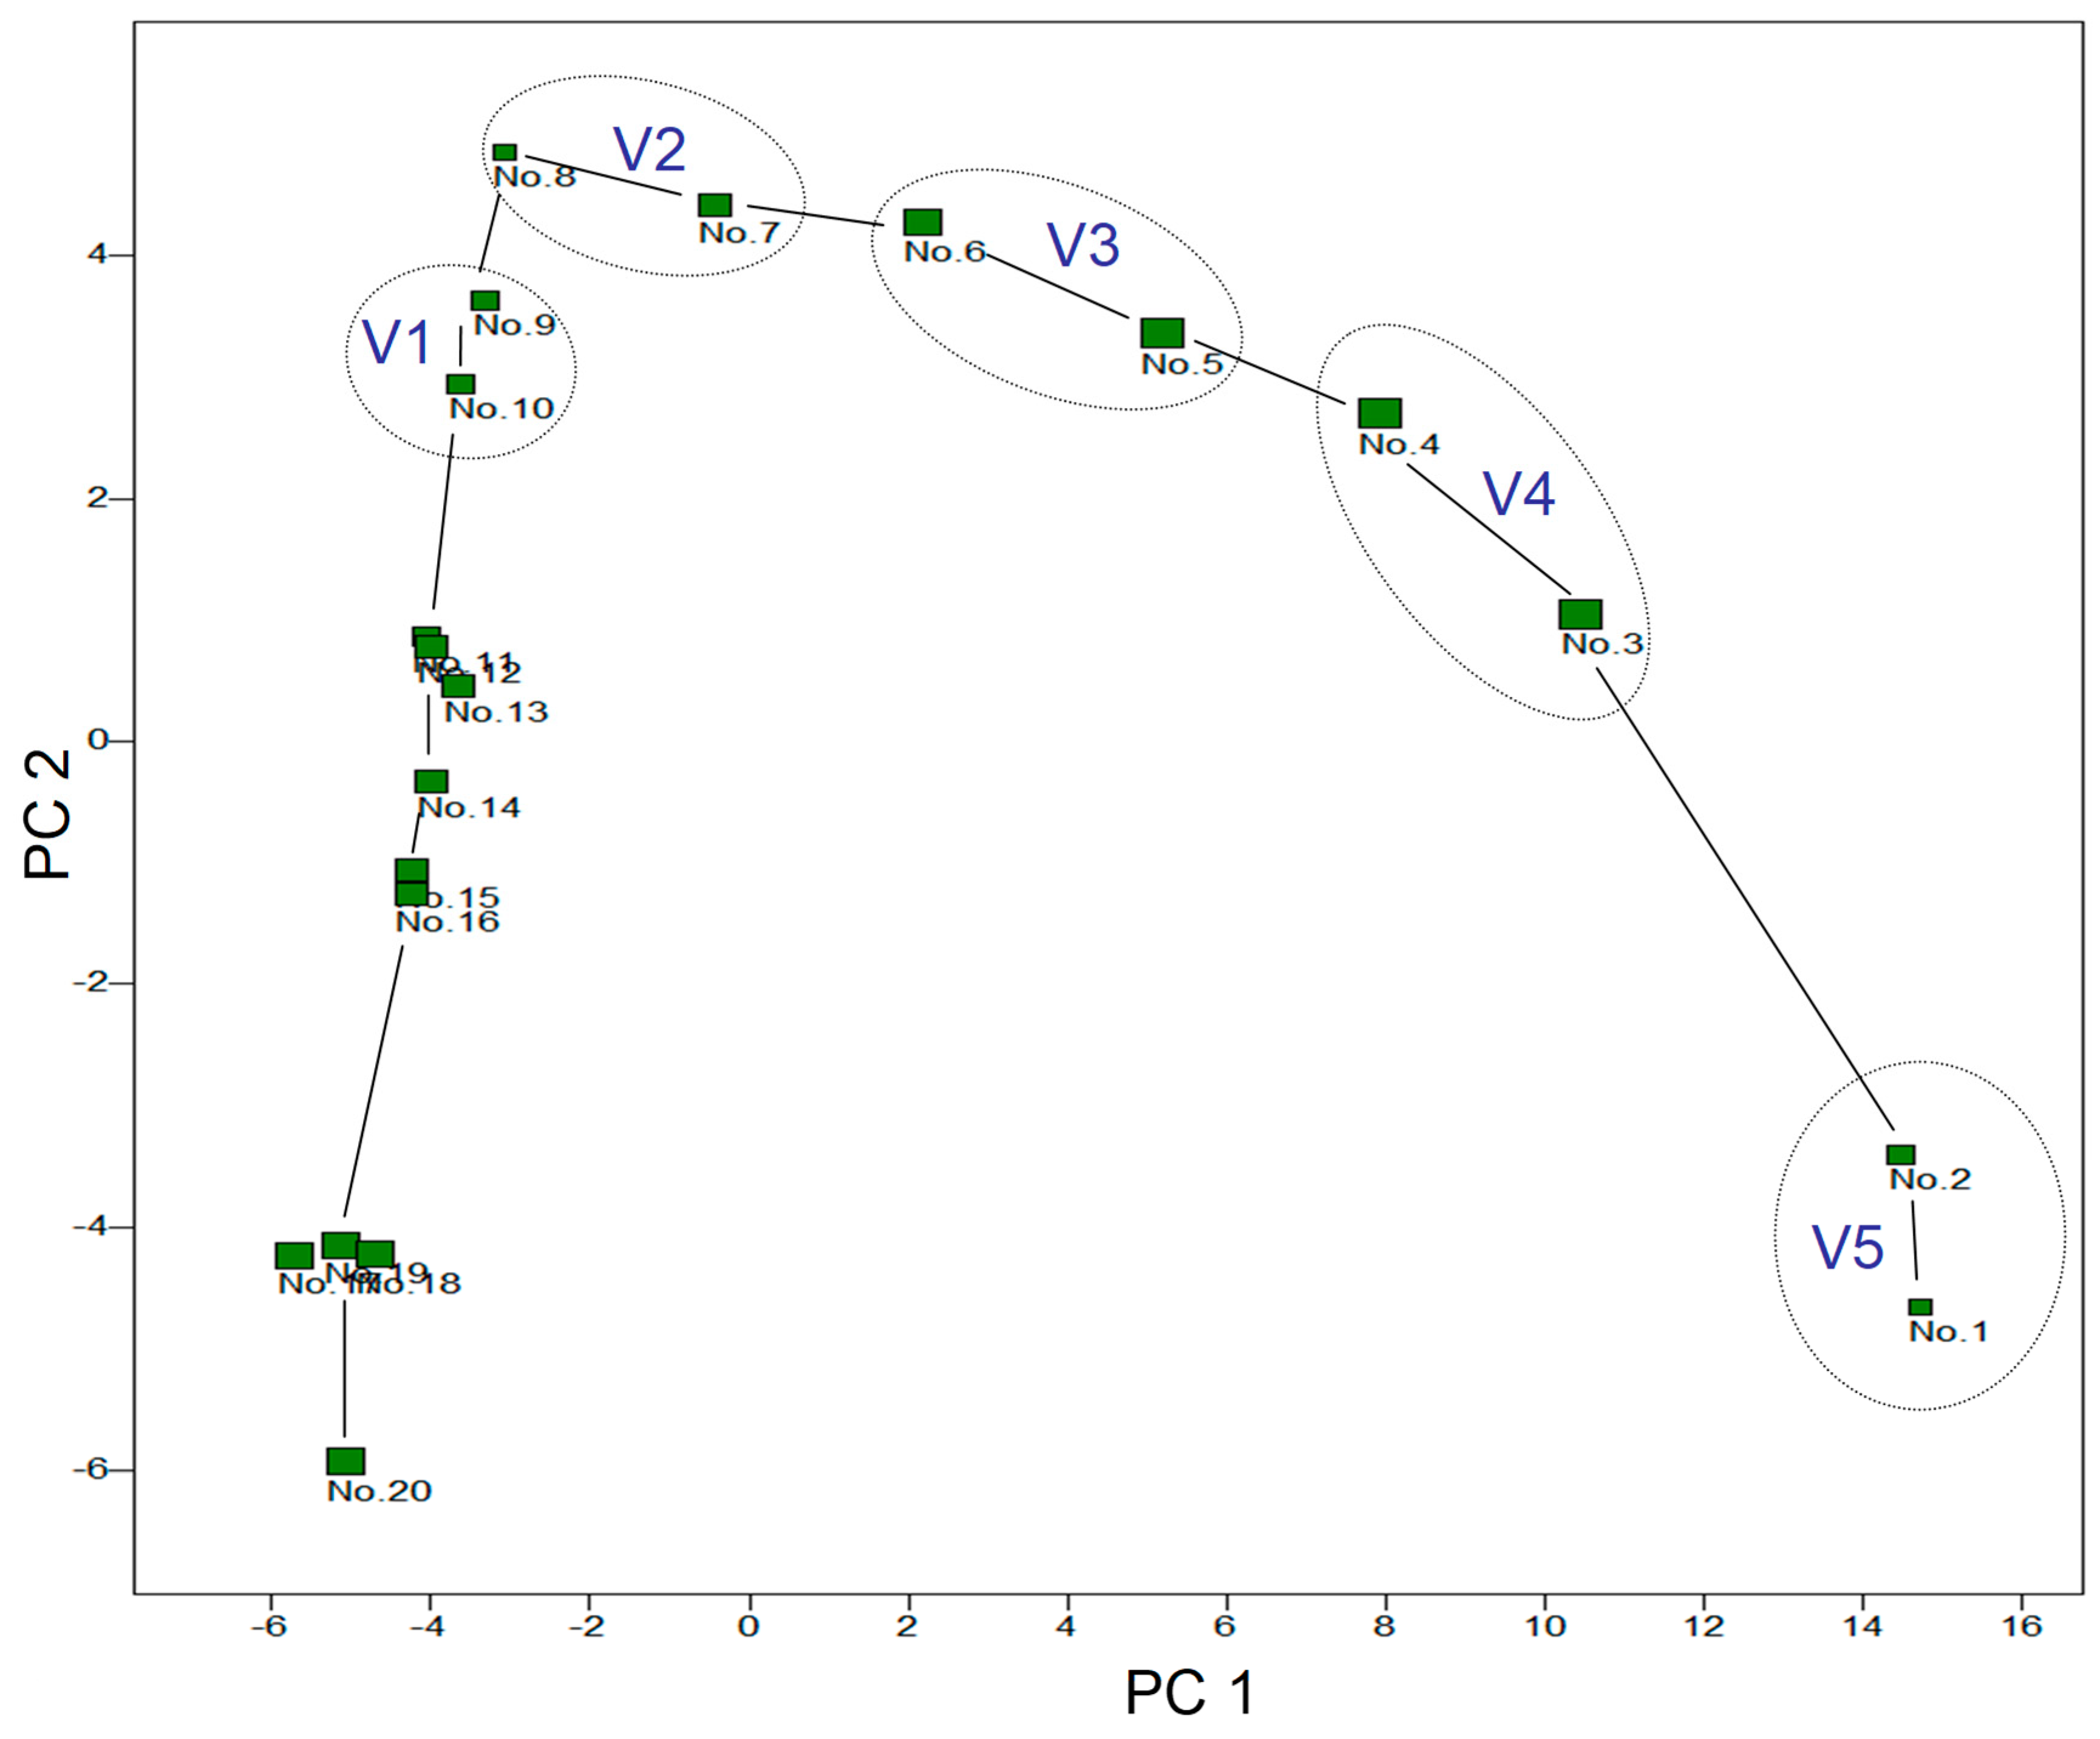
Figure 6 shows the multivariate analysis (PCA) of the development of the aroma composition of the fermenting grape juice. The large difference between the second and third day along the second principal component (PC2) is striking. More relevant, however, is the change along PC1, which remains high from the second to the eighth day (PC1 explains 67.2% of the variance in the data, PC2 only 17.7%). After that, the aroma changes only slowly. On days one and two of fermentation, the attractor liquid corresponds to experimental variant 5, days three and four V4, five and six V3, seven and eight V2 and finally nine and ten V1.
In the following two figures, the aroma components were sorted according to their significance for the positioning of the fermenting grape juices along PC1 and PC2. The fermenting grape juices are positioned along PC1 according to the equation:
 |
(1) |
where xi corresponds to the SIM area of the i-th aroma substance (n is the number of components) and for each component it applies that a larger SIM area also corresponds to a larger aroma concentration. y1 is the value of grape juice on the PC1 axis. The larger the amount of the constant a1i calculated by the PCA algorithm, the more important the substance is for positioning. The sign provides additional information as to whether the SIM area of the component in the fermenting grape juice is relatively high or low. The same applies to y2, the positioning along PC2.
According to the statistical analysis summarized in
Table 4, variant V5 (days 1 and 2 of fermentation) shows the lowest attractiveness for both
D. simulans and
D. suzukii males as well as females. It is therefore unlikely that the aromatic substances contained in the blue rectangle in
Figure 7 are particularly attractive to these species. These are hexanols and hexenols, β-damascenone, vitispiran, decanone, hexanal and furfural. However, almost any of the substances included in the red rectangle could, individually or in combination, have an attracting effect on the two
Drosophila species. In this context, it would of course be interesting to know how attractive the wine, i.e. the grape juice that had finished fermenting, would have been compared to the grape juice that was still fermenting. The Pinot Blanc wine was not included in the experiment, but a study by Tiefenbrunner & Tiefenbrunner in 2017 showed that the wine has no greater appeal than the still unfermented grape juice and it follows that aroma components not typical for the wine but for fermenting grape juice are likely important.
It is easier to deal with the statistical statement that
D. simulans males seem to particularly prefer variant V2 (seventh and eighth day of fermentation) and that, according to
Figure 4, the frequency of the two
Drosophila species seems to increase in the traps with attractant liquid that fermented for a longer period of time until the state of V2 has been reached (although the latter is not statistically proven). This clearly suggests that the aroma components that are most attractive are those that are particularly highly concentrated between day 3 and day 8, but especially around the seventh and eighth day of fermentation. The corresponding fermenting grape juices have particularly high values along the PC2 axis, which is why it makes sense to look at an aromagram sorted accordingly. There is also another reason for this, namely plausibility: species that feed on yeast such as
Saccharomyces cerevisiae and closely related species should be particularly strongly attracted to yeast activity and this is higher in fermenting grape juice than in both unfermented grape juice and wine.
Figure 8 shows an aromagram sorted by PC2.
A particularly promising aroma component in the sense discussed is hexyl acetate (Acetic acid, hexyl ester) (
Figure 7, right in the red framed area), a substance that triggers a pleasant, sweet, fruity, pear-like odour sensation in most people. It was maximally concentrated around the eighth day of fermentation. The same applies to 3-hexenyl acetate (3-hexen-1-ol, acetate), an ester also found in leaves and berries with fungicidal (but obviously not against yeasts) and bactericidal effects. The substance smells of green fruits (
Table 5). It also reached its maximum concentration on the eighth day of fermentation, which also applies to 2-ethylhexyl acetate. However, this carbon ester is not particularly volatile and therefore less suitable as an attractant. A concentration peak around the eighth day also has isopentyl hexanoate, a substance that smells like banana, heptyl acetate (acetic acid, heptyl ester), which also smells pleasantly of fruit, and isobutyl acetate (banana aroma).
Some other aroma components also have their maximum concentration around the eighth to tenth day of fermentation (red framed area in
Figure 8) and should therefore not be neglected in further investigations. Because of their slightly later peak, they are perhaps better suited to explain the preference for V2 by
D. simulans than a general attractiveness within the period from the third to the eighth day of fermentation. However, there is then a need to explain why the attractiveness does not remain longer.
Further investigations could consist of presenting the substances described as suitable in the previous text individually or in combination in the field at different times and in several concentration levels in the experimental setup used here. This has already happened insofar as 50 substances were examined that only partially correspond to those listed in
Table 5. The greatest attractiveness for
D. suzukii in this experiment showed geranyl acetate, which was not examined in this publication. However, this result is not statistically significant.
Another aspect that should also be investigated in this context is the interaction between the perception of aroma substances and CO2. Carbon dioxide can trigger both attraction and aversion in Drosophila (Faucher et al. 2006, 2013; Jones et al. 2007; van Breugel et al. 2018) and, at least in the vicinity of the traps, it could enhance the attraction effect of the volatile fermentation products.


