Submitted:
12 February 2024
Posted:
13 February 2024
You are already at the latest version
Abstract
Keywords:
1. Introduction
2. Methodology
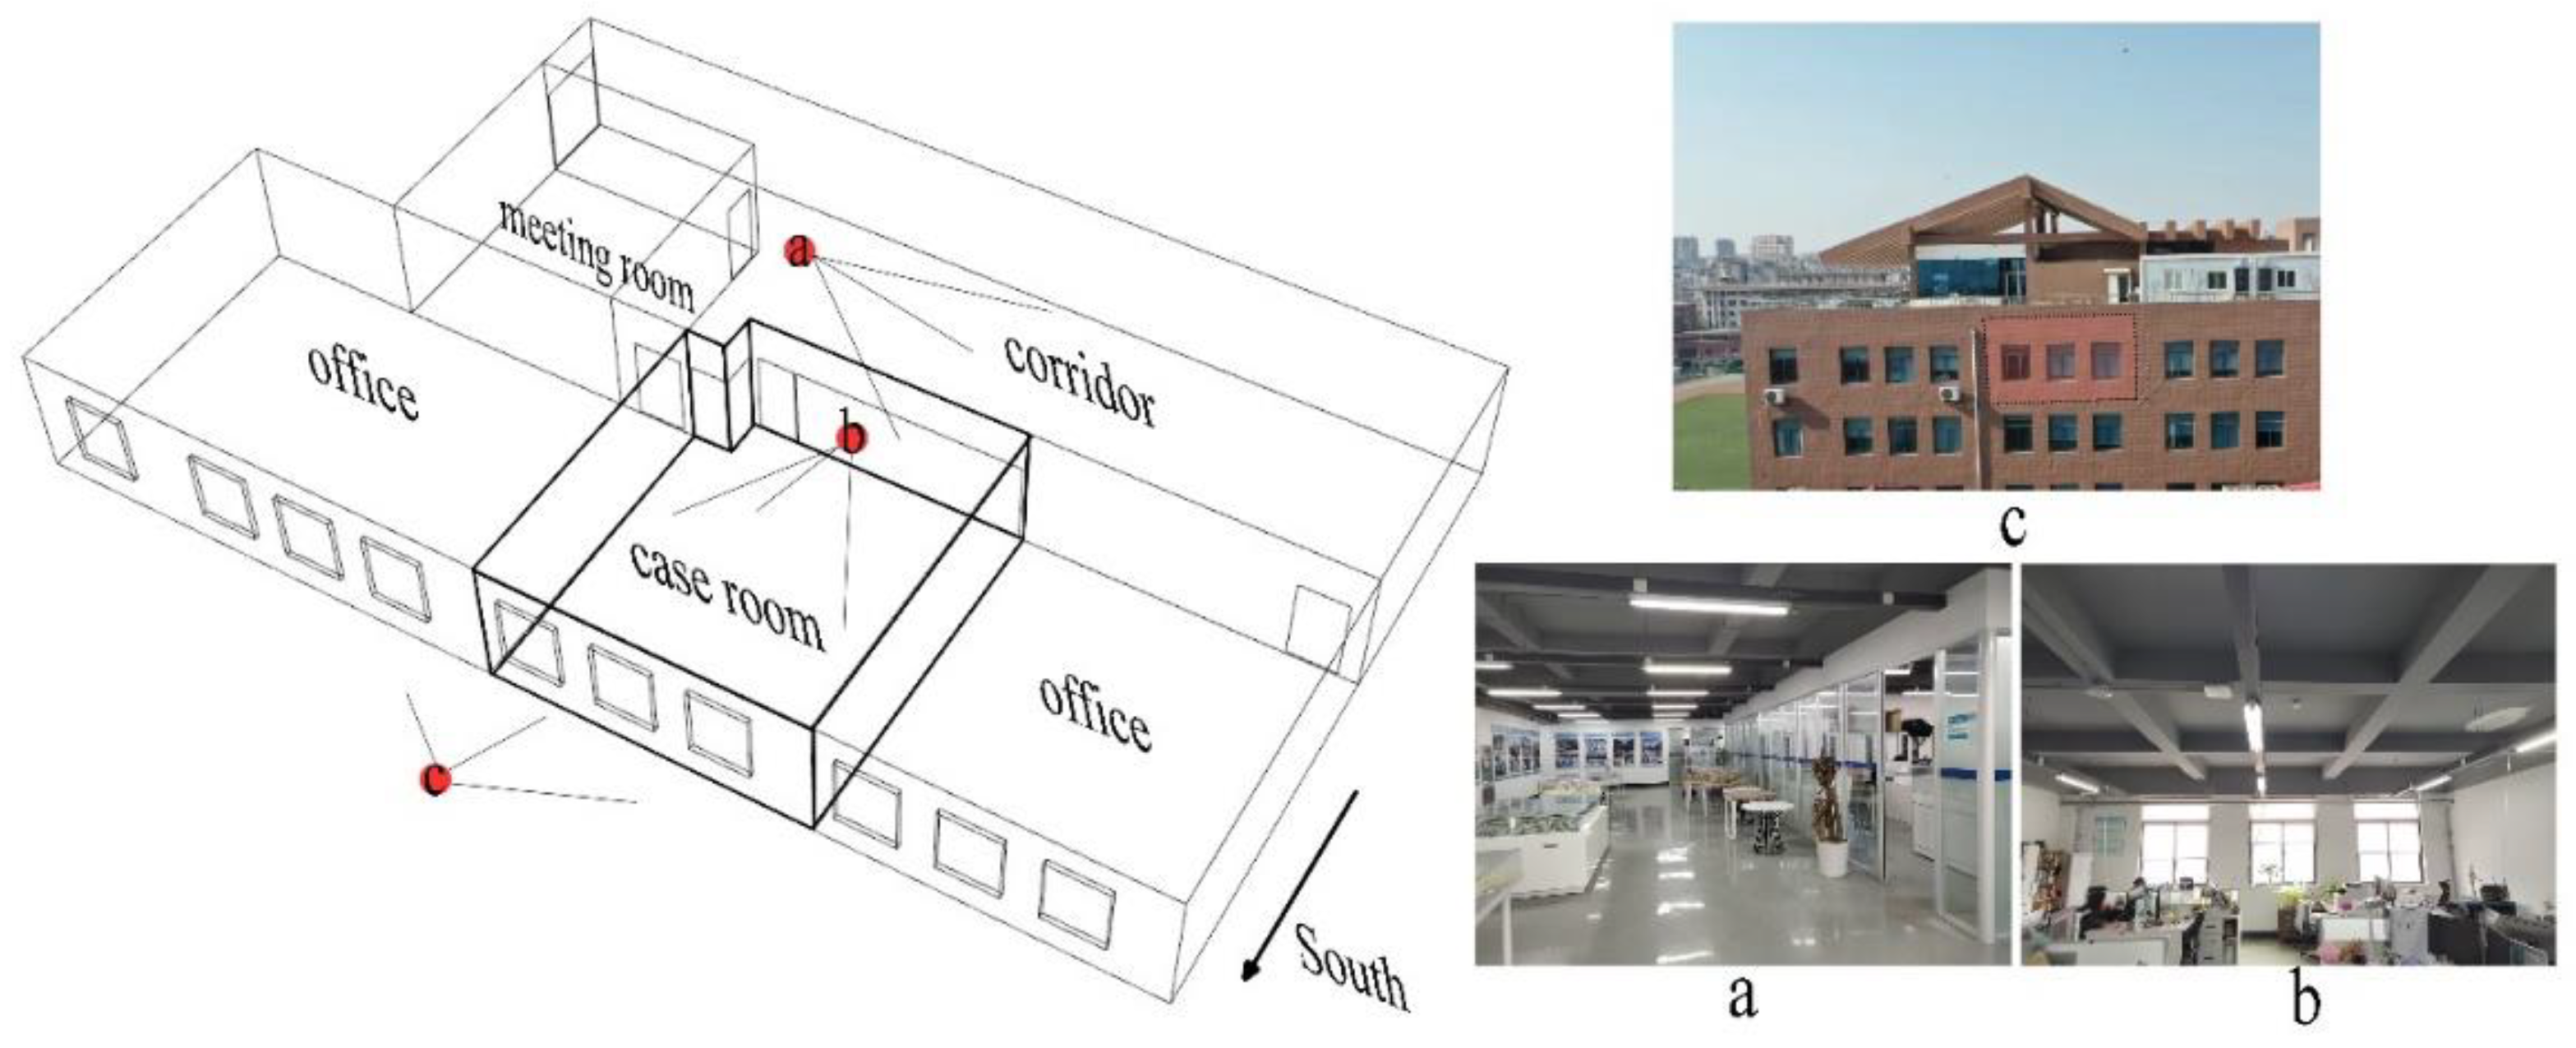
2.1. Case study description
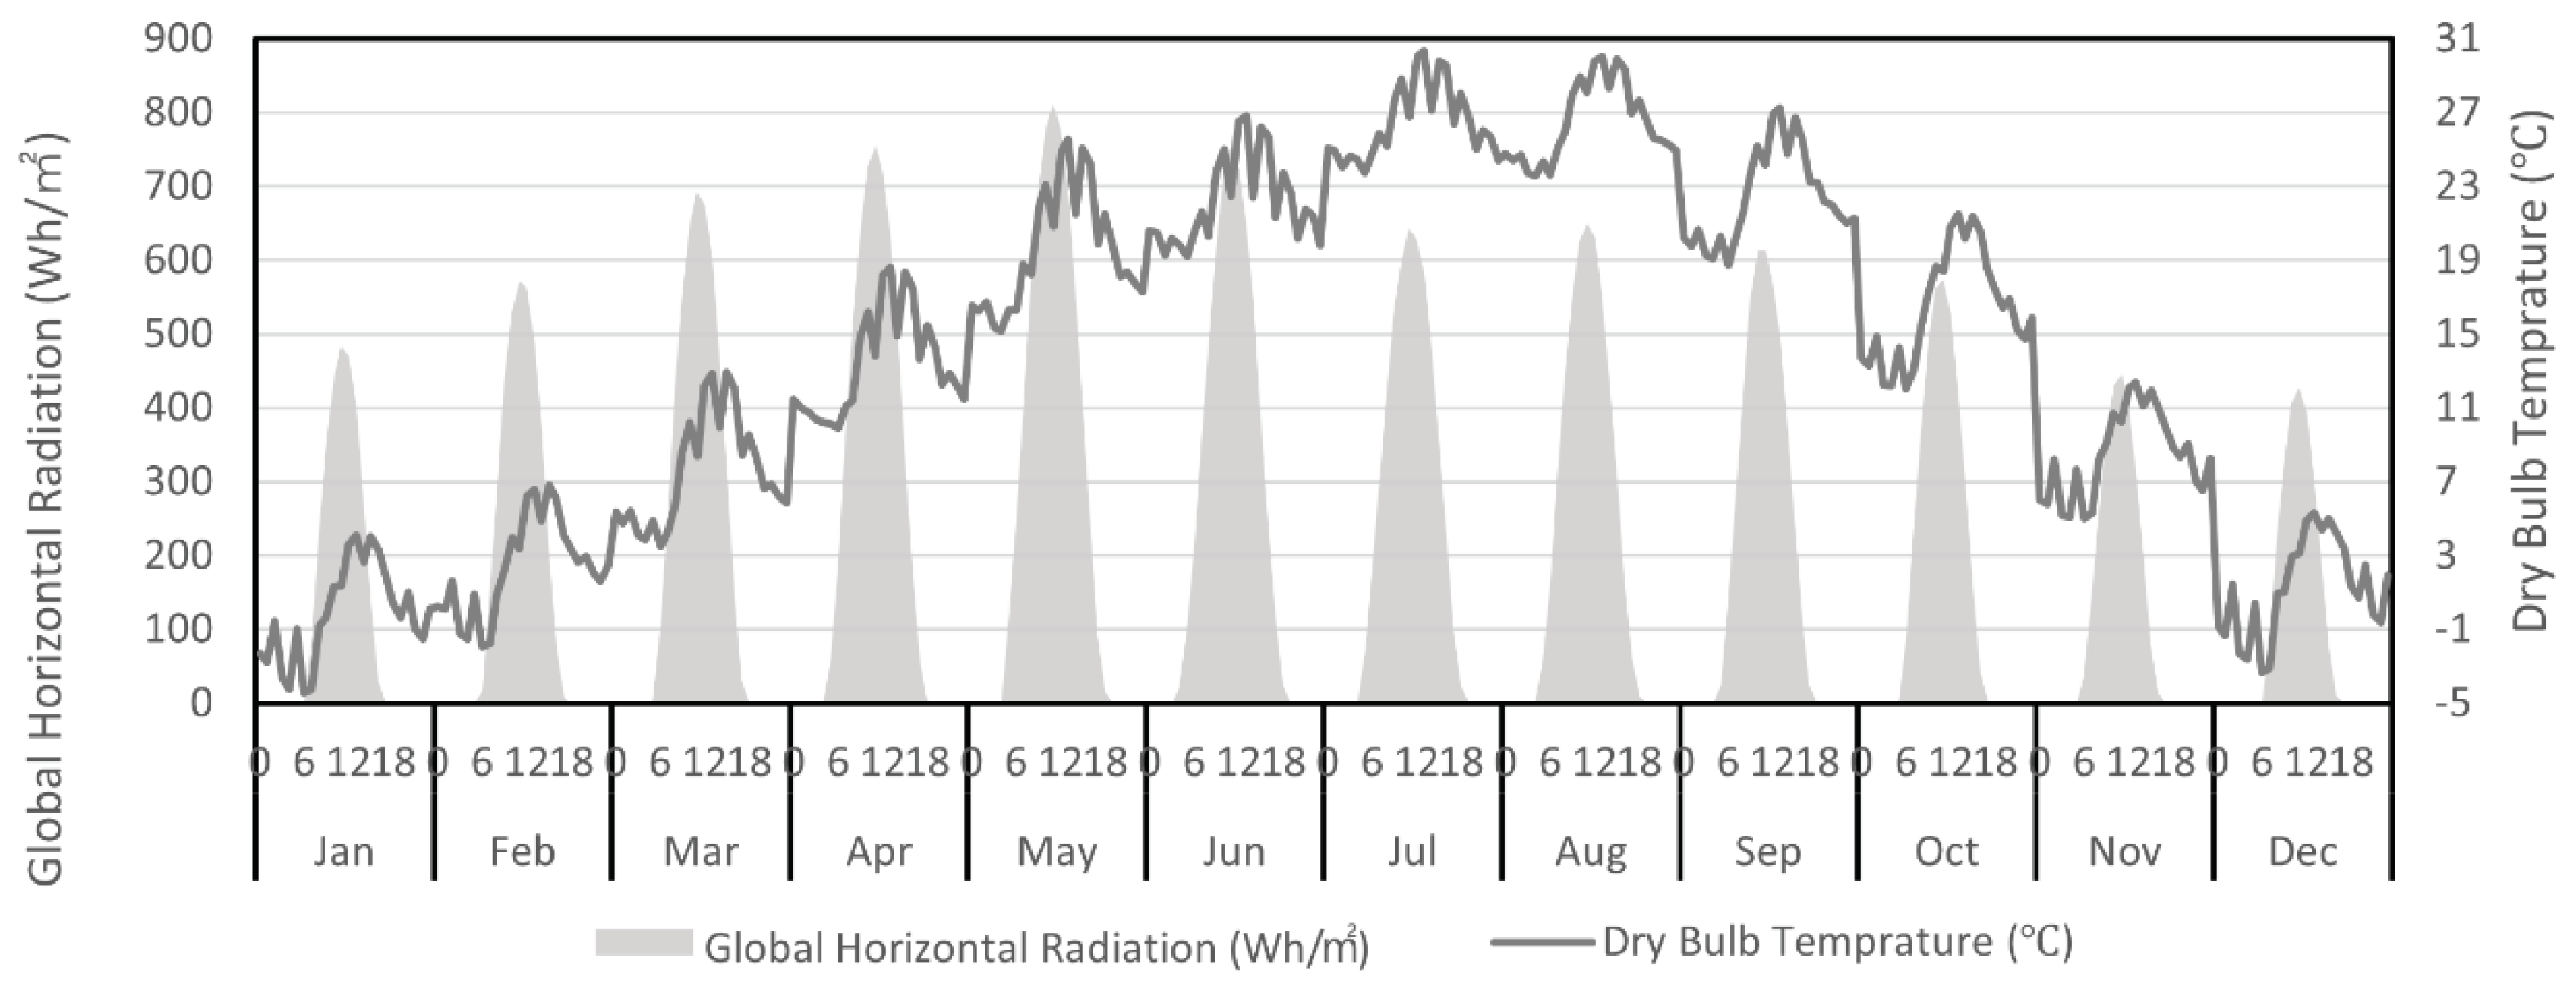
2.2. Baseline model settings
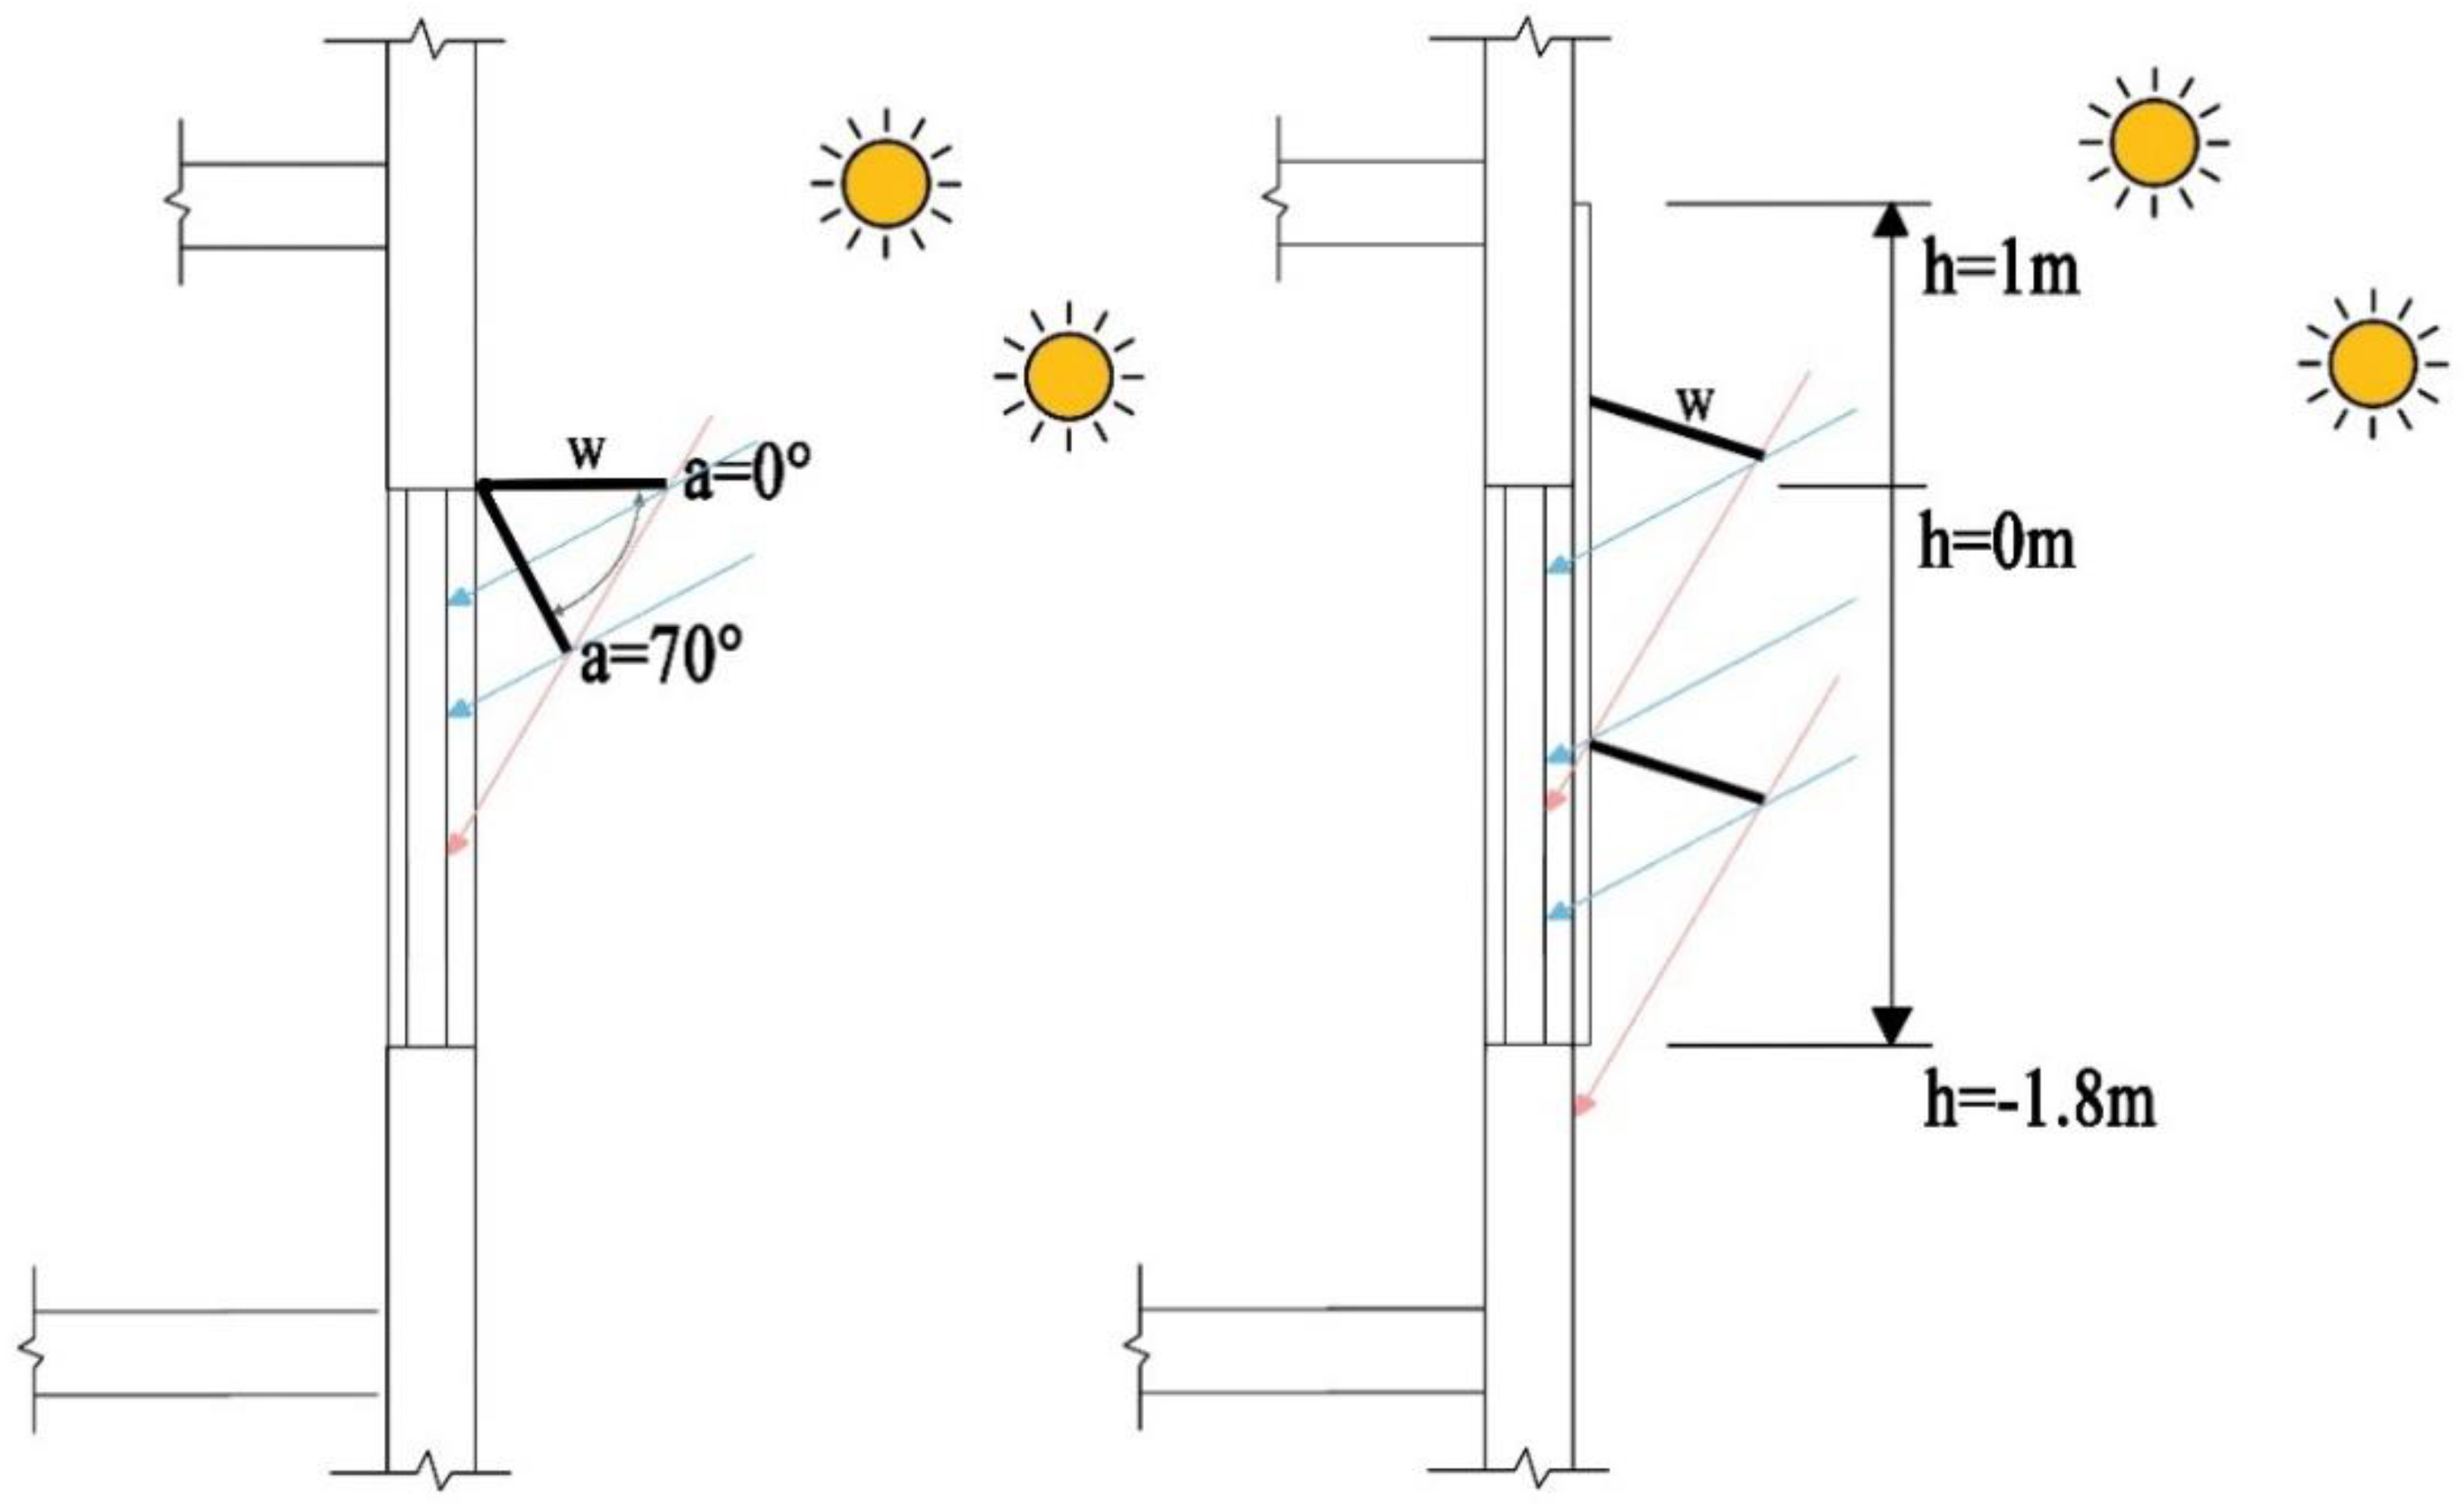
2.3. PVSD control strategies
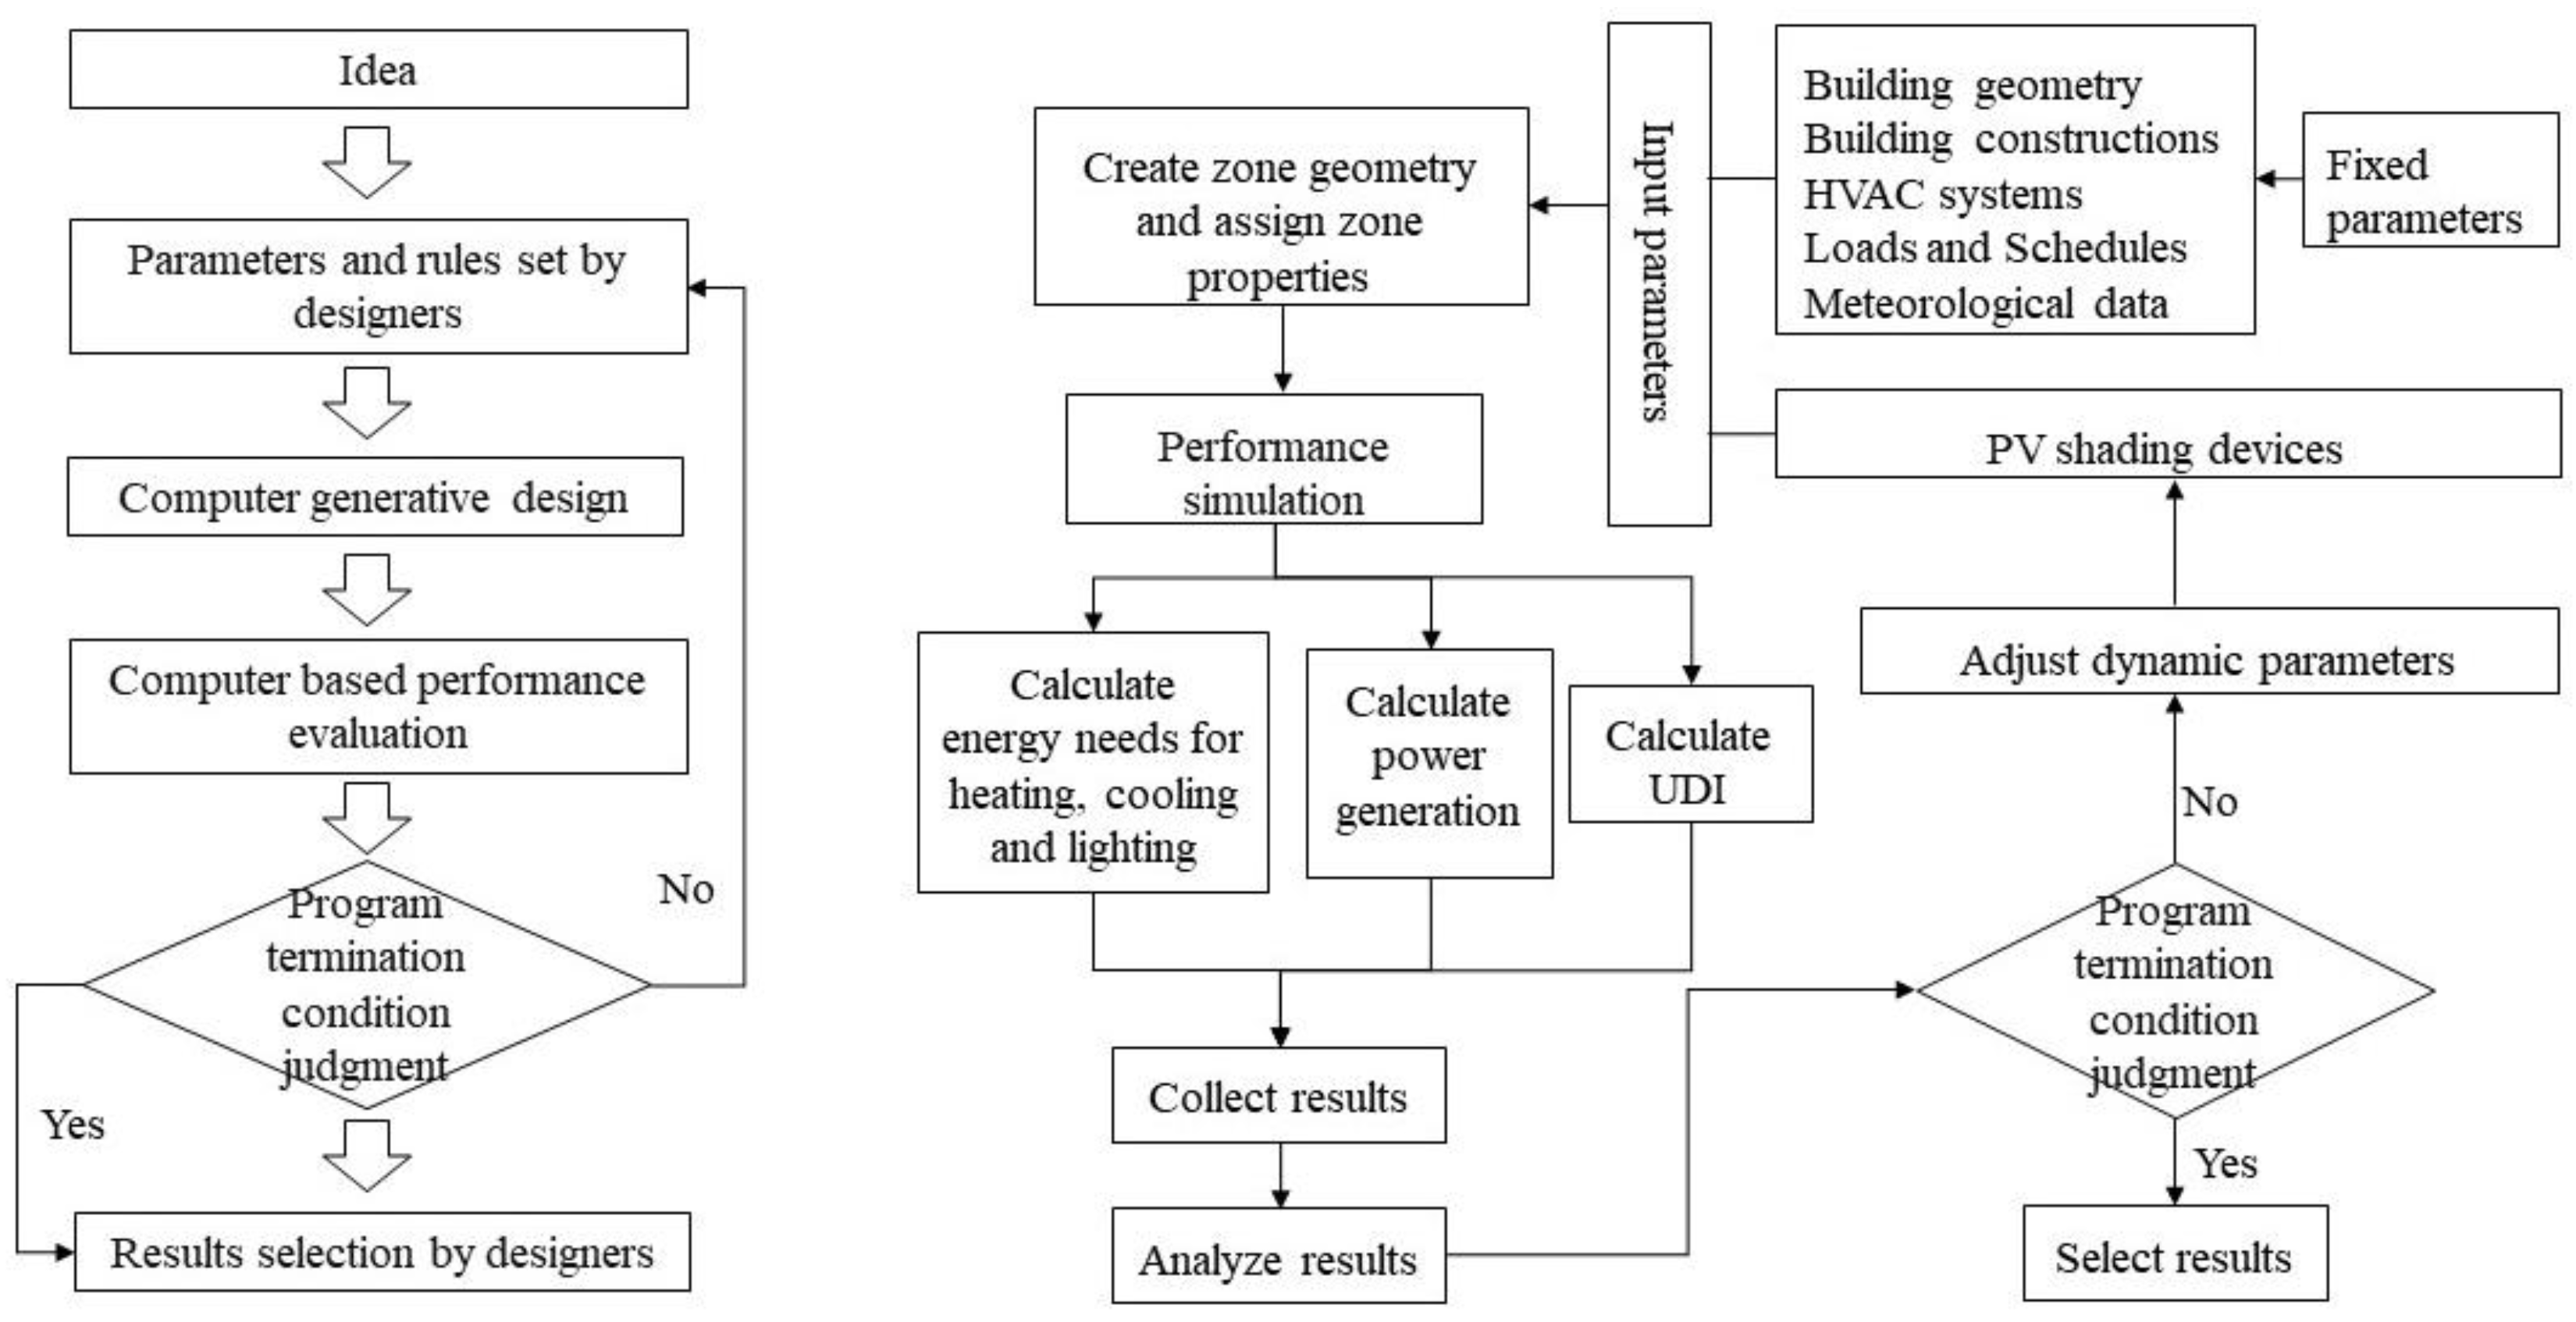
2.4. Parametric Performance Design Method
2.5. Evaluation indicators
2.5.1. Daylighting evaluation indicators
2.5.2. Energy consumption indicators
2.5.3. Model validation indicators
3. Results
3.1. Model Validation
3.2. Energy consumption and daylighting performance of fixed PVSDs
3.2.1. The impact of fixed PVSDs on building energy consumption and daylighting
3.2.2. Energy saving and daylighting potential of fixed PVSDs
3.3. The impact of dynamic PVSDs on daylighting
3.3.1. The impact of rotation strategy on daylighting
3.3.2. The impact of sliding strategy on daylighting
3.3.3. The impact of hybrid strategy on daylighting
3.4. Impact of dynamic PVSDs on energy consumption
3.4.1. The impact of dynamic PVSDs on power generation
3.4.2. The Impact of dynamic PVSDs on energy consumption
3.4.3. The impact of dynamic PVSDs on lighting energy consumption
3.5. Energy-saving and Daylighting potential of dynamic PVSDs
3.5.1. Energy saving potential of dynamic PVSDs
3.5.2. Dynamic PVSDs daylighting potential
4. Discussion
5. Conclusion
- 1)
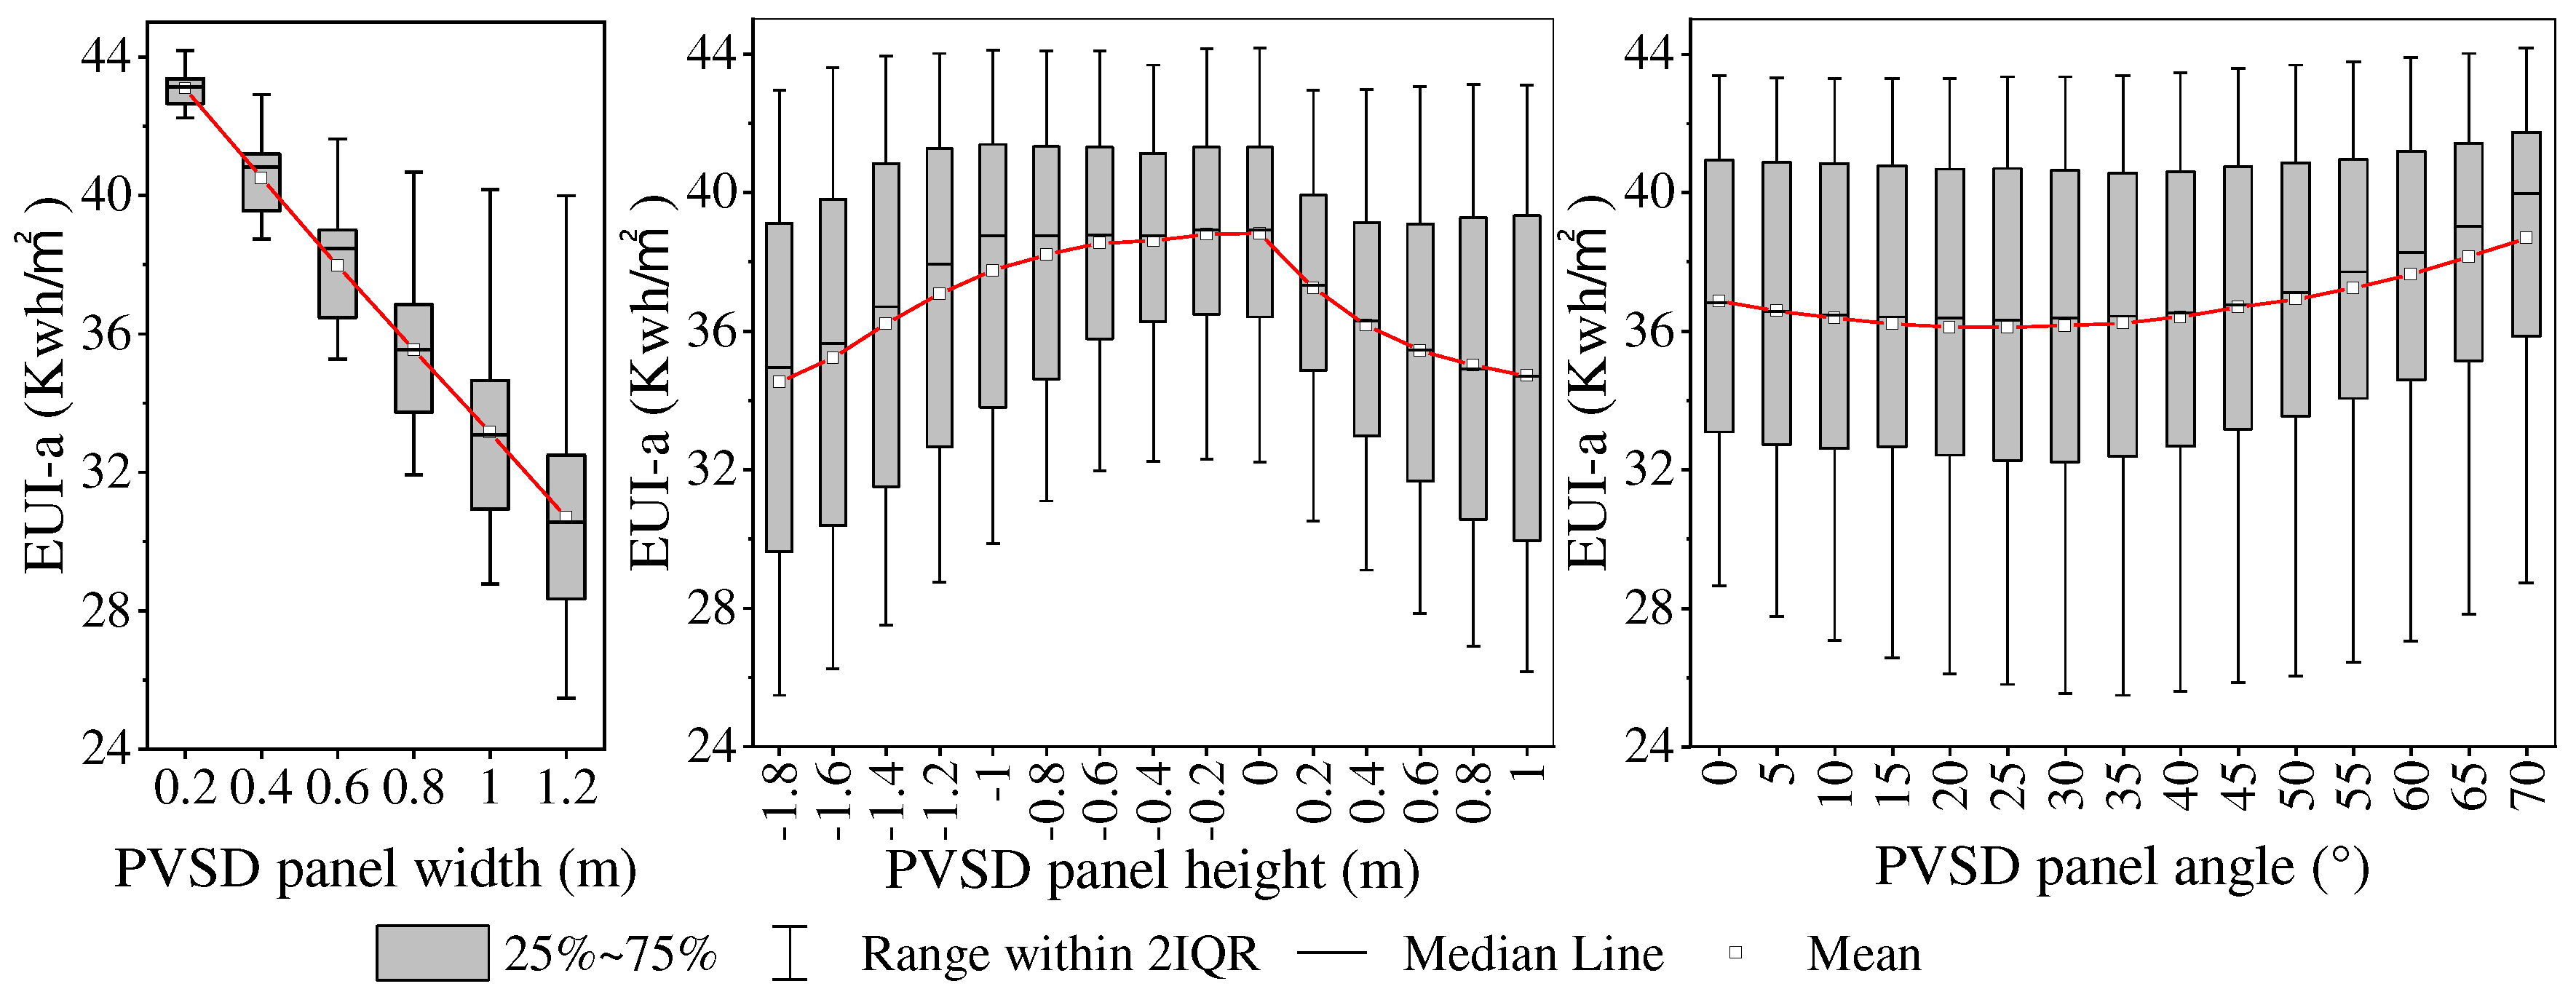
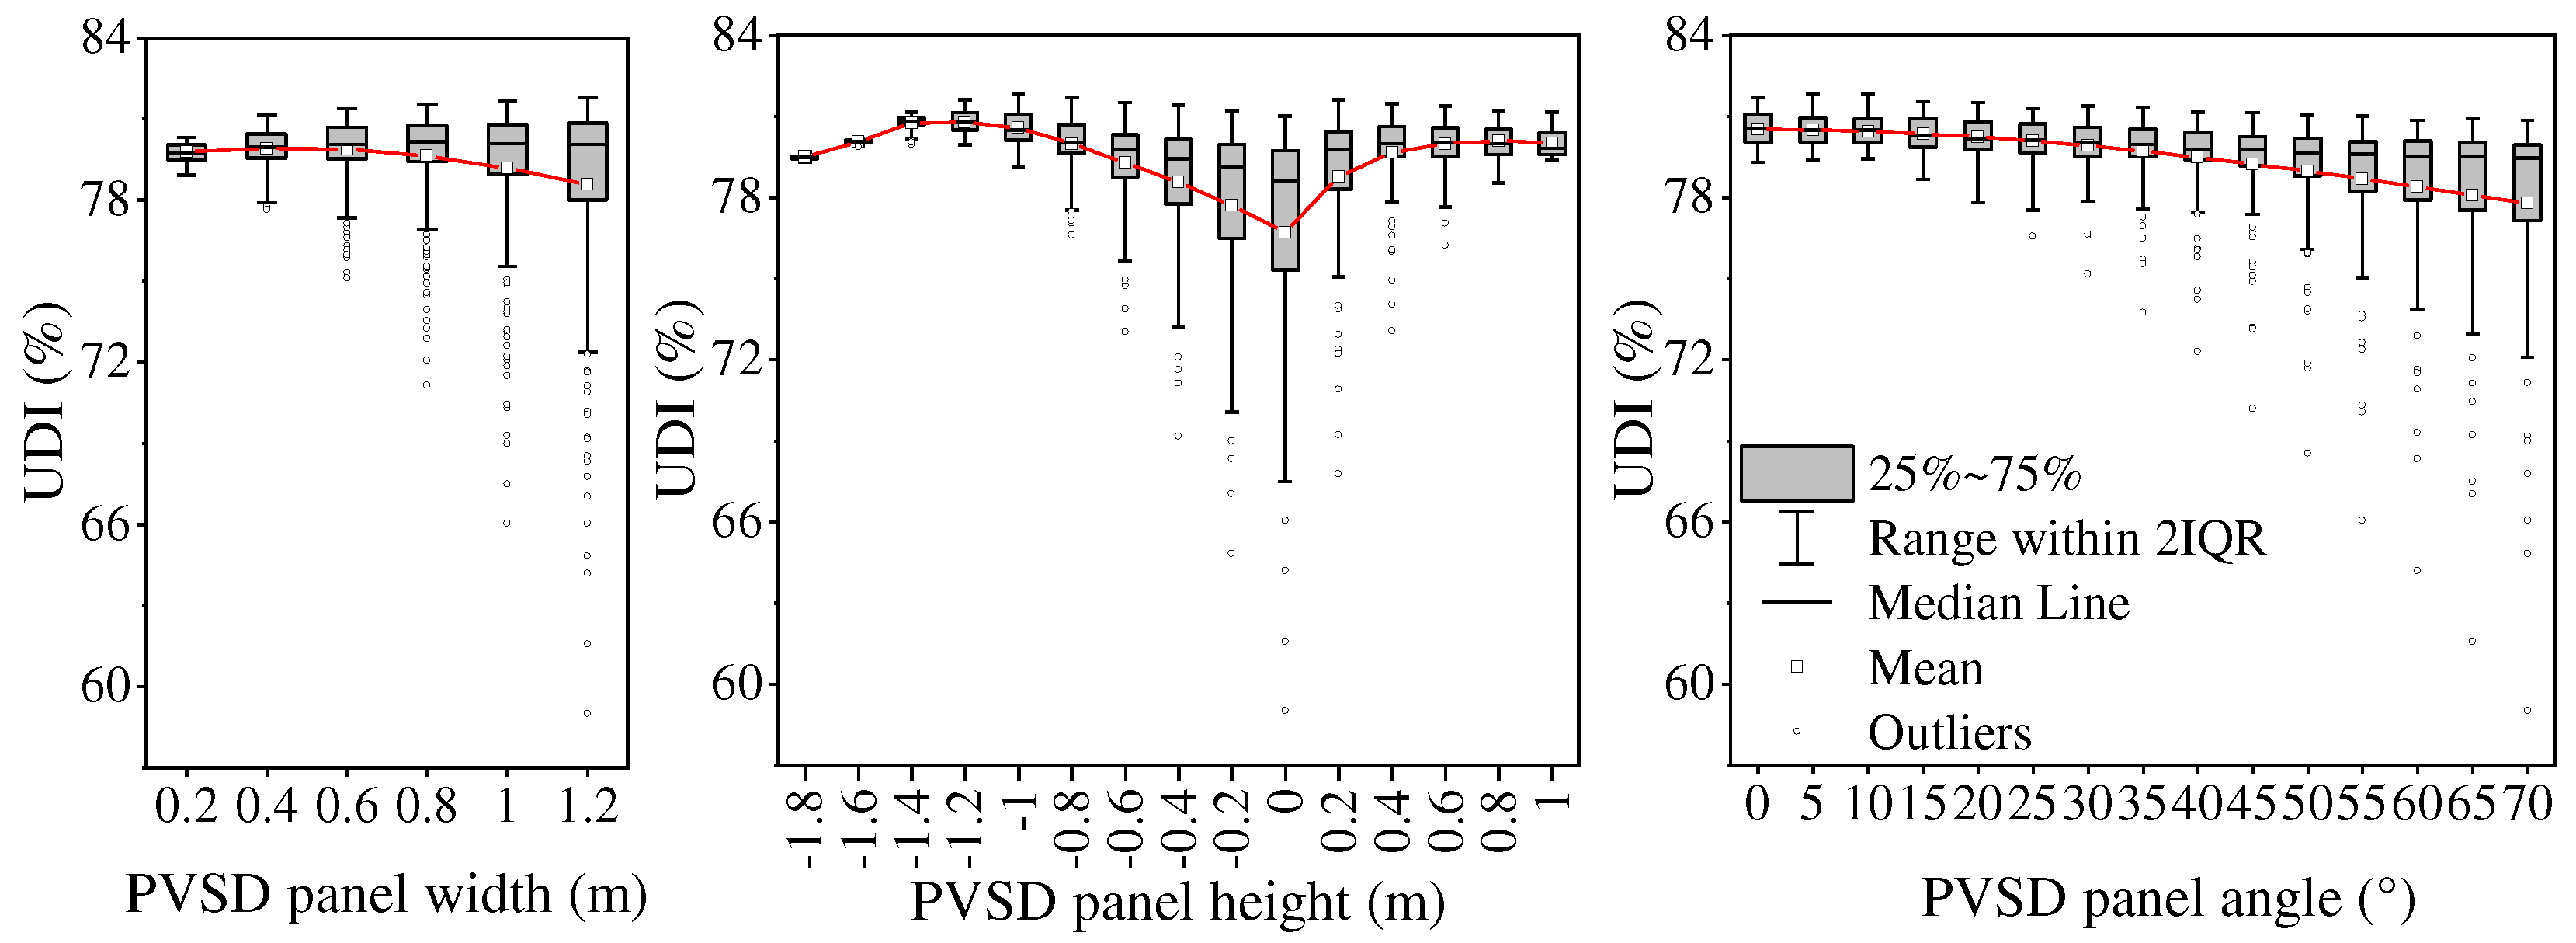
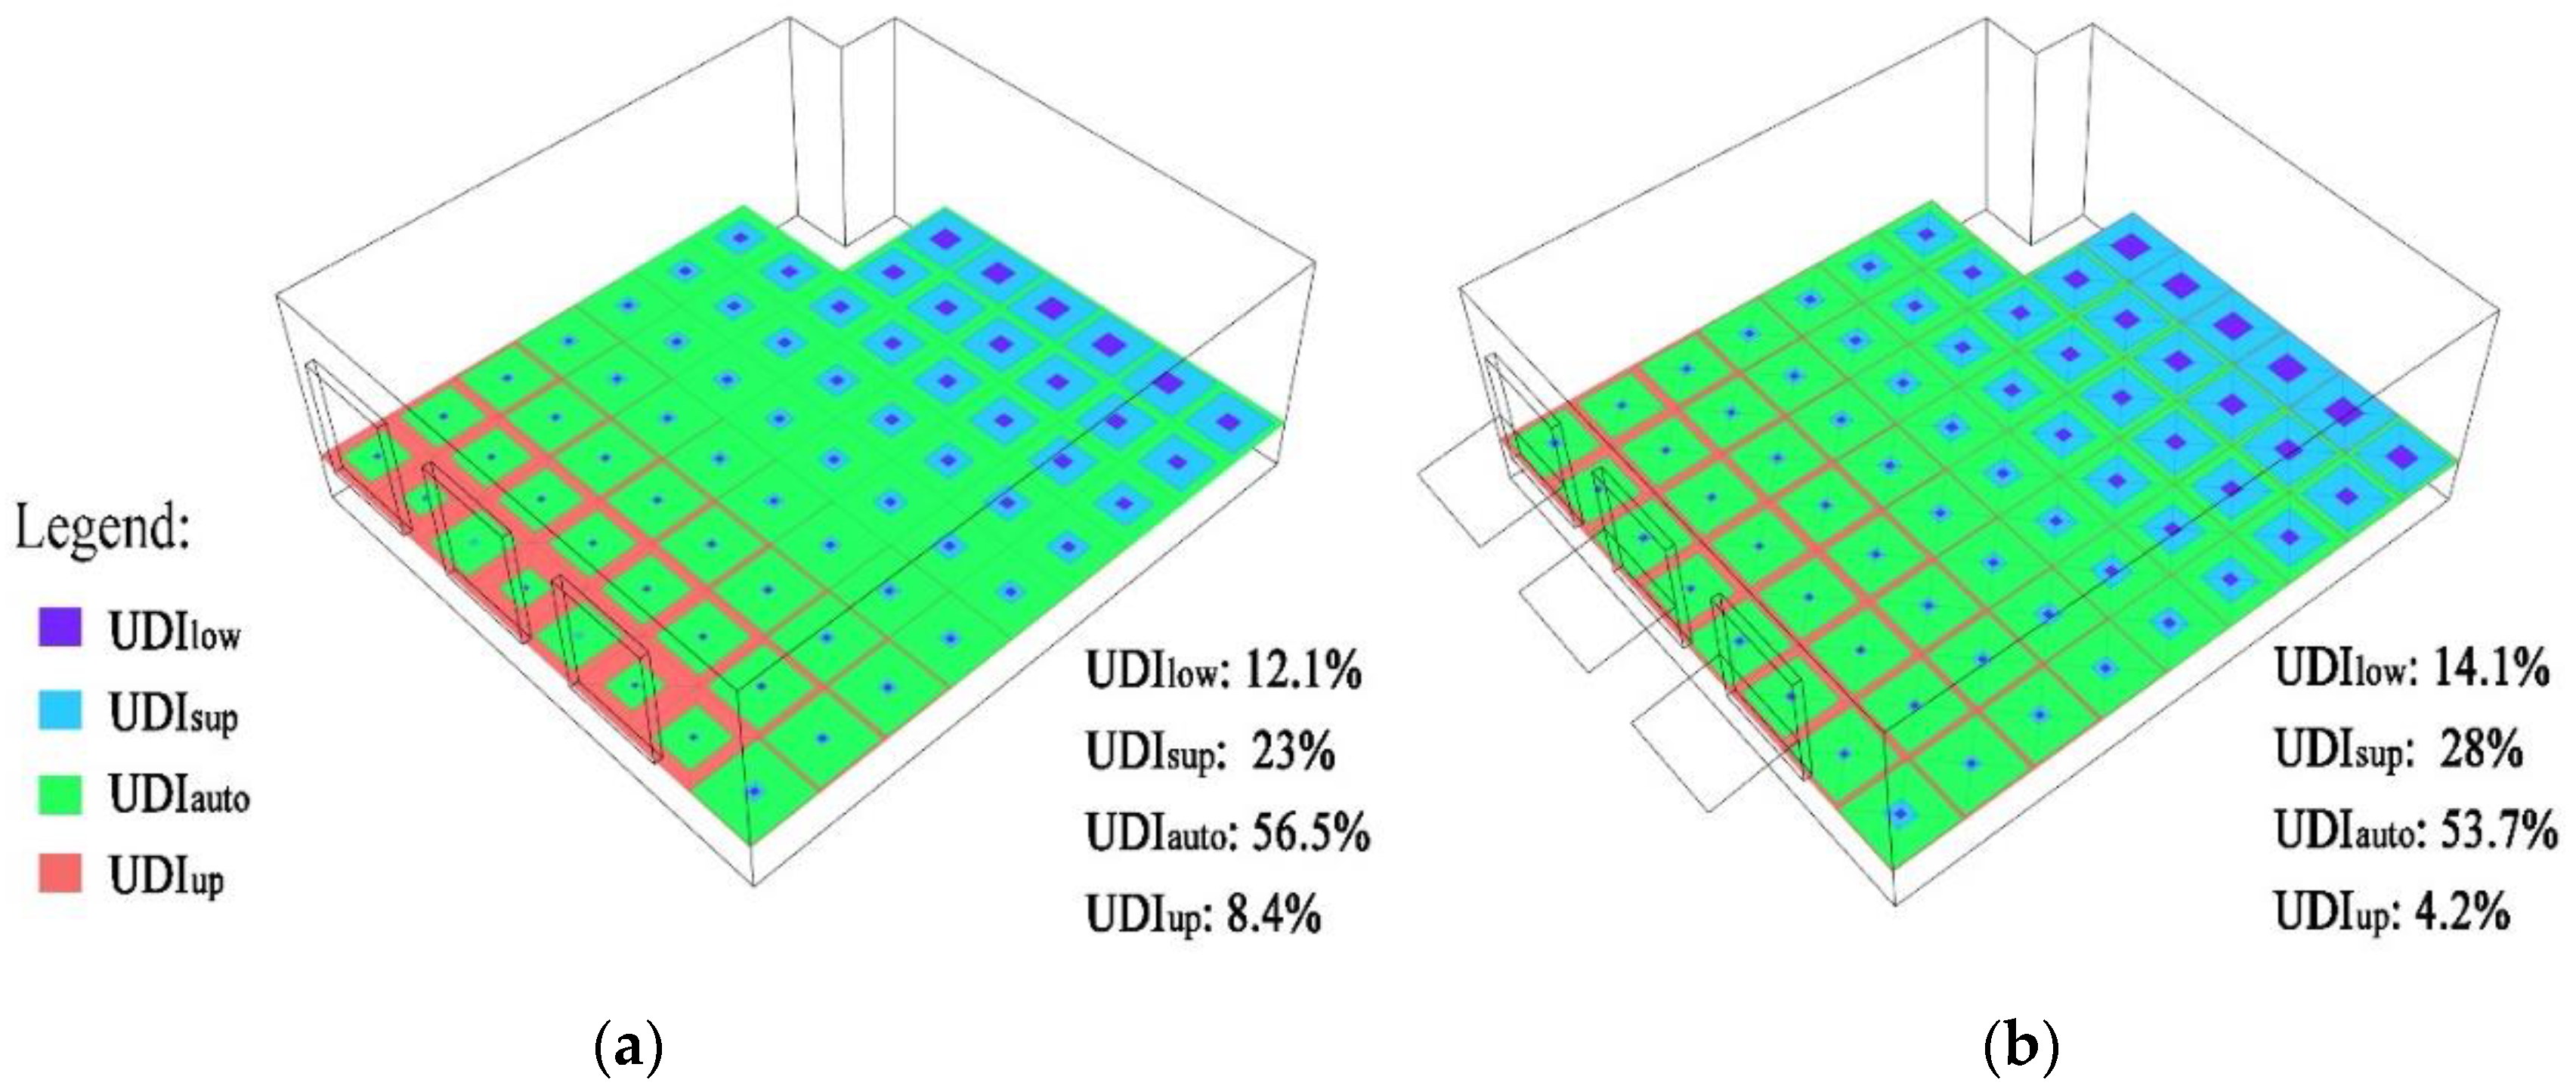
- The fixed PVSD in the Qingdao can increase the annual average UDI by 2.2% and reduce the annual average UDIup by 4.2%. When the fixed PVSD is installed at an angle of 35° and installed under the window eaves, the net EUI is the lowest 25.49 kwh/m2.
- 2)
- Simulation results show that the dynamic PVSD is superior to the fixed PVSD and the photovoltaic panel in terms of energy performance, and can also effectively improve the indoor daylighting environment.
- 3)
- Simultaneous changes in height and tilt angle (hybrid strategy) can achieve maximum energy-saving efficiency and higher daylighting levels.
- 4)
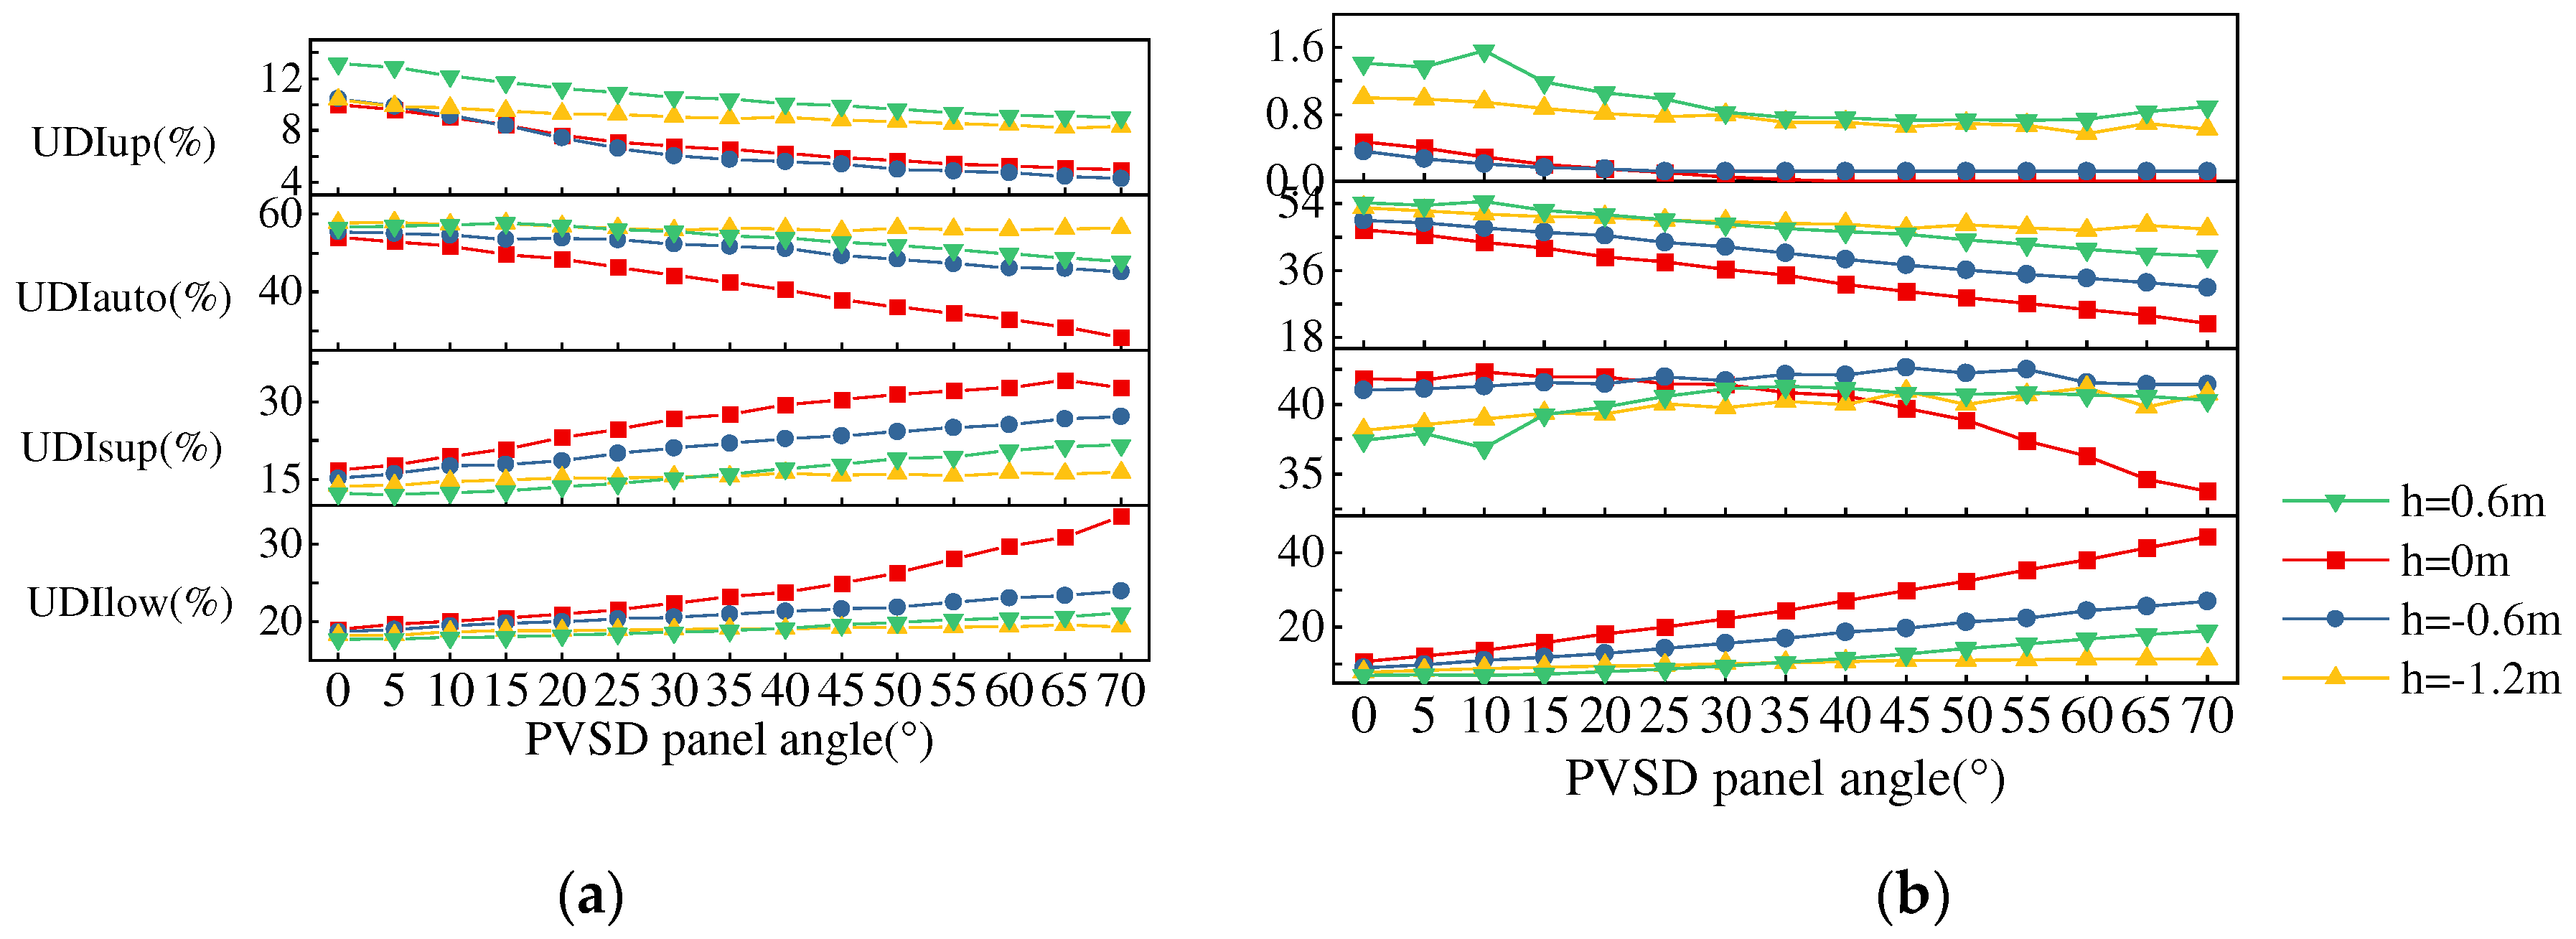
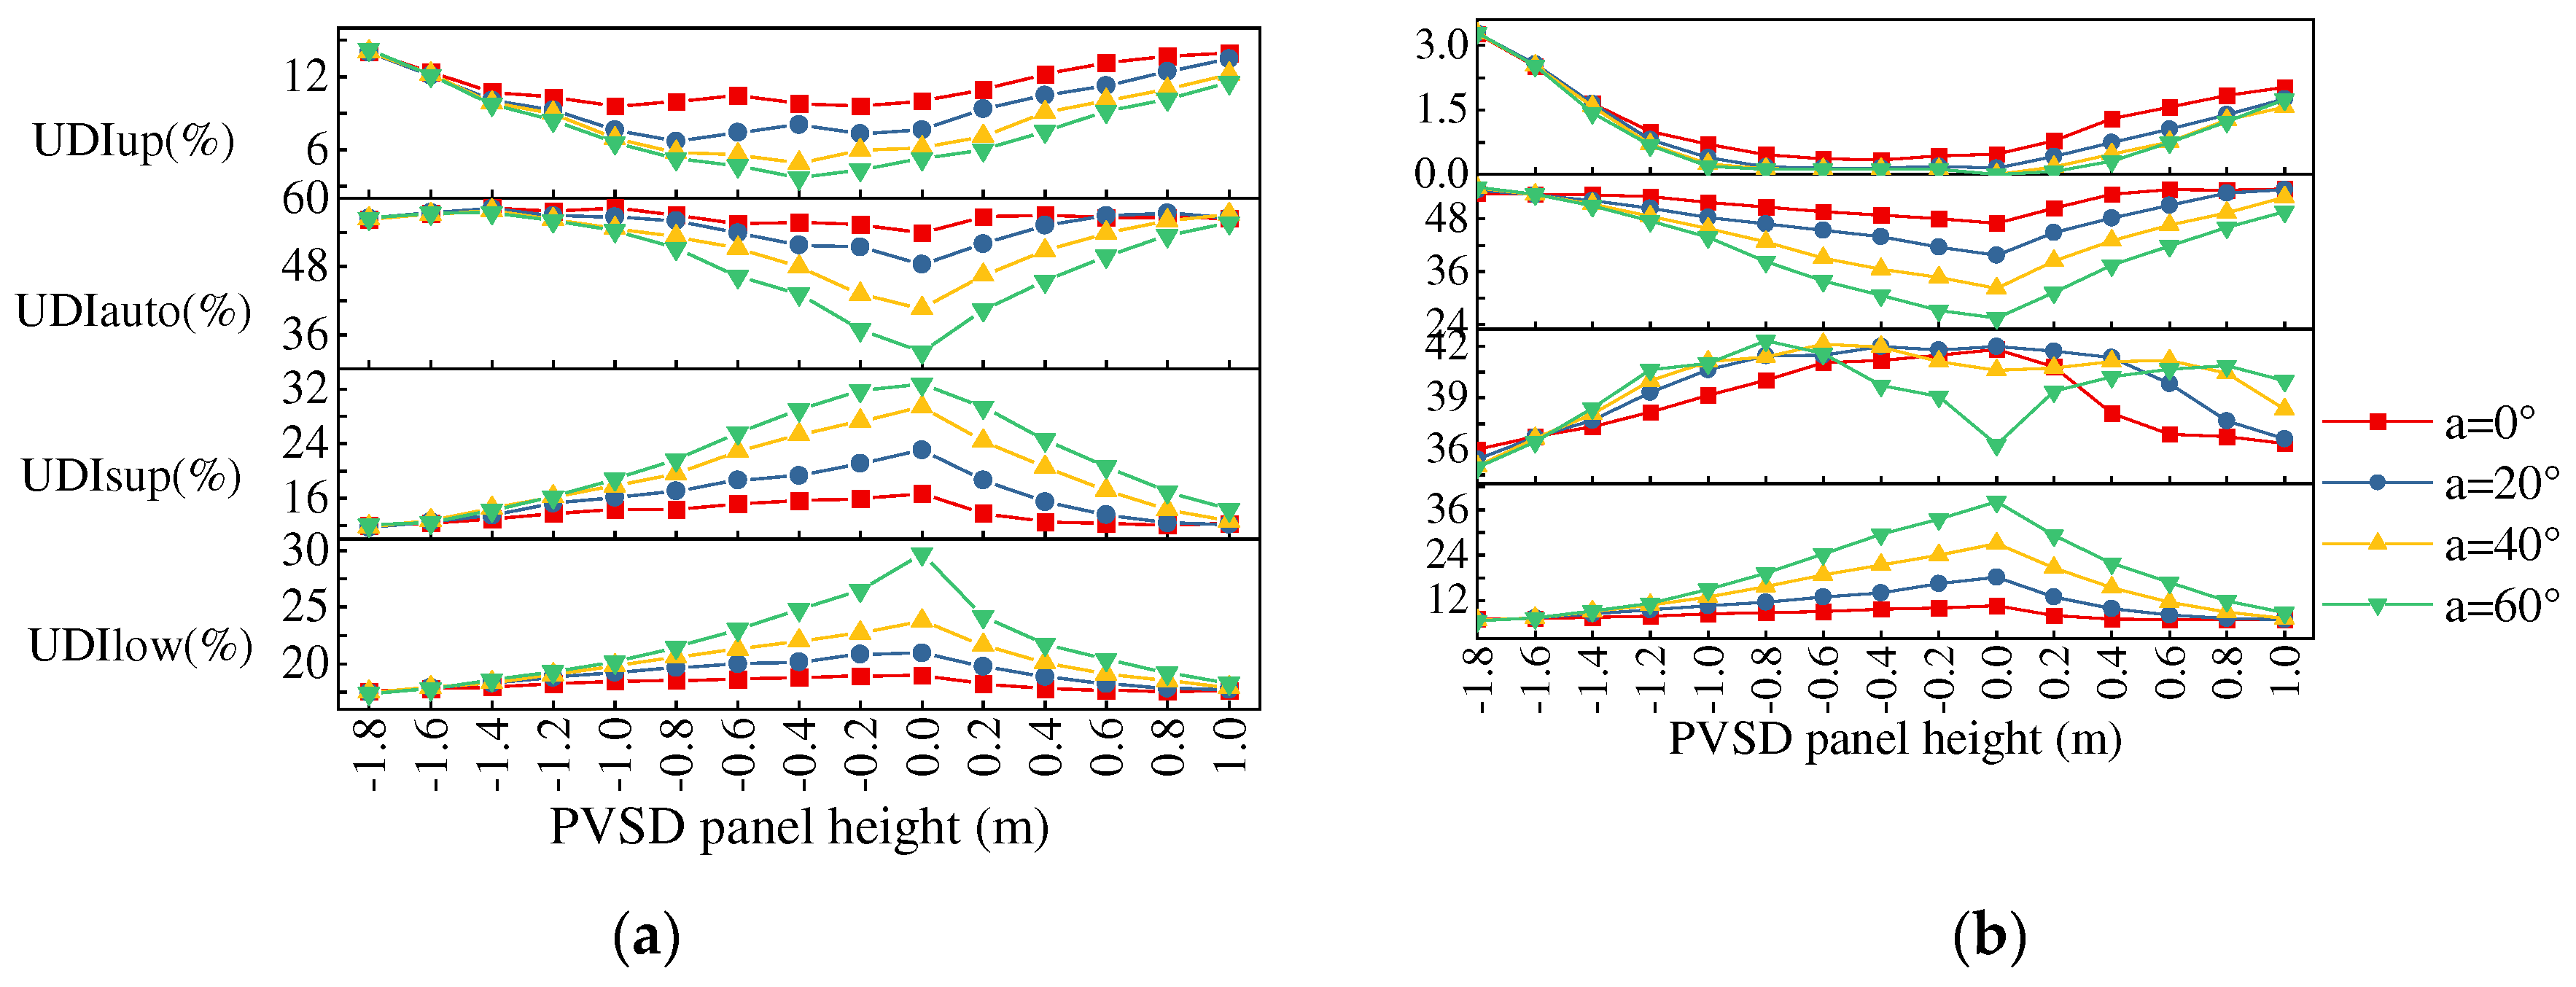
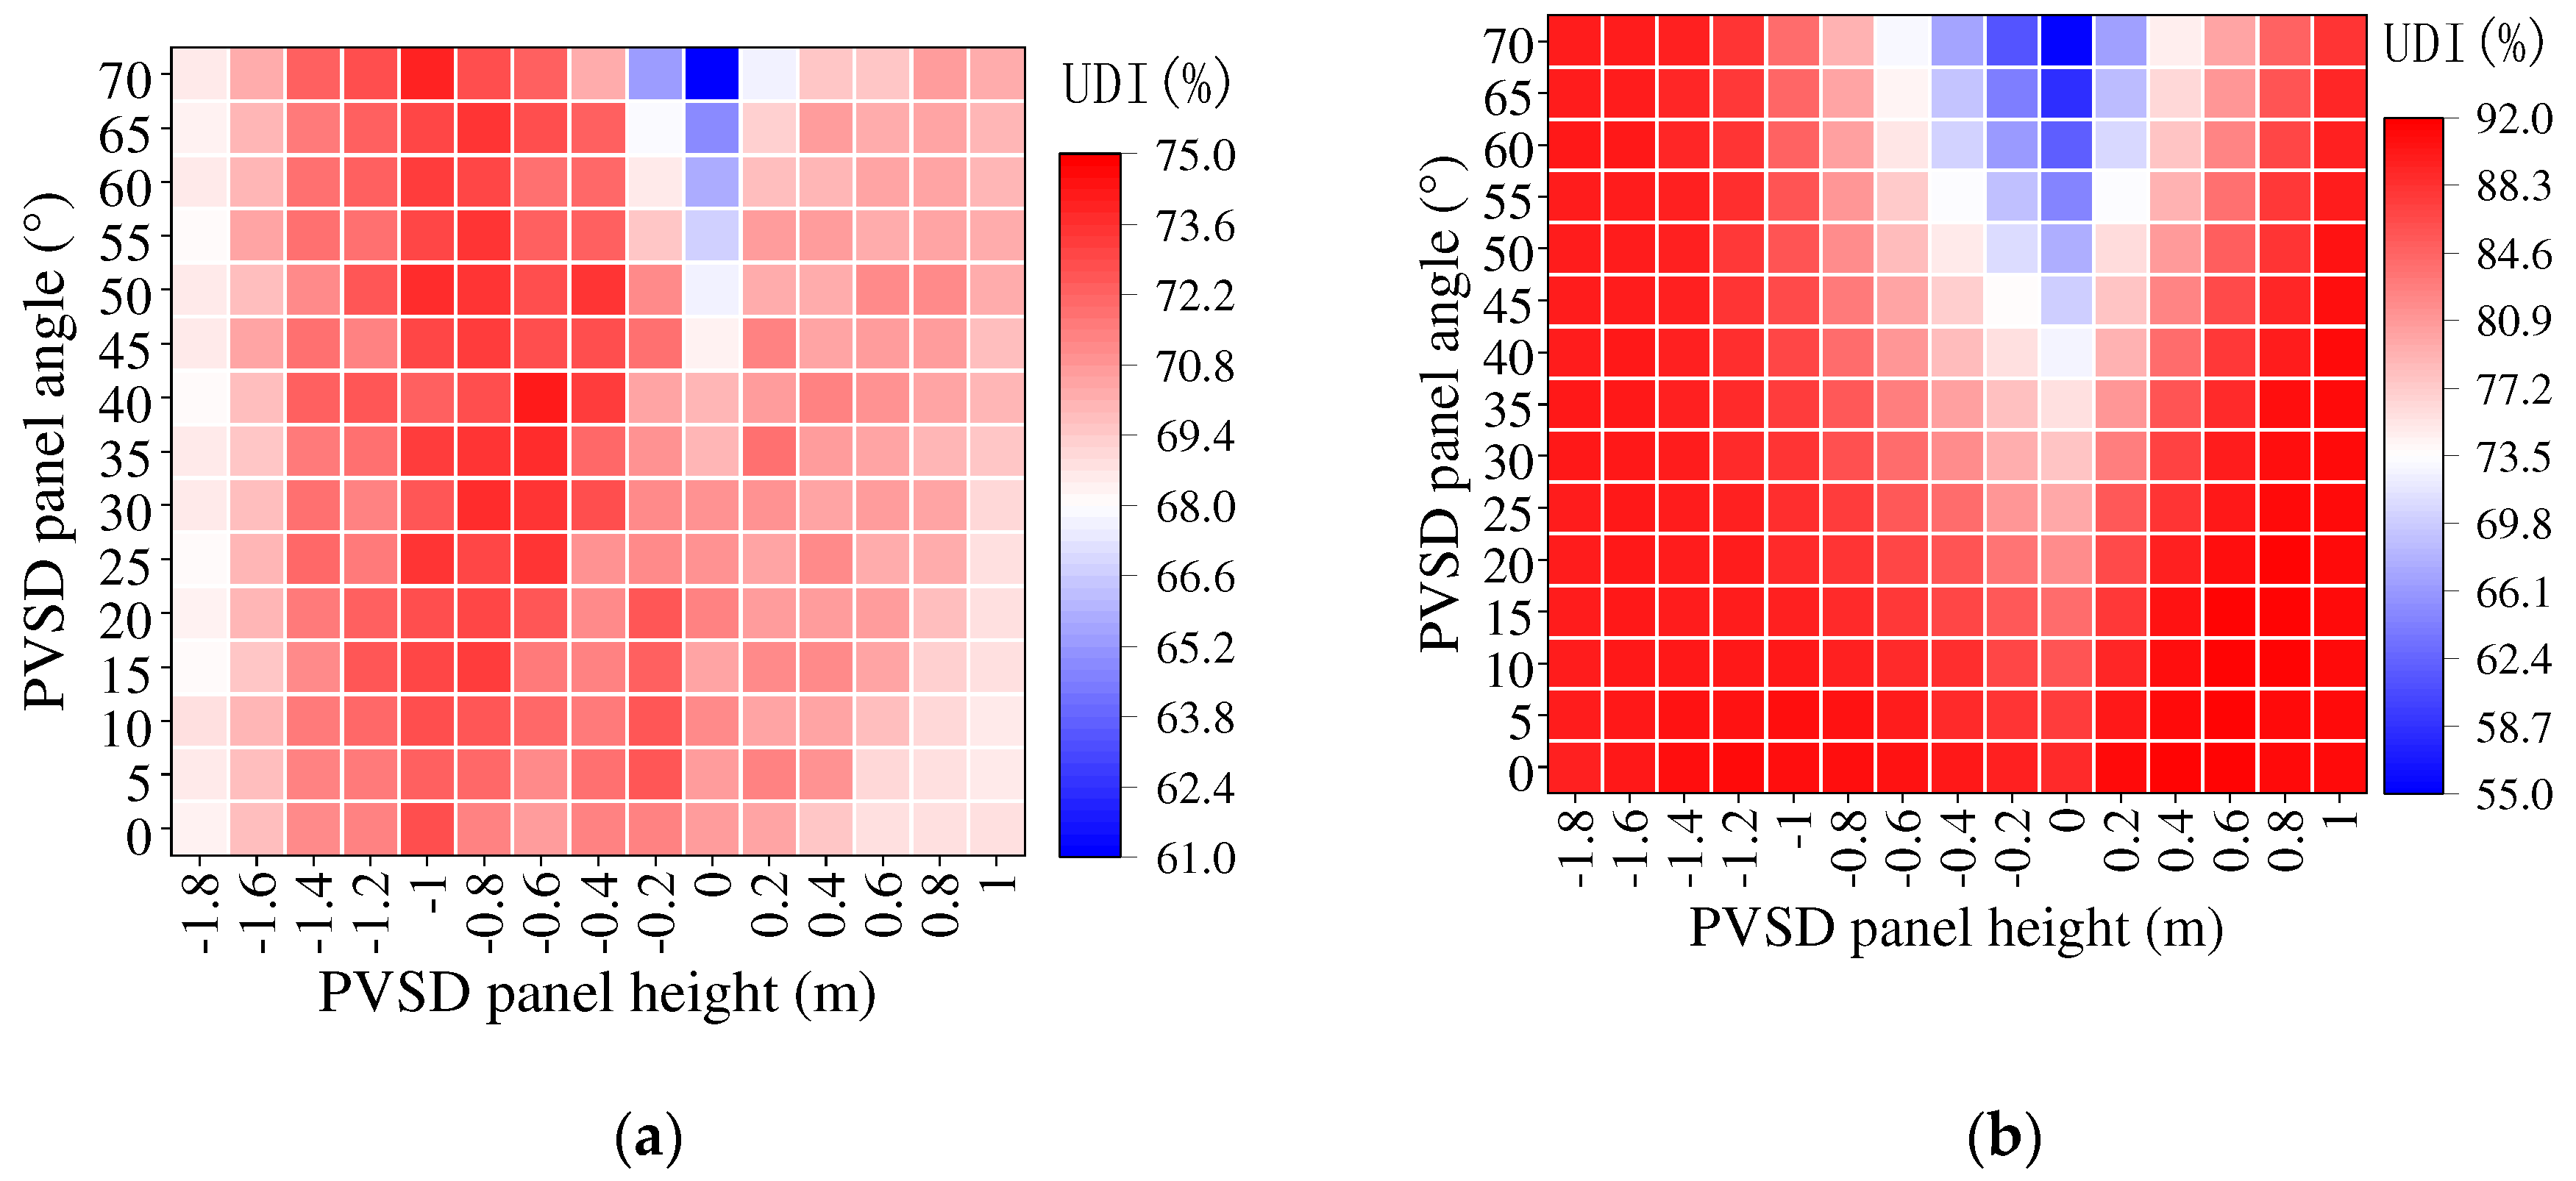
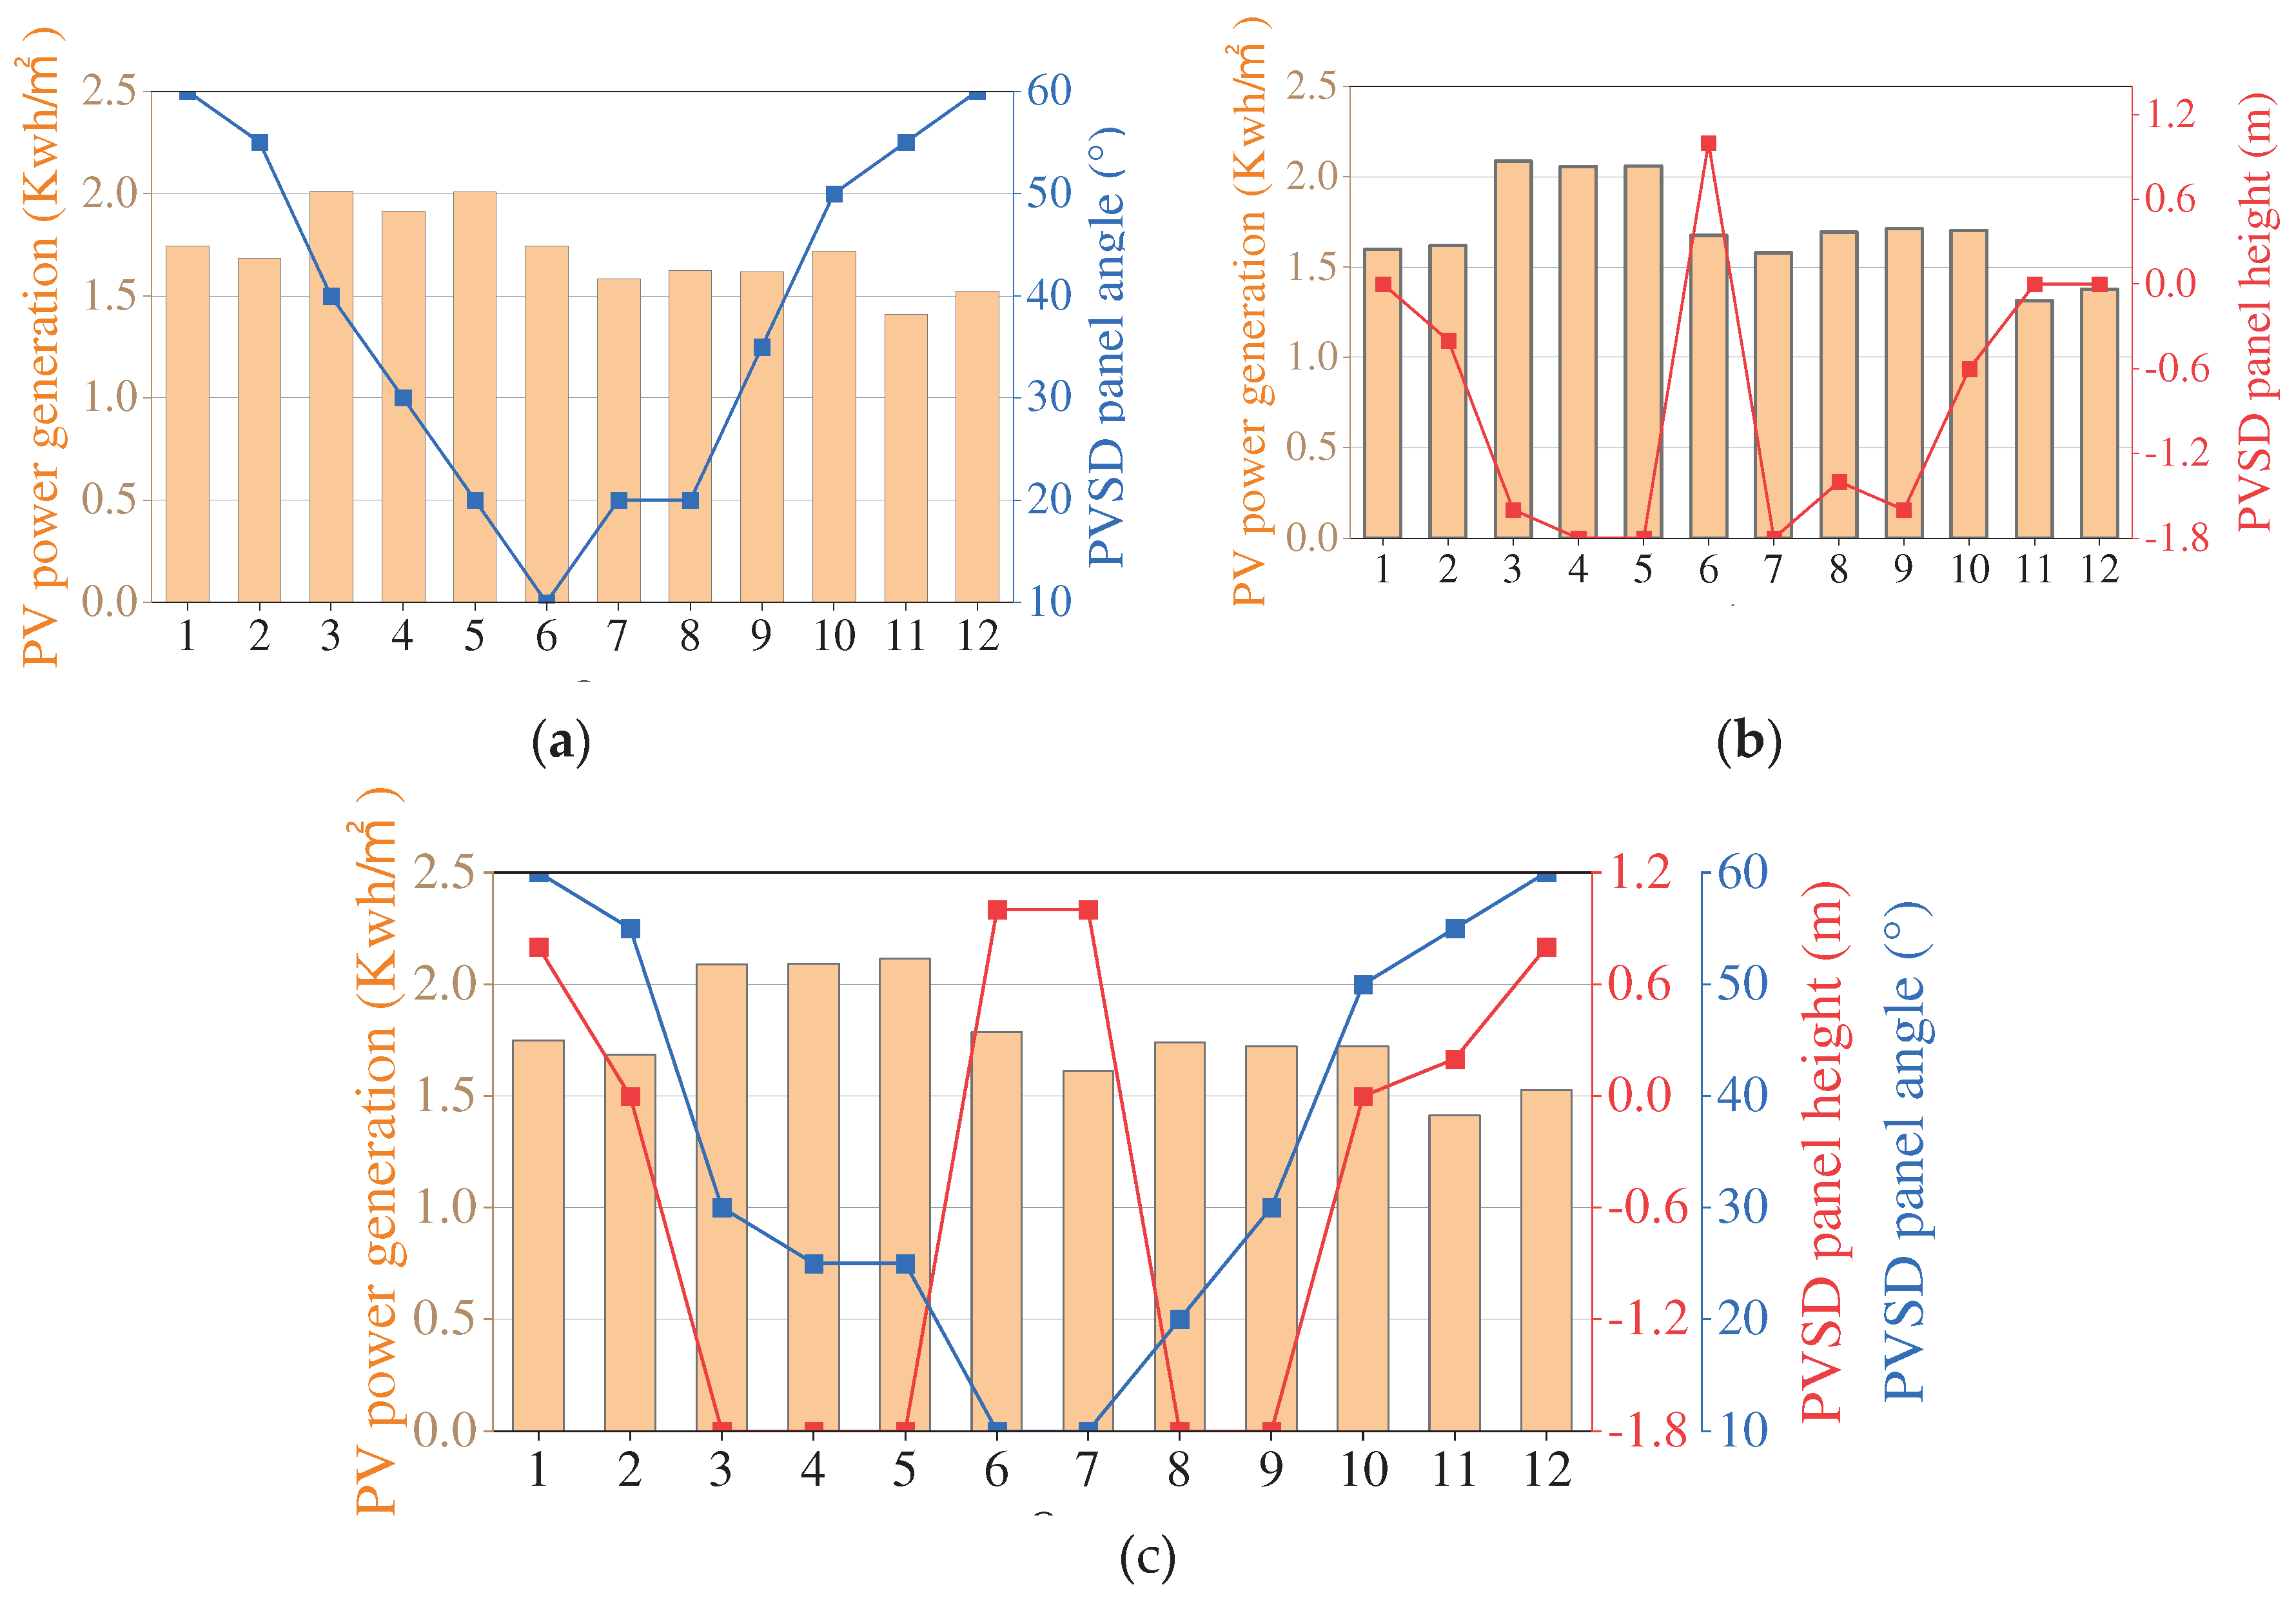
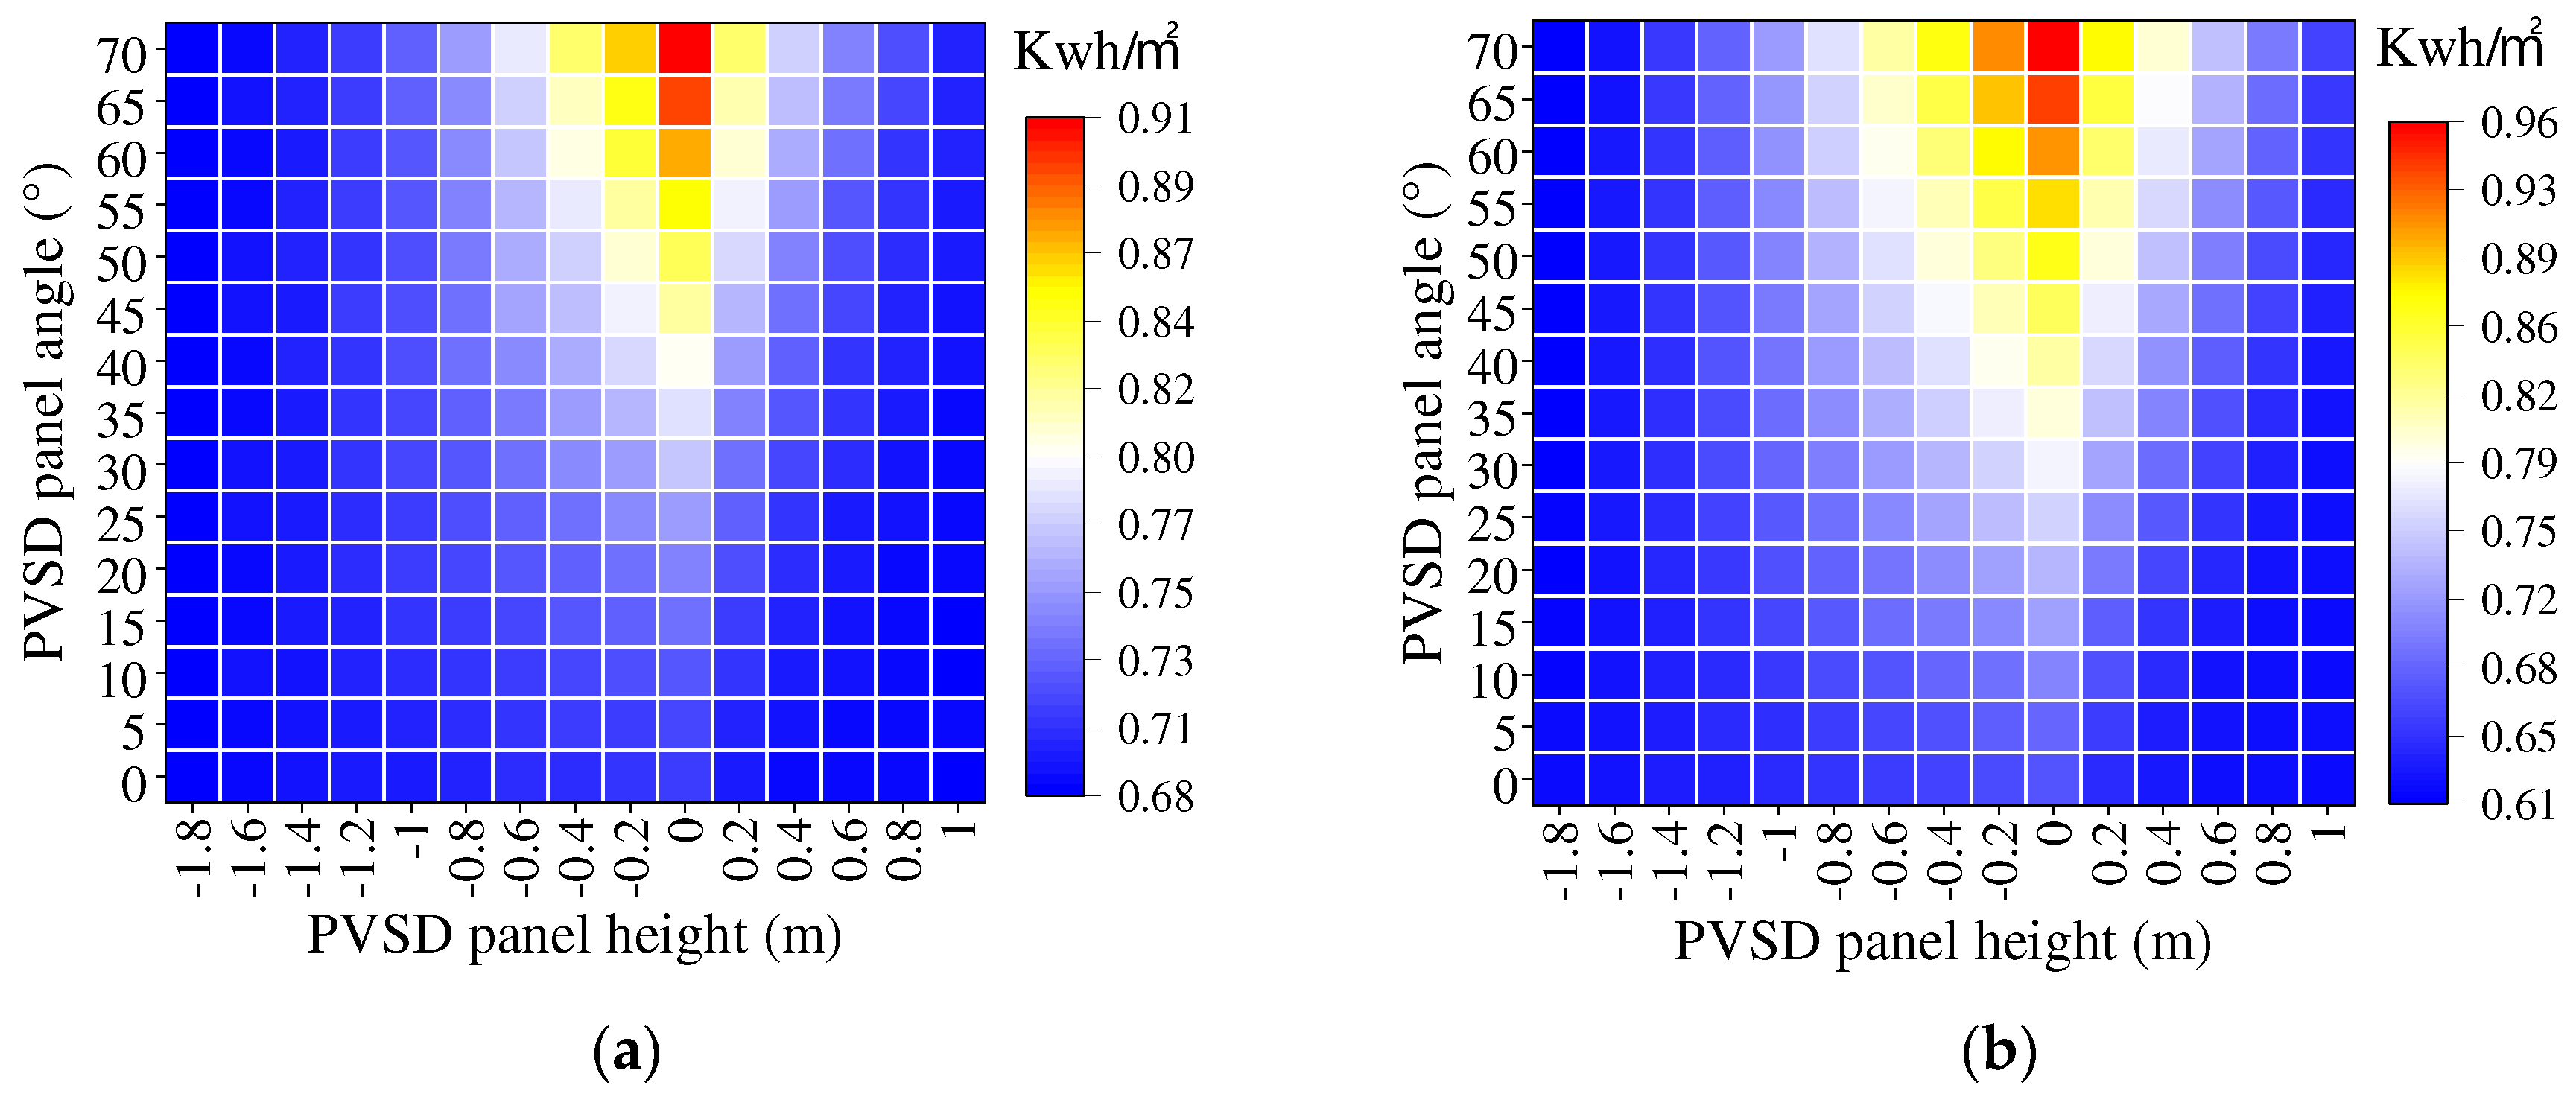
- In terms of daylighting, the greater the tilt angle of the PVSD and the closer to the upper eaves of the window (height is 0 m), the lower the indoor daylighting level will be. In terms of energy consumption, when the PVSD area is constant, the tilt angle has the greatest impact on power generation, while the height has a greater impact on energy consumption.
- 5)
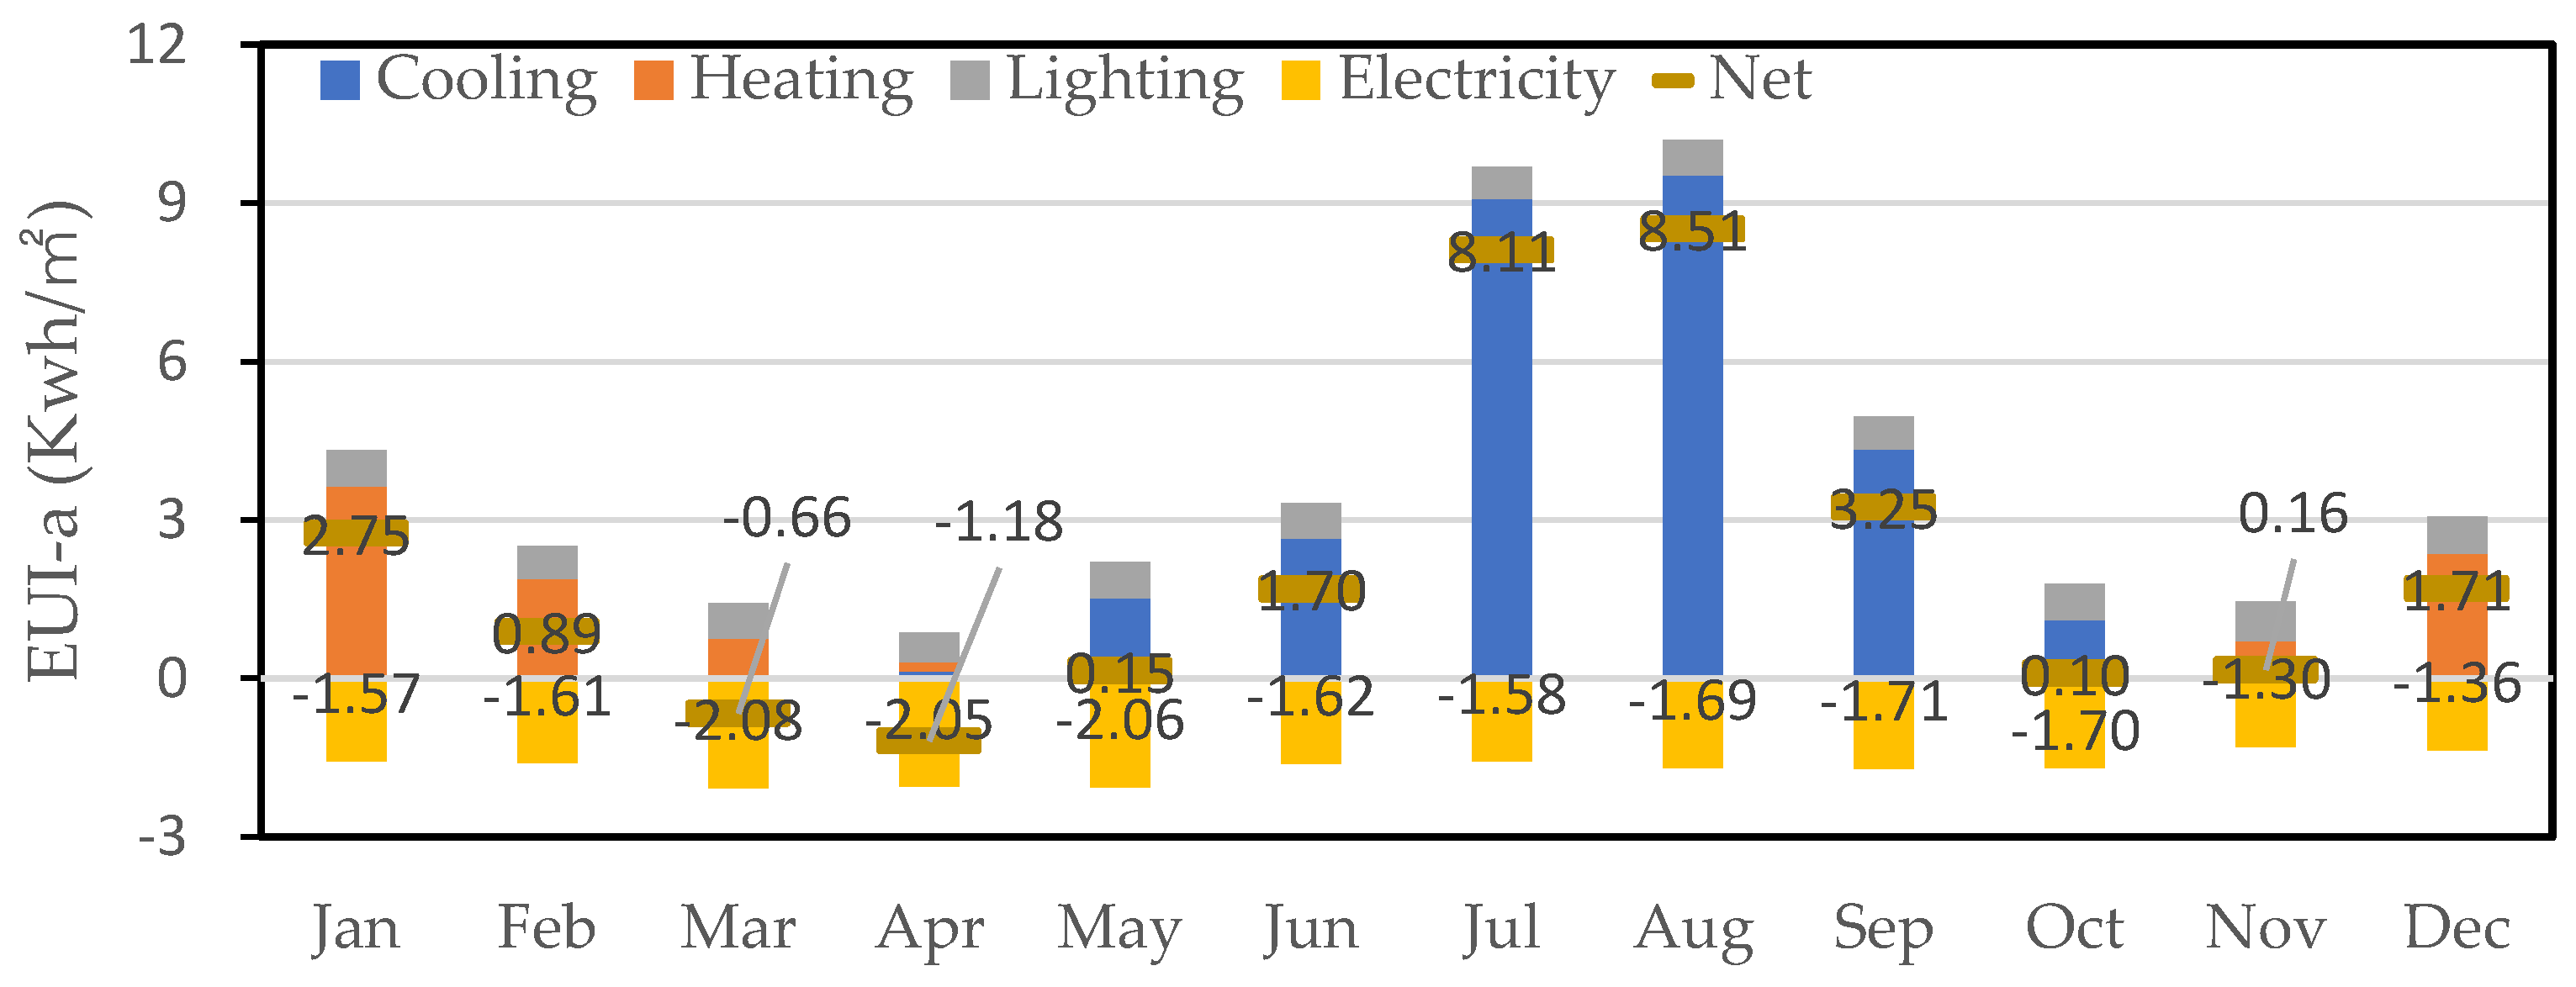
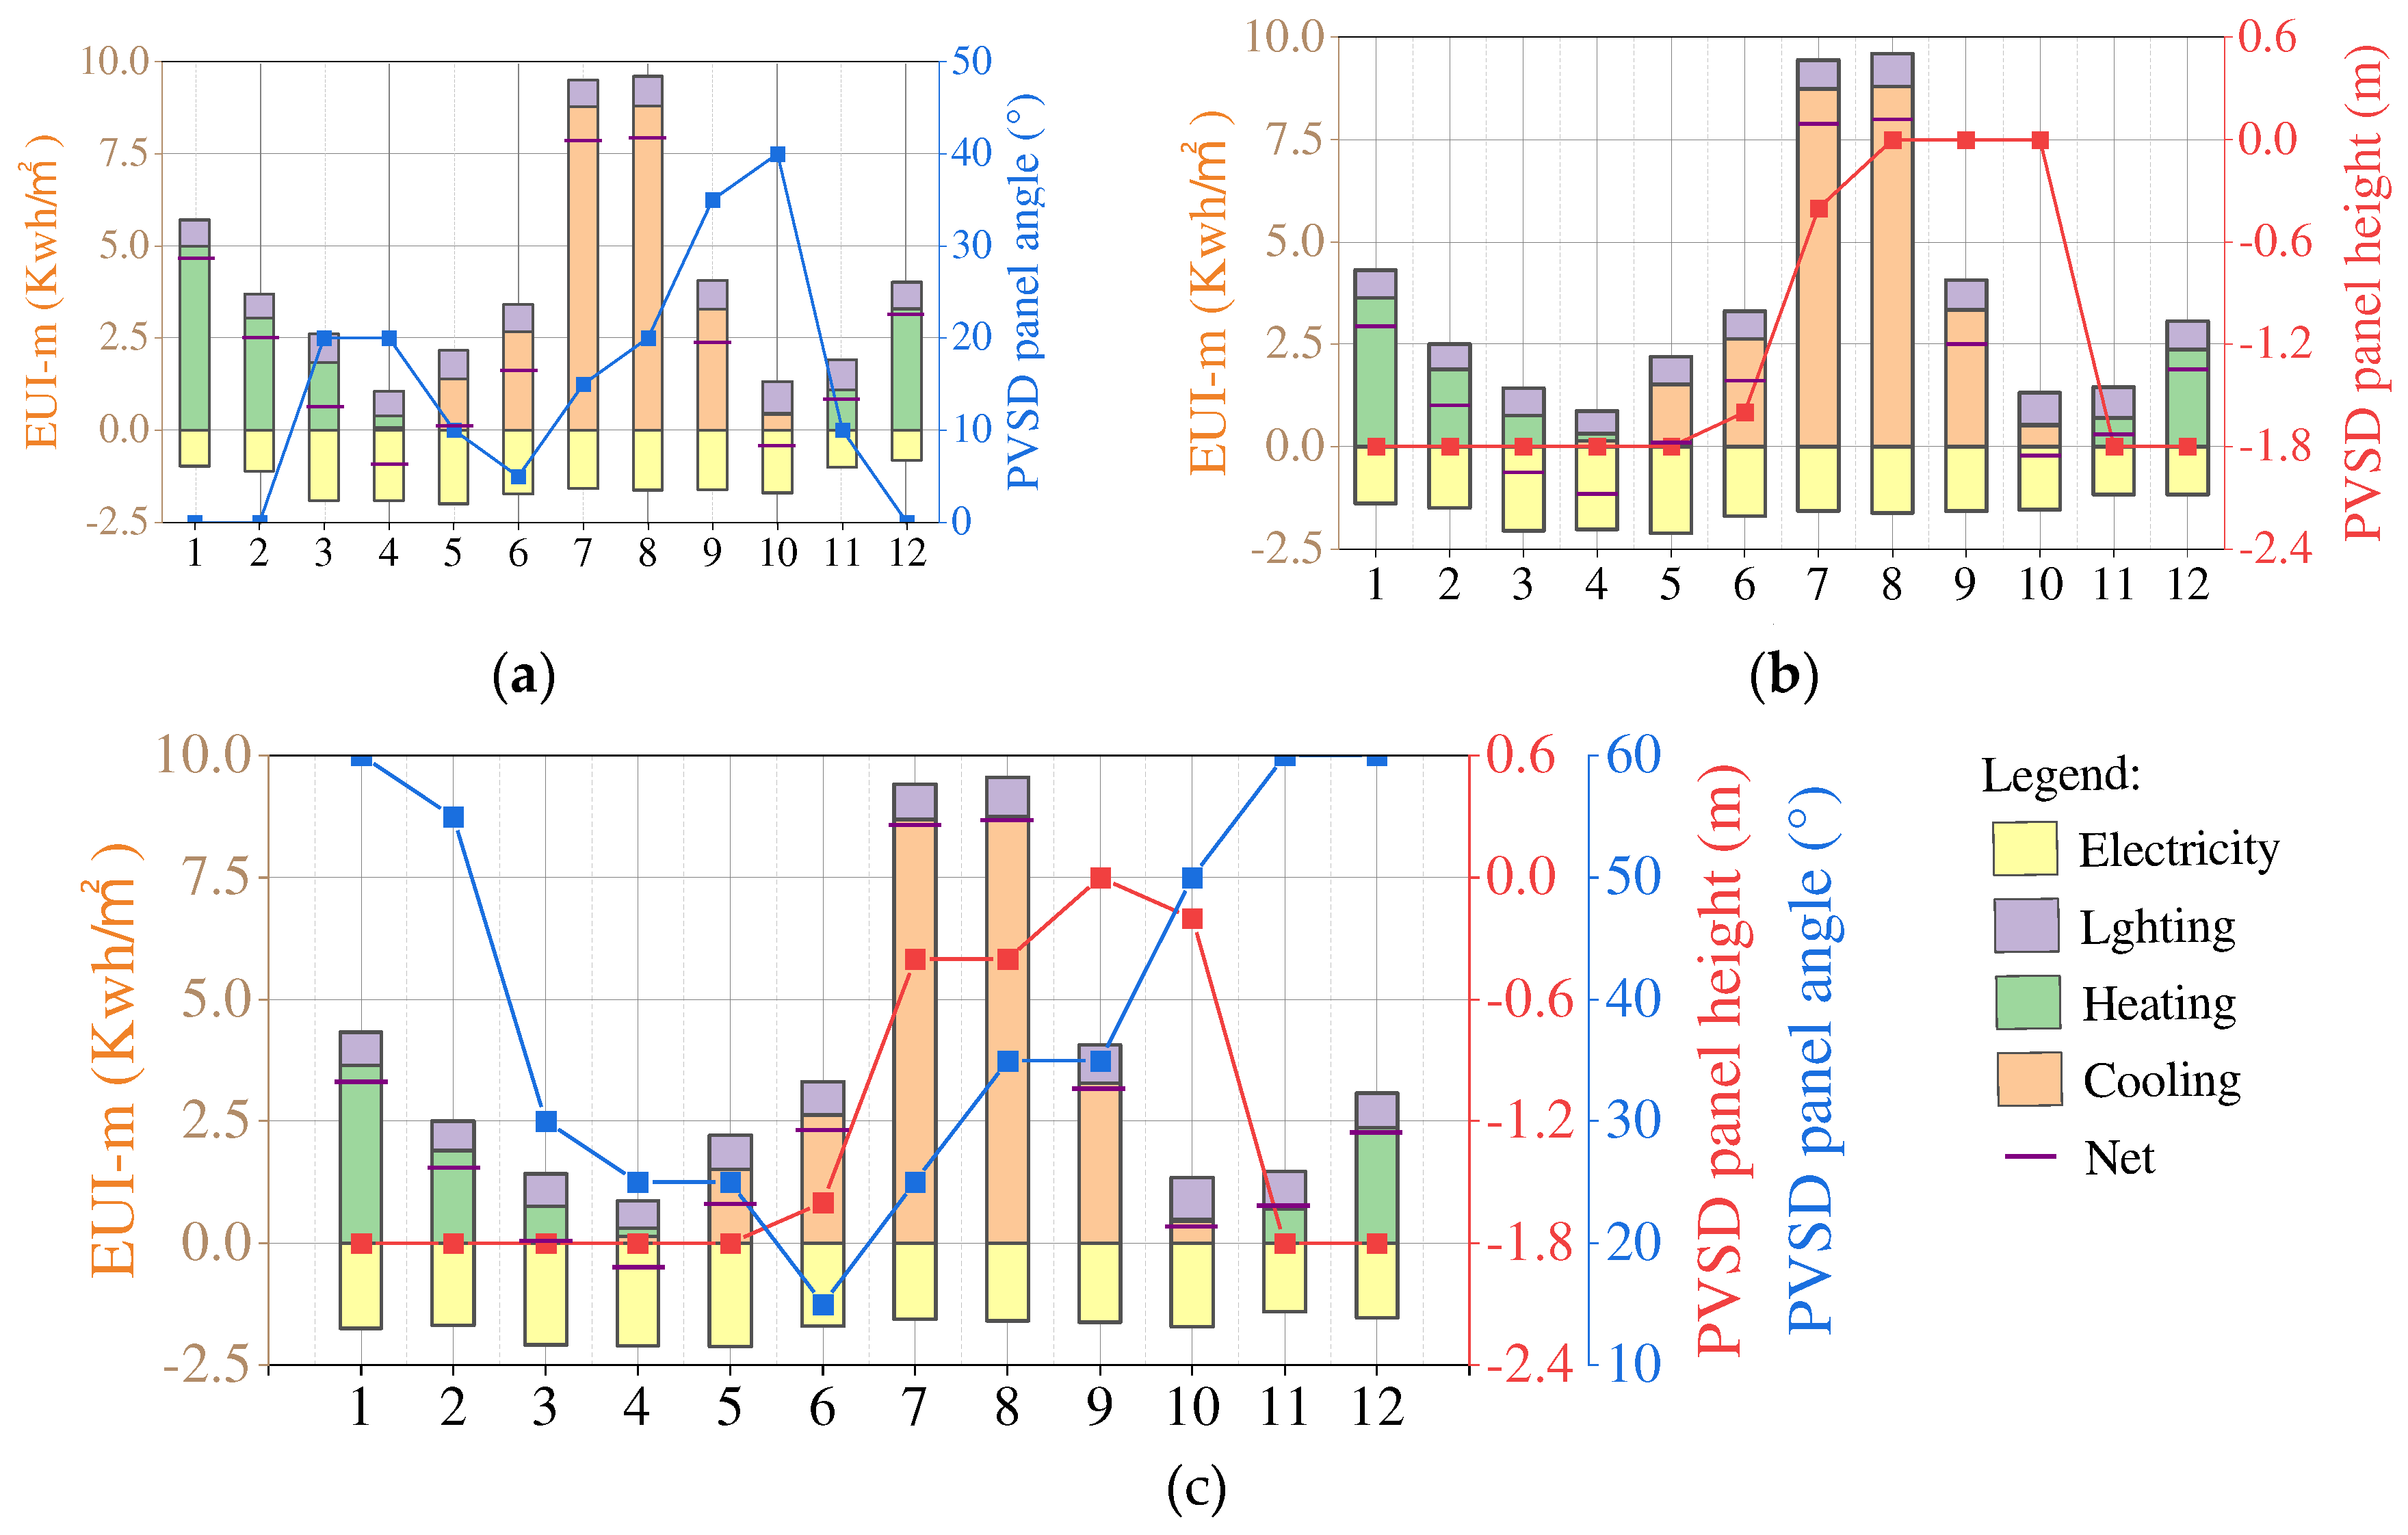
- Compared with no PVSD, the rotation strategy (installation height is 0 m), sliding strategy (tilt angle is 20°), and hybrid strategy can save energy by 32.13%, 47.22%, and 50.38% respectively. The three strategies increase the average UDI by 1.39%, 2.8% and 3.1% respectively.
Author Contributions
Funding
Data Availability Statement
Acknowledgments
Conflicts of Interest
References
- Building on the past and starting a new journey to address climate change globally. Available online: http://www.gov.cn/gongbao/content/2020/content_5570055.htm (accessed on 12/12).
- China, C.P.s.G.o.t.P.s.R.o. Action plan to peak carbon emissions before 2030. 2021.
- Efficiency, C.A.o.B.E. 2022 Research Report of China Building Energy Consumption and Carbon Emissions. 2022.
- Hao, D.; Qi, L.; Tairab, A.M.; Ahmed, A.; Azam, A.; Luo, D.; Pan, Y.; Zhang, Z.; Yan, J. Solar energy harvesting technologies for PV self-powered applications: A comprehensive review. Renewable Energy 2022, 188, 678–697. [Google Scholar] [CrossRef]
- Peng, C.; Huang, Y.; Wu, Z. Building-integrated photovoltaics (BIPV) in architectural design in China. Energy and buildings 2011, 43, 3592–3598. [Google Scholar] [CrossRef]
- Ekoe A Akata, A.M.; Njomo, D.; Agrawal, B. Assessment of Building Integrated Photovoltaic (BIPV) for sustainable energy performance in tropical regions of Cameroon. Renewable and Sustainable Energy Reviews 2017, 80, 1138–1152. [Google Scholar] [CrossRef]
- Jakica, N. State-of-the-art review of solar design tools and methods for assessing daylighting and solar potential for building-integrated photovoltaics. Renewable and Sustainable Energy Reviews 2018, 81, 1296–1328. [Google Scholar] [CrossRef]
- Taveres-Cachat, E.; Lobaccaro, G.; Goia, F.; Chaudhary, G. A methodology to improve the performance of PV integrated shading devices using multi-objective optimization. Applied Energy 2019, 247, 731–744. [Google Scholar] [CrossRef]
- Tzempelikos, A.; Athienitis, A.K. The impact of shading design and control on building cooling and lighting demand. Solar energy 2007, 81, 369–382. [Google Scholar] [CrossRef]
- Yu, G.; Yang, H.; Luo, D.; Cheng, X.; Ansah, M.K. A review on developments and researches of building integrated photovoltaic (BIPV) windows and shading blinds. Renewable and Sustainable Energy Reviews 2021, 149. [Google Scholar] [CrossRef]
- Skandalos, N.; Karamanis, D. An optimization approach to photovoltaic building integration towards low energy buildings in different climate zones. Applied Energy 2021, 295. [Google Scholar] [CrossRef]
- Noorzai, E.; Bakmohammadi, P.; Garmaroudi, M.A. Optimizing daylight, energy and occupant comfort performance of classrooms with photovoltaic integrated vertical shading devices. Architectural Engineering and Design Management 2022, 1–25. [Google Scholar] [CrossRef]
- Liu, J.; Bi, G.; Gao, G.; Zhao, L. Optimal design method for photovoltaic shading devices (PVSDs) by combining geometric optimization and adaptive control model. Journal of Building Engineering 2023, 69. [Google Scholar] [CrossRef]
- Long, W.; Chen, X.; Ma, Q.; Wei, X.; Xi, Q. An Evaluation of the PV Integrated Dynamic Overhangs Based on Parametric Performance Design Method: A Case Study of a Student Apartment in China. Sustainability 2022, 14, 7808. [Google Scholar] [CrossRef]
- Ma, Q.; Ran, S.; Chen, X.; Li, L.; Gao, W.; Wei, X. Study on the effect of photovoltaic louver shading and lighting control system on building energy consumption and daylighting. Energy Sources, Part A: Recovery, Utilization, and Environmental Effects 2023, 45, 10873–10889. [Google Scholar] [CrossRef]
- Mandalaki, M.; Zervas, K.; Tsoutsos, T.; Vazakas, A. Assessment of fixed shading devices with integrated PV for efficient energy use. Solar Energy 2012, 86, 2561–2575. [Google Scholar] [CrossRef]
- Marzouk, M.A.; Atwa, M. Daylighting and Energy Performance of PVSDs. Scientific Research Journal 2020, 8, 69–75. [Google Scholar] [CrossRef]
- Sadatifar, S.; Johlin, E. Multi-objective optimization of building integrated photovoltaic solar shades. Solar Energy 2022, 242, 191–200. [Google Scholar] [CrossRef]
- Chen, H.; Cai, B.; Yang, H.; Wang, Y.; Yang, J. Study on natural lighting and electrical performance of louvered photovoltaic windows in hot summer and cold winter areas. Energy and Buildings 2022, 271. [Google Scholar] [CrossRef]
- Kirimtat, A.; Tasgetiren, M.F.; Brida, P.; Krejcar, O. Control of PV integrated shading devices in buildings: A review. Building and Environment 2022, 214. [Google Scholar] [CrossRef]
- Svetozarevic, B.; Begle, M.; Jayathissa, P.; Caranovic, S.; Shepherd, R.F.; Nagy, Z.; Hischier, I.; Hofer, J.; Schlueter, A. Dynamic photovoltaic building envelopes for adaptive energy and comfort management. Nature Energy 2019, 4, 671–682. [Google Scholar] [CrossRef]
- Akbari Paydar, M. Optimum design of building integrated PV module as a movable shading device. Sustainable Cities and Society 2020, 62. [Google Scholar] [CrossRef]
- Krarti, M. Evaluation of PV integrated sliding-rotating overhangs for US apartment buildings. Applied Energy 2021, 293. [Google Scholar] [CrossRef]
- Kim, M.; Konstantzos, I.; Tzempelikos, A. Real-time daylight glare control using a low-cost, window-mounted HDRI sensor. Building and Environment 2020, 177. [Google Scholar] [CrossRef]
- Huo, H.; Xu, W.; Li, A.; Lv, Y.; Liu, C. Analysis and optimization of external venetian blind shading for nearly zero-energy buildings in different climate regions of China. Solar Energy 2021, 223, 54–71. [Google Scholar] [CrossRef]
- Grynning, S.; Lolli, N.; Wågø, S.; Risholt, B. Solar Shading in Low Energy Office Buildings - Design Strategy and User Perception. Journal of Daylighting 2017, 4, 1–14. [Google Scholar] [CrossRef]
- Barzegar Ganji, H.; Utzinger, D.M.; Bradley, D.E. Create and Validate Hybrid Ventilation Components in Simulation Using Grasshopper and Python in Rhinoceros. In Proceedings of the Proceedings of Building Simulation 2019: 16th Conference of IBPSA, 2020; pp. 4345-4352.
- Feng, K.; Lu, W.; Wang, Y. Assessing environmental performance in early building design stage: An integrated parametric design and machine learning method. Sustainable Cities and Society 2019, 50. [Google Scholar] [CrossRef]
- China, M.o.H.a.U.-R.D.o.t.P.s.R.o. General code for energy efficiency and renewable energy application in buildings. 2021.
- Carlucci, S.; Causone, F.; De Rosa, F.; Pagliano, L. A review of indices for assessing visual comfort with a view to their use in optimization processes to support building integrated design. Renewable and Sustainable Energy Reviews 2015, 47, 1016–1033. [Google Scholar] [CrossRef]
- Mardaljevic, J.; Heschong, L.; Lee, E. Daylight metrics and energy savings. Lighting Research & Technology 2009, 41, 261–283. [Google Scholar] [CrossRef]
- Reinhart, C.F.; Mardaljevic, J.; Rogers, Z. Dynamic daylight performance metrics for sustainable building design. Leukos 2006, 3, 7–31. [Google Scholar] [CrossRef]
- Reinhart, C.F.; Walkenhorst, O. Validation of dynamic RADIANCE-based daylight simulations for a test office with external blinds. Energy and buildings 2001, 33, 683–697. [Google Scholar] [CrossRef]
- Rogers, Z.; Goldman, D. Daylighting metric development using daylight autonomy calculations in the sensor placement optimization tool. Boulder, Colorado, USA: Architectural Energy Corporation: http://www. archenergy. com/SPOT/SPOT_Daylight% 20Autonomy% 20Report. pdf 2006.
- Committee, I.D.M. IES Spatial Daylight Autonomy (sDA) and Annual Sunlight Exposure (ASE), Daylight Metrics Committee. Approved Method IES LM-83-12. Illuminating Engineering Society of North America 2012.
- Nabil, A.; Mardaljevic, J. Useful daylight illuminances: A replacement for daylight factors. Energy and Buildings 2006, 38, 905–913. [Google Scholar] [CrossRef]
- Mardaljevic, J. Climate-based daylight modelling and its discontents. in: CIBSE Tech. Symp., London, 2015, pp. 1–12.
- Mardaljevic, J.; Andersen, M.; Roy, N.; Christoffersen, J. Daylighting metrics: is there a relation between useful daylight illuminance and daylight glare probabilty? In Proceedings of the Proceedings of the building simulation and optimization conference BSO12, 2012.
- Star, E. US energy use intensity by property type. Energy Star 2016.
- Guideline, A. Measurement of energy, demand, and water savings. ASHRAE guidel 2014, 4, 1–150. [Google Scholar]
- Merghani, A.H.; Bahloul, S.A. Comparison between Radiance Daylight Simulation Software Results andMeasured on-Site Data. Journal of Building and Road Research 2016, 20. [Google Scholar] [CrossRef]
- Lakhdari, K.; Sriti, L.; Painter, B. Parametric optimization of daylight, thermal and energy performance of middle school classrooms, case of hot and dry regions. Building and Environment 2021, 204. [Google Scholar] [CrossRef]
- Yoon, Y.; Moon, J.W.; Kim, S. Development of annual daylight simulation algorithms for prediction of indoor daylight illuminance. Energy and Buildings 2016, 118, 1–17. [Google Scholar] [CrossRef]




| Component | Value | Unit |
|---|---|---|
| External wall U-value | 0.36 | W/(m2K) |
| Roof U-value | 0.47 | W/(m2K) |
| Window U-value | 2.58 | W/(m2K) |
| Airtightness | 0.0003 | m3/s-m2 |
| Lighting load | 8 | W/m2 |
| Equipment load | 15 | W/m2 |
| Ventilation per person | 0.0084 | m3/s-ppl |
| Building elements | RGB reflectance | Roughness | Speculariy | Transmissivity |
|---|---|---|---|---|
| Opaque wall | 0.85,0.85,0.85 | 0.05 | 0.0013 | - |
| Ceiling | 0.16,0.17,0.17 | 0.005 | 0.008 | - |
| Floor | 0.4,0.45,0.41 | 0.002 | 0.05 | - |
| Window | - | - | - | 0.65 |
| Glass wall | - | - | - | 0.65 |
| Variables | Range of values | Value interval | Unit |
|---|---|---|---|
| Width | 0.2 ~ 1.2 | 0.2 | Meter |
| Sliding height | -1.8 ~ 1 | 0.2 | Meter |
| Tilt angle | 0 ~ 70 | 5 | Degree |
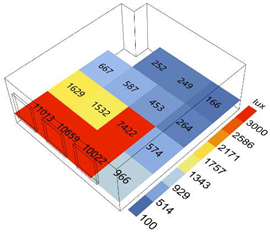
| 10:30 | 12:30 | |
|---|---|---|
| Measured |
 Average illumination: 3118.47 lux |
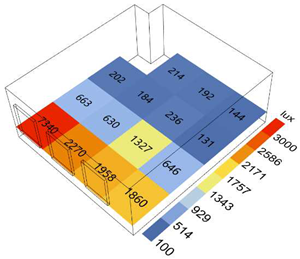 Average illumination: 1199.8 lux |
| Simulated |
 Average illumination: 3096.91 lux |
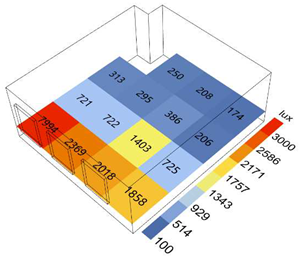 Average illumination: 1309.63 lux |
| MBE | 0.69% | -9.15% |
| CV (RMSE) | 21.78 | 15.53% |
Disclaimer/Publisher’s Note: The statements, opinions and data contained in all publications are solely those of the individual author(s) and contributor(s) and not of MDPI and/or the editor(s). MDPI and/or the editor(s) disclaim responsibility for any injury to people or property resulting from any ideas, methods, instructions or products referred to in the content. |
© 2024 by the authors. Licensee MDPI, Basel, Switzerland. This article is an open access article distributed under the terms and conditions of the Creative Commons Attribution (CC BY) license (http://creativecommons.org/licenses/by/4.0/).


