Submitted:
08 February 2024
Posted:
12 February 2024
You are already at the latest version
Abstract
Applying the iterative methodology for dimensionality reduction/feature selection using categorical gradient boosted trees, as it has been defined in and has been successfully applied on similar datasets in and , on a dataset consisted of 12708 gene expressions coming from 5052 individuals from 105 studies, we classify whether a person has acute myeloid leukaemia (AML) or is healthy. A CatBoost model on a dataset with reduced dimensions of 72 genes reached a ROC-AUC score of 0.9973 using ten fold cross validation (10CV) and ROC-AUC: 0.9988 on an inference dataset. We further investigate the options of using less genes that potentially could be used in clinical practise and genes than have not been associated to AML yet, or to blood cancer in general. On the same folds of the 10CV and on the same inference dataset the performance of the tuned CatBoost models show that it could be the case that not all genes with an association to AML have been found yet and 19 genes could be enough to predict AML: CatBoost63 (ROC-AUC: 0.9941, Test: 0.9942), CatBoost19: (ROC-AUC: 0.9946, Test: 0.9941) and CatBoost15: (ROC-AUC: 0.9922, Test: 0.9900). In addition, our results verify that a gene diagnostic test for AML could be possible in the future as well as further research is needed on these 15 genes that it could lead to new and better drugs.
Keywords:
acute myeloid leukemia
; blood transcriptomics
; machine learning
; explainable artificial intelligence
; Catboost
1. Introduction
Acute myeloid leukaemia (AML) [4] is the most frequent sort of leukemia for adults, while having the lowest survival rate of all leukemias [5]. When diagnosed with AML after the age of 65, mortality exceeds 90% [6]. For AML in the majority of cases, no early detectable symptoms occur [6]. Meanwhile not treating AML is fatal [5,7] and a quick prognosis can have a significant impact on overall survival, even in an intensive care unit [8]. A study analyzing over 25 different gene expressions of AML has shown that there are various genes associated to the disease [9]. In this paper gene expression data is used to create a machine learning model which classifies AML versus healthy cases. We also created a machine learning model which classifies AML versus healthy and patients from other diseases. We sought to improve the identification of AML-related genes by generating a new model. Our work could be seen as complementary to the work in [1,3] since 26 genes not associated to AML have already been identified using probe-set dataset, where here we identify 63 more.
Using machine learning, the diagnosis of AML can be improved, essentially creating a screening tool [10,11]. Here we present a newly-developed method to utilize machine learning in early diagnosis of AML. The actual dataset that is used in this paper has been used before to predict the AML disease [12]. In this paper, a new and different method will be used to exceed the prediction performance of the previous work on the same dataset. In order to classify the actual cases of AML versus healthy, we follow the same methodology which has been defined in [1] and applied successfully in [1,3]. Namely, starting from 12708 genes we tune a CatBoost model [13] and we used it as dimensionality reduction technique taking into account features’ importance for both predictability and loss function. We identify the 100 most important features regarding both, predictability and loss function and we compute the intersection of them. The intersection contains 57 genes. We know from [1] than there are 26 genes which are highly correlated with AML. We take the intersection from this 26 genes and the initial 12708. This leads as to 15 genes. We add these 15 genes to the 57 genes and we tune a new CatBoost model on these 72 genes. Finally, similarly to [1,3] we keep only 62 genes for which there is no bibliographic reference of them to AML; we add only one gene which is highly correlated to AML and we end up to 63 genes.
To establish a gene set with potential diagnostic utility for AML, we aimed to limit our analysis to no more than 20 genes. By selecting the top 19 genes based on their importance, we tuned a CatBoost model, which demonstrated remarkable predictive performance, evidenced by a ROC-AUC of 0.9946 during 10CV and 0.9941 on the independent inference dataset. Further optimization led to a final model configuration based on a subset of 15 genes from the initial 19, noteworthy for their lack of previous association with any form of blood cancer. The adjusted model achieved a ROC-AUC of 0.9922 in 10CV and 0.9900 in the inference dataset, suggesting the potential for undiscovered gene associations with AML. Our findings serve as a complementary extension to the research conducted by Angelakis et al. [1,3], which utilized a larger feature space comprising probe-sets nearly fourfold greater in size. The implications of our study extend to the delineation of a gene profile characteristic of AML and the novel identification of genes implicated in AML that have not been previously associated with the disease. Crucially, the discovery that genes not previously associated with AML can predict the disease underscores the potential for groundbreaking advancements in drug discovery. This revelation opens new avenues for therapeutic intervention, allowing for the exploration of novel targets that may offer more effective or specific treatments for AML. By broadening the genetic landscape associated with AML, our research paves the way for the development of innovative drugs that could significantly enhance patient outcomes by targeting these newly identified genetic markers.
2. Materials and Methods
The initial dataset is a publicly available and contains three datasets, derived from 105 studies [12]. Each of these datasets contain blood transcriptomics data. The first dataset uses HG-U133A microarray to asses 2500 samples of 2500 individuals. The second dataset uses HG-U133 microarray to asses 8348 samples of 8348 individuals. The final dataset uses RNA-seq to asses 1181 samples of 1181 individuals. Combining these datasets gives 12029 samples of 12019 individuals, each containing 12708 genes. From these 12029 samples, 907 are healthy, 4082 have the disease AML and 63 have the disease Acute megakaryoblastic leukaemia (AMKL). AMKL is a rare sub-type of AML [14]. And is thus considered as AML for this study. The samples with other diseases are dropped, giving a dataset containing 907 healthy cases (17.95%) versus 4145 cases of AML (82.05%). We did not use any other information as regards the individuals, like the age, sex, etc. since this would drop the number of samples drastically. Age is highly correlated to AML and since it has been proved [1,3] that its role is really important regarding the predictability of AML using CatBoost and transcriptomics data, we believe that in the future we will be able to enrich this or similar dataset with age so that the performance of our models to be higher.
For the problem of classification of AML vs. Healthy individuals the dataset contains 5052 data instances which correspond to 5052 individuals, each containing 12708 genes. The dataset has been randomly split in two sets, the training and the validation datasets. The training dataset contains 80% of the data and the validation dataset 20%. The percentages of the AML and Healthy individuals are the same in both datasets and close to 20% of healthy and 80% of AML. In order to do the parameter tuning we used 10 fold cross validation (10CV) [15]. Since we want our models to be machine’s agnostic (meaning we do not want to add as feature if a data-instance comes from HG-U133A, HG-U133 or from RNA-seq) we used in our dataset data-instances from the three different sources. CatBoost is a gradient boosting algorithm that solves the prediction shift, which is present in other existing boosting techniques, by using ordered boosting with ordered target statistics. By doing so it outperforms other gradient boosting algorithms like XGBoost, LightGBM, etc.. Even though CatBoost has been developed and it is recommended for tabular datasets consisted of categorical features, various works on numerical features derived from utrasound B-mode and shear wave elastography, as well as the parameters of FIB-4 score, has been shown that CatBoostcan has great performance on numerical data without discretization techniques applied on them. As the datasets are imbalanced, all of the models make use of the weight balance parameters offered by the CatBoost library. The tuning of the models has to do mainly with the following parameters: the number of iterators, the learning rate and the depth. All other tunable parameters have been kept similar to the default values offered by the CatBoost library. The first model is used for dimensionality reduction, the other models are used to do the actual classification of AML. Dimensionality reduction improves the time complexity of the training phase of machine learning models [16]. This has the advantage of being able to create and tune more complex models.
2.1. AML vs. Healthy
The dimensionality reduction CatBoost model, which is the first one in the whole methodology, has been tuned using: 200 iterators, depth of 4 and a learning rate of 0.1. From this dimensionality reduction CatBoost model, we obtain the feature importance for each of its 12708 features. This is done for both the importance regarding the change of the loss function during the training phase and the importance regarding the predictability of the model itself. We took the 100 most important features (genes) for both the predictability and the loss function and we computed the intersection of them. This lead us to only 57 features. The above steps are similar to the method from [3]. In the already proven method 34 genes have been found to have good predictive importance as regards the classification of AML vs. Healthy individuals using probe-set data. In order to take advantage of this previous work, we find the genes which belong to the intersection of the 12708 genes and the 34 genes of [1]. The idea is that using genes which they already have importance as regards the predictability of CatBoost model in the same problem, will benefit the performance of our models. There are only 15 genes that belong to this intersection. These genes are the following, ’ADAMTS2’, ’CEACAM3’, ’CHRNA3’, ’DSG2’, ’FAM153B’, ’FNDC3A’, ’GATA3’, ’LMAN1’, ’MAL’, ’PATJ’, ’RPL10’, ’SERPINI2’, ’SH2D3A’, ’SLC46A3’, ’TRIM45. These genes together with the 57 genes of the dimensionality reduction CatBoost model leads us to 72 genes. These 72 genes will be used in both of our models below.
The first model that is created after the dimensionality reduction has occurred, is a model which uses as features the 72 genes which belong to the above intersection. The tuned CatBoost model has 600 iterators, a depth of 6 and a learning rate of 0.2. This model from now on will be referred to as CatBoost72. According to the methodology of [1] for the next CatBoost model first we keep only these genes from the above 72 which are not associated to AML (there is no bibliographic reference); these are 62 genes. In [1] other than the non associated to to AML genes, one more feature has been used which is highly associated to AML, namely, the age. In our dataset not all data instances had the age filled-in so we decided not to use the age. In order to continue our process we included one gene which from bibliographic references is highly associated to AML: the ’FLT3’. The resulting 63 genes are used for this final model which has been tuned with 400 iterators, a depth of 6 and a learning rate of 0.2; and from now on will be referred to as CatBoost63. The main purpose of the CatBoost63 model is to show that there are genes that are associated to AML and prove for once more after [1] that machine learning can help in the identification of genes which have not been yet associated to AML helping to uncovering the gene profile of this specific disease.In the methodological framework of our study, we strategically confined our analysis to a maximum of 20 genes with the goal of identifying a subset with diagnostic relevance for AML. This constraint led to the initial selection of 19 genes, chosen for their statistical and biological significance. These genes formed the basis for our predictive modeling using the CatBoost algorithm. The CatBoost model, refined with these 19 genes, exhibited exceptional predictive capabilities, as evidenced by achieving a ROC-AUC score of 0.9946 in a 10CV process and 0.9941 on an independent inference dataset.
Subsequent iterations of model optimization were conducted, focusing on a more selective gene set comprising 15 of the initially chosen 19 genes. This selection was particularly notable for including genes with no prior associations to blood cancers, aiming to explore their predictive power in the context of AML. The refined model, henceforth referred to as CatBoost15, demonstrated a robust ROC-AUC of 0.9922 in 10CV and 0.9900 in the inference dataset, indicative of a strong predictive performance and hinting at the existence of previously unrecognized genetic markers for AML. The optimized parameters for CatBoost19 included 95 iterations, a tree depth of 6, and a learning rate of 0.5. In contrast, the CatBoost15 model was adjusted to 200 iterations, a tree depth of 5, and a learning rate of 0.2, reflecting the tailored approach to model refinement.
This systematic approach not only underscores our study’s contribution to the existing body of knowledge, as echoed by the work of Angelakis et al. [1,3], but also highlights the methodological rigor applied in narrowing down the gene set. Our exploration extends beyond the conventional gene profiles associated with AML, venturing into uncharted genetic territories with potential implications for novel diagnostic markers and therapeutic targets. The discovery of predictive capabilities in genes hitherto unassociated with AML not only enriches the genetic landscape pertinent to the disease but also signifies a leap towards innovative drug discovery, opening pathways for the development of new therapeutic strategies. This advancement, rooted in our methodical analysis, sets a precedent for future research aimed at enhancing patient care through genetically informed interventions.
An overview of how the different models and datasets stack up can be found in Figure 1.
2.2. AML vs. Healthy & Other Diseases
In this study we use the dataset of a previous work [12]. In this work the AML vs. Healthy problem has not been explored so our focus here is on this particular problem. In addition though, we want to see how the CatBoost algorithm and the methodology of [1] applies on the binary classification problem of AMl vs. Healthy & Other Diseases individuals. In [12] it is stated that Lasso had the best performance but it was taken into account the differentiation of the data-instances provided from HG-U133A, HG-U133 or from RNA-seq. Since we want our model to be agnostic on HG-U133A, HG-U133 or from RNA-seq we use all the data-instances from the initial dataset. Similar methodology to the previous work Section 2.1 has been conducted. However, instead of the Lasso model that had the best performance in [12], we use again CatBoost models. This comparison model is made using the whole dataset, containing all the diseases and healthy people. From there the AML and AMKL cases are seen as one class. Whereas all other diseases and healthy is seen as the other class. This model is created to question if CatBoost and the methodology of [1] are able to achieve good performance in a different problem using blood transcriptomic data.
The initial dataset has 12029 data-instances and 12708 features. First, a CatBoost model is trained on the whole dataset in order to do a dimensionality reduction on the number of the features. This dimensionality reduction CatBoost model has 100 iterators, a depth of 5 and a learning rate of 0.2. After the training and tuning using 10 fold cross validation, we take the 100 most important features as regards the predictability and the 100 most important features as regards the loss function. We compute the intersection of them which contains 60 genes. From these genes, a new dataset is created, containing only these genes as features. Given this new dataset, a new CatBoost model is tuned using 10CV. This model from now on will be referred to as CatBoost60. It has 200 iterators, a depth of 6 and a learning rate of 0.5.
3. Results
3.1. AML vs. Healthy
The dimensionality reduction model has been created using the method mentioned above. The results of this model can be seen in Table 1. The feature importance of this model regarding the loss function change and the model predictability can be seen in Figure 2 and Figure 3 respectively. From these figures it is clear that there is one gene that has a high score for feature importance for both the loss function change and the predictability of the model. This gene is the ’WT1’.
The intersection between the feature importance regarding the loss function and predictability result in 57 genes. Adding the 15 genes from previous work [1] results in a dataset containing 72 genes. These genes can be found in Table 8, together with their references to blood malignancies in literature. These genes are the following, ’FNDC3A’, ’ASAH1’, ’CCNA1’, ’ALDH1A1’, ’NUDT11’, ’HBBP1’, ’ENTPD1’, ’IGF1R’, ’IFI27’, ’PRAME’, ’CHRNA3’, ’SERPINI2’, ’CXorf57’, ’VPREB3’, ’AOAH’, ’HOXB6’, ’SH2D3A’, ’EPS8’, ’DAB1’, ’GPKOW’, ’FLT3’, ’AVP’, ’NXF3’, ’CES1P1’, ’RLN2’, ’NDUFB7’, ’HHEX’, ’TCL1A’, ’C3orf14’, ’RPL10’, ’PF4’, ’S1PR4’, ’WT1’, ’CTDSPL’, ’EGLN2’, ’TRIM45’, ’LMAN1’, ’MAL’, ’CHRM3’, ’TRBV21-1’, ’CCL5’, ’TUBB1’, ’CRISP3’, ’CEACAM3’, ’CXCL5’, ’TRAV21’, ’CDC14B’, ’PCDH9’, ’KDM7A’, ’ISG20’, ’NUP214’, ’SERPINA1’, ’ANAPC15’, ’SYNE1’, ’SPX’, ’PATJ’, ’LCN2’, ’AKTIP’, ’BACH2’, ’TIAM1’, ’PECR’, ’APOC4-APOC2’, ’GP1BB’, ’FAM153B’, ’ADAMTS2’, ’TPD52’, ’DSG2’, ’SLC46A3’, ’TBC1D9B’, ’MAPK12’, ’MYBL2’, ’GATA3’. This dataset is used to train the CatBoost72 model. The performance of this model can be seen in Table 2. When comparing the CatBoost72 model to the dimensionality reduction model. It is clear that the CatBoost72 model has a higher score for all the metrics. This shows that reducing the complexity of tuning a model using less features has a positive impact on the performance of the new model. It shows also that the dimensionality reduction using CatBoost as dimensionality technique works well. The genes that contribute the most to the results can be seen in Figure 4 and Figure 5, here the features importance of the model regarding the loss function and predictability of the model are shown. We observe at both figures is that the ’WT1’ gene is the most important for both manners of looking at the feature importance. The top 5 most important features regarding the loss function are ’WT1’, ’CCL5’, ’CXorf57’, ’CHRM3’, ’TCL1A’. For the predictability of the model the top 5 are ’WT1’, ’FLT3’, ’APOC4-APOC2’, ’C3orf14’, ’CXorf57’.
The genes that do not have a bibliograhic reference to AML are the following 62: ’FNDC3A’, ’ASAH1’, ’ALDH1A1’, ’NUDT11’, ’HBBP1’, ’IFI27’, ’CHRNA3’, ’SERPINI2’, ’CXorf57’, ’VPREB3’, ’AOAH’, ’SH2D3A’, ’EPS8’, ’DAB1’, ’GPKOW’, ’AVP’, ’NXF3’, ’CES1P1’, ’RLN2’, ’NDUFB7’, ’TCL1A’, ’C3orf14’, ’RPL10’, ’PF4’, ’S1PR4’, ’CTDSPL’, ’EGLN2’, ’TRIM45’, ’LMAN1’, ’MAL’, ’CHRM3’, ’TRBV21-1’, ’CCL5’, ’TUBB1’, ’CRISP3’, ’CEACAM3’, ’CXCL5’, ’TRAV21’, ’CDC14B’, ’PCDH9’, ’KDM7A’, ’ISG20’, ’SERPINA1’, ’ANAPC15’, ’SYNE1’, ’SPX’, ’PATJ’, ’LCN2’, ’AKTIP’, ’BACH2’, ’TIAM1’, ’PECR’, ’APOC4-APOC2’, ’GP1BB’, ’FAM153B’, ’ADAMTS2’, ’DSG2’, ’SLC46A3’, ’TBC1D9B’, ’MAPK12’, ’MYBL2’, ’GATA3’. This results in a dataset containing 63 genes. Using this dataset the CatBoost63 model is trained. The performance of this model can be seen in Table 3. When comparing the CatBoost63 model to the dimensionality reduction model, it is clear that the CatBoost63 model has a higher score for all the metrics. However, when comparing to the CatBoost72 model, for all the metrics, the CatBoost63 model scores are lower, but not significant lower. This shows that using uncorrelated to AML genes and only one highly correlated to AML that the predictability differs only for a fraction. When looking at Figure 6 and Figure 7, the feature importance of the CatBoost63 model can be found. When looking at the most important feature, both for the loss function change and the predictability of the model, it is the ’FLT3’ gene as expected since this is the gene which is highly correlated to AML. For the CatBoost63 model the top 5 most important genes regarding the loss function change are ’FLT3’, ’C3orf14’, ’PECR’, ’CXorf57’, ’APOC4-APOC2’. Regarding the predictability of the CatBoost63 model the top 5 are ’FLT3’, ’C3orf14’, ’APOC4-APOC2’ ’SYNE1’, ’CXorf57’.
For a potential application in clinical trial of a diagnostic test using the above 63 genes, one considerable obstacle could be the cost. In general, using no more than 20 genes is a good initial point for any further research or application of a diagnostic test. For this reason we identify the 19 genes: ’MAL’, ’C3orf14’, ’APOC4-APOC2’, ’TCL1A’, ’CES1P1’, ’NUDT11’, ’LCN2’, ’AKTIP’, ’FNDC3A’, ’PECR’, ’TUBB1’, ’ISG20’, ’CCL5’, ’GPKOW’, ’EGLN2’, ’FLT3’, ’CXorf57’, ’SYNE1’, ’EPS8’, which are the most important regarding the predictability and the training process, as we did before. We tuned a CatBoost model, namely the CatBoost19, with the following parameters: iterators: 95, learning rate: 0.50 and depth: 6, and we show in Table 4 that the performance is similar to the performance of the CatBoost63 (Table 3. This makes the CatBoost19 a potential candidate for a gene diagnostic test on AML. At Figure 8 and Figure 9, the feature importance of the CatBoost19 model can be found.
In our final experiment we wanted to investigate if using genes that have never been bibliographically associated to AML or any other type of blood cancer, we could be able to create a CatBoost model that distinguishes if a patient has or not AML with a performance similar to CatBoost19. We drop the following four genes: ’TCL1A’, ’FNDC3A’, ’FLT3’, ’SYNE1’, which are associated to blood cancer [24,40,42,47]. We tuned a CatBoost model, namely the CatBoost15, with the following parameters: iterators: 200, learning rate: 0.20 and depth: 5, and we show in Table 5 that the performance is relatively close to the performance of the CatBoost19 (Table 4. At Figure 10 and Figure 11, the feature importance of the CatBoost15 model can be found. Regarding the predictability the most important gene is the ’APOC2-APOC4’ which is associated to liver cancer ??; On the most important feature in the change of the loss function we observe that the ’EPS8’ is the one that is associated to various cancers ??. The most weighted gene for both the predictability and the loss change being on the 2nd place is the ’C3orf14’ which is associated to renal cancer [20].
3.2. AML vs. Healthy & Other Diseases
For the dimensionality reduction model for the AML vs. Healthy & Other Diseases, the results can be seen in Table 6. From this model, the most important features regarding the loss function change and predictability of the model are taken. The feature importance can be seen in Figure 12 and Figure 13. The intersection of these features results in 60 genes. For this model these genes are, ’GLRX’, ’AZU1’, ’FLT3’, ’HMGB2’, ’CYP4F3’, ’APOC4-APOC2’, ’TP53TG1’, ’CEACAM8’, ’RHOH’, ’LCK’, ’ATP9A’, ’SLC27A5’, ’GP1BB’, ’LCN2’, ’ACTA2’, ’ARHGEF9’, ’AKTIP’, ’FNDC3B’, ’IGF2BP2’, ’SERPINI2’, ’MPST’, ’CALR’, ’CD19’, ’HOMER3’, ’PF4’, ’BLVRA’, ’CAMP’, ’ASAH1’, ’TMEM131L’, ’KIAA1456’, ’CFD’, ’GOLIM4’, ’GP1BA’, ’ARL4A’, ’BLK’, ’TMEM40’, ’HIST2H2BE’, ’HMCES’, ’HLA-F’, ’ELOVL4’, ’PRAME’, ’EDEM1’, ’DEPTOR’, ’HOXA9’, ’NUDT11’, ’CCL5’, ’NPR3’, ’LRIG1’, ’ZNF423’, ’C3orf14’, ’TPSB2’, ’MME’, ’CRISP2’, ’RYR3’, ’RPL13AP20’, ’WIPI1’, ’UBL5’, ’IGHA2’, ’ORM2’, ’MORF4L2’.
Using the 60 genes found from the dimensionality reduction model. The CatBoost60 model is created. The performance of this model can be seen in Table 7. It is clear that the performance of this model is better than that of the dimensionality reduction model, as it scores higher for all the metrics except for the specificity score of the validation set. The feature importance for this model can be seen in Figure 14 and Figure 15. The top 5 most important features regarding the loss function change are: ‘APOC4-APOC2’, ‘GLRX’, ‘DEPTOR’, ‘GOLIM4’, ‘IGHA2’. When looking at the feature importance regarding the predictability of the model the top 5 is made up from the following genes: ‘DEPTOR’, ‘APOC4-APOC2’, ‘AZU1’, ‘AKTIP’, ‘MME’.
When comparing the most important features to the CatBoost63 and CatBoost72 models, it is clear that there exists a difference in importance. There is a slight overlap, as all models have ’APOC4-APOC2’ in both their feature importance except the CatBoost72 loss function change feature importance. When looking at the overlap between the CatBoost72 and CatBoost63, there is more overlap between the top 5 genes in terms of feature importance. For both of these models and both of the feature importance, the CXorf57 exists in all top fives. In three of the four top fives of this model, the ’FLT3’, ’CSorf14’ genes exist. This is quite interesting, apparently when classifying in the case of AML vs Healthy other genes are more important than in the case with AML vs Healthy & Other Diseases. Finally, when looking at the dimensionality reduction overall, all models that are created using a dataset coming from a dimensionality reduction, outperform the dimensionality reduction models themselves. Showing that the dimensionality reduction itself using CatBoost is a success and works for this dataset.
4. Discussion
As mentioned before a different study has been done using the same initial dataset as used in this paper. However different machine learning techniques had been used in [12] and also the dataset has been split differently. A different form of dimensionality reduction has been used using the Lasso. The dataset is reduced to 35 genes. Interestingly only the ’GOLIM4’, ’ACTA2’, ’FLT3’, ’TPSB2’, ’NPR3’, ’DEPTOR’, ’ARL4A’, ’APOC4-APOC2’, ’HOMER3’ are in the intersection between the 35 found in the previous paper and the 60 found by the CatBoost dimensionality reduction method.
Using that dataset the authors managed to obtain a scores between 0.90 and 0.96 for specificity and between 0.94 and 0.98 for sensitivity. The most fair comparison is to compare the model from the previous study to the CatBoost60 model, as the method is the most similar. The scores for the CatBoost60 model are especially higher for the specificity score, where the CatBoost60 model scores 0.993. When looking at the sensitivity, the scores are actually similar to the model of the previous study. Meaning that the performance of the CatBoost60 model exceeds the performance of the model used in the previous study. Proving that the model used in this paper is better suited for this problem. However, when comparing the previous work of [1] to the CatBoost72 and CatBoost63, it is clear that the models proposed by [1], provide better solutions. Both models score higher in terms of both the specificity and sensitivity by quite a margin. Showing that the models of [1] this method is a better pick for the classification of AML using this dataset. It is worth to mention that our approach and our results, as regards the AML vs. Healthy problem cannot be directly compared to the work of [1] since the datasets are different. It can be used as complementary studies. On the contrary, our approach as regards the AML vs. Healthy & Other Diseases can be compared to the results of [12] since we use the same dataset, even though we take different approach.
As this paper uses a method that is already showen interesting results [1], it is interesting how the results of this paper stack up to the paper in which this method was first used. In the paper proposing the method an F1-score of 0.9996 is reached for the final model using non associated to AML probe-stes. This score is not matched by any of the models used in this paper. However the CatBoost72 and CatBoost63 models do come real close with an F1-score of 0.9988 and 0.9964 respectively. These close scores between the papers shows that this method works for the dataset used in this paper. And that the method is applicable for more than one dataset. From the results it is clear that using the method proposed in this paper, it is possible to classify AML vs. Healthy and AML vs. Healthy & Other Diseases in a robust manner. The high scores in both specificity and sensitivity showcase that. When looking at the scores of all models. It is also clear that the dimensionality reduction has an positive impact on the performance of the models. Both the CatBoost72 and CatBoost63 models are able to outperform the dimensionality reduction model. The same phenomenon can be seen with the CatBoost60 model and its dimensionality reduction model.
In conclusion, the predictive capabilities of the CatBoost63, CatBoost19, and CatBoost15 models in identifying AML are noteworthy, especially given that genes traditionally linked to AML were deliberately excluded from their datasets, with the sole exception of ’FLT3’. This exception notwithstanding, the models’ high performance underscores the presence of additional genetic markers relevant to AML that lack explicit bibliographic ties to the disease. The CatBoost15 model, in particular, demonstrates robust predictive accuracy even when restricted to genes previously unassociated with any form of cancer, further emphasizing the potential of machine learning in uncovering novel disease markers.
Our methodology has not only shown to surpass previous efforts in leveraging the same dataset for AML prediction but also highlighted specific genes that play a pivotal role in distinguishing AML from healthy cases, as opposed to AML versus healthy and other diseases scenarios. This distinction is crucial for understanding the unique genetic signatures of AML and improving diagnostic accuracy.
This research contributes to the growing body of evidence that machine learning can be a powerful tool in the identification of previously unrecognized genetic factors associated with diseases like AML. By doing so, it lays the groundwork for future interdisciplinary collaborations among data scientists, clinicians, and molecular biologists. The ultimate aim is to harness the power of transcriptomics in disease research, offering new insights and pathways for the investigation of cancer and potentially leading to groundbreaking advancements in diagnosis and treatment strategies. Our hope is that this work will inspire further studies and foster collaborations that bridge the gap between computational approaches and clinical applications in oncology.
Author Contributions
Conceptualization, A.A.; methodology, A.A.; software, A.A., R.N. and M.F; validation, A.A. and M.F.; formal analysis, A.A. and R.N.; investigation, A.A.; resources, A.A. and M.F.; data curation, A.A. and R.N.; writing—original draft preparation, A.A. and R.N.; writing—review and editing, A.A.; visualization, A.A.; supervision, A.A.; project administration, A.A.; funding acquisition, N/A. All authors have read and agreed to the published version of the manuscript.
Data Availability Statement
Publicly available datasets were used in this study from doi:10.1016/j.isci.2019.100780. This data can be found here: via the SuperSeries GSE122517 or via the individual SubSeries GSE122505 (dataset 1), GSE122511 (dataset 2), and GSE122515 (dataset 3).
Acknowledgments
We would like to thank Myrto Moutafi from National-Kapodistrian University of Athens and Lina Ntokou from Yale University for their valuable input during our discussions.
Conflicts of Interest
The authors declare no conflicts of interest.
References
- Angelakis, Athanasios, and Ioanna Soulioti. Diagnosis of Acute Myeloid Leukaemia Using Machine Learning. arXiv preprint arXiv:2108.07396 (2021). [CrossRef]
- Angelakis Athanasios et al. Uncovering the Gene Profile of Acute Myeloid Leukaemia Using Gradient Boosted Trees., Research Square preprint (2022). [CrossRef]
- Angelakis, Athanasios et al. Diagnosis of acute myeloid leukaemia on microarray gene expression data using categorical gradient boosted trees. Heliyon, Vol 9, No 10, e20530, (2023). [CrossRef]
- Short NJ, Rytting ME, Cortes JE. Acute myeloid leukaemia.Lancet. 2018, 392(10147):593-606. [CrossRef]
- Deschler, Barbara, and Michael Lübbert. Acute myeloid leukemia: epidemiology and etiology.Acute leukemias (2008): 47-56. [CrossRef]
- Abelson, Sagi, et al. "Prediction of acute myeloid leukaemia risk in healthy individuals." Nature 559.7714 (2018): 400-404. [CrossRef]
- De Kouchkovsky, I., and M. Abdul-Hay. Acute myeloid leukemia: a comprehensive review and 2016 update. Blood cancer journal 6.7 (2016): e441-e441. [CrossRef]
- Mottal N, Issa N, Dumas PY, et al. Reduce Mortality and Morbidity in Acute Myeloid Leukemia With Hyperleukocytosis With Early Admission in Intensive Care Unit: A Retrospective Analysis. J Hematol. 2020, 9(4):109-115. [CrossRef]
- Miller, Brady G., and John A. Stamatoyannopoulos. Integrative meta-analysis of differential gene expression in acute myeloid leukemia. PloS one 5.3 (2010): e9466. [CrossRef]
- Roushangar R, Mias GI. Multi-study reanalysis of 2,213 acute myeloid leukemia patients reveals age- and sex-dependent gene expression signatures. Sci Rep. 2019, 9(1):12413. Published 2019 Aug 27. [CrossRef]
- Abelson S, Collord G, Ng SWK, et al. Prediction of acute myeloid leukaemia risk in healthy individuals. Nature. 2018, 559(7714):400-404. [CrossRef]
- Warnat-Herresthal, Stefanie, et al. Scalable prediction of acute myeloid leukemia using high-dimensional machine learning and blood transcriptomics. Iscience 23.1 (2020): 100780. [CrossRef]
- Prokhorenkova L, Gusev G, Vorobev A, et al. CatBoost: unbiased boosting with categorical features. Advances in Neural Information Processing Systems. 2018, vol. 31. [CrossRef]
- Bennett, John M., et al. Criteria for the diagnosis of acute leukemia of megakaryocyte lineage (M7) A report of the French-American-British Cooperative Group. Annals of internal medicine 103.3(1985): 460-462. [CrossRef]
- Kohavi R, A study of cross-validation and bootstrap for accuracy estimation and model selection. Proceedings of the 14th international joint conference on Artificial intelligence. 1995, vol. 2.
- Reddy, G. Thippa, et al. Analysis of dimensionality reduction techniques on big data. IEEE Access 8 (2020): 54776-54788. [CrossRef]
- Eckardt, Jan-Niklas, et al. Deep learning detects acute myeloid leukemia and predicts NPM1 mutation status from bone marrow smears. Leukemia 36.1 (2022): 111-118. [CrossRef]
- Ren L, Yi J, Li W, et al. Apolipoproteins and cancer. Cancer Med. (2019); 8: 7032–7043. [CrossRef]
- Li, M., Yang, J., Zhang, L. et al. A low-molecular-weight compound exerts anticancer activity against breast and lung cancers by disrupting EGFR/Eps8 complex formation. J Exp Clin Cancer Res 38, 211 (2019). [CrossRef]
- Monzon FA et al. Chromosome 14q loss defines a molecular subtype of clear-cell renal cell carcinoma associated with poor prognosis. Mod Pathol. (2011) Nov;24(11):1470-9. [CrossRef]
- Hou Q, Liao F, Zhang S, et al. Regulatory network of GATA3 in pediatric acute lymphoblastic leukemia. Oncotarget. 2017;8(22):36040-36053. [CrossRef]
- Raiser DM, Narla A, Ebert BL. The emerging importance of ribosomal dysfunction in the pathogenesis of hematologic disorders. Leuk Lymphoma. 2014;55(3):491-500. [CrossRef]
- De Keersmaecker K, Atak ZK, Li N, et al. Exome sequencing identifies mutation in CNOT3 and ribosomal genes RPL5 and RPL10 in T-cell acute lymphoblastic leukemia. Nat Genet. 2013;45(2):186-190. [CrossRef]
- Manfrini N, Mancino M, Miluzio A, et al. FAM46C and FNDC3A are multiple myeloma tumor suppressors that act in concert to impair clearing of protein aggregates and autophagy. Cancer Res. 2020;80(21):4693-4706. [CrossRef]
- Farfsing A, Engel F, Seiffert M, et al. Gene knockdown studies revealed CCDC50 as a candidate gene in mantle cell lymphoma and chronic lymphocytic leukemia. Leukemia. 2009;23(11):2018-2026. [CrossRef]
- Tota G, Coccaro N, Zagaria A, et al. ADAMTS2 gene dysregulation in T/myeloid mixed phenotype acute leukemia.BMC Cancer. 2014;14(1):1-6. [CrossRef]
- Laukkanen S, Liuksiala T, Nykter M, Heinäniemi M, Lohi O. Identification of Novel Drug Targets in T-Cell Acute Lymphoblastic Leukemia.Blood. 2015;126(23):3646-3646. [CrossRef]
- Riehn M, Klopocki E, Molkentin M, Reinhardt R, Burmeister T. A BACH2-BCL2L1 Fusion Gene Resulting from a Lymphoma Cell Line BLUE-1. Cancer. 2011;396(January):389-396. [CrossRef]
- Aroua N, Boet E, Ghisi M, et al. Extracellular atp and cd39 activate camp-mediated mitochondrial stress response to promote cytarabine resistance in acute myeloid leukemia. Cancer Discov. 2020;10(10):1544-1565. [CrossRef]
- Perry C, Hazan-Halevy I, Kay S, et al. Increased CD39 expression on CD4 + T lymphocytes has clinical and prognostic significance in chronic lymphocytic leukemia. Ann Hematol. 2012;91(8):1271-1279. [CrossRef]
- Nagate Y, Ezoe S, Fujita J, et al. Ectonucleotidase CD39 is highly expressed on ATLL cells and is responsible for their immunosuppressive function. Leukemia. 2021;35(1):107-118. [CrossRef]
- Bargal SA, Rafiee R, Crews KR, et al. Genome-wide association analysis identifies SNPs predictive of in vitro leukemic cell sensitivity to cytarabine in pediatric AML. Oncotarget. Published online 2018. [CrossRef]
- Rodrigues Alves APN, Fernandes JC, Fenerich BA, et al. IGF1R/IRS1 targeting has cytotoxic activity and inhibits PI3K/AKT/mTOR and MAPK signaling in acute lymphoblastic leukemia cells. Cancer Lett. 2019;456(April):59-68. [CrossRef]
- Steinbach D, Hermann J, Viehmann S, Zintl F, Gruhn B. Clinical implications of PRAME gene expression in childhood acute myeloid leukemia. Cancer Genet Cytogenet. 2002;133(2):118-123. [CrossRef]
- Roman-Gomez J, Jimenez-Velasco A, Agirre X, et al. Epigenetic regulation of PRAME gene in chronic myeloid leukemia.Leuk Res. 2007;31(11):1521-1528. [CrossRef]
- Abdelmalak CA, Yahya RS, Elghannam DM, El-Khadragy AE, Abd El Messih HM. PRAME gene expression in childhood acute lymphoblastic leukemia: Impact on prognosis. Clin Lab. 2014;60(1):55-61. [CrossRef]
- Giampaolo A, Felli N, Diverio D, et al. Expression pattern of HOXB6 homeobox gene in myelomonocytic differentiation and acute myeloid leukemia. Leukemia. 2002;16(7):1293-1301. [CrossRef]
- He YZ, Liang Z, Wu MR, et al. Overexpression of EPS8 is associated with poor prognosis in patients with acute lymphoblastic leukemia.Leuk Res. 2015;39(6):575-581. [CrossRef]
- Erarslan-Uysal B, Kunz JB, Rausch T, et al. Chromatin accessibility landscape of pediatric T-lymphoblastic leukemia and human T-cell precursors. EMBO Mol Med. 2020;12(9):1-14. [CrossRef]
- Gary Gilliland D, Griffin JD. The roles of FLT3 in hematopoiesis and leukemia.Blood. Published online 2002. [CrossRef]
- Homminga I, Pieters R, Meijerink JPP. NKL homeobox genes in leukemia.Leukemia. 2012;26(4):572-581. [CrossRef]
- Stachelscheid J, Jiang Q, Herling M. The modes of dysregulation of the proto-oncogene T-cell leukemia/lymphoma 1A. Cancers (Basel). Published online 2021. [CrossRef]
- Inoue K, Ogawa H, Sonoda Y, et al. Aberrant overexpression of the Wilms tumor gene (WT1) in human leukemia. Blood. Published online 1997. [CrossRef]
- Shu J, Jelinek J, Chang H, et al. Silencing of bidirectional promoters by DNA methylation in tumorigenesis. Cancer Res. Published online 2006. [CrossRef]
- Mendes A, Fahrenkrog B. NUP214 in Leukemia: It’s More than Transport. Cells. Published online 2019. [CrossRef]
- Zhou MH, Yang QM. NUP214 fusion genes in acute leukemia (Review).Oncol Lett. Published online 2014. [CrossRef]
- Qu Y, Gao N, Wu T. Expression and clinical significance of SYNE1 and MAGI2 gene promoter methylation in gastric cancer. Med (United States). Published online 2021. [CrossRef]
- Ha M, Han ME, Kim JY, Jeong DC, Oh SO, Kim YH. Prognostic role of TPD52 in acute myeloid leukemia: A retrospective multicohort analysis. J Cell Biochem. Published online 2019. [CrossRef]
Figure 1.
A flowchart of modules consisting of the different datasets and models used in this study for the binary classification problem of AML vs. Healthy individuals. The ’Previously found genes’ come from a similar method used in this study on another dataset [1].
Figure 1.
A flowchart of modules consisting of the different datasets and models used in this study for the binary classification problem of AML vs. Healthy individuals. The ’Previously found genes’ come from a similar method used in this study on another dataset [1].
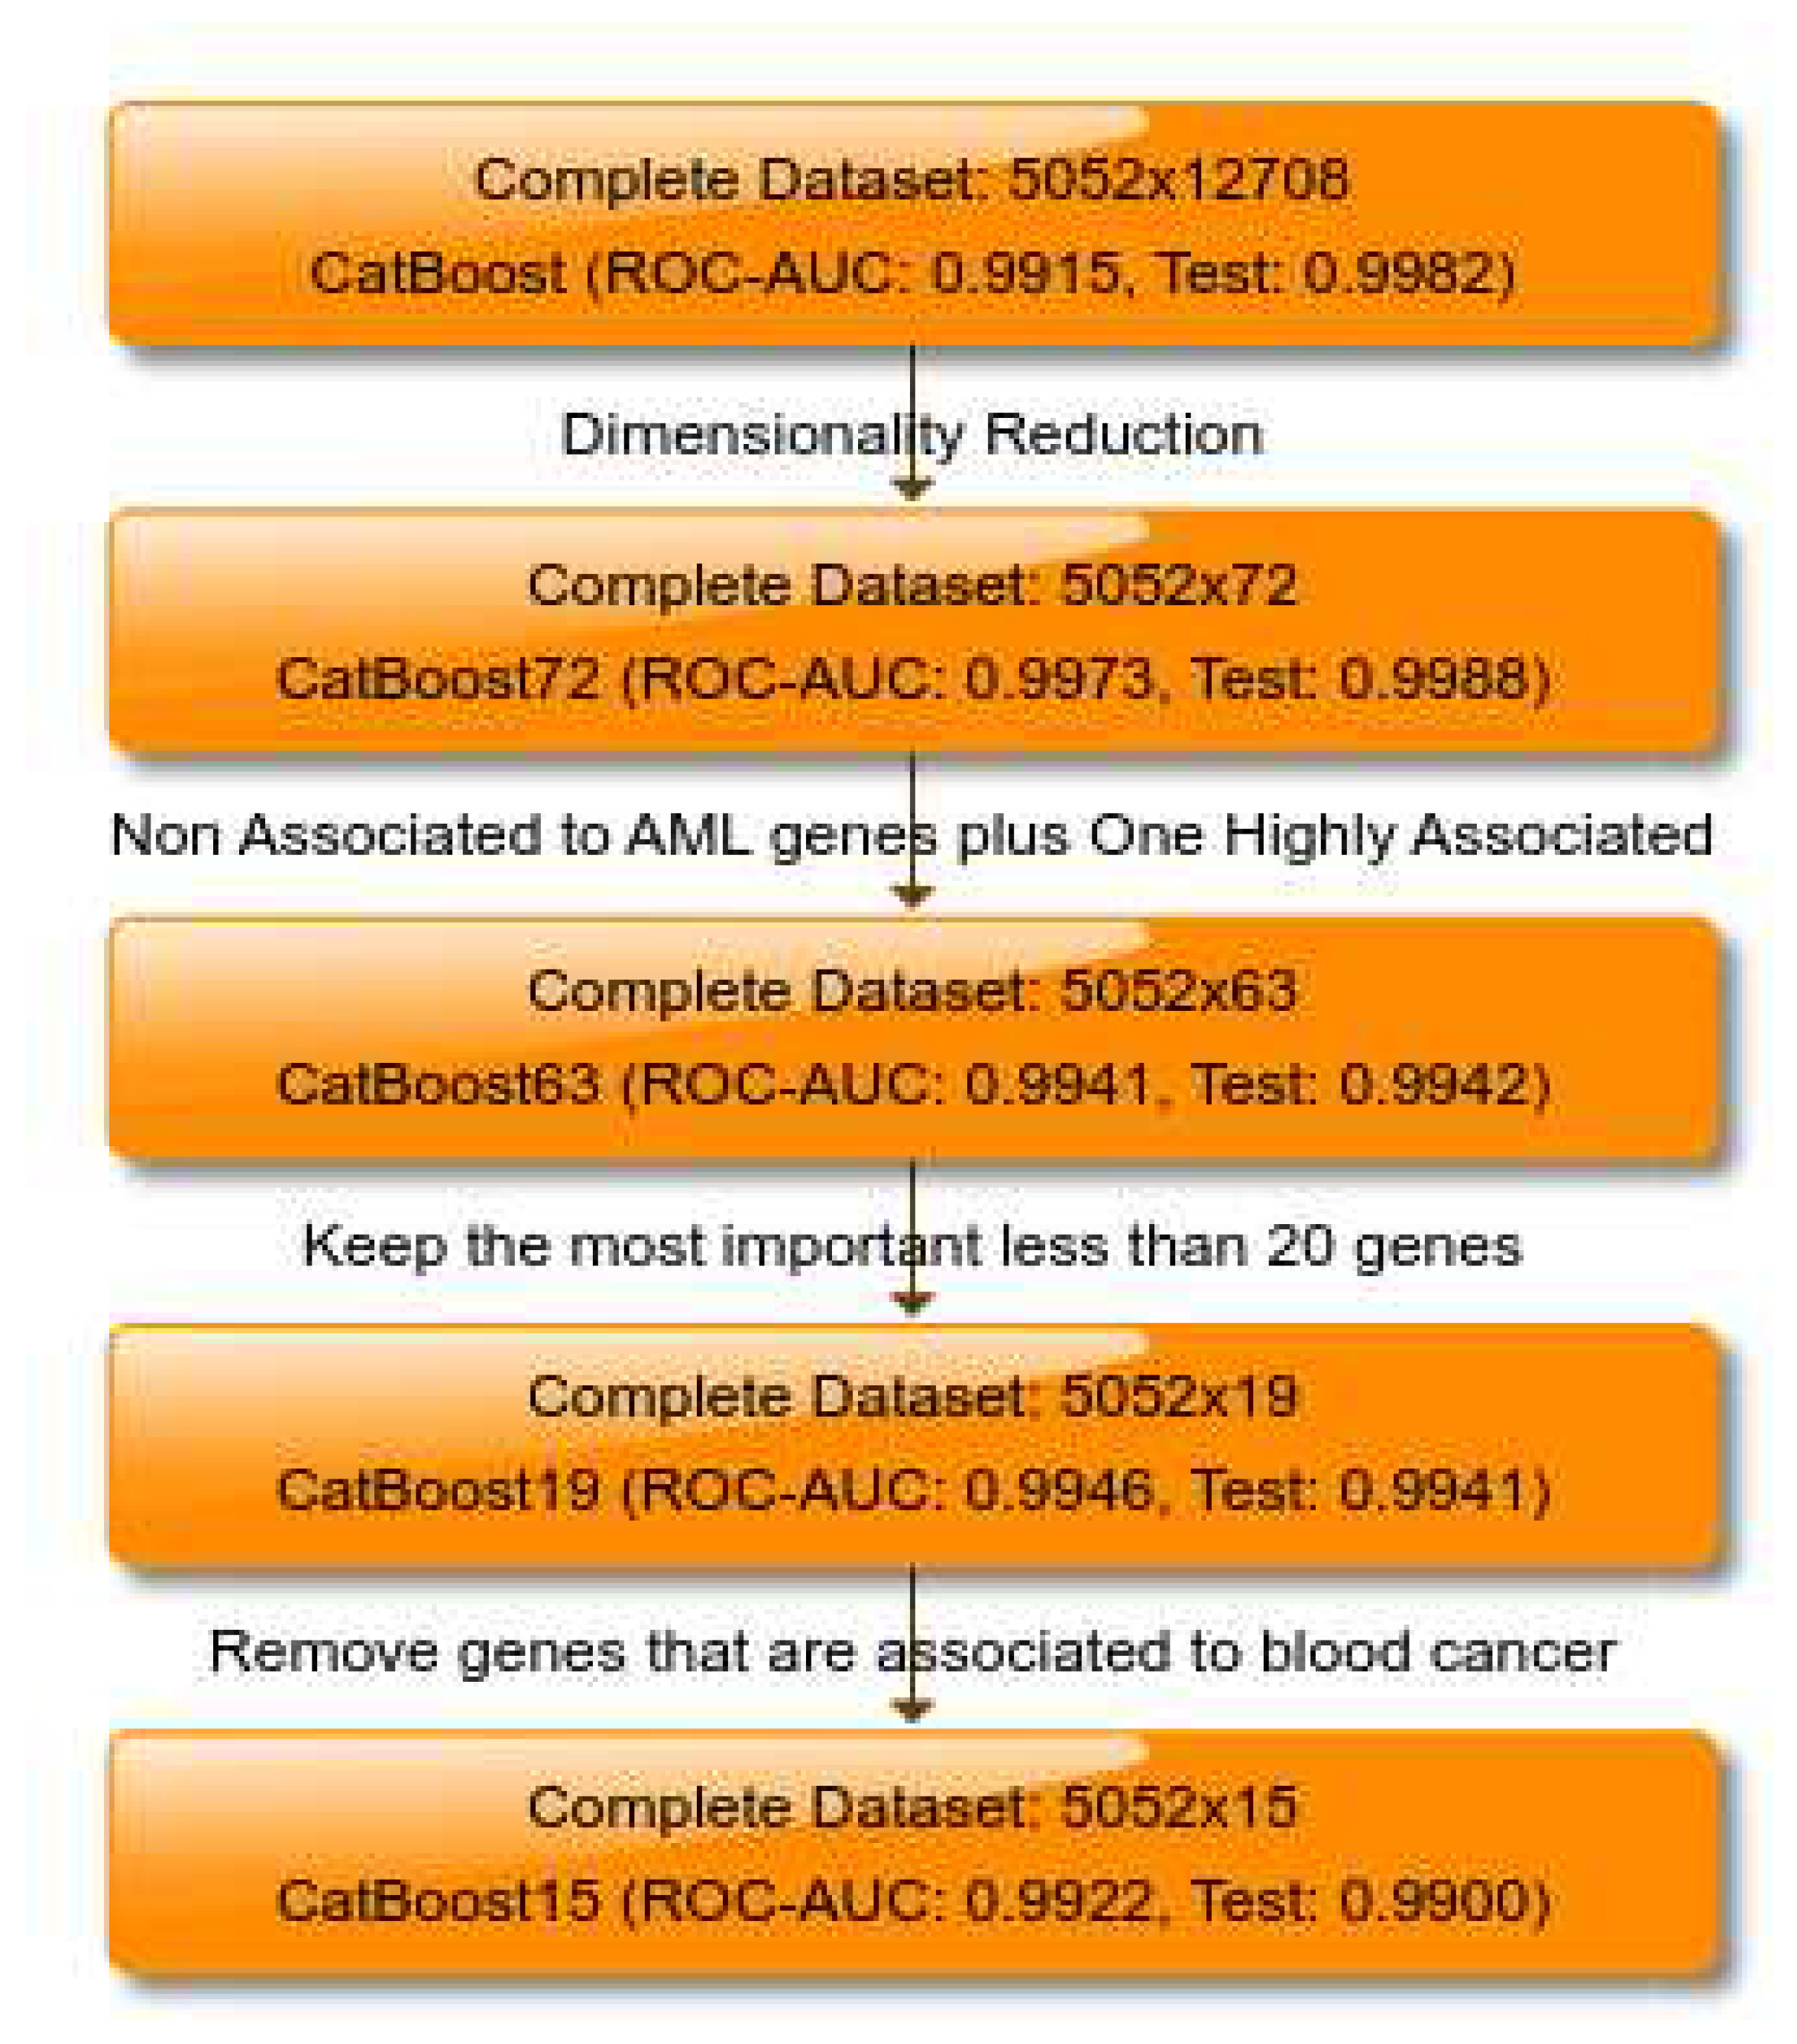
Figure 2.
The 100 most important features of the CatBoost [13] dimensionality reduction model regarding the change of the loss function for the AML vs. Healthy problem.
Figure 2.
The 100 most important features of the CatBoost [13] dimensionality reduction model regarding the change of the loss function for the AML vs. Healthy problem.
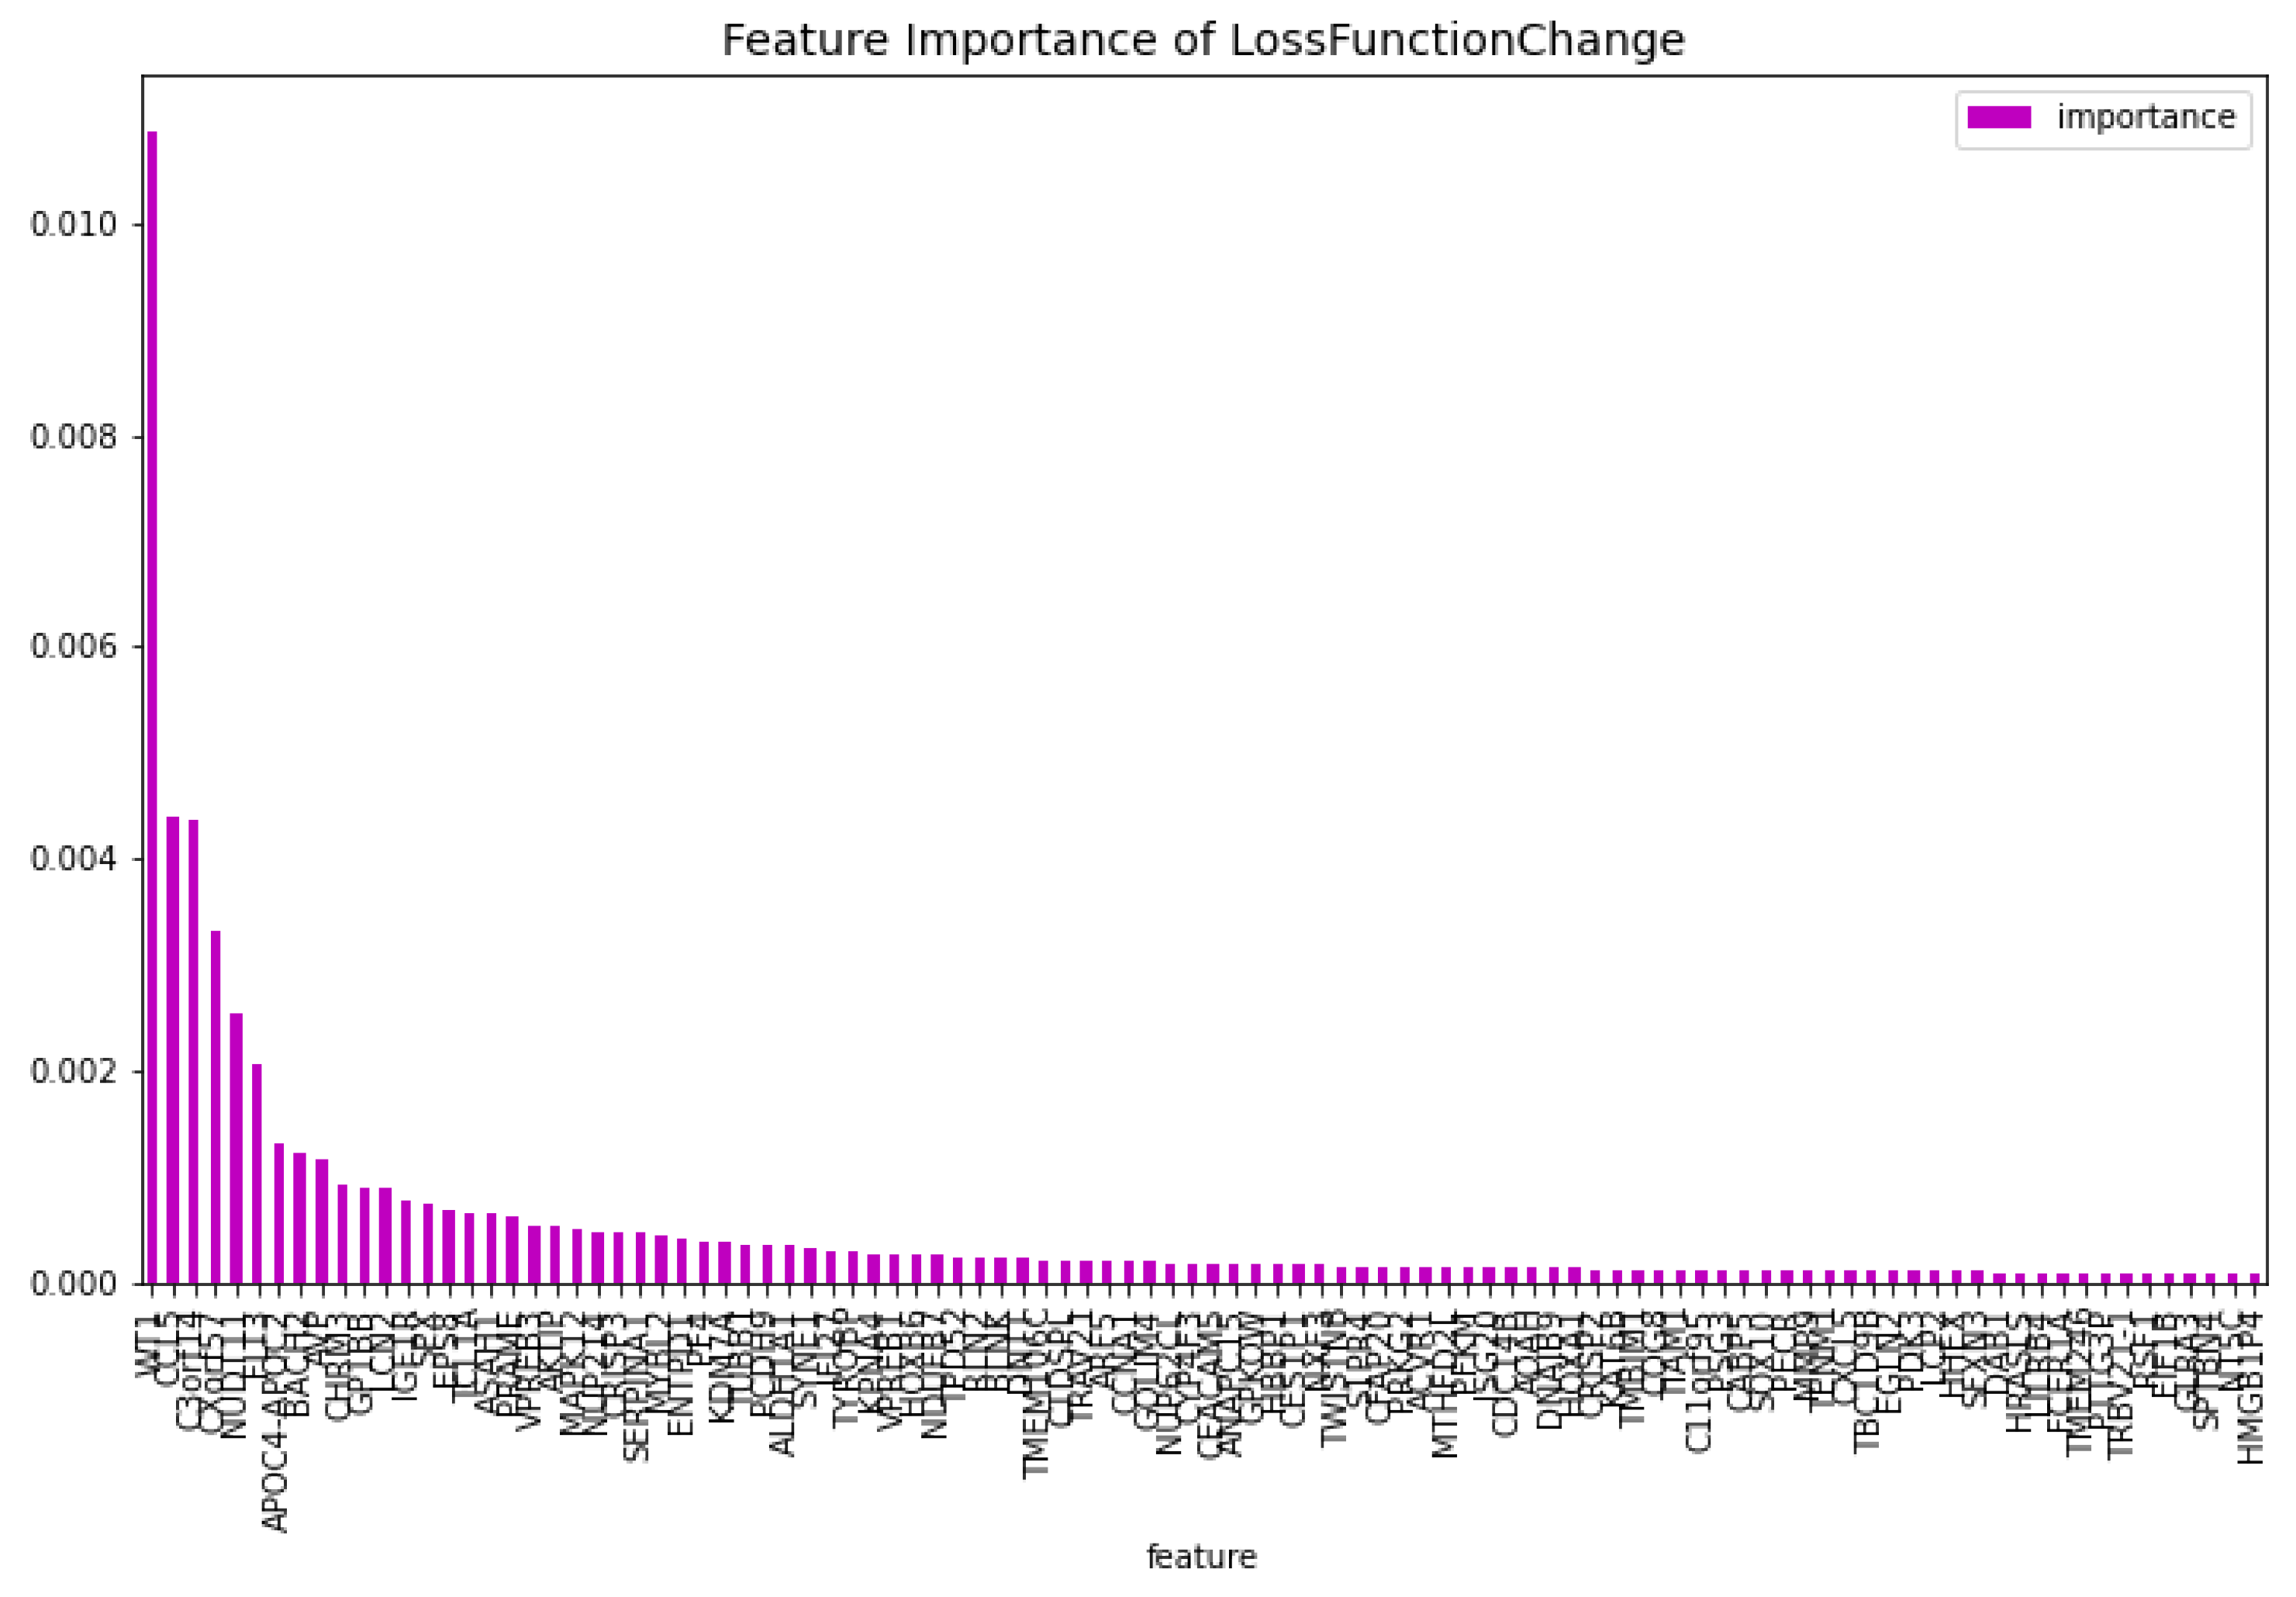
Figure 3.
The 100 most important features of the CatBoost [13] dimensionality reduction model regarding the predictability of the model, for the AML vs. Healthy problem.
Figure 3.
The 100 most important features of the CatBoost [13] dimensionality reduction model regarding the predictability of the model, for the AML vs. Healthy problem.
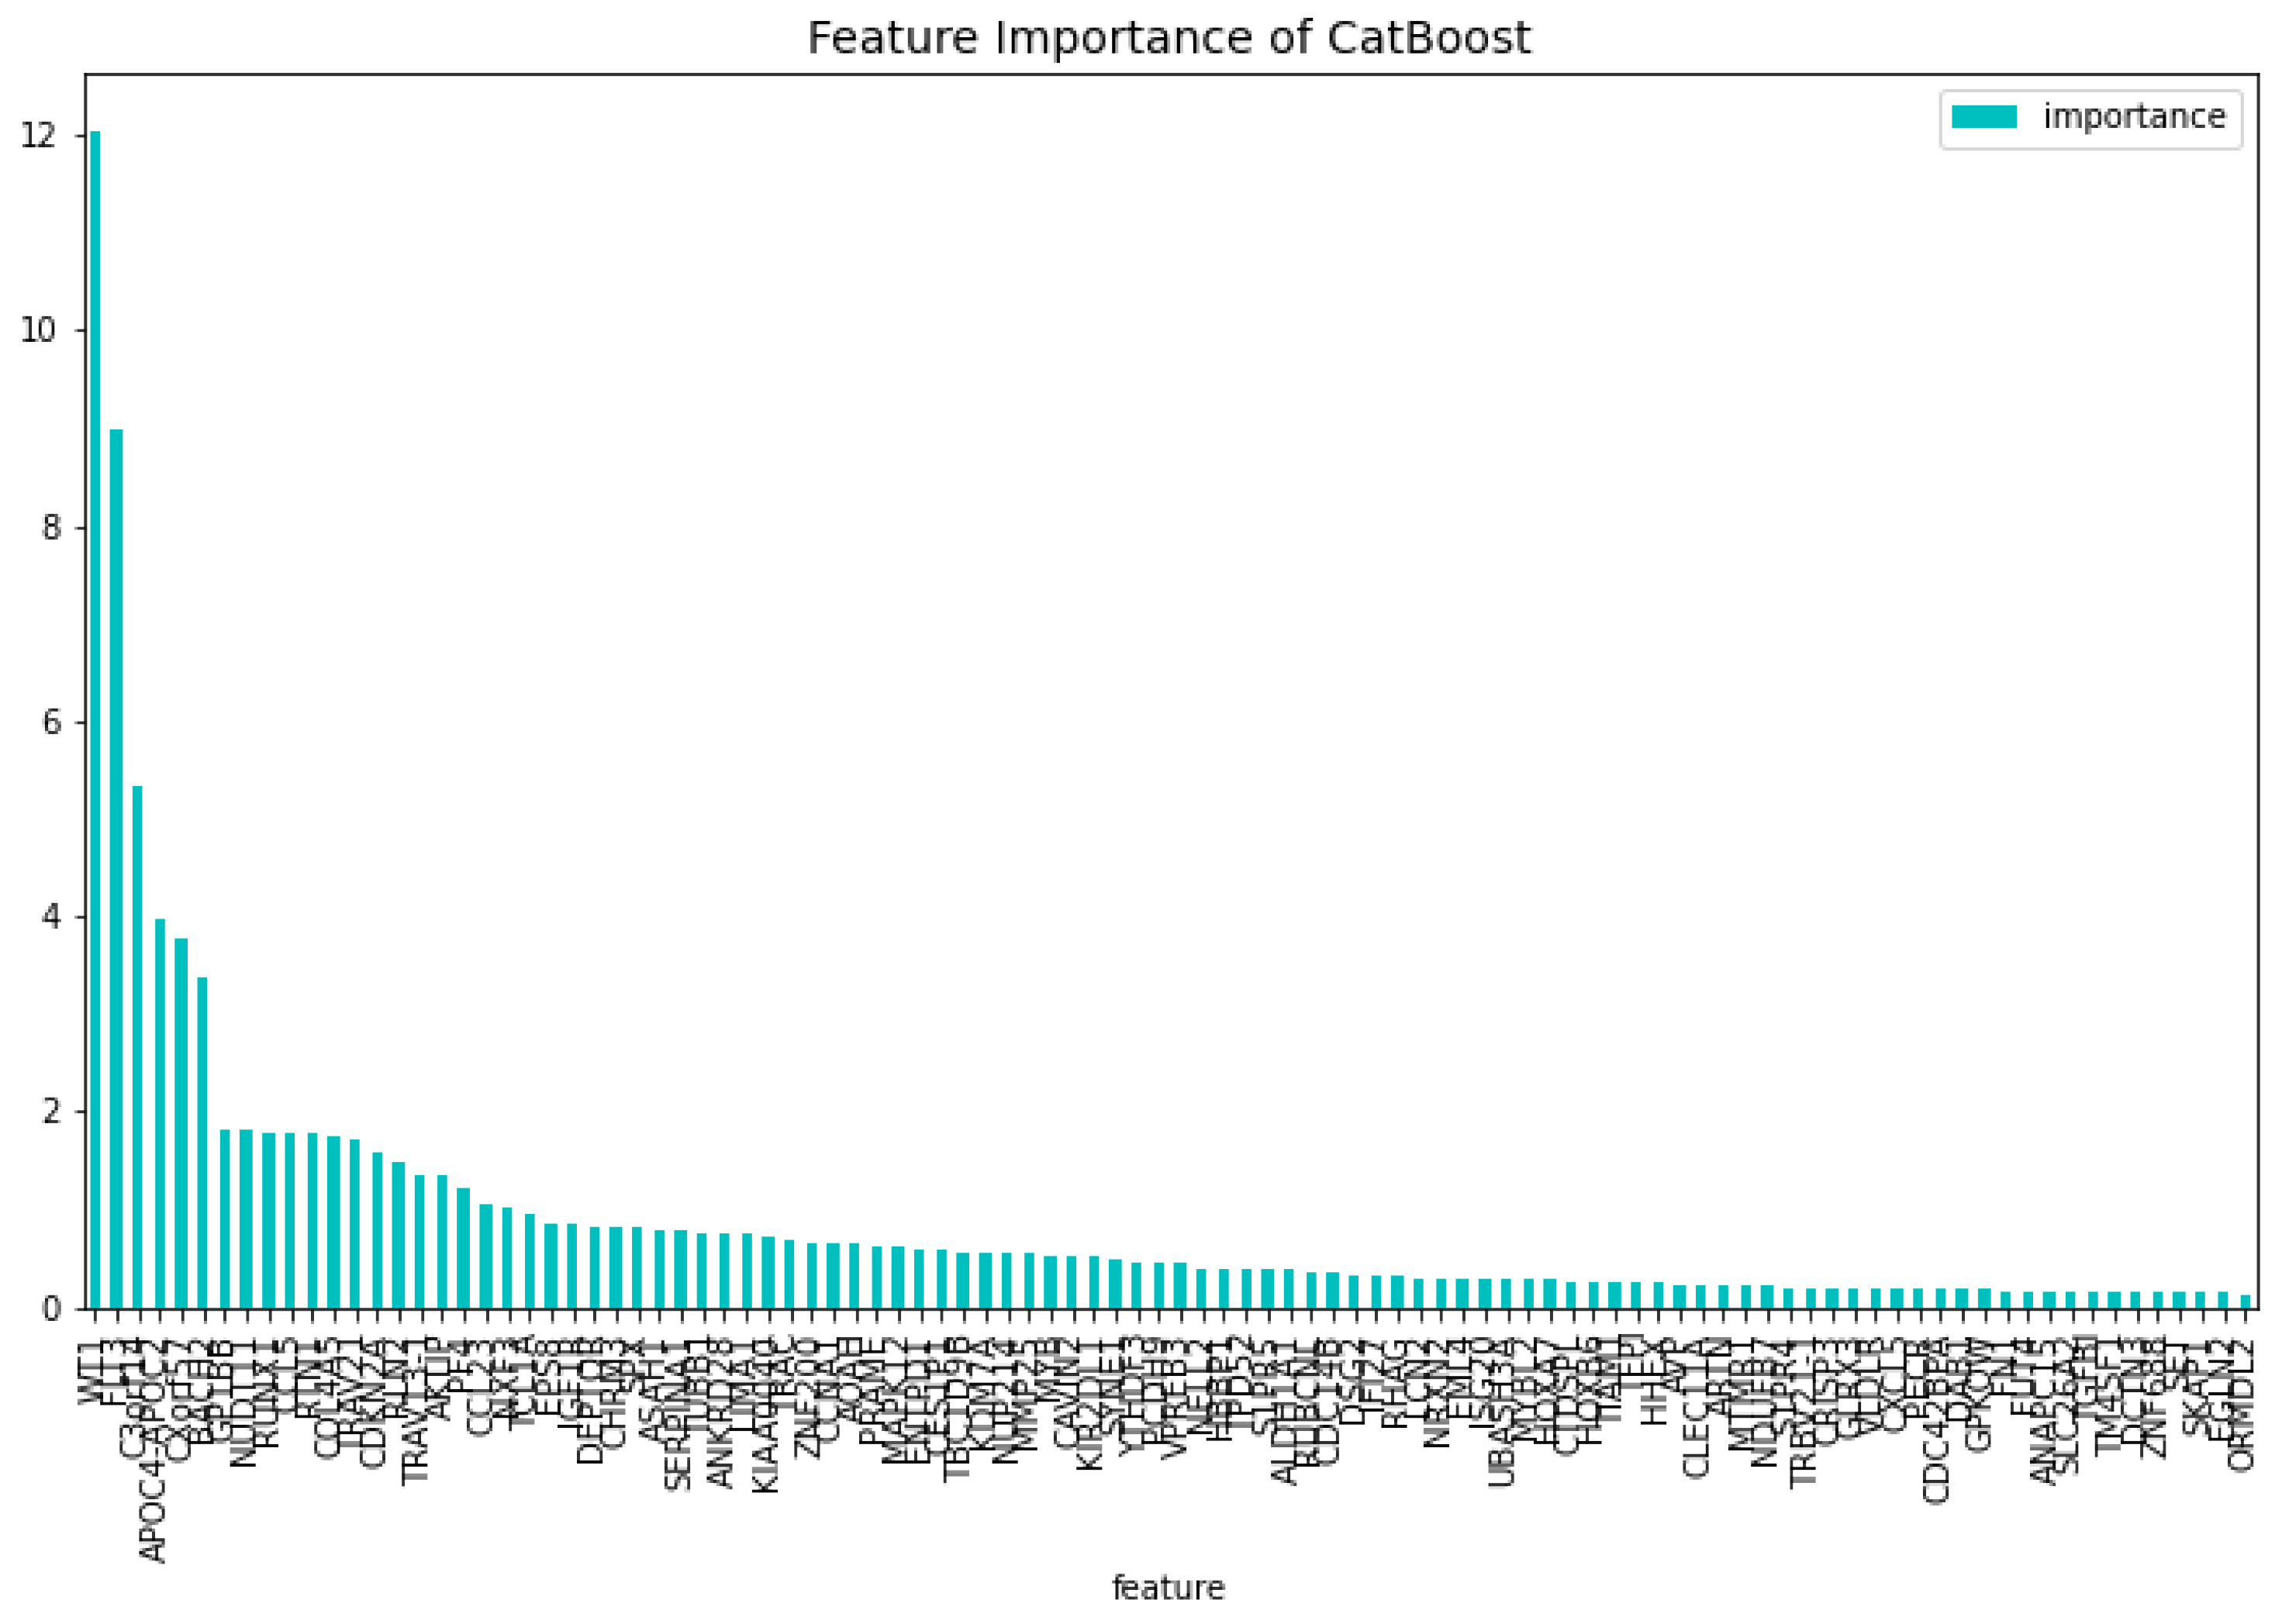
Figure 4.
The most important features of the CatBoost72 model regarding the change of the loss function.
Figure 4.
The most important features of the CatBoost72 model regarding the change of the loss function.
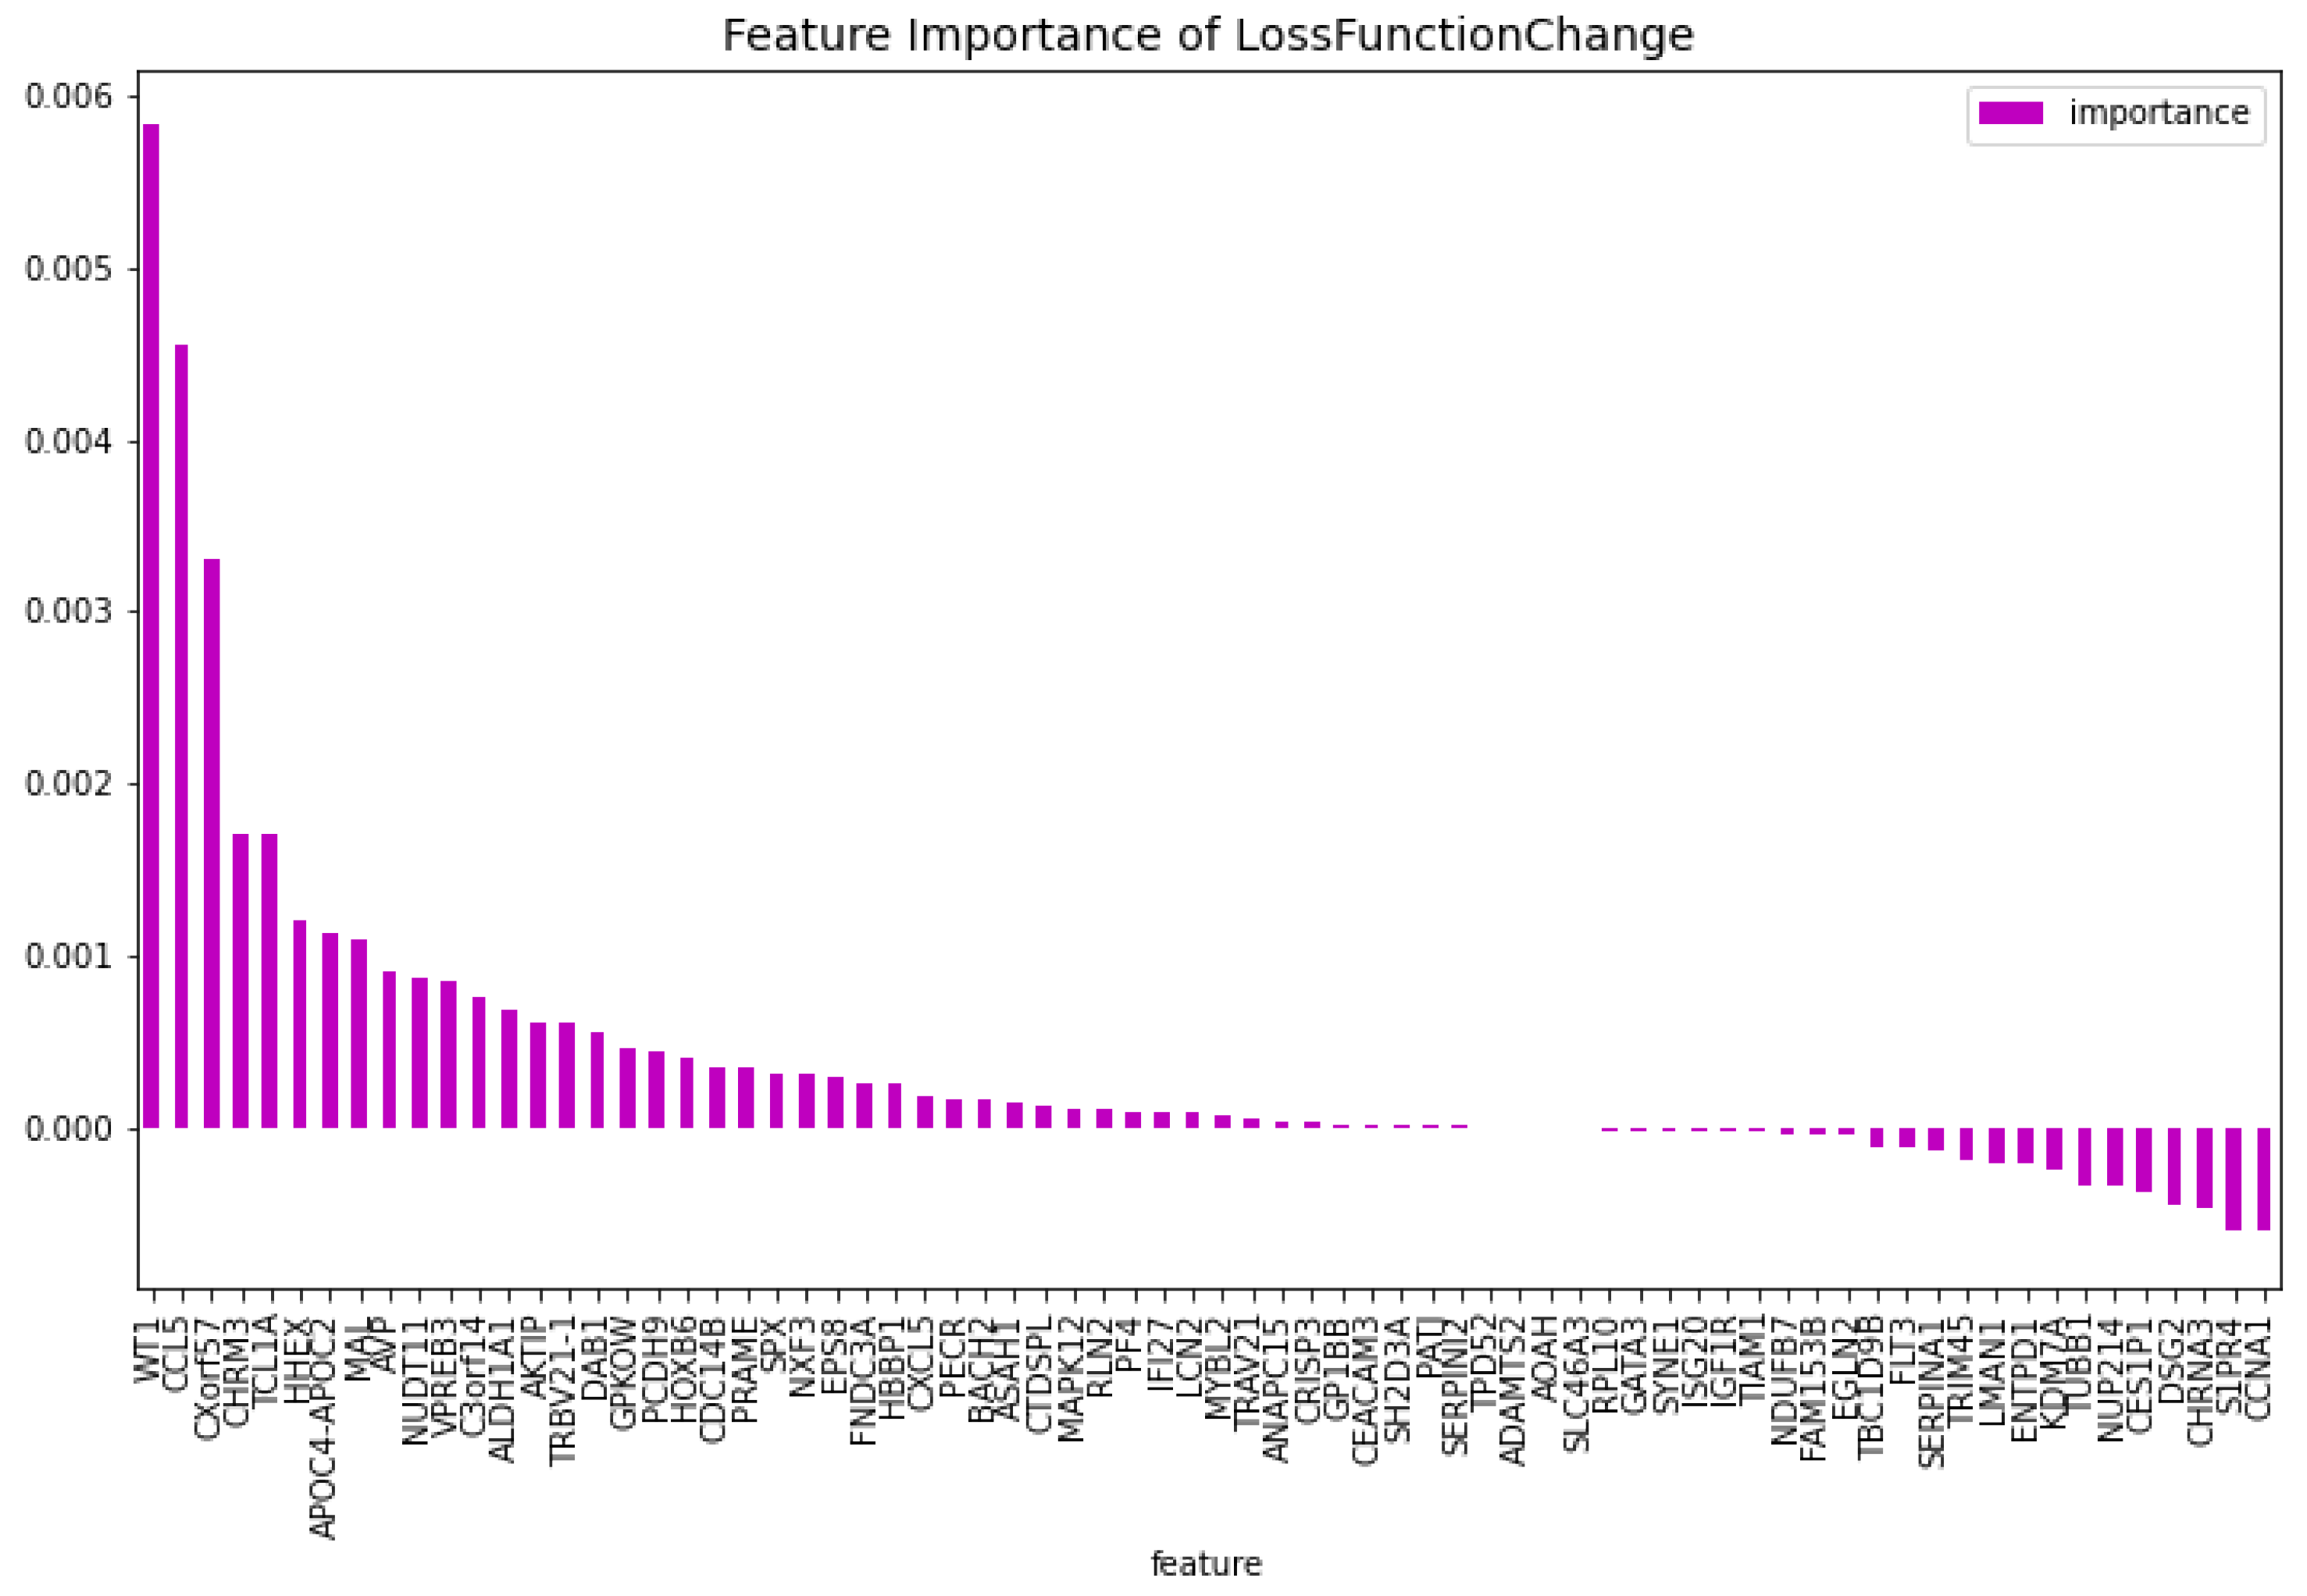
Figure 5.
The 100 most important features of the CatBoost72 model regarding the predictability of the model.
Figure 5.
The 100 most important features of the CatBoost72 model regarding the predictability of the model.
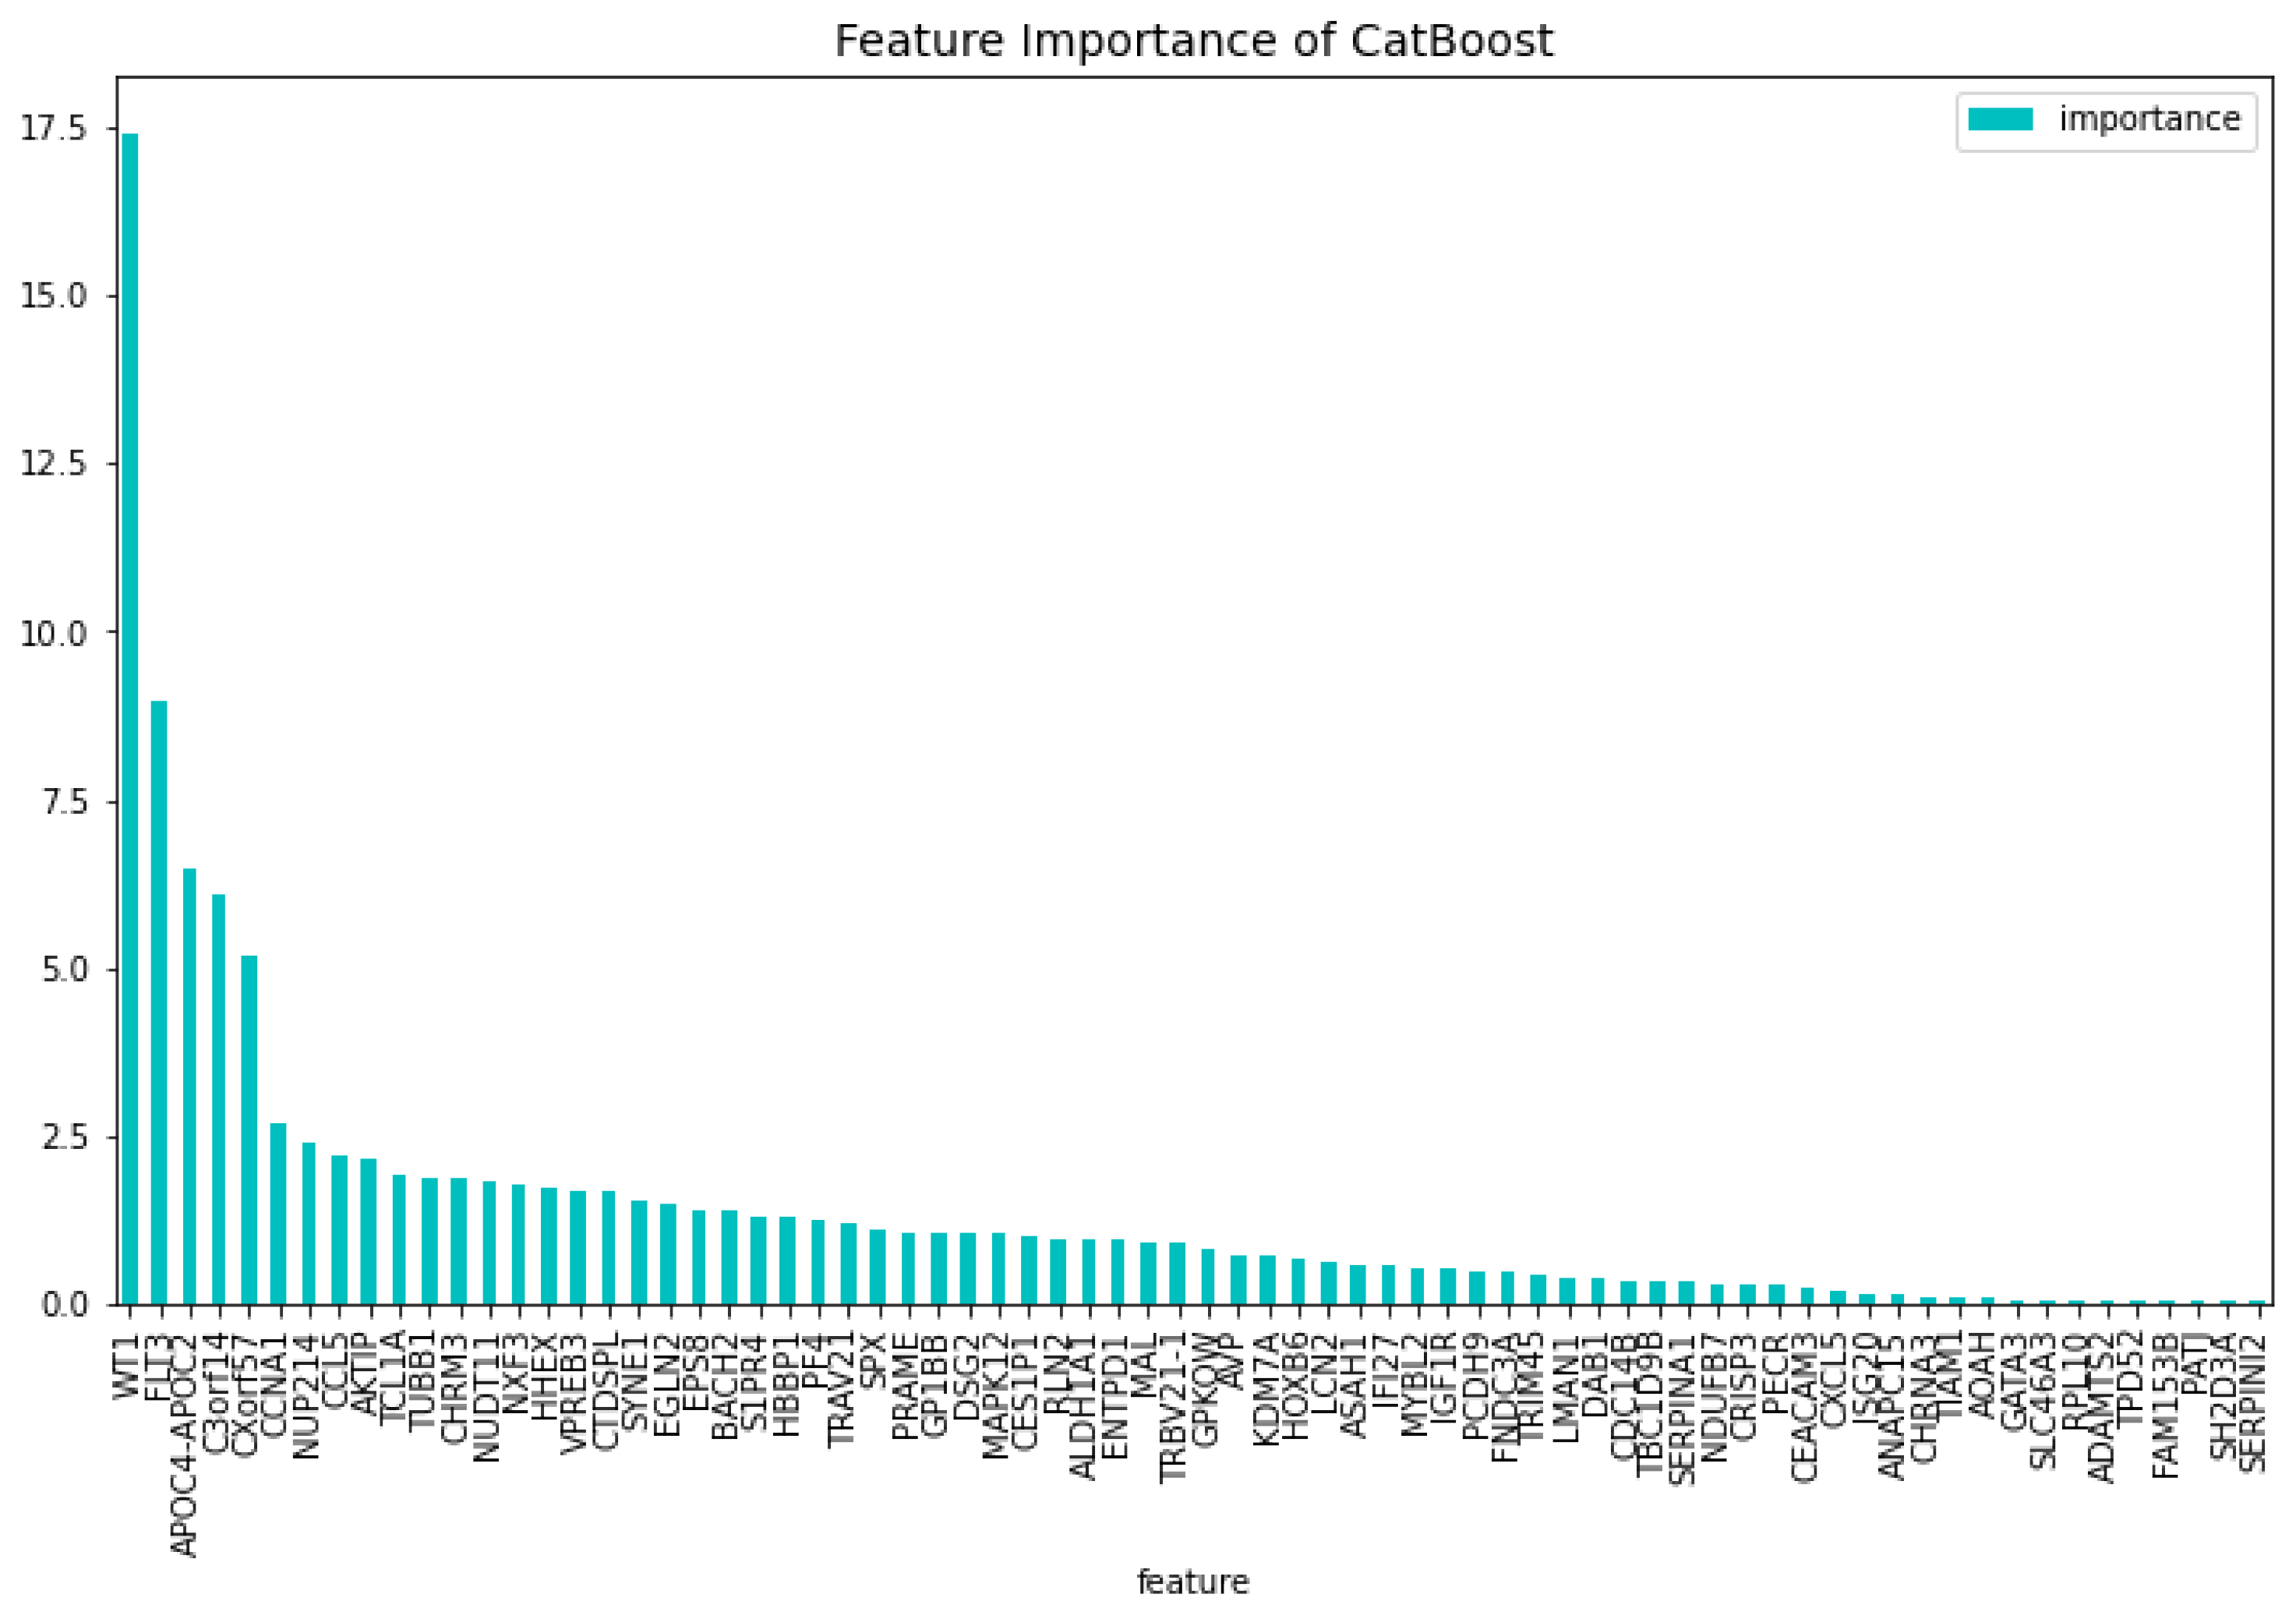
Figure 6.
The most important features of the CatBoost63 model regarding the change of the loss function.
Figure 6.
The most important features of the CatBoost63 model regarding the change of the loss function.
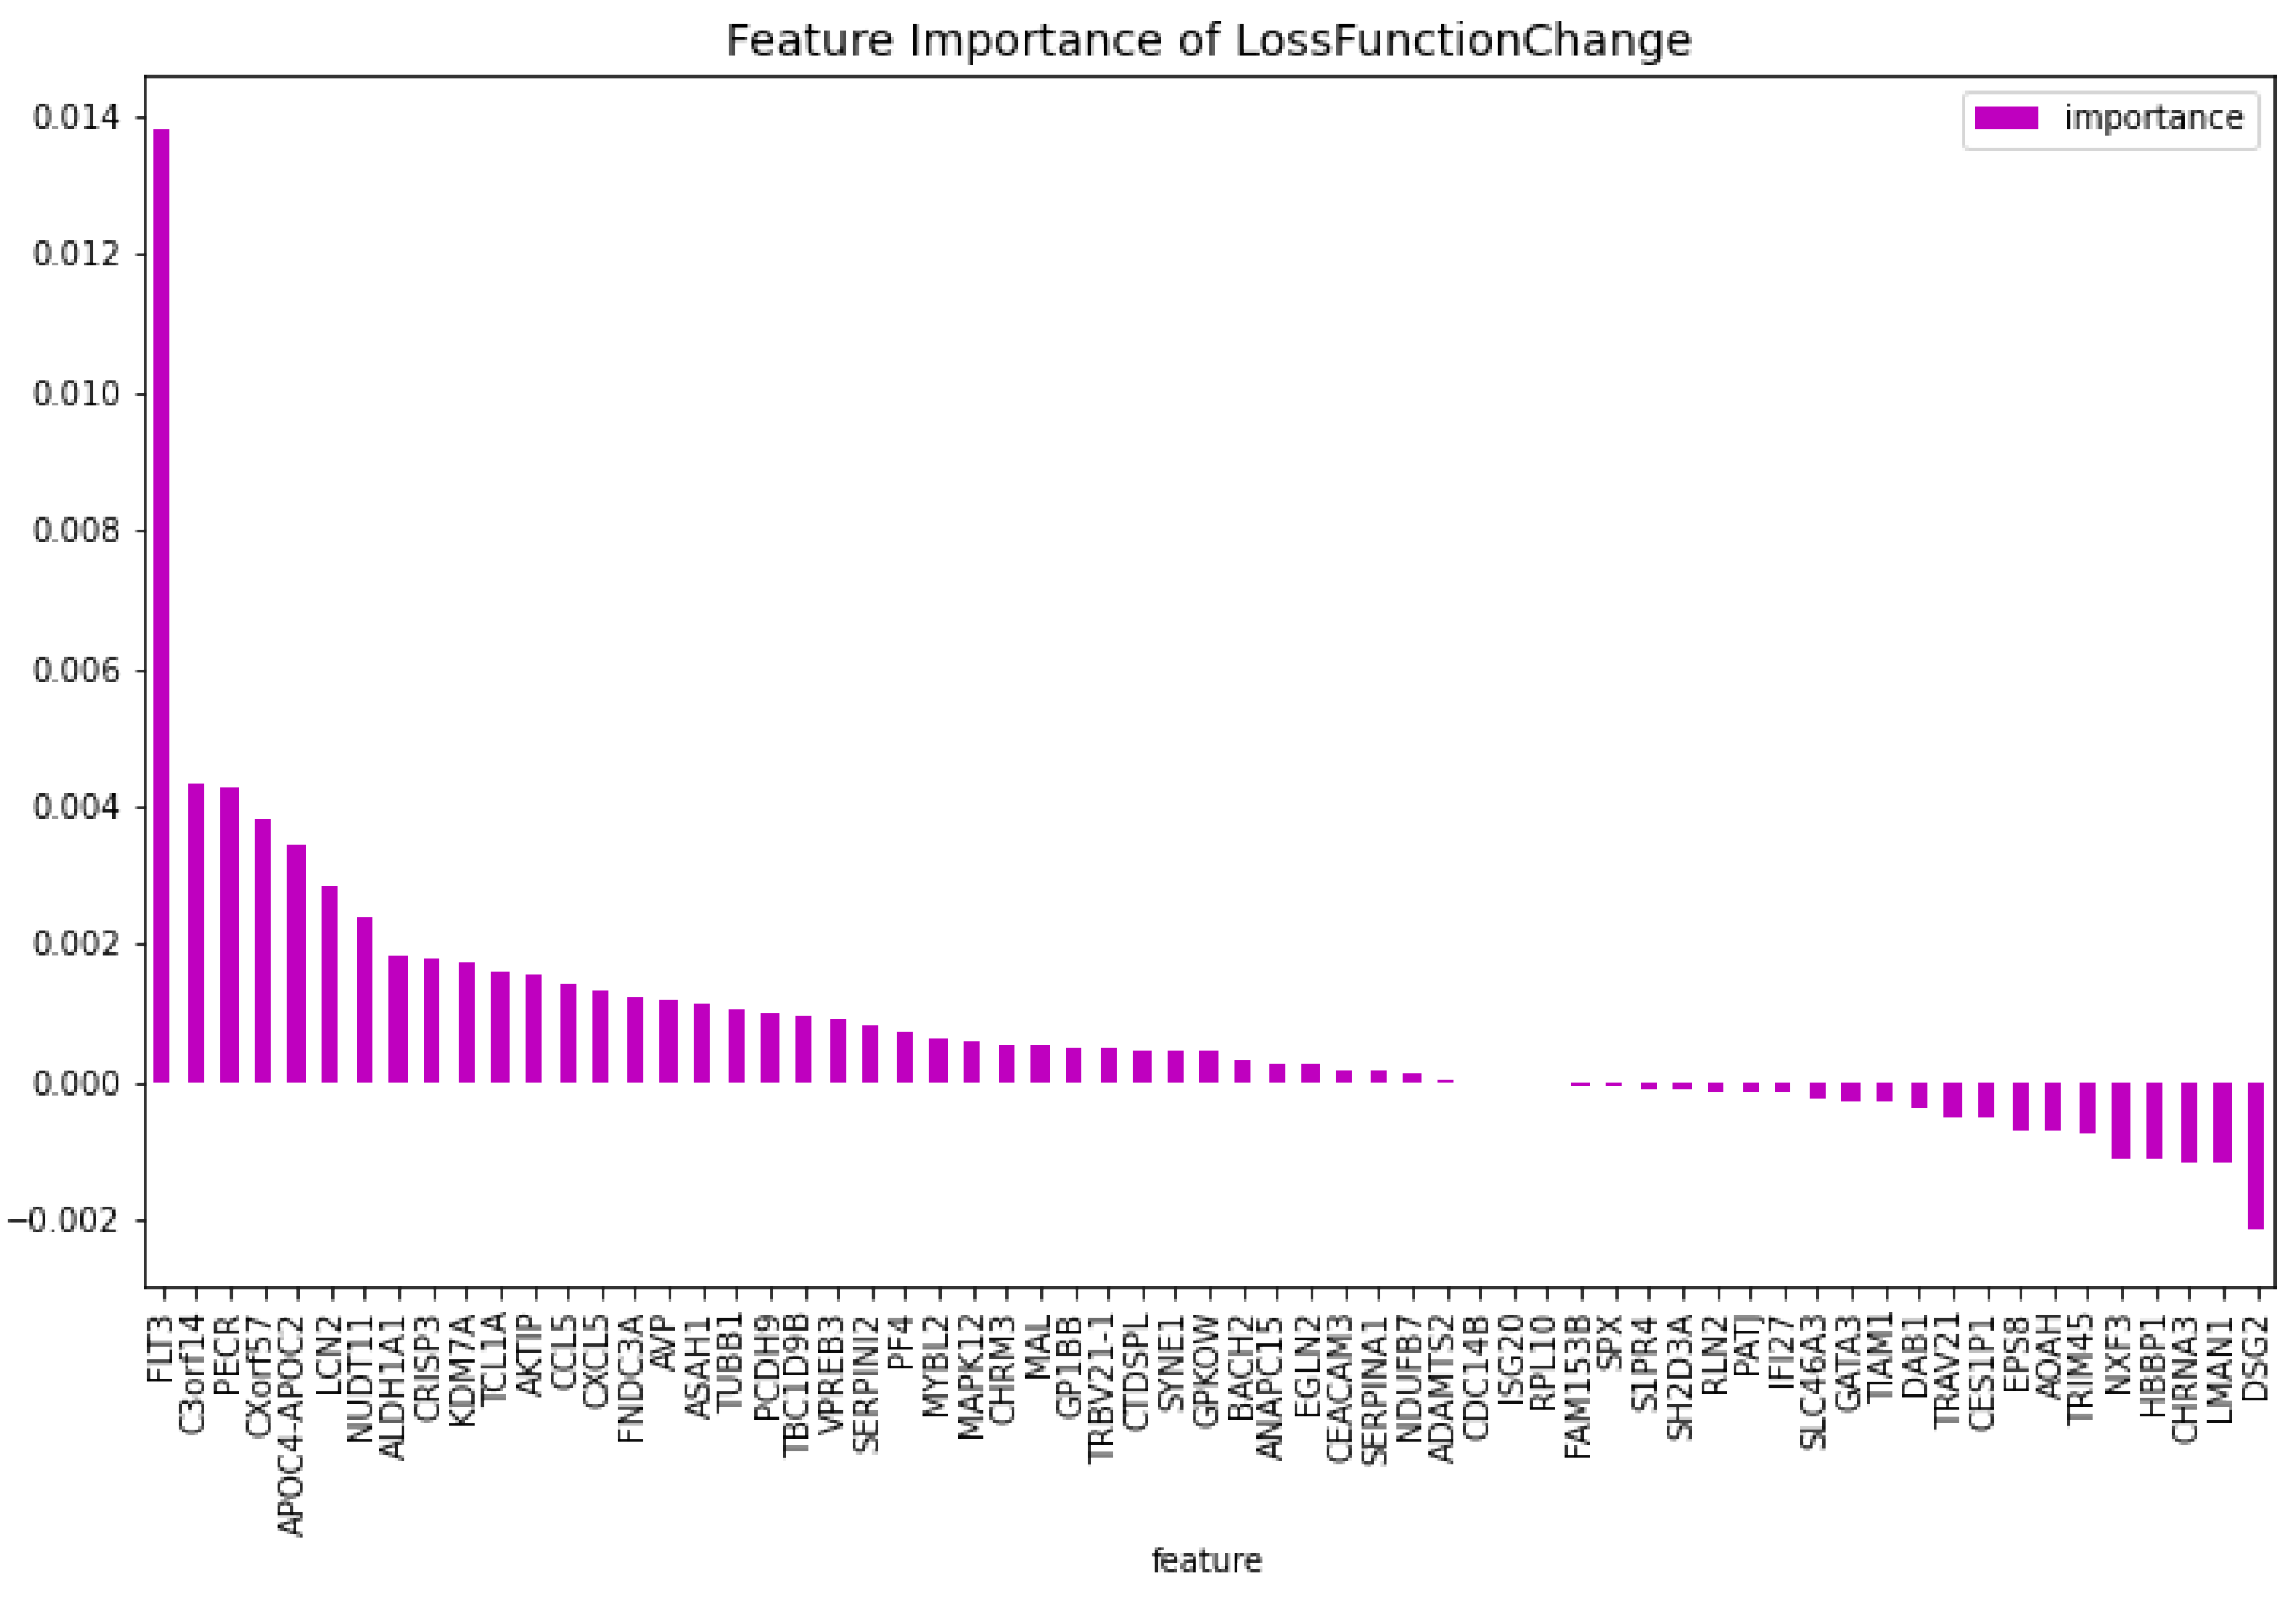
Figure 7.
The 100 most important features of the CatBoost63 model regarding the predictability of the model.
Figure 7.
The 100 most important features of the CatBoost63 model regarding the predictability of the model.
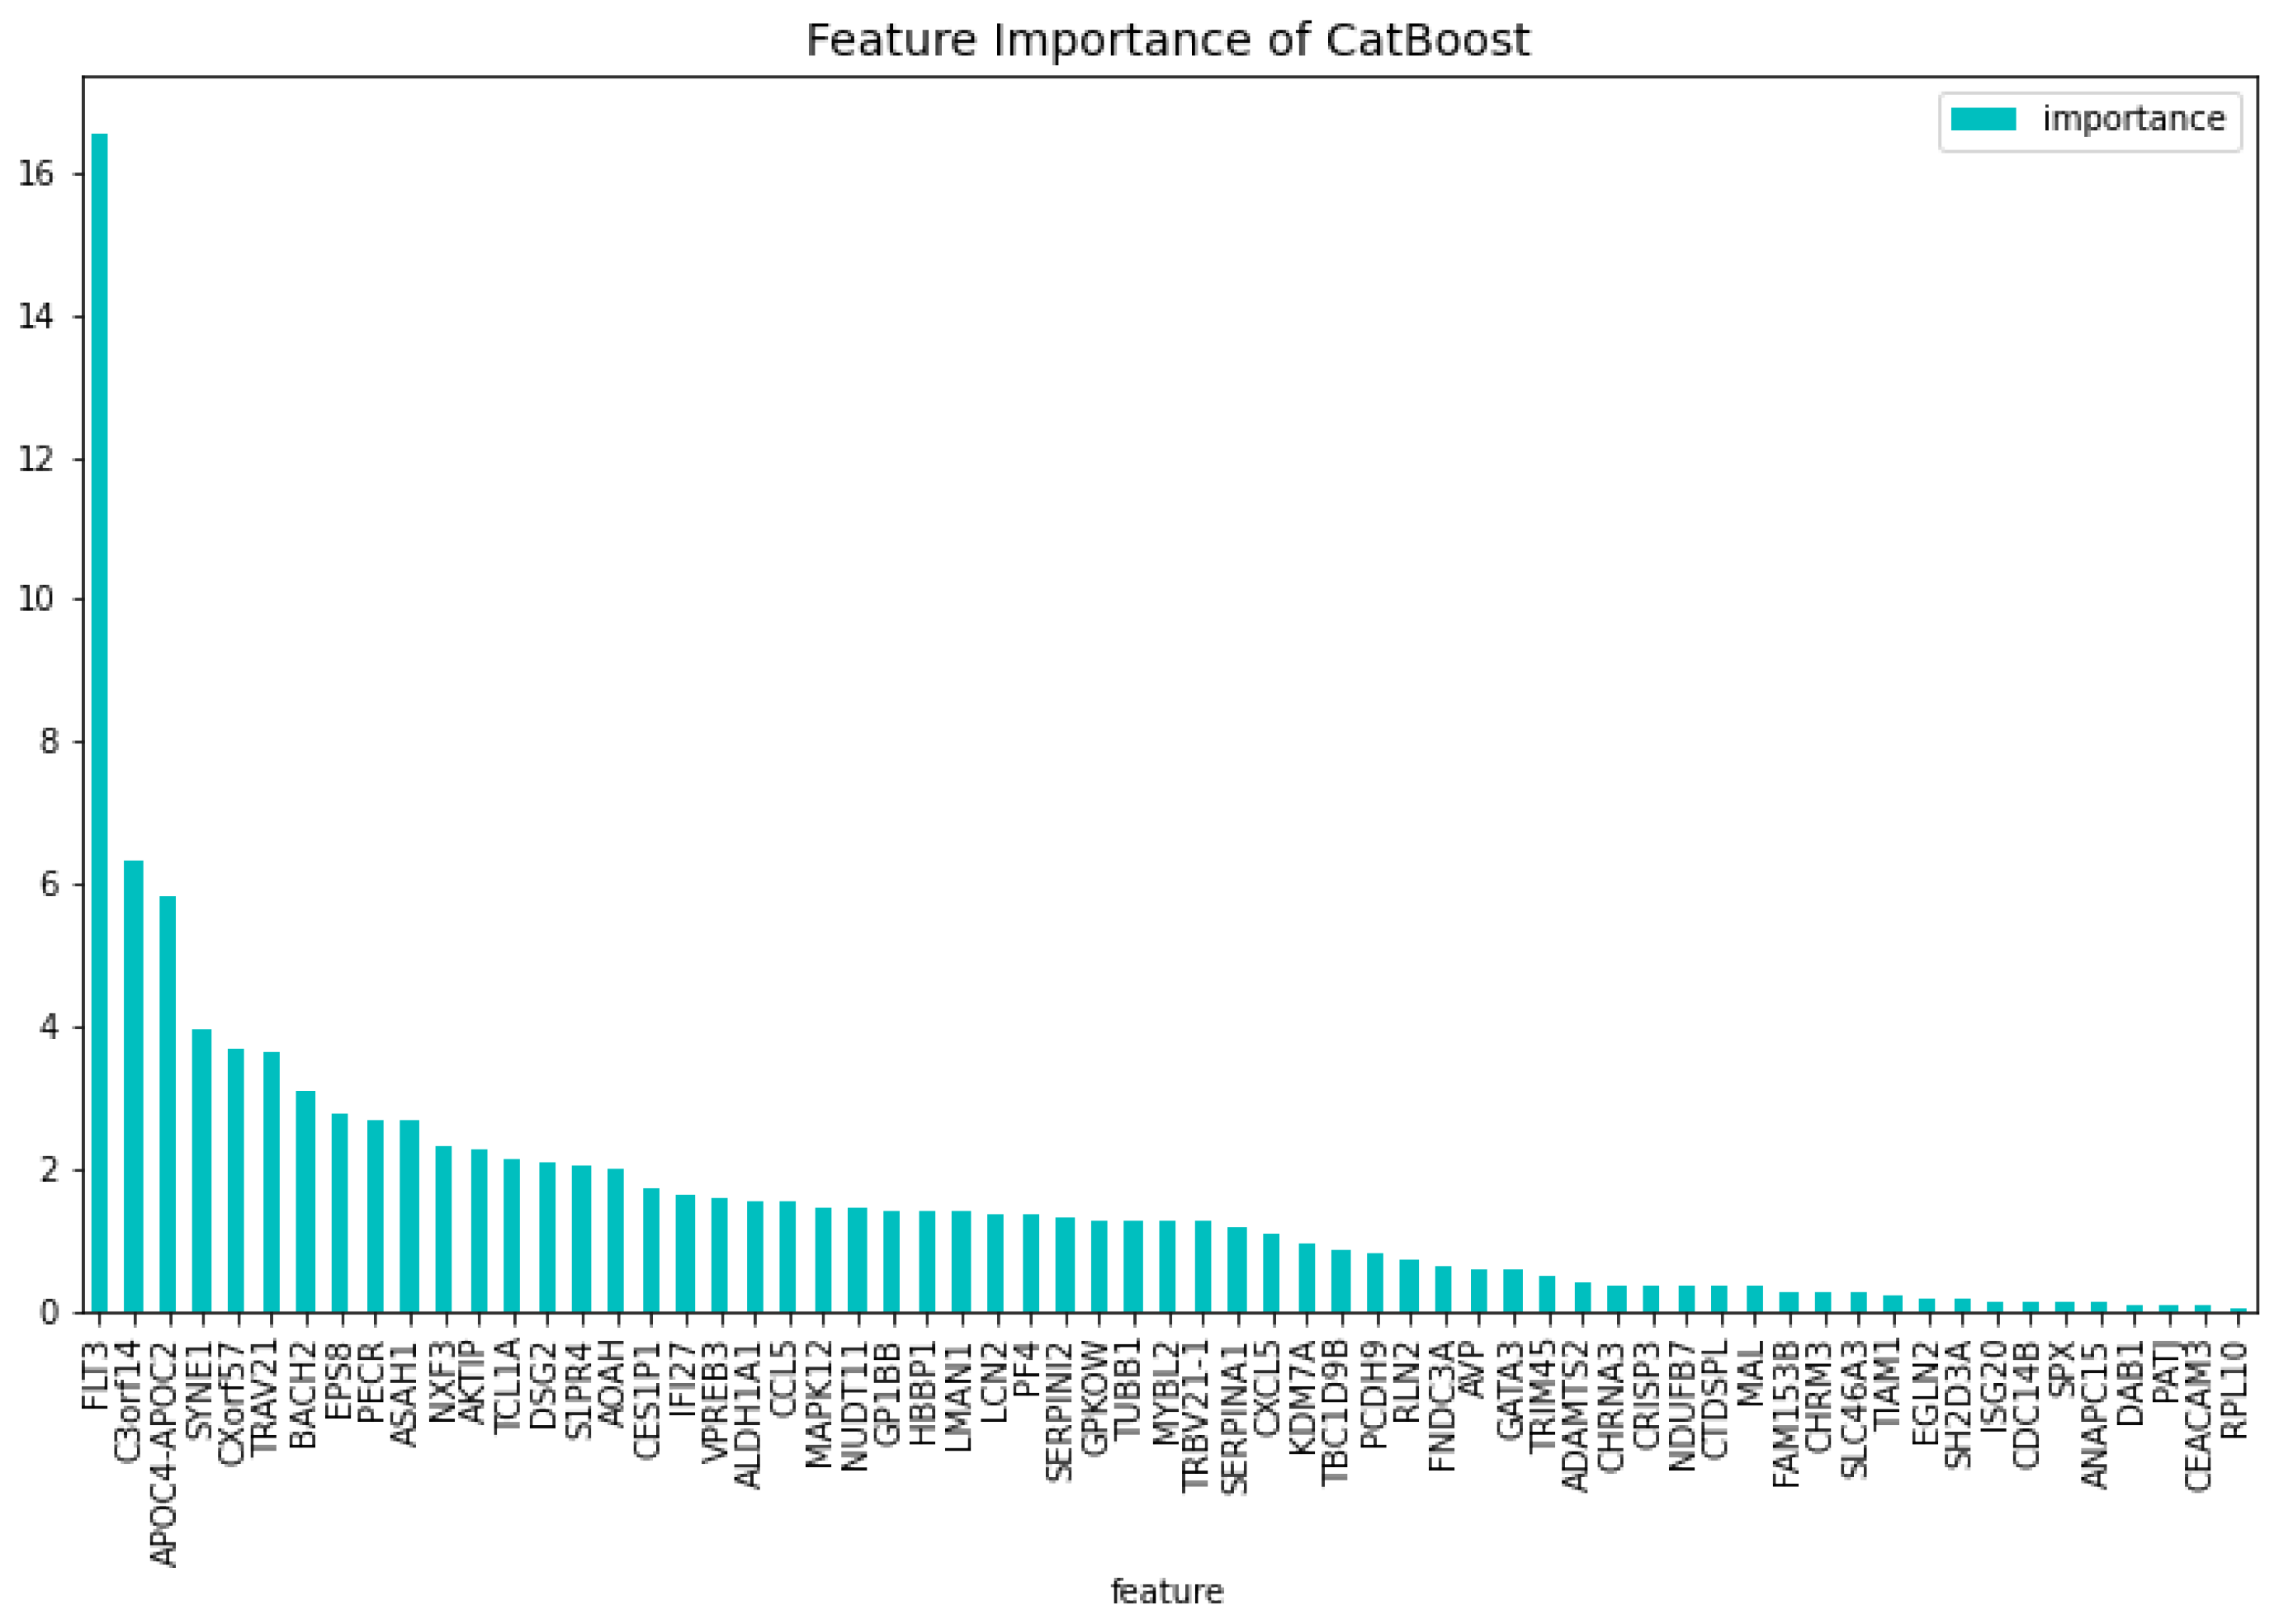
Figure 8.
The most important features of the CatBoost19 model regarding the change of the loss function.
Figure 8.
The most important features of the CatBoost19 model regarding the change of the loss function.
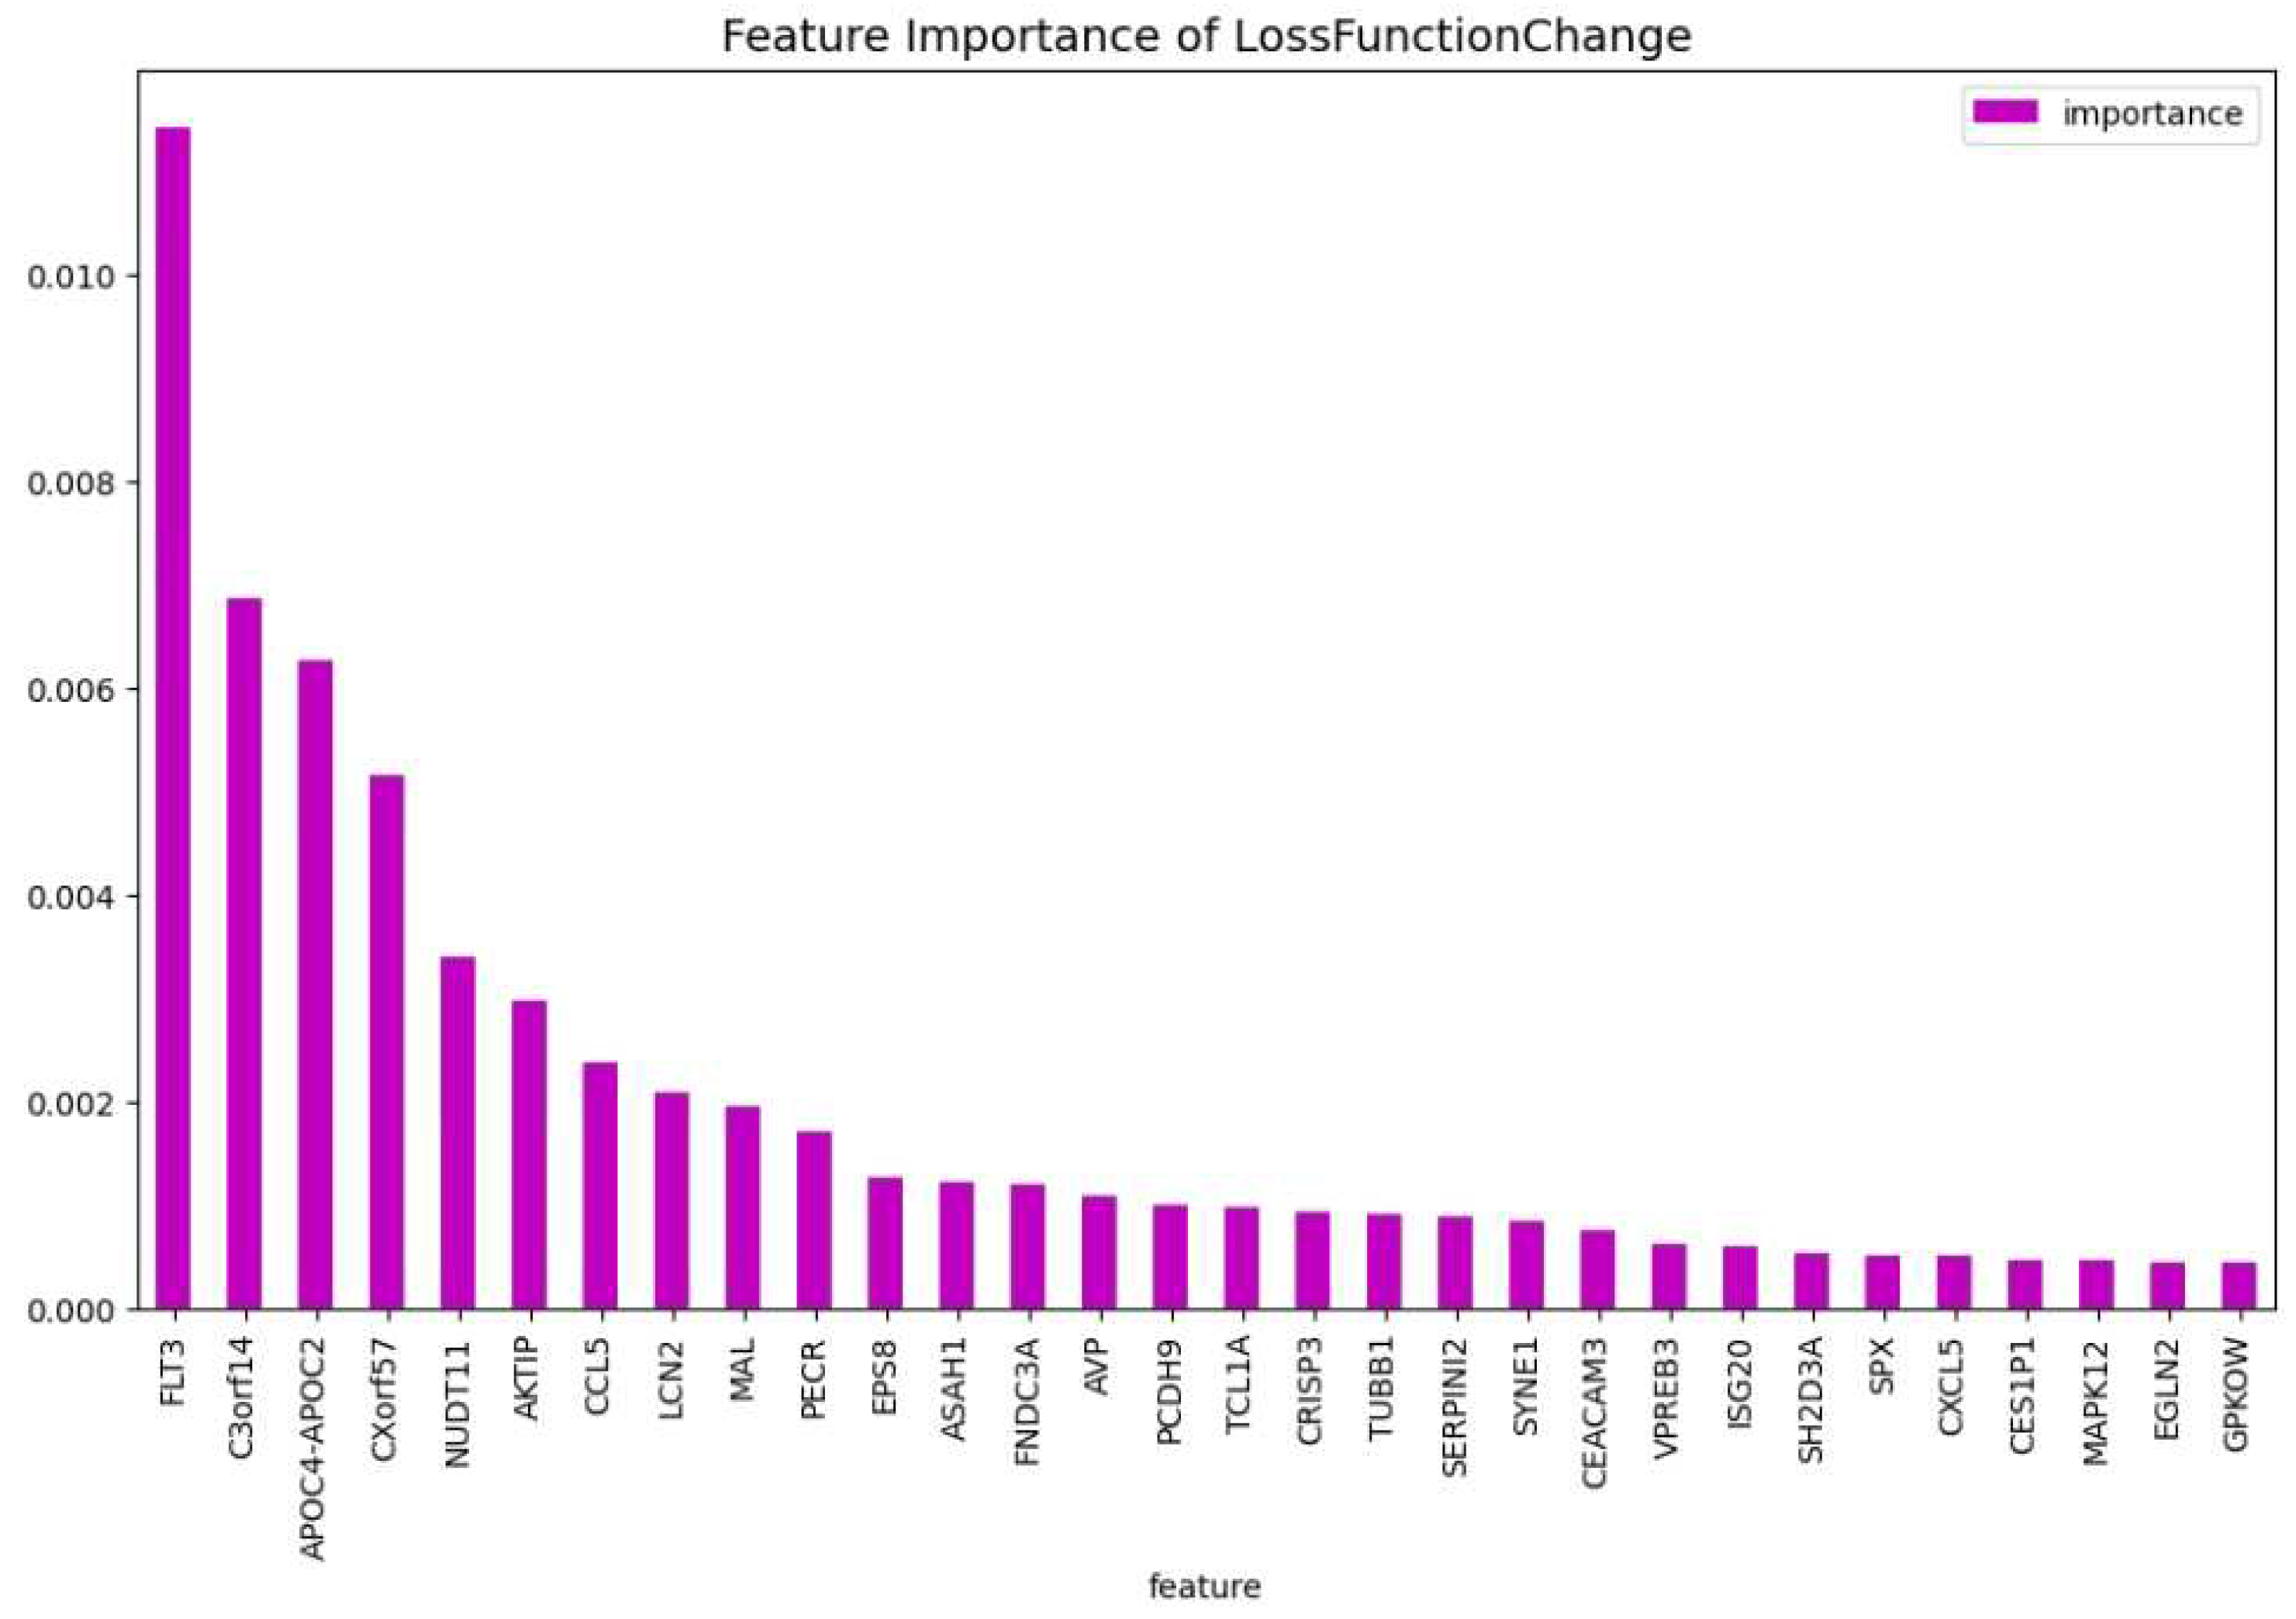
Figure 9.
The weights of the features of the CatBoost19 model regarding the predictability of the model.
Figure 9.
The weights of the features of the CatBoost19 model regarding the predictability of the model.
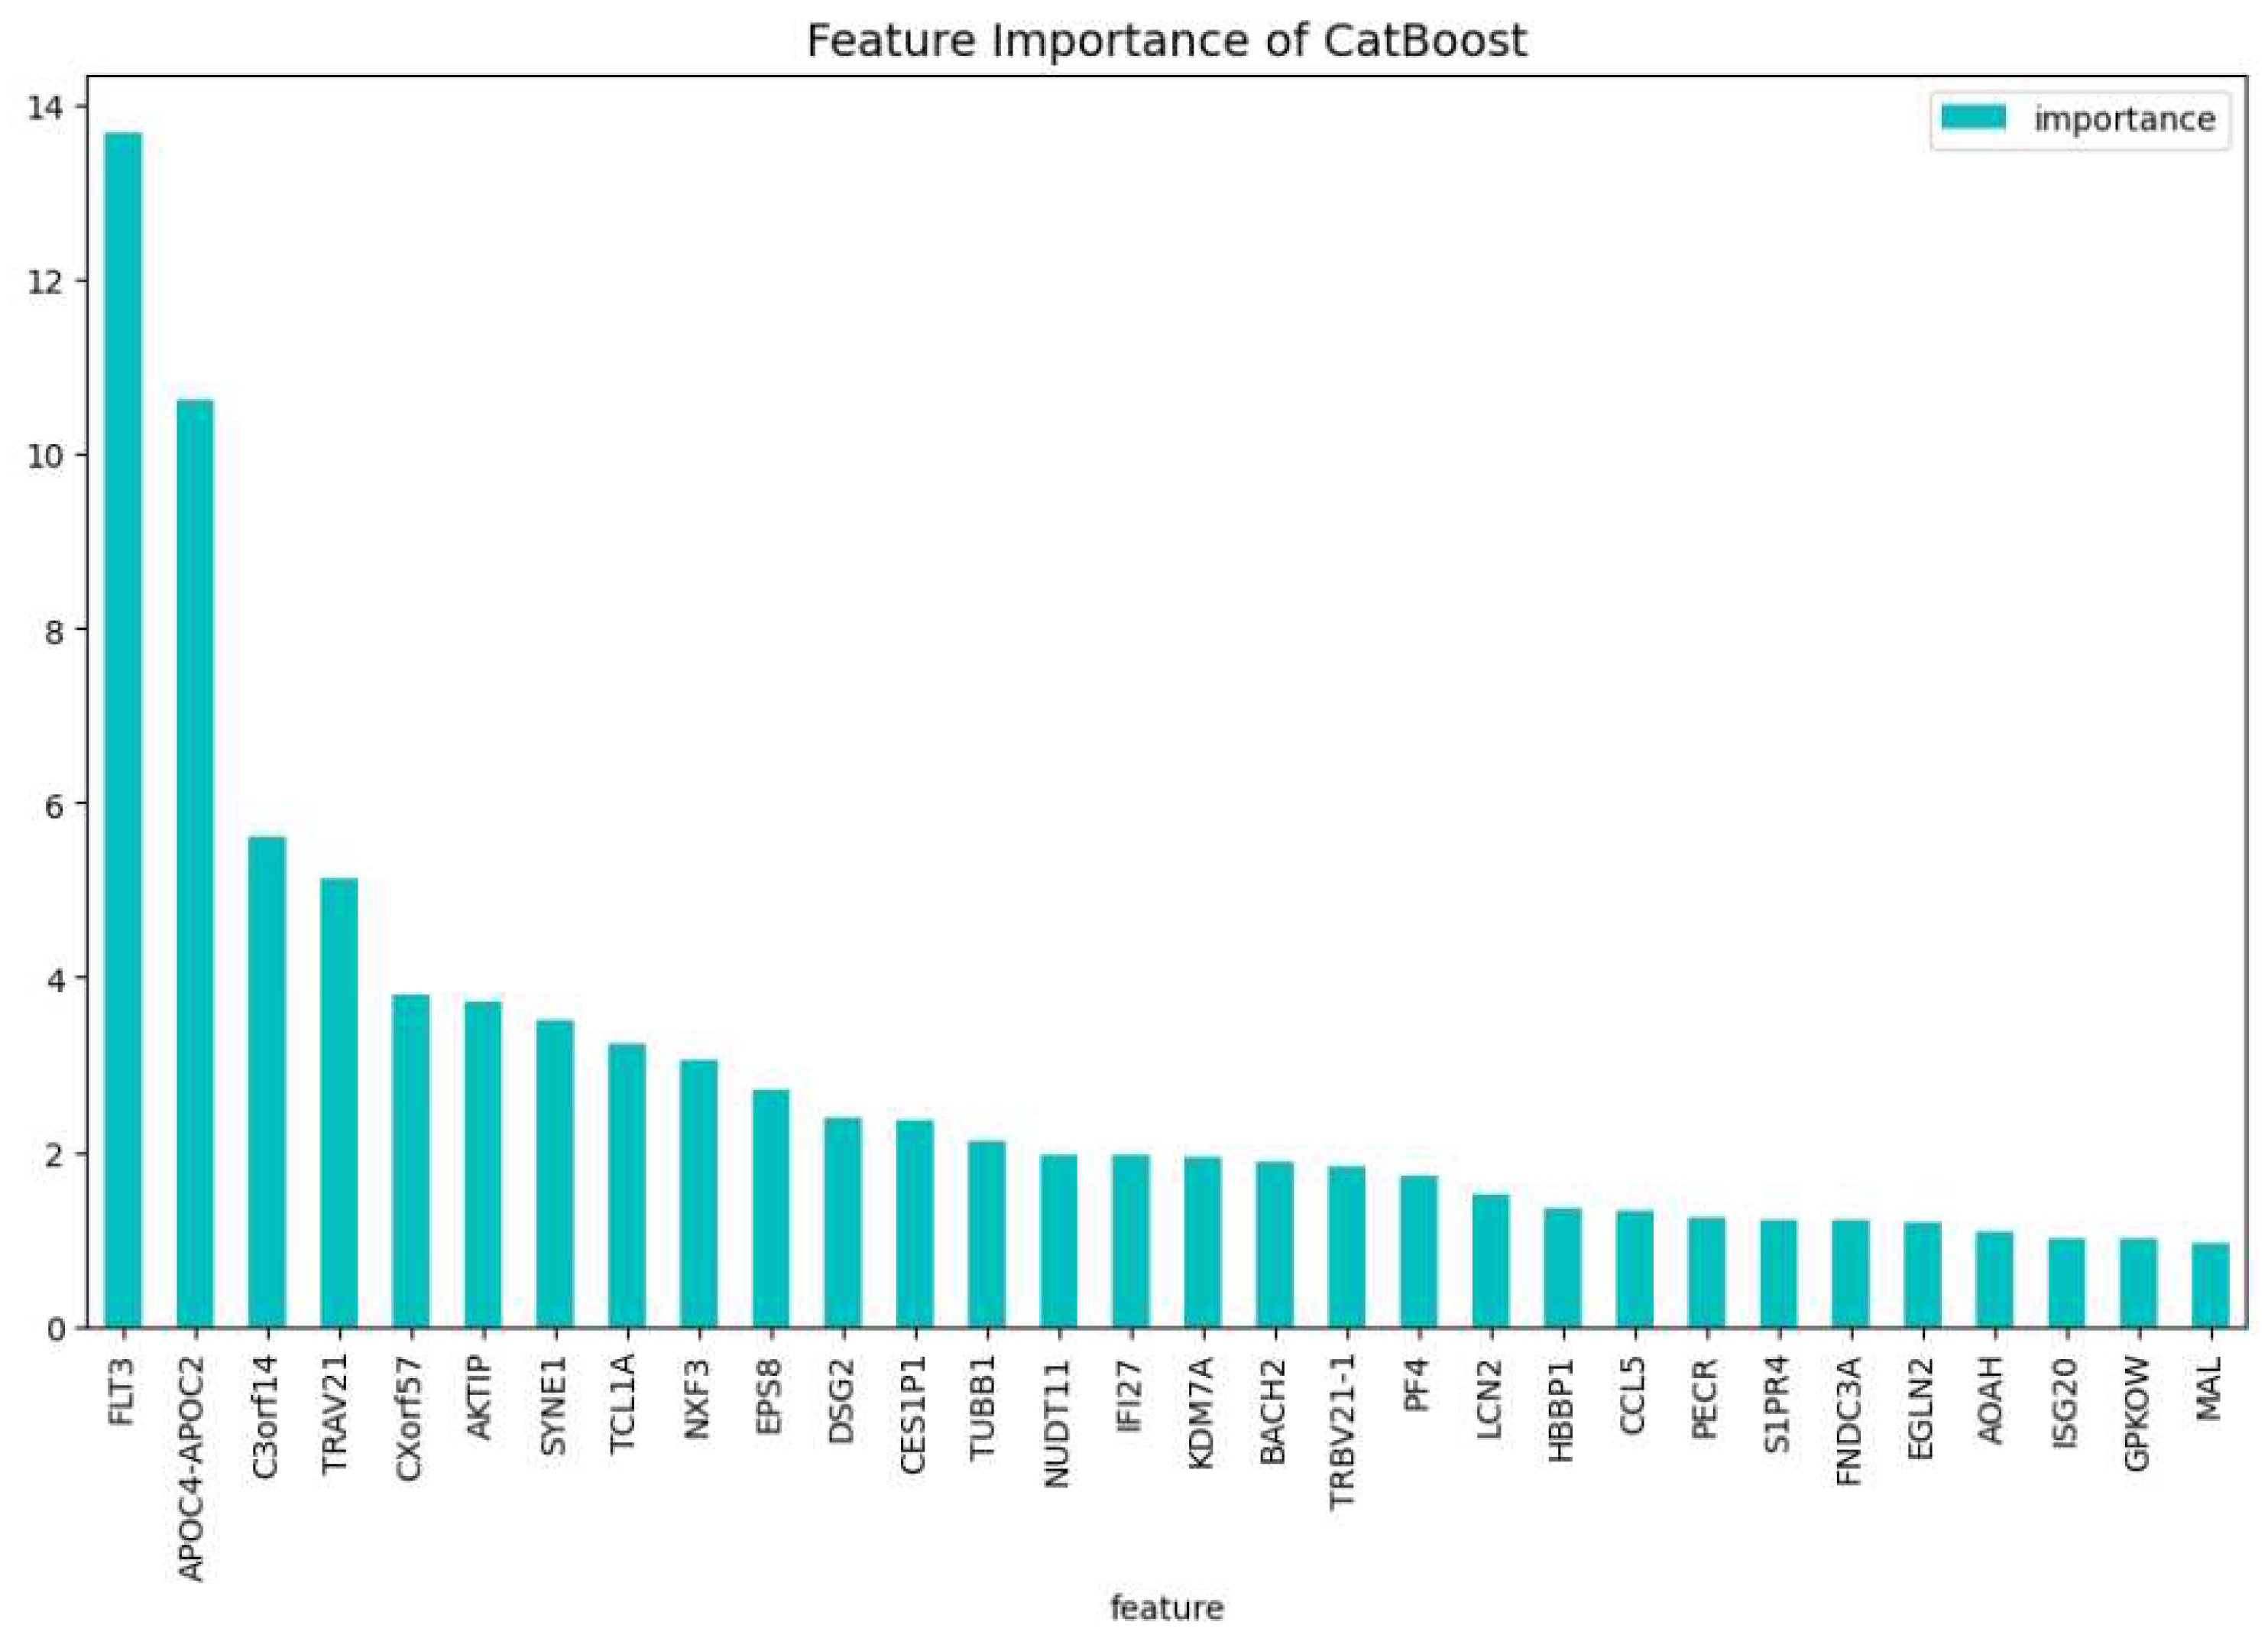
Figure 10.
The most important features of the CatBoost15 model regarding the change of the loss function.
Figure 10.
The most important features of the CatBoost15 model regarding the change of the loss function.
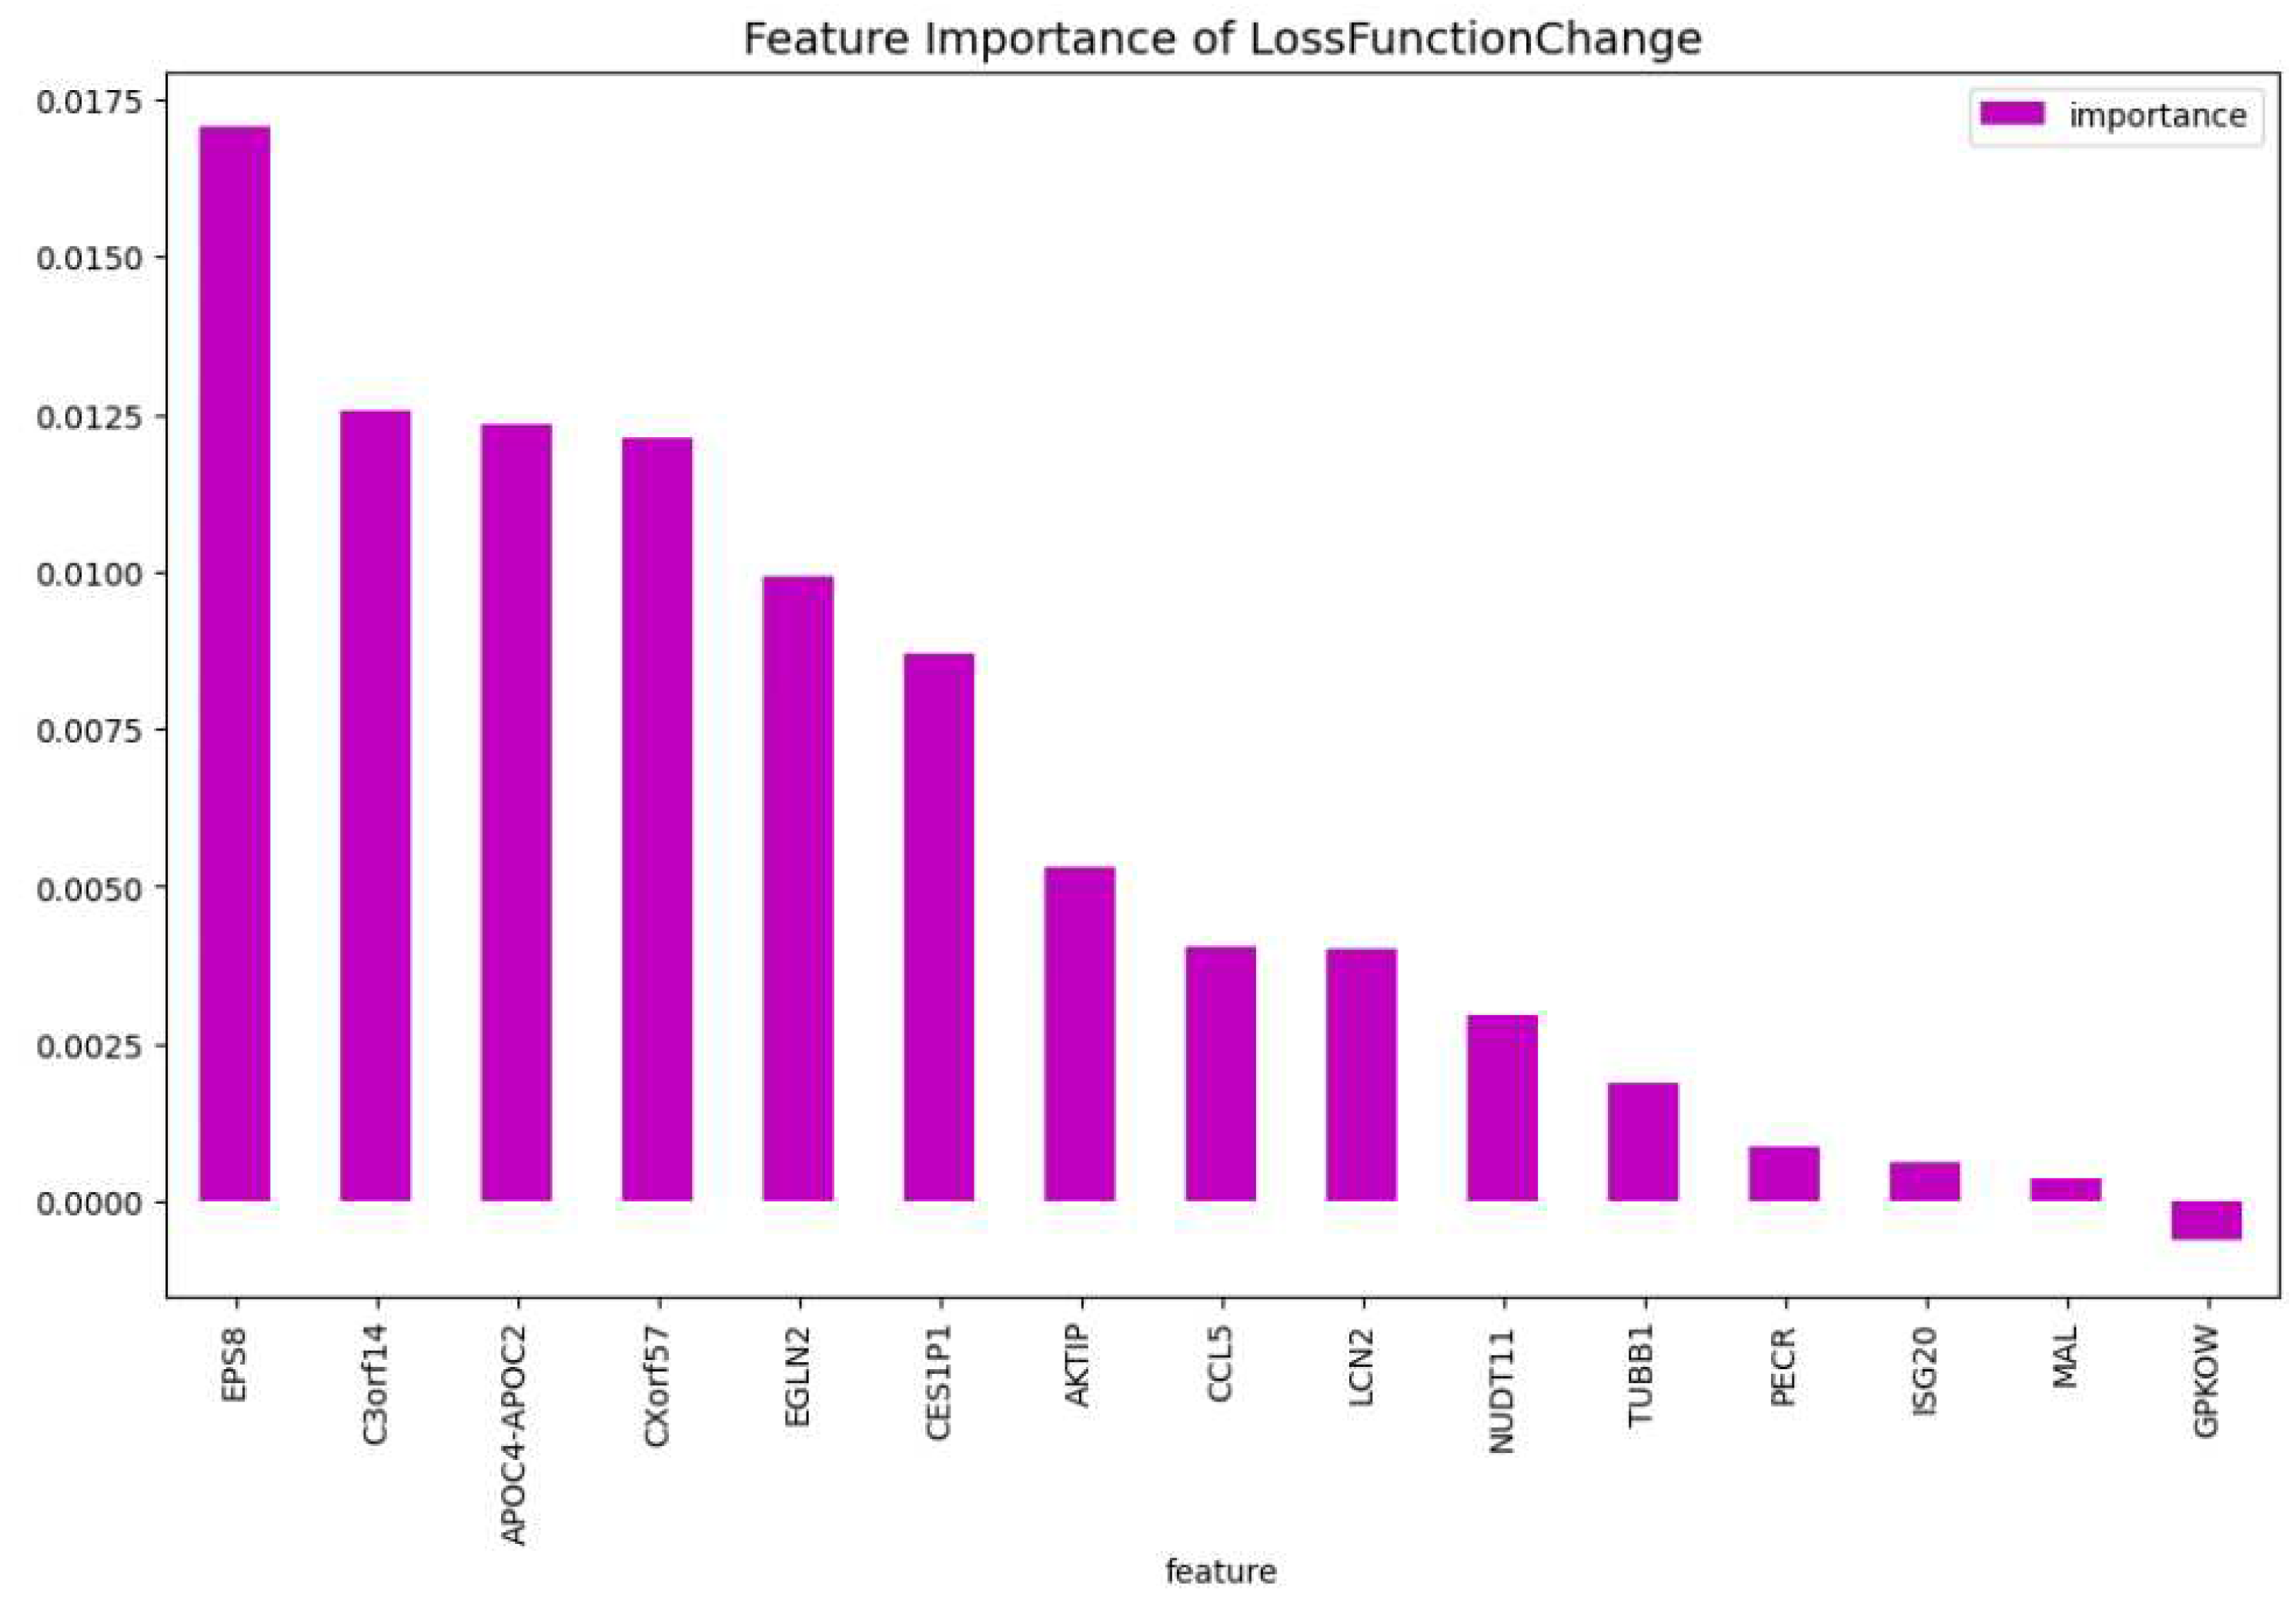
Figure 11.
The weights of the features of the CatBoost15 model regarding the predictability of the model.
Figure 11.
The weights of the features of the CatBoost15 model regarding the predictability of the model.
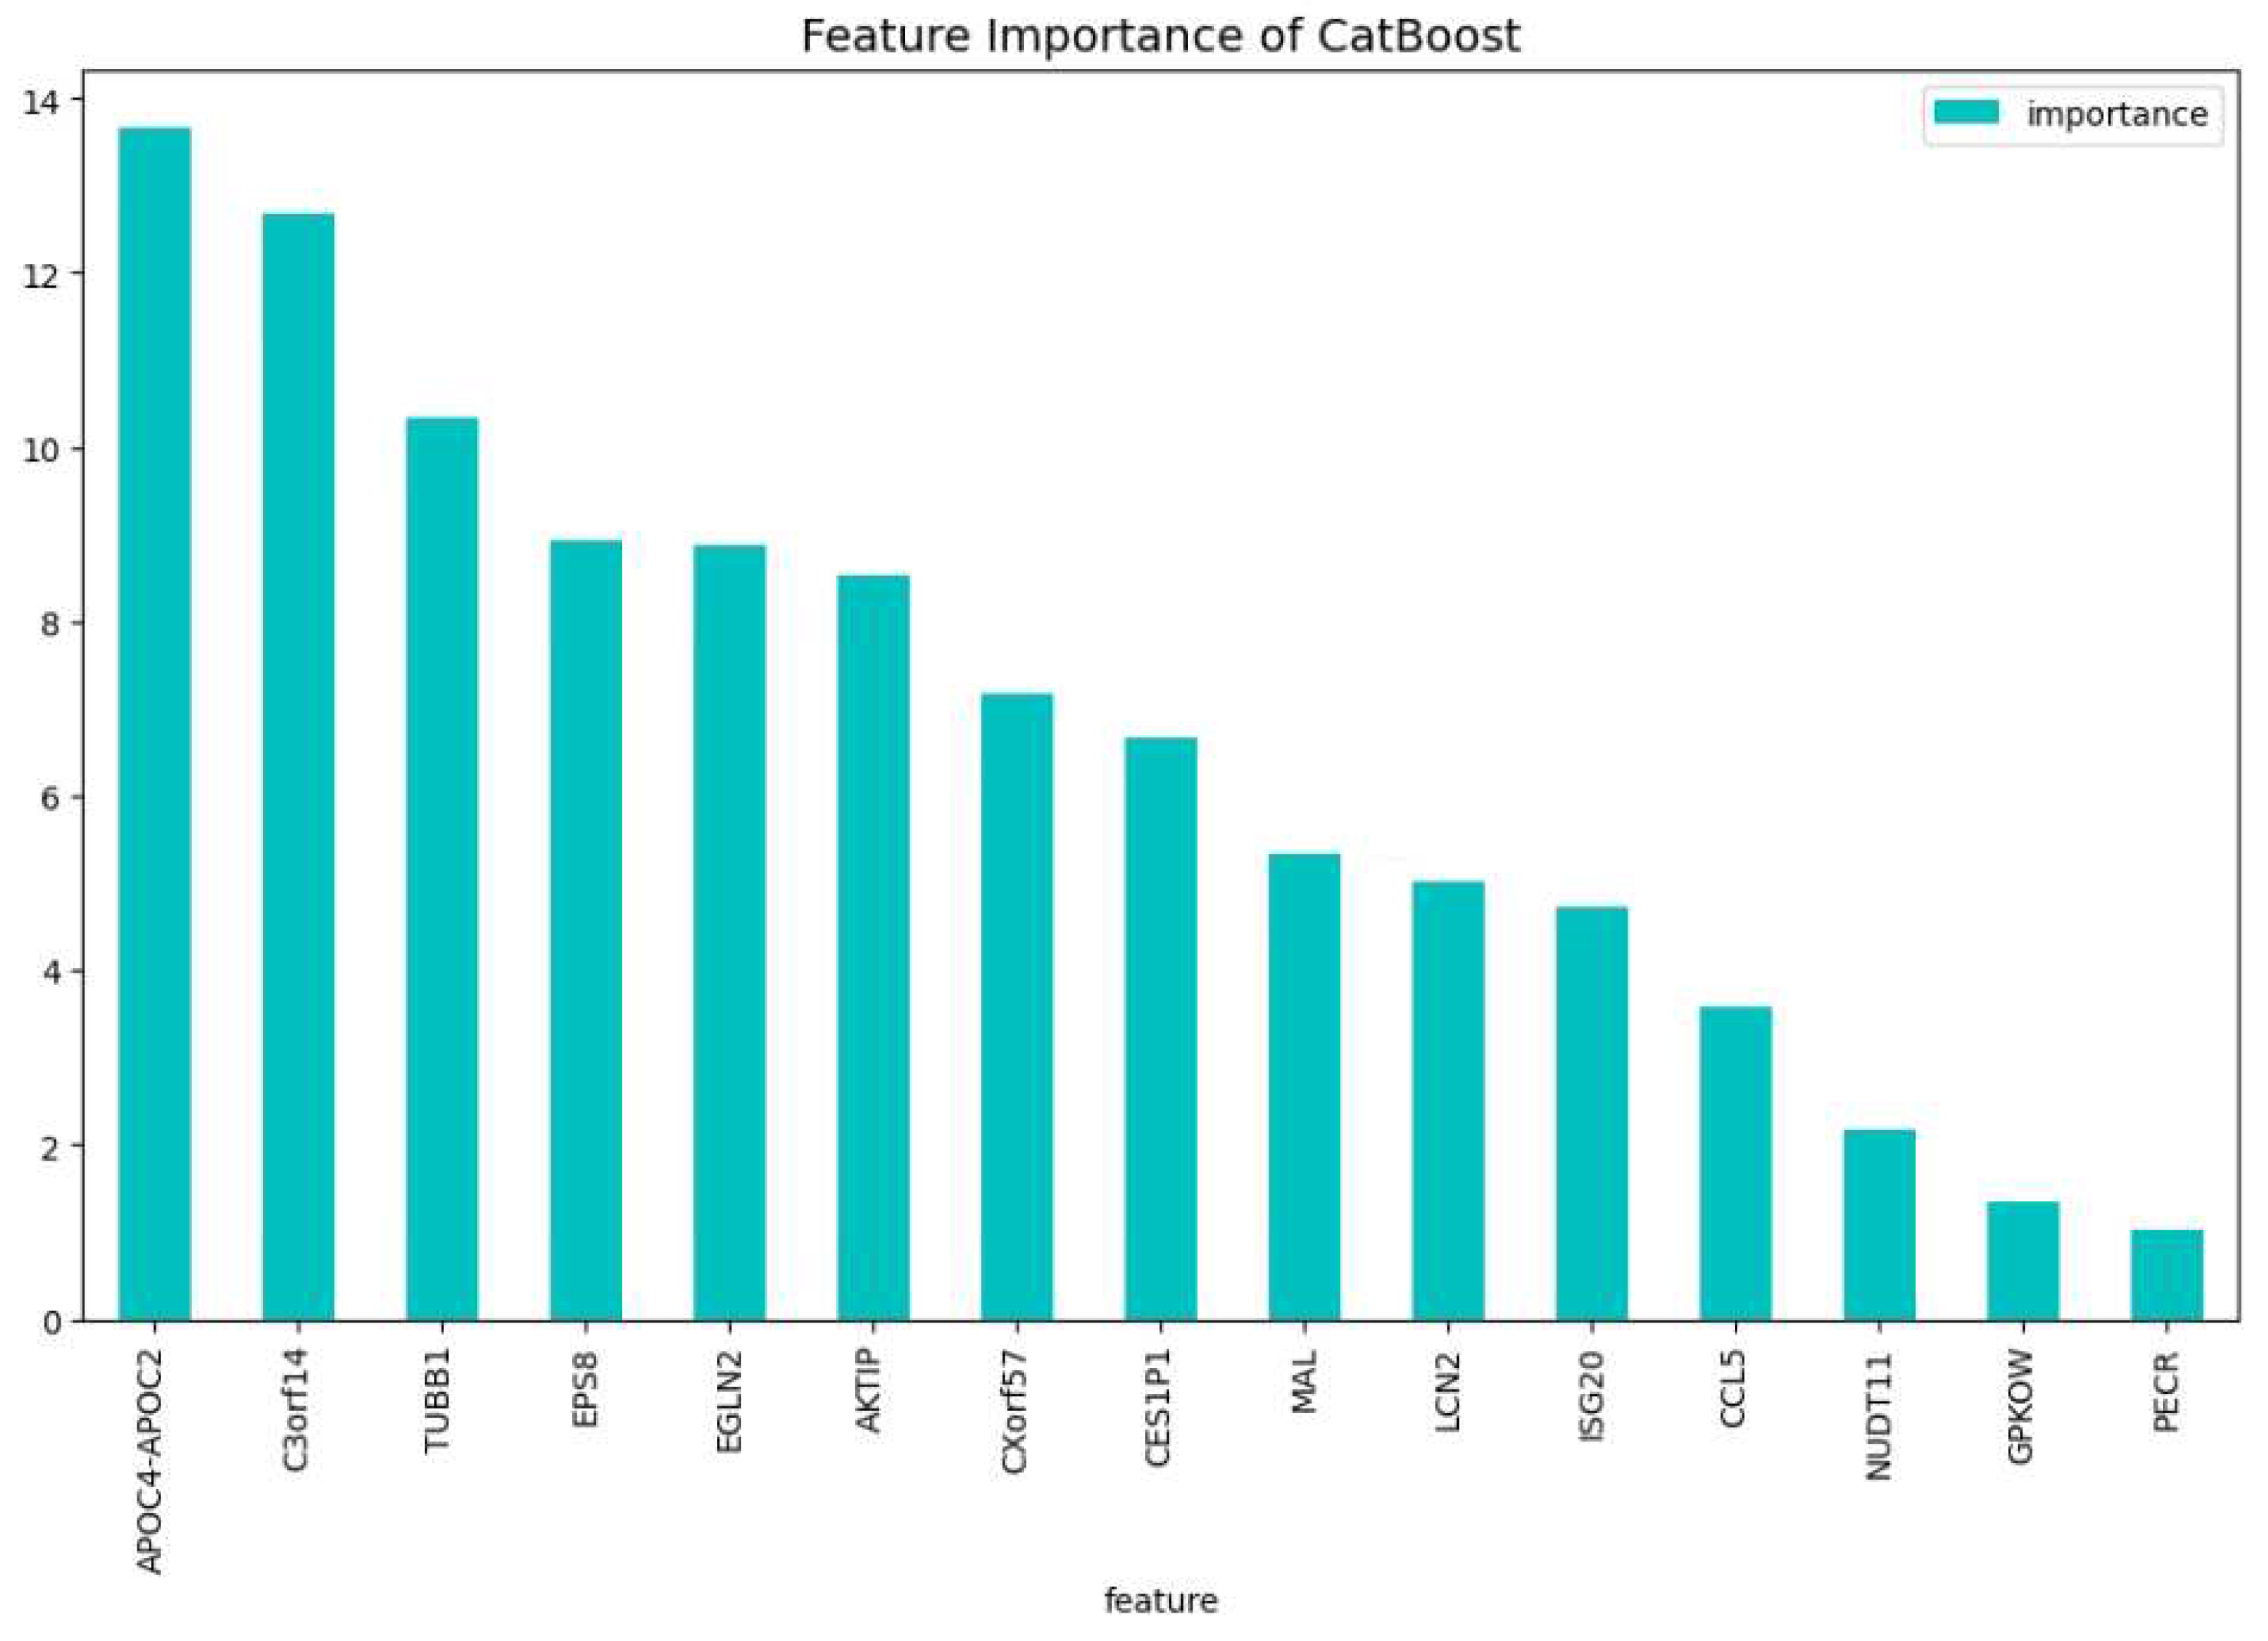
Figure 12.
The 100 most important features of the CatBoost [13] dimensionality reduction model for comparison regarding the change of the loss function.
Figure 12.
The 100 most important features of the CatBoost [13] dimensionality reduction model for comparison regarding the change of the loss function.
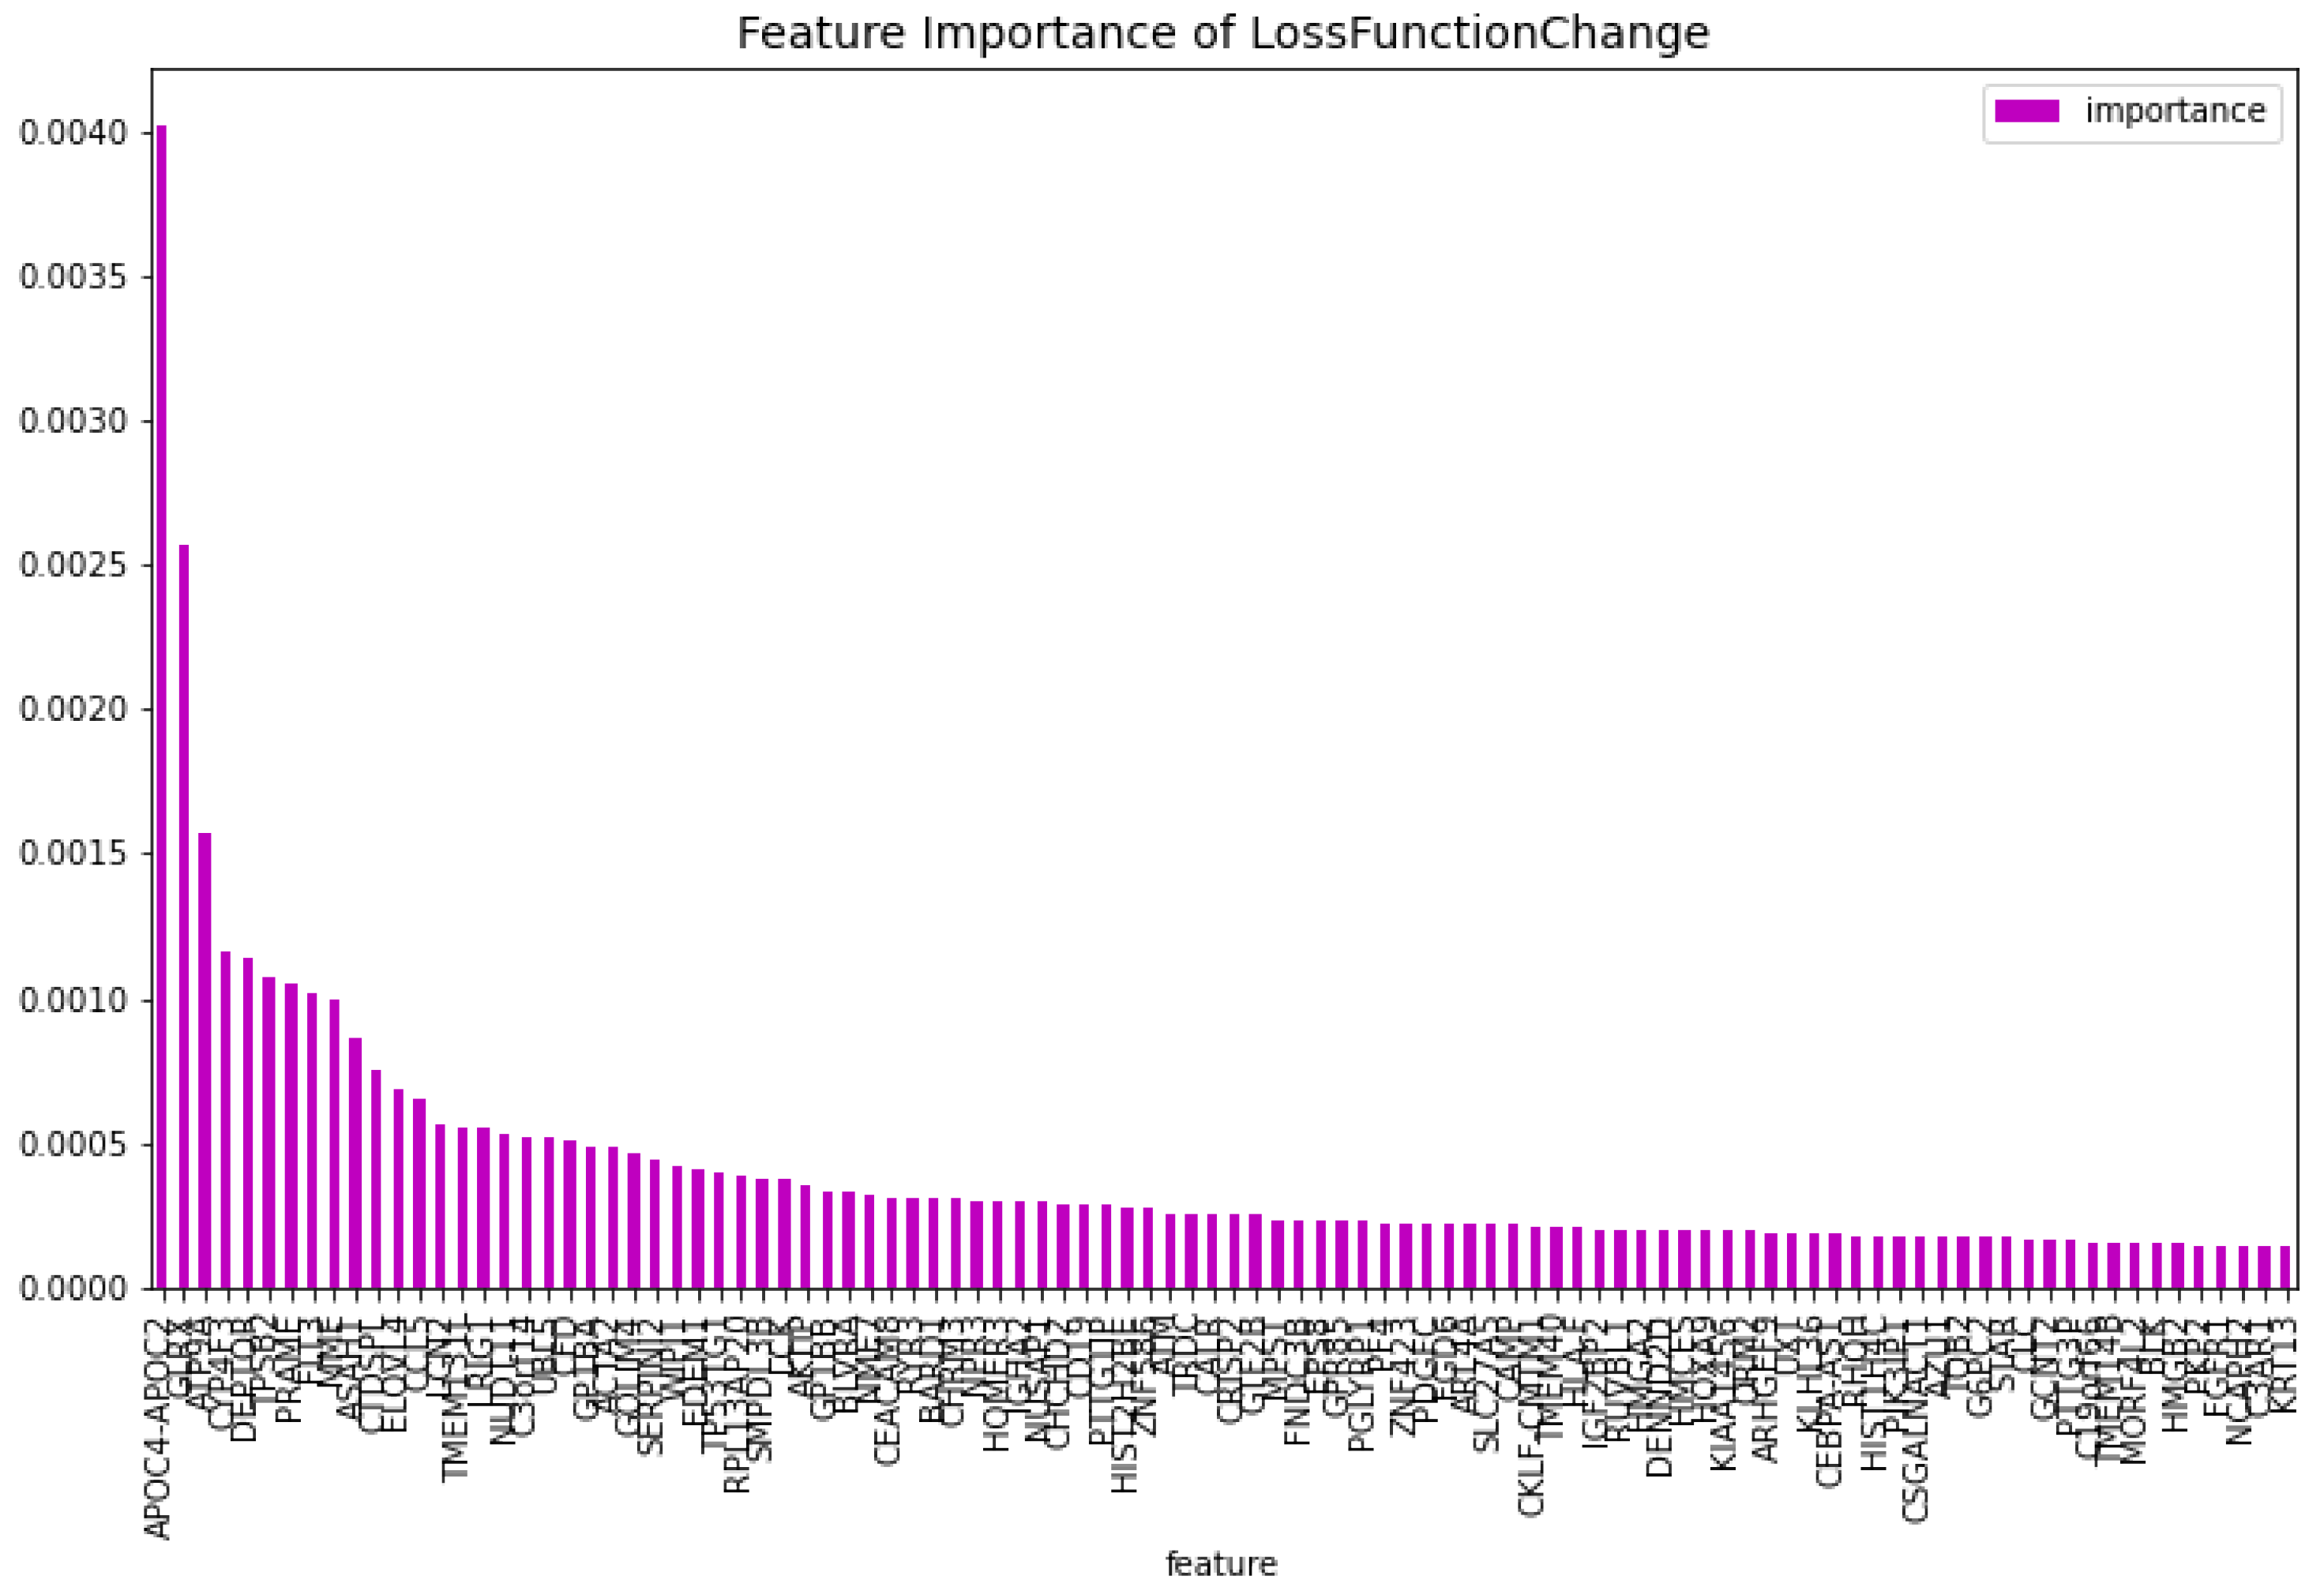
Figure 13.
The 100 most important features of the CatBoost [13] dimensionality reduction model for comparison regarding the predictability of the model.
Figure 13.
The 100 most important features of the CatBoost [13] dimensionality reduction model for comparison regarding the predictability of the model.
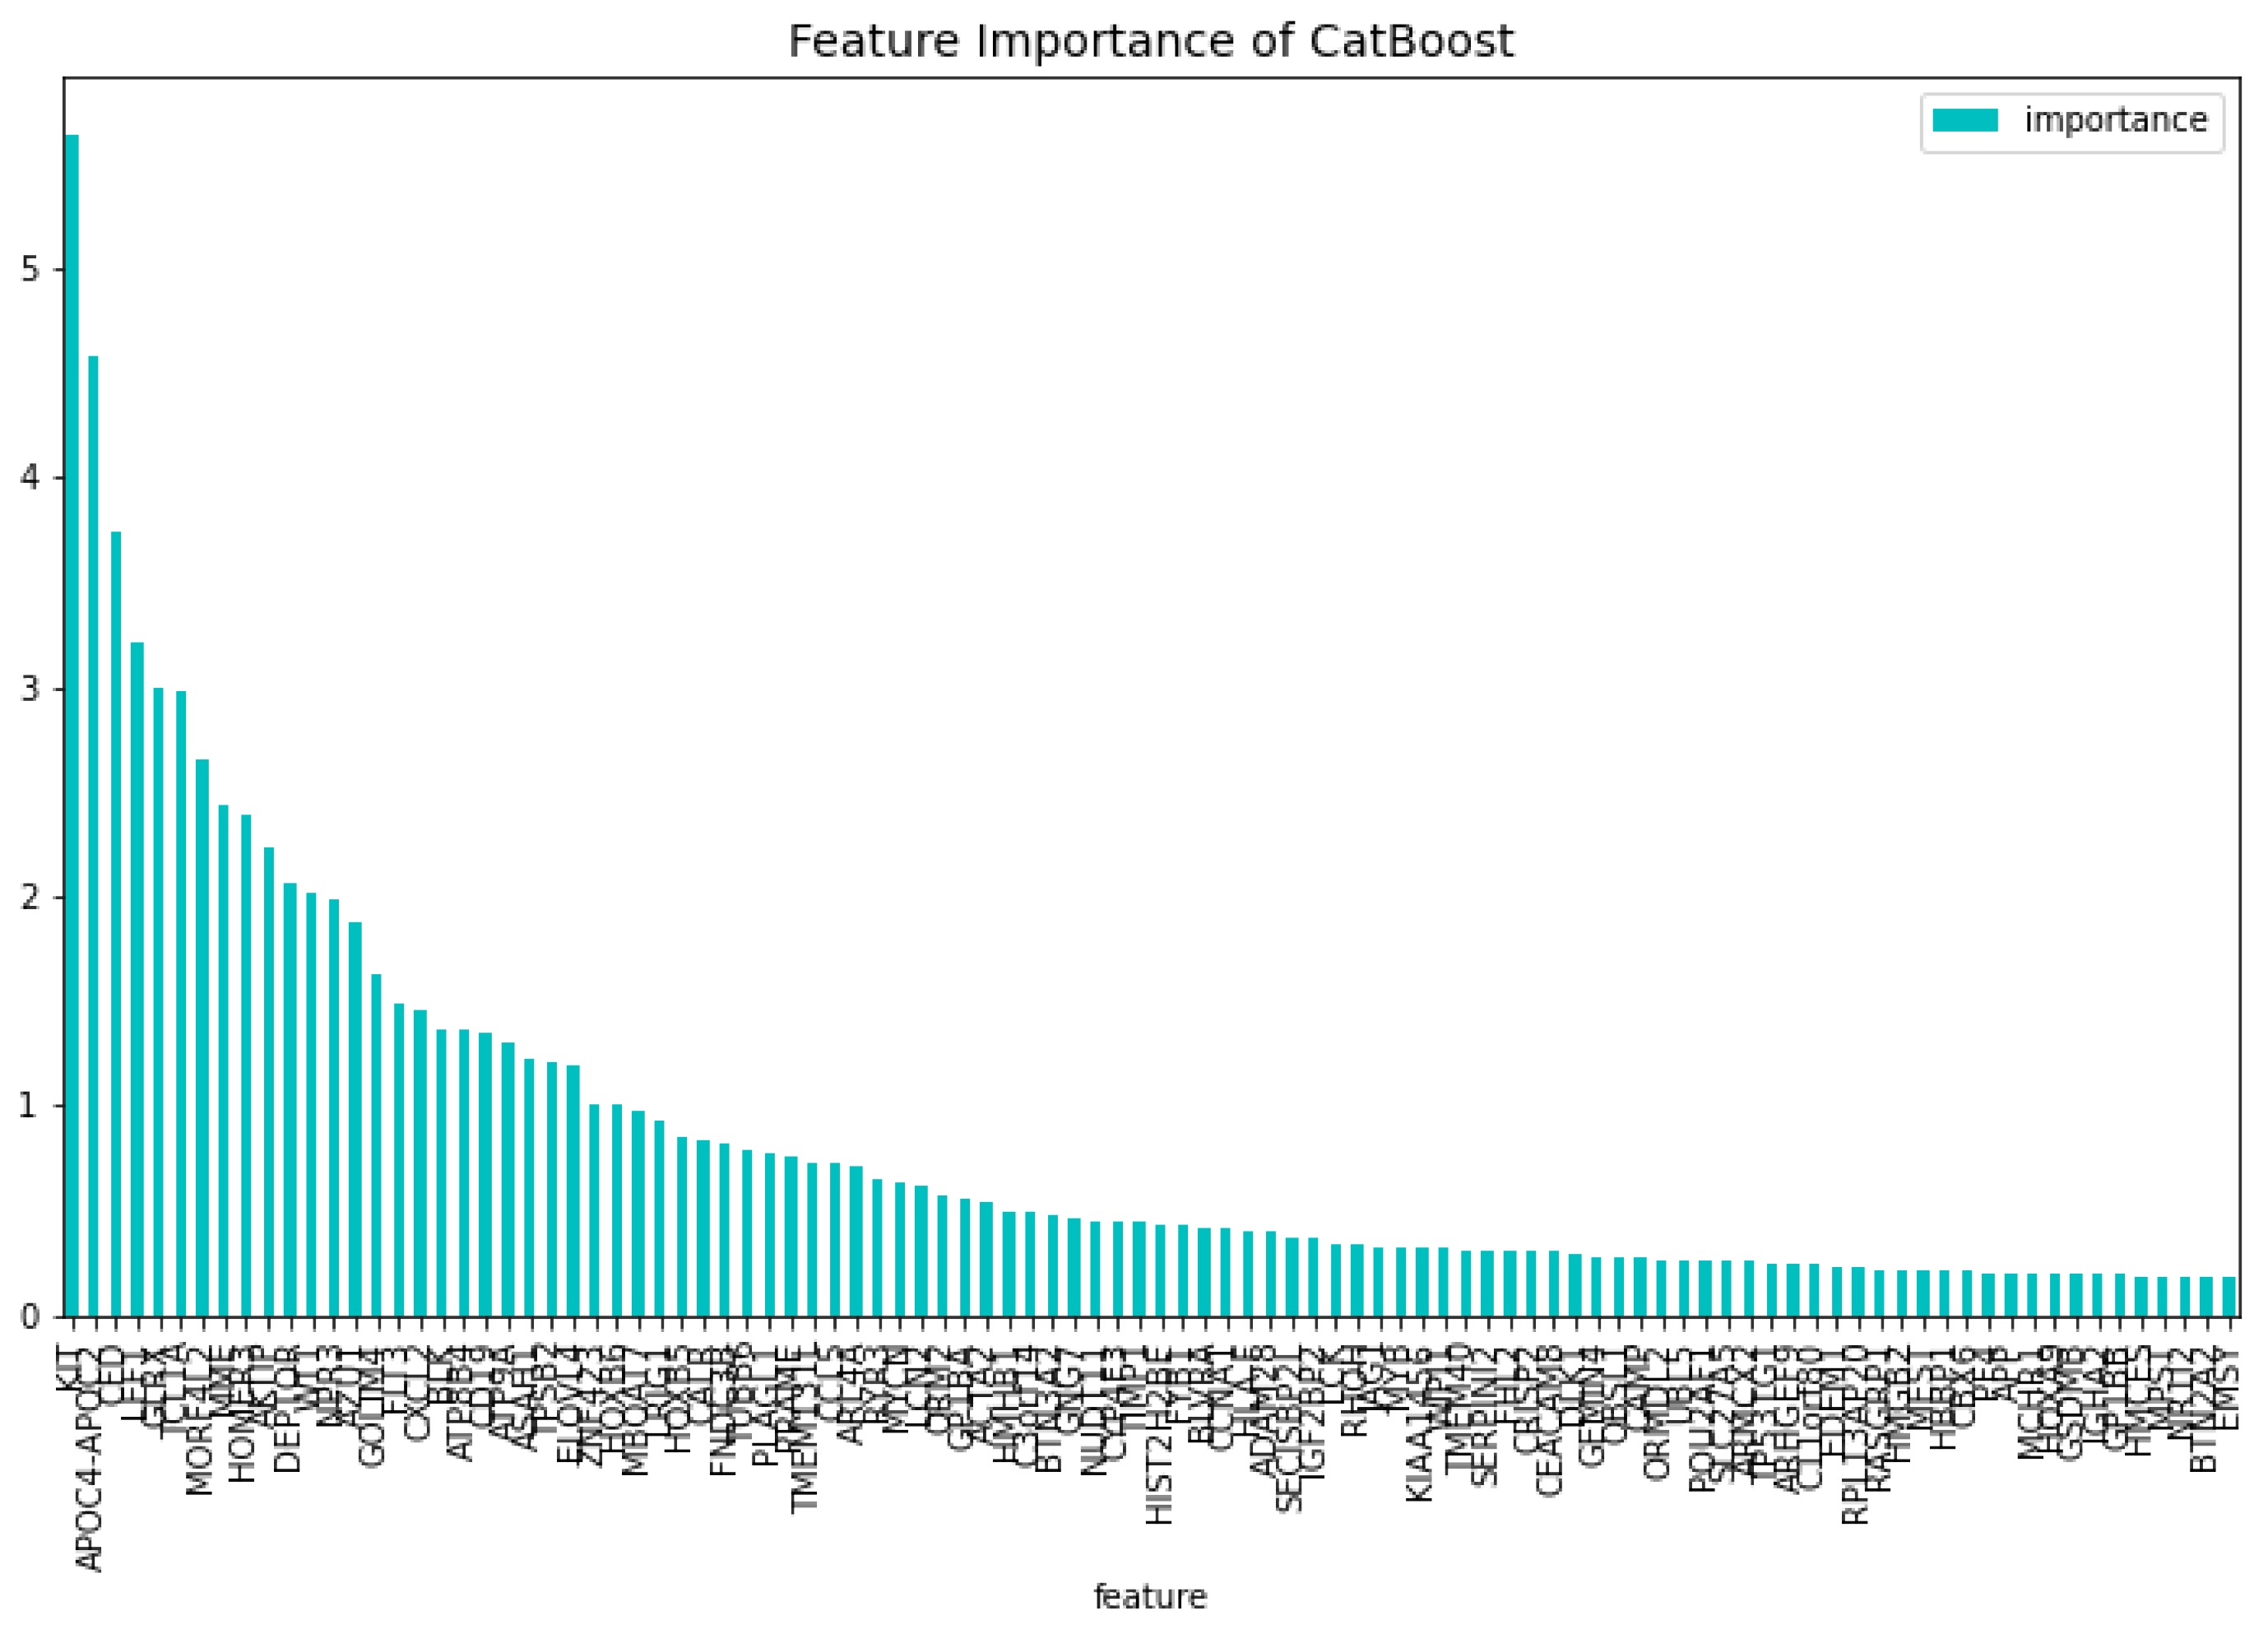
Figure 14.
The 100 most important features of the CatBoost60 model regarding the change of the loss function.
Figure 14.
The 100 most important features of the CatBoost60 model regarding the change of the loss function.
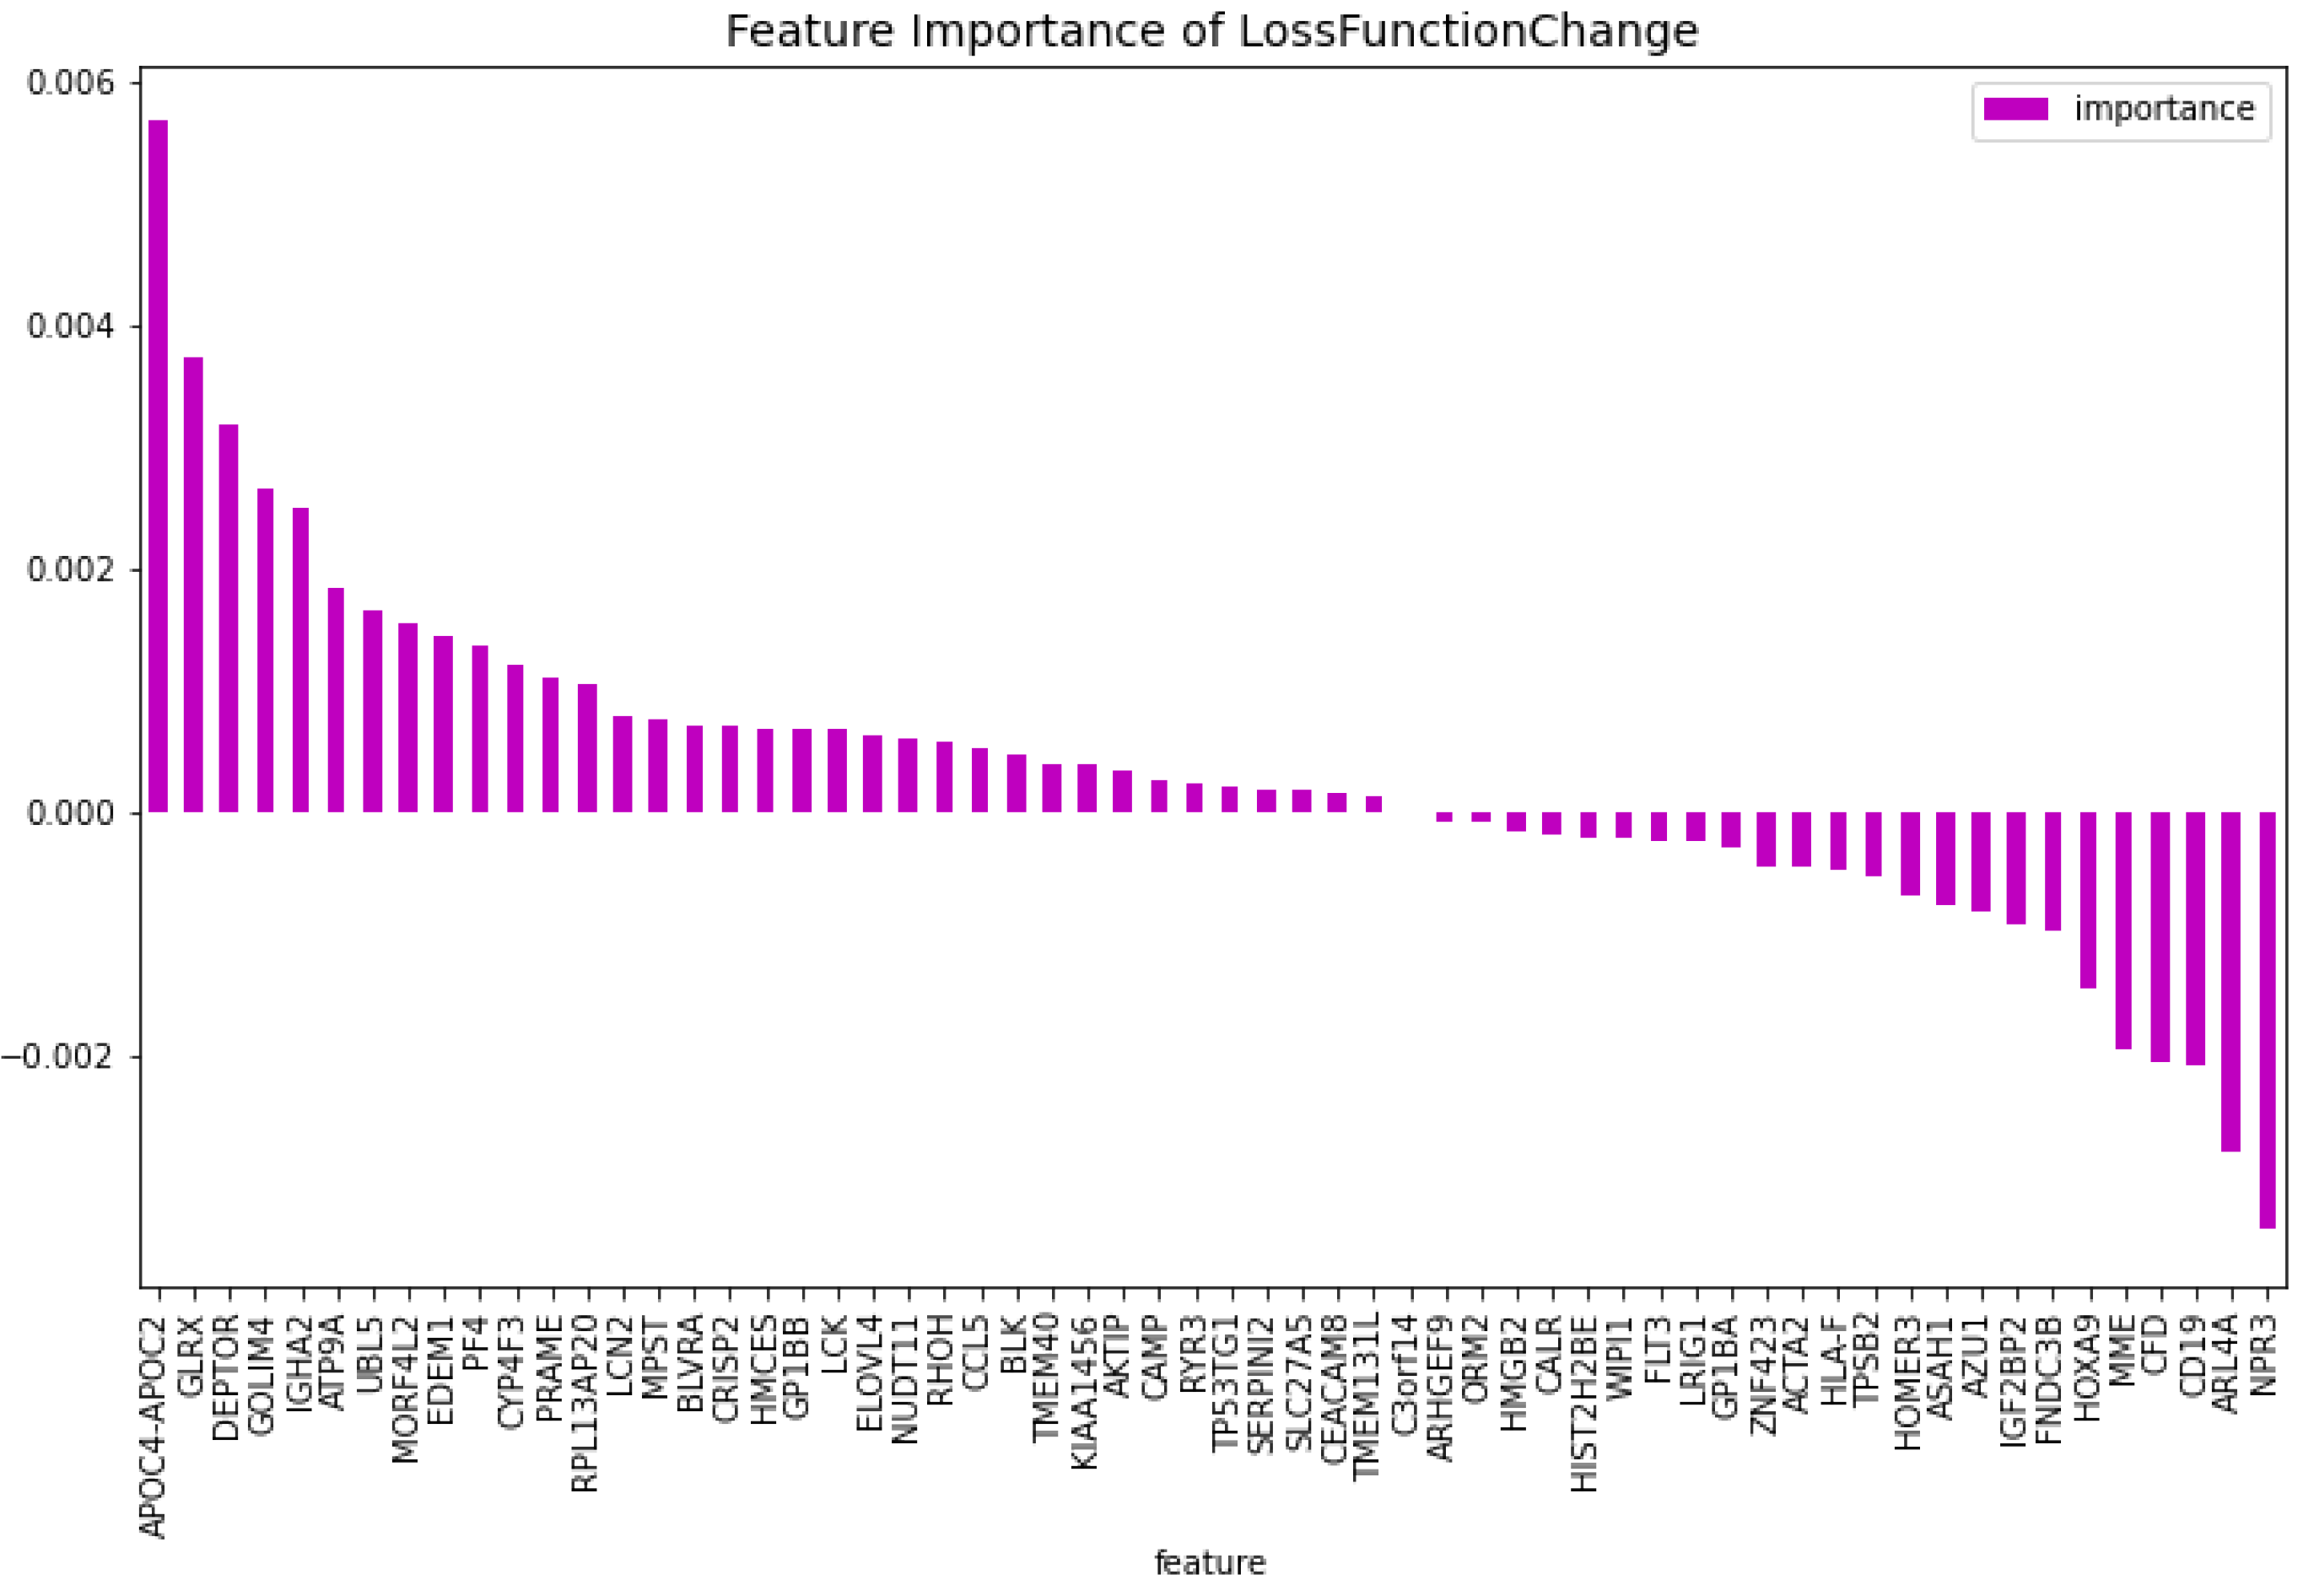
Figure 15.
The 100 most important features of the CatBoost60 regarding the predictability of the model.
Figure 15.
The 100 most important features of the CatBoost60 regarding the predictability of the model.
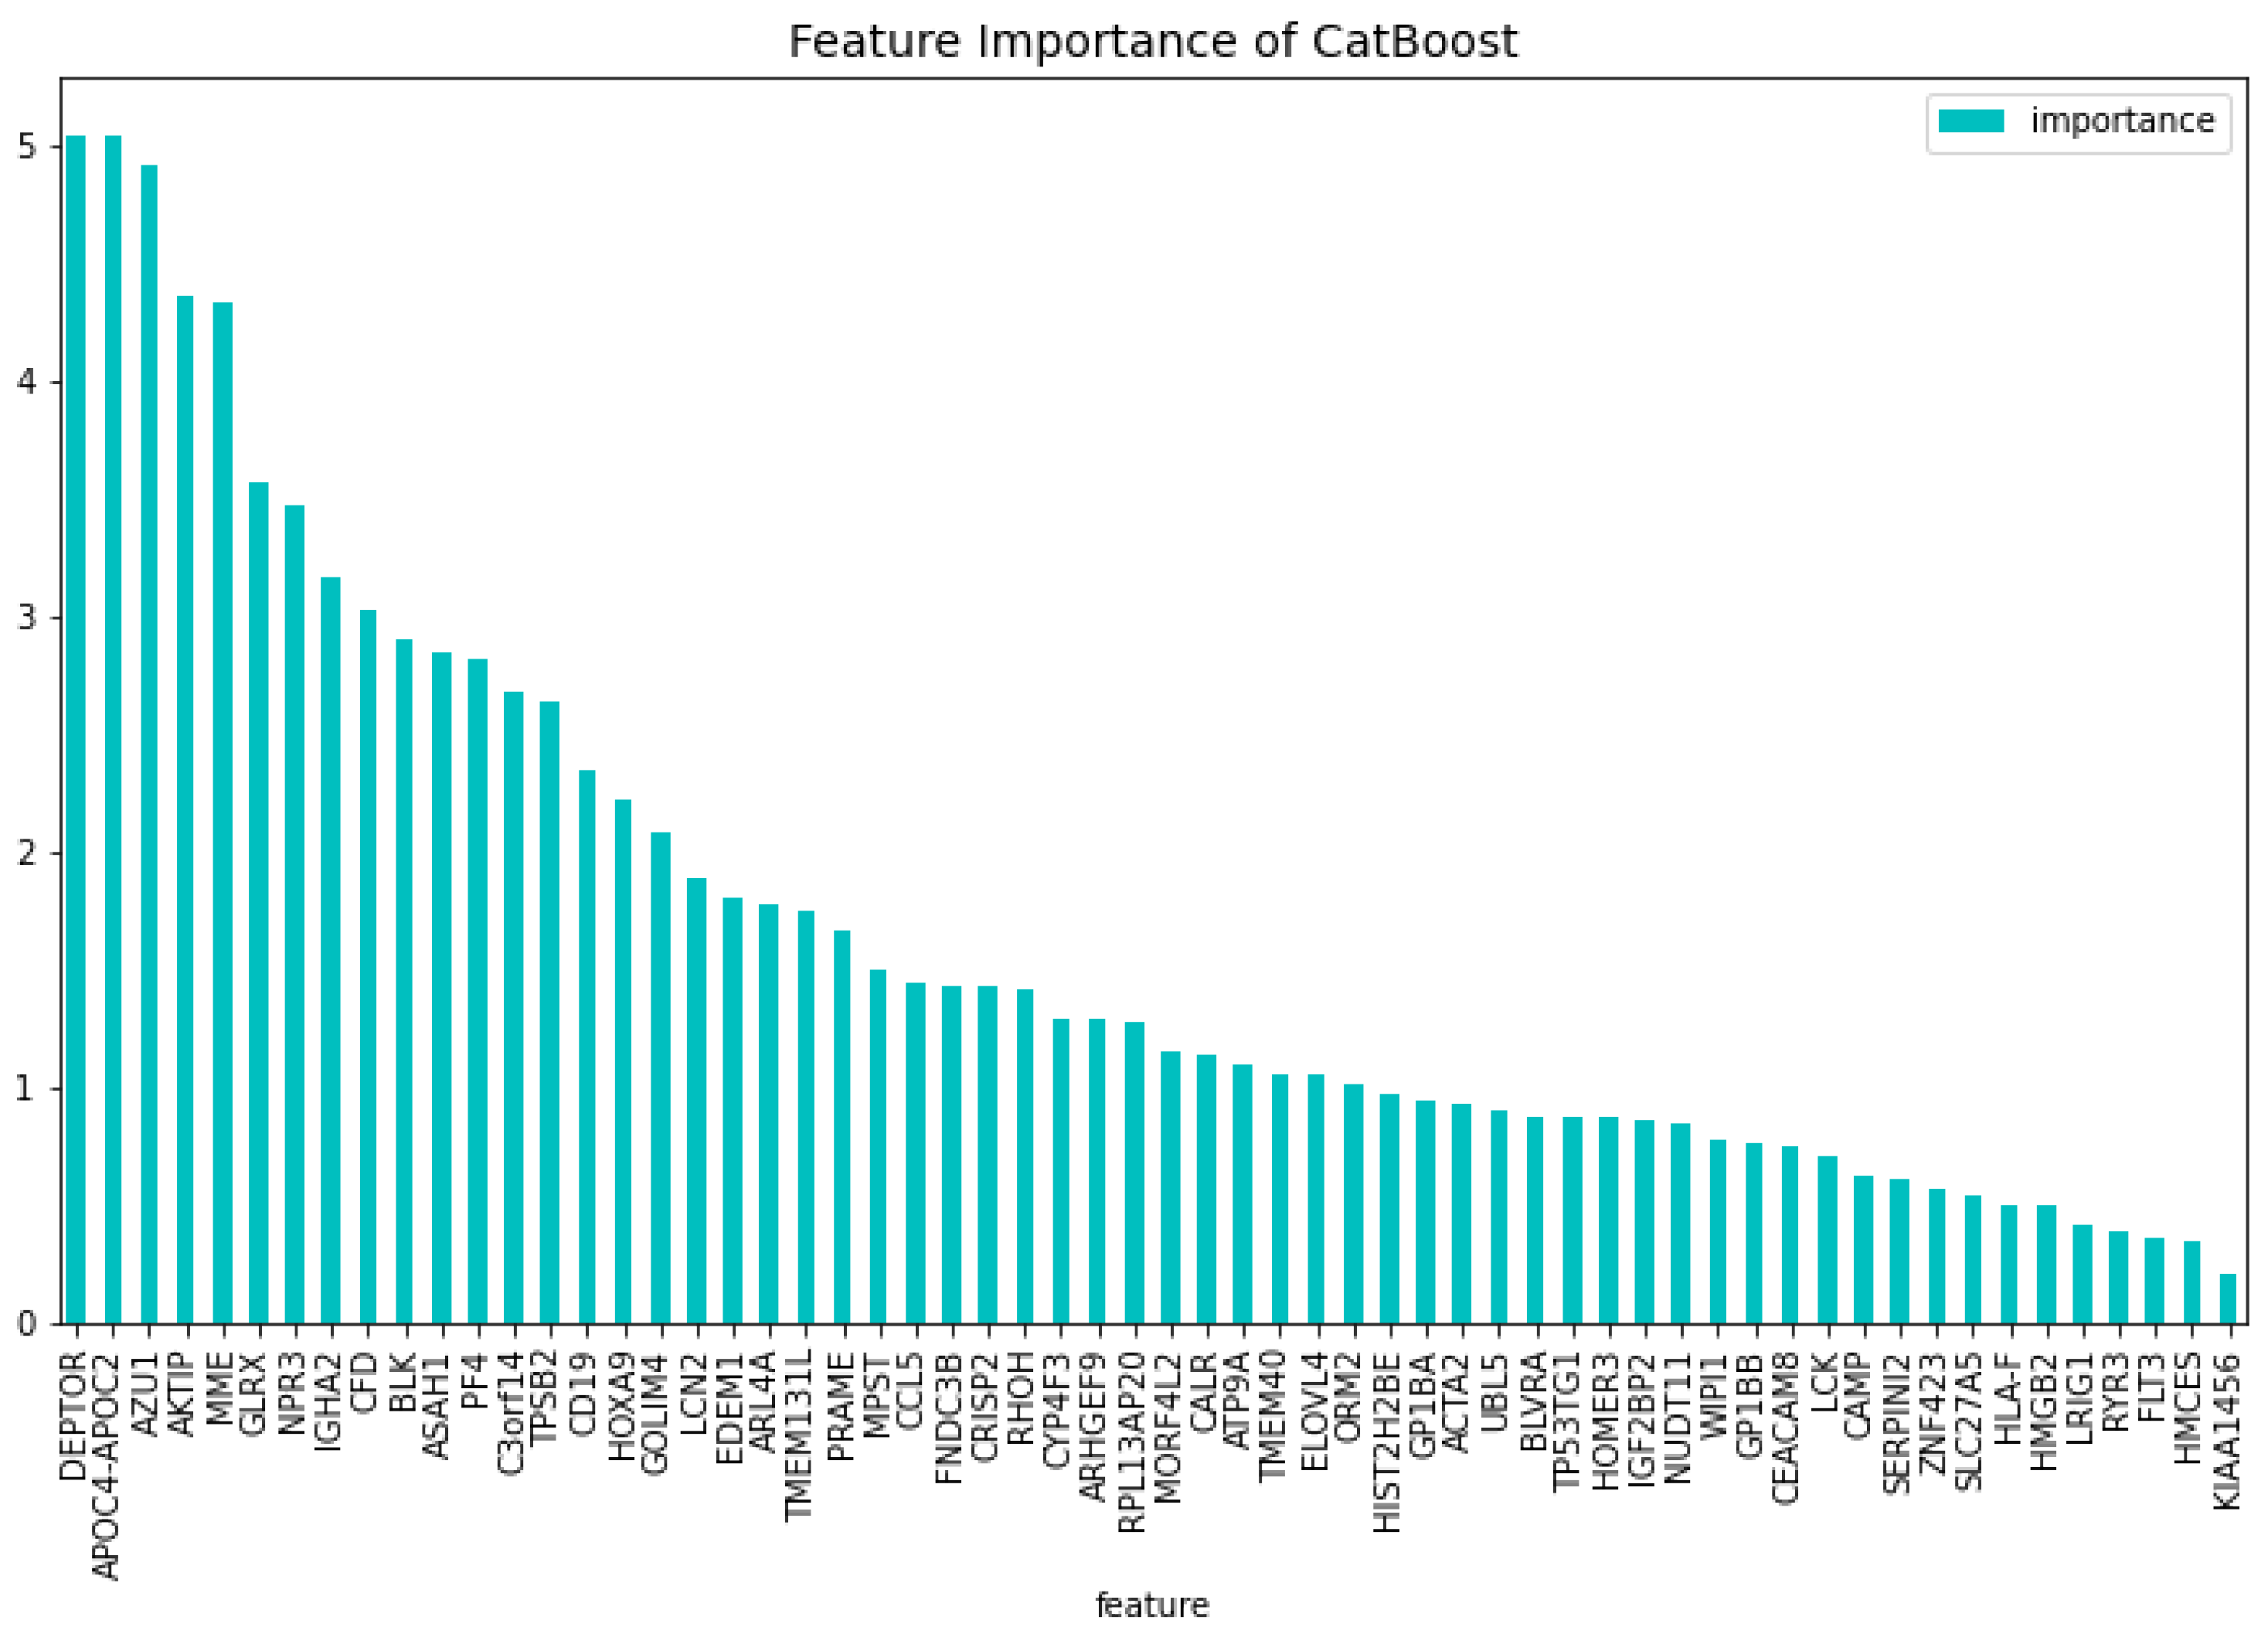

Table 1.
Performance of the dimensionality reduction CatBoost model for the AML vs. Healthy problem on ten fold cross validation and on the test set using 12708 genes.
Table 1.
Performance of the dimensionality reduction CatBoost model for the AML vs. Healthy problem on ten fold cross validation and on the test set using 12708 genes.
| Metrics | 10CV | Test |
| Specificity | 0.9796 | 0.9837 |
| Sensitivity | 0.9973 | 1.000 |
| AUC | 0.9915 | 0.9982 |
| F1-score | 0.9964 | 0.9982 |
Table 2.
Performance of the CatBoost72 model for the AML vs. Healthy problem on ten fold cross validation and on the test set on the set using 72 genes.
Table 2.
Performance of the CatBoost72 model for the AML vs. Healthy problem on ten fold cross validation and on the test set on the set using 72 genes.
| Metrics | 10CV | Test |
| Specificity | 0.9877 | 0.9891 |
| Sensitivity | 0.9994 | 1.000 |
| AUC | 0.9973 | 0.9988 |
| F1-score | 0.9983 | 0.9988 |
Table 3.
Performance of the CatBoost63 model for the AML vs. Healthy problem on ten fold cross validation and on the test set on the set using 63 genes.
Table 3.
Performance of the CatBoost63 model for the AML vs. Healthy problem on ten fold cross validation and on the test set on the set using 63 genes.
| Metrics | 10CV | Test |
| Specificity | 0.9836 | 0.9730 |
| Sensitivity | 0.9982 | 0.9988 |
| AUC | 0.9941 | 0.9942 |
| F1-score | 0.9973 | 0.9964 |
Table 4.
Performance of the CatBoost19 model for the AML vs. Healthy problem on ten fold cross validation and on the test set on the set using 19 genes.
Table 4.
Performance of the CatBoost19 model for the AML vs. Healthy problem on ten fold cross validation and on the test set on the set using 19 genes.
| Metrics | 10CV | Test |
| Specificity | 1.0000 | 0.9943 |
| Sensitivity | 0.9892 | 0.9940 |
| AUC | 0.9946 | 0.9941 |
| F1-score | 0.9945 | 0.9964 |
Table 5.
Performance of the CatBoost15 model for the AML vs. Healthy problem on ten fold cross validation and on the test set on the set using 15 genes.
Table 5.
Performance of the CatBoost15 model for the AML vs. Healthy problem on ten fold cross validation and on the test set on the set using 15 genes.
| Metrics | 10CV | Test |
| Specificity | 1.0000 | 0.9857 |
| Sensitivity | 0.9843 | 0.9943 |
| AUC | 0.9922 | 0.9900 |
| F1-score | 0.9921 | 0.9956 |
Table 6.
Performance of the CatBoost [13] dimensionality reduction model for the AML vs. Healthy & Other Diseases binary classification problem on ten fold cross validation and on the test set on the set using 12708 genes.
Table 6.
Performance of the CatBoost [13] dimensionality reduction model for the AML vs. Healthy & Other Diseases binary classification problem on ten fold cross validation and on the test set on the set using 12708 genes.
| Metrics | 10CV | Test |
| Specificity | 0.9929 | 0.9890 |
| Sensitivity | 0.9545 | 0.9643 |
| AUC | 0.9810 | 0.9801 |
| F1-score | 0.9704 | 0.9717 |
Table 7.
Performance of the CatBoost60 model for the AML vs. Healthy & Other Diseases binary classification problem on ten fold cross validation and on the test set on the set using 60 genes.
Table 7.
Performance of the CatBoost60 model for the AML vs. Healthy & Other Diseases binary classification problem on ten fold cross validation and on the test set on the set using 60 genes.
| Metrics | 10CV | Test |
| Specificity | 0.993 | 0.9887 |
| Sensitivity | 0.9727 | 0.9742 |
| AUC | 0.9861 | 0.9825 |
| F1-score | 0.9797 | 0.9764 |
Table 8.
The 57 resulting genes from using the CatBoost dimensionality reduction model and intersection the top 100 features importance of this model regarding the loss function change and model predictability with the 15 genes found from previous work [1] added, and their relation to blood malignancies in literature.
| Gene Symbol/NCBI Accesion Number | Blood Malignancies |
| GATA3 | acute lymphoblastic leukemia (ALL)[21] |
| DSG2 | - |
| SLC46A3 | - |
| SH2D3A | - |
| CEACAM3 | - |
| MAL | - |
| LMAN1 | - |
| PATL2 | - |
| TRIM45 | - |
| RPL10 | RPL10 T-cell acute lymphoblastic leukemia (T-ALL) [22,23] |
| PATJ | - |
| FNDC3A | FNDC3A multiple myeloma [24] |
| SERPINI2 | chronic lymphocytic leukemia (CLL) [25] |
| ADAMTS2 | mixed phenotype acute leukemias (MPAL) [26] |
| CHRNA3 | T-cell acute lymphoblastic leukemia (T-ALL) [27] |
| ASAH1 | - |
| CCNA1 | AML [28] |
| ALDH1A1 | - |
| NUDT11 | - |
| HBBP1 | - |
| ENTPD1 | AML [29], CLL [30], adult T-cell leukaemia/lymphoma (ATLL) [31] |
| IGF1R | AML [32], ALL [33] |
| IFI27 | - |
| PRAME | PRAME AML [34], CML [35], ALL [36] |
| CXorf57 | - |
| VPREB3 | - |
| AOAH | - |
| HOXB6 ! | AML [37] |
| AML52 | ALL [38] |
| DAB1 | T-ALL [39] |
| GPKOW | - |
| FLT3 ! | AML, ALL, CML [40] |
| AVP | - |
| NXF3 | - |
| CES1P1 | - |
Table 8.
The 57 resulting genes from using the CatBoost dimensionality reduction model and intersection the top 100 features importances of this model regarding the loss function change and model predictability with the 15 genes found from previous work [1] added, and their relation to blood malignancies in literature. (continued)
| Gene Symbol/NCBI Accesion Number | Blood Malignancies |
| RLN2 | - |
| NDUFB7 | - |
| HHEX | T-ALL, AML [41] |
| TCL1A | CLL, T-prolymphocytic leukaemia [42] |
| C3orf14 | - |
| PF4 | - |
| S1PR4 | - |
| WT1 | AML, ALL, CML [43] |
| CTDSPL | aml [44] |
| EGLN2 | - |
| CHRM3 | - |
| TRBV21-1 | - |
| CCL5 | - |
| TUBB1 | - |
| CRISP3 | - |
| CXCL5 | - |
| TRAV21 | - |
| CDC14B | - |
| PCDH9 | - |
| PCDH9 | - |
| ISG20 | - |
| NUP214 ! | AML, ALL [45], T-ALL [46] |
| SERPINA1 | - |
| ANAPC15 | - |
| SYNE1 | ALL [47] |
| SPX | - |
| LCN2 | - |
| AKTIP | - |
| BACH2 | - |
| TIAM1 | - |
| PECR | - |
| APOC4-APOC2 | - |
| GP1BB | - |
| TPD52 | AML [48] |
| TBC1D9B | - |
| MAPK12 | - |
| MYBL2 | - |
Disclaimer/Publisher’s Note: The statements, opinions and data contained in all publications are solely those of the individual author(s) and contributor(s) and not of MDPI and/or the editor(s). MDPI and/or the editor(s) disclaim responsibility for any injury to people or property resulting from any ideas, methods, instructions or products referred to in the content. |
© 2024 by the authors. Licensee MDPI, Basel, Switzerland. This article is an open access article distributed under the terms and conditions of the Creative Commons Attribution (CC BY) license (http://creativecommons.org/licenses/by/4.0/).
Copyright: This open access article is published under a Creative Commons CC BY 4.0 license, which permit the free download, distribution, and reuse, provided that the author and preprint are cited in any reuse.


