Submitted:
08 February 2024
Posted:
12 February 2024
You are already at the latest version
Abstract
Intrinsically Disordered Proteins (IDPs) play crucial roles in signal transduction, cell differentiation, and transcriptional regulation. Many disrupted genes associated with mental disorders are identified as IDPs, and emerging evidence suggests the functional role of IDPs in neuropsychiatric disorders. However, few studies comprehensively explore the functional association between protein disorder properties and different mental diseases. To address this gap, we collected disrupted gene sets for seven mental diseases (MDD, SCZ, BP, ID, AD, ADHD, ASD) and a control gene set from normal brains using DisGeNET and GeneCards databases. The state-of-the-art predictor IUPred2A was then utilized to calculate the disorder properties , followed by a thorough comparison between the disordered proteins in mental diseases and healthy controls. Functional enrichment analysis and protein-protein interaction networks were conducted to investigate the IDPs’ functional roles in psychiatric diseases. Additionally, we demonstrated the role of IDPs in protein binding formations through a case study of alpha-synuclein using protein docking.
Our findings reveal that differentially expressed proteins in mental disorders, especially in ASD and ADHD, exhibit more IDPs than those in healthy controls. IDPs in psychiatric disorders are significantly enriched in neurodevelopmental pathways and play an important role in in gene expression regulation. Our results indicate distinct functional patterns of disorder proteins among mental diseases and healthy controls. When comparing the IDPs between ASD and ADHD, we observed that IDPs in ADHD are more likely linked to the synaptic signaling and regulation, while IDPs in ASD are more tendentiously related to diverse and complex biological processes. Our work offers valuable insights into the important functions of IDPs in psychiatric disorders, enhancing our understanding of the molecular mechanisms involved in psychiatric disorders.
Keywords:
mental disorder
; intrinsically disordered protein
; neural signaling
; Neurological development
1. Introduction
Mental disorders are common diseases that affect the mental health of more than 22.1% of the world’s population [1]. Due to the complexity of pathogenesis and unknown etiological factors, there are rarely effective therapies for mental diseases. Although genetic variation assessment, such as Genome-Wide Association Studies (GWAS), has found numerous genes associated with mental disorders, the underlying molecular mechanisms are still not fully understood [2,3,4].
In recent years, significant strides have been made in exploring the functional properties of intrinsically disordered proteins (IDPs) and unraveling their crucial role in mental disorders [4,5,6].
Intrinsically disordered regions (IDRs) are the protein regions of biologically active and highly conformationally variable, but lacking stable three-dimensional structures [7,8,9]. IDPs, which can contain IDRs of varying lengths of IDRs or being completely disordered, are involved in a number of biological regulation activities, such as signaling pathways, transcription, translation, and cell cycle [10,11,12,13,14]. The precise regulation of affluent IDPs in cells ensures the accuracy of signaling pathways. Mutations or changes in abundant IDPs could lead to multiple diseases [15,16,17].
IDPs play a crucial role in brain development. For example, ZSWIM8, a ubiquitin ligase, catalyzes the development of the embryonic nervous system [18]. Its function is characterized by an abundance of IDRs. These IDRs recognize the IDRs in the Dab1 protein, correcting its misfold through the ‘disorder targets misorder’ mechanism [19]. ZSWIM8 facilitates proper phosphorylation of Dab1 to maintain the regulatory role in the Reelin signaling pathway which is a key pathway in several mental disorders, including Autism Spectrum Disorders(ASD), Schizophrenia(SCZ), Bipolar Disorder(BP), Major Depression Disorders(MDD), and Alzheimer’s disease [18,20].
Mutations in IDPs have been found to be the main causes of protein aggregation in the brain, which are associated with the plaques development and brain deposits in patients with neurodegenerative disorders. Well-known IDPs, such as alpha-synuclein, amyloid beta peptide, and also Huntington’s protein , are linked to the development of disorders like Alzheimer’s diseases, Parkinson’s diseases, and Huntington’s diseases [21,22,23,24,25,26,27].
There are already some studies to reveal the functional importance of disorder properties by investigating a single or a couple of genes in mental diseases [4,28]. However, the comprehensive analysis of IDRs’ functional roles in the psychiatric disorders is rarely performed [29] . With improved experimental methods and increased psychiatric cases, there is an urgent demand to collect the current differential genetics data, conduct an in-depth disorder characteristics analysis, and summarize the essential consequences of the major psychiatric disorders.
For this purpose, we meticulously gathered all proteins associated with the seven psychiatric diseases (AD, Anxiety Disorder; ADHD, Attention Deficit Hyperactivity Disorder; ASD, Autism Spectrum Disorder; BP, Bipolar Disorder; MDD, Major Depressive Disorder; ID, Intellectual Disability; SCZ, Schizophrenia) through strict criteria guided process. The database was constructed by comprising differentially expressed proteins from 7 diseases datasets and 1 control dataset (BRAIN). Subsequently, the disorder properties of these proteins were characterized by the state-of-the-art disorder predictor IUPred2A.
We conducted a thorough statistical study of the prediction results to both the disease dataset and the control dataset, through focusing on the frequency of IDPs in each dataset. By utilizing the protein interaction networks, Gene Ontology (GO) and Kyoto Encyclopedia of Genes and Genomes (KEGG), we examined the crucial roles that IDPs play in psychiatric disorders and detected some significant enriched pathways and IDPs, and discussed their impact in psychiatric diseases.
We found that 50.53% proteins associated with mental disorders had IDRs (≥ 30 consecutive residues in length), whereas the percentage in normal human brain proteins was 47.17%(p-value≤0.05).
Further analysis found that ASD and ADHD datasets hold more IDPs than the normal BRAIN dataset. Additionally, ASD and ADHD datasets exhibited more IDPs than BP, MDD, and SCZ datasets (Bonferroni p−value ≤ 0.05). IDPs associated with psychiatric disorders are significantly enriched in pathways related to neurodevelopment, and the known IDPs protein P53, occupies a pivotal position among the psychiatric disease-differentiating proteins, and interacts with a wide range of psychiatric disease-associated IDPs.
Our research aims to explore the neurobiological connections between IDPs and mental diseases, and provide new insights into the pathogenesis and treatment of psychiatric disorders.
2. Results&Discussion
2.1. Acquisition and characterization of differential genes in mental diseases
We created the MENTAL dataset, a disease database, and the BRAIN dataset, a control dataset, as outlined in "Methods". The disease dataset was further subdivided into seven subsets: 68 proteins related to anxiety disorders (AD dataset), 307 proteins related to attention deficit hyperactivity disorder (ADHD dataset), 143 proteins related to autism spectrum disorders (ASD dataset), 602 proteins related to bipolar disorder (BP dataset), 512 proteins related to major depression (MDD dataset), 812 proteins related to intellectual developmental disorders (ID dataset), and 939 proteins related to schizophrenia (SCZ dataset).The list of genes is shown in Supplementary Table S1. Figure 2A illustrates the gene relationships among the seven diseases datasets.
After obtaining differentially expressed genes and control genes for mental disease, we functionally enriched them and examined the distinct functions of the differentially expressed proteins associated with mental disorders using the MENTAL dataset. We observed significant enrichment of proteins associated with psychiatric disease in processes related to behavior (GO:0007610), head development (GO:0060322), neural projection development (GO:0031175), trans-synaptic signaling regulation (GO:0099177), and brain development (GO:0007420), These processes are closely linked to nervous system formation and function, as well as intraneuronal communication and neurotransmitter release. There is evidence linking early neurodevelopment, synaptic density, and neurotransmitter homeostasis to a variety of psychiatric disorders. For example, several brain imaging studies of schizophrenic patients have shown that early brain development is different in schizophrenia [30,31,32].
Furthermore, genes differentially expressed in mental diseases are strongly related to transcription, signal transduction, protein-protein interactions, and gene regulatory mechanisms. The encoded proteins are crucial parts of dendritic, axonal, post-synaptic, and pre-synaptic synapses.
The KEGG pathway enrichment analysis revealed significant enrichment of genes associated with mental diseases in several pathways, including the cancer pathway (hsa05200), the neurodegeneration pathway (hsa05022), the neuroactive ligand pathway (hsa04080), the MAPK signaling pathway (hsa04010), and the Alzheimer's disease pathway (hsa05010). Figure 1B and Figure 1C show the detailed results of functional enrichment.
We used the STRING plug-in for Cytoscape software to construct a protein interaction network for the MENTAL dataset in order to obtain the potential hub proteins and their interactions. The key hub proteins including AKT1, TP53, and ACTB were identified by the degree algorithm in the cytoHubba plug-in for Cytoscape software.
Previous studies have demonstrated that AKT1, TP53, and ACTB are strongly associated with the development of psychiatric disorders. It has been suggested that TP53 plays a crucial role in neuronal injury and death, despite the fact that it has been implicated in cancer [33]. Furthermore, the AKT1 is a member of the AKT1-GSK3beta signaling pathway, which is a target of lithium, as a result, it is implicated in the pathophysiology of schizophrenia [34,35].
Although limited evidence linking ACTB to psychiatric disorders, Actin Beta, encoded by ACTB, has been found playing a significant role in presynaptic vesicle release, as well as in endocytosis and vesicle recirculation processes, all of which are essential for intra-neuronal signaling. As regards the fundamental function of 180 the Actin Beta, it is not surprising that ACTB plays a significant role in mental health [27,36,37]. Figure 1D depicts comprehensive data on the protein interaction network associated with mental disorders.
2.2. Comparison of Protein Intrinsic Disorder Properties Between MENTAL Diseases and Controls
We predicted protein disorder for the seven psychiatric diseases in the MENTAL dataset and the BRAIN dataset, and determined the percentage of IDPs in each dataset. The proportion of IDPs in each dataset is as follows: ASD (66.43%), ADHD (59.93%)> ID (51.60%) > BP (50.83%) > MENTAL (50.57%) > SCZ (50.48%) >BRAIN (47.17%) > MDD (47.07%) > AD (44.12%).
We observed that the percentage of IDPs in the MENTAL dataset is greater than that in the BRAIN dataset. The result indicates that only 47.17% of the proteins in the BRAIN dataset are classified as IDPs, while the number in the MENTAL dataset is 50.57%. This is a significant difference in the percentage of IDPs between the two datasets (P ≤ 0.05). (Table 2, Figure 2B).
Then, in order to gain a better understanding of the relationship between psychiatric disorders and IDPs, we compared the content differences between the seven psychiatric datasets (AD, ADHD, ASD, BP, ID, MDD, and SCZ) and the BRAIN dataset. We discovered that, in comparison to the BRAIN dataset, the percentage of IDPs in the ASD and ADHD datasets was significantly higher (Bonferroni p−value ≤ 0.05) than that in other datasets (Table 2, Figure 2B).
Lastly, we separately compared the differences between the ASD dataset and the other six psychiatric datasets, as well as the differences between ADHD dataset and the remaining six psychiatric datasets. We discovered that the percentage of IDPs in the ASD dataset was significantly higher than that in the MDD, BP, SCZ dataset (Bonferroni p−value ≤ 0.05). Additionally, the percentage of IDPs in the ADHD dataset was significantly higher than that in the MDD dataset (Bonferroni p−value ≤ 0.05). Furthermore, we discovered that while the percentage of IDPs in the BP dataset was similar to that of the BRAIN dataset and other psychiatric datasets, the IDPs in the BP dataset had longer IDRs, shown in Figure 2D. Table 2 provides the detailed information. Furthermore, Table 1 presents details on the top 15 proteins in the MENTAL dataset with the highest percentage of protein disorder.
After identifying the varying proportions of IDPs between mental diseases and healthy controls, we delved deeper into exploring potential functional pathways associated with IDPs in psychiatric diseases. To facilitate this investigation, we categorized the proteins into two groups: namely 'LOW' and 'HIGH', based on the length of the disordered regions. Subsequently, we conducted a series of analyses, including functional enrichment and protein-protein interaction assessments.
2.3. Binding Sites Prediction in MENTAL Diseases and Controls
We employed ANCHOR to predict disordered binding sites within the protein sequences of each dataset. Given the crucial role of IDPs in molecular functions through protein interactions. disordered binding sites were identified based on a threshold ANCHOR SCORE of 0.5.
To reduce the impact of variations in protein sequence length across datasets on the comparison of disordered binding sites, only the proteins of at least one disordered binding site are selected into the comparison task. Our findings reveal that the ASD and ADHD datasets contained more proteins with disordered binding sites than the BRAIN dataset does (Bonferroni p−value ≤ 0.05), and furthermore, the ASD and ADHD datasets surpass the MDD dataset in the number of proteins with disordered binding sites (Bonferroni p−value ≤ 0.05).
The result indicates that the proteins in the ASD and ADHD datasets are more likely to bind and, interact with other proteins than those in the BRAIN and MDD datasets. This tendency is also associated with the higher prevalence of IDPs in the ASD and ADHD datasets. Supplementary Table S2 and Figure 2C provide a comprehensive summary by regarding the disordered binding sites for each dataset.

Table 2.
Comparison of disorder properties in different mental diseases.
| Protein length | Intrinsic disorder estimates | ||||||
|---|---|---|---|---|---|---|---|
| Name | N | Mean | SE | Maximum | Median | Overall disordered | Proteins with long regions of |
| amino acids (%) | disorder (%) | ||||||
| BRAIN | 2188 | 575.8 | 10.9 | 4870 | 441 | 25.25% | 47.17% |
| AD | 68 | 695.8 | 72.8 | 2768 | 479.5e | 29.59%e | 44.12% |
| ADHD | 307 | 995.1 | 54.3 | 8797 | 710.0e | 28.28%e | 59.93%e |
| ASD | 143 | 1033 | 68.3 | 4967 | 708.0e | 29.22%e | 66.43%e |
| BP | 602 | 753.1 | 29.2 | 8797 | 560.5e | 24.98%e | 50.83% |
| MDD | 512 | 687.8 | 28.6 | 6306 | 485.5e | 23.07%e | 47.07% |
| ID | 812 | 921.1 | 30.2 | 8797 | 634.5e | 26.21%e | 51.60% |
| SCZ | 939 | 754.2 | 23.2 | 8797 | 541.0e | 26.02%e | 50.48% |
| P-valuea | P<0.001c | P<0.001d | P<0.001d | ||||
| MENTAL | 2189 | 791.9 | 15.6 | 8797 | 559.0e | 25.67%e | 50.57%e |
| P-valueb | P<0.001c | P<0.001d | P<0.001d | ||||
BRAIN, Randomly selected controls from brain expression protein data after exclusion of MENTAL data;AD,Anxiety Disorder;ADHD,Attention Deficit Hyperactivity Disorder;ASD,Autism Spectrum Disorder;BP,Bipolar Disorder;MDD,Major Depressive Disorder;ID,Intellectual Disability;SCZ,Schizophrenia;MENTAL,All relevant proteins in selected psychiatric disorders. aP-value for disease-specific comparison with BRAIN dataset; bP-value of MENTAL compared to BRAIN dataset; cKruskal–Wallis Test. dchi-square test; eValues different from BRAIN dataset.
2.4. Comparison of Enrichment Analysis between Low Disorder and the High Disorder proteins
We conducted GO and KEGG functional enrichment analyses on the Low Disorder dataset and the High Disorder dataset, respectively. We identified and listed the top 5 items for BP, MF, CC in GO, as well as the top 10 pathways in KEGG. This analysis serves to further validate the pivotal role of disordered proteins in psychiatric disorders and explore the key functions they played in these conditions.
2.4.1. Gene Ontology Functional Analysis
The two protein categories distinctly differ in terms of molecular function; Low Disorder proteins are implicated in molecular transmembrane transport, protein-protein interactions, and oxidoreductase activity. In contrast, High-disorder proteins exhibit a strong preference for intermolecular interactions, particularly those involving proteins and DNA. The majority of these interactions are related to signaling, gene expression, and transcriptional regulation.
In biological processes, Low Disorder proteins are primarily involved in behavioral processes, synaptic signaling, regulatory processes, and cellular responses. Correspondently, High Disorder proteins are also involved in the regulation of synaptic signaling processes, but their primary functions lie in nervous system development and cellular morphogenesis. The GO enrichment results reveal that, although High Disorder proteins and Low Disorder proteins are implicated in distinct biological processes, there is also some overlap between them, indicating that these two proteins categories are not entirely function independently.
Furthermore, both Low Disorder and High Disorder proteins play vital role in synapses, for the reason that their shared genetic origin as proteins are associated with mental disorders. This reinforces the importance of synapses in the pathogenesis of psychiatric disorders.
We also performed GO enrichment analysis of IDPs in the ASD and ADHD datasets, considering the significant differences in IDPs content between ASD and ADHD compared to the BRAIN dataset. The results highlighted distinctions in the molecular functions and biological processes associated with IDPs in these two diseases.
Specifically, the molecular functions performed by IDPs in ASD involve the binding of chromatin DNA transcription factors RNA, etc., while those in ADHD are associated with both ion transmembrane transport and chromatin binding. In terms of biological process enrichment, IDPs from the ASD dataset are linked to a diverse range of biological processes, including learning and memory, chemical synaptic modulation, behavior, head development, and cognition. Conversely, IDPs from the ADHD dataset are related to processes such as membrane potential regulation, ionic transmembrane transport regulation, and synaptic signaling.
Both the molecular functions and biological processes enriched for IDPs in ADHD underscore their essential role in synaptic signaling and regulate. The comprehensive findings of the GO analysis are presented in Figure 3.
2.4.2. KEGG pathway enrichment analysis
The KEGG enrichment results for Low Disorder and High Disorder proteins exhibited no significant differences; both were enriched in several of the same pathways, including neurodegenerative diseases, cancer, neuroactive ligand-receptor interactions, and the PI3K-Akt, MAPK, and cAMP signaling pathways. Interestingly, all of these pathways were also represented in the KEGG enrichment of the MENTAL dataset.
This suggests that the similarities between the KEGG enrichment values for low and high disordered protein KEGG enrichment values can be attributed to their common origin from the mental disorder Differential Gene Dataset. The top 10 pathways enriched by KEGG for the Low Disorder and High Disorder datasets are illustrated in Figure 4C and Figure 4D.
2.5. Comparison of PPI Network between Low Disorder and the High Disorder proteins
Protein interaction networks were constructed for proteins in the Low Disorder and High Disorder datasets to gain a better understanding of the role of IDPs in psychological diseases and to identify key IDPs crucial in these diseases. The final PPI network appeared as following:
The Low Disorder Protein Interaction Network consists of 619 nodes and 1455 edges, where each node represents a protein. Edges between nodes indicate the existence of known or predicted interactions between two proteins. Using a degree algorithm, we filtered out the top 50 nodes and reconstructed the interaction network of these nodes. In this reconstructed network, there are 50 nodes and 970 edges, with an average of 19.4 edges per node connected to other nodes. According to the degree algorithm, the top three proteins in the low disorder protein network are ACTB, AKT1 and KRAS.
Similarly, the High Disorder protein interaction network includes 605 nodes and 1707 edges. By means of a degree algorithm, we filtered out the top 50 nodes and reconstructed the interaction network of these nodes. In this reconstructed network, there are 50 nodes and 1426 edges, and on average each node has 28.5 edges connected to other nodes. According to the degree algorithm, the top three proteins in the highly disordered protein interaction network are TP53, CREB1, and CREBBP
KRAS is identified as one of the top proteins in the Low Disorder. Proteins expressed by the KRAS play a crucial role in mediating the regulation of the RAS/MAPK pathway , impacting neuronal cell growth, proliferation, and differentiation, as well as influencing the development of the central nervous system [38,39].
One of the top proteins identified in the High Disorder dataset is TP53, which codes for the P53 protein, a known IDPs. The P53 protein features a tetramerization and regulatory function-rich intrinsically disordered structural domain at its C-terminus, along with an intrinsically disordered transcriptional activation structural domain at its N-terminus [40,41]. The presence of these disordered regions is crucial for the multifunctionality of the P53 protein, known to interact with nearly 1,000 partners.
The C-terminal structural domain of the P53 protein binding to GSK3, an interaction with implications, as the association of GSK3 with schizophrenia has been demonstrated [42].
Among the top proteins identified in the High Disorder dataset are CREB1 and CREBBP, encoding proteins known to have regions that are intrinsically disordered. CAMP Response Element Binding 1 (CREB1), encodes a CREB transcription factor. In the eukaryotic transcriptional regulatory network, the CREB binding protein (CBP) is a central node and is encoded by the CREBBP. CBP interacts with over 400 transcription factors and other regulatory proteins. Remarkably, more than 1,400 amino acids (almost 60% of the sequences) are predicted to be intrinsically disordered, in addition to seven known folded structural domains.
The phosphorylated kinase inducible activation domain (pKID) of CREB binds to the KIX structural domain of CBP, folds into two α-helices, called αA and αB, effectively triggering gene expression [43,44]. A meta-analysis comparing the expression levels of CREB1, CREBBP, and EP300 in autopsy Brodmann Area 10(BA10) samples from patients with schizophrenia to healthy controls revealed higher levels of CREB1 and CREBBP in samples of patient. Additionally, BA10 was found to be involved in cognitive deficits associated with schizophrenia, suggesting that CREB1 and CREBBP are implicated in the cognitive symptoms of diseases[4]. Furthermore, downregulation of the CREB1 gene is linked to MDD, SCZ, and BP, according to the current study [28].
All these results collectively suggest the crucial role of disordered proteins in the development of mental disorders. The concept of structural protein-based mechanisms underpinning mental diseases can be significantly enriched through research on disordered proteins. Figure 4A and Figure 4B depict the protein interaction networks for the datasets with Low Disorder and High Disorder.
2.6. A case study of IDP alpha-synuclein
Here, we selected IDP alpha-synuclein, whose abnormal deposition in the brain has been strongly associated with Parkinson's disease [45,46] for protein interaction analysis. Recent studies have shown that the SNCA gene encoding alpha-synuclein protein is upregulated in the peripheral blood of patients with MD [47]. Despite the importance of alpha-synuclein in neuropsychiatric disorders, most of the previous studies have dealt with only a small portion of the alpha-synuclein protein. In this study, we selected a randomized Molecular Dynamics conformation containing the entire α-synuclein sequence, and its binding partner tubulin (PDB:7S7J), a structural protein that also plays an important role in depression for protein interaction. Our docking results show the interactions between α-synuclein and tubulin. It has been studied that the functional conformation of tubulin is formed through the binding with α-synuclein [48]. Also, the docking results suggest that the roles of disordered and structural proteins in psychiatric disorders are not completely independent of each other. These proteins may function through specific binding. This is consistent with our functional enrichment results. By exploring the interactions between these two proteins, we hope to provide some insights for further studies on the mode of disordered proteins in protein interactions, especially the role of disordered proteins in protein interaction networks related to mental diseases. The Molecular docking results are shown in Figure 5.
3. DISCUSSION
Despite significant research efforts over the past few decades aimed at revealing the pathophysiology of mental diseases [3,49,50,51,52], the precise molecular mechanisms underlying psychiatric disorders remain an unresolved mystery. Previous research suggests that alterations in the disordered properties of proteins are likely associated with the onset and progression of mental disorders.
This paper delves into the distinctions in protein disorders from a proteomic viewpoint by analyzing the disordered properties of proteins that differ across seven mental diseases. Furthermore, it includes a discussion on the molecular pathways and mechanisms that underlie proteins that display varying levels of disorder in these seven psychiatric diseases.
Our study results reveal a robust correlation between IDPs and psychiatric disorders, particularly in proteins associated with ASD and ADHD, where IDPs are more prevalent. Studies suggest that ASD and ADHD share certain common neurological conditions [53,54], and their underlying neurobiological pathways exhibit remarkable similarities [55,56,57].
Our findings underscore the importance of IDPs in brain development [58] and highlight the significance of IDPs in cell signaling and regulation [10,13]. These discoveries align with and support previous research in the field. Although the proportion of IDPs in ASD equals to that in ADHD, the biological processes involving IDPs in these two diseases differ significantly. In ADHD, IDPs are predominantly enriched in synaptic signaling pathways, whereas in ASD, the processes involving IDPs are more diverse and encompass pathways relevant to behavior, brain development, cognition, synaptic signal transduction, and learning and memory.
The variations in the biological processes involving IDPs in ASD and ADHD may be linked to their intricate pathogenic pathways and diverse clinical presentations. Further research on IDPs in mental diseases, particularly ASD and ADHD, has the potential to contribute to a molecular-level understanding of the pathogenic mechanisms of psychiatric disorders, providing a theoretical basis for distinguishing between different psychiatric disorders.
The entire sequence of PPR1B is predicted to be disordered in the most IDPs. PPR1B encodes for protein phosphatase 1 regulatory subunit 1B, a regulator of kinase or phosphatase associated with glutamate and dopamine receptor activation. As a target of dopamine, PPR1B is strongly implicated in the therapy of neurological and mental disorders [59,60,61,62]. Furthermore, we observed that majority of the IDPs are associated with pathways or structures involving chromatin, nuclear membrane, cytoskeleton, neurons, and other structures; This discovery aligns with the established role of IDPs in synaptic and neuronal processes. We also found that some of the proteins that we categorized as IDPs are proven targets for psychiatric drugs, a finding that may provide insights for further elucidation of the mechanism of action of psychiatric drugs as well as the discovery of new psychiatric drug targets. We show these drug targets categorized as IDPs in Supplementary Table S3.
We speculate that the overexpression of IDPs in psychiatric diseases may cause aberrant protein interactions, and disrupt the balance of signaling networks [63]. The occurrence of psychiatric diseases could in part, be attributed to an imbalanced signal transduction.
Furthermore, psychiatric disorders are associated with the initiation of protein aggregation driven by the IDPs overexpression. For instance, protein aggregation resulting from the increased release of synaptic nuclear proteins and Tau is implicated in neurodegenerative disorders such as Parkinson's disease and Alzheimer's disease [23,64]. Similarly, chronic psychiatric diseases have been linked to occurrences of protein aggregation. In the mouse brain, dysbindin, produced by the Schizophrenia susceptible gene DTNBP1, co-aggregates with DISC1 , causes deleterious effects on receptor neurons , specifically being pulling away from the initial aggregation site [65]. Recently, patients suffering from SCZ and MDD simultaneously were found to exhibit TRIOBP-1 aggregation [66].
Our study has certain limitations. Despite the abundance of gene-protein and disease-gene data being available in the databases like DisGeNE and GeneCards, it is still possible to miss newly identified genes linked to mental disorders. Furthermore, despite the utilization of highly reliable predictors, in vitro studies continue to be the gold standard for precisely assessing whether a protein structure affects mental disorders or not. Therefore, care should be taken to interpret our findings.
In summary, our study contributes to the exploration of the neurobiological mechanisms underlying psychiatric disorders, providing a novel perspective from the standpoint of protein disorders. We discuss the potential specific roles and mechanisms of IDPs in psychiatric disorders. Our next step could be to study the aggregate properties of IDRs in the psychiatric disease-related proteins, including radius of gyration, end-to-end distance, polymer scaling index, and aggregate a sphericity. We might also explore the impact of conformational changes of IDRs in mental disease-associated proteins on the function of full-length proteins and how conformational changes of IDRs in mental diseases are linked to cellular function, localization, amino acid sequences, evolutionary conservation, and disease variation, in conjunction with another newly released molecular model for generating IDR conformational assemblies [67,68].We hope that our research will advance a deeper understanding of the pathogenic mechanisms of psychiatric disorders, and offer new insights for future diagnosis and treatment.
4. MATERIALS AND METHODS
4.1. Datasets
To create a dataset related to mental disorders, we searched the DisGeNET [69] and GeneCards [70] databases by the following keywords: ‘anxiety disorder’, ‘attention deficit/hyperactivity disorder’, ‘autism spectrum disorder’, ‘bipolar disorder’, ‘intellectual disability’, ‘major depressive disorder’, and ‘schizophrenia’. The genes with at least one of the following conditions are considered: (i) gene-disease association score> 0.1 in the DisGeNET database; (ii) gene score > 1 in the GeneCards database; and (iii) genes included by both databases.
The above steps resulted in the selection of 2388 differential genes for mental disorders. Since the brain is primarily involved in the occurrence of psychiatric disorders, we concentrated on genes that are expressed in the brain. To ensure that the disease related genes screened are expressed in the brain, we applied the following criteria to the psychiatric differential gene dataset: (i). either Cerebellum, Cerebral Cortex, Hippocampus, or Lateral Ventricle tissue were collected from the Human Protein Atlas [71]; (ii) For the Allen Human Brain Atlas [72], genes of at least 75% expression rates in normalized microarray datasets from 6 donors' brain samples, and co-occurrence in more than half of the donors; (iii) Genes were considered to be brain-expressed for the RNA-Seq developmental transcriptome dataset from the BrainSpan Atlas of the Developing Human Brain [73] if they had an RPKM (reads per kilobase of transcript per million mapped reads) value > 1 in at least 75% of samples from at least one developmental stage. Differential genes for psychiatric disorders meeting any one of the above requirements are retained in the final dataset. Figure 6 illustrates the differential genes selection pipeline for psychiatric diseases.
Finally, we mapped the screened differential genes to the corresponding proteins via UniPro-tKB [74] to obtain a mentally differential protein dataset containing 2,189 non-redundant proteins, which we named the MENTAL dataset.
For comparison, we also established a control dataset named BRAIN using Brain-Specific Proteome data in the Human Protein Atlas (Uhlen et al., 2010). The BRAIN dataset contains genes only expressed in normal brains collected from the Human Protein Atlas. The criteria for curating the BRAIN dataset are as follows: (i) Genes of a minimal expression signal in the human brain; (ii) Genes of immunohistochemistry evidence of brain expression; (iii) Genes can be mapped to proteins by the UniProt database ;(iv) Genes not found in the MENTAL dataset.
In the Human Protein Atlas, the proteins in the dataset were categorized into three classes based on the relative expression levels: (i) Elevated in brain, (ii) Low tissue specificity but expressed in brain, and (iii) Elevated in other but expressed in brain.
After categorizing the proteins in the MENTAL dataset according to their expression levels, brain-normal proteins were chosen at random for each expression level in order to match the number of proteins in the MENTAL dataset. 2,188 non-redundant proteins were included in the BRAIN dataset.
Finally, we obtained 2,189 proteins in the disease MENTAL dataset and 2,188 proteins in the control BRAIN dataset.
4.2. Intrinsic Disorder Prediction
We used a state-of-the-art disorder prediction program IUPred2A [75] to predict the disorder properties in each dataset. IUPred2A is a combinatorial prediction model using support vector regression (SVR) algorithms by integrating information based on residue-residue interactions and specified lengths of secondary structure patterns. The online application of IUPred2A accepts UniProt identifiers or a protein sequence in FASTA format as input. The final result will be the disorderly tendency score for each residue in the sequence. Residues with scores above 0.5 are classified as disordered, while scores below 0.5 indicate ordered. In this study, protein regions with a continuous length ≥ 30 disordered residues are characterized as an IDR, and proteins with at least one IDR were classified as IDPs [29]. This allows us to conduct significant assessments of the propensity to disorder between different protein groupings. Based on the presence or absence of IDRs, we divided mental disease-related proteins into two categories: ’LOW Disorder’ and ’HIGH Disorder’, respectively.
4.3. Binding Sites Prediction
The ANCHOR software was used to identify the binding regions [76,77]. Most disordered proteins function by binding to structured partners through a disorder-to-order transition event. ANCHOR uses methods for pairwise energy estimation to predict disordered binding regions by finding fragments located in disordered regions interacting with globular protein partners to gain stabilizing energy. Every protein sequence in the seven disease datasets and the BRAIN dataset had predicted disordered binding sites; we compared the number of proteins with disordered binding sites between the seven disease datasets and the BRAIN dataset, then investigated the patterns of disordered binding sites in each dataset.
4.4. Protein-protein interaction (PPI) network construction
We constructed a network of protein-protein interactions (PPI) in using the UniProt ID as the input, the string value ‘Protein Query’ as the data source, the threshold of ‘0.90’ as the confidence score. Then, we completed the network creation by the STRING plug-in, which eliminated the nodes without edges in each network. Each node in the protein interaction network constructed by the STRING plugin represents a protein, named after the gene corresponding to that protein. Therefore, in the protein interaction network below, we will refer to the corresponding protein by the gene name instead. The construction of network edges is based on known interactions, including those from curated databases, experimentally validated interactions, and predicted interactions such as gene neighborhoods, gene fusions, and gene co-occurrence. Additional factors such as text mining, gene co-expression and protein homology are also considered.
The CytoHubba plugin was utilized to filter out the top 50 pivotal proteins in each dataset based on the descending order of degrees. The interaction network for these important proteins was reconstructed. We set the confidence (score) criterion to 0.40 while creating the top 50 network of proteins interactions. The final interaction network containing the essential proteins was exhibited in clockwise order based on the degree score. The top 10 hub proteins were identified by degree score in the deepest layer of the network.
4.5. A case of psychiatric disease-associated disorder proteins
Our studies have found that most of the IDPs in psychiatric disorders are involved in protein-protein interactions, and in order to explore the mode of action of disordered proteins in protein interaction networks, we have conducted a case study of one of the currently prevalent IDP proteins, α-synuclein. α-Synuclein's aberrant deposition in the brain has been implicated in the pathogenesis of Parkinson's disease, and recent studies have demonstrated that the protein encoding the SNCA gene is upregulated in the peripheral blood of patients with Parkinson's disease [47]. We selected a randomized Molecular Dynamics conformation of alpha-synuclein and selected Tubulin (PDB:7S7J), another potential biomarker of MD, as the target for interaction with alpha-synuclein protein. Tubulin is a structural protein, and research suggests that Tubulin may be a potential biomarker for MD (H. Singh et al., 2020). We performed molecular docking of alpha-synuclein and Tubulin using CLUSPRO v.2 [78,79,80,81] and used PyMOL 2.6.0a0 open-source version to label amino acids with distances below 6 Å between the two proteins as possible interaction sites between alpha-synuclein and Tubulin. By exploring the interaction relationship between IDPs (alpha-synuclein) and structural proteins (Tubulin) associated with MD, we hope to provide some insights into further exploring the interaction patterns between IDPs and structural proteins in a wider range of psychiatric disorders.
4.6. Protein Functional Annotation
We used the Metascape [82] to apply GO and KEGG analysis with all the following criteria: a minimum overlap of 3, a p-value cutoff of 0.05, and a minimum enrichment of 3. We identified the top 5 enriched gene counts in Biological Process (BP), Molecular Function (MF), Cellular Component (CC), and the top 10 pathways with enriched gene counts in KEGG. R version 4.2.3 was utilized to visualize these observations.
4.7. Statistical Analysis
The statistical analysis was conducted using R version 4.2.3. Normality tests and tests for variance homogeneity were conducted on each dataset, and it was determined that none of the datasets had a normal distribution and that variances were not equal across groups. Therefore, protein sequence lengths between groups were compared using the Kruskal-Wallis Test, proportional comparisons were made using the chi-squared test, and pairwise comparisons were adjusted the Bonferroni correction.
5. Conclusions
We found that psychiatric disease-associated proteins contain more IDPs compared to normal brain proteins, and in particular, there are significant differences in the levels of IDPs in ASD and ADHD compared to normal brain proteins. IDPs may influence early neurodevelopment as well as signaling through protein-protein interactions, which may in turn influence the onset of psychiatric disorders.
Supplementary Materials
The following supporting information can be downloaded at the website of this paper posted on Preprints.org. Table S1: The genes involved in this study; Table S2: Binding Sites Prediction for Diseases and BRAIN; Table S3: IDPs in existing psychiatric drug targets.
Author Contributions
Conceptualization, X.Z., Y.Y., G.H.and Q.H.; methodology, X.Z., G.H., Y.Y.and Q.H.; software, Y.Y., X.Z., X.S., R.L., N.Z. and Q.H.; formal analysis, Y.Y., X.Z., and G.H.; resources, X.Z., N.Z., R.L., and Q.H.; data curation, Y.Y., X.Z., G.H.and Q.H.; writing—original draft preparation,Y.Y., X.Z., G.H., X.S., M.J. and Q.H.; writing—reviewand editing, X.Z., G.H., S.B., M.J. and Q.H.; visualization, X.Z., Y.Y., S.B. M.J.and Q.H.; supervision, S.B.,M.J., X.S., Y.Y.and Q.H.; project administration, Y.Y., M.J., X.S.and Q.H.; funding acquisition, Q.H. All authors have read and agreed to the published version of the manuscript.
Funding
Q.H. was supported by the Young Scholars Program of Shandong University (21320082064101) and Shandong Province Key R&D Program (2021SFGC0504).
Data Availability Statement
Data from this study are available in Supplementary Table S1.
Conflicts of Interest
The authors declare that there are no conflicts of interest regarding the publication of this paper.
References
- Charlson, F.; van Ommeren, M.; Flaxman, A.; Cornett, J.; Whiteford, H.; Saxena, S. New WHO Prevalence Estimates of Mental Disorders in Conflict Settings: A Systematic Review and Meta-Analysis. Lancet Lond. Engl. 2019, 394, 240–248. [Google Scholar] [CrossRef]
- Ayhan, F.; Konopka, G. Regulatory Genes and Pathways Disrupted in Autism Spectrum Disorders. Prog. Neuropsychopharmacol. Biol. Psychiatry 2019, 89, 57–64. [Google Scholar] [CrossRef]
- Network and Pathway Analysis Subgroup of Psychiatric Genomics Consortium Psychiatric Genome-Wide Association Study Analyses Implicate Neuronal, Immune and Histone Pathways. Nat. Neurosci. 2015, 18, 199–209. [CrossRef]
- Ohayon, S.; Yitzhaky, A.; Hertzberg, L. Gene Expression Meta-Analysis Reveals the up-Regulation of CREB1 and CREBBP in Brodmann Area 10 of Patients with Schizophrenia. Psychiatry Res. 2020, 292, 113311. [Google Scholar] [CrossRef]
- Maqsood, Q.; Sumrin, A.; Mahnoor, M.; Waseem, M.; Tabassum, N.; Bhattacharya, R.; Saraf, D.; Bose, D. Tumor Suppressor Protein P53 and Association of Its Gene TP53 with Schizophrenia Patients. Gene Rep. 2021, 25, 101402. [Google Scholar] [CrossRef]
- Zhuang, W.; Ye, T.; Wang, W.; Song, W.; Tan, T. CTNNB1 in Neurodevelopmental Disorders. Front. Psychiatry 2023, 14, 1143328. [Google Scholar] [CrossRef]
- Davey, N.E. The Functional Importance of Structure in Unstructured Protein Regions. Curr. Opin. Struct. Biol. 2019, 56, 155–163. [Google Scholar] [CrossRef] [PubMed]
- Ghag, G.; Holler, C.J.; Taylor, G.; Kukar, T.L.; Uversky, V.N.; Rangachari, V. Disulfide Bonds and Disorder in Granulin-3: An Unusual Handshake between Structural Stability and Plasticity. Protein Sci. Publ. Protein Soc. 2017, 26, 1759–1772. [Google Scholar] [CrossRef] [PubMed]
- Vn, U. Protein Intrinsic Disorder and Structure-Function Continuum. Prog. Mol. Biol. Transl. Sci. 2019, 166. [Google Scholar] [CrossRef]
- Bondos, S.E.; Dunker, A.K.; Uversky, V.N. On the Roles of Intrinsically Disordered Proteins and Regions in Cell Communication and Signaling. Cell Commun. Signal. CCS 2021, 19, 88. [Google Scholar] [CrossRef]
- Iakoucheva, L.M.; Brown, C.J.; Lawson, J.D.; Obradović, Z.; Dunker, A.K. Intrinsic Disorder in Cell-Signaling and Cancer-Associated Proteins. J. Mol. Biol. 2002, 323, 573–584. [Google Scholar] [CrossRef]
- Liu, J.; Perumal, N.B.; Oldfield, C.J.; Su, E.W.; Uversky, V.N.; Dunker, A.K. Intrinsic Disorder in Transcription Factors. Biochemistry 2006, 45, 6873–6888. [Google Scholar] [CrossRef] [PubMed]
- Wright, P.E.; Dyson, H.J. Intrinsically Unstructured Proteins: Re-Assessing the Protein Structure-Function Paradigm. J. Mol. Biol. 1999, 293, 321–331. [Google Scholar] [CrossRef] [PubMed]
- Cermakova, K.; Demeulemeester, J.; Lux, V.; Nedomova, M.; Goldman, S.R.; Smith, E.A.; Srb, P.; Hexnerova, R.; Fabry, M.; Madlikova, M.; et al. A Ubiquitous Disordered Protein Interaction Module Orchestrates Transcription Elongation. Science 2021, 374, 1113–1121. [Google Scholar] [CrossRef] [PubMed]
- Babu, M.M.; van der Lee, R.; de Groot, N.S.; Gsponer, J. Intrinsically Disordered Proteins: Regulation and Disease. Curr. Opin. Struct. Biol. 2011, 21, 432–440. [Google Scholar] [CrossRef] [PubMed]
- Gsponer, J.; Futschik, M.E.; Teichmann, S.A.; Babu, M.M. Tight Regulation of Unstructured Proteins: From Transcript Synthesis to Protein Degradation. Science 2008, 322, 1365–1368. [Google Scholar] [CrossRef] [PubMed]
- Vavouri, T.; Semple, J.I.; Garcia-Verdugo, R.; Lehner, B. Intrinsic Protein Disorder and Interaction Promiscuity Are Widely Associated with Dosage Sensitivity. Cell 2009, 138, 198–208. [Google Scholar] [CrossRef] [PubMed]
- Wang, G.; Lei, J.; Wang, Y.; Yu, J.; He, Y.; Zhao, W.; Hu, Z.; Xu, Z.; Jin, Y.; Gu, Y.; et al. The ZSWIM8 Ubiquitin Ligase Regulates Neurodevelopment by Guarding the Protein Quality of Intrinsically Disordered Dab1. Cereb. Cortex N. Y. N 1991 2023, 33, 3866–3881. [Google Scholar] [CrossRef]
- Rosenbaum, J.C.; Fredrickson, E.K.; Oeser, M.L.; Garrett-Engele, C.M.; Locke, M.N.; Richardson, L.A.; Nelson, Z.W.; Hetrick, E.D.; Milac, T.I.; Gottschling, D.E.; et al. Disorder Targets Misorder in Nuclear Quality Control Degradation: A Disordered Ubiquitin Ligase Directly Recognizes Its Misfolded Substrates. Mol. Cell 2011, 41, 93–106. [Google Scholar] [CrossRef]
- Folsom, T.D.; Fatemi, S.H. The Involvement of Reelin in Neurodevelopmental Disorders. Neuropharmacology 2013, 68, 122–135. [Google Scholar] [CrossRef]
- Aguzzi, A.; Altmeyer, M. Phase Separation: Linking Cellular Compartmentalization to Disease. Trends Cell Biol. 2016, 26, 547–558. [Google Scholar] [CrossRef] [PubMed]
- Calabretta, S.; Richard, S. Emerging Roles of Disordered Sequences in RNA-Binding Proteins. Trends Biochem. Sci. 2015, 40, 662–672. [Google Scholar] [CrossRef] [PubMed]
- Chiti, F.; Dobson, C.M. Protein Misfolding, Functional Amyloid, and Human Disease. Annu. Rev. Biochem. 2006, 75, 333–366. [Google Scholar] [CrossRef] [PubMed]
- Knowles, T.P.J.; Vendruscolo, M.; Dobson, C.M. The Amyloid State and Its Association with Protein Misfolding Diseases. Nat. Rev. Mol. Cell Biol. 2014, 15, 384–396. [Google Scholar] [CrossRef] [PubMed]
- Molliex, A.; Temirov, J.; Lee, J.; Coughlin, M.; Kanagaraj, A.P.; Kim, H.J.; Mittag, T.; Taylor, J.P. Phase Separation by Low Complexity Domains Promotes Stress Granule Assembly and Drives Pathological Fibrillization. Cell 2015, 163, 123–133. [Google Scholar] [CrossRef]
- Toretsky, J.A.; Wright, P.E. Assemblages: Functional Units Formed by Cellular Phase Separation. J. Cell Biol. 2014, 206, 579–588. [Google Scholar] [CrossRef]
- Wu, H.; Fuxreiter, M. The Structure and Dynamics of Higher-Order Assemblies: Amyloids, Signalosomes, and Granules. Cell 2016, 165, 1055–1066. [Google Scholar] [CrossRef]
- Xiao, X.; Zhang, C.; Grigoroiu-Serbanescu, M.; Wang, L.; Li, L.; Zhou, D.; Yuan, T.-F.; Wang, C.; Chang, H.; Wu, Y.; et al. The cAMP Responsive Element-Binding (CREB)-1 Gene Increases Risk of Major Psychiatric Disorders. Mol. Psychiatry 2018, 23, 1957–1967. [Google Scholar] [CrossRef]
- Tovo-Rodrigues, L.; Recamonde-Mendoza, M.; Paixão-Côrtes, V.R.; Bruxel, E.M.; Schuch, J.B.; Friedrich, D.C.; Rohde, L.A.; Hutz, M.H. The Role of Protein Intrinsic Disorder in Major Psychiatric Disorders. Am. J. Med. Genet. Part B Neuropsychiatr. Genet. Off. Publ. Int. Soc. Psychiatr. Genet. 2016, 171, 848–860. [Google Scholar] [CrossRef]
- Zakharova, N.V.; Mamedova, G.S.; Bravve, L.V.; Kaydan, M.A.; Syunyakov, T.S.; Kostyuk, G.P.; Ushakov, V.L. Brain Gyrification Index in Schizophrenia (Review, Systematic Review and Meta-Analysis). 2020 Annu. Int. Conf. Brain-Inspired Cogn. Archit. Artif. Intell. Elev. Annu. Meet. BICA Soc. 2021, 190, 825–837. [Google Scholar] [CrossRef]
- Narr, K.; Thompson, P.; Sharma, T.; Moussai, J.; Zoumalan, C.; Rayman, J.; Toga, A. Three-Dimensional Mapping of Gyral Shape and Cortical Surface Asymmetries in Schizophrenia: Gender Effects. Am. J. Psychiatry 2001, 158, 244–255. [Google Scholar] [CrossRef] [PubMed]
- Yücel, M.; Stuart, G.W.; Maruff, P.; Wood, S.J.; Savage, G.R.; Smith, D.J.; Crowe, S.F.; Copolov, D.L.; Velakoulis, D.; Pantelis, C. Ohayon. Biol. Psychiatry 2002, 52, 15–23. [Google Scholar] [CrossRef]
- Morrison, R.S.; Kinoshita, Y. The Role of P53 in Neuronal Cell Death. Cell Death Differ. 2000, 7, 868–879. [Google Scholar] [CrossRef] [PubMed]
- Emamian, E.S.; Hall, D.; Birnbaum, M.J.; Karayiorgou, M.; Gogos, J.A. Convergent Evidence for Impaired AKT1-GSK3beta Signaling in Schizophrenia. Nat. Genet. 2004, 36, 131–137. [Google Scholar] [CrossRef]
- Law, A.J.; Wang, Y.; Sei, Y.; O’Donnell, P.; Piantadosi, P.; Papaleo, F.; Straub, R.E.; Huang, W.; Thomas, C.J.; Vakkalanka, R.; et al. Neuregulin 1-ErbB4-PI3K Signaling in Schizophrenia and Phosphoinositide 3-Kinase-P110δ Inhibition as a Potential Therapeutic Strategy. Proc. Natl. Acad. Sci. U. S. A. 2012, 109, 12165–12170. [Google Scholar] [CrossRef]
- Gentile, J.E.; Carrizales, M.G.; Koleske, A.J. Control of Synapse Structure and Function by Actin and Its Regulators. Cells 2022, 11, 603. [Google Scholar] [CrossRef]
- Soykan, T.; Kaempf, N.; Sakaba, T.; Vollweiter, D.; Goerdeler, F.; Puchkov, D.; Kononenko, N.L.; Haucke, V. Synaptic Vesicle Endocytosis Occurs on Multiple Timescales and Is Mediated by Formin-Dependent Actin Assembly. Neuron 2017, 93, 854–866.e4. [Google Scholar] [CrossRef]
- Boguski, M.S.; McCormick, F. Proteins Regulating Ras and Its Relatives. Nature 1993, 366, 643–654. [Google Scholar] [CrossRef] [PubMed]
- Rauen, K.A. The RASopathies. Annu. Rev. Genomics Hum. Genet. 2013, 14, 355–369. [Google Scholar] [CrossRef] [PubMed]
- Oldfield, C.J.; Meng, J.; Yang, J.Y.; Yang, M.Q.; Uversky, V.N.; Dunker, A.K. Flexible Nets: Disorder and Induced Fit in the Associations of P53 and 14-3-3 with Their Partners. BMC Genomics 2008, 9 Suppl 1, S1. [Google Scholar] [CrossRef]
- Uversky, V.N.; Dunker, A.K. Understanding Protein Non-Folding. Biochim. Biophys. Acta 2010, 1804, 1231–1264. [Google Scholar] [CrossRef]
- Anderson, C.W.; Appella, E. Chapter 264 - Signaling to the P53 Tumor Suppressor through Pathways Activated by Genotoxic and Non-Genotoxic Stresses. In Handbook of Cell Signaling (Second Edition); Bradshaw, R.A., Dennis, E.A., Eds.; Academic Press: San Diego, 2010; pp. 2185–2204. ISBN 978-0-12-374145-5. [Google Scholar]
- Parker, D.; Ferreri, K.; Nakajima, T.; LaMorte, V.J.; Evans, R.; Koerber, S.C.; Hoeger, C.; Montminy, M.R. Phosphorylation of CREB at Ser-133 Induces Complex Formation with CREB-Binding Protein via a Direct Mechanism. Mol. Cell. Biol. 1996, 16, 694–703. [Google Scholar] [CrossRef]
- Radhakrishnan, I.; Pérez-Alvarado, G.C.; Parker, D.; Dyson, H.J.; Montminy, M.R.; Wright, P.E. Solution Structure of the KIX Domain of CBP Bound to the Transactivation Domain of CREB: A Model for Activator:Coactivator Interactions. Cell 1997, 91, 741–752. [Google Scholar] [CrossRef]
- Baba, M.; Nakajo, S.; Tu, P.H.; Tomita, T.; Nakaya, K.; Lee, V.M.; Trojanowski, J.Q.; Iwatsubo, T. Aggregation of Alpha-Synuclein in Lewy Bodies of Sporadic Parkinson’s Disease and Dementia with Lewy Bodies. Am. J. Pathol. 1998, 152, 879–884. [Google Scholar]
- Krüger, R.; Kuhn, W.; Müller, T.; Woitalla, D.; Graeber, M.; Kösel, S.; Przuntek, H.; Epplen, J.T.; Schöls, L.; Riess, O. Ala30Pro Mutation in the Gene Encoding Alpha-Synuclein in Parkinson’s Disease. Nat. Genet. 1998, 18, 106–108. [Google Scholar] [CrossRef]
- Du, T.; Li, G.; Luo, H.; Pan, Y.; Xu, Q.; Ma, K. Hippocampal Alpha-Synuclein Mediates Depressive-like Behaviors. Brain. Behav. Immun. 2021, 95, 226–237. [Google Scholar] [CrossRef] [PubMed]
- Basu, S.; Mukharjee, D. Salt-Bridge Networks within Globular and Disordered Proteins: Characterizing Trends for Designable Interactions. J. Mol. Model. 2017, 23, 206. [Google Scholar] [CrossRef] [PubMed]
- Hammerschlag, A.R.; de Leeuw, C.A.; Middeldorp, C.M.; Polderman, T.J.C. Synaptic and Brain-Expressed Gene Sets Relate to the Shared Genetic Risk across Five Psychiatric Disorders. Psychol. Med. 2020, 50, 1695–1705. [Google Scholar] [CrossRef]
- Palmer, D.S.; Howrigan, D.P.; Chapman, S.B.; Adolfsson, R.; Bass, N.; Blackwood, D.; Boks, M.P.M.; Chen, C.-Y.; Churchhouse, C.; Corvin, A.P.; et al. Exome Sequencing in Bipolar Disorder Identifies AKAP11 as a Risk Gene Shared with Schizophrenia. Nat. Genet. 2022, 54, 541–547. [Google Scholar] [CrossRef] [PubMed]
- Singh, T.; Poterba, T.; Curtis, D.; Akil, H.; Al Eissa, M.; Barchas, J.D.; Bass, N.; Bigdeli, T.B.; Breen, G.; Bromet, E.J.; et al. Rare Coding Variants in Ten Genes Confer Substantial Risk for Schizophrenia. Nature 2022, 604, 509–516. [Google Scholar] [CrossRef] [PubMed]
- Trubetskoy, V.; Pardiñas, A.F.; Qi, T.; Panagiotaropoulou, G.; Awasthi, S.; Bigdeli, T.B.; Bryois, J.; Chen, C.-Y.; Dennison, C.A.; Hall, L.S.; et al. Mapping Genomic Loci Implicates Genes and Synaptic Biology in Schizophrenia. Nature 2022, 604, 502–508. [Google Scholar] [CrossRef]
- Cocchi, L.; Bramati, I.E.; Zalesky, A.; Furukawa, E.; Fontenelle, L.F.; Moll, J.; Tripp, G.; Mattos, P. Altered Functional Brain Connectivity in a Non-Clinical Sample of Young Adults with Attention-Deficit/Hyperactivity Disorder. J. Neurosci. Off. J. Soc. Neurosci. 2012, 32, 17753–17761. [Google Scholar] [CrossRef] [PubMed]
- Xu, J.; Wang, C.; Xu, Z.; Li, T.; Chen, F.; Chen, K.; Gao, J.; Wang, J.; Hu, Q. Specific Functional Connectivity Patterns of Middle Temporal Gyrus Subregions in Children and Adults with Autism Spectrum Disorder. Autism Res. Off. J. Int. Soc. Autism Res. 2020, 13, 410–422. [Google Scholar] [CrossRef] [PubMed]
- Di Martino, A.; Zuo, X.-N.; Kelly, C.; Grzadzinski, R.; Mennes, M.; Schvarcz, A.; Rodman, J.; Lord, C.; Castellanos, F.X.; Milham, M.P. Shared and Distinct Intrinsic Functional Network Centrality in Autism and Attention-Deficit/Hyperactivity Disorder. Biol. Psychiatry 2013, 74, 623–632. [Google Scholar] [CrossRef] [PubMed]
- Kernbach, J.M.; Satterthwaite, T.D.; Bassett, D.S.; Smallwood, J.; Margulies, D.; Krall, S.; Shaw, P.; Varoquaux, G.; Thirion, B.; Konrad, K.; et al. Shared Endo-Phenotypes of Default Mode Dsfunction in Attention Deficit/Hyperactivity Disorder and Autism Spectrum Disorder. Transl. Psychiatry 2018, 8, 133. [Google Scholar] [CrossRef] [PubMed]
- Qian, L.; Li, Y.; Wang, Y.; Wang, Y.; Cheng, X.; Li, C.; Cui, X.; Jiao, G.; Ke, X. Shared and Distinct Topologically Structural Connectivity Patterns in Autism Spectrum Disorder and Attention-Deficit/Hyperactivity Disorder. Front. Neurosci. 2021, 15, 664363. [Google Scholar] [CrossRef]
- Xie, H.; Vucetic, S.; Iakoucheva, L.M.; Oldfield, C.J.; Dunker, A.K.; Obradovic, Z.; Uversky, V.N. Functional Anthology of Intrinsic Disorder. 3. Ligands, Post-Translational Modifications, and Diseases Associated with Intrinsically Disordered Proteins. J. Proteome Res. 2007, 6, 1917–1932. [Google Scholar] [CrossRef]
- Khan, A.; Molitor, A.; Mayeur, S.; Zhang, G.; Rinaldi, B.; Lannes, B.; Lhermitte, B.; Umair, M.; Arold, S.T.; Friant, S.; et al. A Homozygous Missense Variant in PPP1R1B/DARPP-32 Is Associated With Generalized Complex Dystonia. Mov. Disord. Off. J. Mov. Disord. Soc. 2022, 37, 365–374. [Google Scholar] [CrossRef]
- Kotecha, S.; Lebot, M.N.; Sukkarn, B.; Ball, G.; Moseley, P.M.; Chan, S.Y.; Green, A.R.; Rakha, E.; Ellis, I.O.; Martin, S.G.; et al. Dopamine and cAMP-Regulated Phosphoprotein 32 kDa (DARPP-32) and Survival in Breast Cancer: A Retrospective Analysis of Protein and mRNA Expression. Sci. Rep. 2019, 9, 16987. [Google Scholar] [CrossRef]
- Avanes, A.; Lenz, G.; Momand, J. Darpp-32 and t-Darpp Protein Products of PPP1R1B: Old Dogs with New Tricks. Biochem. Pharmacol. 2019, 160, 71–79. [Google Scholar] [CrossRef]
- Hunt, C.P.J.; Pouton, C.W.; Haynes, J.M. Characterising the Developmental Profile of Human Embryonic Stem Cell-Derived Medium Spiny Neuron Progenitors and Assessing Mature Neuron Function Using a CRISPR-Generated Human DARPP-32WT/eGFP-AMP Reporter Line. Neurochem. Int. 2017, 106, 3–13. [Google Scholar] [CrossRef] [PubMed]
- T, P.; N, W. Oncogenic Re-Wiring of Cellular Signaling Pathways. Oncogene 2007, 26. [Google Scholar] [CrossRef]
- Goedert, M. Alpha-Synuclein and Neurodegenerative Diseases. Nat. Rev. Neurosci. 2001, 2, 492–501. [Google Scholar] [CrossRef] [PubMed]
- Zhu, C.-Y.; Shen, Y.; Xu, Q. Propagation of Dysbindin-1B Aggregates: Exosome-Mediated Transmission of Neurotoxic Deposits. Neuroscience 2015, 291, 301–316. [Google Scholar] [CrossRef] [PubMed]
- Zaharija, B.; Odorčić, M.; Hart, A.; Samardžija, B.; Marreiros, R.; Prikulis, I.; Juković, M.; Hyde, T.M.; Kleinman, J.E.; Korth, C.; et al. TRIOBP-1 Protein Aggregation Exists in Both Major Depressive Disorder and Schizophrenia, and Can Occur through Two Distinct Regions of the Protein. Int. J. Mol. Sci. 2022, 23. [Google Scholar] [CrossRef] [PubMed]
- Tesei, G.; Trolle, A.I.; Jonsson, N.; Betz, J.; Knudsen, F.E.; Pesce, F.; Johansson, K.E.; Lindorff-Larsen, K. Conformational Ensembles of the Human Intrinsically Disordered Proteome. Nature 2024, 1–8. [Google Scholar] [CrossRef] [PubMed]
- Lotthammer, J.M.; Ginell, G.M.; Griffith, D.; Emenecker, R.J.; Holehouse, A.S. Direct Prediction of Intrinsically Disordered Protein Conformational Properties from Sequences. Nat. Methods 2024, 1–12. [Google Scholar] [CrossRef]
- Piñero, J.; Ramírez-Anguita, J.M.; Saüch-Pitarch, J.; Ronzano, F.; Centeno, E.; Sanz, F.; Furlong, L.I. The DisGeNET Knowledge Platform for Disease Genomics: 2019 Update. Nucleic Acids Res. 2020, 48, D845–D855. [Google Scholar] [CrossRef]
- Safran, M.; Rosen, N.; Twik, M.; BarShir, R.; Stein, T.I.; Dahary, D.; Fishilevich, S.; Lancet, D. The GeneCards Suite. In Practical Guide to Life Science Databases; Abugessaisa, I., Kasukawa, T., Eds.; Springer Nature Singapore: Singapore, 2021; pp. 27–56. ISBN 978-981-16-5812-9. [Google Scholar]
- Uhlen, M.; Oksvold, P.; Fagerberg, L.; Lundberg, E.; Jonasson, K.; Forsberg, M.; Zwahlen, M.; Kampf, C.; Wester, K.; Hober, S.; et al. Towards a Knowledge-Based Human Protein Atlas. Nat. Biotechnol. 2010, 28, 1248–1250. [Google Scholar] [CrossRef]
- Hawrylycz, M.J.; Lein, E.S.; Guillozet-Bongaarts, A.L.; Shen, E.H.; Ng, L.; Miller, J.A.; van de Lagemaat, L.N.; Smith, K.A.; Ebbert, A.; Riley, Z.L.; et al. An Anatomically Comprehensive Atlas of the Adult Human Brain Transcriptome. Nature 2012, 489, 391–399. [Google Scholar] [CrossRef]
- Miller, J.A.; Ding, S.-L.; Sunkin, S.M.; Smith, K.A.; Ng, L.; Szafer, A.; Ebbert, A.; Riley, Z.L.; Royall, J.J.; Aiona, K.; et al. Transcriptional Landscape of the Prenatal Human Brain. Nature 2014, 508, 199–206. [Google Scholar] [CrossRef]
- The UniProt Consortium UniProt: The Universal Protein Knowledgebase in 2023. Nucleic Acids Res. 2023, 51, D523–D531. [CrossRef]
- Erdős, G.; Dosztányi, Z. Analyzing Protein Disorder with IUPred2A. Curr. Protoc. Bioinforma. 2020, 70, e99. [Google Scholar] [CrossRef]
- Dosztányi, Z.; Mészáros, B.; Simon, I. ANCHOR: Web Server for Predicting Protein Binding Regions in Disordered Proteins. Bioinforma. Oxf. Engl. 2009, 25, 2745–2746. [Google Scholar] [CrossRef] [PubMed]
- Mészáros, B.; Simon, I.; Dosztányi, Z. Prediction of Protein Binding Regions in Disordered Proteins. PLoS Comput. Biol. 2009, 5, e1000376. [Google Scholar] [CrossRef]
- Desta, I.T.; Porter, K.A.; Xia, B.; Kozakov, D.; Vajda, S. Performance and Its Limits in Rigid Body Protein-Protein Docking. Struct. Lond. Engl. 1993 2020, 28, 1071–1081.e3. [Google Scholar] [CrossRef]
- Kozakov, D.; Beglov, D.; Bohnuud, T.; Mottarella, S.E.; Xia, B.; Hall, D.R.; Vajda, S. How Good Is Automated Protein Docking? Proteins 2013, 81, 2159–2166. [Google Scholar] [CrossRef] [PubMed]
- Kozakov, D.; Hall, D.R.; Xia, B.; Porter, K.A.; Padhorny, D.; Yueh, C.; Beglov, D.; Vajda, S. The ClusPro Web Server for Protein-Protein Docking. Nat. Protoc. 2017, 12, 255–278. [Google Scholar] [CrossRef]
- Vajda, S.; Yueh, C.; Beglov, D.; Bohnuud, T.; Mottarella, S.E.; Xia, B.; Hall, D.R.; Kozakov, D. New Additions to the ClusPro Server Motivated by CAPRI. Proteins 2017, 85, 435–444. [Google Scholar] [CrossRef]
- Zhou, Y.; Zhou, B.; Pache, L.; Chang, M.; Khodabakhshi, A.H.; Tanaseichuk, O.; Benner, C.; Chanda, S.K. Metascape Provides a Biologist-Oriented Resource for the Analysis of Systems-Level Datasets. Nat. Commun. 2019, 10, 1523. [Google Scholar] [CrossRef]
Figure 1.
Gene Ontology (GO) Enrichment of Differentially Expressed Proteins in BRAIN dataset and MENTAL dataset and Kyoto Encyclopedia of Genes and Genomes (KEGG) and Protein-Protein Interaction Network Analysis of MENTAL dataset (A). The biological process (BP), cellular component (CC), and molecular function (MF) terms of top 5 are associated with the BRAIN dataset. (B). The BP, CC, and MF GO terms of top 5 are associated with the MENTAL dataset. (C). Based on the number of enriched genes, the top 10 KEGG pathways in the MENTAL dataset were ranked. The more enriched the path is, the closer it is too red from blue to red. The size of the circle indicates the number of enriched genes. (D). Protein-protein interaction networks for the 100 proteins in the MENTAL dataset, ordered from highest to lowest degree score. The colors represent different ranges of degree values, from red to orange to yellow. The inner circle depicts the top 10 proteins in clockwise order starting with AKT1.
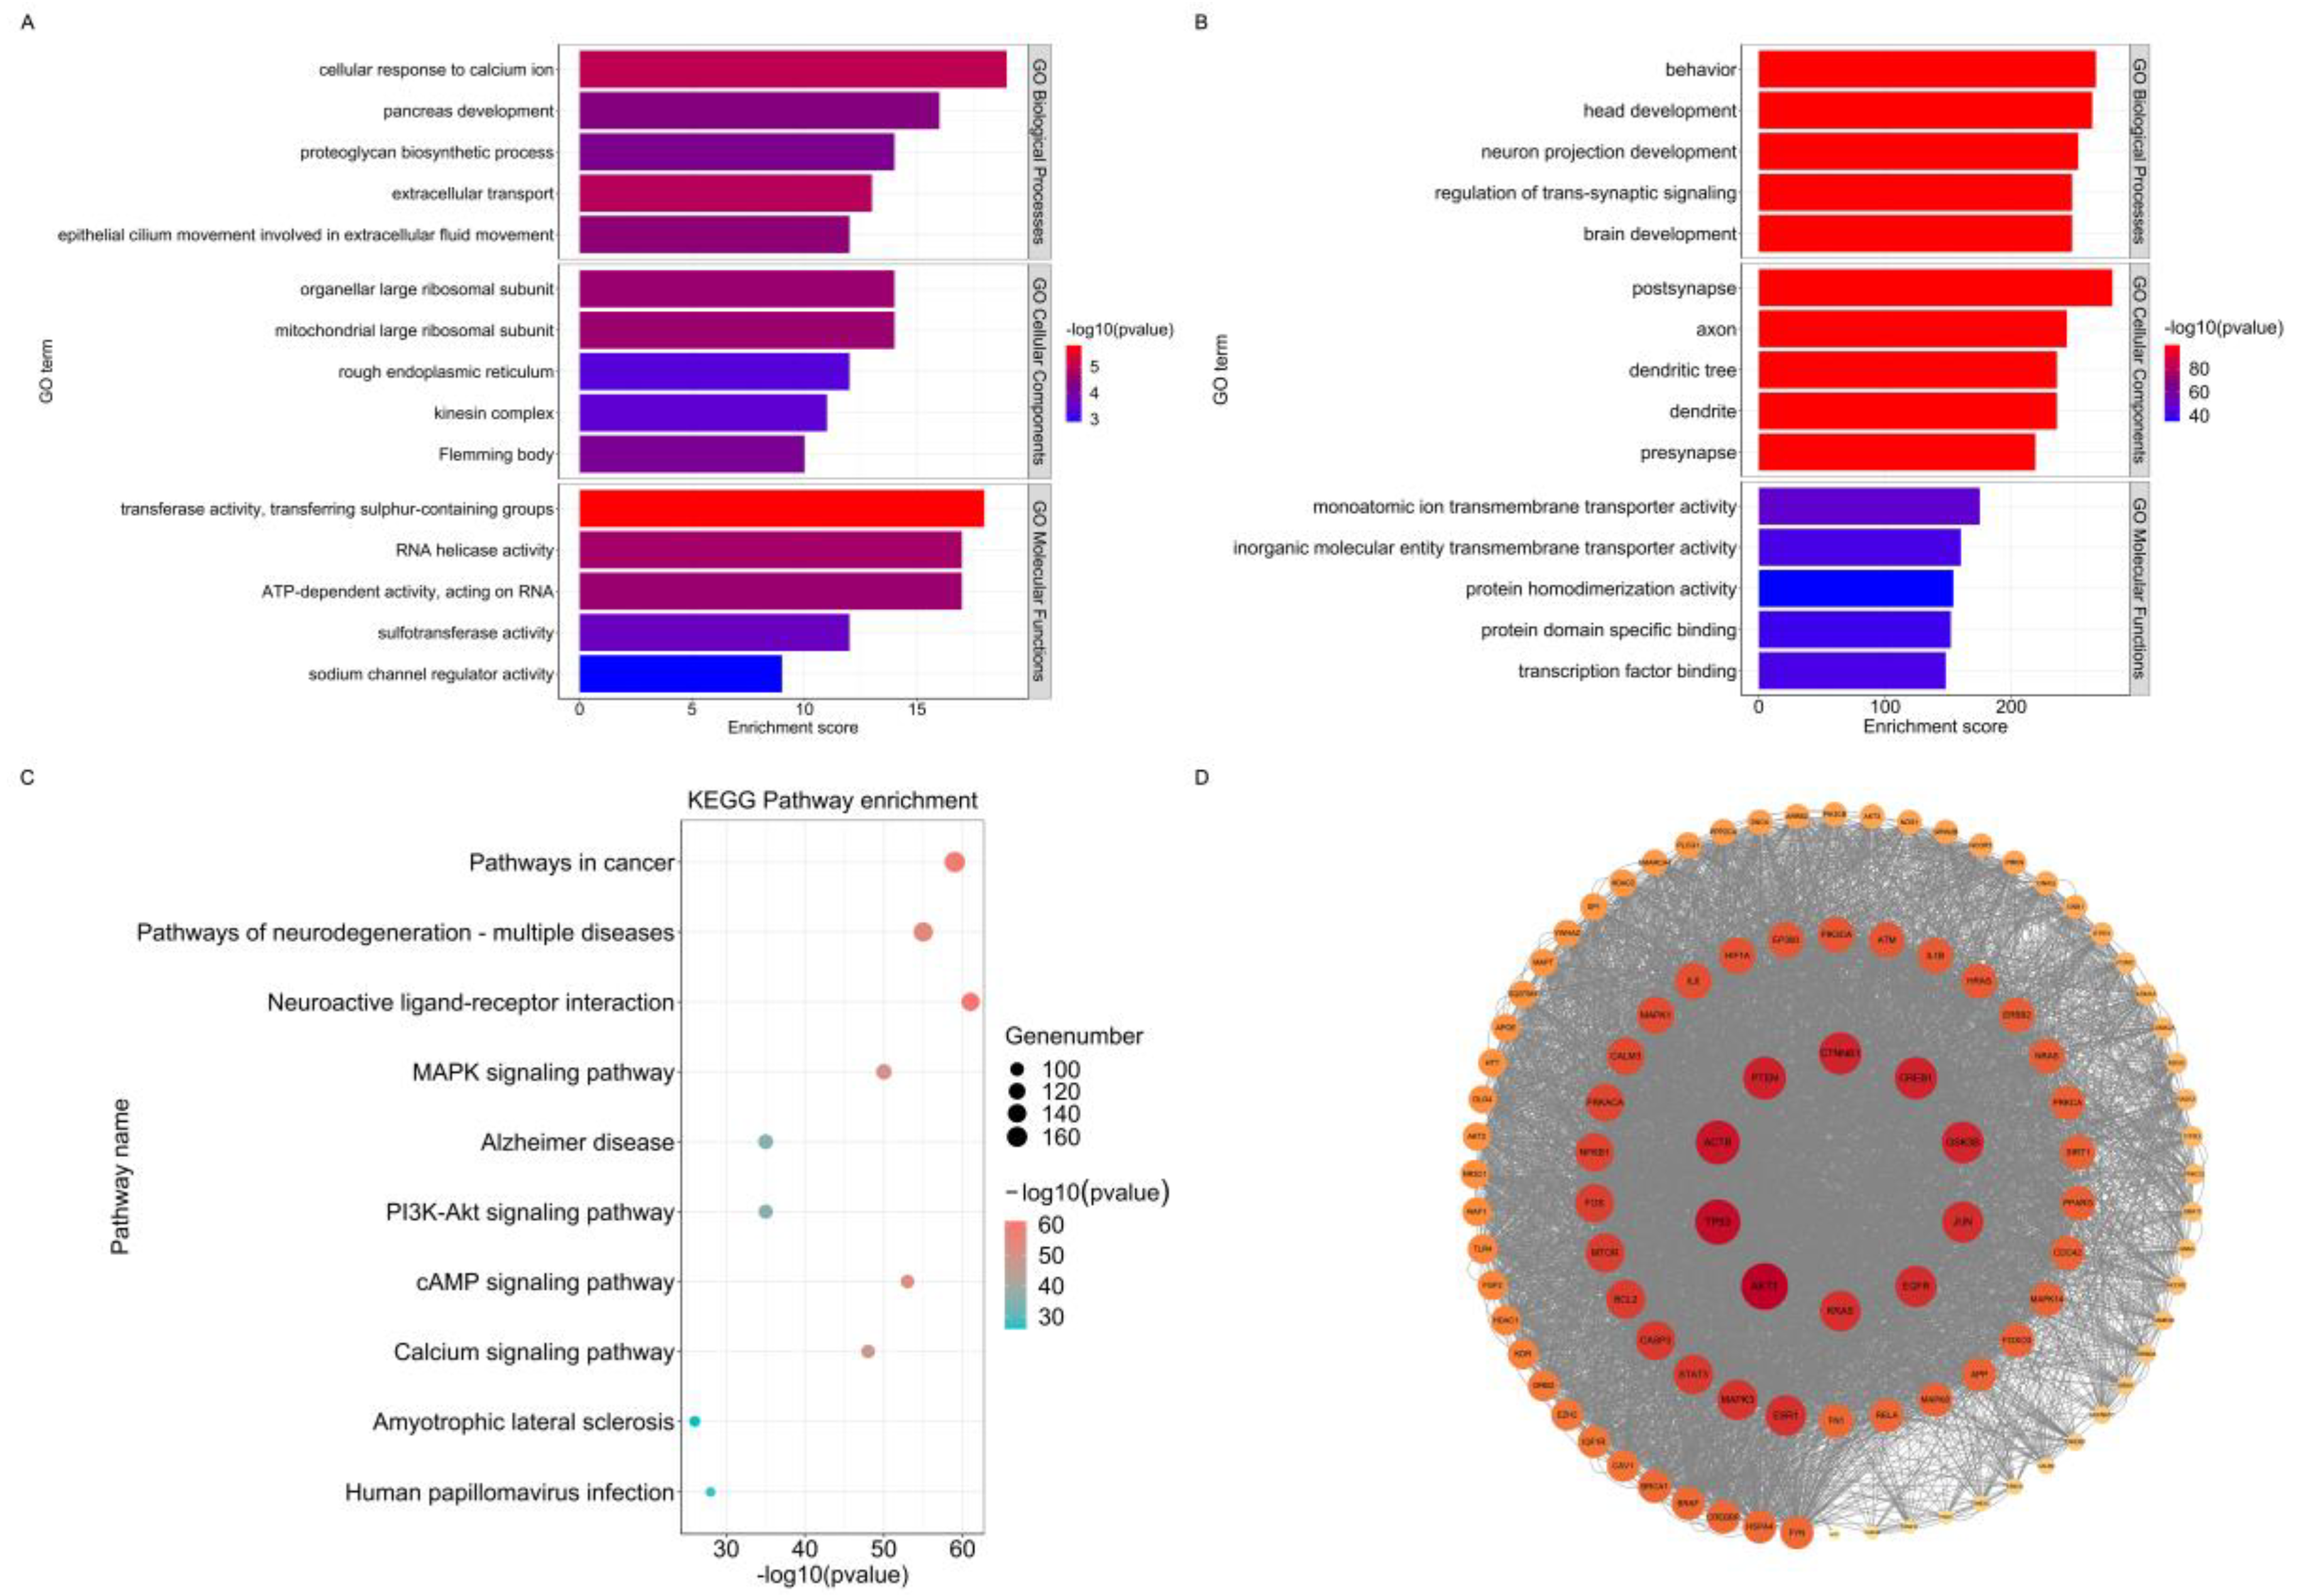
Figure 2.
Summary of differential gene datasets for psychiatric diseases and results of protein disorder and binding site prediction. (A) Intersections between the seven psychiatric disease datasets, with the number in each region representing the number of genes contained in the corresponding disease intersection. (B) Percentage of proteins containing disordered residues of each length in the seven disease datasets, with the x-axis representing disordered residues of different lengths (30-90) and the y-axis representing the percentage of proteins in the dataset containing at least one disordered residue of that length. (C) Percentage of proteins containing at least one disordered binding site in the seven disease datasets and the control dataset, with the X-axis representing the different datasets and the Y-axis representing the percentage of proteins containing at least one disordered binding site. (D) Percentage of disordered residues of each length in the seven disease datasets to the total number of disordered residues in the datasets, with the x-axis representing disordered residues of different lengths (30-90), and the y-axis representing disordered residues of each length as a percentage of the total number of disordered residues contained in the proteins in the datasets.
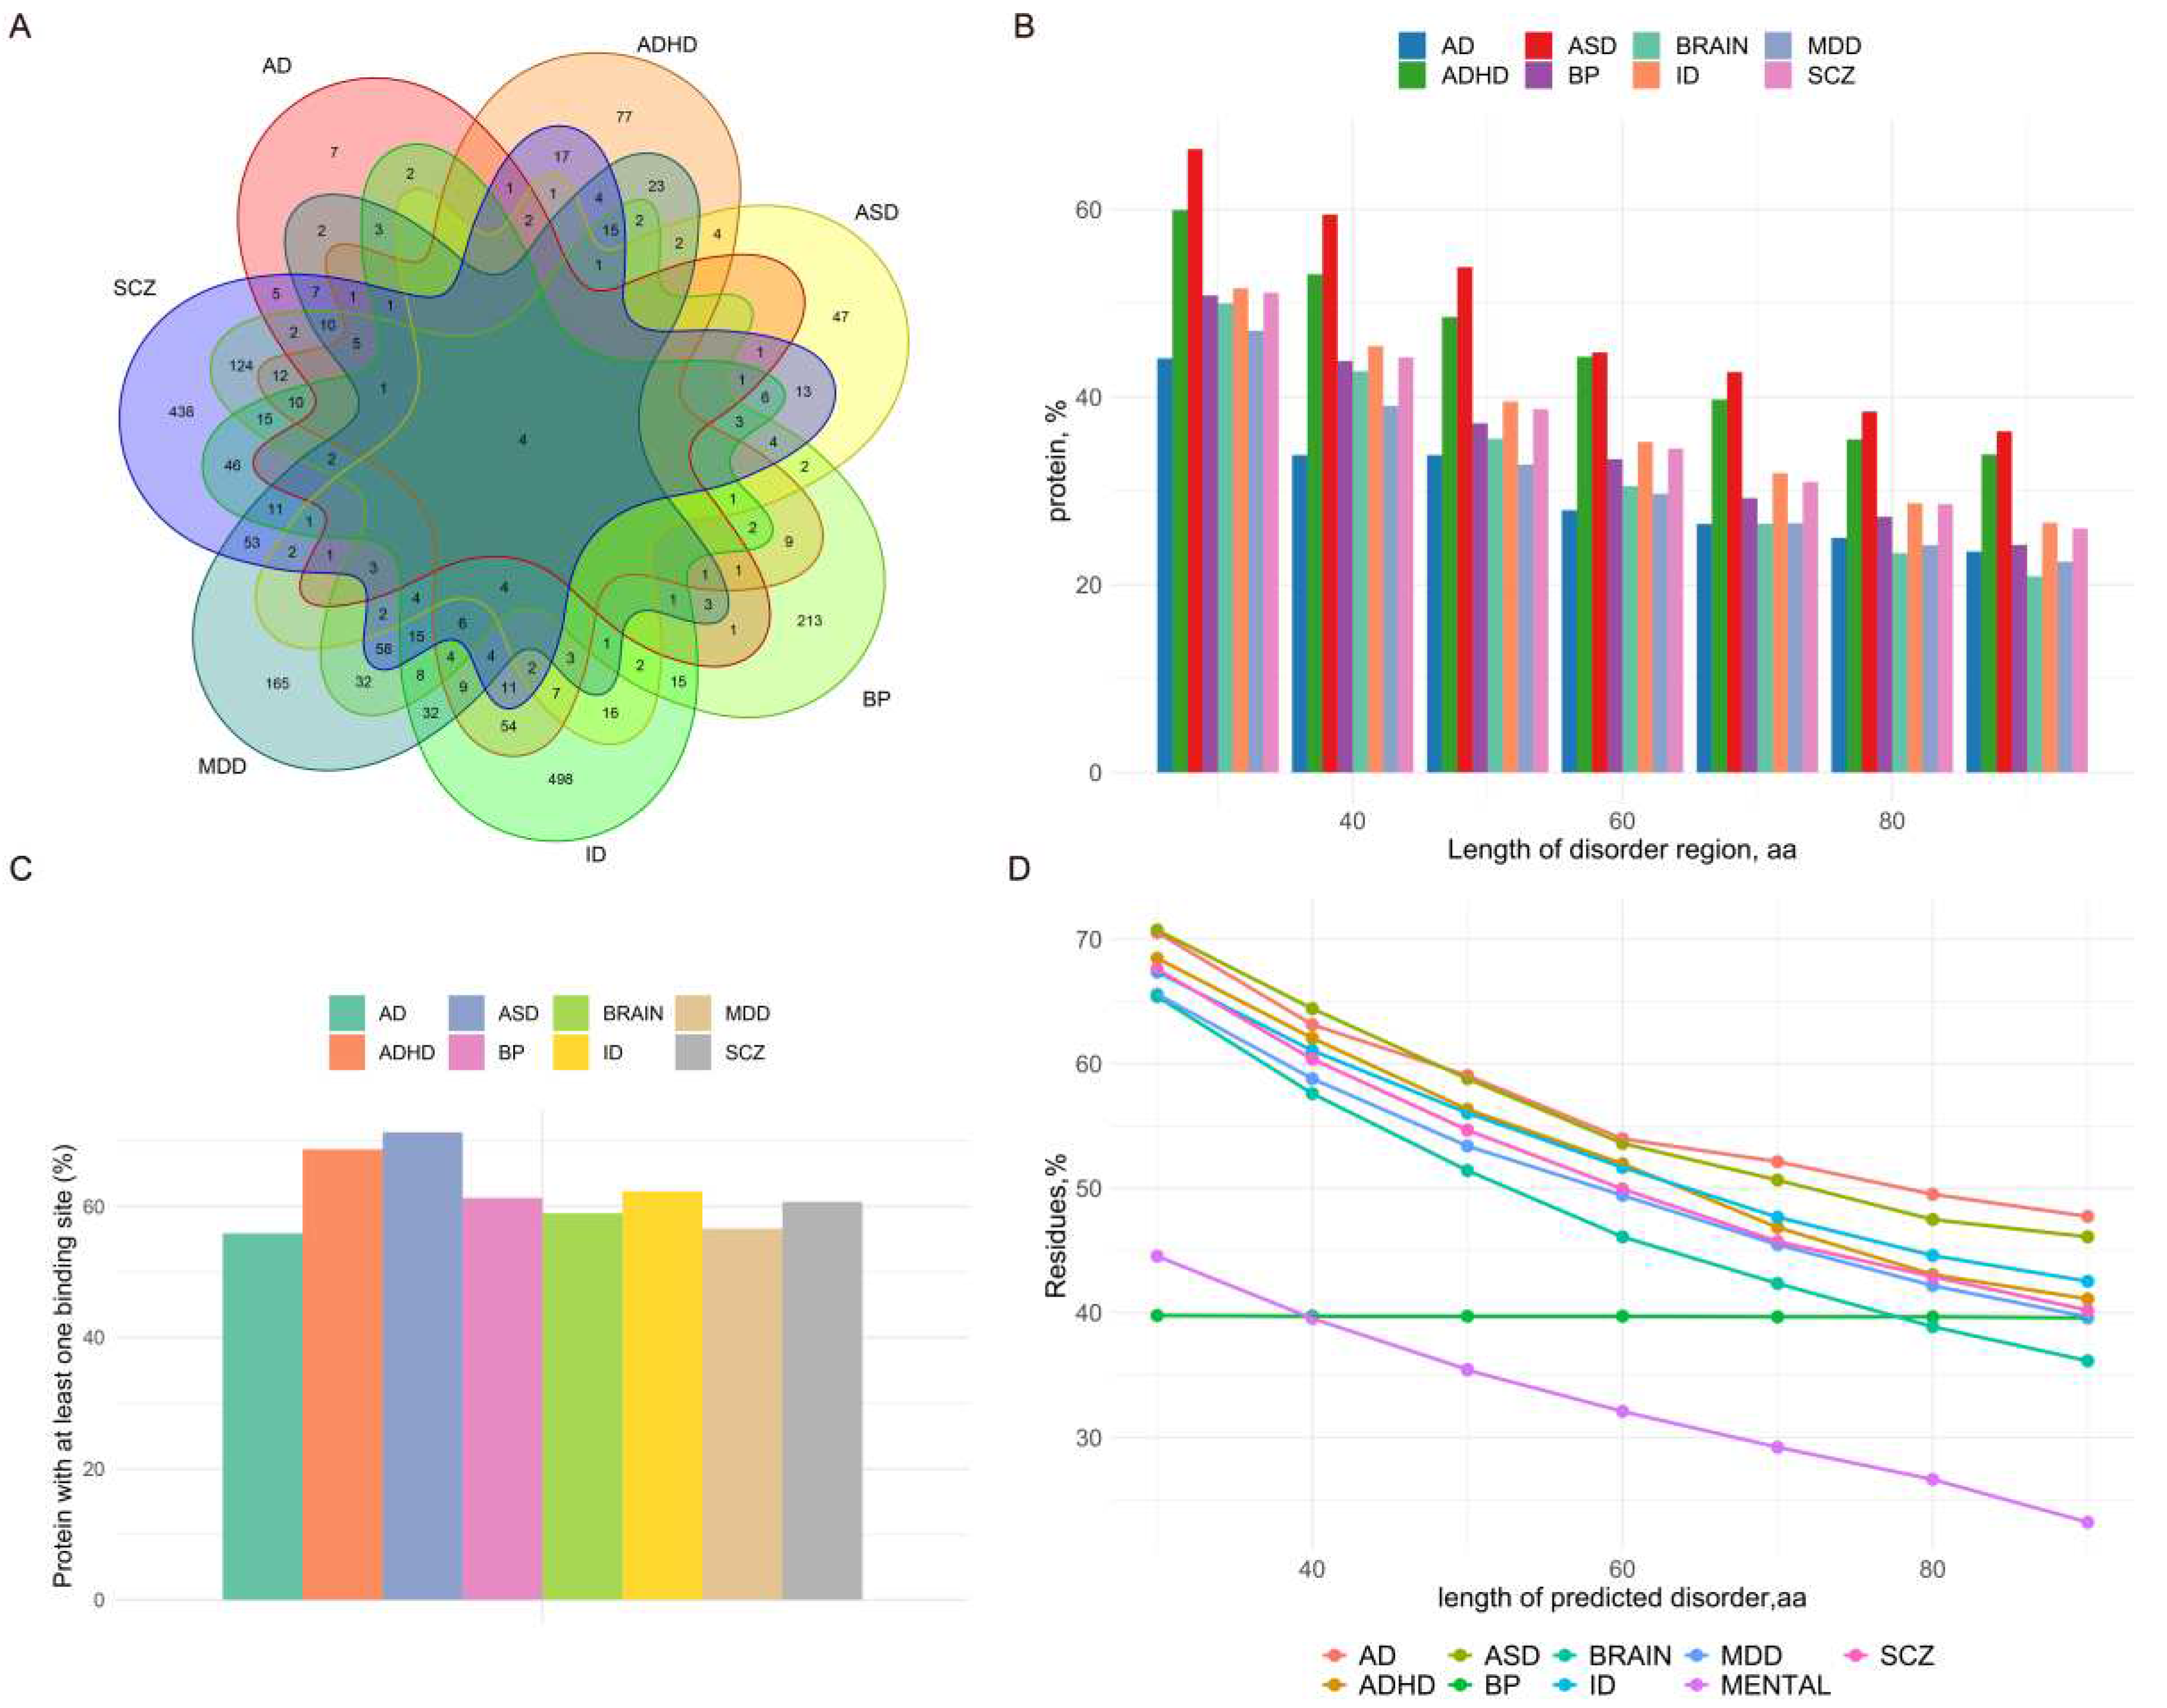
Figure 3.
Based on the Gene Ontology (GO) terms that were significantly enriched for function, the top 5 GO terms in Biological Process (BP), Cellular Component (CC), and Molecular Function (MF) were chosen. The length of the bar indicates the number of genes enriched for that term, and the color of the bar ranges from red to blue, with the closer the red color, the more genes enriched for the altered term. (A) Enrichment results for the Low Disorder dataset. (B) Enrichment results for the High Disorder dataset. (C) Enrichment results of IDPs in ASD. (D) Enrichment results of IDPs in ADHD.
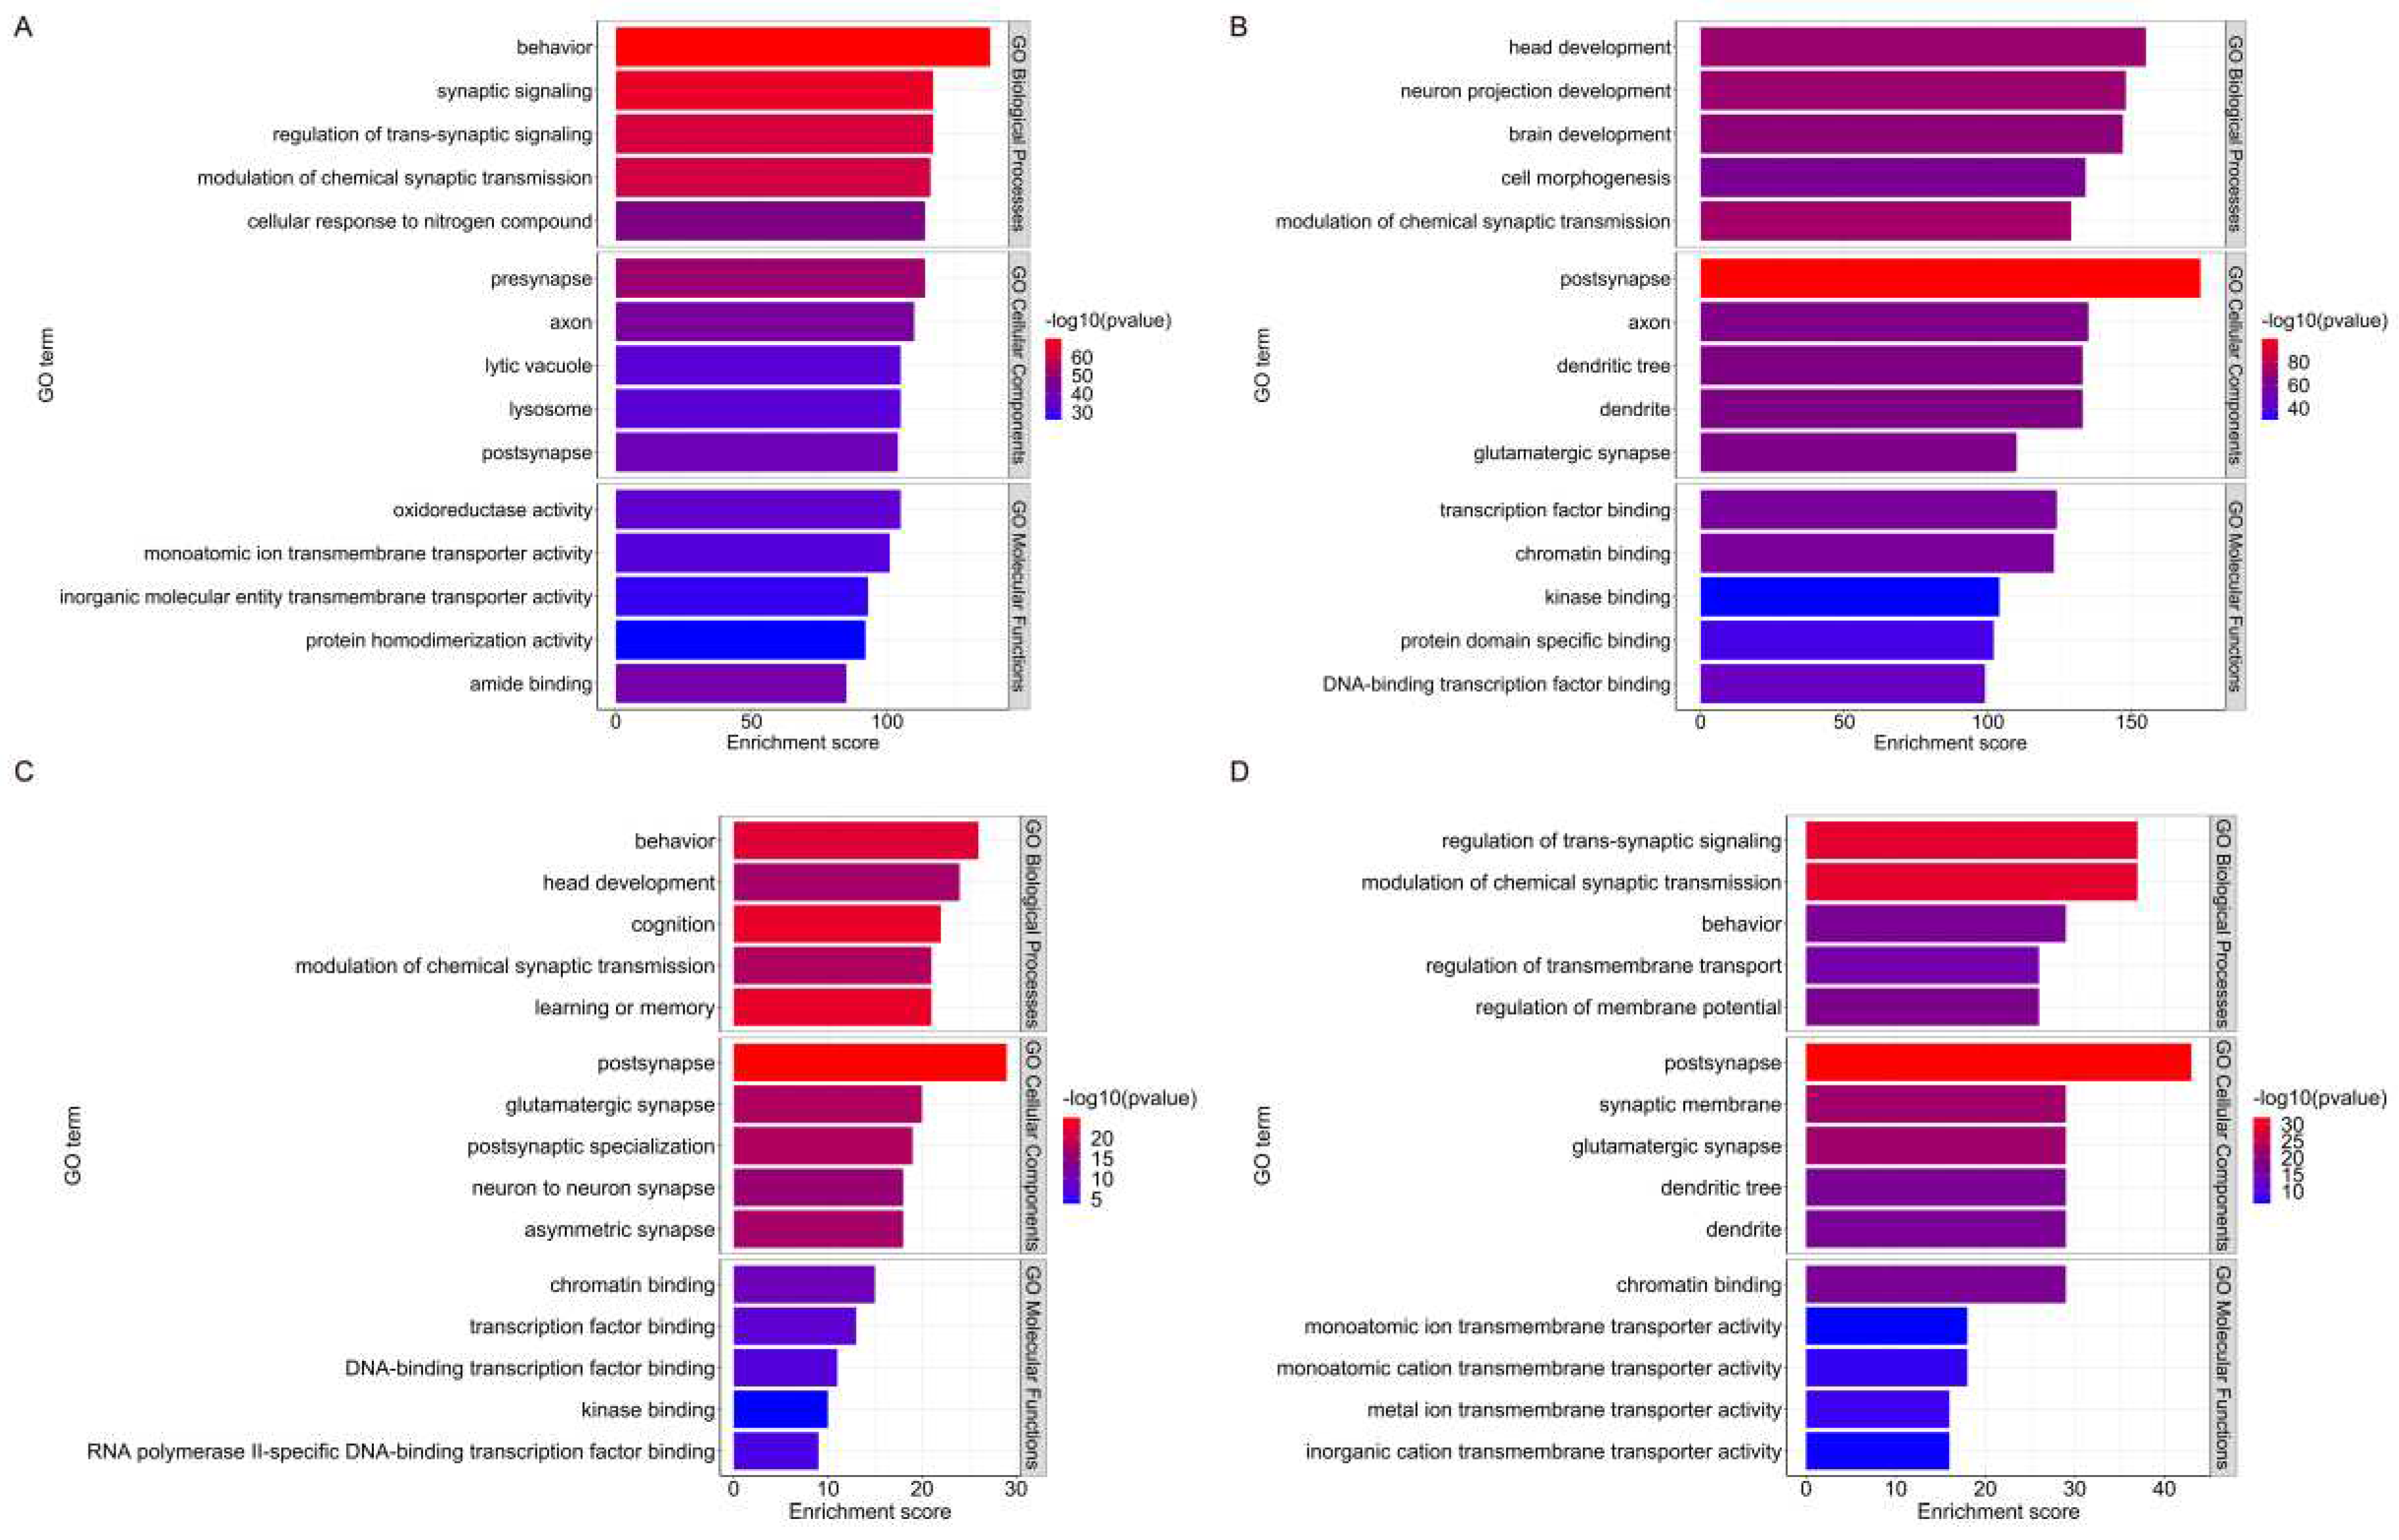
Figure 4.
For the Low Disorder and High Disorder datasets, a degree-based algorithm created protein interaction networks, mapped the top 10 Kyoto Encyclopedia of the Genome (KEGG) pathways, and displayed the top 50 protein networks. (A) Protein-protein interaction networks of the top 50 proteins in the LOW Disorder dataset, ranked in descending order of their degree scores. The colors represent different ranges of degree values, transitioning from red to orange to yellow. The inner circle depicts the top 10 proteins in clockwise order starting from ACTB. (B) Protein-protein interaction network between the top 50 proteins in the Highly Disordered Dataset, ordered as in. The inner circle depicts the top 10 proteins in clockwise order starting from TP53. (C) The top 10 KEGG pathways in the Low Disorder dataset were ranked according to the number of enriched genes. The size of the circle represents the number of genes enriched, and the closer to red color from blue to red color represents the more significant enrichment in that pathway (D) The top 10 KEGG pathways in the High Disorder dataset, ranked by the number of enriched genes. Circle and color mean the same as C.
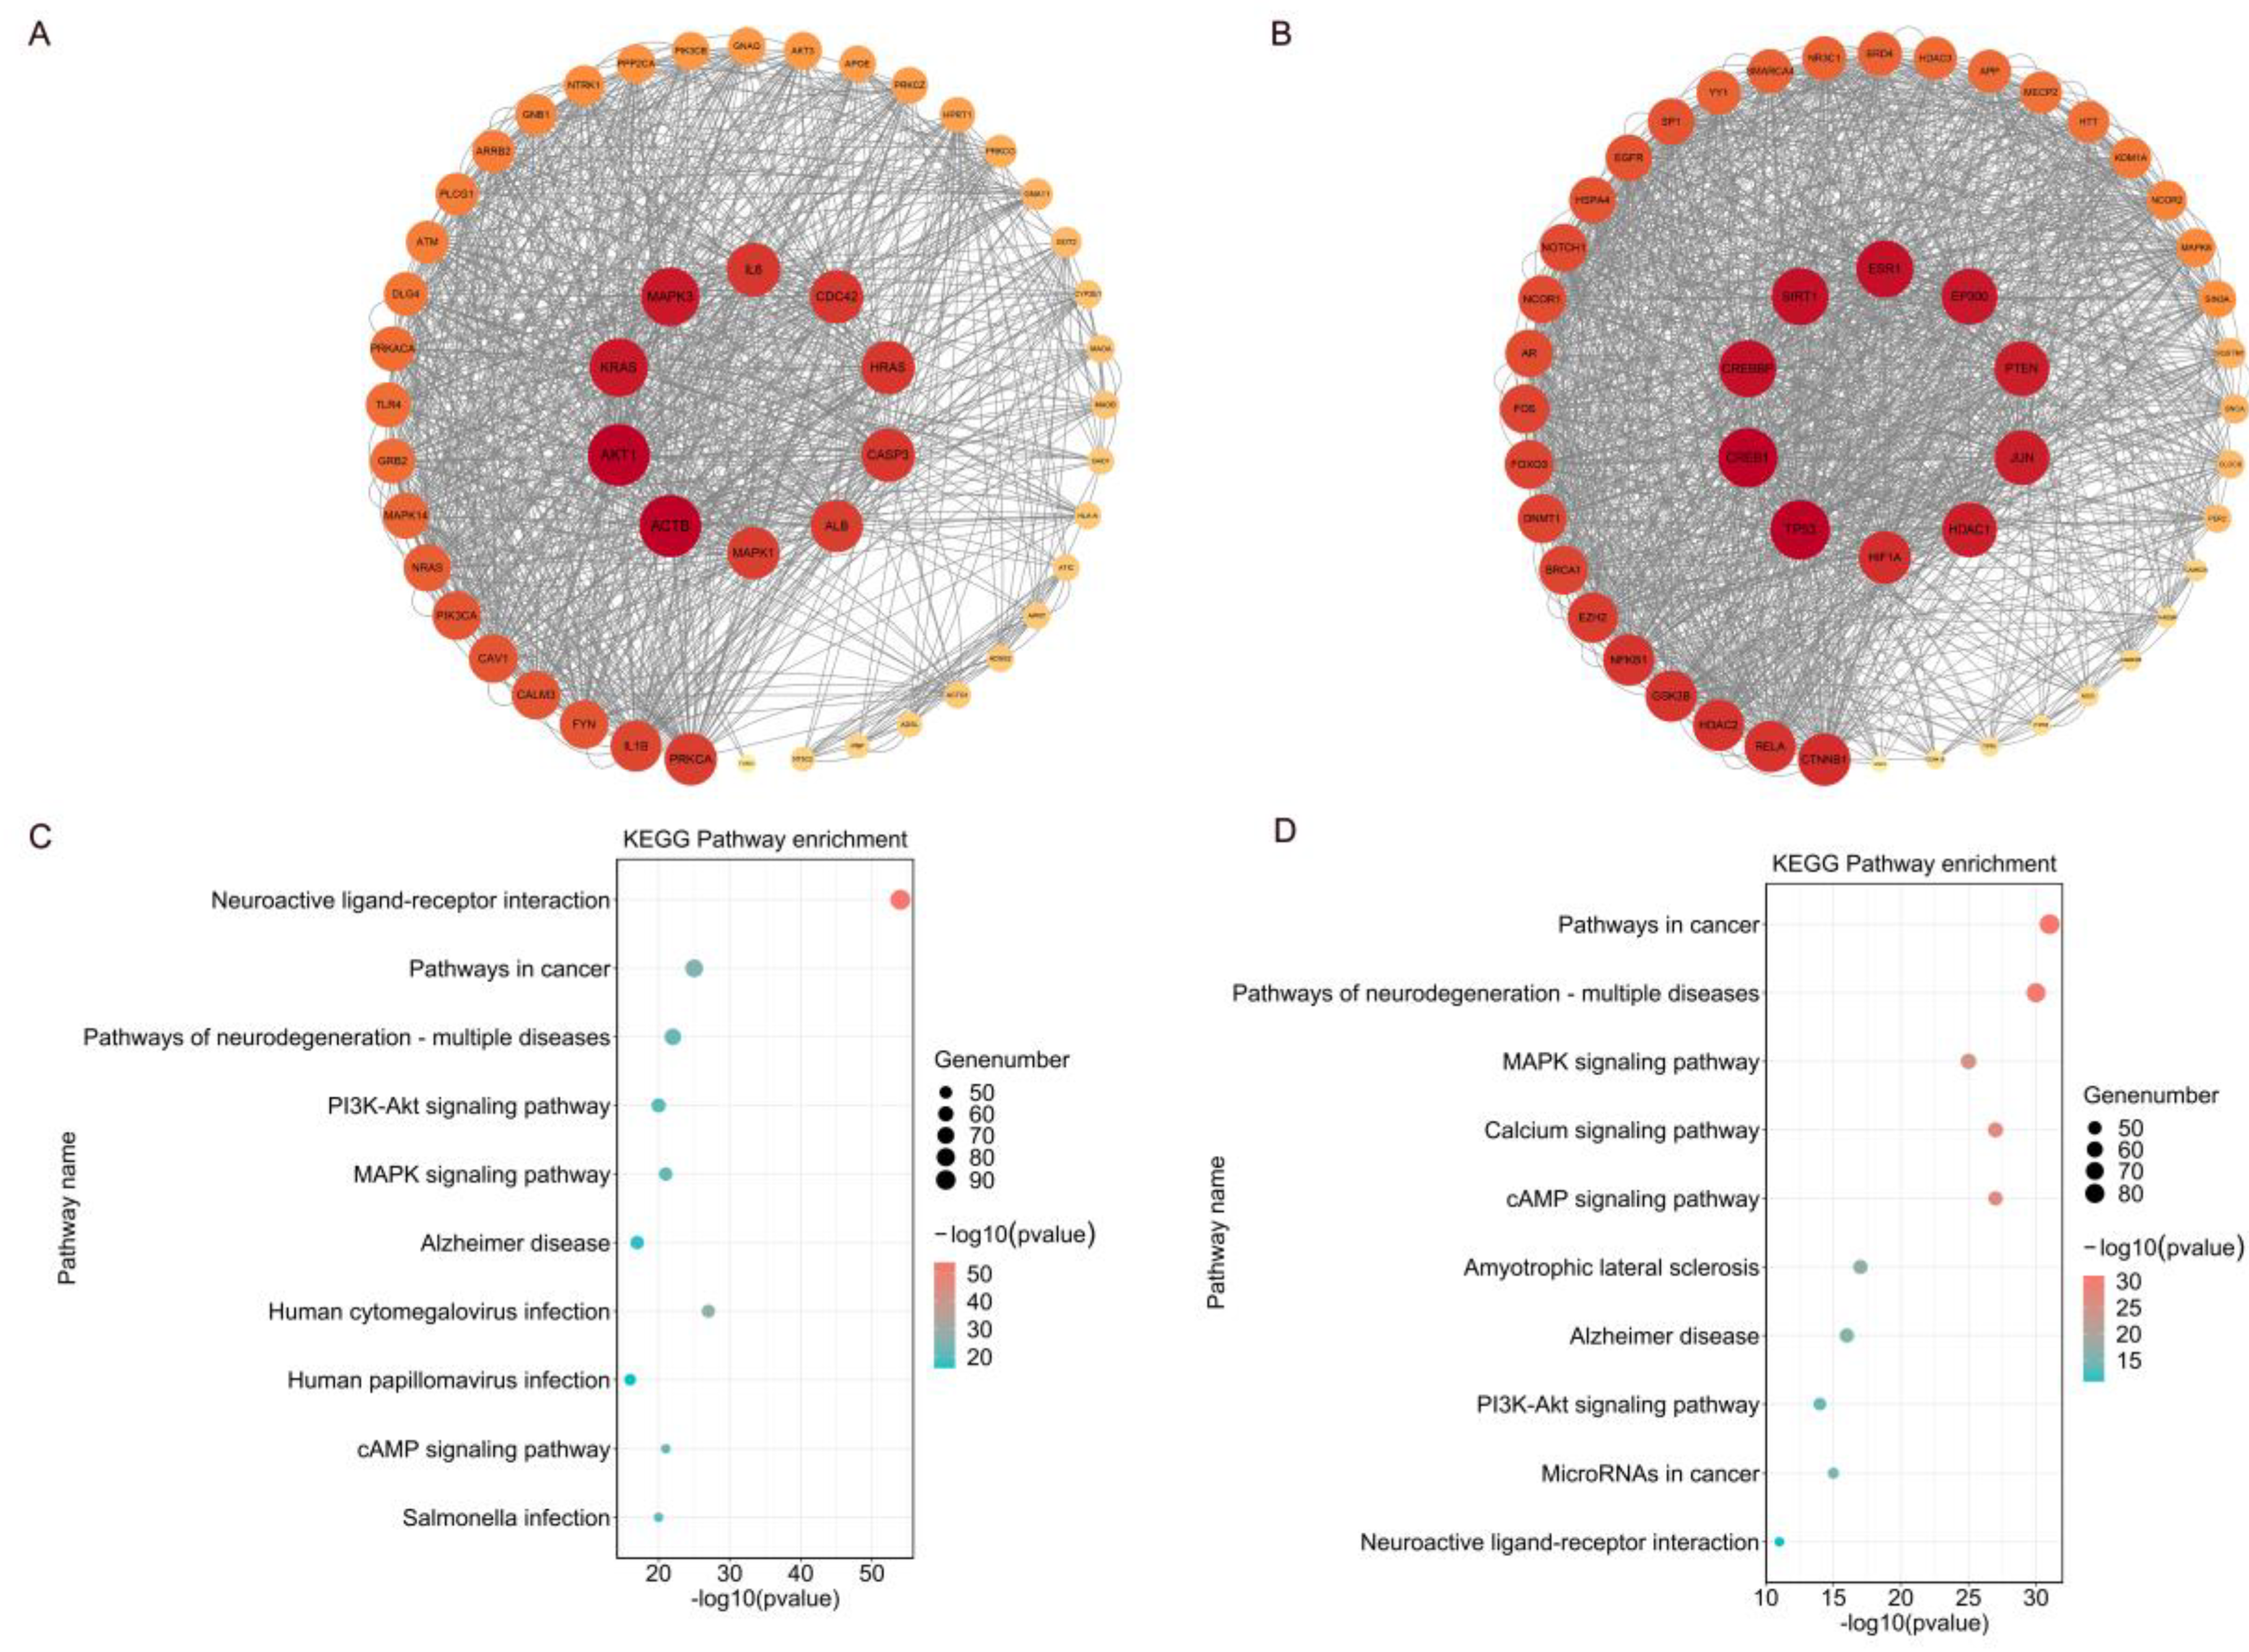
Figure 5.
Molecular docking results of the IDP alpha-synuclein and the structural protein Tubulin. The top left of the picture shows the 3D spatial structure of alpha-synuclein that we used for docking, and the top right of the picture shows the 3D spatial structure of the Tubulin (PDB:7S7J) that we used for docking. The results of our molecular docking are shown in the lower portion of the picture. We labeled the amino acids within 6 Å of the distance between the two proteins as possible interaction sites in PyMOL and showed the molecular structures of these amino acids.
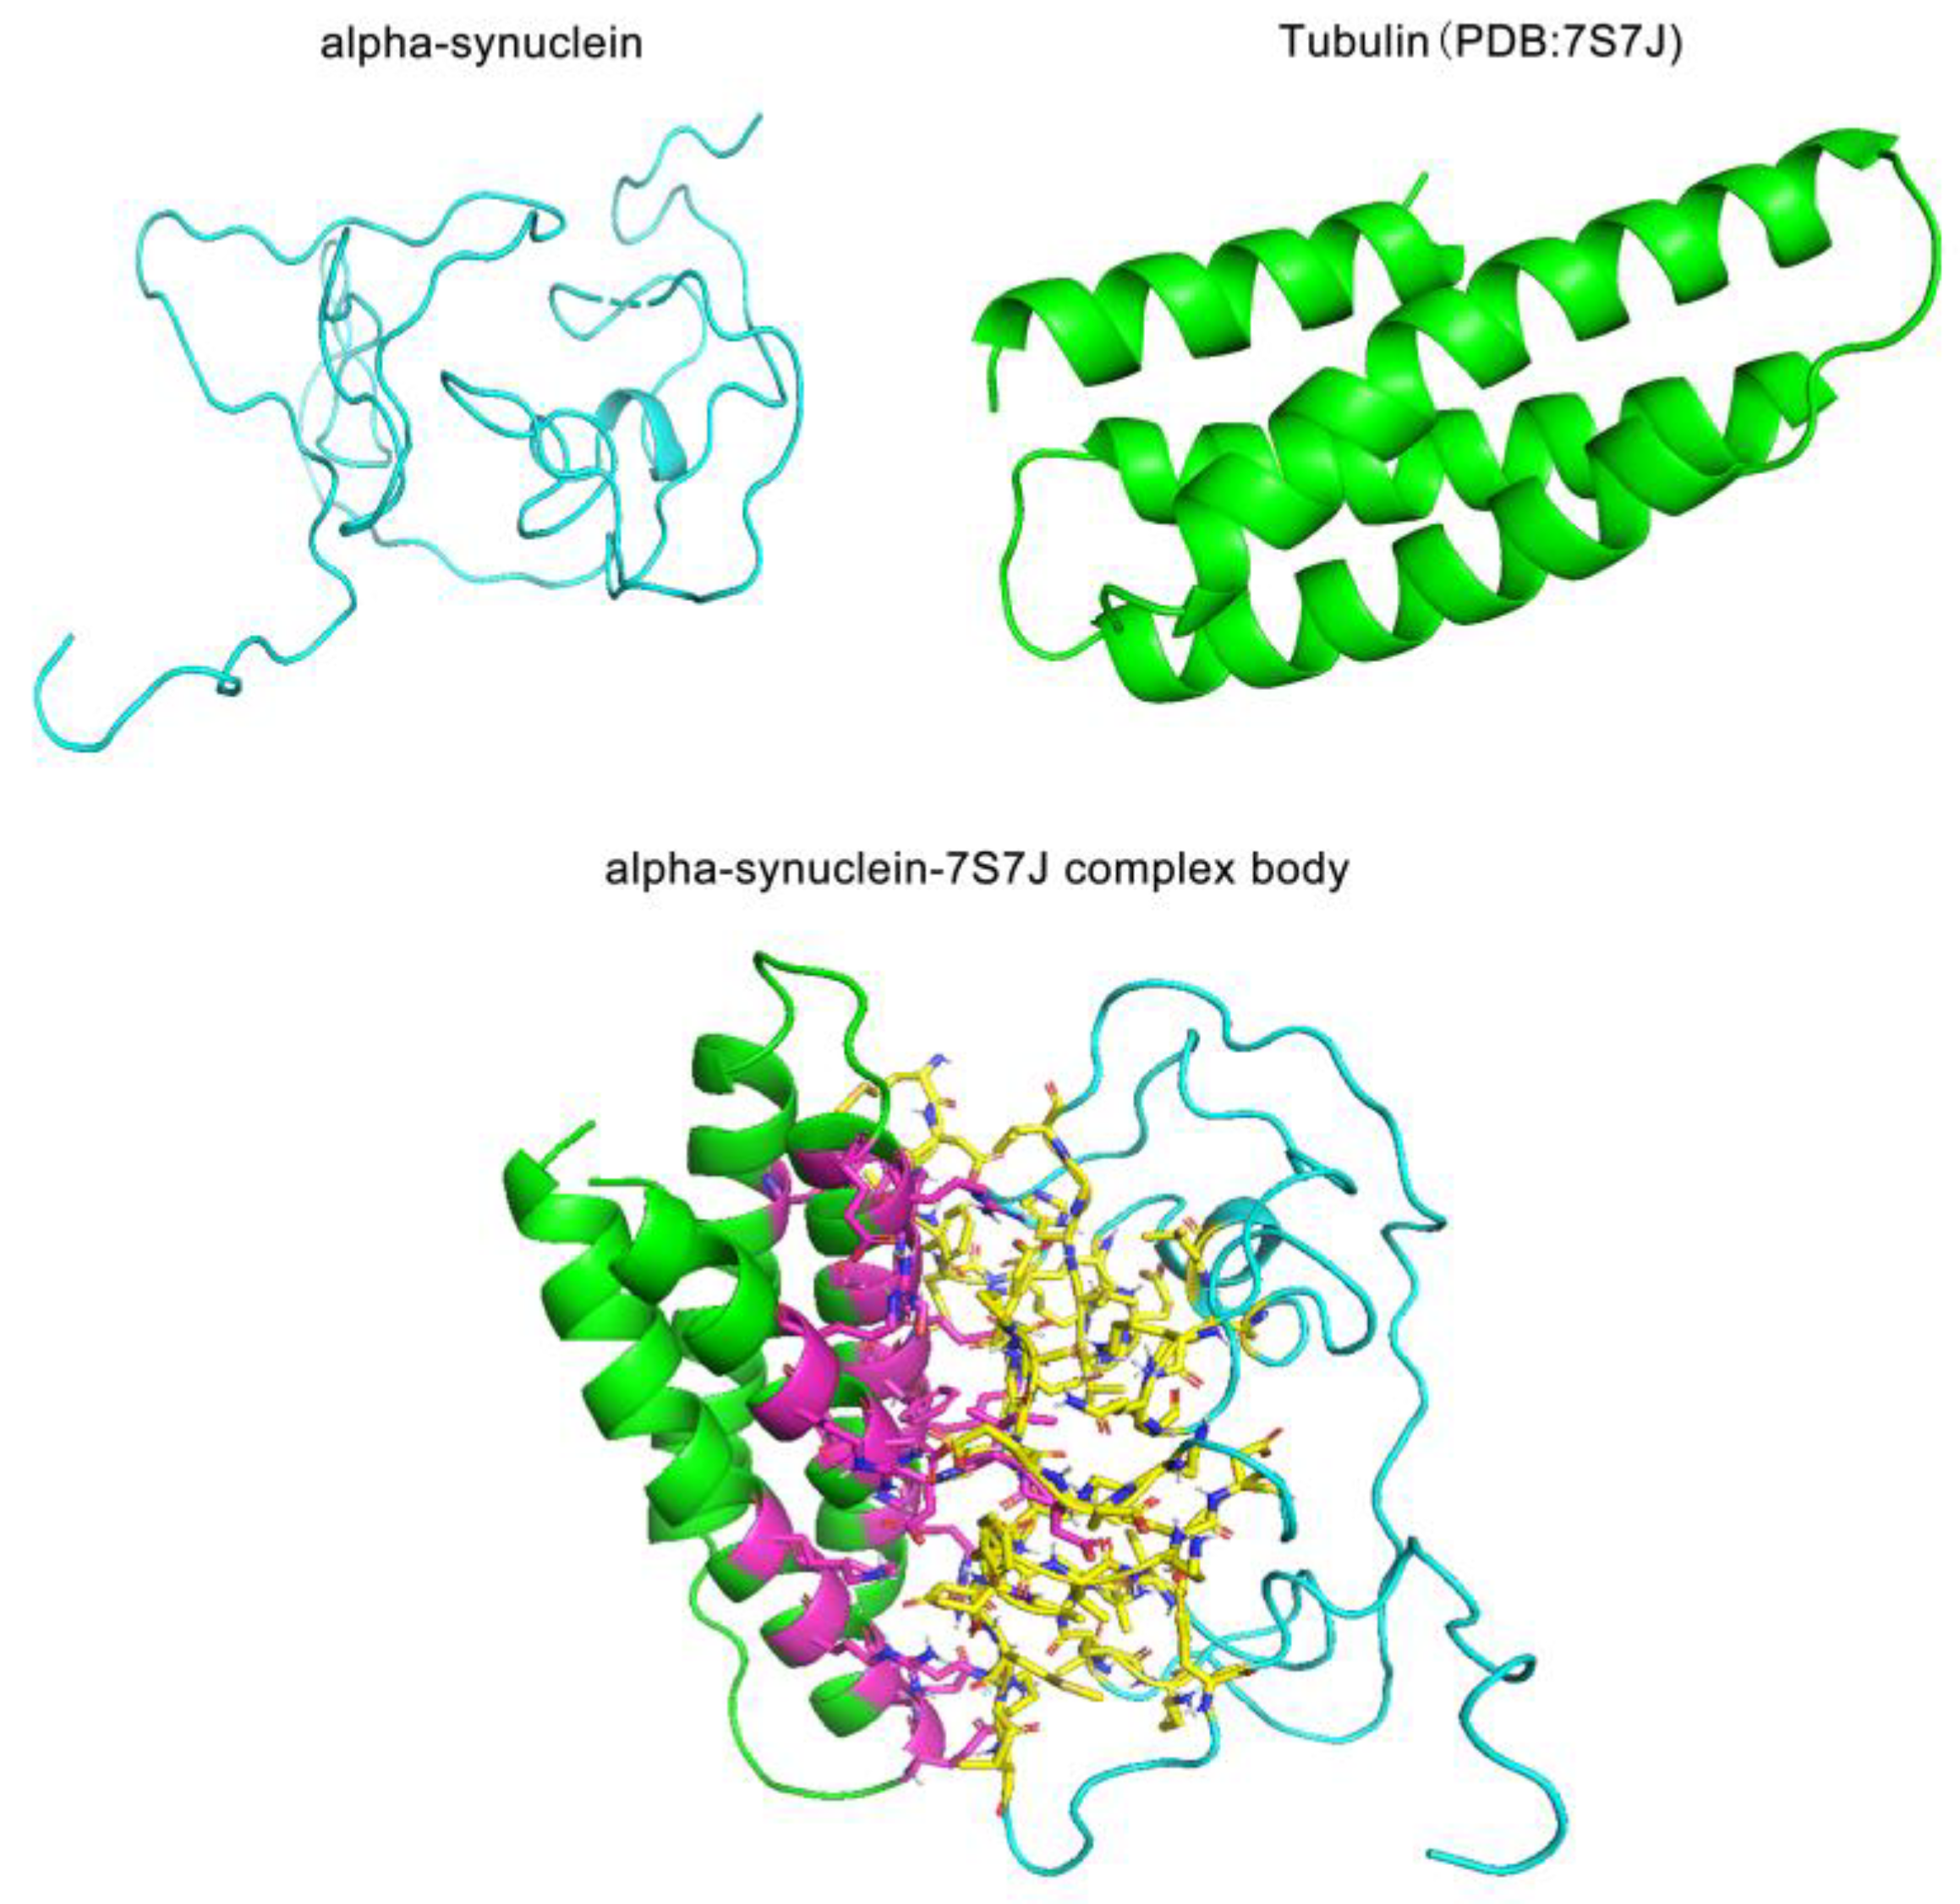
Figure 6.
Data processing.
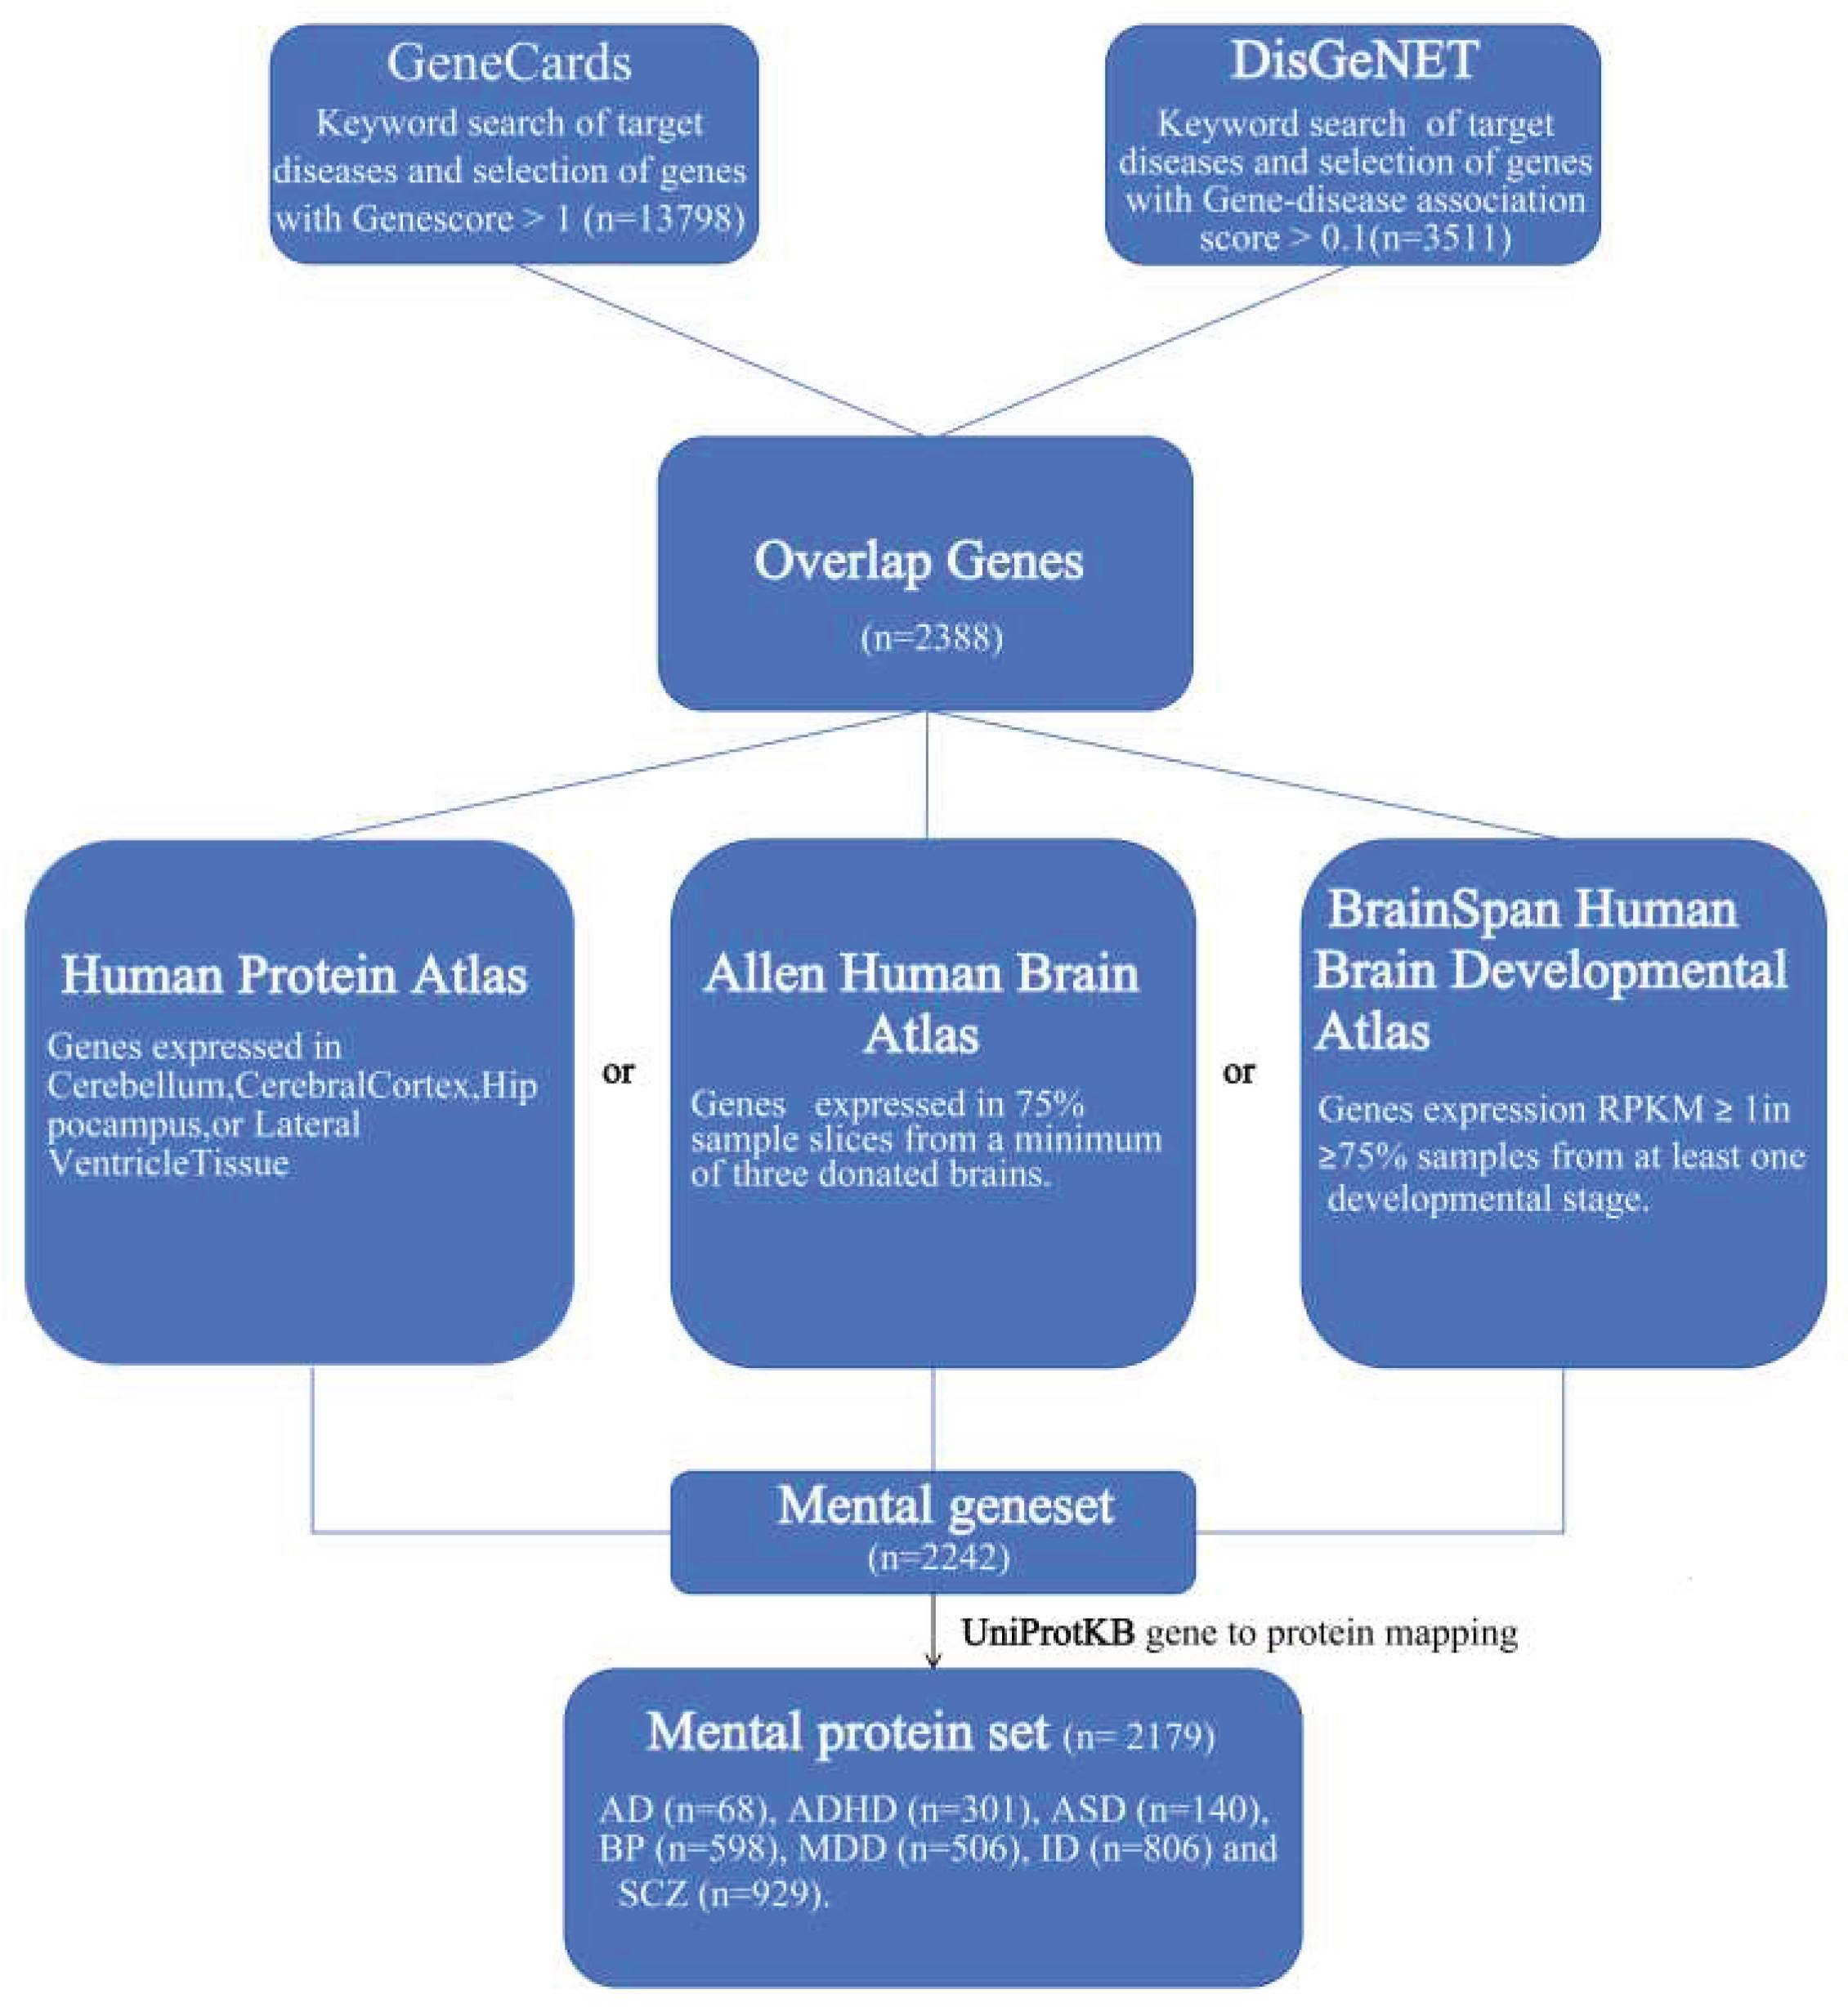
Table 1.
Top 15 proteins with the highest percentage of disordered residues in the MENTAL dataset.
| Protein name | Protein ID | Disease | Protein length(aa) | Amino acid residues predicted to be disordered, aa (%) | Longest disordered region (aa) | Function |
|---|---|---|---|---|---|---|
| Protein phosphatase 1 regulatory subunit 1B | PPR1B_HUMAN | BP/MDD/SCZ | 204 | 204(100) | 204 | Inhibitor of protein-phosphatase 1. |
| B-cell CLL/lymphoma 9 protein | BCL9_HUMAN | BP/SCZ | 1426 | 1421(99.65) | 532 | beta-catenin binding |
| Neuromodulin | NEUM_HUMAN | BP/MDD/SCZ | 238 | 235(98.74) | 235 | calmodulin binding |
| Complexin-2 | CPLX2_HUMAN | ADHD/BP/MDD/SCZ | 134 | 132(98.51) | 125 | calcium-dependent protein binding |
| Protein PRRC2A | PRC2A_HUMAN | SCZ | 2157 | 2078(96.34) | 1802 | RNA binding |
| Microtubule-associated protein 6 | MAP6_HUMAN | SCZ | 813 | 775(95.33) | 448 | calmodulin binding |
| Transcription factor 4 | ITF2_HUMAN | ADHD/BP/MDD/ID/SCZ | 667 | 635(95.20) | 255 | beta-catenin binding |
| Methyl-CpG-binding protein 2 | MECP2_HUMAN | AD/ADHD/ASD/BP/MDD/ID/SCZ | 486 | 460(94.65) | 269 | chromatin binding |
| Myelin basic protein | MBP_HUMAN | SCZ | 304 | 85(93.75) | 168 | calmodulin binding |
| TATA-binding protein-associated factor 2N | RBP56_HUMAN | MDD | 592 | 555(93.75) | 243 | DNA binding |
| Splicing factor, arginine/serine-rich 19 | SFR19_HUMAN | SCZ | 1312 | 1229(93.67) | 737 | protein domain specific binding |
| RNA-binding protein FUS | FUS_HUMAN | MDD | 526 | 490(93.16) | 293 | chromatin binding |
| Microtubule-associated protein tau | TAU_HUMAN | AD/MDD | 758 | 703(92.74) | 603 | actin binding |
| Neurosecretory protein VGF | VGF_HUMAN | BP/MDD/SCZ | 615 | 568(92.36) | 267 | growth factor activity |
| Stathmin | STMN1_HUMAN | MDD | 149 | 137(91.95) | 120 | tubulin binding |
AD, Anxiety Disorder; ADHD, Attention Deficit Hyperactivity Disorder; ASD, Autism Spectrum Disorder; BP, Bipolar Disorder; MDD, Major Depressive Disorder; ID, Intellectual Disability; SCZ, Schizophrenia.
Disclaimer/Publisher’s Note: The statements, opinions and data contained in all publications are solely those of the individual author(s) and contributor(s) and not of MDPI and/or the editor(s). MDPI and/or the editor(s) disclaim responsibility for any injury to people or property resulting from any ideas, methods, instructions or products referred to in the content. |
© 2024 by the authors. Licensee MDPI, Basel, Switzerland. This article is an open access article distributed under the terms and conditions of the Creative Commons Attribution (CC BY) license (http://creativecommons.org/licenses/by/4.0/).
Copyright: This open access article is published under a Creative Commons CC BY 4.0 license, which permit the free download, distribution, and reuse, provided that the author and preprint are cited in any reuse.


