
Submitted:
06 February 2024
Posted:
08 February 2024
You are already at the latest version
Abstract
Machine performance modeling and optimization have emerged as crucial steps for process enhancement and efficiency. This study explored machine learning to model and optimize the cassava grating chamber of cassava grater for the quality production of gari. This domain remains unexplored thus far. A total of 196 graters were studied. Key variables studied included tooth diameter (TD), tooth height (TH), inter-tooth spacing (ITS), drum speed (DS), clearance (C), and moisture content of cassava (MC). Geometric mean diameter (GMD) represented mash quality. Feature importance rankings emphasized TH (0.488784), C (0.243284), TD (0.112682), ITS (0.103547), DS (0.036261), and MC (0.015442) in determining particle size (GMD) of grated mash. Machine learning models efficiently interpreted these attributes, including gradient boost regressor, linear regression, neural network, and random forest. The gradient boost regressor was the best predictive model, achieving 95.34% accuracy, RMSE (0.3291), and MAE (0.2303). The study provides a GMD predictive equation and optimized parameters for specific gari size production, offering valuable insights for tailored machinery in the cassava grating activity.
Keywords:
machine learning prediction
; cassava grating
; performance modeling
; mash quality
1. Introduction
Cassava, a staple crop of paramount importance, undoubtedly holds immense potential in addressing contemporary global challenges, particularly food security-related. Its significance extends beyond its role as a valuable source of calories and income for small-scale farmers and processors [1]. Cassava also offers solutions to the complex problems posed by climate variability, resource constraints, and diverse nutritional requirements, and also serves as a raw material across various industries [2,3,4].
Cassava processing is a fundamental stage in the journey from harvest to the eventual consumption of semi-finished or finished products because of its perishability [5,6,7]. To reduce post-harvest physiological deterioration (PPD) in cassava roots, it is imperative to process them into dry, shelf-stable edible forms [8]. Cassava processing has its challenges. One critical aspect significantly impacting the quality of the final product [9], especially within the context of local Ghanaian cuisines, is the grating or size reduction process. Almost all cassava processing activities require that cassava be grated. Grating is a size reduction activity performed by cassava graters that transform cassava roots into a mash or pulp for subsequent processing into various delicacies such as gari, agbelima, and akyeke [10].
However, locally fabricated cassava graters designed for grating cassava tubers still confront many challenges, as highlighted by [11,12,13,14]. Cassava graters have suffered from a lack of innovation and modernization. Their designs have remained unchanged, with the traditional manually operated graters dominating small-scale processing units. Outdated cassava grater designs give rise to a series of challenges, highlighted in Figure 1.
The evolution of cassava graters, from traditional pounding in a mortar with a pestle to modern motorized graters, reflects a continuous quest for efficiency and improved performance in cassava processing. While these advancements have undoubtedly enhanced cassava processing capabilities, recent years have seen an even more profound exploration of design improvements. Researchers have made commendable efforts in designing various cassava graters, focusing on enhancing efficiency, capacity, and overall machine performance. These research endeavors primarily employ traditional engineering methodologies, which involve sizing various components of the cassava grater, such as the hopper, shaft, discharge chute, and rotary drum. While these approaches have yielded valuable insights and tangible improvements in cassava grater design, they have remained mainly within the confines of conventional mechanical engineering principles.
However, there is an emerging recognition that optimizing specific components of the cassava grater is a step in the right direction, particularly in an era characterized by the relentless pursuit of efficiency and resource optimization to address the above-mentioned challenges. This recognition is exemplified by [15] innovative approaches to cassava grater design. These innovators have recognized that optimizing specific components, such as the contact plate, can yield significant enhancements in efficiency and quality within the cassava grating activity. This profound realization underscores the importance of targeted improvements within the machinery to elevate performance standards.
Building upon this recognition, the integration of machine learning-driven optimization emerges as the logical next step in this evolutionary journey. With its data-driven precision and adaptability, machine learning offers a transformative approach to cassava grater design. By harnessing the power of advanced algorithms and real-time data analysis, it has the potential to unlock unprecedented levels of efficiency, consistency, and sustainability in cassava processing, ultimately redefining the industry’s standards and capabilities.
Machine learning has various applications in the food processing industry. It can be used to predict the micronutrient profile in cooked food from raw food composition, improving precision and generality [16]. Machine learning algorithms can accurately predict the degree of processing for any food, indicating that a significant portion of the US food supply is ultra-processed [17]. Additionally, machine learning can enhance demand forecasting accuracy in the food industry, leading to better supply chain management [18]. ML-based approaches can optimize process parameters and kinetics, reducing energy consumption and ensuring better-quality products in various food processing operations [19]. Furthermore, industrial automation based on artificial intelligence (AI) and machine learning can improve the efficiency and safety of food production and delivery processes, reducing human error and enhancing operational competence [20].
This study, therefore, seeks to leverage machine learning techniques to optimize the design parameters of the grating chamber of a cassava grater system to improve cassava mash quality in accordance with ASAE standards.
2. Materials and Methods
2.1. Overview of Approach
This study on cassava graters integrates fundamental steps crucial for performance optimization. The approach as outlined in Figure 2 begins by first establishing the dependent and independent variables, leveraging an extensive literature review and expert insights to establish key variables impacting cassava grater mash quality taken as geometric mean diameter (GMD). This was followed by a comprehensive study of different cassava graters focusing on the grating chamber variables, tooth height (TH), tooth diameter (TD), inter-tooth spacing (ITS), drum speed (DS), clearance (C), and the moisture content (MC) of cassava to be grated.
The influence of these variables on the resulting cassava mash (GMD) is studied. GMD of each sample collected from the surveyed graters is calculated using sieve analysis. Subsequently, descriptive statistics and performance modeling utilizing machine learning algorithms were deployed allowing for an understanding of the variable relationships. The models are evaluated based on accuracy, RMSE, and MAE criteria. The ultimate aim lies in optimizing these models to obtain optimum parameters of the studied variables that meet ASAE standards for gari mash quality, ensuring improved cassava grater performance aligned with industry benchmarks.
2.2. Description of a Cassava Grater and the Grating Process)
A cassava grater (Figure 3A) is a mechanical device used to process cassava, a starchy tuberous root crop, into smaller granules or finer particles. It’s designed specifically to grate or shred cassava into various sizes depending on the intended use. In the cassava grating process (Figure 3B), tubers are loaded into the top hopper of the machine. The grating process is initiated by the electric motor or engine, which drives the rotation of the grating barrels or rotary drum (Figure 3C). As these drums rotate, the rasping blades (Figure 3D) on their surfaces efficiently grate the cassava, producing fine particles. The grated material is then guided through the discharge chute, facilitated by the force of gravity, into a container placed underneath it.
2.3. Establishment of Variables and Performance Parameters
The synergy of studied literature and expert insight is pivotal in the determination of grating chamber design variables and performance parameters. It ensures that the identified variables are not only theoretically relevant but also practically applicable. This holistic approach to knowledge acquisition laid the groundwork for subsequent phases of the research, including data collection, analysis, and optimization. After extensive research and expert insight, six (6) independent and one (1) dependent variable was selected as shown in Table 1.
2.4. Study Area
Data collection was conducted in the five major cassava processing regions in Ghana, known for their significant cassava production and processing activities as shown in Figure 4. Specifically, the research targeted two prominent cassava processing centers/clusters in each of these regions. This strategic approach ensured that data was gathered from a diverse range of processing contexts and regions, providing a comprehensive representation of cassava grater chamber designs and performance across Ghana.
2.5. Data Collection Procedure
Data collection was done in the following steps:
- Clean the cassava grater thoroughly to remove any contaminants.
- Measure and record all independent variables, excluding DS.
- Weigh a specific amount of cassava and pour it into the grater’s hopper.
- Start grating and record the DS after 30 seconds.
- Stop the grater when no cassava mash is discharged from the chute.
- Extract a sample of the grated cassava mash for subsequent sieve analysis to determine the GMD of mash from a specific grater.
2.6. Particle Size Sieve Analysis for GMD
Particle size is defined as the mean diameter of individual particles of a sample or the fineness of the grind of the sample. Initially, particle size was generally defined in terms of ‘fine, medium, and coarse’ which prevented meaningful discussions and comparison of data. These limitations were addressed in 1983 by the American Society of Agricultural and Biological Engineers (ASABE) by developing procedures that are more precise and specific. These include quantifying particle size in terms of geometric mean diameter (GMD), which is expressed in millimeters (mm) or microns (µm) [21]. Procedures for calculating and expressing particle size distribution come in different forms and a critical selection must be made among these available procedures. Common procedures available are dry and wet sieving [22]. Under both methods particles of a given sample are put into a size classification which aids in determining its average mass as it is retained on each level of sampling sieve size preferred for the sample under study [23]. In this study, dry sieving was used.
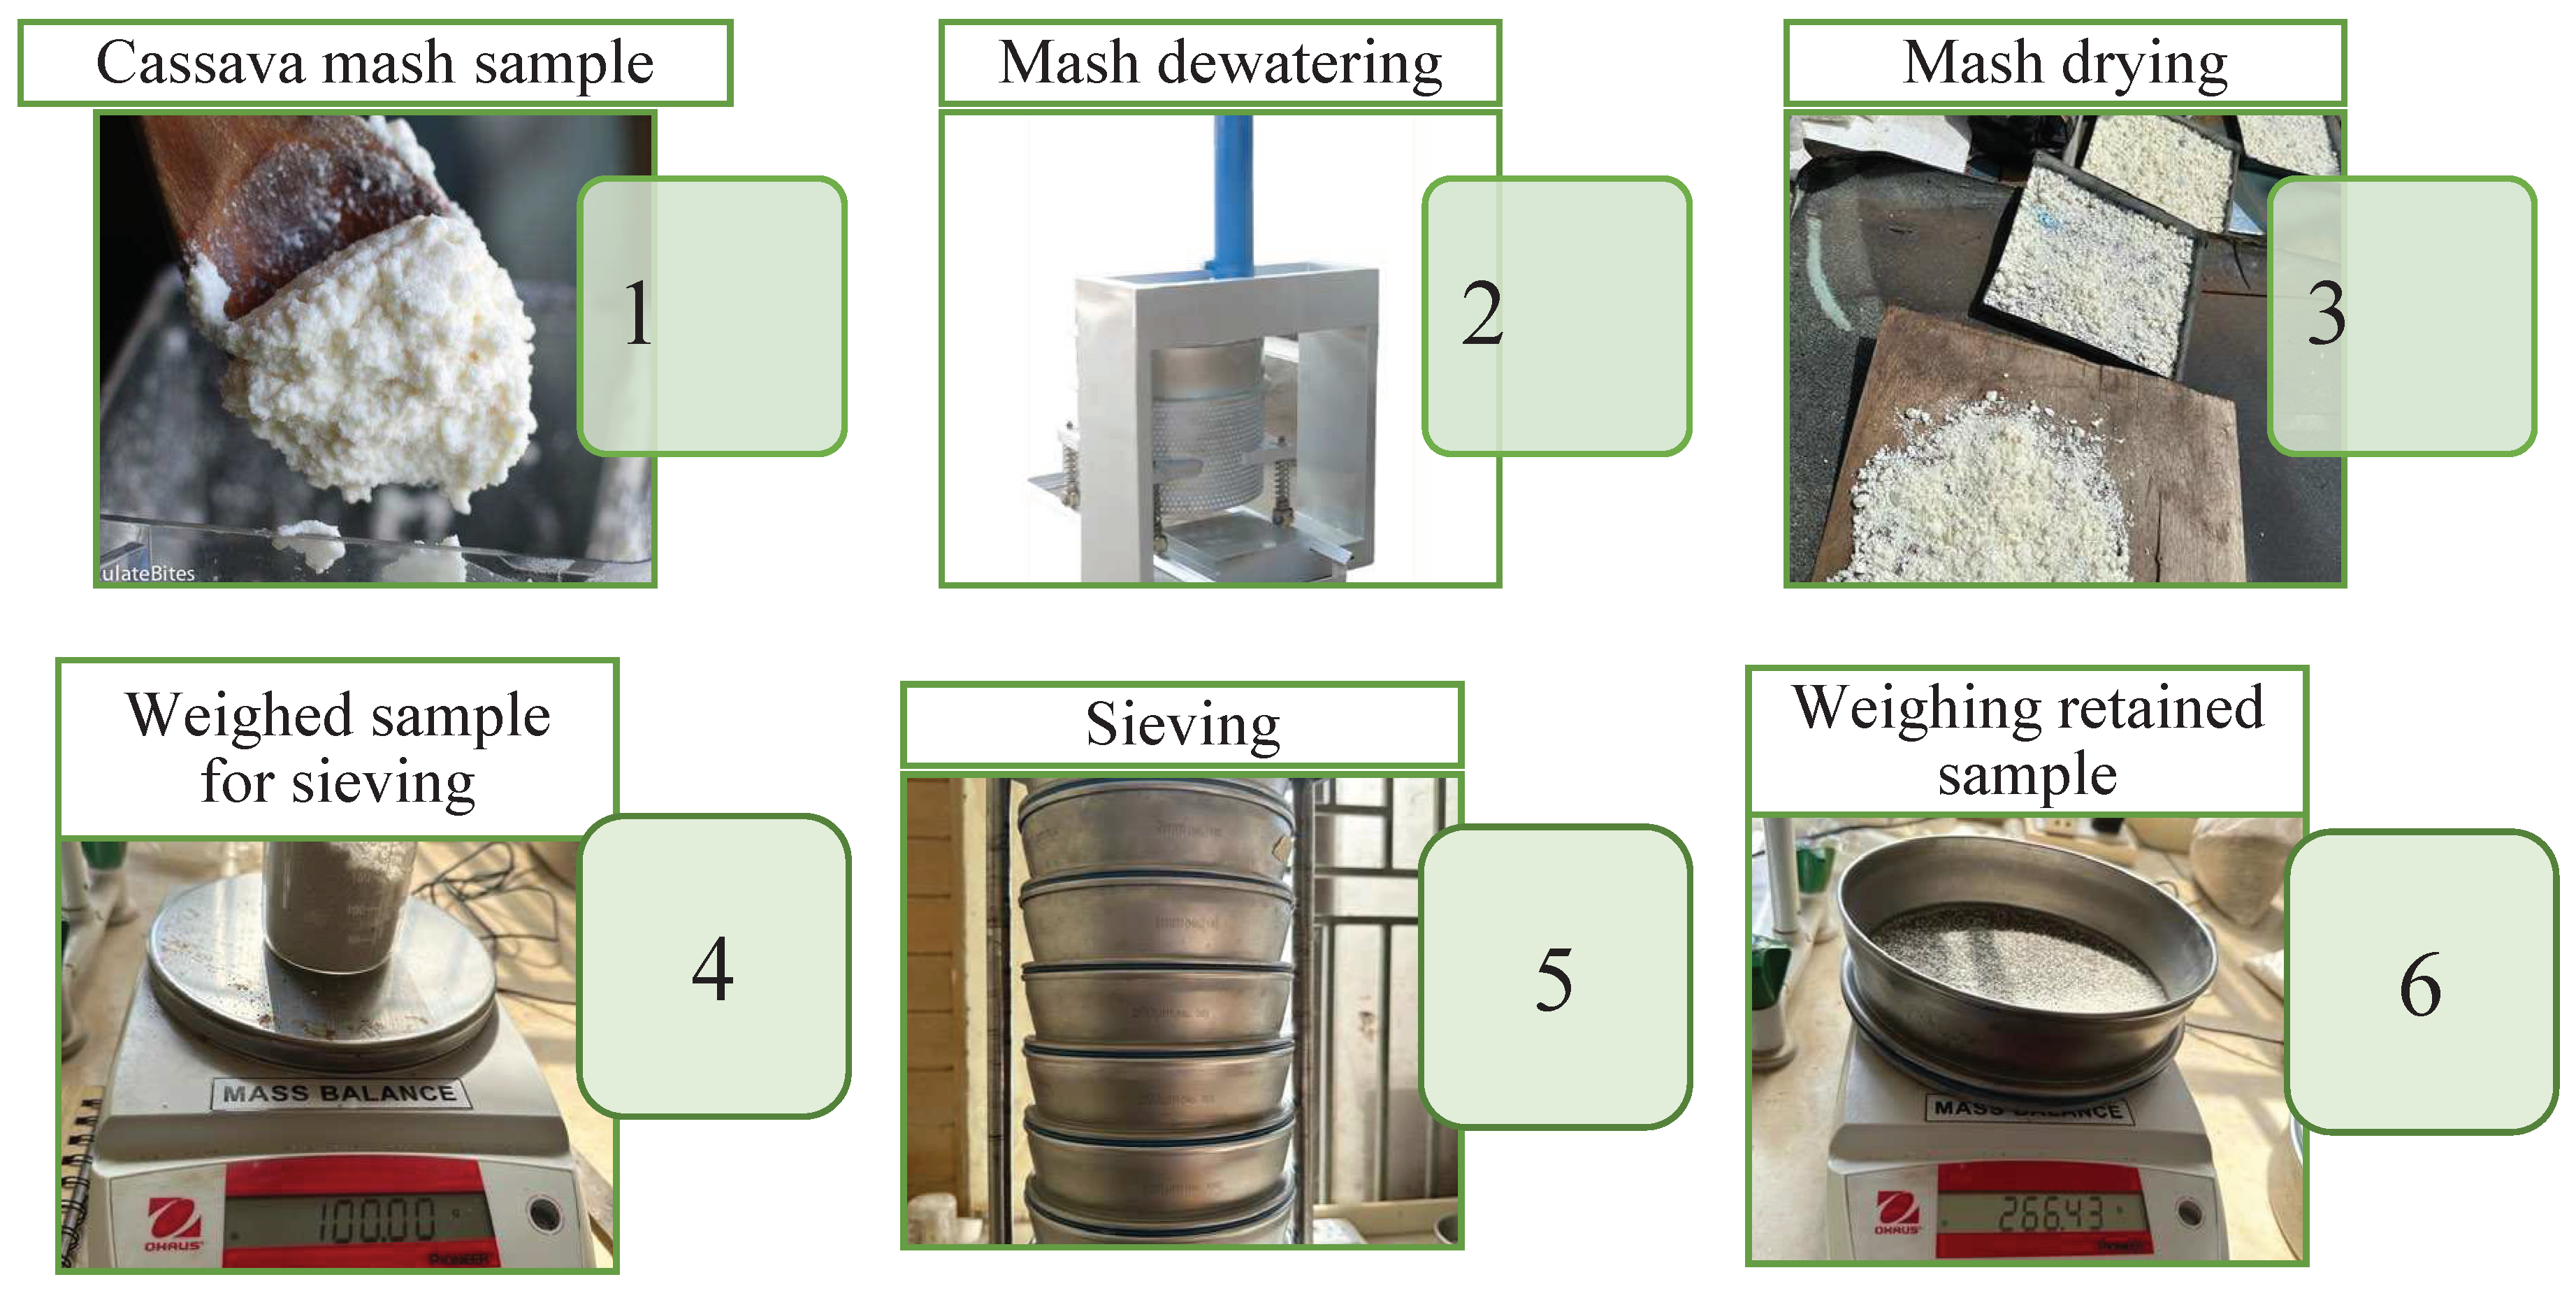
2.6.1. Dry Sieving
In this study, dry sieving was conducted using a retch sieve shaker with standard sieve sizes and a pan, following the ANSI/ASAE S319.5 method for determining and expressing particle sizes. The process as illustrated in Figure 5 involved dewatering, drying, and sieving 100-gram samples of collected mash through a set of sieves with openings at 4000, 2000, 1000, 500, 250, 125, 63, and a pan. The weight of the material retained on each sieve was measured. The GMD was then calculated based on this data with the formula;
Where,
is nominal sieve aperture size of the sieve, mm
is nominal sieve aperture size in next larger than sieve (just above in a set), mm
is geometric mean diameter or median size of particles by mass, mm, or is geometric mean diameter or median size of particles on sieve, mm, or is , which is .
Figure 5.
Sieve analysis procedure.
2.7. Data Preprocessing and Cleaning
After calculating the GMD of all 235 samples, the data was pre-processed. Missing values in the dataset were addressed through a combination of techniques. Missing values were imputed using appropriate statistical measures such as mean, median, or mode. Outliers, which can significantly impact the accuracy of regression models, were identified, and addressed. Techniques like Z-score analysis and Tukey’s fences were employed to detect outliers in numerical parameters. Once identified, outliers were either transformed to a more reasonable value or, in some cases, removed from the dataset.
2.8. Description of Data Set
Descriptive statistics serve as the preliminary step in the data analysis. This involved calculating and interpreting measures such as mean, median, mode, variance, standard deviation, and range [24,25]. In this study, it provided insights into the central tendency, dispersion, and shape of the data distribution. These statistical metrics offered a quick overview, revealing patterns, outliers, and the overall nature of the data collected. It was a crucial step in this study that helped understand the dataset before advanced analyses, which guided the research in identifying trends and making informed decisions regarding subsequent analytical approaches [26,27,28].
2.9. Feature Importance and Correlation Analysis
Feature importance and correlation analysis are crucial in machine learning for understanding the relevance of variables and the relationships between them [29,30,31].
In this study, a heat map was used for the visual representation, employing color-coded cells to depict correlations and level of correlation among studied variables [32]. It helped in identifying redundant or highly correlated features, which aided in feature selection and addressed multicollinearity issues in regression models. On the other hand, feature importance helped to quantify the impact of each variable on predictive models. Its generated scores prioritized features based on their influence on model predictions, guiding feature selection and enhancing the model’s interpretability [33]. Combining both approaches allowed for a comprehensive understanding of variable relationships, aiding in effective feature selection and improving the overall performance of machine learning models [34].
2.10. Algorithm Exploration
A comprehensive exploration of machine learning algorithms was employed for the optimization of the cassava grater chamber parameters in this study. To select the most suitable approach, the focus was on algorithms capable of handling continuous numerical values, aligning to enhance specific grater parameters. Regression-based methods, including linear regression, random forest, gradient boost regressor, and neural network regressor, were chosen after careful evaluation due to their compatibility with optimizing grating speed, tooth configuration, and other measurable variables. According to [35,36], linear regression is a foundational statistical method used to understand the relationship between dependent and independent variables by fitting a linear equation to observed data. By providing insights into the direction and strength of relationships, linear regression enables the identification and prediction of outcomes based on continuous variables. Random Forest is an ensemble learning method used for regression and task classification. It builds multiple decision trees during training and combines their predictions to obtain the final result. This technique is particularly effective in handling large datasets, maintaining accuracy, and mitigating overfitting. By leveraging the collective wisdom of multiple trees, Random Forest provides a robust and versatile approach to machine learning. According to [37], this technique is particularly effective in handling large datasets, maintaining accuracy, and mitigating overfitting. The Gradient Boost Regressor is another ensemble technique that builds predictive models in a sequential manner, where each model corrects errors made by its predecessor. [38] report of how this iterative process results in boosted performance, often achieving higher accuracy in predicting outcomes by combining multiple weaker models.
2.11. Data Splitting
The dataset was carefully split into three subsets—training, validation, and test sets—to support the machine learning optimization process. The training set, accounting for 70% of the data, was used to train the regression models, enabling them to connect the relationships between the cassava grater parameters and performance metrics. About 15% of the data constituted the validation set which is critical for model evaluation and fine-tuning during training. This subset monitored model performance on unseen data and helped adjust hyperparameters. The remaining 15% formed the independent test set, ensuring the models were evaluated on entirely new instances. This approach allowed a comprehensive evaluation of the model’s ability to generalize and predict optimal cassava grater chamber parameters while preventing overfitting. The splitting ratios maintained a balance between model development and robust evaluation, while random splitting maintained the dataset’s inherent distribution across subsets, minimizing biases in model assessment.
2.12. Testing and Generalization
To assess the generalization ability of the final models, they were rigorously tested on a separate and previously unseen test dataset. This testing phase ensured that the models could make accurate predictions beyond the data they were trained on. By evaluating the models on unseen instances, their robustness and reliability in predicting optimal cassava grater chamber parameters were thoroughly examined.
2.13. Optimized Parameter Generation
The culmination of the model development process led to the generation of optimized parameter configurations for cassava grater chambers to meet the ASAE standard for one cassava product, gari through the analysis of response surface plots and generated prediction model. These optimized parameters have significant implications for grater design, as they offer insights into how to enhance grating efficiency, throughput capacity, and mash quality.
2.14. Tools and Software Utilized
The research utilized a combination of tools and programming languages to carry out data analysis, modeling, and optimization. The primary tools and software used include Anaconda, Python, and Jupyter Notebook. Anaconda, a popular data science platform, provided a comprehensive environment for managing Python libraries and packages. Python programming language known for its extensive libraries and data analysis capabilities [39], served as the core programming language for the research. It allowed for efficient data manipulation, statistical analysis, and the implementation of machine learning algorithms. Python’s readability and flexibility made it an ideal choice for working with complex datasets and conducting optimization tasks. Jupyter Notebook was employed as the interactive computing environment for the research. It facilitated the creation of interactive documents containing live code, equations, visualizations, and narrative text [40]. According to [41], Jupyter Notebook’s user-friendly interface enables researchers to develop and present their work in an organized and accessible manner.
2.15. Data Analysis and Machine Learning
This study leveraged several libraries in Python for data analysis and machine learning. A screenshot of key libraries utilized in Python is presented in Figure 6.
3. Results and Discussion
3.1. Disparities in Grater Chamber Attributes
From a dataset of 196 cassava grater chambers examined from across various machines in the study areas, the extensive range of unique values (Figure 7) in both dependent and independent variables signals a wide spectrum of measurements and characteristics. This diversity within the dataset underlines a significant issue: the absence of standardization among cassava grater machines in Ghana. The varying attributes observed across these grater chambers highlight potential differences in design, manufacturing, or operational parameters, pointing towards a lack of uniformity in these machines within the Ghanaian context. This disparity poses substantial challenges for consistent analysis and evaluation, limiting comparability and broader insights into cassava grater functionalities within the country.
3.2. Relationship between Independent Variables and GMD
Figure 8 highlights the observed relationship between GMD and various independent variables, showing positive or negative trends and the relative strength of these relationships. The plot of GMD against TD illustrates a positive correlation, indicating an increase in GMD as TD rises. Similarly, a positive trend is seen between GMD and TH, along with C. Contrary to this, a negative correlation becomes evident in the GMD plot against DS, signifying a decrease in GMD with higher DS values. There were also relatively weak correlations observed in the plots involving ITS and MC with GMD, suggesting a limited influence of these variables on GMD.
3.3. Distribution of Measured Parameters
The distribution of studied variables was analyzed using a histogram as shown in Figure 9. The histogram of various parameters of cassava grater output revealed substantial variability in GMD, TD, ITS, DS, and C. The histogram of GMD exhibits densities ranging from 0.0085 to 0.2735, with a wide GMD range of 0.28 to 6.48 and modes at 1.12, 4.97, and 5.16, reflecting prevalent sizes and potential uniformity challenges. TD ranged from 1 to 5.5, emphasizing variability with a variance of 1.05164 and modes at 4.3 and 4.5. The results on TH depicted diverse occurrences, with ranges from 0.375 to 3.125, and a mean of 1.939, suggesting moderate variability. The ITS shows varied occurrences across intervals, presenting a mean of 10.24 and a standard deviation of 4.684, signifying moderate variability. The DS exhibited densities from 0.0000512821 to 0.00169231, emphasizing a diverse range with a mean of 1596 and a standard deviation of 292.4. A Histogram of DS reveals densities spanning 0.0170940 to 0.820513, showcasing variability with a mean of 2.976 and a standard deviation of 0.7534. These statistics underscore the diverse nature of parameters within cassava grater output, vital for tailored processing methods and equipment design in relevant industries.
3.4. Correlation Analysis of Key Cassava Grater Parameters
The correlation matrix in Figure 10 shows relationships among key parameters within the cassava grater’s grating chamber. TD exhibits a positive correlation with TH (0.84) and an even stronger correlation with GMD (0.91). This emphasizes the influence of tooth dimensions on the overall GMD of grated cassava particles. ITS shows a moderate positive correlation with GMD (0.5), indicating that variations in the spacing between teeth moderately impact the resultant particle sizes. DS exhibits significant negative correlations with TD and C (-0.62 for both), suggesting that higher drum speeds tend to coincide with smaller TD and C, potentially impacting the output size distribution. MC demonstrates very weak correlations with other parameters, indicating its relatively independent role in influencing particle size. The correlations in the cassava grater’s parameters reflect key aspects of the grating process. For instance, the strong positive correlation between TD and GMD implies that larger tooth sizes generally result in larger grated particle sizes. This relationship aligns with the physical mechanism of grating: larger teeth tend to produce larger shreds or particles. The strong correlation between TD and TH reinforces this, indicating that tooth size significantly influences the overall particle size. The negative correlations of DS with TD and C are intuitive from an engineering standpoint: higher drum speeds might prompt smaller teeth and clearances, affecting the size reduction process. These relationships emphasize the critical role of tooth dimensions and operational settings in determining particle size, essential for designing and optimizing grating machinery to achieve desired particle sizes for specific applications in cassava processing.
3.5. Feature Importance Scores of Studied Variables
The feature importance scores are shown in Figure 11. represent the hierarchy of influence of different parameters on particle size in a cassava grater. TH demonstrates the highest importance score (0.488784), indicating its substantial impact on particle size, followed by C with an importance score of 0.243284, emphasizing its significant influence. TD holds moderate importance (0.112682), suggesting a discernible yet lesser impact compared to TH and C. ITS and DS exhibit lower importance scores (0.103547 and 0.036261, respectively), reflecting their comparatively lesser impact on particle size determination. MC possesses the lowest importance score (0.015442), indicating its minimal role in affecting particle size during the grating process. These scores provide insights into the critical parameters affecting particle size in the cassava grater, which can aid in targeted adjustments for optimizing particle size output in cassava processing. The feature importance scores in the cassava grater’s operation likely reflect the inherent nature of the grating process and the mechanical interplay among various parameters. TH might hold the highest importance due to its direct influence on the depth to which the cassava is grated, impacting the resultant particle size. C likely follows closely as it regulates the space between the grating elements, directly affecting how finely or coarsely the cassava is grated as similarly reported by [42] in the case of milling machines. Tooth Diameter (TD) holds moderate importance as it contributes to the size and shape of grated particles, but its influence was somewhat less pronounced than TH and C. ITS and DS likely have lower importance scores because while they impact the grating process, their effects might be secondary compared to TH, C, and TD. MC might have the lowest score as its influence on particle size might be more indirect, affecting the cassava’s consistency rather than the mechanical aspects directly impacting size reduction. These importance scores align with the mechanical and operational dynamics of the grating chamber, indicating which parameters have more direct control over particle size in the cassava grater.
3.6. Model Evaluation and Optimization
This study explored and optimized four regression algorithms: linear regression, random forest, gradient boost regressor, and neural network regressor to determine the best-fitting model for the given dataset. Recursive feature elimination was employed to enhance robustness by eliminating the least important feature which was determined to be the MC.
The models were assessed using key metrics - accuracy, root mean squared error (RMSE), and mean absolute error (MAE) - on the testing dataset. The results are summarized in Table 4.

Table 2.
Performance of algorithms.
| Algorithm | Accuracy | RMSE | MAE |
|---|---|---|---|
| Linear regression | 0.9486 | 0.3349 | 0.2757 |
| Random forest | 0.9045 | 0.4538 | 0.3670 |
| Gradient boost regressor | 0.9534 | 0.3291 | 0.2303 |
| Neural network regressor | -788.6182 | 41.2690 | 40.6196 |
The Gradient Boost Regressor stands out as the best-performing model, exhibiting the highest accuracy of 95.34%. It also demonstrates the lowest RMSE (0.3291) and MAE (0.2303), indicating superior predictive capability and smaller prediction errors compared to other models.
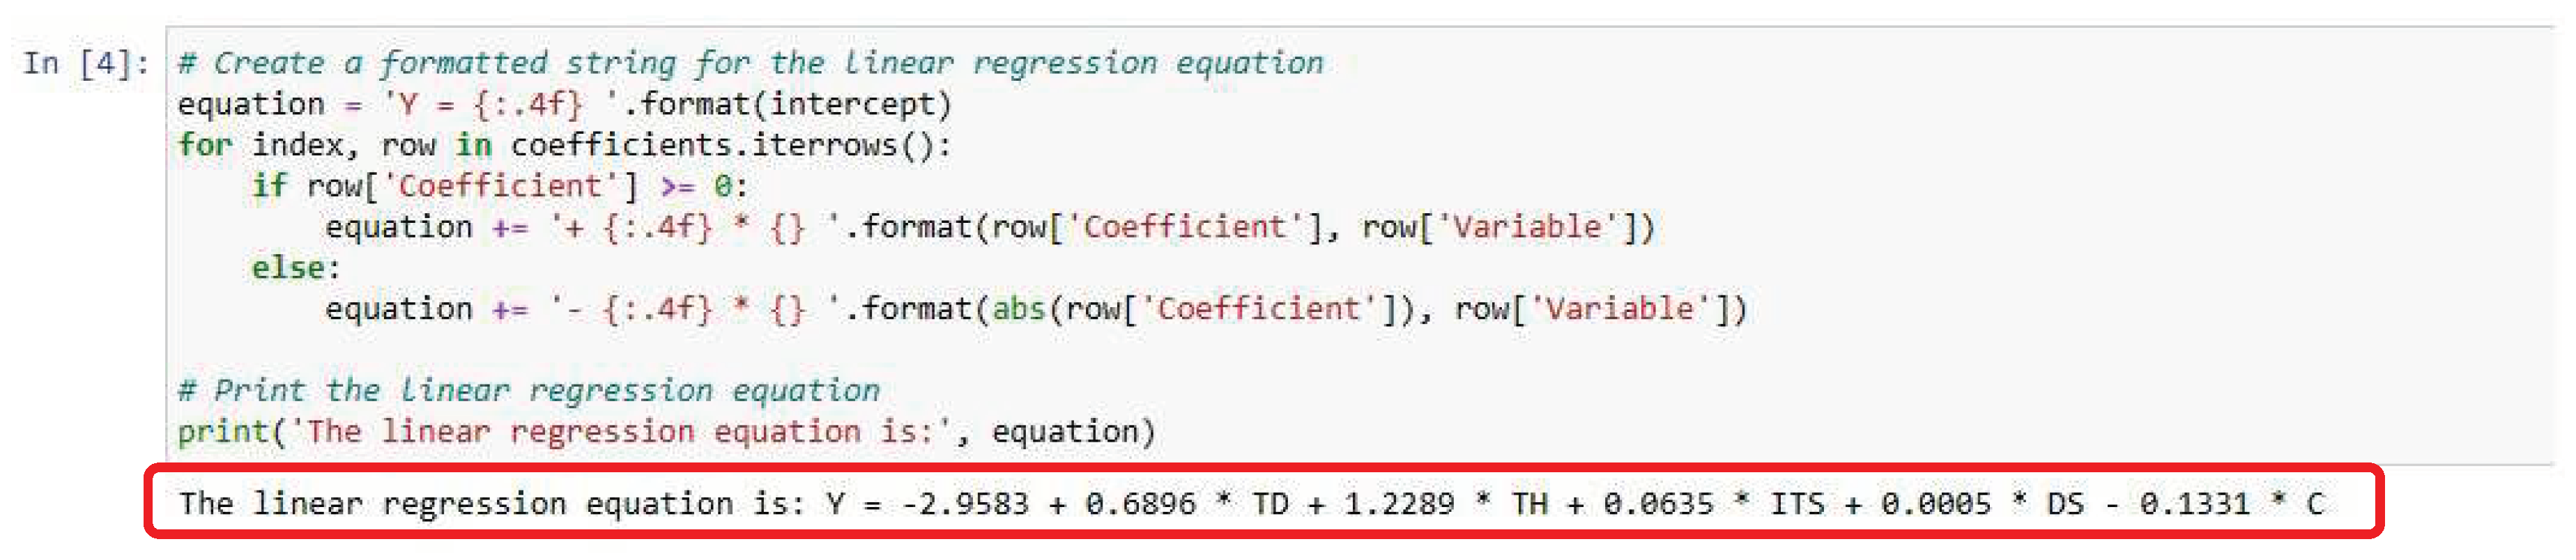
3.7. Proposed Model for Particle Size Prediction of Cassava Graters
The linear regression equation is:
Figure 12.
The proposed model in Jupyter Notebooks environment.
3.8. Residual Plot Analysis: Assessing Model Fit
The residual plot for the proposed regression model shown in Figure 13 reveals a notable pattern, with the majority of residuals concentrated within the range of 0.0 to -0.2 and 0.0 to 0.2. The examined pattern of residuals (actual GMD – predicted GMD) in Figure 13 illustrates a random scatter around the horizontal axis, indicating homoscedasticity and affirming the linear relationship between the chosen predictors (TH, TD, ITS, C, and DS) and the response variable (GMD), specifically in the context of cassava mash quality. The cluster of residual GMDs close to the zero line suggests unbiased predictions, on average. However, several observed potential outliers (below -0.4) and non-linear patterns, particularly at the extremes, can be further studied to refine the proposed model.
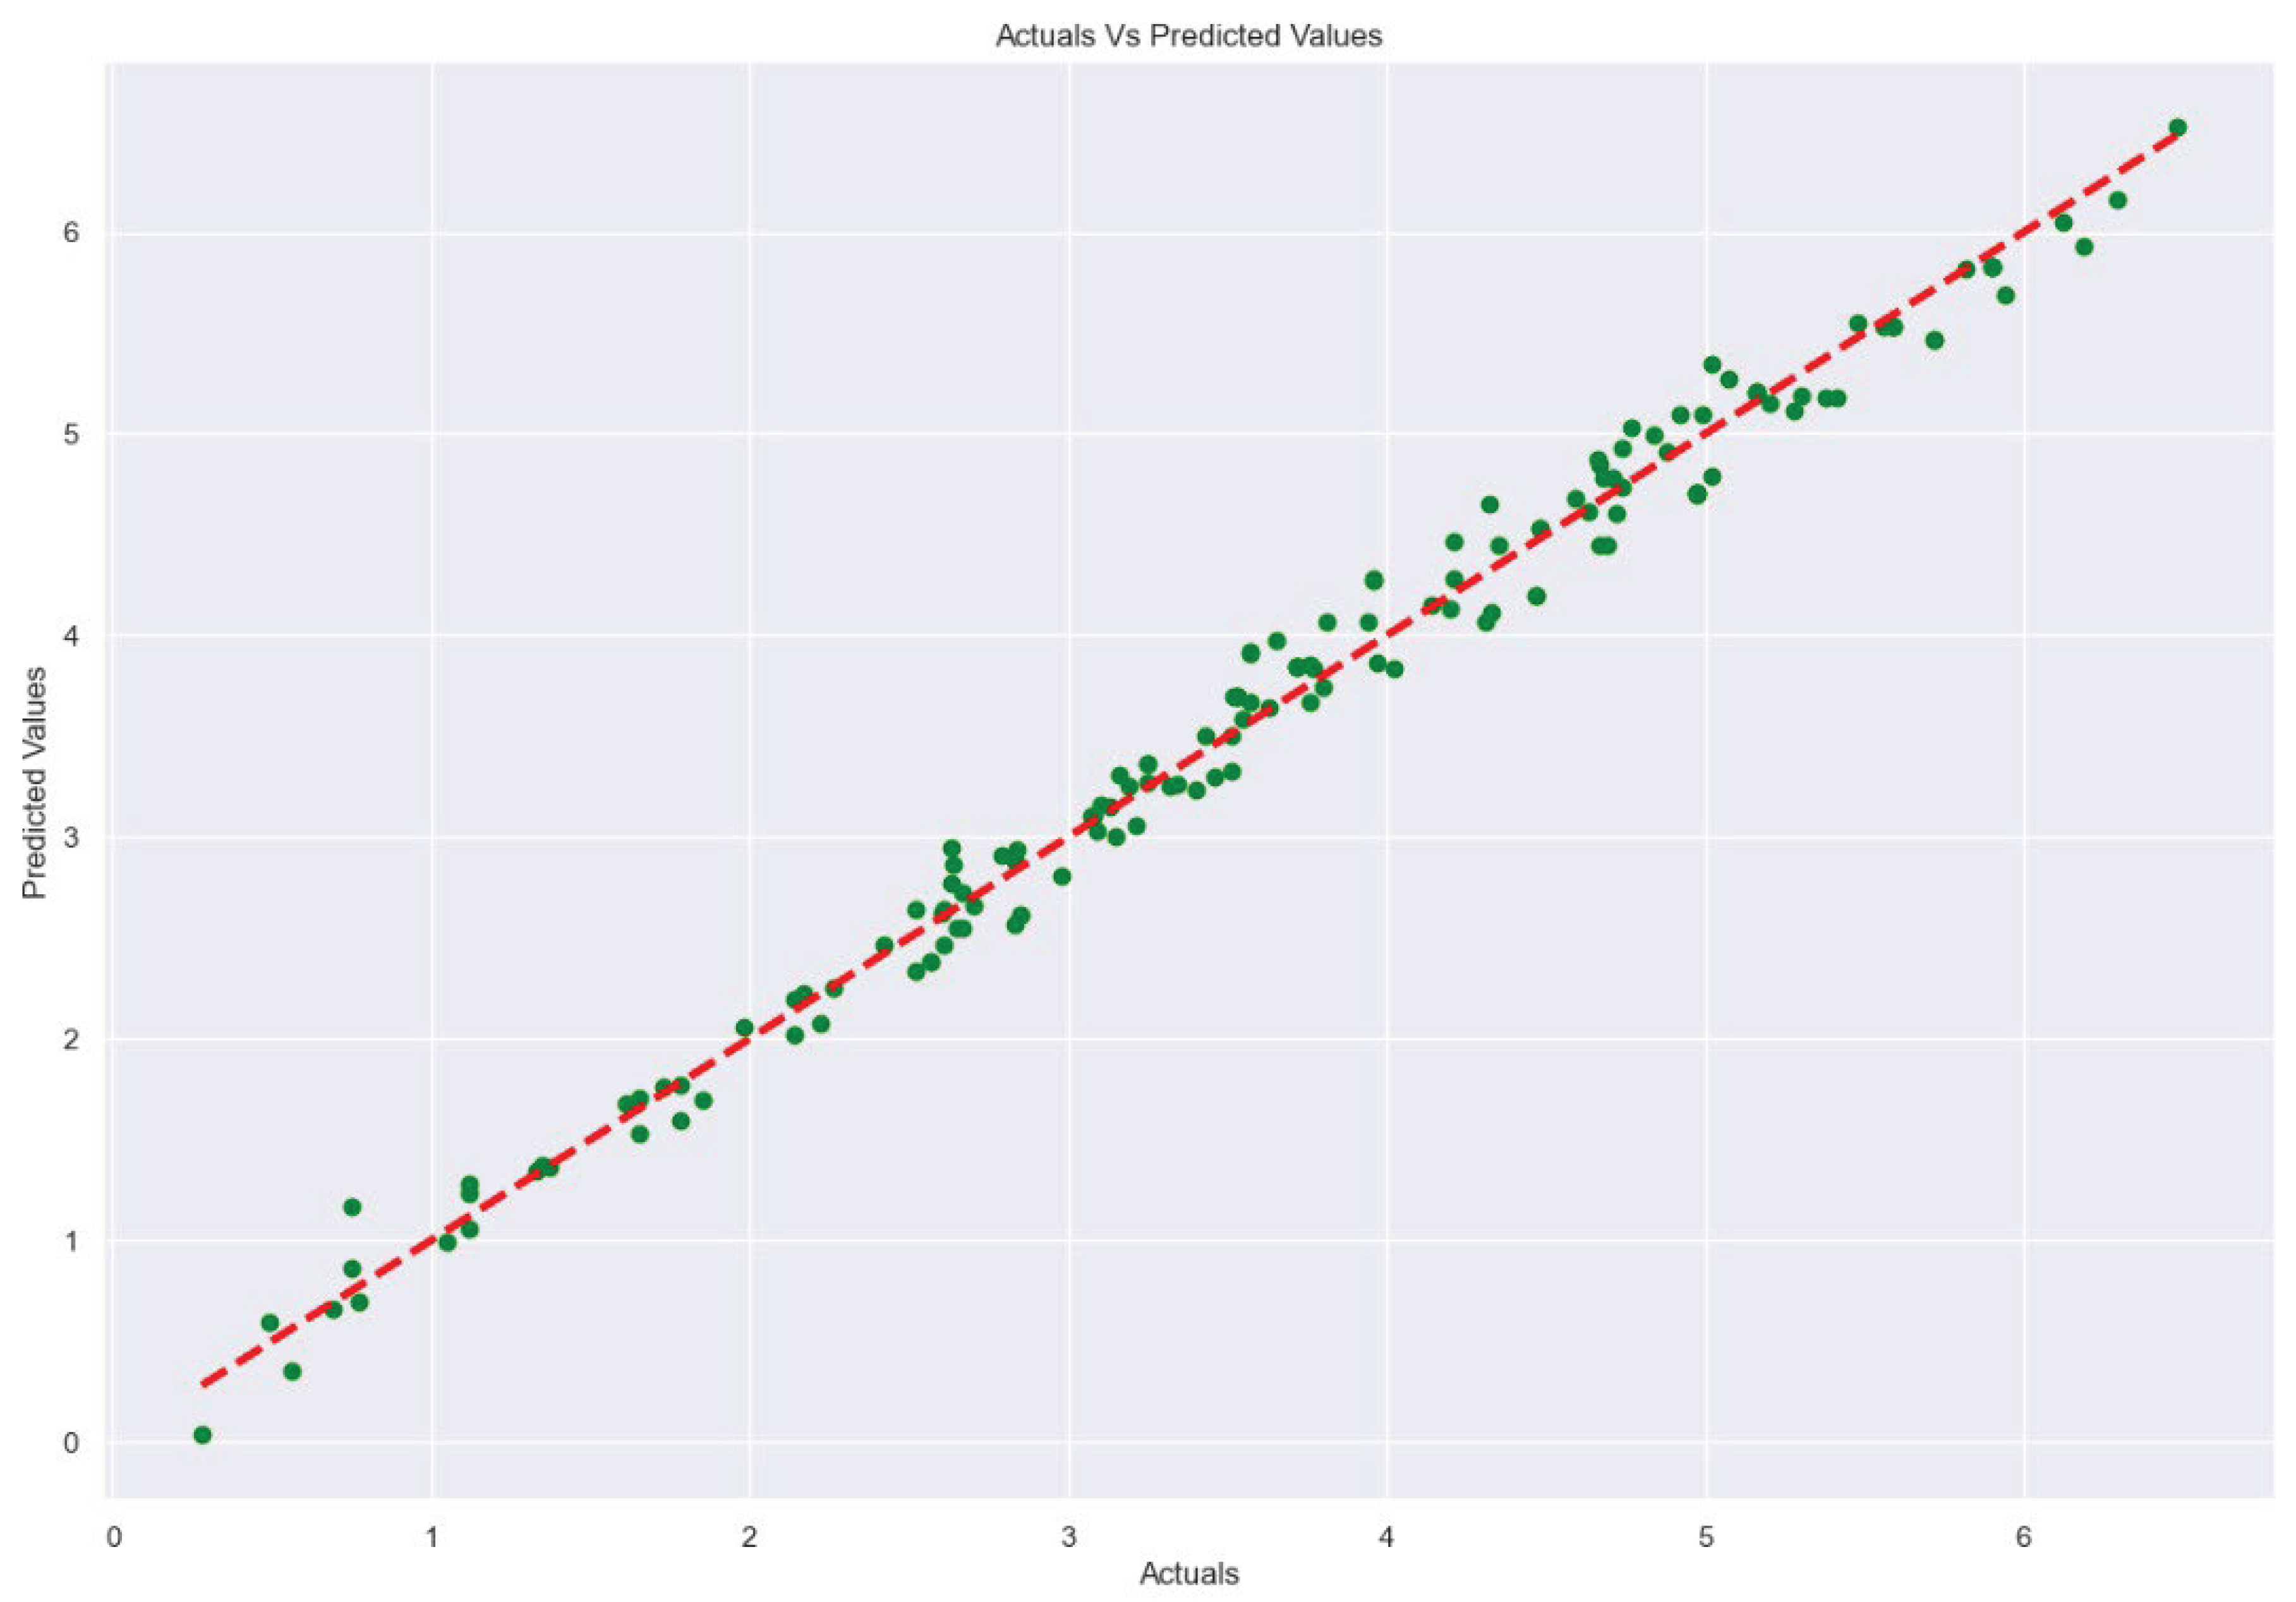
3.9. Assessing Model Accuracy
Figure 13 presents a plot of the actual GMD versus the model’s predicted GMD. The plot shows a concentrated cluster of points forming close to the diagonal line which depicts a good prediction of the derived model [43].
Figure 14.
Graph of actual versus predicted values.
3.10. Optimization of Parameters for ASAE Size Distribution for Gari
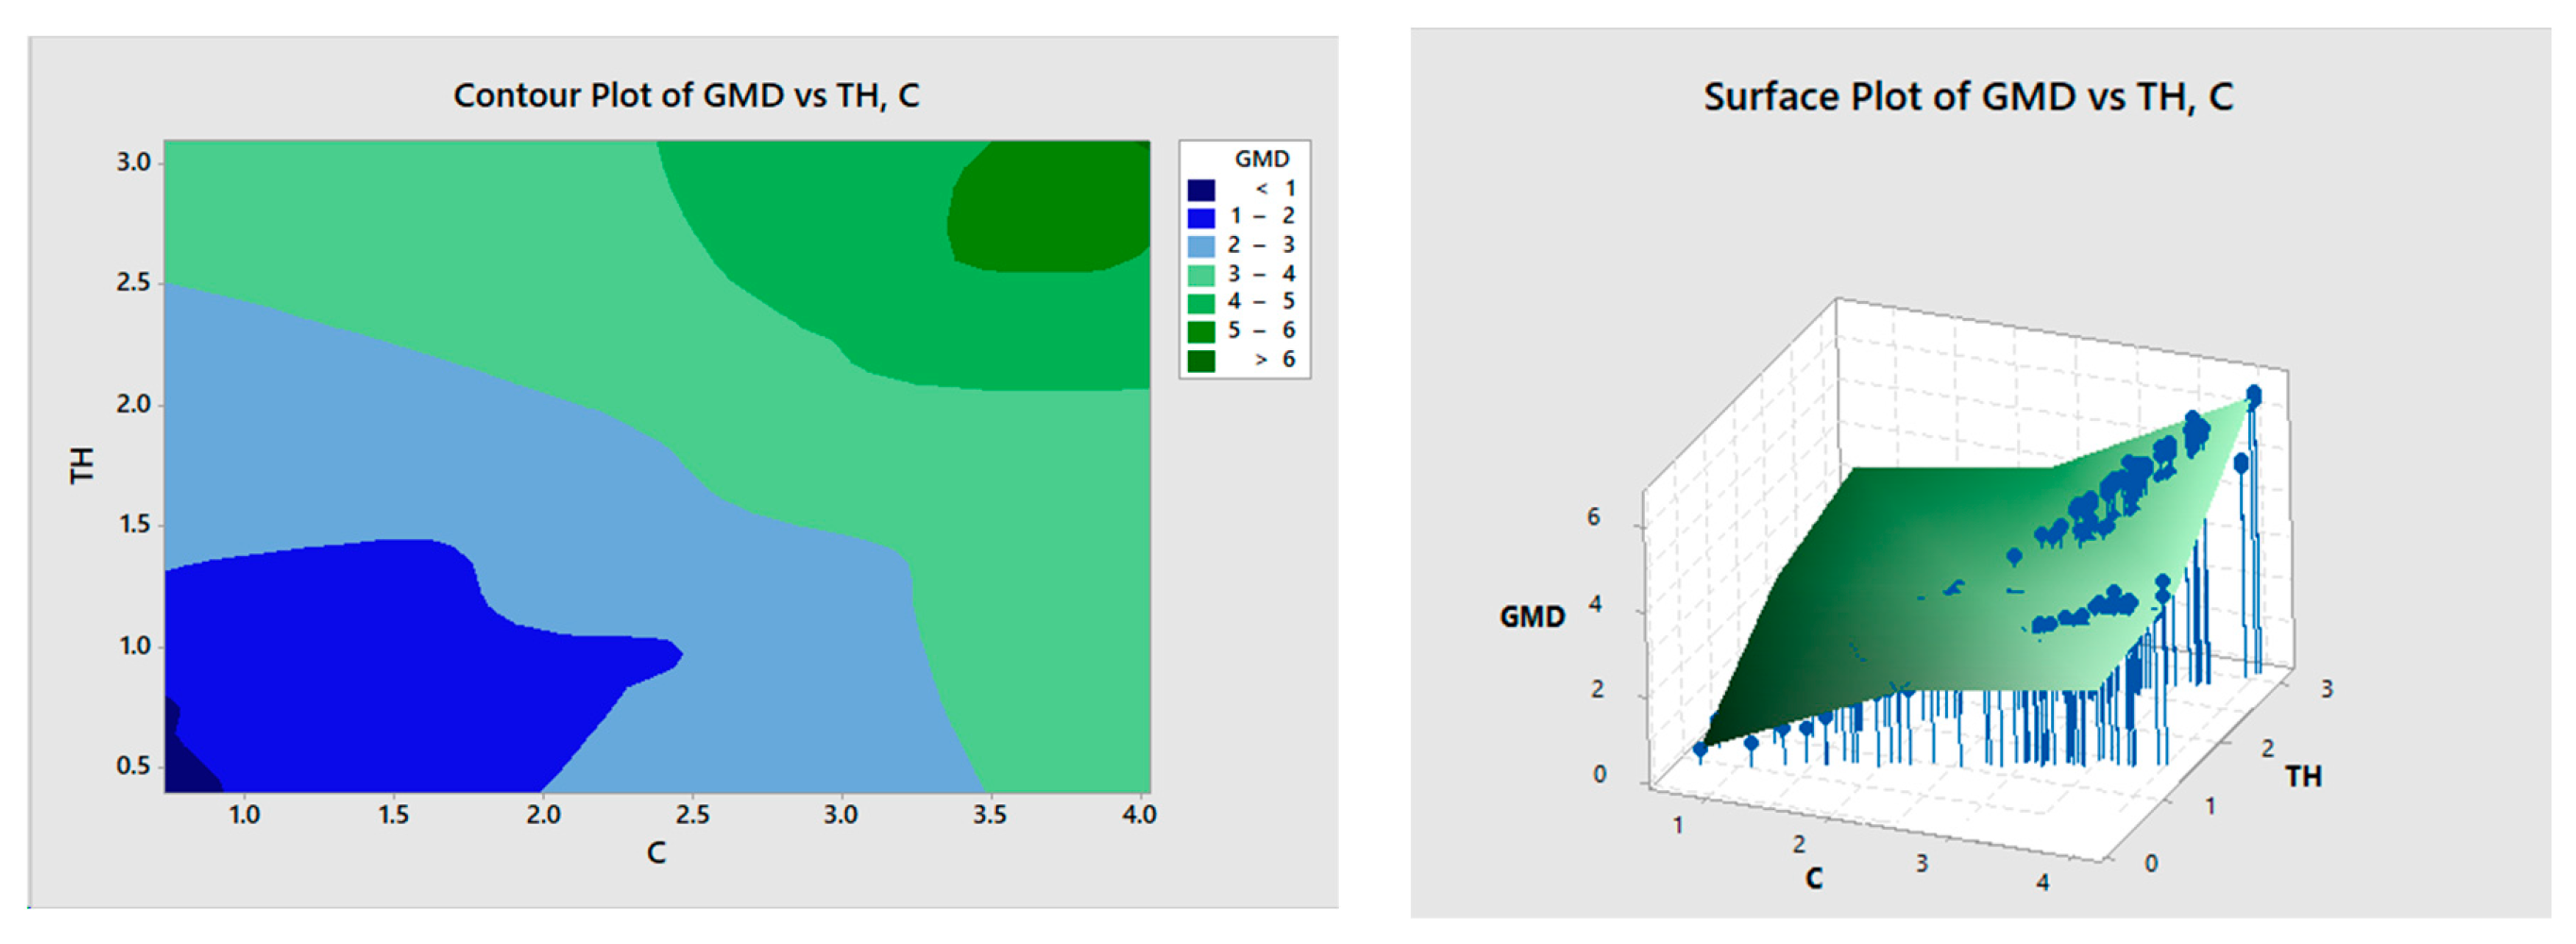
The contour plot of GMD versus TH and C illustrates specific regions conducive to achieving varying particle sizes. A narrow area exhibits fine particles (GMD < 1 mm) when TH is below 0.6 mm and C is under 1 mm. Particle sizes ranging from 1mm – 2 mm can be attained with TH between 0.5 mm and 1.25 mm and C from 1 mm to slightly over 2 mm, particularly effective at around 0.8 mm TH. GMD values of 2 mm – 3 mm are associated with TH approximately 1.5 mm-2.5 mm and C in the range of 2 mm – 3.5 mm. Larger particle sizes require TH above 2.5 mm and C at over 3.5 mm.
Figure 15.
Contour and surface plot of GMD versus TH, C.
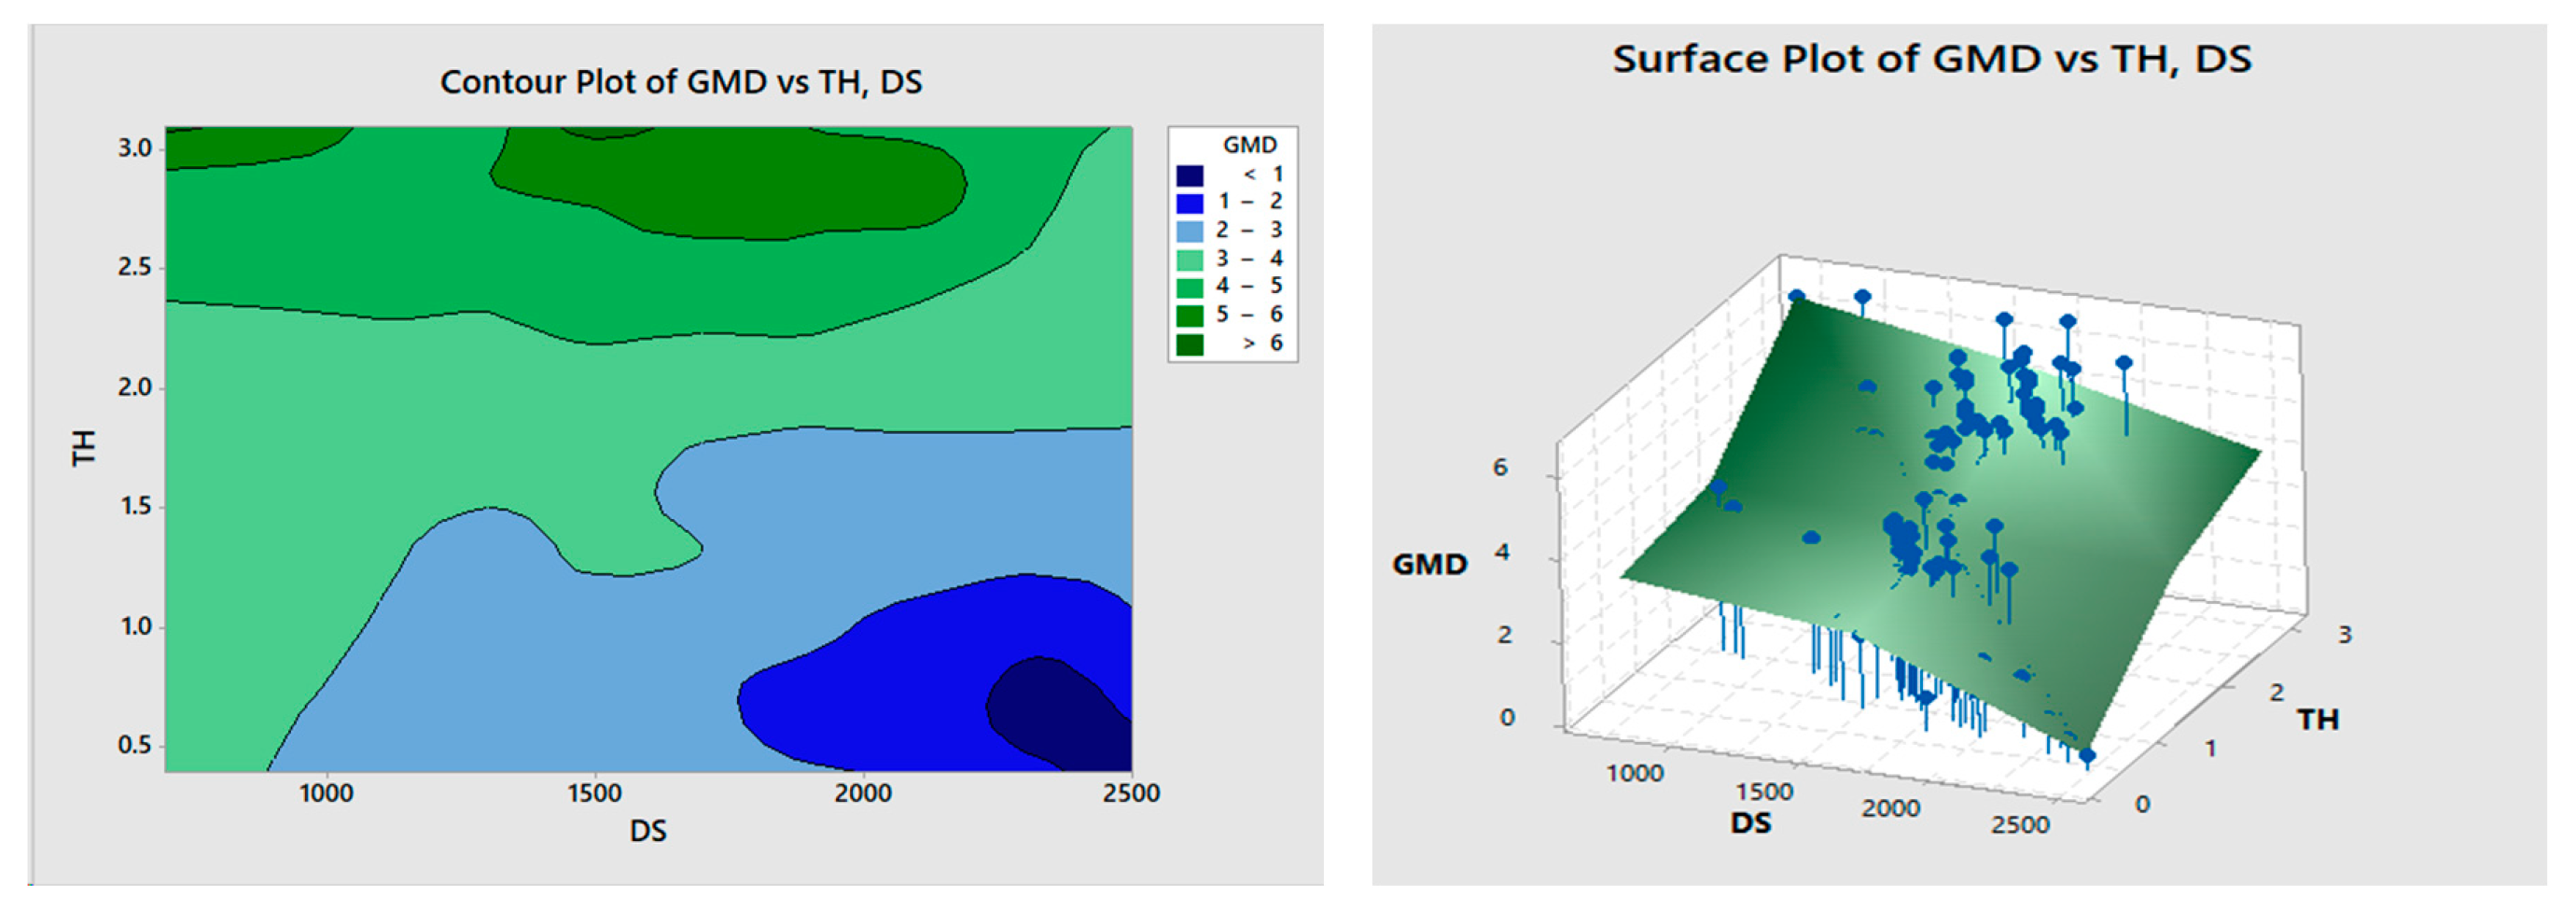
The GMD versus TH and TD contour plot delineates specific regions for achieving varying particle sizes, both fine and coarse. Finer particles are attained with lower TD and TH, while larger particles correlate with increased TH and TD. For particles smaller than 1 mm, maintaining TH and TD below 0.75 mm and 1.5 mm respectively is optimal. In areas denoted by deep blue (GMD < 1 mm), a larger TD could yield similar particle sizes if TH remains below 0.75 mm, achievable through worn teeth. Particle sizes between 1mm and 2 mm are feasible with TD approximately 0.75 mm -1.5 mm and TH between 2 mm – 3 mm. Alternatively, a TD below 2 mm, coupled with TH below 0.75 mm, can produce similar sizes. Particle sizes spanning 2 mm – 4mm are achievable with TH ranging from 1.5 mm – 3 mm and TD between 3 mm – 5 mm. Larger particles of processed gari result from TH above 2.7 mm and TD exceeding 5 mm.
The observed relationship between GMD, TH, and DS in the contour plot in Figure 16 indicates distinctive regions associated with varied particle sizes. Notably, lower TH alongside larger DS correlates with finer GMD. Specifically, TH below 0.75 mm with DS of 2250 rpm and above leads to GMD < 1 mm, emphasizing the significance of low TH and high DS in producing smaller particles of gari. In contrast, within the ranges of TH (0.5 mm - 1.75 mm) and DS (1000 rpm – 2500 rpm), GMD spans 2 mm – 3 mm, demonstrating a moderate particle size range. Interestingly, the broader TH range (0.5 mm - 2.25 mm) coupled with DS (800 rpm – 2500 rpm) results in GMD of 3 mm – 4 mm, indicating a shift towards larger particle sizes. However, when TH surpasses 4, larger particle sizes are achieved, exhibiting reduced dependency on DS. This trend suggests that while both TH and DS influence particle size, lower TH and higher DS tend to favor finer particles, whereas larger TH values predominantly determine larger particle sizes, with DS exerting a comparatively lesser impact in this range.
Figure 16.
Contour and surface plot of GMD versus TH, TD.
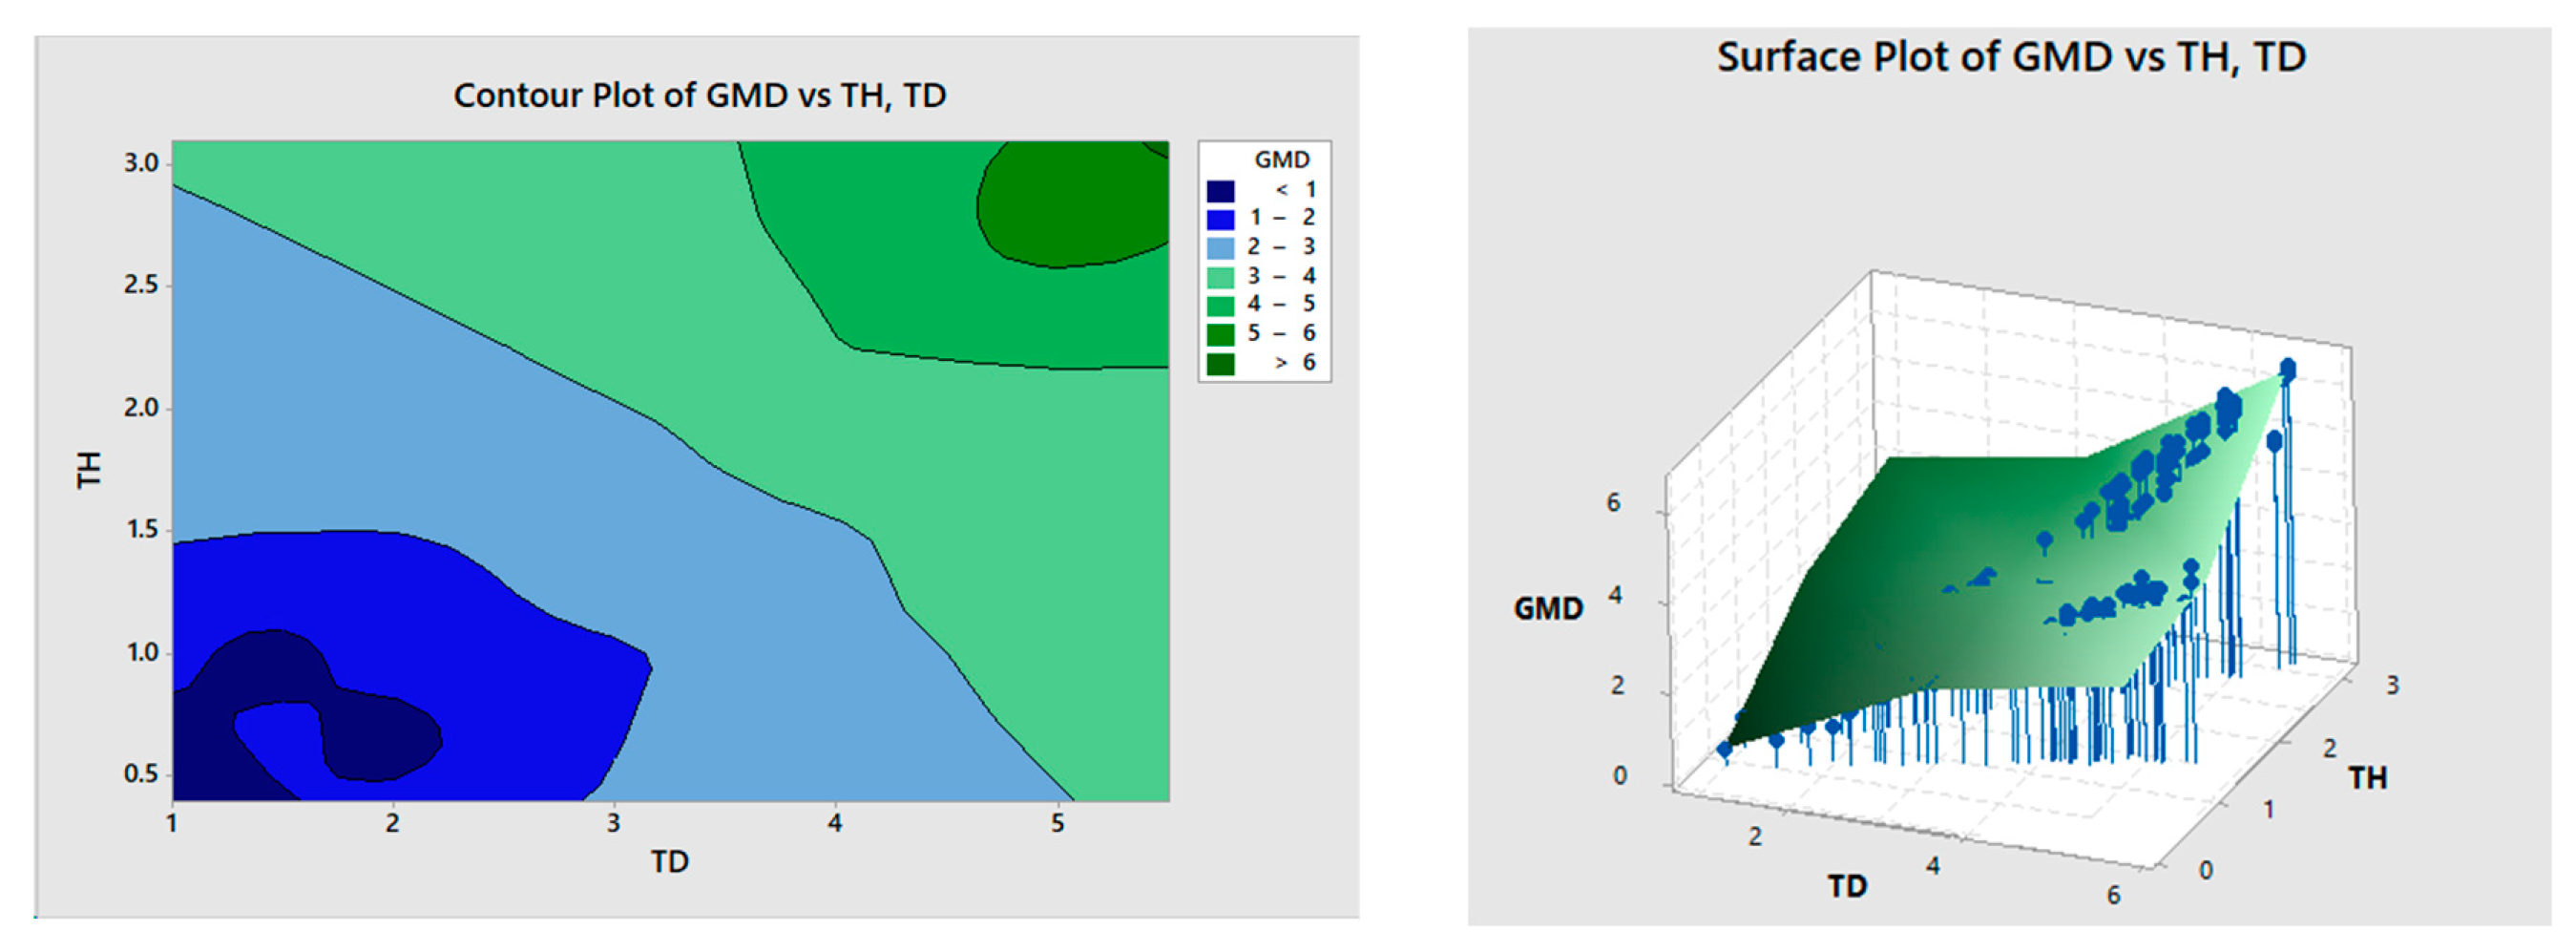
Figure 17.
Contour and surface plot of GMD versus TH, DS.
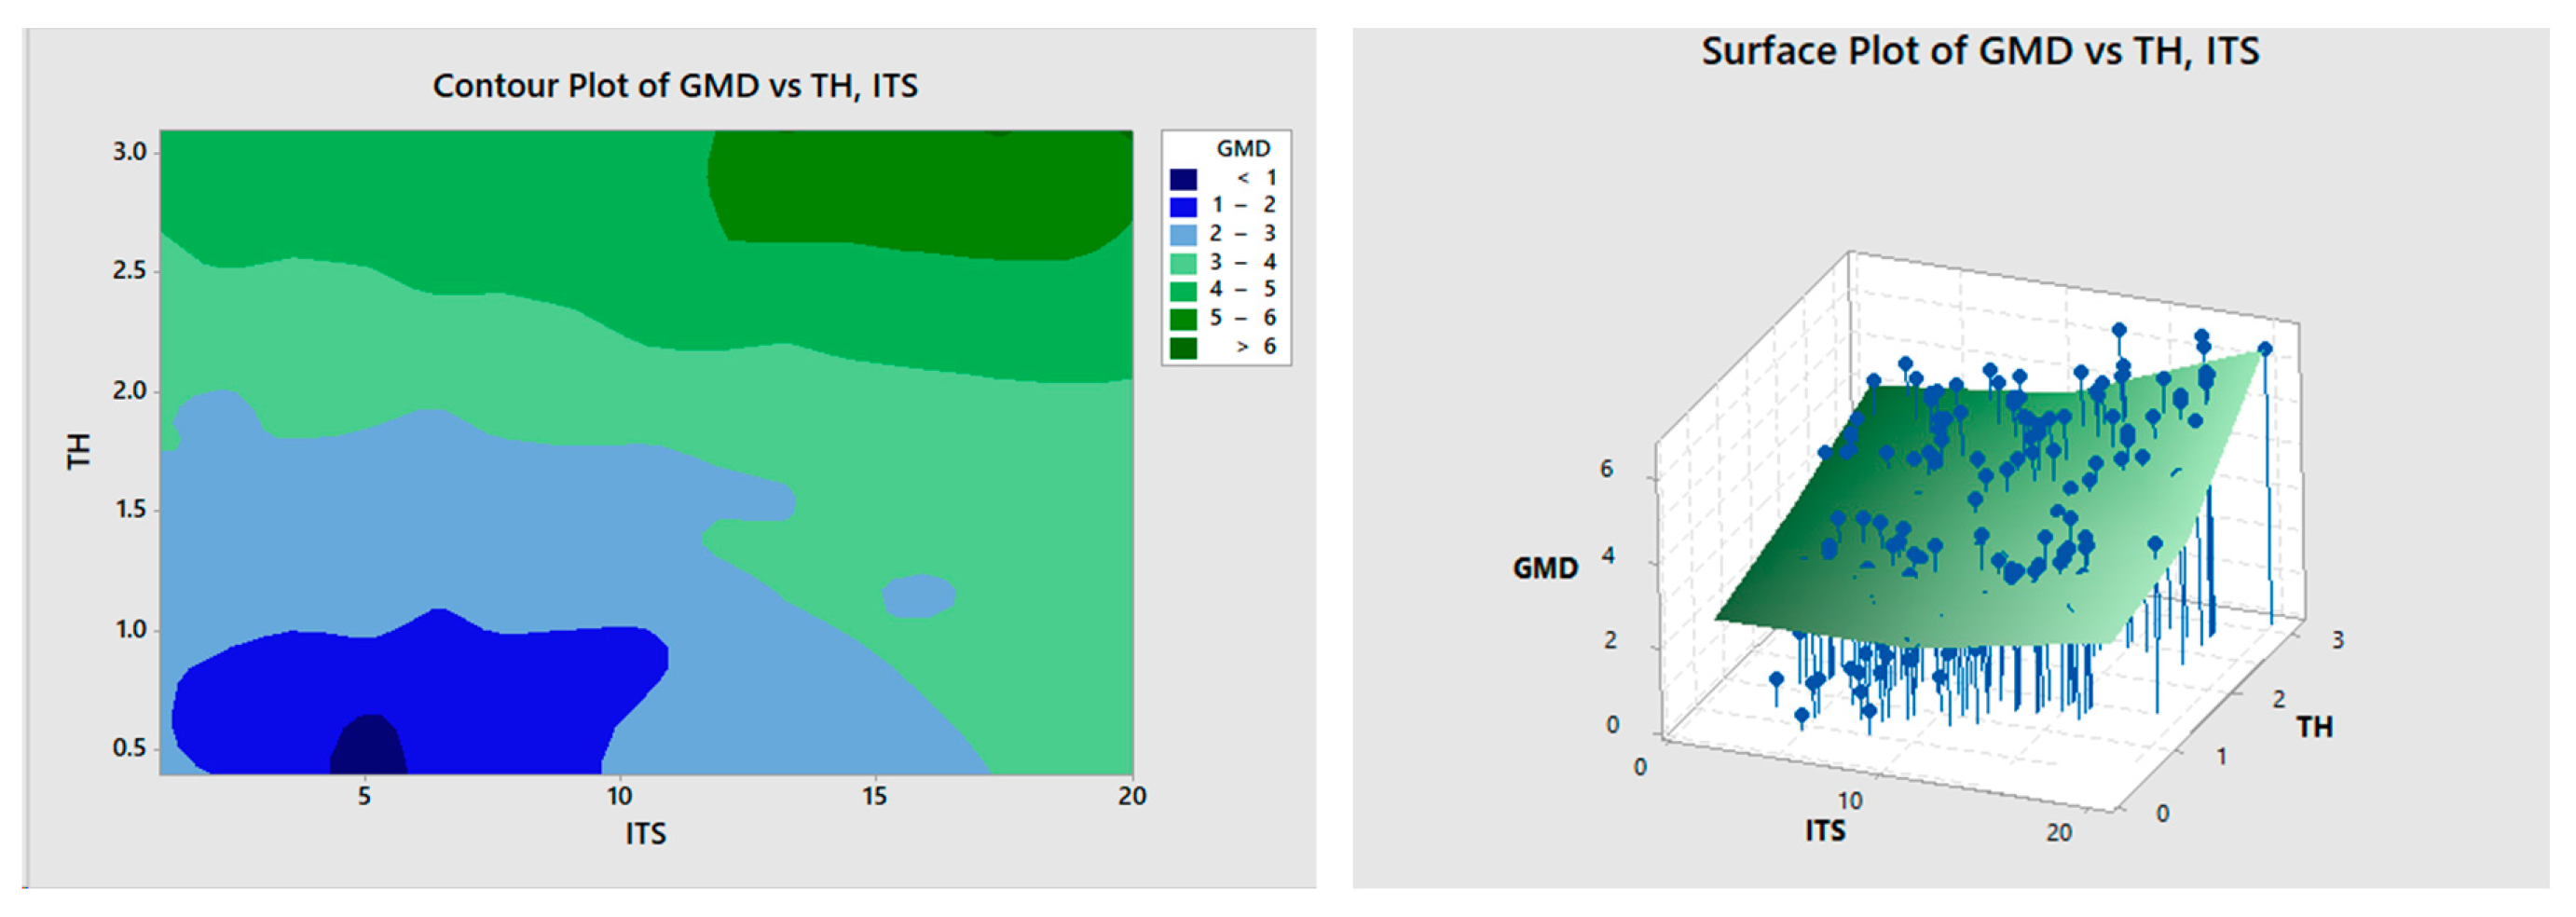
The observed relationships depicted in the GMD versus TH and ITS contour plot reveal distinct zones associated with various particle size distributions. Notably, the plot showcases specific combinations of TH and ITS linked to different GMD outcomes. TH below 0.6 mm, combined with ITS of 5 mm, results in GMD < 1 mm, underscoring their joint influence in producing smaller particles. Furthermore, a TH below 1 mm combined with ITS ranging from 3 mm to 10 mm yields GMD in the 1 mm – 2 mm range, indicating their collective impact on intermediate particle sizes. Conversely, for larger GMD outcomes, the plot indicates that TH exceeding 2.5 mm coupled with ITS ranging between 13 mm – 20 mm is optimal. However, the small region exhibiting GMD between 2 mm – 3 mm appears as an outlier, potentially influenced by other unaccounted parameters or interactions. This anomaly suggests the presence of additional variables or complex interactions influencing particle size distribution within this specific range, warranting further investigation to elucidate these intricate dependencies.
Figure 18.
Contour and surface plot of GMD versus TH, ITS.
The analyses conducted across GMD versus various parameters revealed critical trends governing cassava grater performance in producing distinct particle sizes.
It became evident that TH emerges as a main factor influencing particle size distribution. Lower TH consistently correlates with finer particle sizes, while higher TH values predominantly relate to larger particles. Additionally, specific TH thresholds appear critical for transitions between particle size ranges, often in tandem with other parameters. This emphasizes the relationship of multiple variables in particle size determination. Furthermore, outliers in certain plots suggest nuanced dependencies or unexplored interactions, necessitating detailed investigation for a comprehensive understanding. Overall, these findings interpret the relationship between key operational parameters and their collective impact on achieving varied particle sizes in cassava grater design, offering critical insights for optimizing performance across diverse particle size specifications.
3.11. ASAE Requirements and Proposed Optimum Parameters for Gari Production
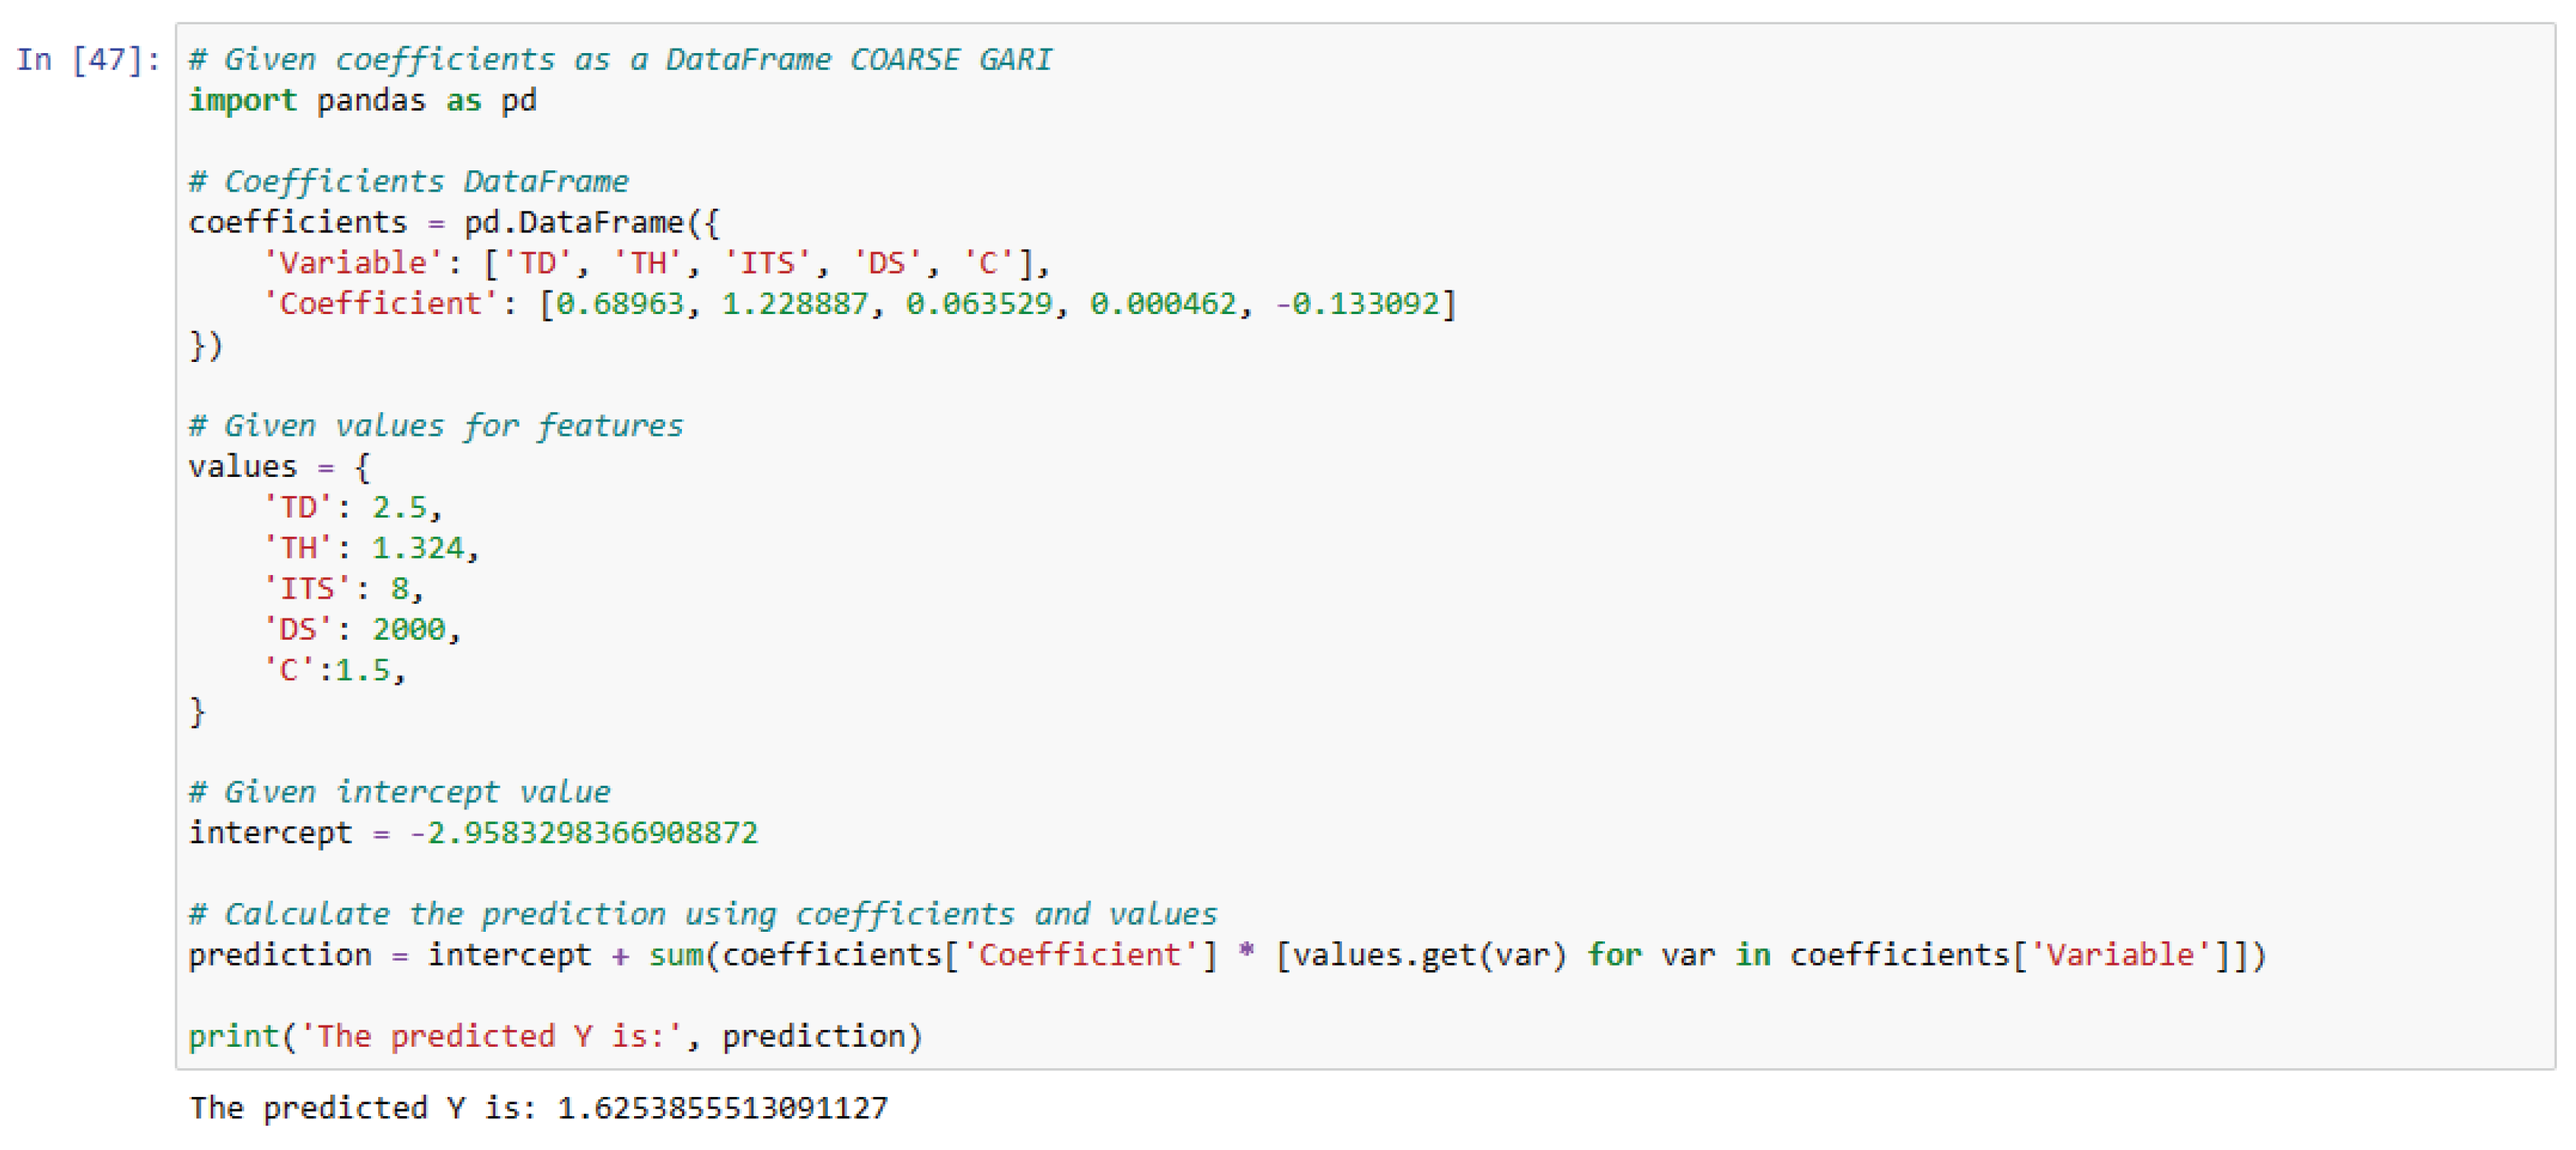
Table 5 illustrates the ASAE’s characterization of gari quality based on particle size categories: extra fine, fine, medium, and coarse. To align parameters with these defined standards, contour plots were utilized alongside predictive models to anticipate particle sizes resulting from optimized parameter ranges displayed on the contour plot. Table 5 details the optimized settings for parameters such as TD (Tooth Diameter), TH (Tooth Height), ITS (Inter-Tooth Spacing), DS (Drum Speed), and C (Clearance), along with the resulting Geometric Mean Diameter (GMD) necessary to achieve gari of extra fine, fine, medium, and coarse classifications. This analysis aids in tailoring machine parameters to ensure the produced gari adheres to the desired quality specifications as outlined by ASAE. Appendix 1 shows the utilization of the generated model to predict GMD according to the parameters of variables chosen in Jupyter Notebooks.
Table 3.
Optimized parameters for ASAE standard for gari.
| Description | Range | Average | TH | C | TD | ITS | DS |
|---|---|---|---|---|---|---|---|
| Extra fine gari | 0.25– 0.5 | 0.375 | 0.83 | 1.2 | 1.5 | 8 | 2000 |
| Fine gari | 0.5 - 1.0 | 0.75 | 1.0 | 1.45 | 1.8 | 8 | 2000 |
| Medium gari | 1-1.25 | 1.125 | 1.192 | 1.45 | 2.0 | 8 | 2000 |
| coarse gari | 1.25-2 | 1.625 | 1.324 | 1.5 | 2.5 | 8 | 2000 |
4. Conclusion
The research focused on optimizing cassava grating chambers to enhance the production of quality cassava mash for various food applications. By examining 196 graters from 5 regions in Ghana, the study identified critical variables like tooth diameter (TD), tooth height (TH), inter-tooth spacing (ITS), drum speed (DS), clearance (C), and moisture content (MC) influencing the geometric mean diameter (GMD) of the grated cassava.
Among these variables, TH, C, and TD emerged as the most influential factors affecting GMD. Machine learning models, particularly the gradient boost regressor, proved to be effective in predicting GMD with an accuracy of 95.34%. This accurate prediction led to the development of a specific equation for GMD prediction and the determination of optimized parameters, adhering to ASAE standards for different gari sizes.
This research significantly contributes to improving cassava processing, and aid in the design of machinery suitable for standardized cassava mash production tailored to meet varying consumer preferences.
Author Contributions
Conceptualization, N.Y.S.S. and J.O.A.; methodology, N.Y.S.S. and J.O.A.; software N.Y.S.S; validation, N.Y.S.S; formal analysis, N.Y.S.S; investigation, N.Y.S.S; resources, N.Y.S.S., J.O.A, and E.A.A.; data curation, N.Y.S.S; writing—original draft preparation, N.Y.S.S; writing—review and editing, N.Y.S.S. and J.O.A.; visualization, N.Y.S.S.; supervision, N.Y.S.S., J.O.A, J.O.D and E.A.A.; project administration, N.Y.S.S., J.O.A, J.O.D and E.A.A. All authors have read and agreed to the published version of the manuscript.
Funding
Not applicable
Institutional Review Board Statement
Not applicable.
Data Availability Statement
The data presented in this study are available on request.
Conflicts of Interest
The authors declare no conflict of interest.
Appendix
Figure A.
Model prediction of GMD of extra fine gari.
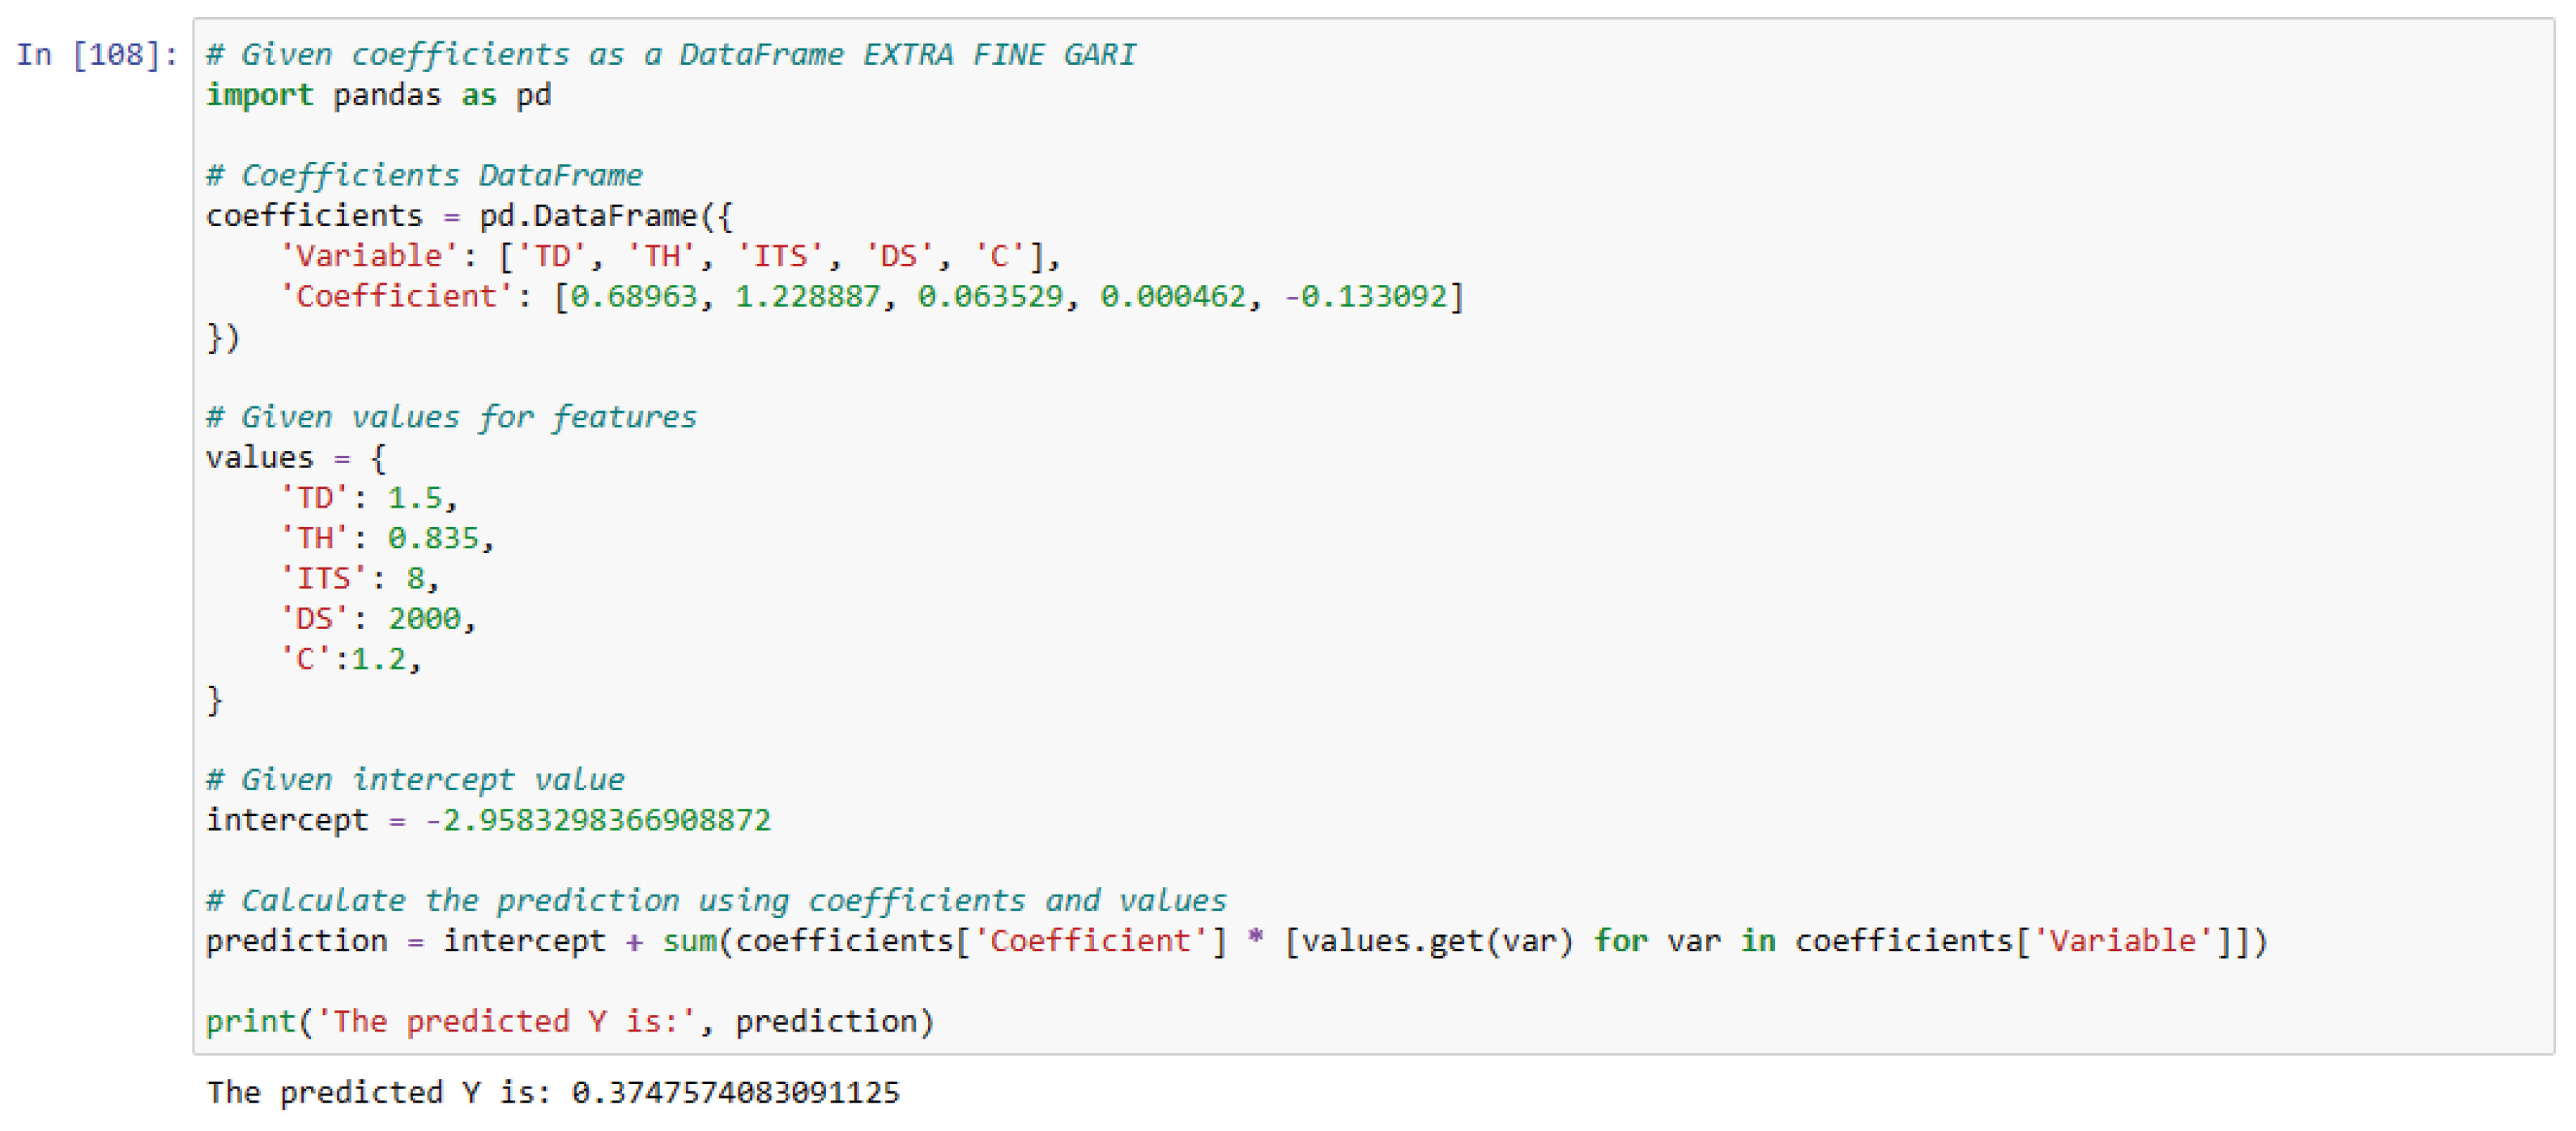
Figure B.
Model prediction of GMD of fine gari.
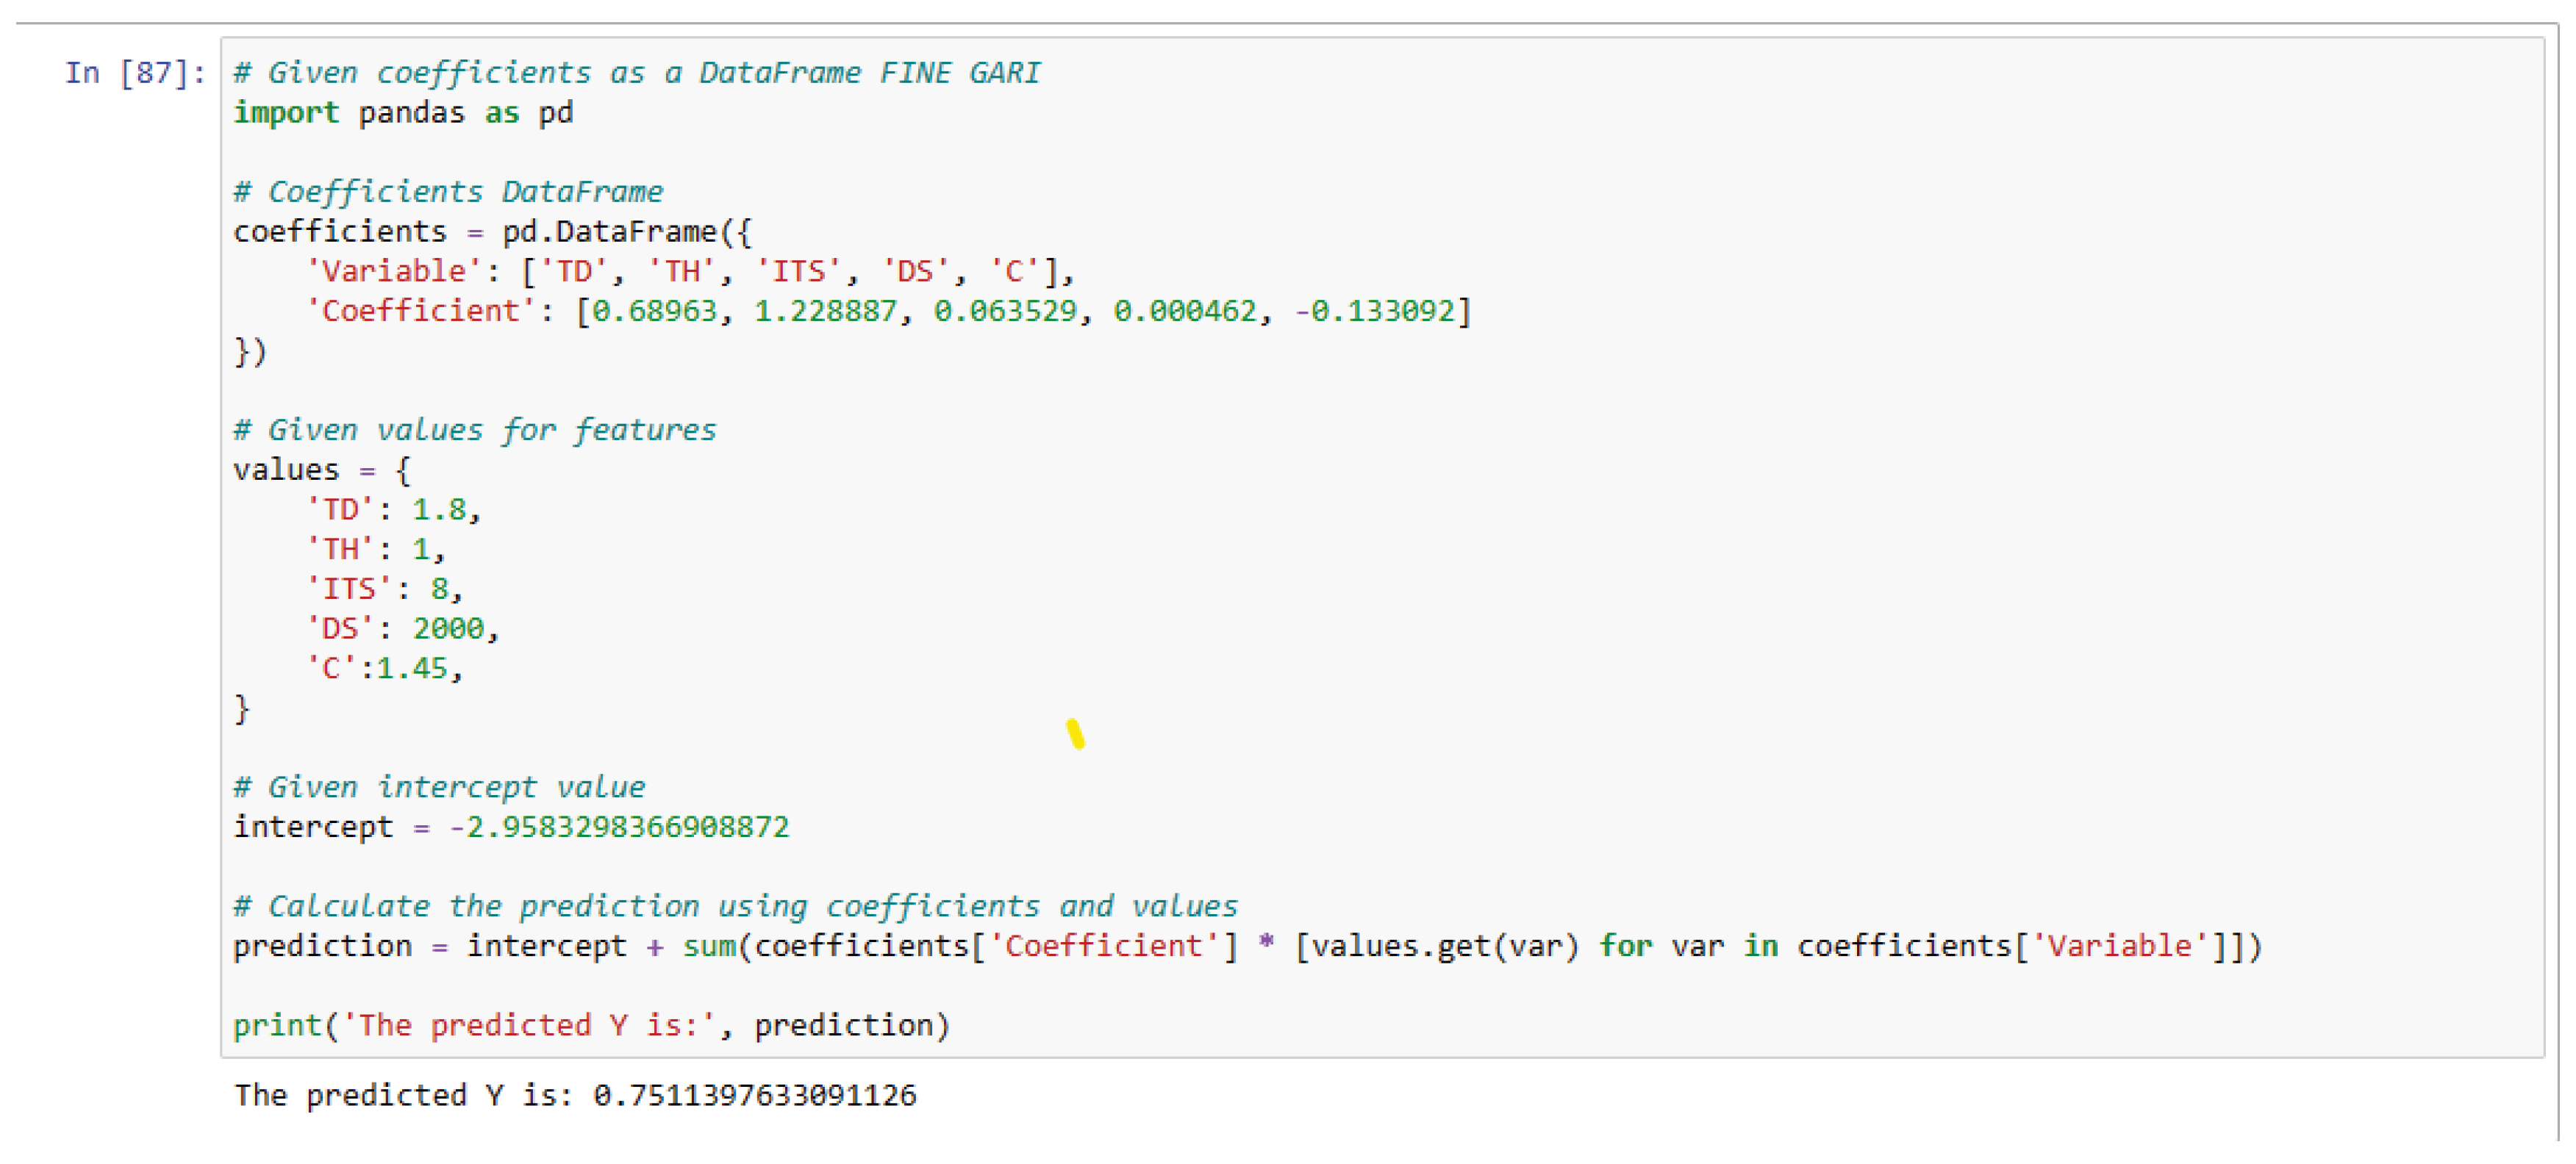
Figure C.
Model prediction of GMD of medium gari.
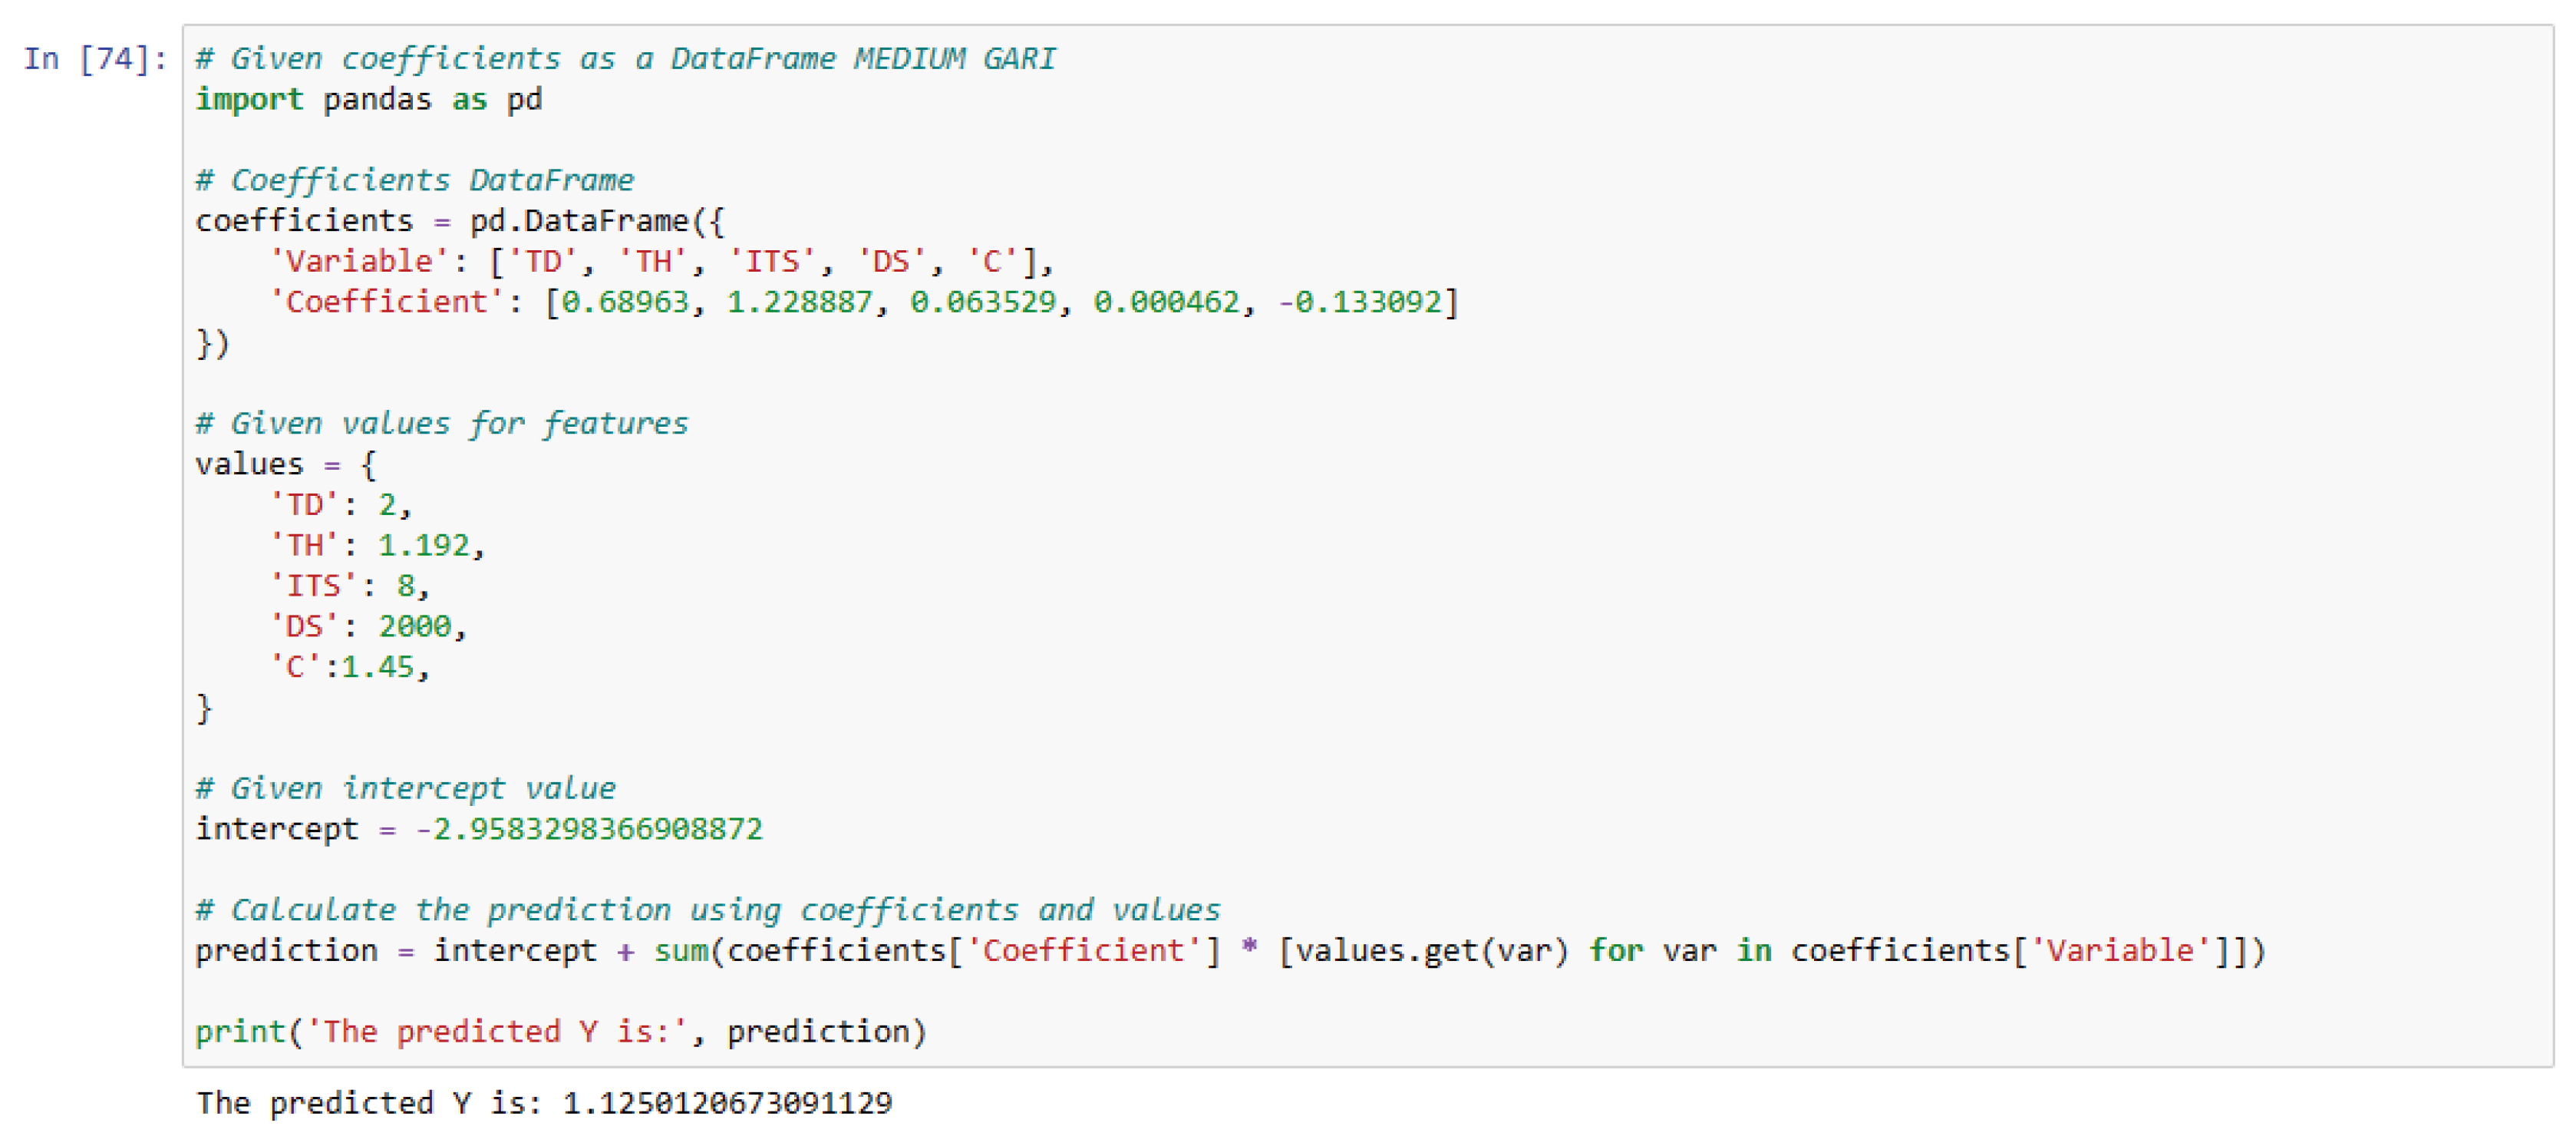
Figure D.
Model prediction of GMD of course gari.
References
- Esuma, W.; Kawuki, R.S.; Herselman, L.; Labuschagne, M.T. Diallel analysis of provitamin A carotenoid and dry matter content in cassava (Manihot esculenta Crantz). Breed. Sci. 2016, 66, 627–635. [Google Scholar] [CrossRef] [PubMed]
- Bechoff et al. Cassava traits and end-user preference: Relating traits to consumer liking, sensory perception, and genetics. Crit. Rev. Food Sci. Nutr. 2018, 58, 547–567. [CrossRef] [PubMed]
- V. Y. Waisundara, ‘Introductory Chapter: Cassava as a Staple Food. Cassava pp. 3–10, 2018.
- Feleke, S.; Manyong, V.; Abdoulaye, T.; Alene, A.D. Assessing the impacts of cassava technology on poverty reduction in Africa. Stud. Agric. Econ. 2016, 118, 101–111. [Google Scholar] [CrossRef]
- N. K. Morgan and M. Choct, ‘Cassava: Nutrient composition and nutritive value in poultry diets’. Anim. Nutr. 2016, 2, 253–261. [CrossRef] [PubMed]
- M. O. Sunmonu, M. M. Odewole, and A. A. Ibrahim, ‘Investigation of disease incidence and nutritional storability of cassava roots under different storage techniques’. J. Res. For. … 2016.
- Saravanan, R.; Ravi, V.; Stephen, R.; Thajudhin, S.; George, J. . Post-harvest Physiological Deterioration of Cassava (Manihot esculenta) - A review. Indian J. Agric. Sci. 2016, 86, 1383–1390. [Google Scholar] [CrossRef]
- P. Pornpraipech, M. Khusakul, R. Singklin, P. Sarabhorn, and C. Areeprasert, ‘Effect of temperature and shape on drying performance of cassava chips’. Agric. Nat. Resour. 2017, 51, 402–409.
- P. Pingali, ‘Agricultural Mechanization: Adoption Patterns and Economic Impact, Handbook of Agricultural Economics’. 2010, 3, 2780–2805, cit. p. 2859.
- G. Chetachi, ‘Empirical Investigation on the Design and Fabrication of Cassava Grating Machine of 4.5kw’. Am. J. IT Appl. Sci. Res. 2022, 1.
- K. C. Umani, O. A. Fakayode, and I. S. Ossom, ‘Effects of Machine Operating Parameters on the Grating Time of a Double-Action Cassava Grater with Automated Contact Plate: A Response Surface approach’. Agric. Res. 2021, 10, 148–163. [CrossRef]
- S. K. Bello, S. B. Lamidi, and S. A. Oshinlaja, ‘Design and Fabrication of Cassava Grating Machine’. Int. J. Adv. Sci. Res. Eng. 2020, 06, 162–167.
- D. U. Esteves, G. P. Pantuhan, M. O. Serviñas, and J. S. Malasador, ‘Design, fabrication and performance evaluation of motor-operated cassava grater’. Mindanao J. Sci. Technol. 2019, 17, 227–241.
- K. J. Doydora, R. Bodod, J. Lira, and M. Zamoranos, ‘Design, Fabrication, and Performance Evaluation of Electric Motor Driven Cassava (Manihot esculenta) Grater with Juice Extractor’. Philipp. J. Agric. Econ. 2017, 1, 17–28.
- K. C. Umani, O. A. Fakayode, E. U. U. Ituen, and F. B. Okokon, ‘Development and testing of an automated contact plate unit for a cassava grater’. Comput. Electron. Agric. 2019, 157, 530–540. [CrossRef]
- T. Naravane and I. Tagkopoulos, ‘Machine learning models to predict micronutrient profile in food after processing’. Curr. Res. Food Sci. 2023, 6, 100500. [CrossRef] [PubMed]
- G. Menichetti, B. G. Menichetti, B. Ravandi, D. Mozaffarian, and A. L. Barabási, ‘Machine learning prediction of the degree of food processing’. Nat. Commun. 2023, 14. [Google Scholar]
- N. Nassibi, H. Fasihuddin, and L. Hsairi, ‘A Proposed Demand Forecasting Model by Using Machine Learning for Food Industry’, ACM Int. Conf. Proceeding Ser., pp. 690–694, 2022.
- M. I. H. Khan, S. S. Sablani, R. Nayak, and Y. Gu, ‘Machine learning-based modeling in food processing applications: State of the art’, Compr. Rev. Food Sci. Food Saf. 2022, 21, 1409–1438. [CrossRef] [PubMed]
- Kumar, I.; Rawat, J.; Mohd, N.; Husain, S. Opportunities of Artificial Intelligence and Machine Learning in the Food Industry. J. Food Qual. 2021, 2021. [Google Scholar] [CrossRef]
- Trajcev, M.; Janakieva Bashevska, C.; Tomovska, H.; Bogovska, T.; Babunovska, H. Transfer and optimization of methods for particle size distribution from Mastersizer 2000 to Mastersizer 3000. Maced. Pharm. Bull. 2022, 68, 181–182. [Google Scholar] [CrossRef]
- Barth, H.G.; Sun, S.T. Particle Size Analysis. Anal. Chem. 1989, 61, 143 R–152 R. [Google Scholar] [CrossRef]
- M. Roostaei et al., ‘Comparison of various particle size distribution measurement methods: Role of particle shape descriptors’, Proc. - SPE Int. Symp. Form. Damage Control, vol. 2020-Febru, 2020.
- M. Titus, ‘Using Descriptive Statistics and Graphs’, pp. 79–102, 2021.
- D. A. Choi, P. Tagore, F. Siddiq, K. Park, and R. Ewing, ‘Descriptive statistics and visualizing data’, Basic Quant. Res. Methods Urban Planners, pp. 107–132, 2020.
- Ferreira, Á.R.S. The importance of descriptive analysis. Rev. Col. Bras. Cir., 2020, 47, 1. [Google Scholar] [CrossRef] [PubMed]
- Mondal, H.; Swain, S.; Mondal, S. How to conduct descriptive statistics online: A brief hands-on guide for biomedical researchers. Indian J. Vasc. Endovasc. Surg. 2022, 9, 70. [Google Scholar] [CrossRef]
- Fulk, G. Descriptive Statistics, An Important First Step. J. Neurol. Phys. Ther. 2023, 47, 63. [Google Scholar] [CrossRef]
- D. Rengasamy et al., .Feature importance in machine learning models: A fuzzy information fusion approach. Neurocomputing 2022, 511, 163–174. [CrossRef]
- Ao, X.; Wang, F.; Zhao, J.; She, J. Interpretable analysis of feature importance and implicit correlation based on sEMG grayscale. images’, Proc. - 2023 IEEE 6th Int. Conf. Ind. Cyber-Physical Syst. ICPS 2023, 2023.
- Kaneko, H. Interpretation of Machine Learning Models for Data Sets with Many Features Using Feature Importance. ACS Omega, 2023, 8, 23218–23225. [Google Scholar] [CrossRef]
- W. C. Liu et al., Application of machine learning techniques to predict bone metastasis in patients with prostate cancer. Cancer Manag. Res. 2021, 13, 8723–8736. [CrossRef]
- Gerstorfer, Y.; Hahn-Klimroth, M.; Krieg, L. A Notion of Feature Importance by Decorrelation and Detection of Trends by Random Forest Regression. Data Sci. J. 2023, 22. [Google Scholar] [CrossRef]
- Sundermann, C.; Raab, H.; Heß, T.; Thüm, T.; Schaefer, I. Exploiting d-DNNFs for Repetitive Counting Queries on Feature Models. 2023. [Google Scholar]
- Maulud, D.; Abdulazeez, A.M. A Review on Linear Regression Comprehensive in Machine Learning’, J. Appl. Sci. Technol. Trends 2020, 1, 140–147. [Google Scholar] [CrossRef]
- Chen, R.C.; Dewi, C.; Huang, S.W.; Caraka, R.E. Selecting critical features for data classification based on machine learning methods. J. Big Data 2020, 7. [Google Scholar] [CrossRef]
- Fan, G.F.; Zhang, L.Z.; Yu, M.; Hong, W.C.; Dong, S.Q. Applications of random forest in multivariable response surface for short-term load forecasting. Int. J. Electr. Power Energy Syst. 2022, 139. [Google Scholar] [CrossRef]
- Nie, P.; Roccotelli, M.; Fanti, M.P.; Ming, Z.; Li, Z. Prediction of home energy consumption based on gradient boosting regression tree. Energy Reports 2021, 7, 1246–1255. [Google Scholar] [CrossRef]
- M. Scharfstein and Gaurf, ‘Python for Data Science for Dummies’. J. Chem. Inf. Model. 2013, 53, 1689–1699.
- Mendez, K.M.; Pritchard, L.; Reinke, S.N.; Broadhurst, D.I. Toward collaborative open data science in metabolomics using Jupyter Notebooks and cloud computing. Metabolomics 2019, 15. [Google Scholar] [CrossRef] [PubMed]
- Pimentel, J.F.; Murta, L.; Braganholo, V.; Freire, J. Understanding and improving the quality and reproducibility of Jupyter notebooks. Empir. Softw. Eng. 2021, 26. [Google Scholar] [CrossRef] [PubMed]
- Shakiru, O.; Babasola, D. Assessment of Dry and Wet Milling using Fabricated Burr Mill. Issn 2014, 31, 2224–6088. [Google Scholar]
- Zhang, X.; Akber, M.Z.; Zheng, W. Predicting the slump of industrially produced concrete using machine learning: A multiclass classification approach. J. Build. Eng. 2022, 58. [Google Scholar] [CrossRef]
Figure 1.
Challenges of cassava graters.
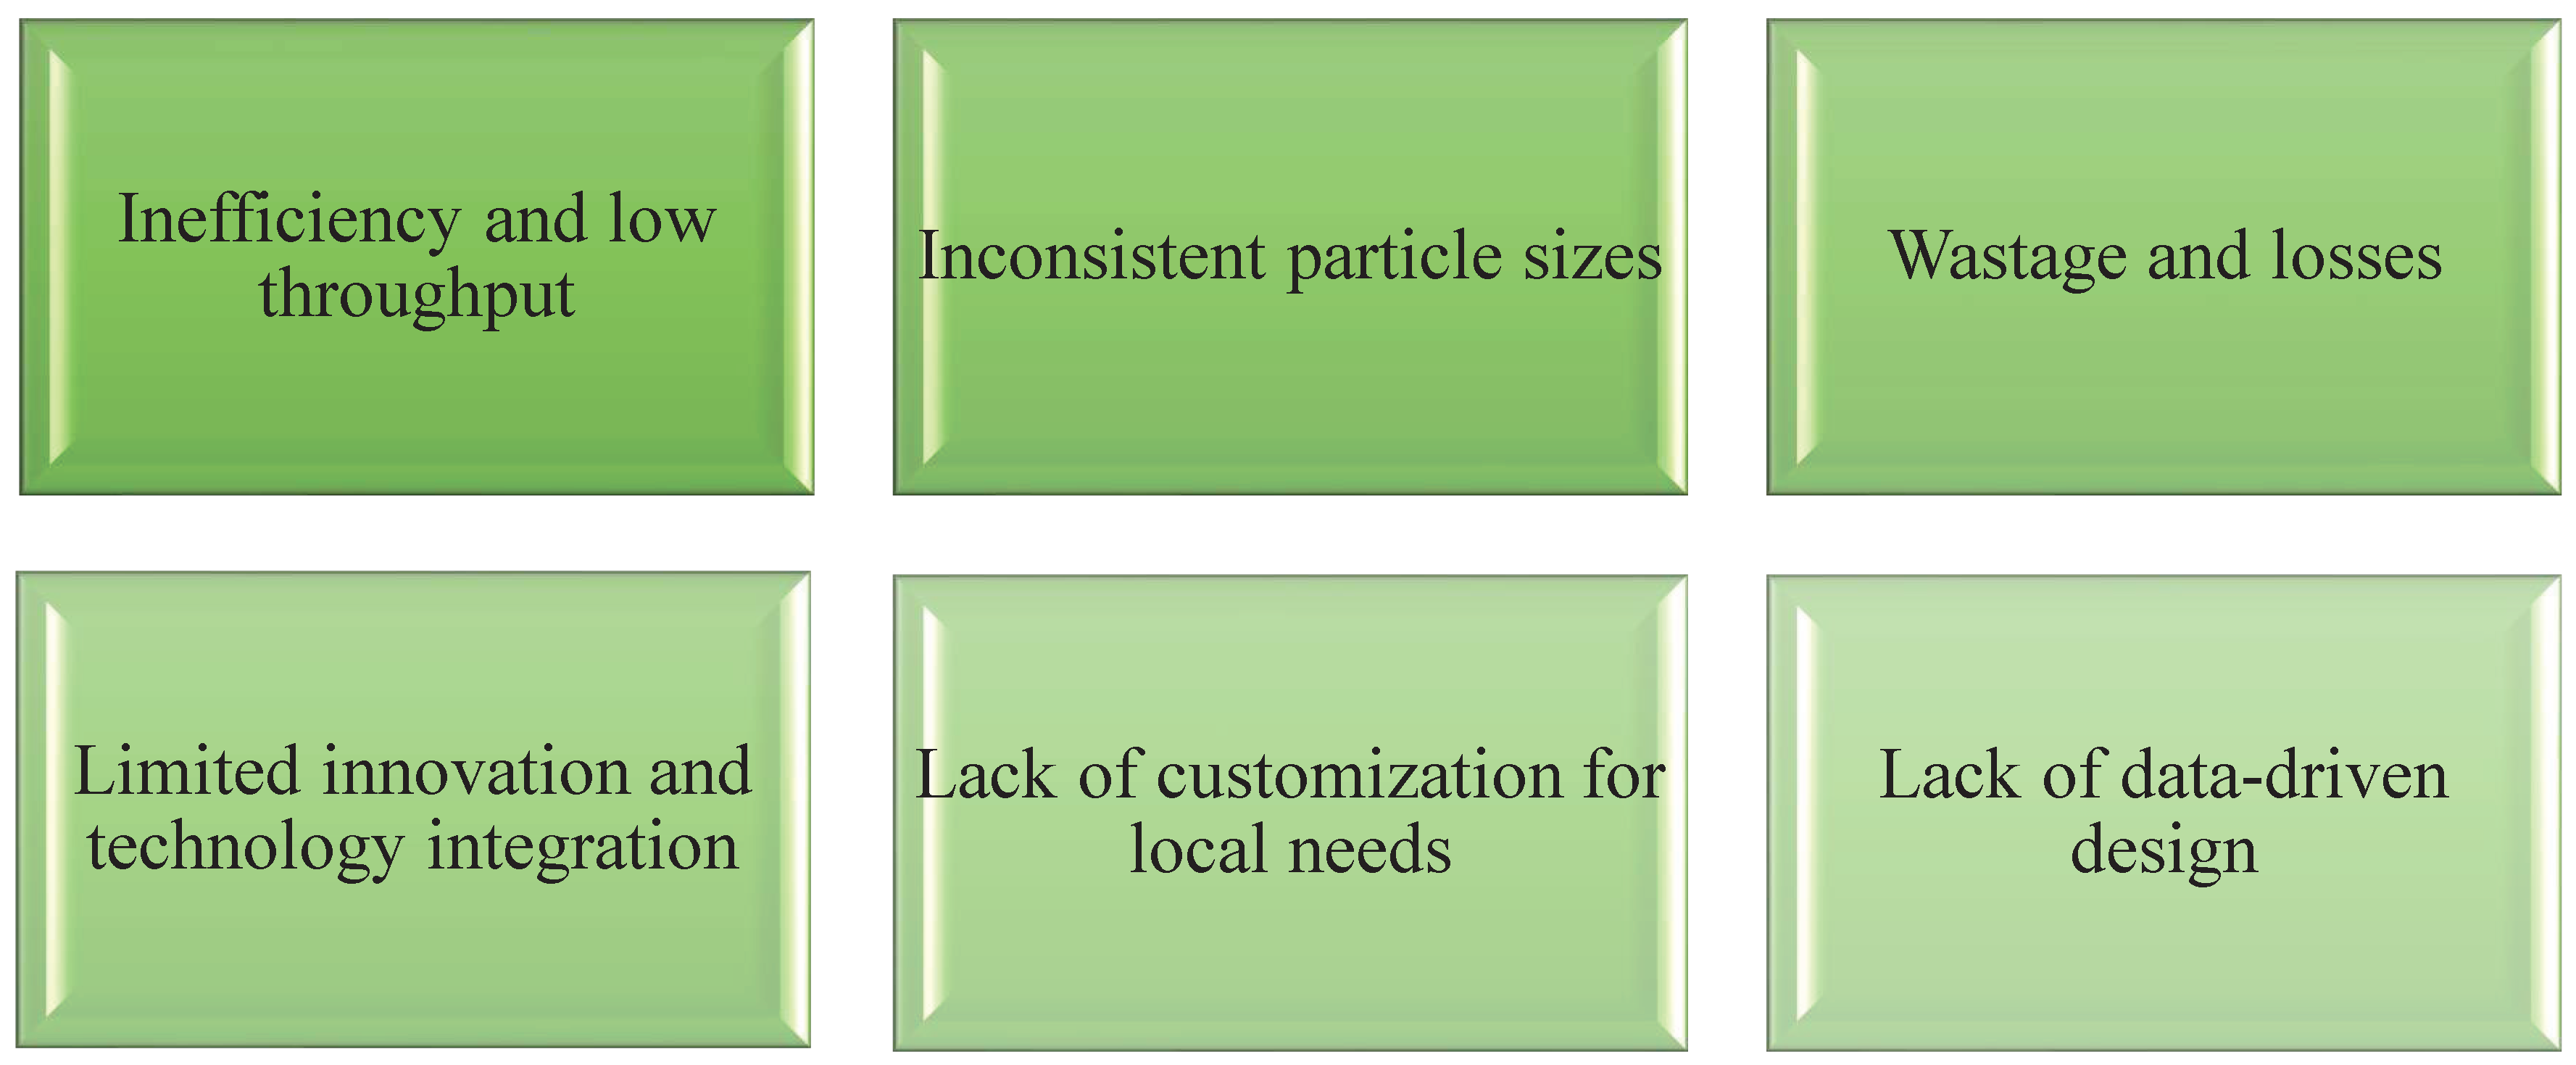
Figure 2.
Methodological approach overview.
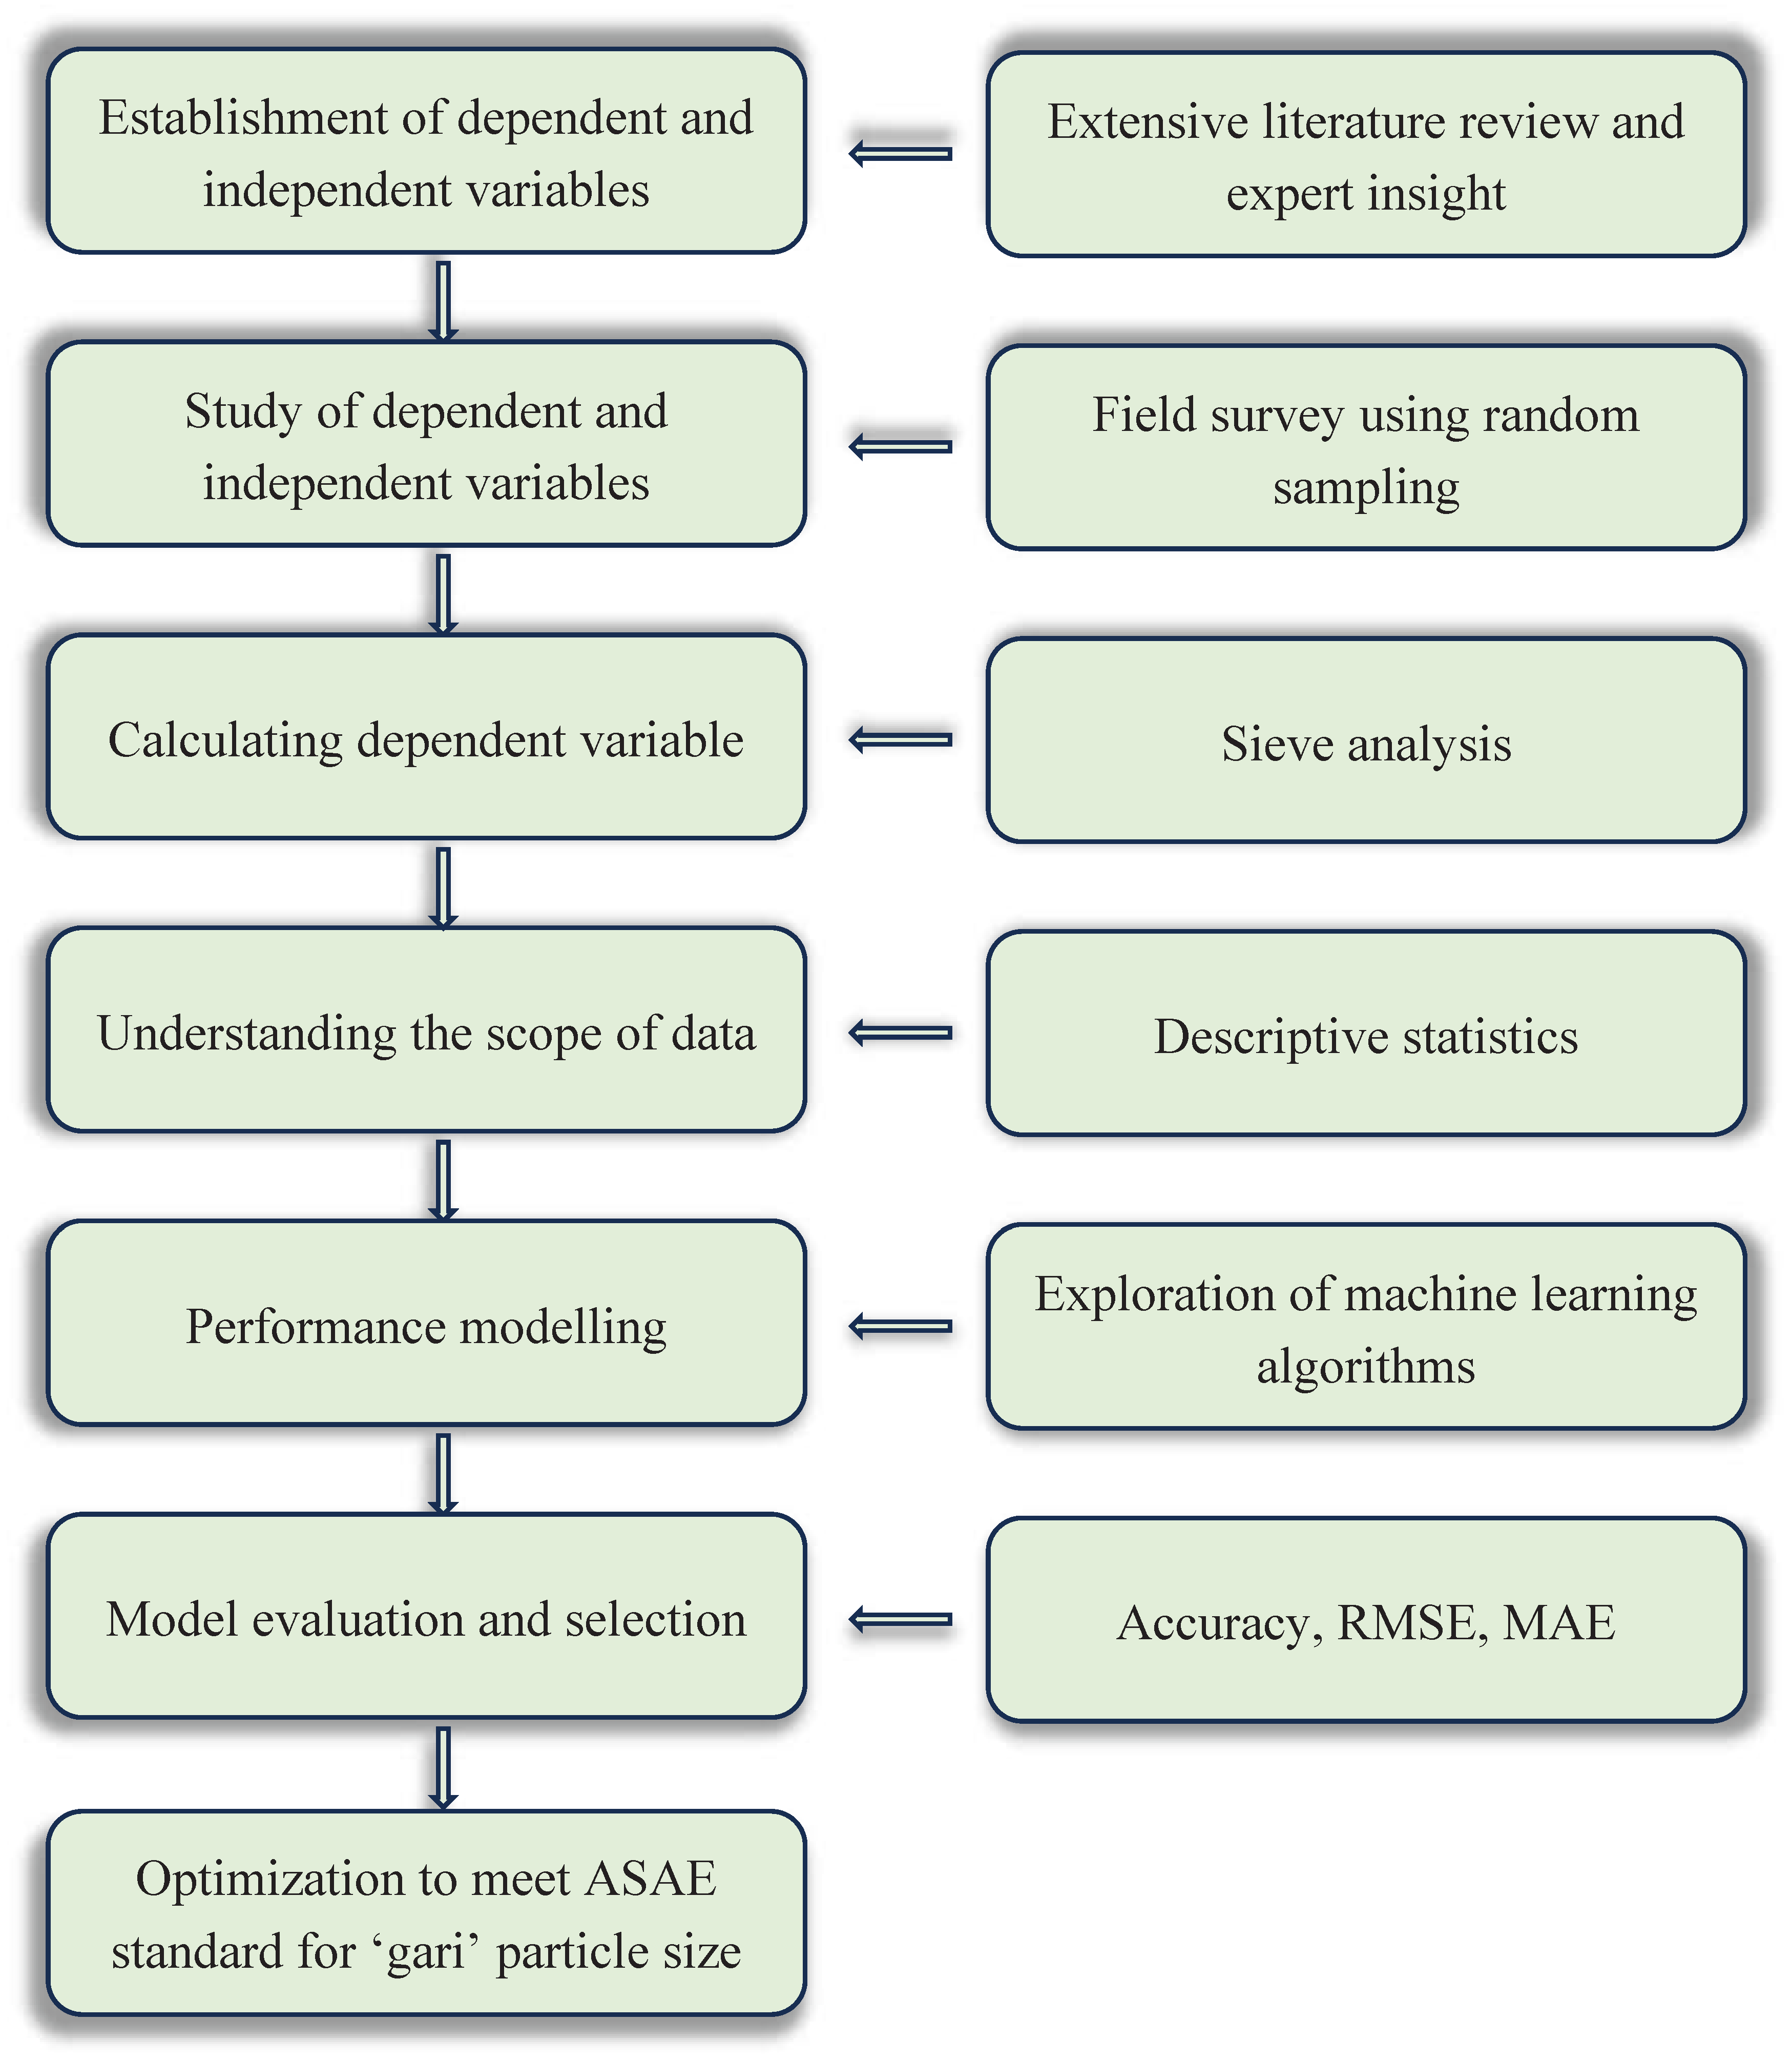
Figure 3.
Cassava grater and its major components.
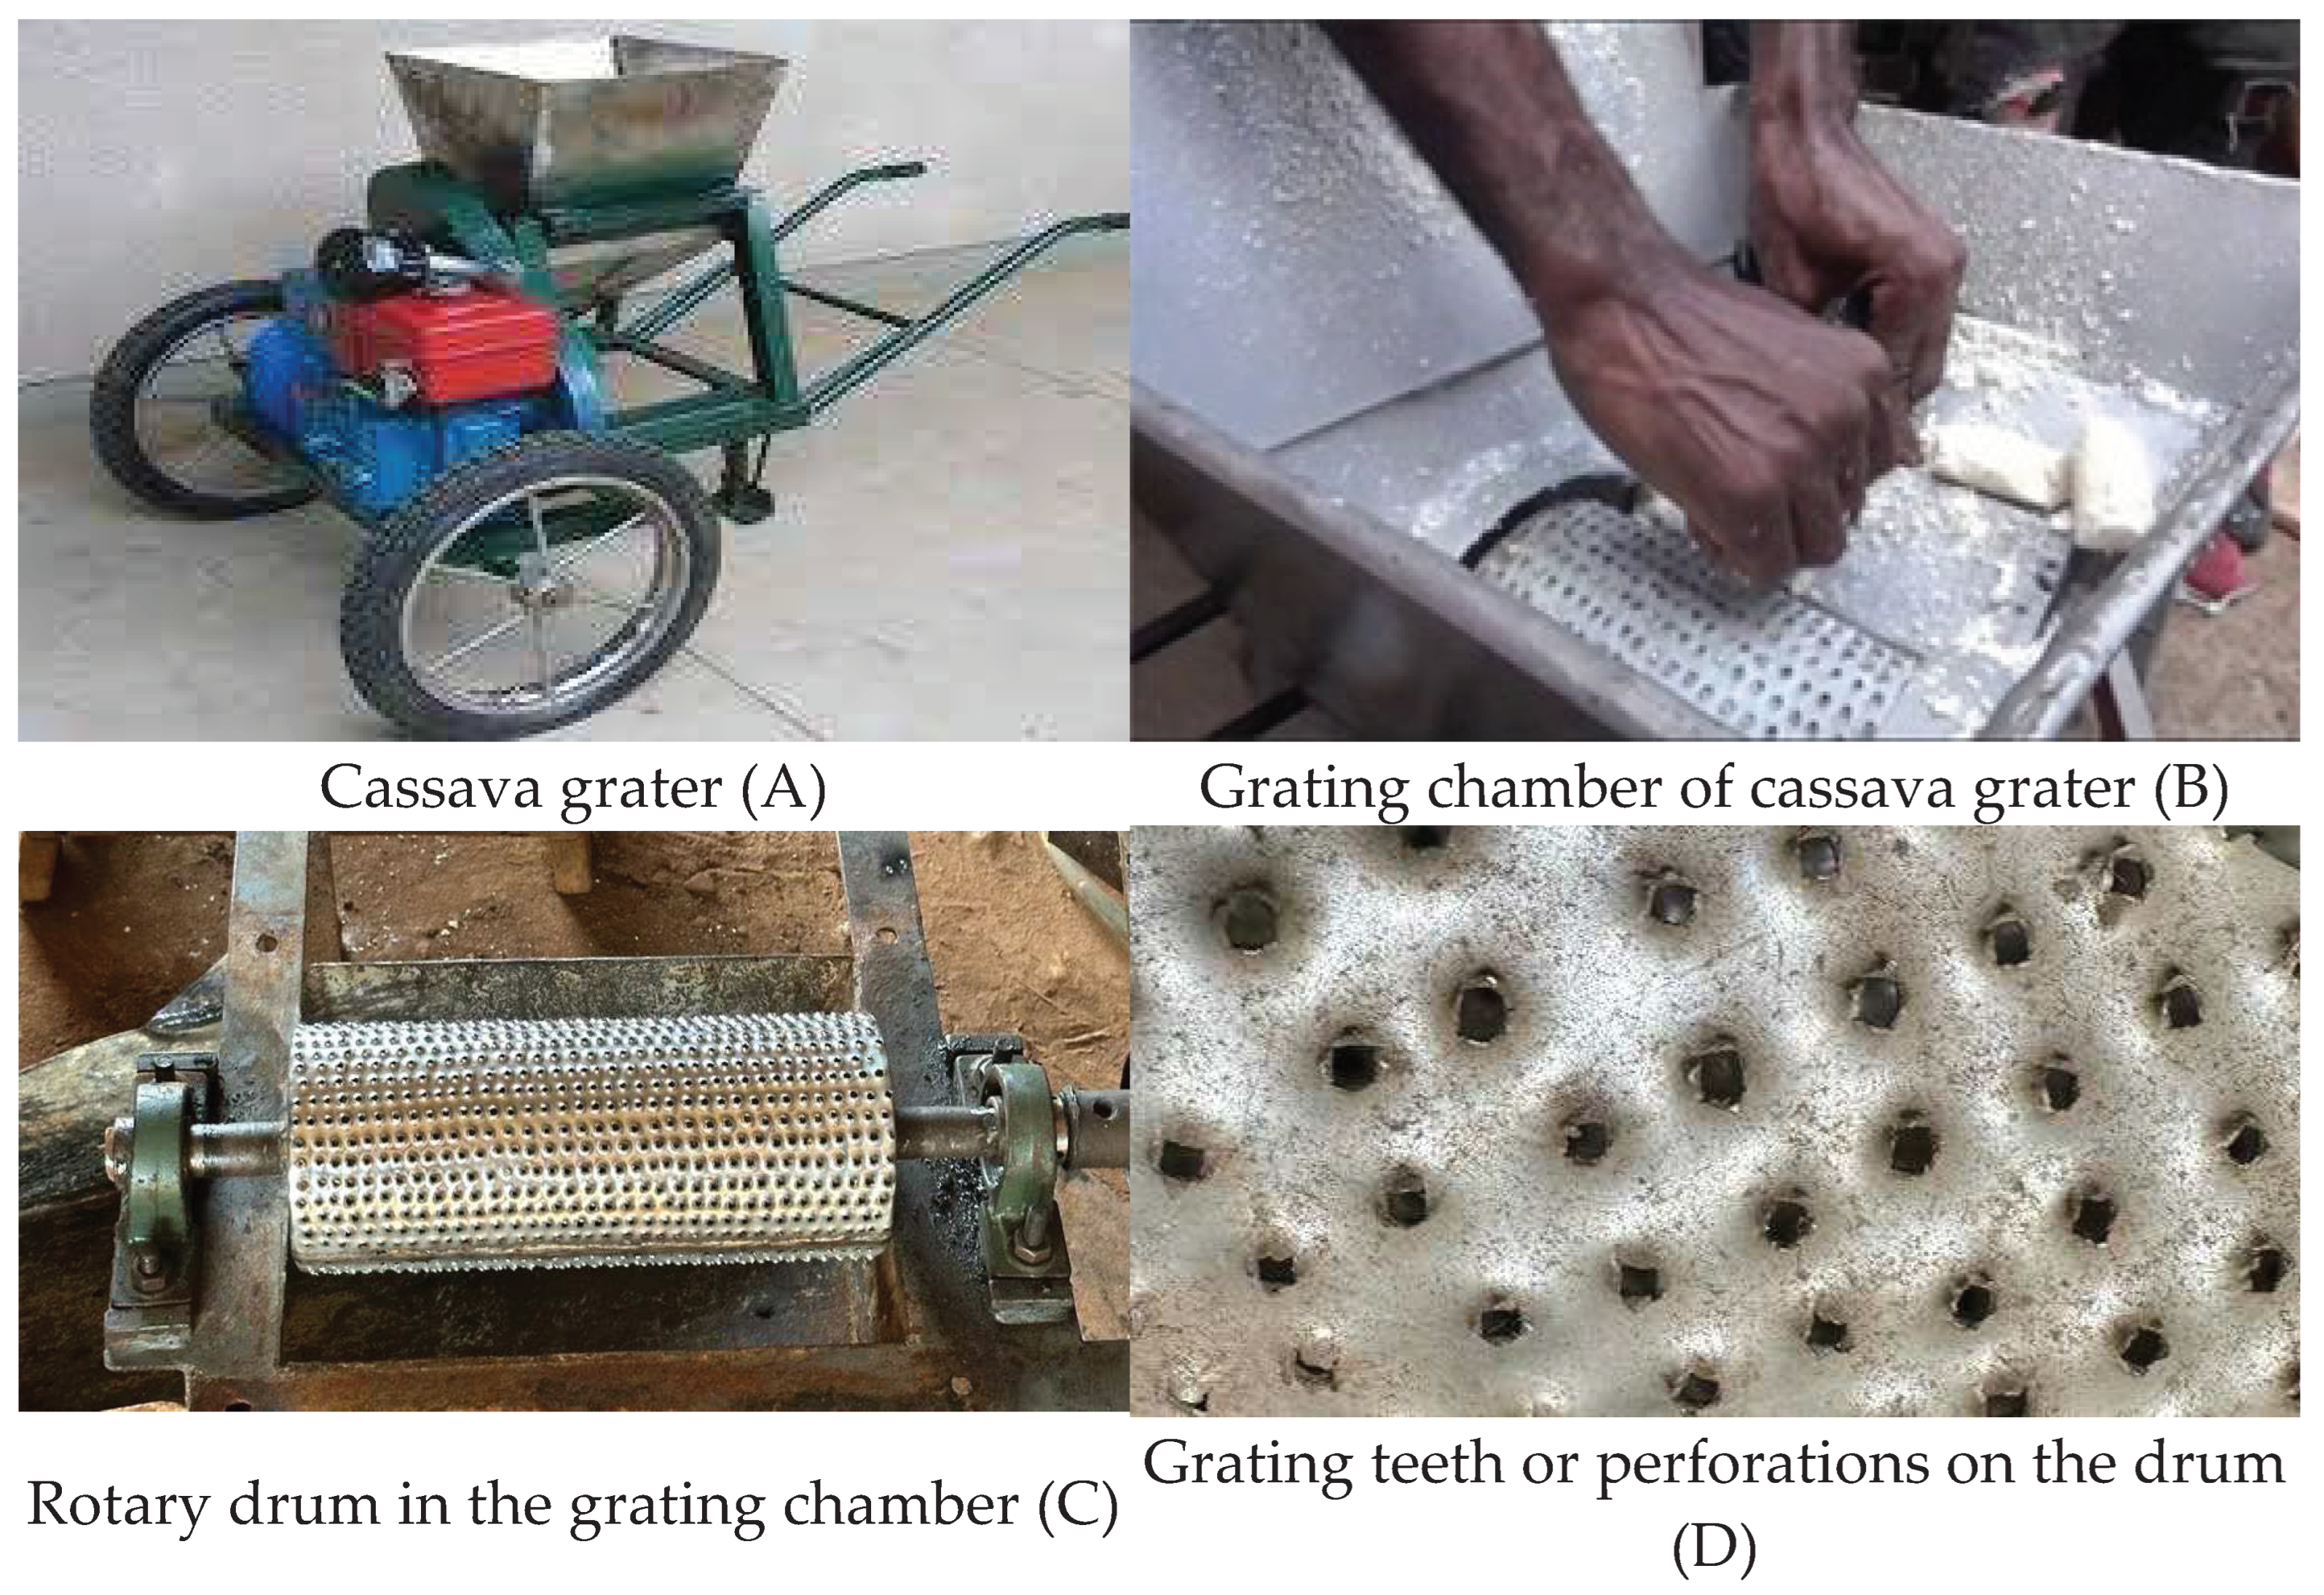
Figure 4.
The trend of cassava production in Ghana. Source: SRID 2019.
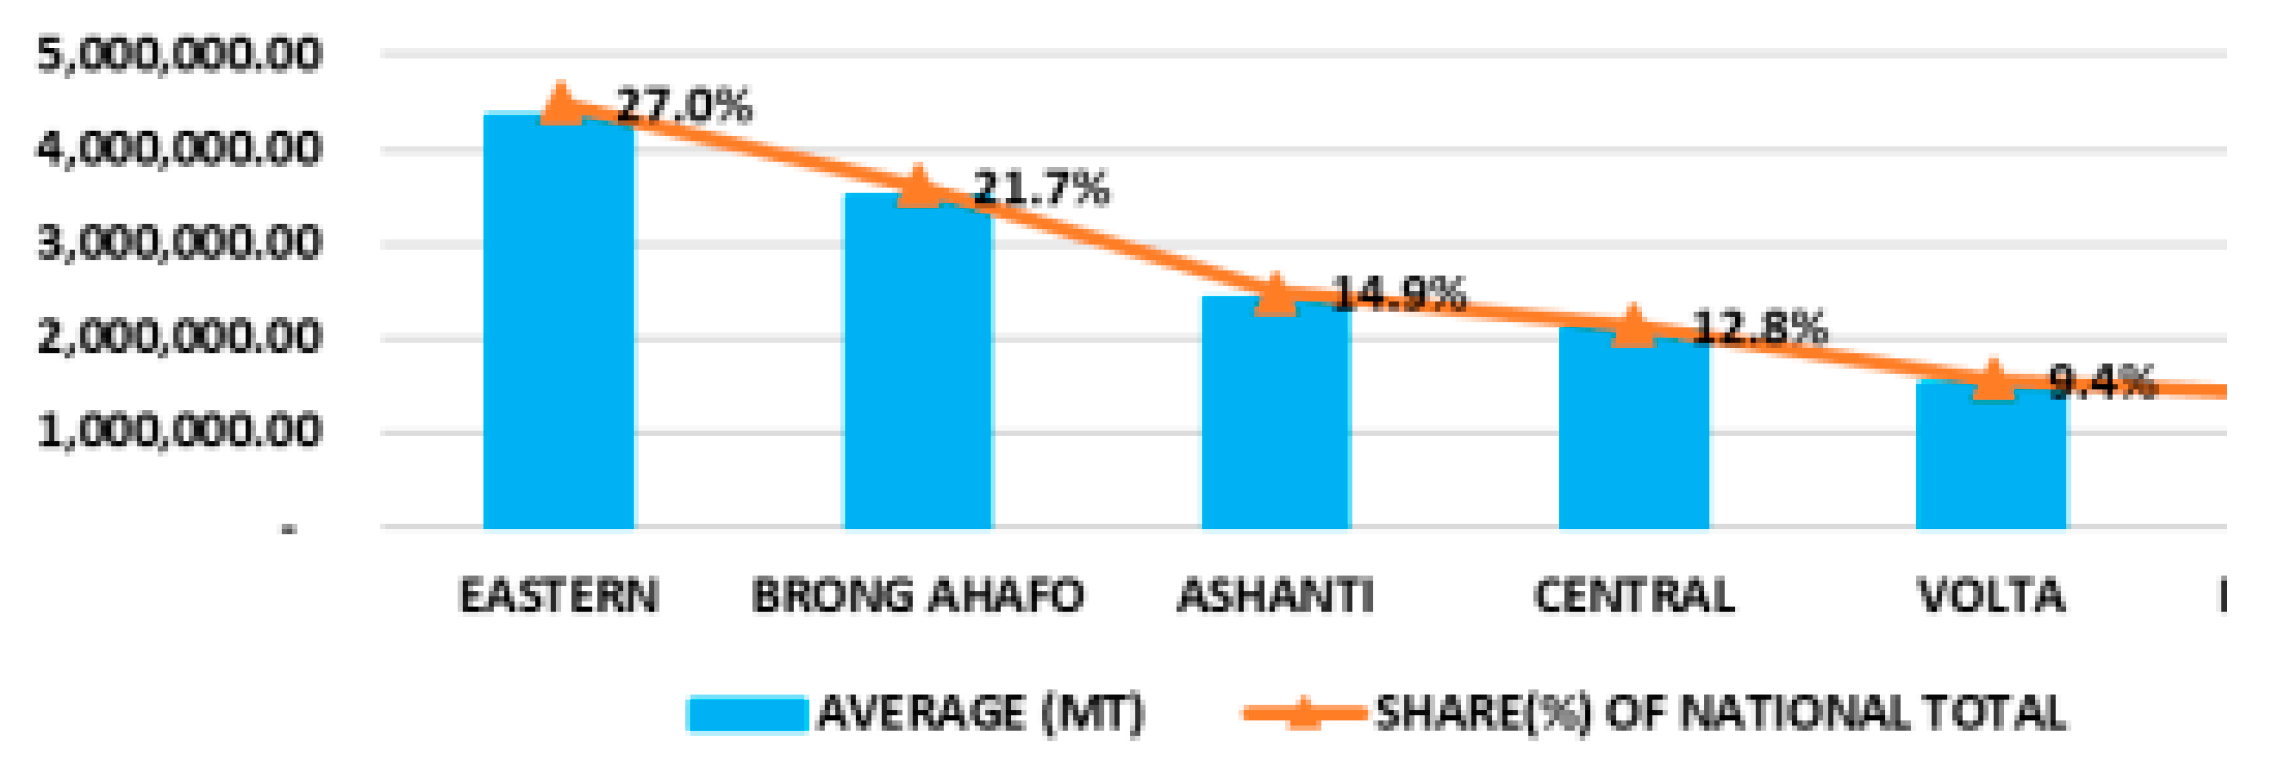
Figure 6.
Libraries used in Python environment.
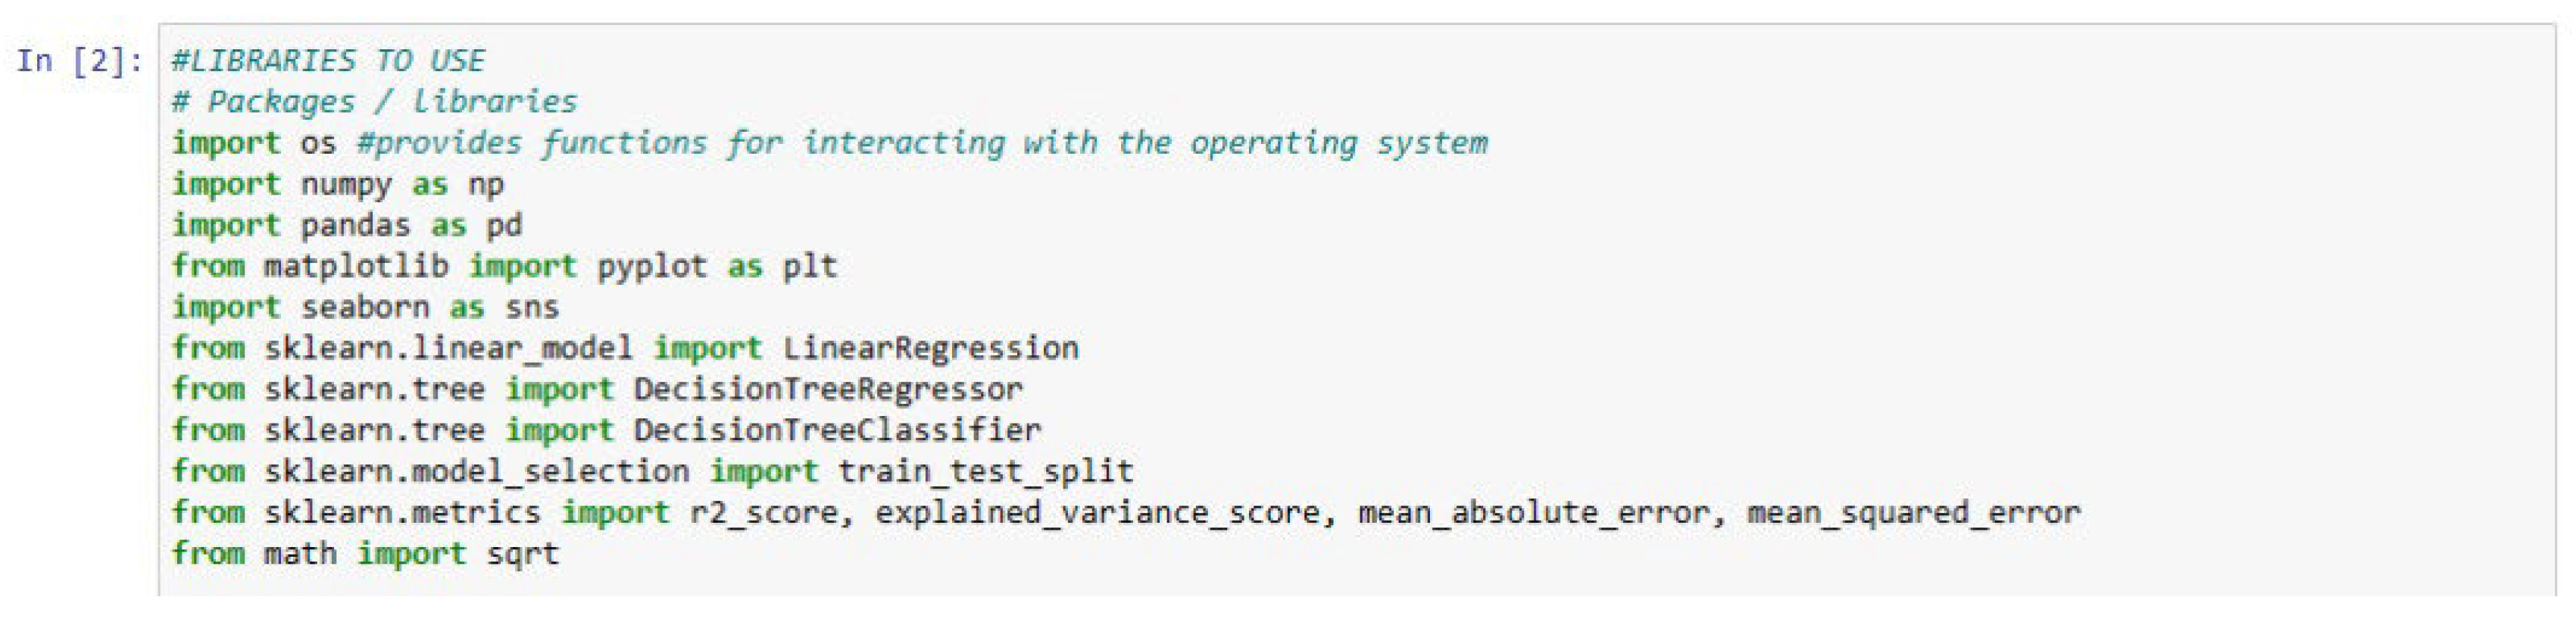
Figure 7.
Number of unique values for each variable highlighting machine disparity.
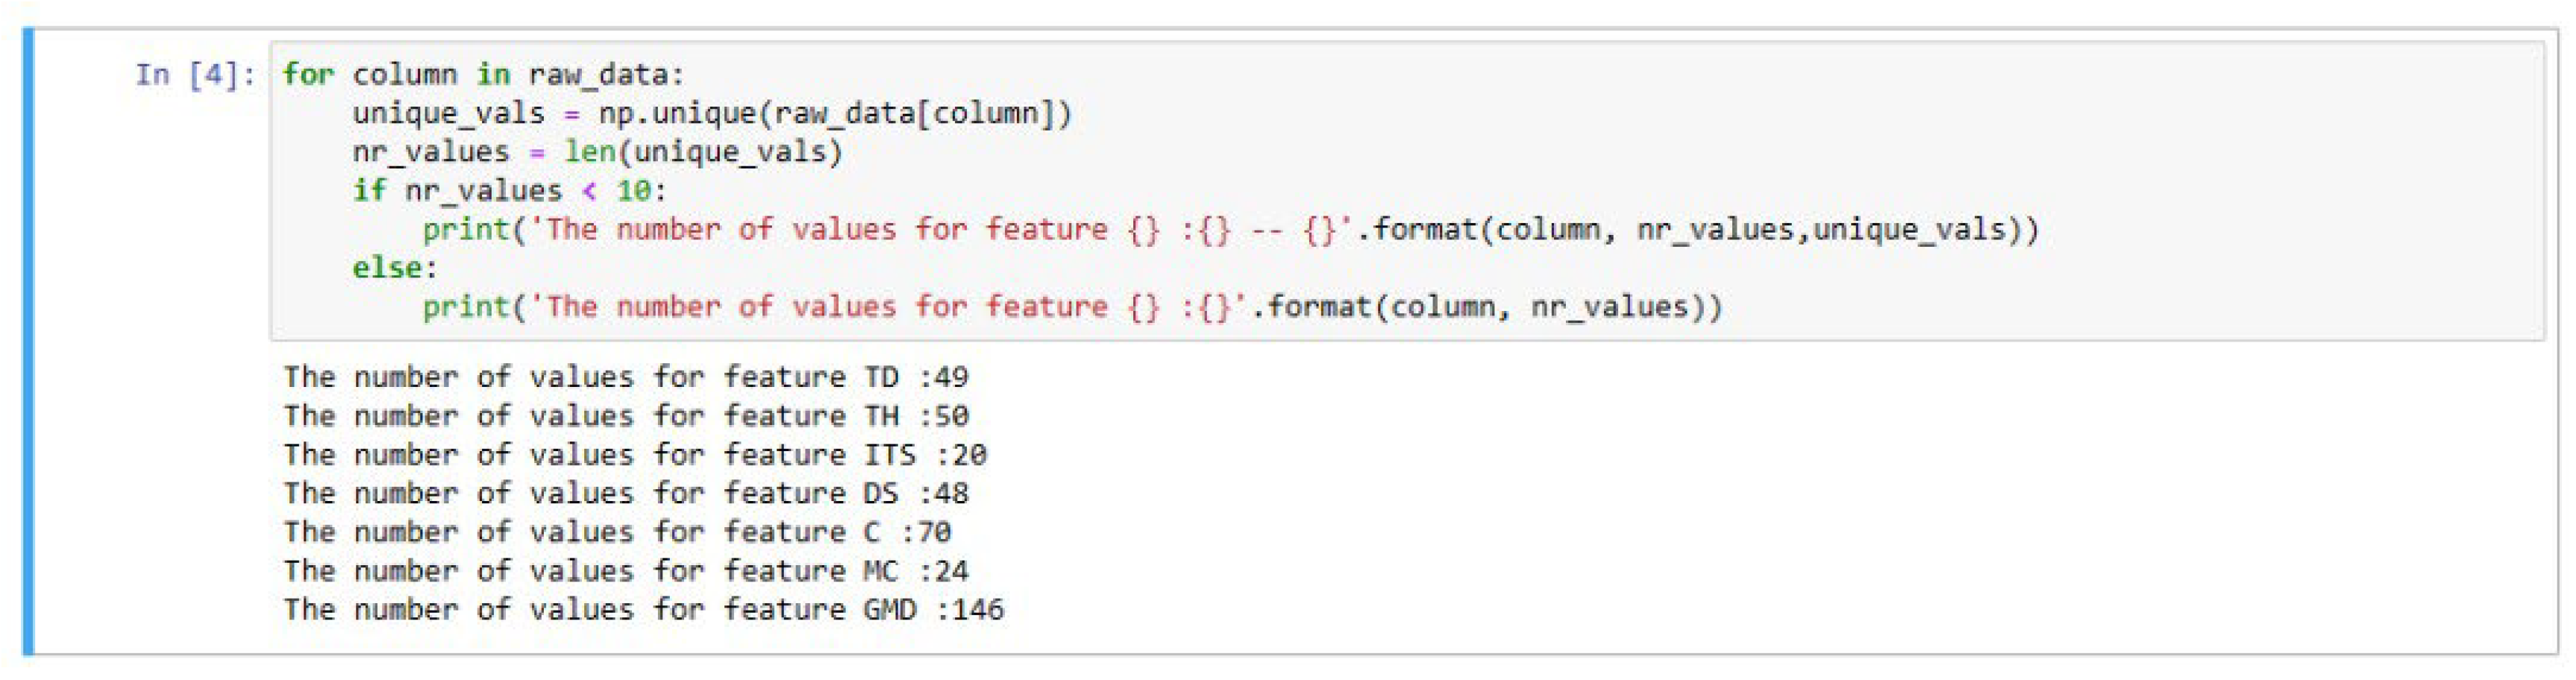
Figure 8.
Relationship between independent variables and dependent variables.
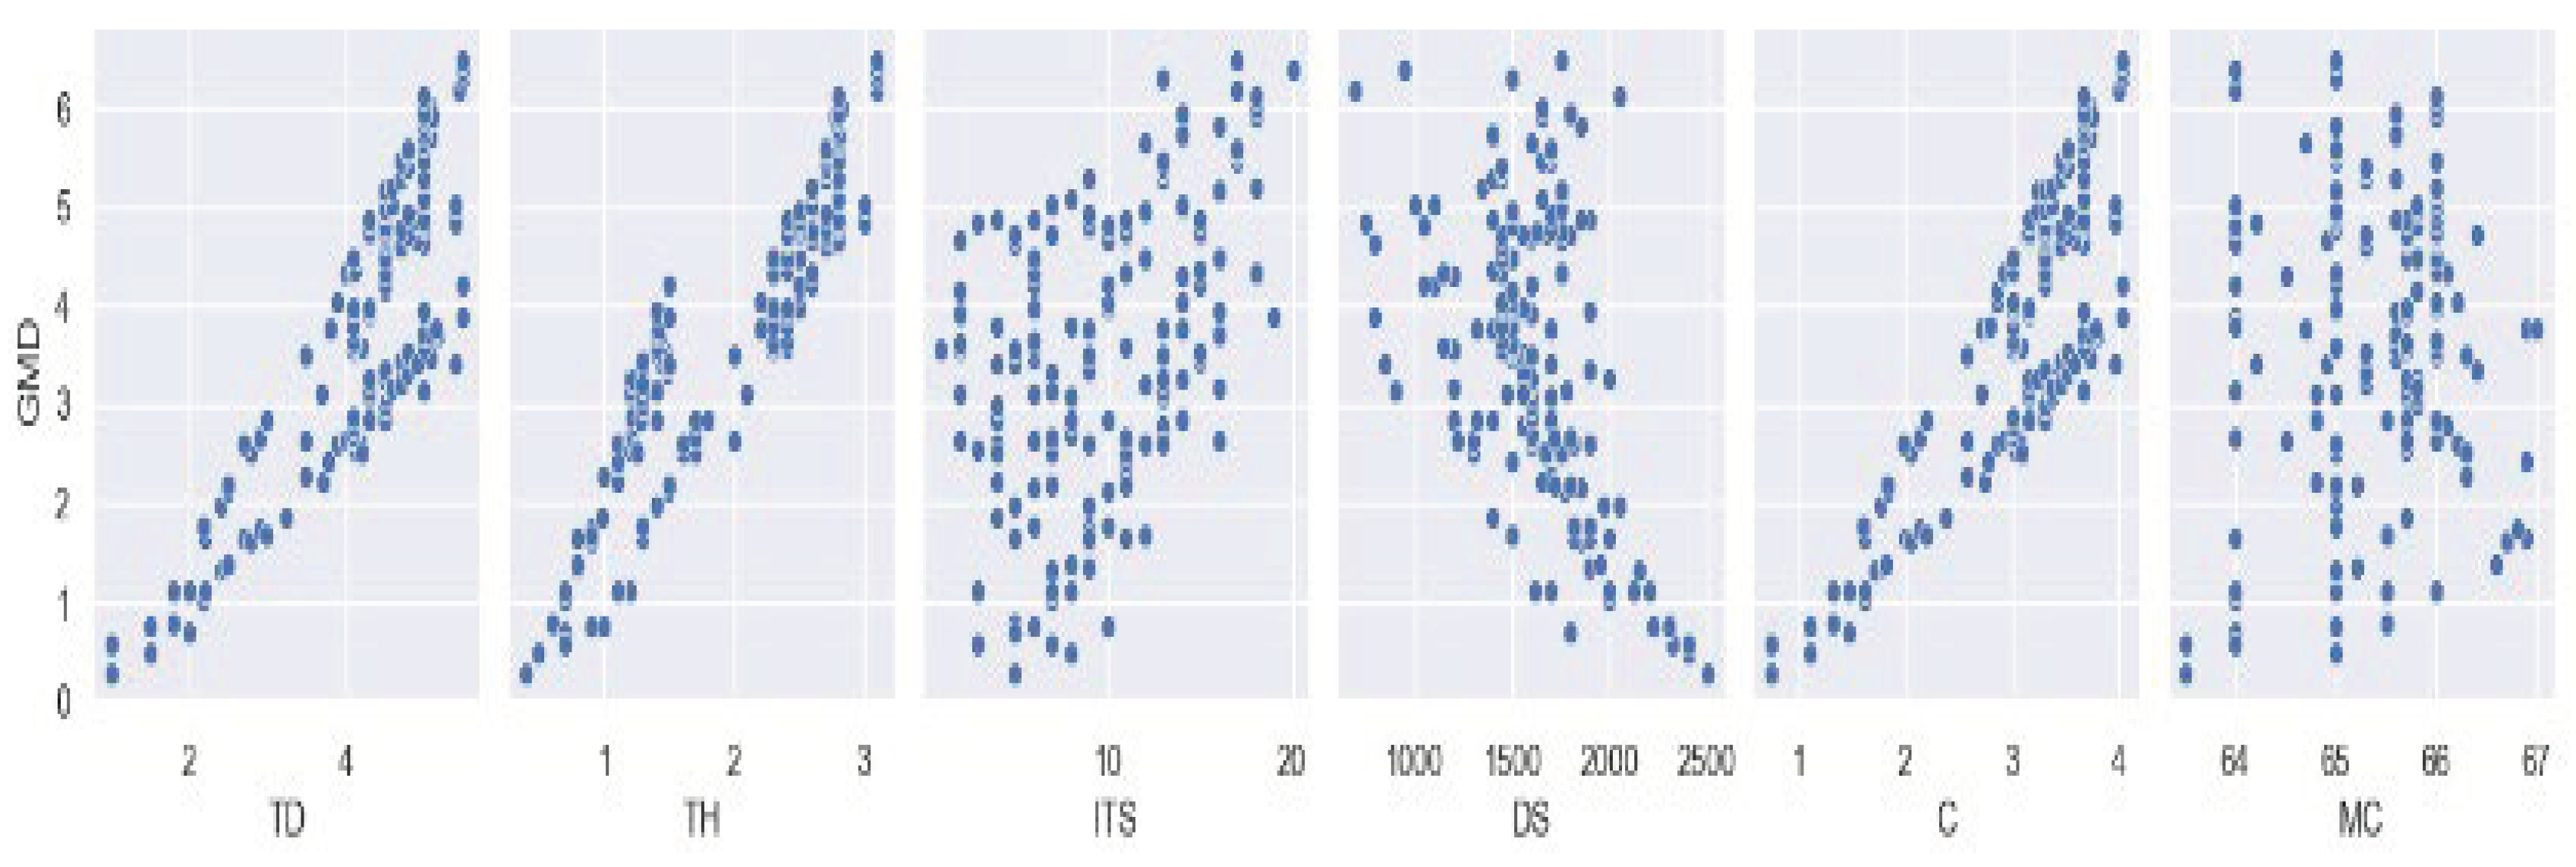
Figure 9.
Distribution of studied variables.
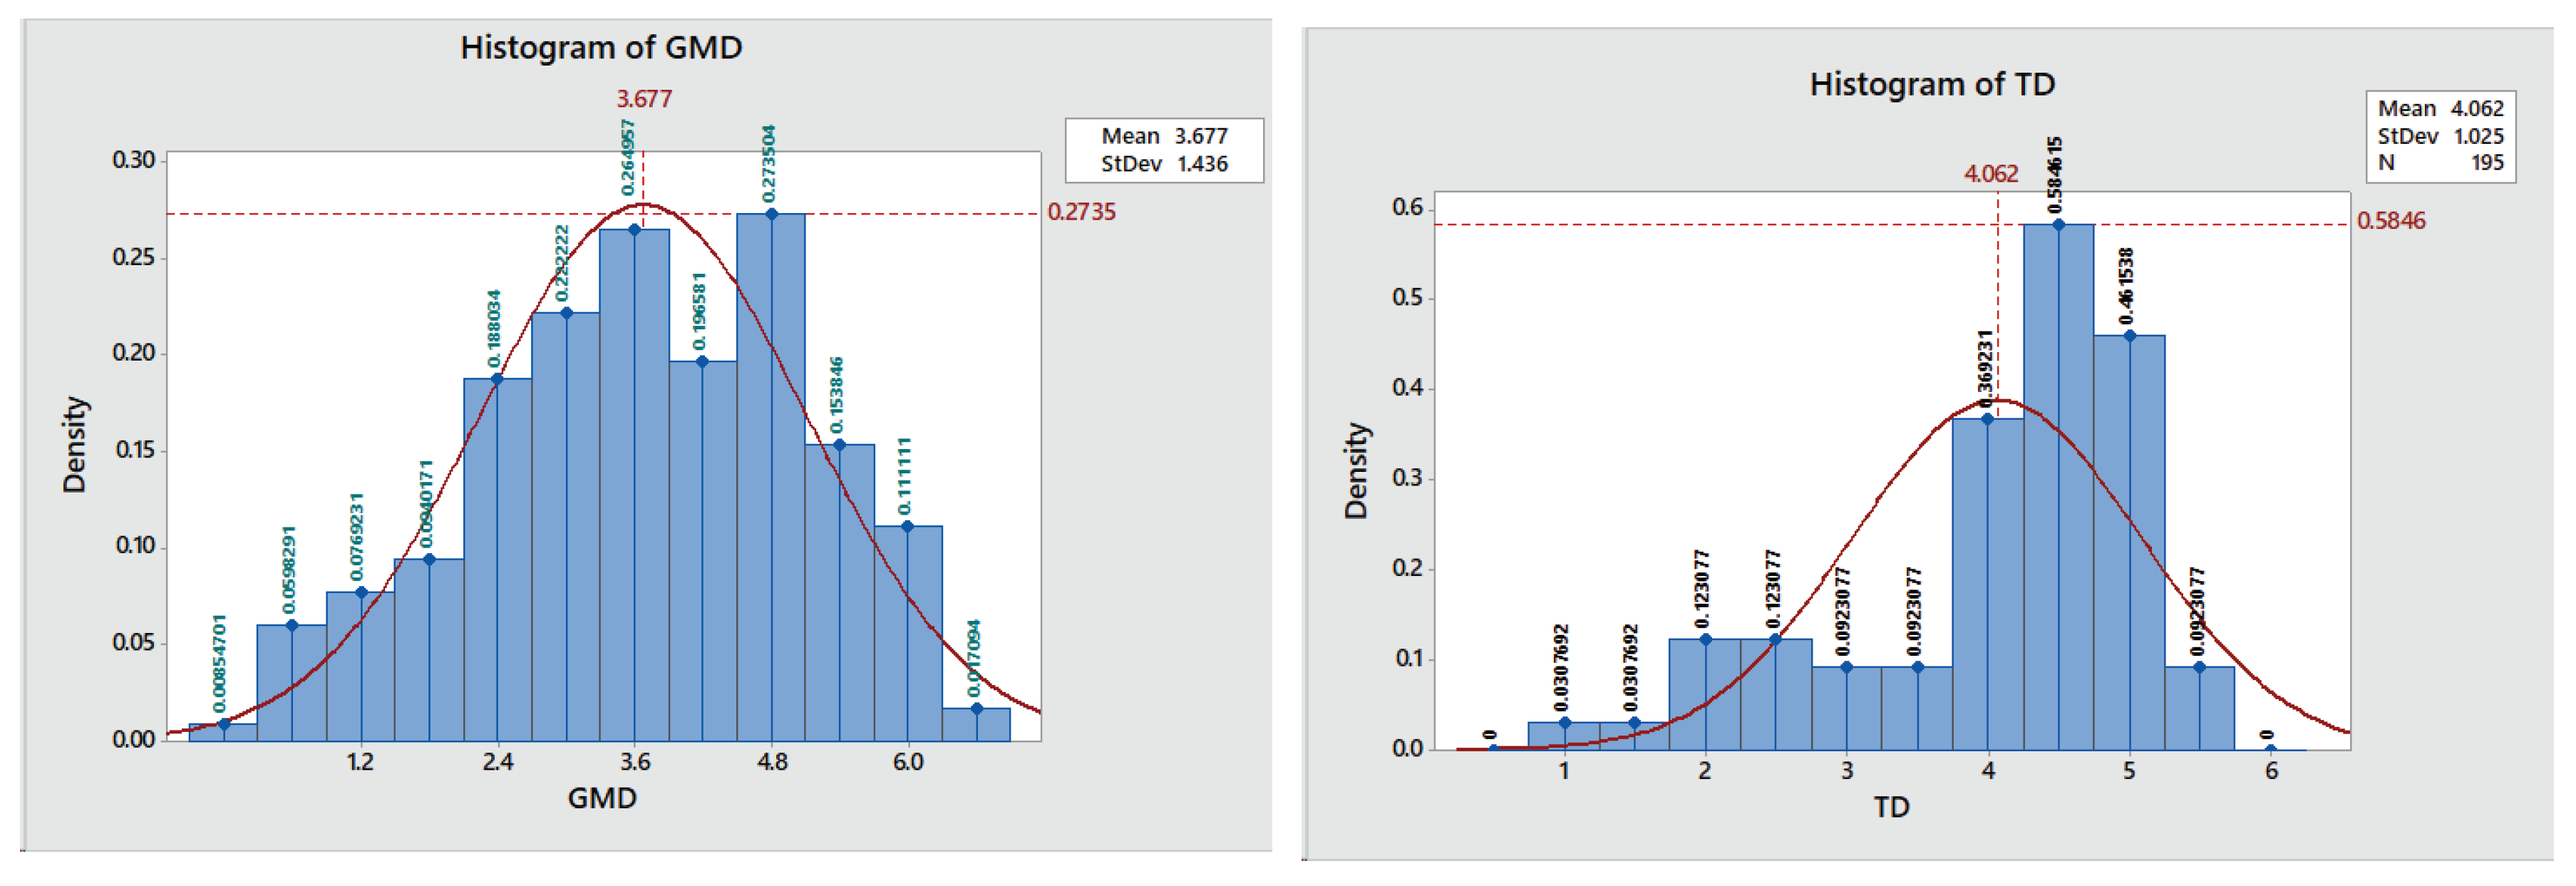
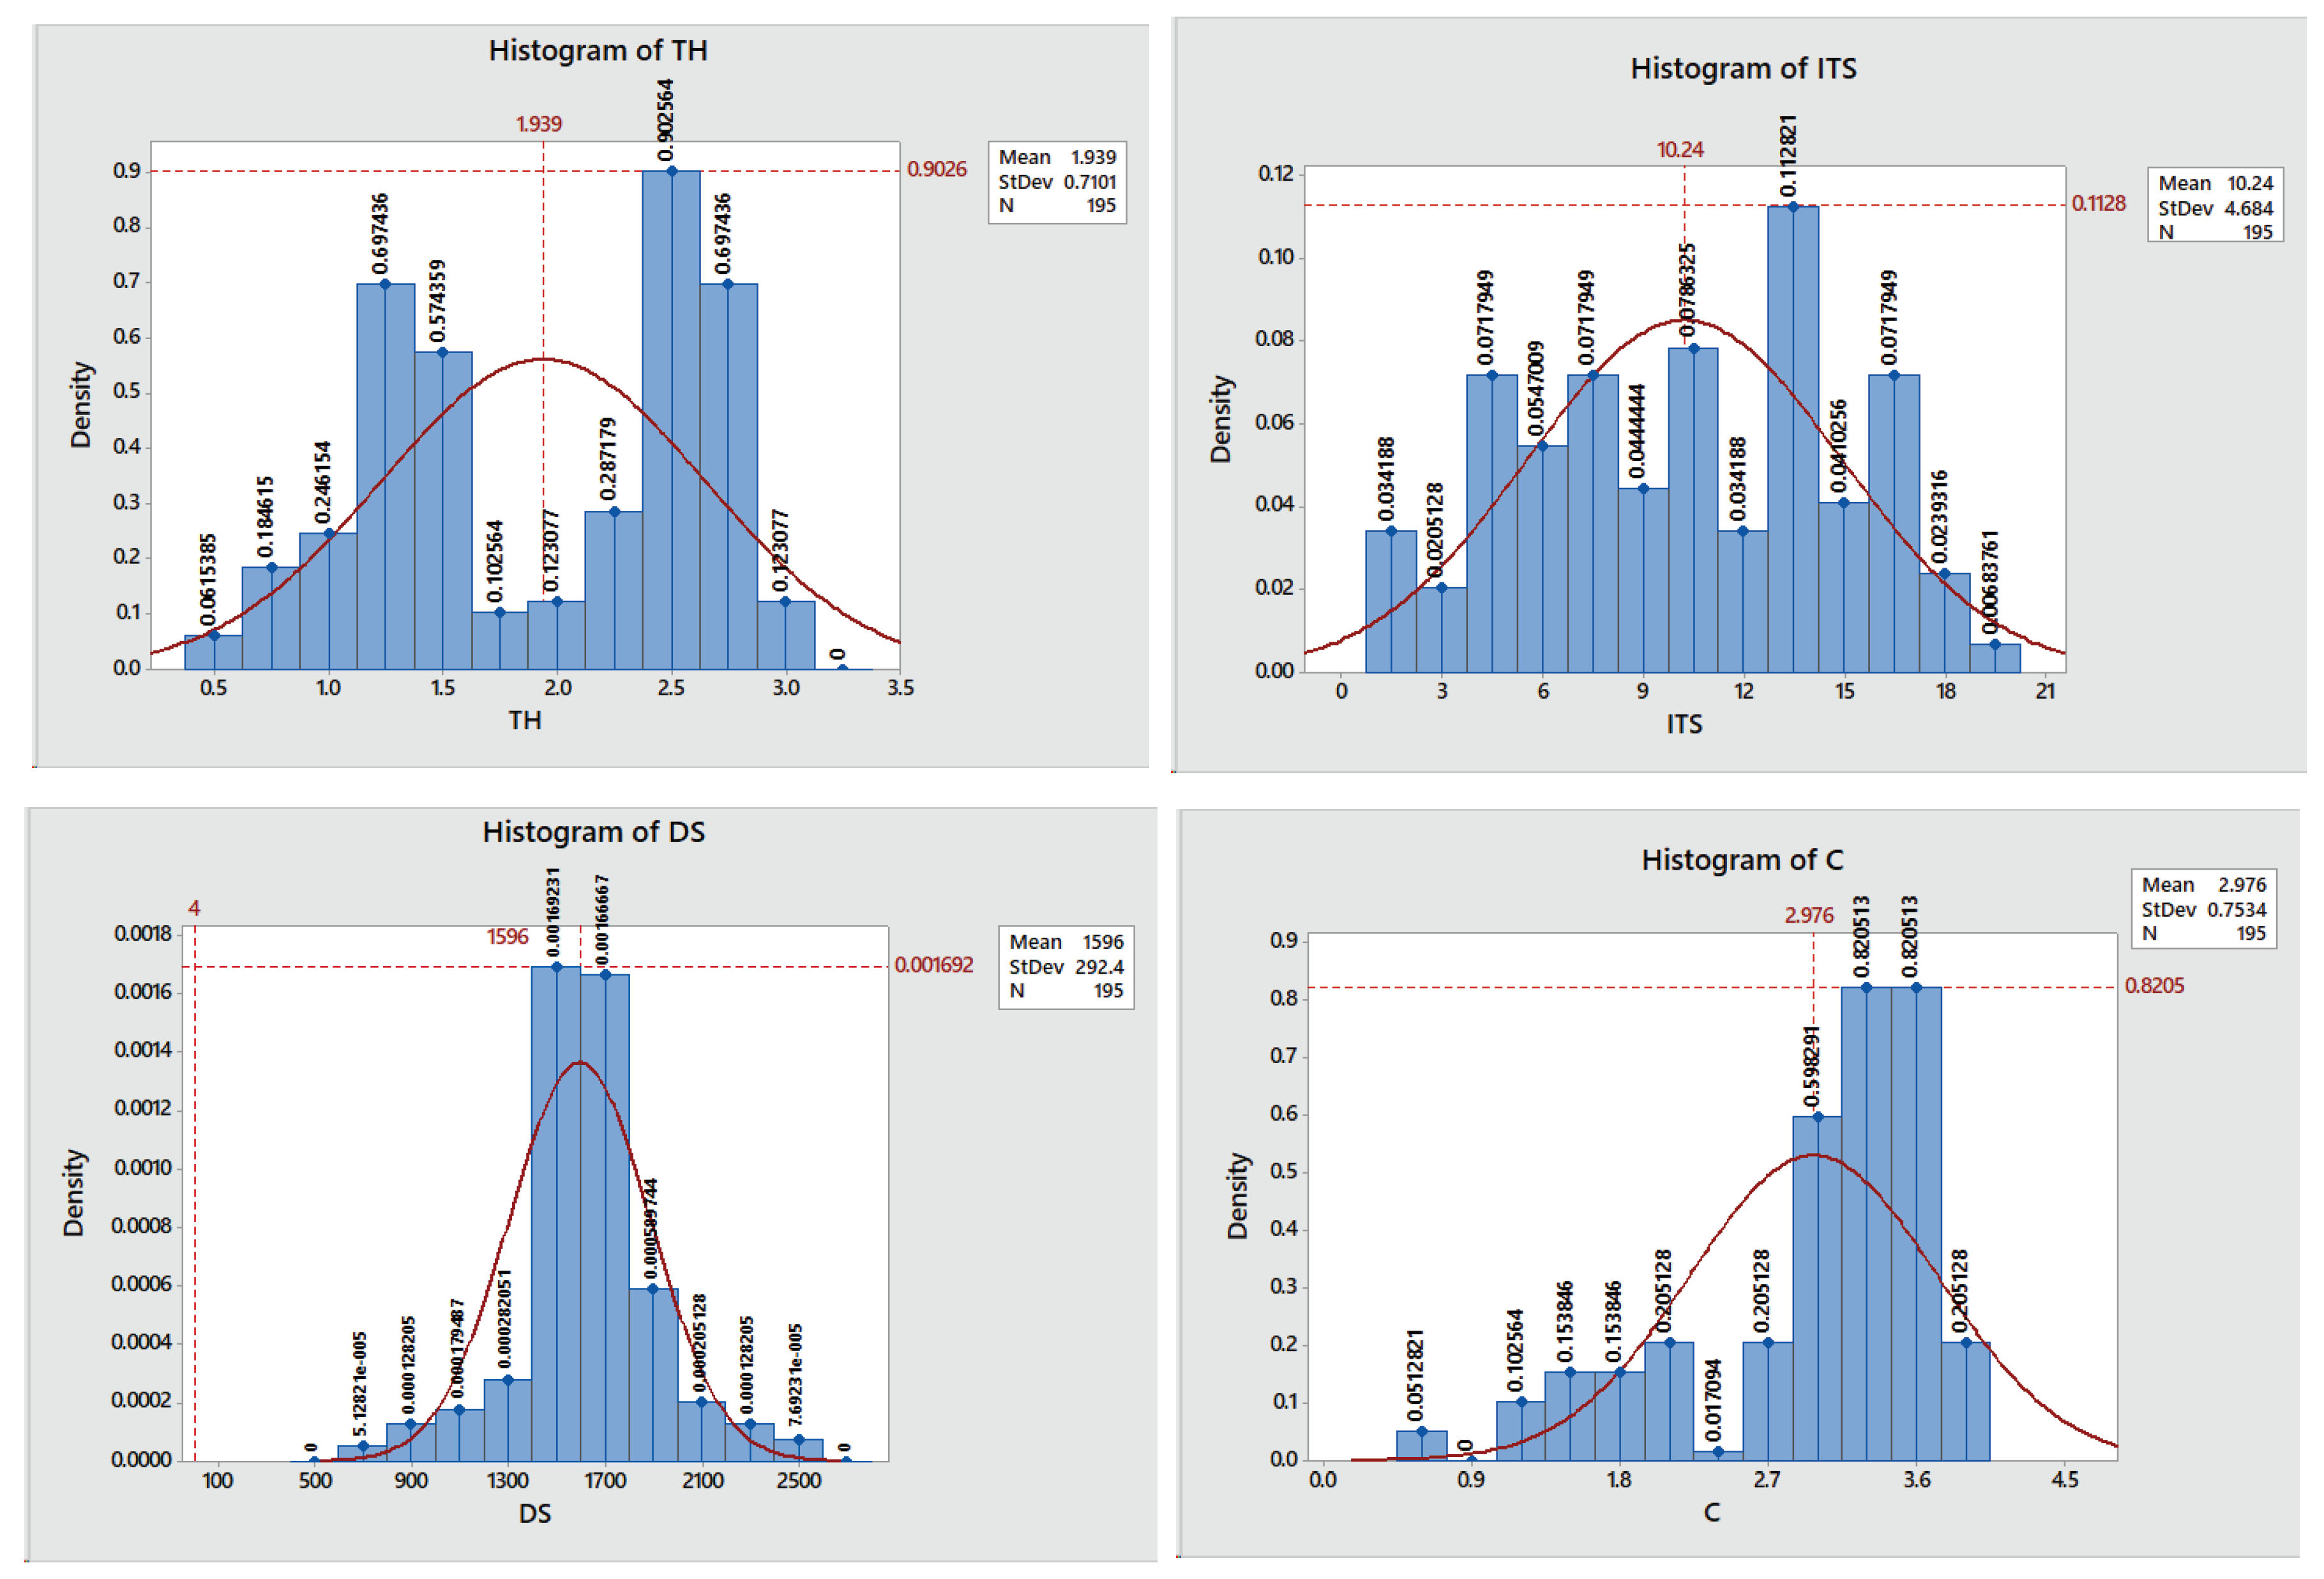
Figure 10.
Correlation between studied variables.
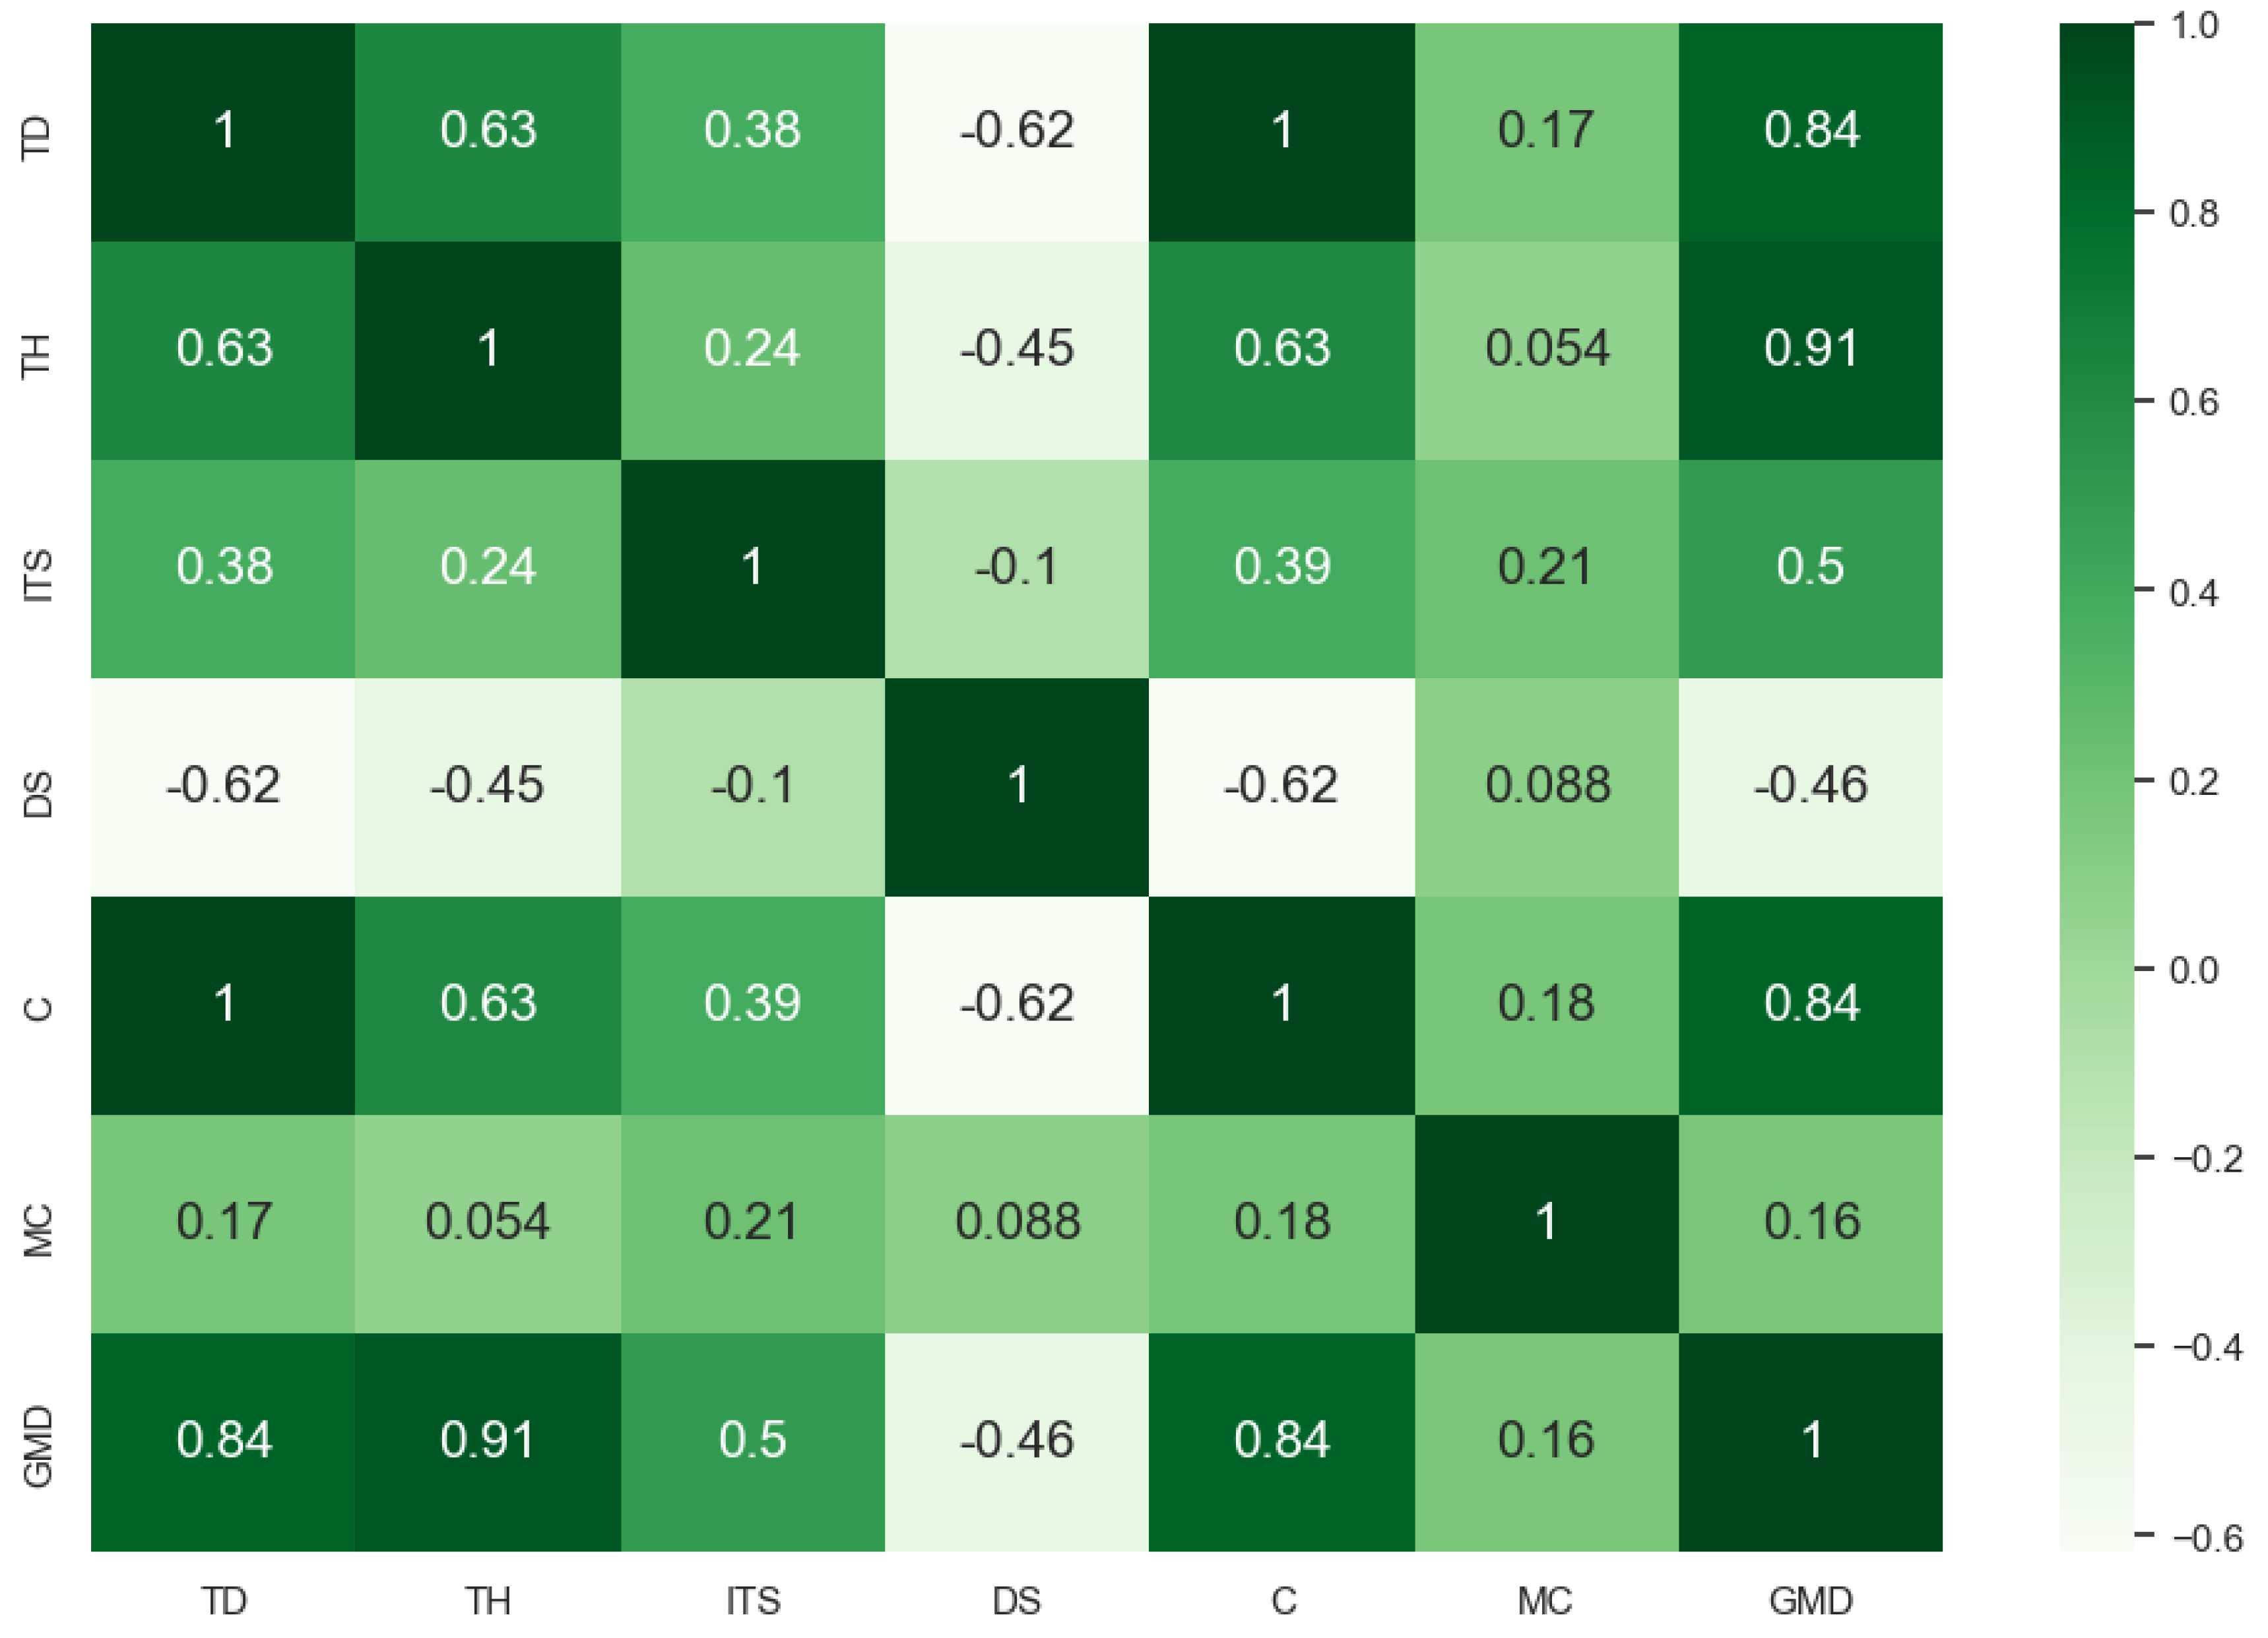
Figure 11.
Importance of studied variables or features.
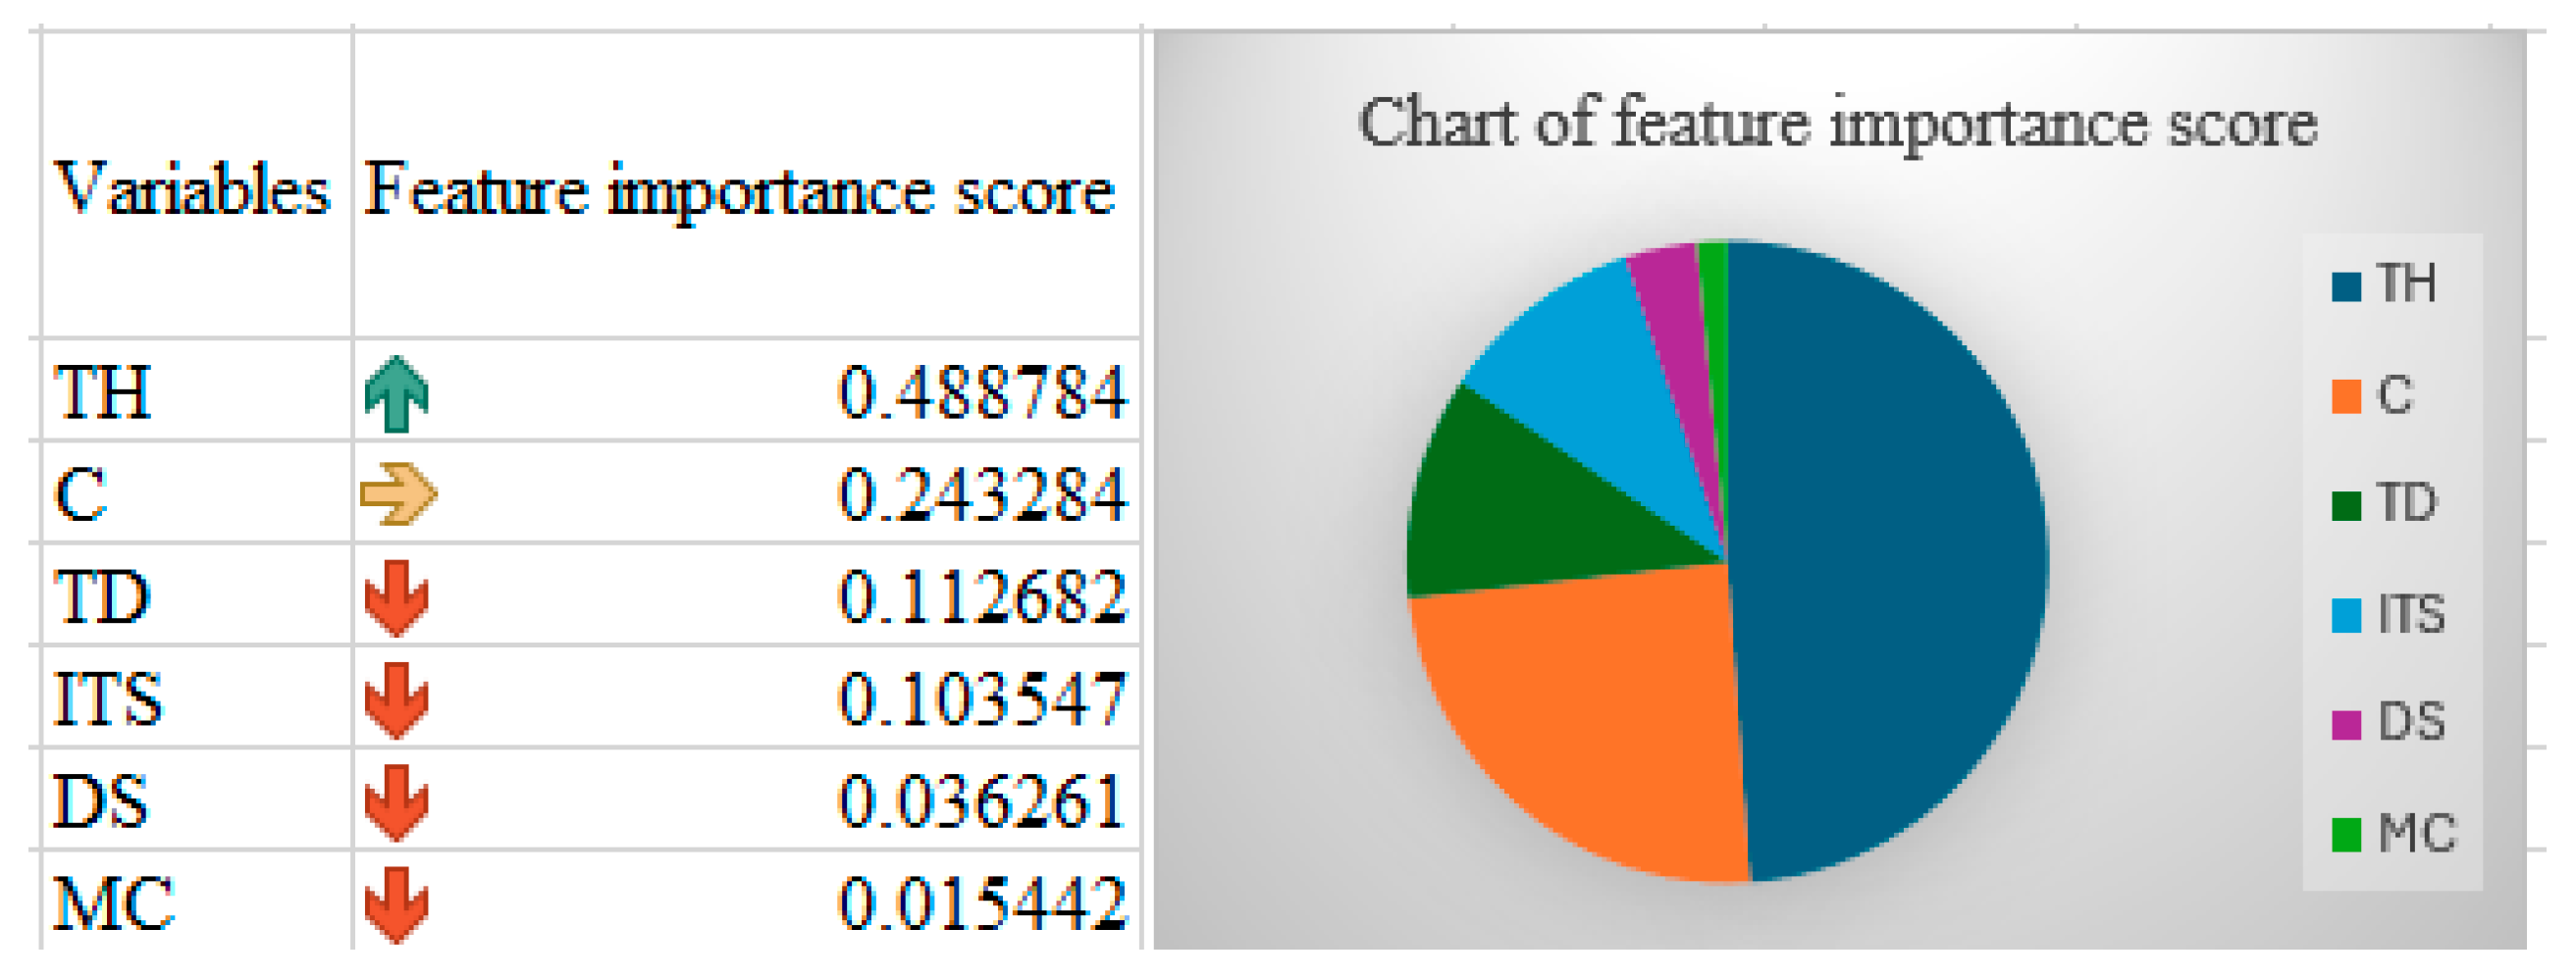
Figure 13.
Plot of model fit.
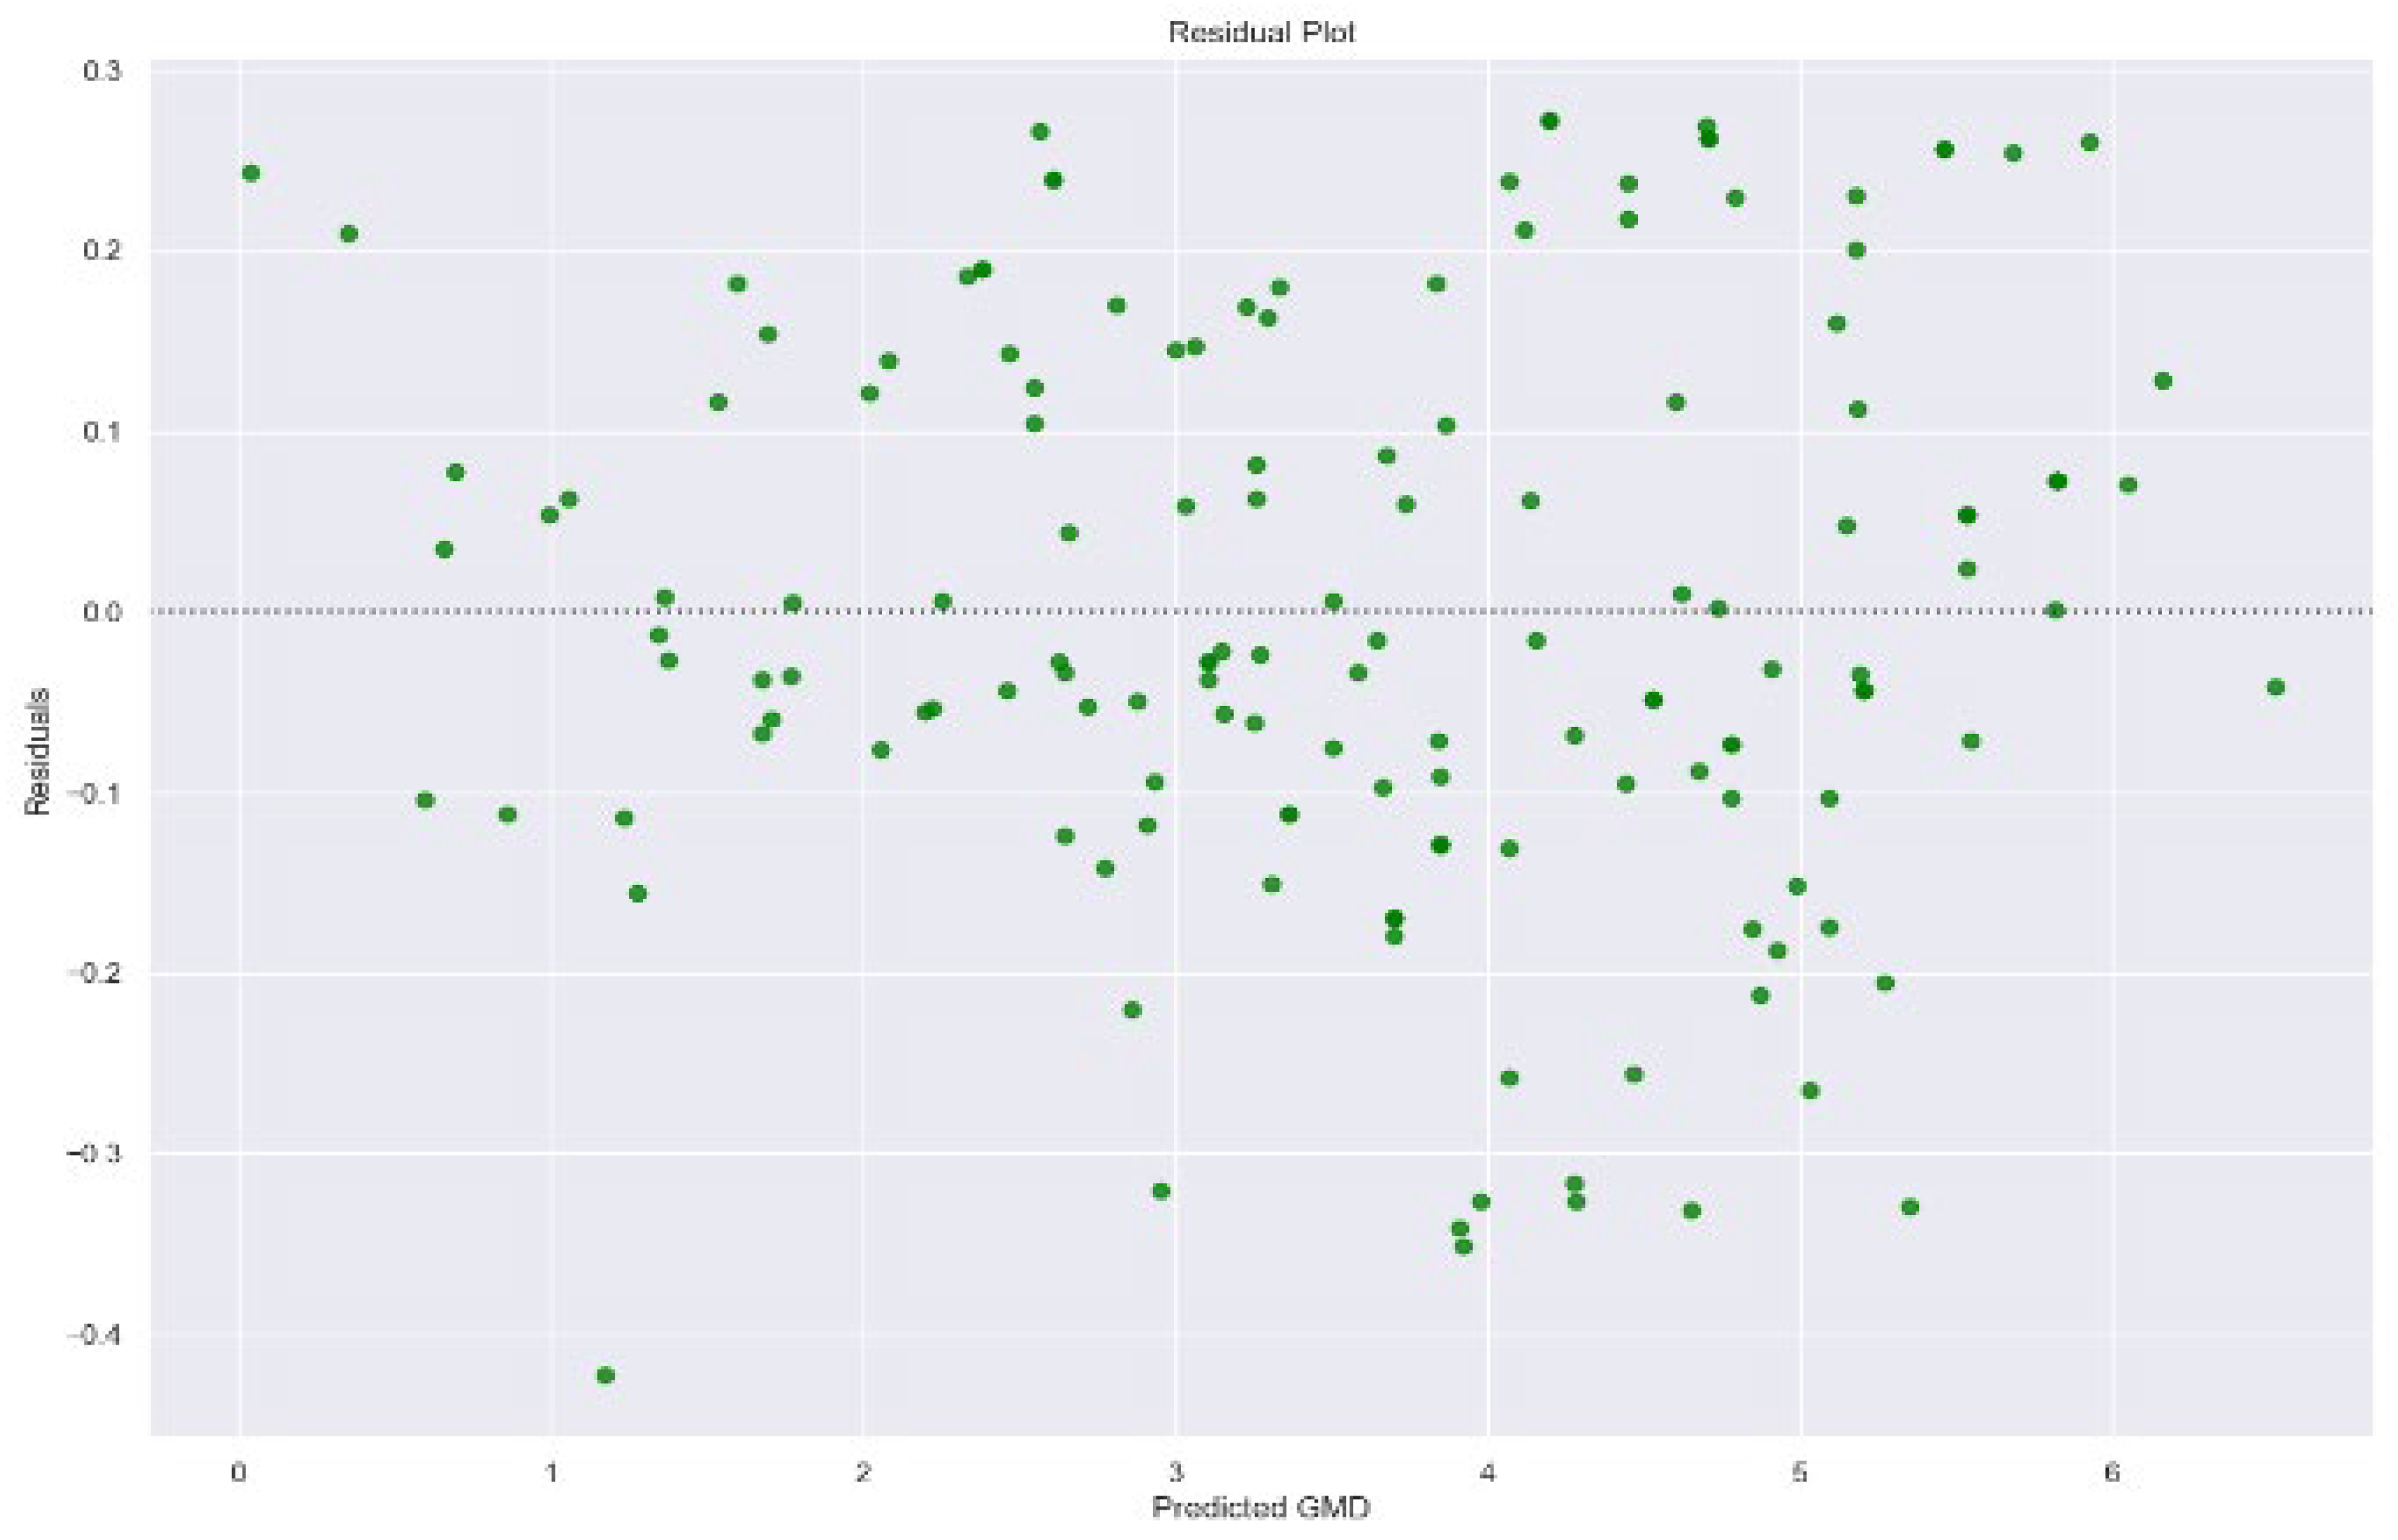
Table 1.
Description of independent and dependent variables.
| Features/Independent Variables | Description | Rationale |
|---|---|---|
| Tooth Height (TH) | The height of the perforation on the surface of a grating drum was measured with a vernier caliper | The height of the grating teeth influences the depth to which the cassava roots are grated. A proper tooth height ensures efficient grating, preventing over-grating or under-grating, which can affect the texture and quality of the mash. |
| Inter-Tooth Spacing (ITS) | The distance between individual perforations or teeth measured with a vernier caliper | The distance between individual grating teeth determines how closely the cassava roots are grated. An optimal spacing ensures even grating and prevents blockages, contributing to consistent mash quality. |
| Tooth Diameter (C) | The diameter of the perforation or grating teeth was measured with a vernier caliper | The diameter of the grating teeth impacts the size of grated cassava particles. Controlling tooth diameter is crucial for achieving the desired texture and consistency of the cassava mash. |
| Clearance (C) | The gap between the edges of the grating teeth and the walls of the grating chamber measured with a feeler gauge | The gap between the edges of the grating teeth and the walls of the grating chamber determines how cassava is constrained during grating. Proper clearance ensures efficient grating and prevents clogging, contributing to consistent mash quality. |
| Moisture Content (MC) | Refers to the amount of water present in cassava before the grating process. | The moisture content influences the texture, consistency, and flow characteristics of cassava during grating. |
| Drum Speed (DS) | The rotational speed of the grating drum was measured with a tachometer | The rotational speed of the grating drum influences the overall grating process. Higher speeds may result in finer mash, while lower speeds may produce coarser mash. |
| Dependent Variables | Description | Rationale |
| (GMD) | The Geometric Mean Diameter (GMD) denotes the average particle size in a sample, providing a precise measurement of the particle distribution resulting from the cassava grater through a sieve analysis | GMD’s selection as a performance parameter for optimizing cassava grater chamber design stems from its pivotal role in ensuring consistent particle sizes essential for various cassava-based products. Achieving a specific GMD through chamber design optimization guarantees uniformity in cassava processing, enhancing product quality and process efficiency. |
Disclaimer/Publisher’s Note: The statements, opinions and data contained in all publications are solely those of the individual author(s) and contributor(s) and not of MDPI and/or the editor(s). MDPI and/or the editor(s) disclaim responsibility for any injury to people or property resulting from any ideas, methods, instructions or products referred to in the content. |
© 2024 by the authors. Licensee MDPI, Basel, Switzerland. This article is an open access article distributed under the terms and conditions of the Creative Commons Attribution (CC BY) license (http://creativecommons.org/licenses/by/4.0/).
Copyright: This open access article is published under a Creative Commons CC BY 4.0 license, which permit the free download, distribution, and reuse, provided that the author and preprint are cited in any reuse.


