Introduction
Pancreatic cancer (PAAD) is the seventh leading cause of cancer-related death, with slightly increased incidence and mortality rates in many countries [
1]. PAAD will surpass breast cancer to become the third leading cause of cancer-related death by 2025 [
2]. The prognosis of PAAD is poor, and the 5-year survival rate is about 2%~9% [
3]. Conventional therapies, including surgical intervention, chemotherapy, radiotherapy, and targeted therapies, are insufficient in most cases [
4]. Immunotherapy has had remarkable advances in many malignant tumors, while PAAD is refractory to almost all FDA-approved immunotherapies. PAAD exhibits a “cold” tumor immune microenvironment (TIME) characterized by poor T cell infiltration and low mutational burden. Strategies seeking to combine chemotherapy with immune checkpoint blockade (ICB), and dual checkpoint blockade exhibited minimal activity in PAAD [
5]. Personalized immunotherapy for individuals based on PAAD genotypic and immunological heterogeneity may provide novel insights [
6].
T cell exhaustion (TEX) is one of the main causes for immunotherapy failure, which is characterized by sustained expression of inhibitory receptors, poor effector function, and distinct transcriptional state different from functional effector or memory T cells [
7]. CD8
+ T cell exhaustion (CD8TEX) is driven by massive immunosuppressive signals including nutrient deficiency, hypoxia, pro-inflammatory cytokines, and chronic TCR signaling in the tumor microenvironment (TME), regarded as the main responder to ICB, and correlated with poor prognosis in numerous cancers [
8]. Reinvigoration of CD8TEX indicates great therapeutic potential and may become a breakthrough for improving ICB efficacy [
9].
In this study, we extracted TEX-related genes utilizing the single-cell RNA sequencing (ScRNA-seq) dataset from the Tumor Immune Single-Cell Hub (TISCH) database, combined with differentially expressed genes between PAAD tumor and normal tissues from the Cancer Genome Atlas (TCGA) and the Genotype-Tissue Expression (GTEx) databases, to construct the TEX prognostic risk model. We revealed that TEX risk model can predict the outcome and TIME status in patients with PAAD. Our analysis show that TEX-related gene signature is an independent and promising prognostic model for PAAD.
Materials and methods
Data source and clinical information
Integrated gene expression and clinical information of PAAD patients and normal subjects in TCGA and GTEx databases were downloaded from Xena (
https://xena.ucsc.edu/), an online platform for public, multi-omic and clinical/phenotype data. ICGC-PACA-CA and ICGC-PAAD-US PAAD cohorts were retrieved from the International Cancer Genome Consortium (ICGC,
https://dcc.icgc.org/). GSE71729 dataset was downloaded from the Gene Expression Omnibus (GEO,
https://www.ncbi.nlm.nih.gov/geo/). All ScRNA-seq datasets were downloaded from TISCH, a scRNA-seq database including 190 datasets focusing on TME. Adjusted P-value <0.05, and |log2 FC| >2 were used as cutoff values for filtering differentially expressed genes (DEGs) in bulk sequencing datasets. Adjusted P-value <0.05, and |log2 FC| >0.3 were used as cutoff values for filtering DEGs in scRNA-seq datasets. DEseq2 (v4.41.12), edgeR (v3.40.2), and limma (v3.54.2) R packages were used for DEGs analysis. Benjamini & Hochberg (BH) was used to get adjusted p-value in DEG analysis using DEseq2, edgeR, and limma.
Construction of T cell exhaustion signature
DEGs from TCGA-PAAD and GTEx were intersected with DEGs of CD8TEX from TISCH to screen CD8TEX-related DEGS. Univariate Cox regression and Kaplan-Meier survival analysis of overall survival (OS) were performed with P-value cutoff of 0.05 to filter OS correlated TEX-related DEGS using the survival (v3.3.1) R package. LASSO regression followed by stepwise variable selection process to obtain the best candidate for Cox’s proportional hazards model using the glmnet (v4.1-7) and My.stepwise (v0.1.0) R packages. The final risk model was constructed using the Multivariate Cox regression analysis using the survival (v3.3.1) R package, and the forest plot was drawn using the forestplot (v3.1.1) R package. The PAAD patients were divided into high- and low-risk subgroups with the cutoff of median risk scores.
Validation of T cell exhaustion-related risk model
In the training TCGA-PAAD dataset, Kaplan-Meier survival analysis was performed to compare the OS between high- and low-risk groups. Risk score curve, patient distribution and expression of TEX-related genes in the risk prognostic model were also compared using tinyarray (v2.2.9) R package. The 1-, 3-, and 5-year survival curves were constructed and the Area Under Curve (AUC) was determined using the survival (v3.3.1) and survminer (v0.4.9) R packages, and plotted with the timeROC (v0.4) R package [
10]. Univariate and multivariate Cox regression analysis were performed to identify independent prognostic factors including age, gender, grade, stage, and risk score. A nomogram was drawn to assess risk based on these characteristics using the rms (v6.6-0) R package. The Decline Curve Analysis (DCA) was used to evaluate the clinical applicability of the nomogram via quantifying the improved benefits with various threshold probabilities using the ggDCA (v1.2) R package.
In the validation cohorts, including ICGC-PACA-CA (n=186), ICGC-PAAD-US (n=112), and GSE71729 (n=114), Kaplan-Meier survival analysis was performed to validate the prognostic prediction potential of the TEX-related gene signature. Risk score curve, patient distribution and expression of TEX-related genes in the risk prognostic model were also compared using the tinyarray (v2.2.9)
Gene set variation analysis (GSVA)
The 186 Kyoto Encyclopedia of Genes and Genomes (KEGG) pathways were extracted from the Molecular Signatures Database (MSigDB) C2: curated gene sets using the msigdbr (v7.5.1) R package. The scores of these KEGG pathways were calculated with the GSVA (v1.46.0) R package [
11], and significantly different KEGG pathways between high- and low-risk TCGA-PAAD patients.
Mutation landscape analysis
The mutation and clinical information of TCGA patients were downloaded The Pan-Cancer Atlas (PanCanAtlas,
https://gdc.cancer.gov/about-data/publications/pancanatlas). The mutation landscape and differences between high- and low-risk patients was summarized and plotted using the maftools (v2.14.0) R package [
12]. The Gene Ontology (GO) biological process analysis of differentially mutated genes between high- and low-risk patients was performed on Enrichr [
13], an online platform for gene set enrichment analysis (
https://maayanlab.cloud/Enrichr/), and plotted using ggplot2 (v3.4.2) R package.
Immune cell infiltration estimation
The gene signatures for immune cell type classification and gene signatures for immune function were extracted from previous study [
14]. The immune cell abundance and immune function estimation were performed using the ‘ssgsea’ function with the GSVA R package. Moreover, XCELL, TIMER, QUANTISEQ, and CIBERSORT algorithms were applied to estimate the immune cell infiltration using the immunedeconv (v2.1.3) and CIBERSORT (v0.1.0) R packages [
15]. The spearman correlation between the infiltration ratio and risk score was performed using the psych (v2.3.3) R package, and a P-value of 0.05 was used as threshold.
Immune subtype analysis
Tumors could be classified into six immune subtypes [
16], named C1 to C6. C1 (Wound Healing) is characterized by high proliferation rate and upregulated expression of angiogenic genes. C2 (IFN-γ Dominant) had a strong CD8 signal and the highest M1/M2 macrophage polarization. C3 (Inflammatory) had low somatic copy number alterations and tumor cell proliferation, while showed elevated Th17 and Th1 genes. C4 (Lymphocyte Depleted) displayed a more prominent macrophage signature and high M2 response. C5 (Immunologically Quiet), was dominated by M2 macrophages and exhibited the highest macrophage responses but the lowest lymphocyte responses. C6 (TGF-β Dominant) had the highest TGF-β signature. The TCGA-PAAD patients were classified using the ImmuneSubtypeClassifier (v0.1.0) R package.
Drug response prediction
The Genomics of Drug Sensitivity in Cancer 2 (GDSC2,
https://www.cancerrxgene.org/) database consists of 805 types of cells and their response to 198 anti-tumor drugs. The cell line expression and half-maximal inhibitory concentration (IC50) data were downloaded GDSC2. The drug response of the TCGA-PAAD patients to these compounds was predicted using the oncoPredict (v0.2) R package [
17]. The correlation between drug response and risk score was calculated using the psych (v2.3.3) R package, and plotted with ggstatsplot (v0.0.6) and ggpubr (v0.6.0) R packages.
Immunohistochemistry staining
The surgical PAAD tumor and adjacent tissues were briefly deparaffinized and rehydrated, followed by incubation with primary antibodies overnight (anti-SPOCK2: 11725-1-AP; anti-MT1X: 7172-1-AP; anti-LIPH: 16602-1-AP) from Proteintech (
https://ptgcn.com/products/). These sections were rinsed with PBS, incubated with corresponding secondary antibodies at 37 °C.
Pan-cancer scRNA-seq analysis of CD8TEX-related genes
The expression of TEX-related genes was explored and plotted in the PAAD-CRA001160 scRNA-seq dataset from TISCH database (
http://tisch.comp-genomics.org/home/). Then a pan-cancer expression of SPOCK2 cross a variety of cell types was analyzed and plotted in heatmap and violin plots.
Statistical analysis
All statistical analysis was carried out utilizing R software (v4.2.3). Comparison of mean values between different groups was performed using the Student’s t-test. The correlation analysis was assessed using Pearson correlation analysis. The log-rank test was used in the Kaplan-Meier survival analysis. P-value of adjusted P-value <0.05 considered statistically significant.
Results
Identification of TEX-related gene signature in PAAD
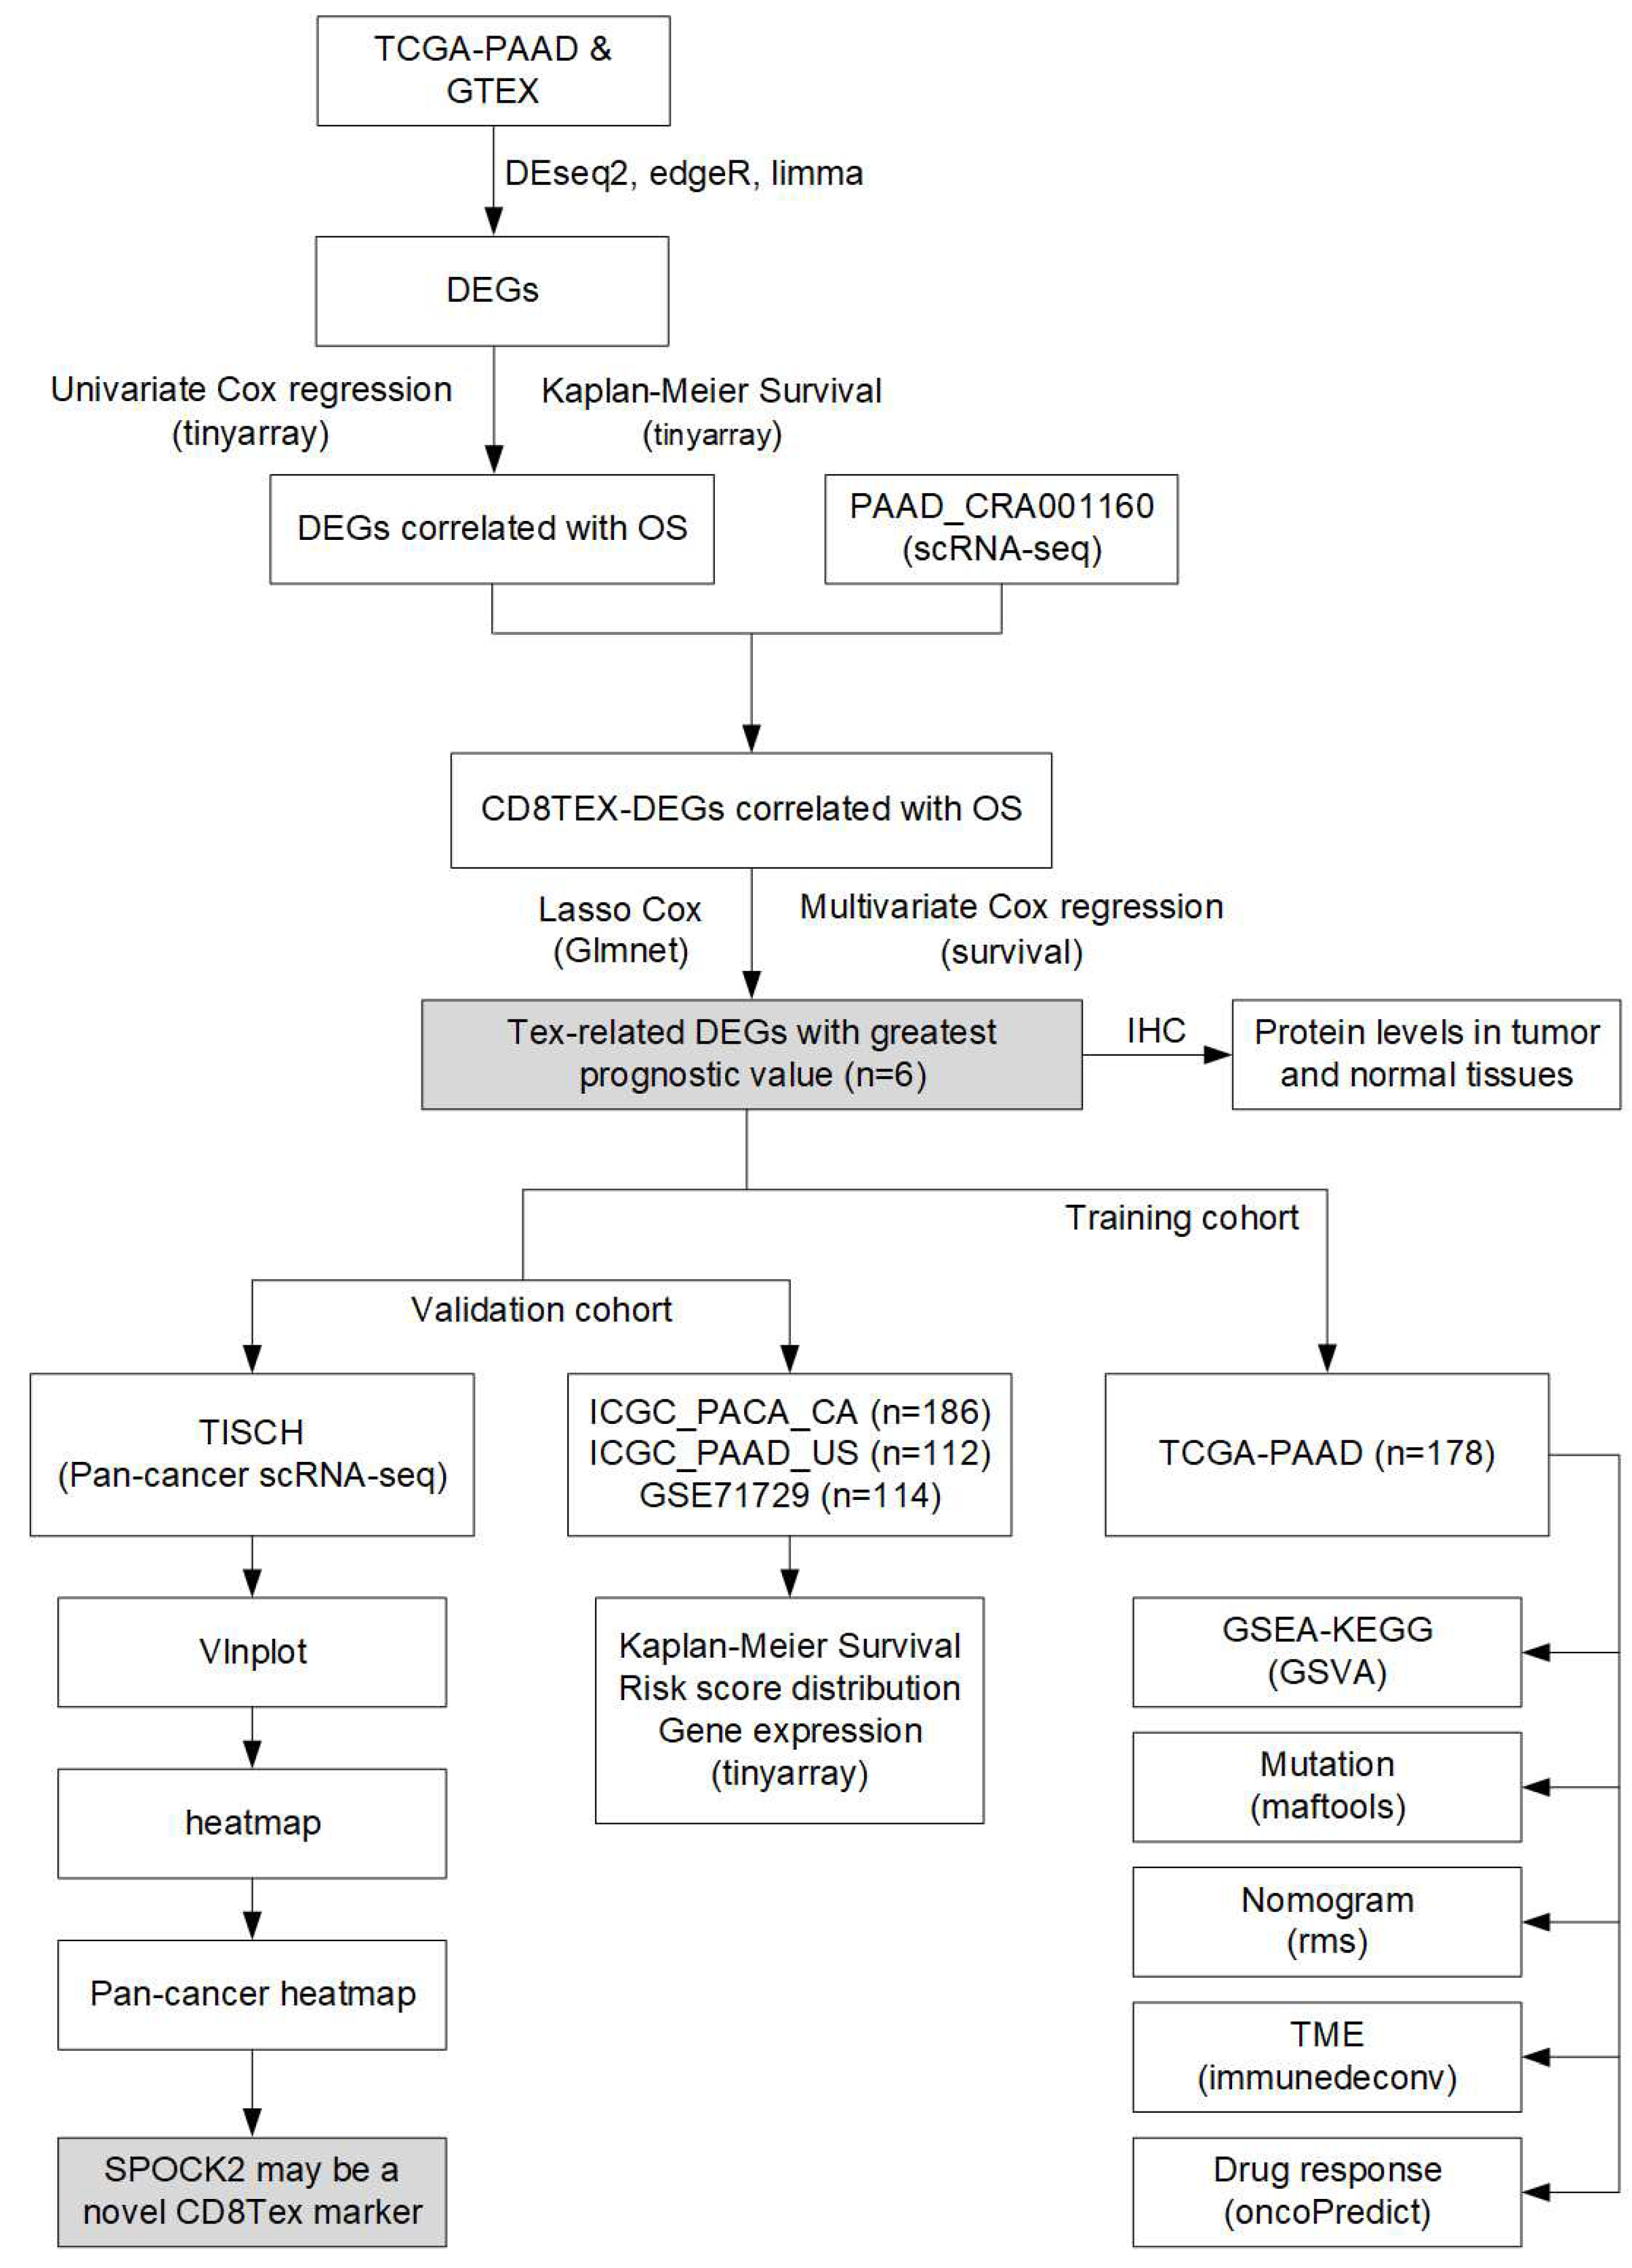
The general workflow of the current study is depicted in
Figure 1.
Differential expression analysis
In this study, 179 tumor samples and 171 controls were selected from the TCGA and GTEx integrated data. A robust disease-specific model with fewer genes is more suitable for clinical translation, therefore, only those common DEGs which were identified as significant across all three methods (DESeq2, edgeR and limma R packages) were considered. A total of 3156 DEGs were identified across all three different programs, including 1985 upregulated and 1171 downregulated genes, respectively (Table S1).
Prognostic potential analysis of DEGs
We further explored the prognostic potential of these DEGs using univariate Cox regression and Kaplan-Meier survival analysis. The surv_cox function from tinyarray (v2.2.9) R package was used to calculate the Cox p value and HR of DEGs in univariate Cox regression with p value cutoff of 0.05, and 1150 DEGs with prognostic potential were identified (Table S2). The surv_KM function from tinyarray (v2.2.9) R package was used to calculate log_rank test p value for DEGs in Kaplan-Meier survival analysis with p value cutoff of 0.05, and 681 DEGs with prognostic potential were identified (Table S3).
Identification of TEX-related gene signature in PAAD
TISCH2 database was a scRNA-seq database including 190 datasets focusing on TME. The Model-based AnalysEs of Transcriptome and RegulOme (MAESTRO) was utilized by TISCH2 to perform quality control, normalization, clustering and cell type annotation for each collected dataset [
18]. A total of 1555 genes associated with CD8TEX were obtained from PAAD-CRA001160 scRNA-seq dataset in TISCH2 database (
Figure 2A,B; Table S4). The intersected genes among CD8TEX genes, DEGs with prognostic potential identified by using univariate Cox regression and Kaplan-Meier survival analysis were defined as TEX-related DEGs. A total of 49 TEX-related DEGs were collected (
Figure 2C, Table S5).
LASSO regression followed by stepwise variable selection process to obtain the best candidate for Cox’s proportional hazards model (
Figure 2D,E). The final TEX risk model was constructed using the Multivariate Cox regression analysis including six genes (SPOCK2, MT1X, LIPH, RARRES3, EMP1, and MEG3). Both univariate and multivariate Cox regression analysis confirmed the correlation between these risk genes and OS of PAAD patients (
Figure 2F,G).
Validation of TEX-related gene signature in PAAD
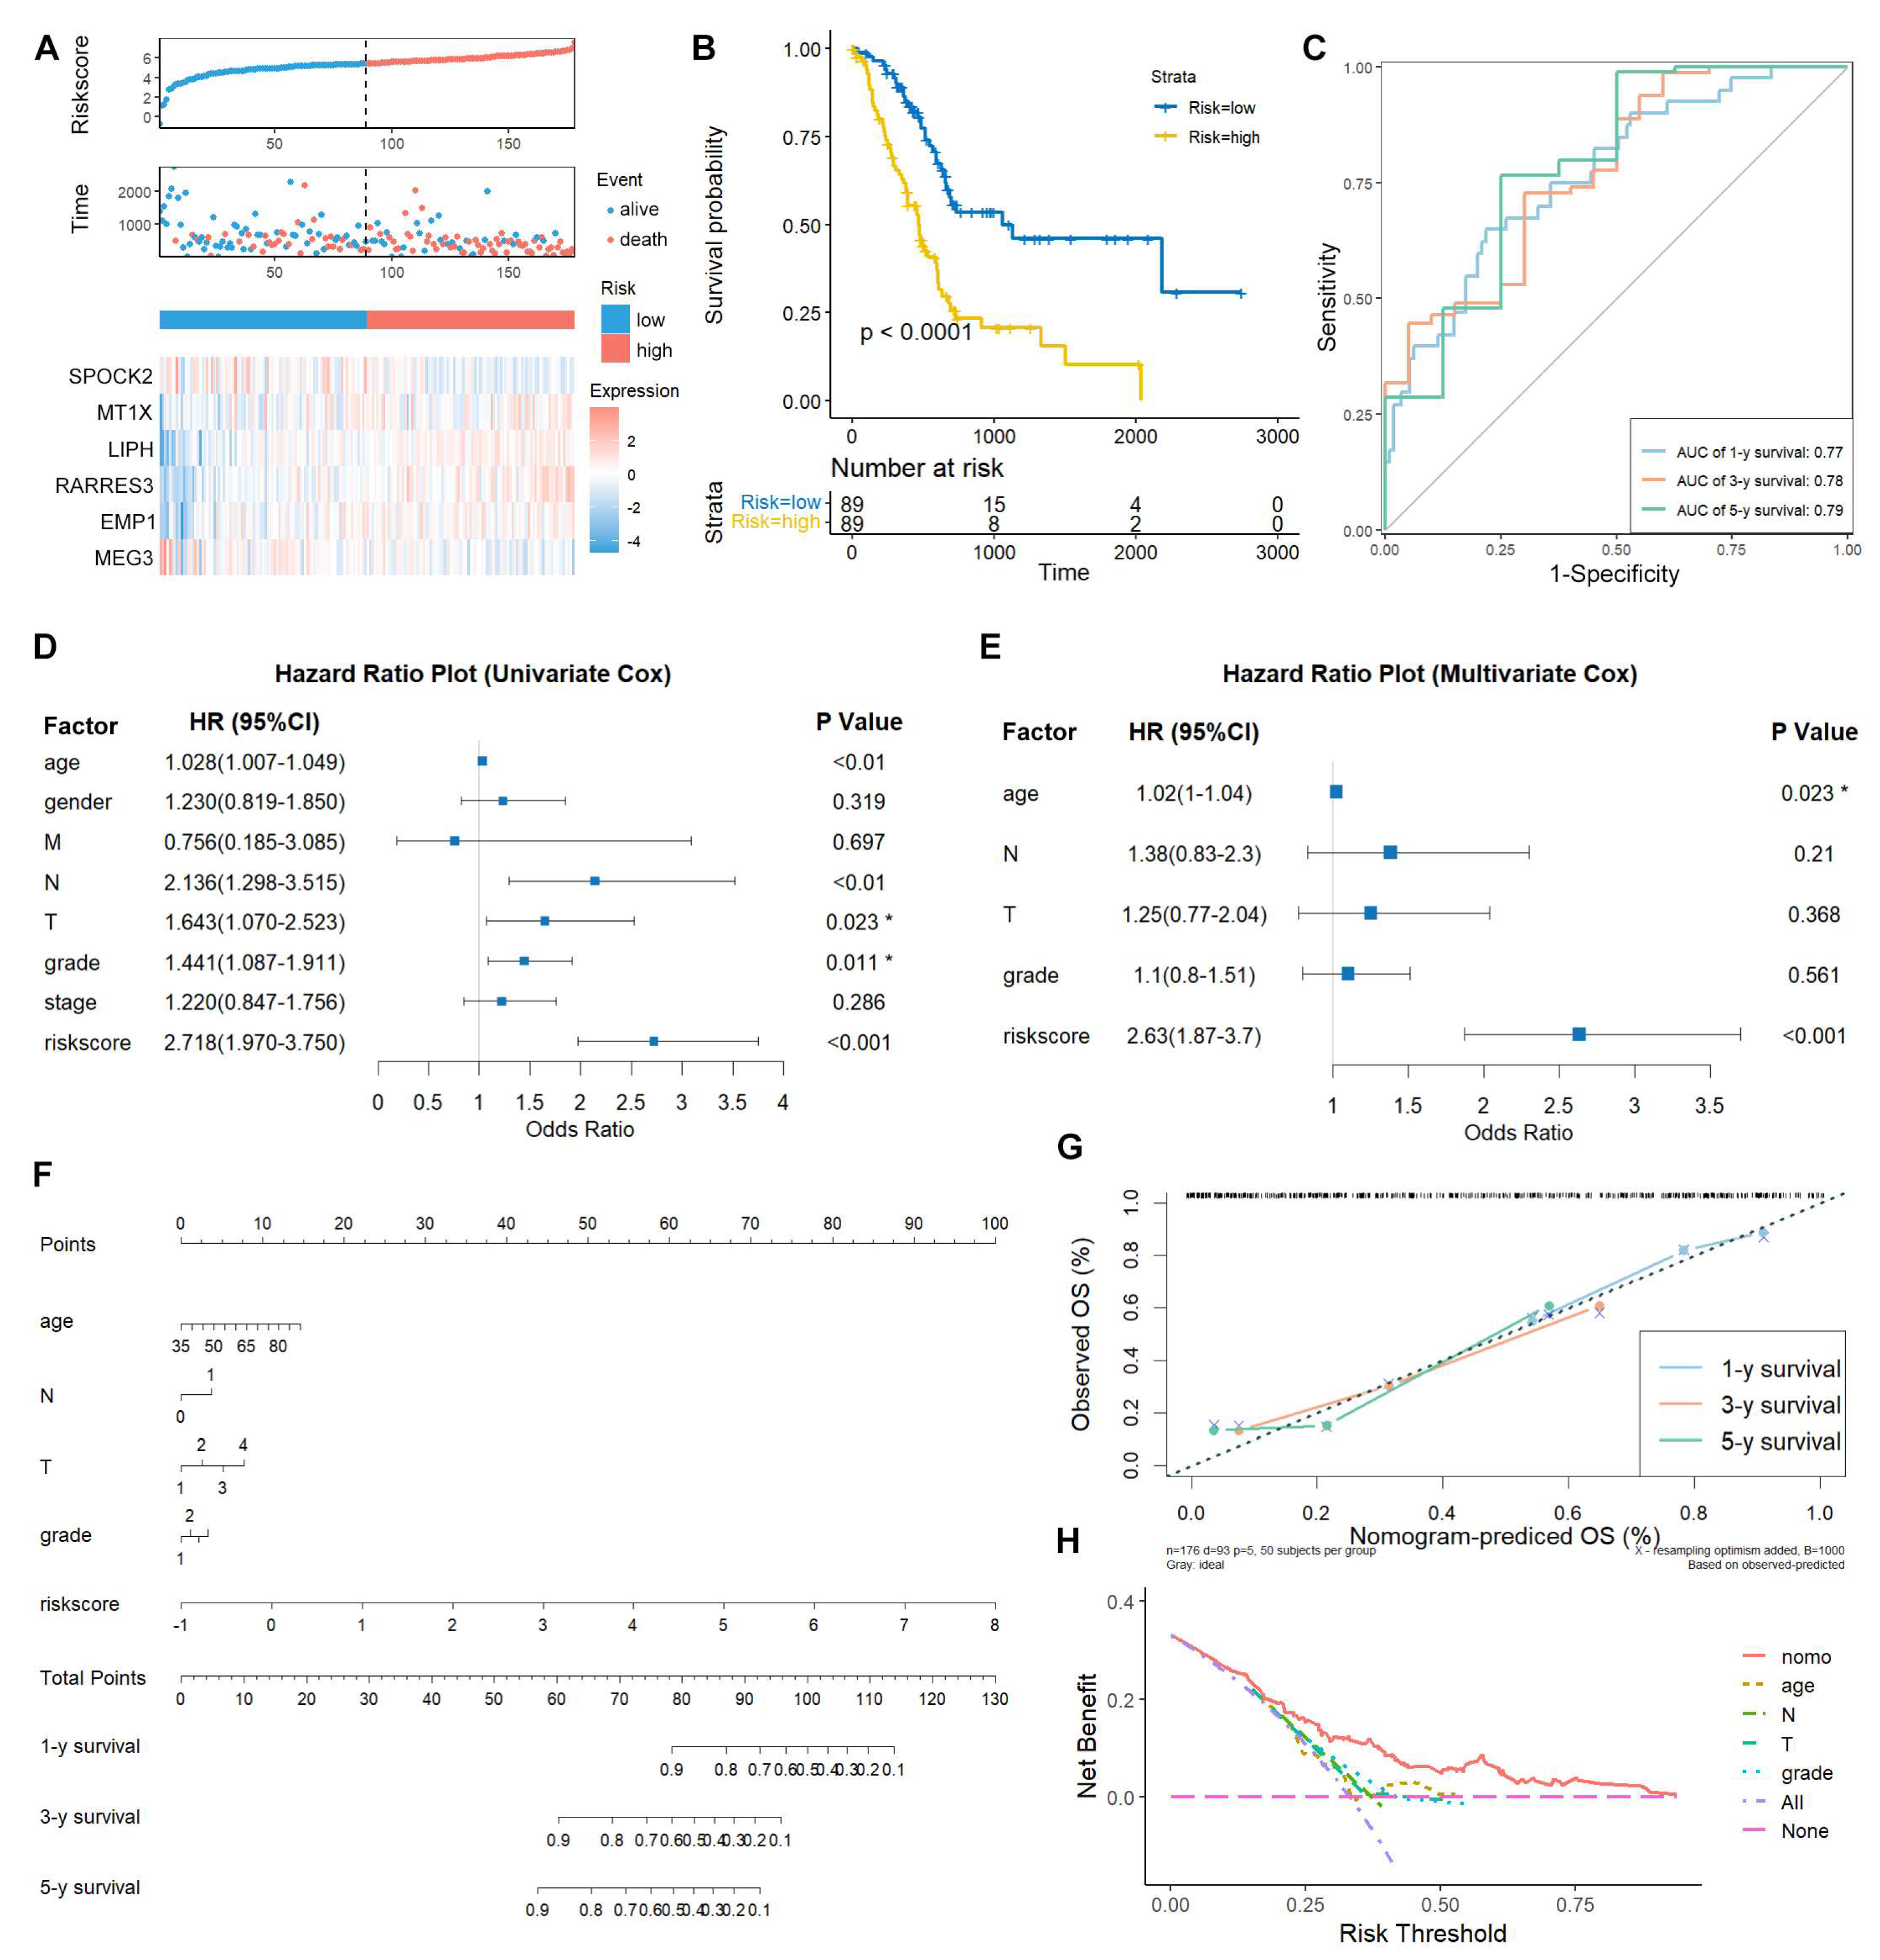
The risk score was calculated with the following formula: riskscore=-0.2248802*SPOCK2+0.3692181*MT1X+0.3364109*LIPH+0.2723827*RARRES3+0.2901199*EMP1-0.2231695*MEG3. The TCGA-PAAD patients were used as training dataset, and patients were divided into high- and low-risk groups based on the median risk score. SPOCK2 and MEG3 were downregulated in high-risk group, while MT1X, LIPH, and RARRES3 were upregulated in high-risk group (
Figure 3A). The Kaplan-Meier survival analysis showed that the low-risk patients had longer survival time than the high-risk patients (
Figure 3B). Moreover, the ROC curve base on the TEX-related signature revealed the 1-, 3- and 5-year AUC values were 0.77, 0.78, and 0.79, respectively (
Figure 3C).
We further explored whether this risk model could act as in independent prognostic variables for PAAD patients. Both univariate and multivariate Cox regression analysis confirmed that risk score and age were significantly correlated with the OS (
Figure 3D,E). To make this risk model useful in the clinic, a nomogram was construct to predict 1-, 3-, and 5-year survival in the TCGA-PAAD patients. As depicted in the nomogram, the risk score model had the most weight among all these included factors including age, N stage, T stage, and grade (
Figure 3F). The calibration curves showed consensus between the nomogram predicted and actual survival (
Figure 3G). The DCA curves demonstrated that the nomogram performed better than other clinical factors in predicting the 1-, 3- and 5-year OS (
Figure 3H).
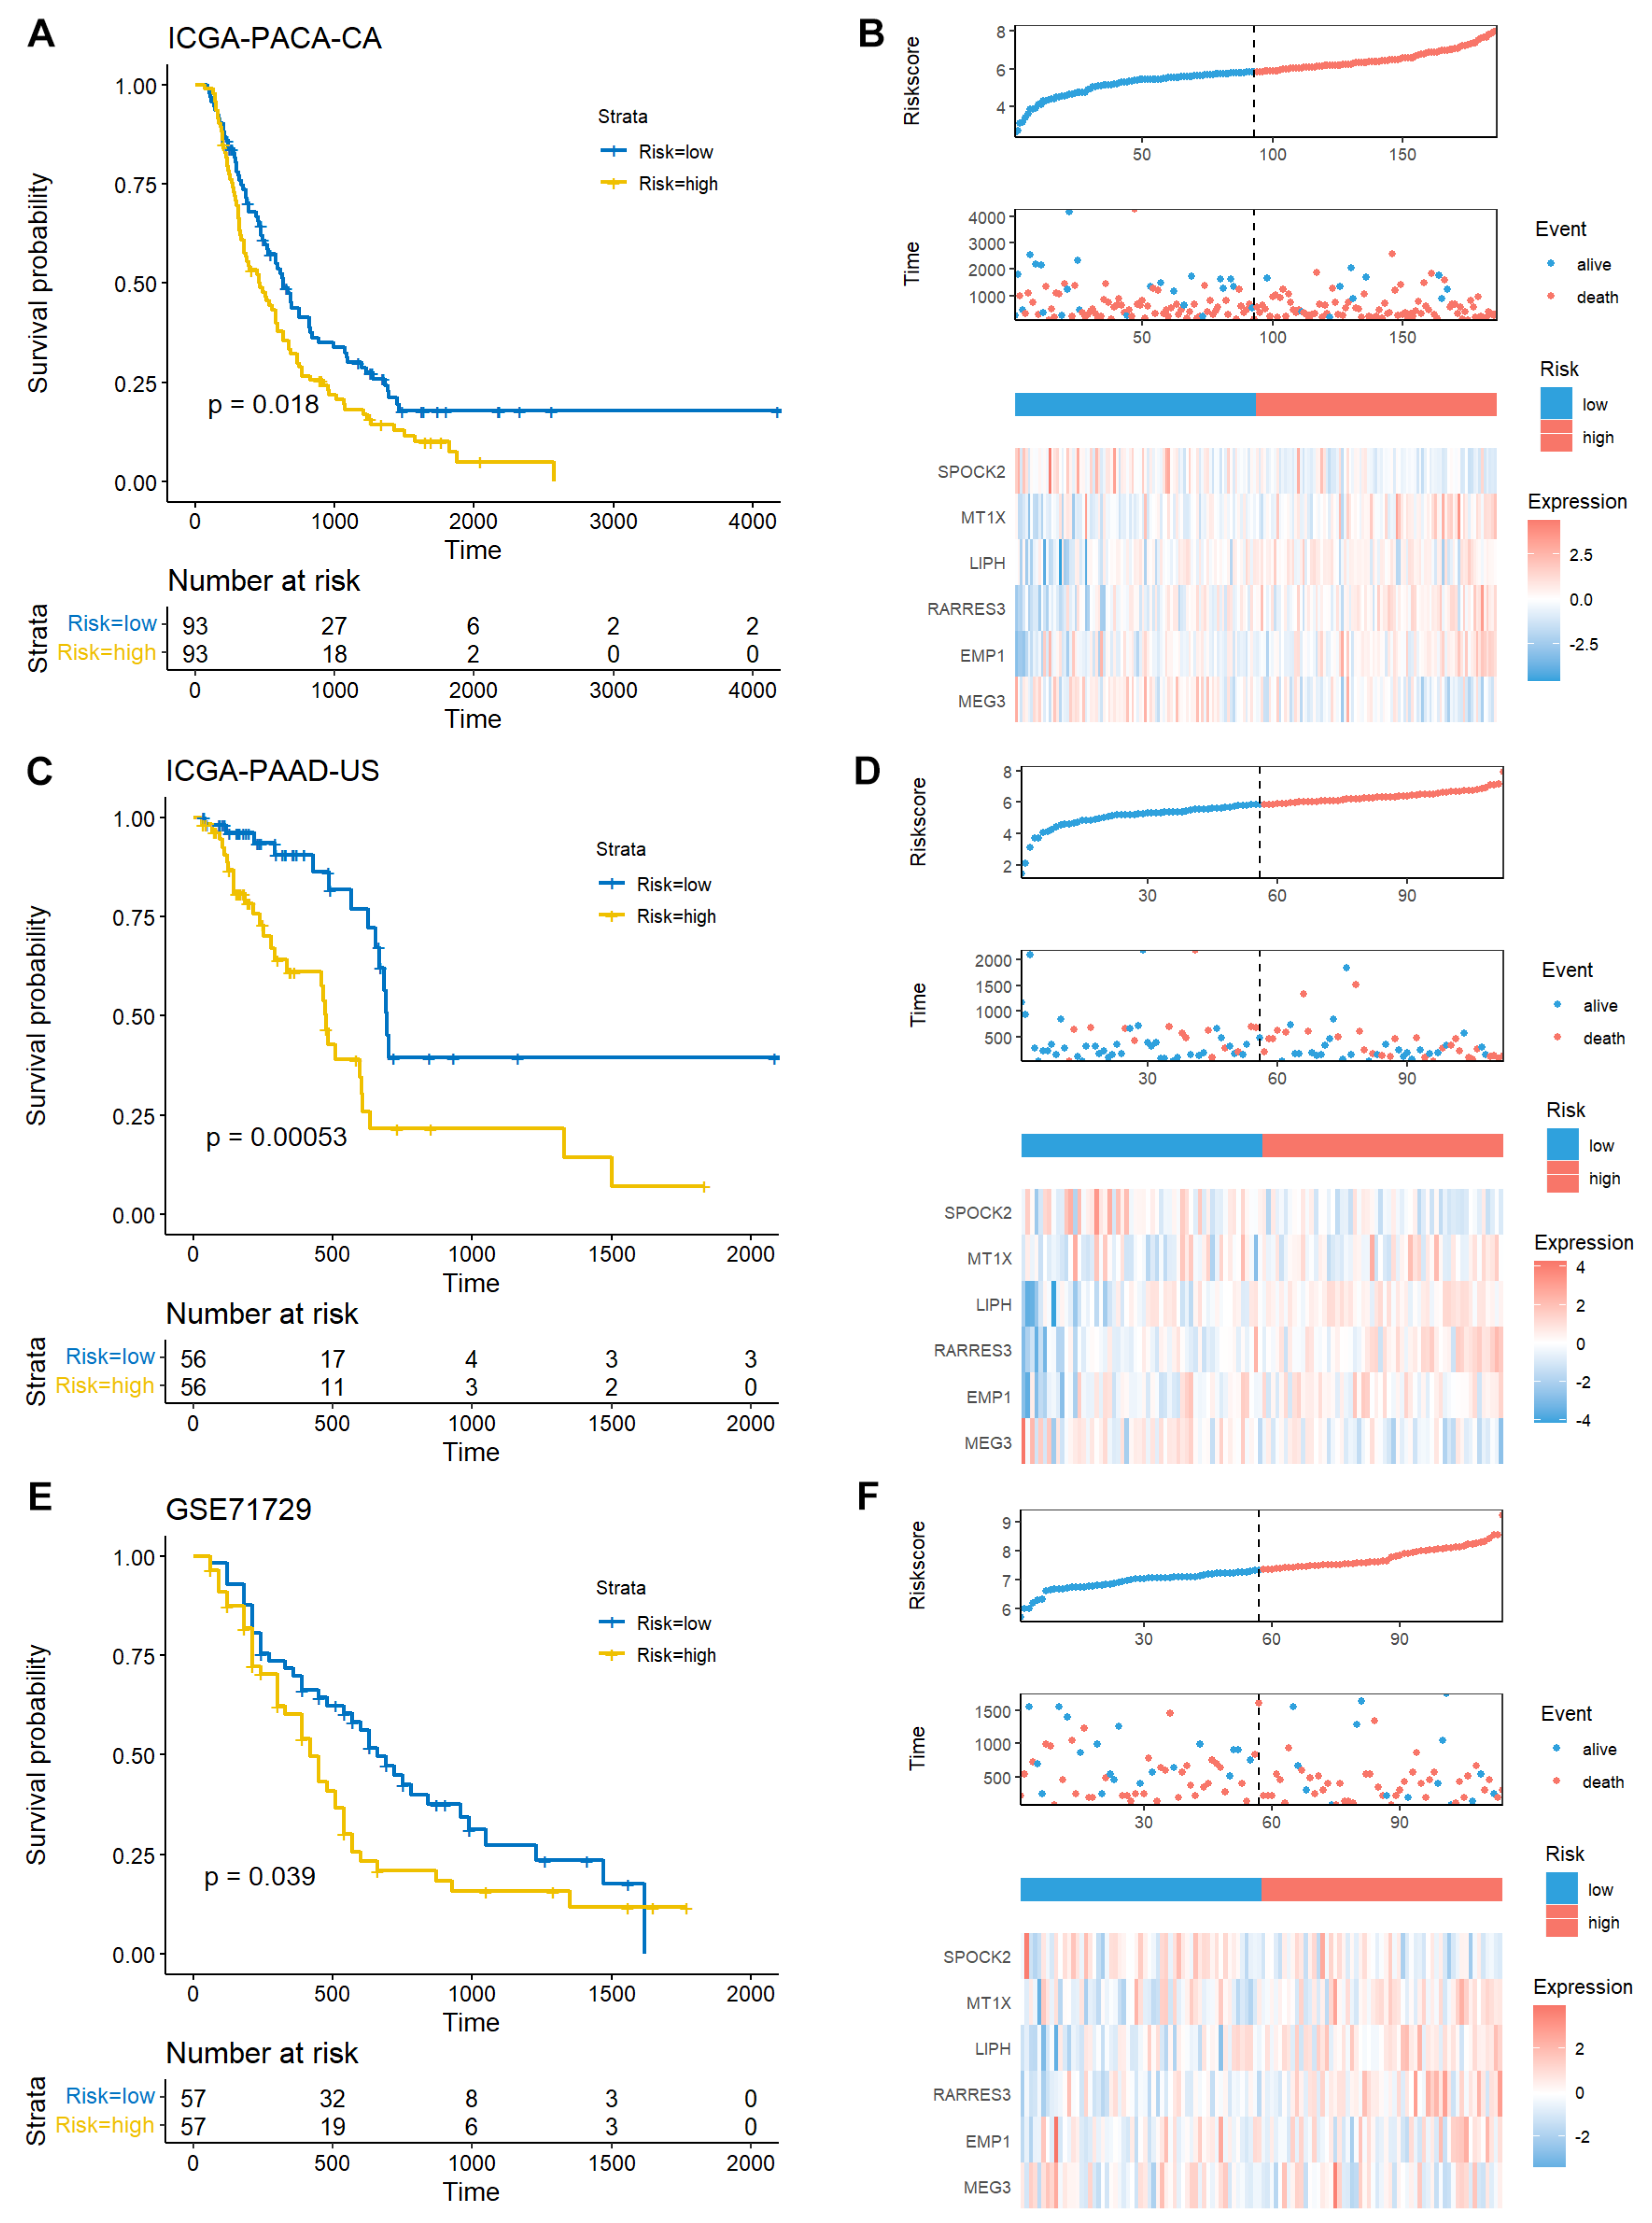
Moreover, three external validation datasets (ICGC-PACA-CA, ICGC-PAAD-US, and GSE71729, n=412) were applied to validate the prognostic potential of this TEX-related signature. Consistent with the results in the TCGA-PAAD training dataset, the low-risk patients had longer survival time and the expression pattern of risk genes were similar with the TCGA cohort (
Figure 4A-F). Collectively, these results from different cohorts suggest that TEX-related gene signature may be an independent predictive indicator for PAAD patients.
Mutationallandscapedifference betweenhigh- and low-risk groups
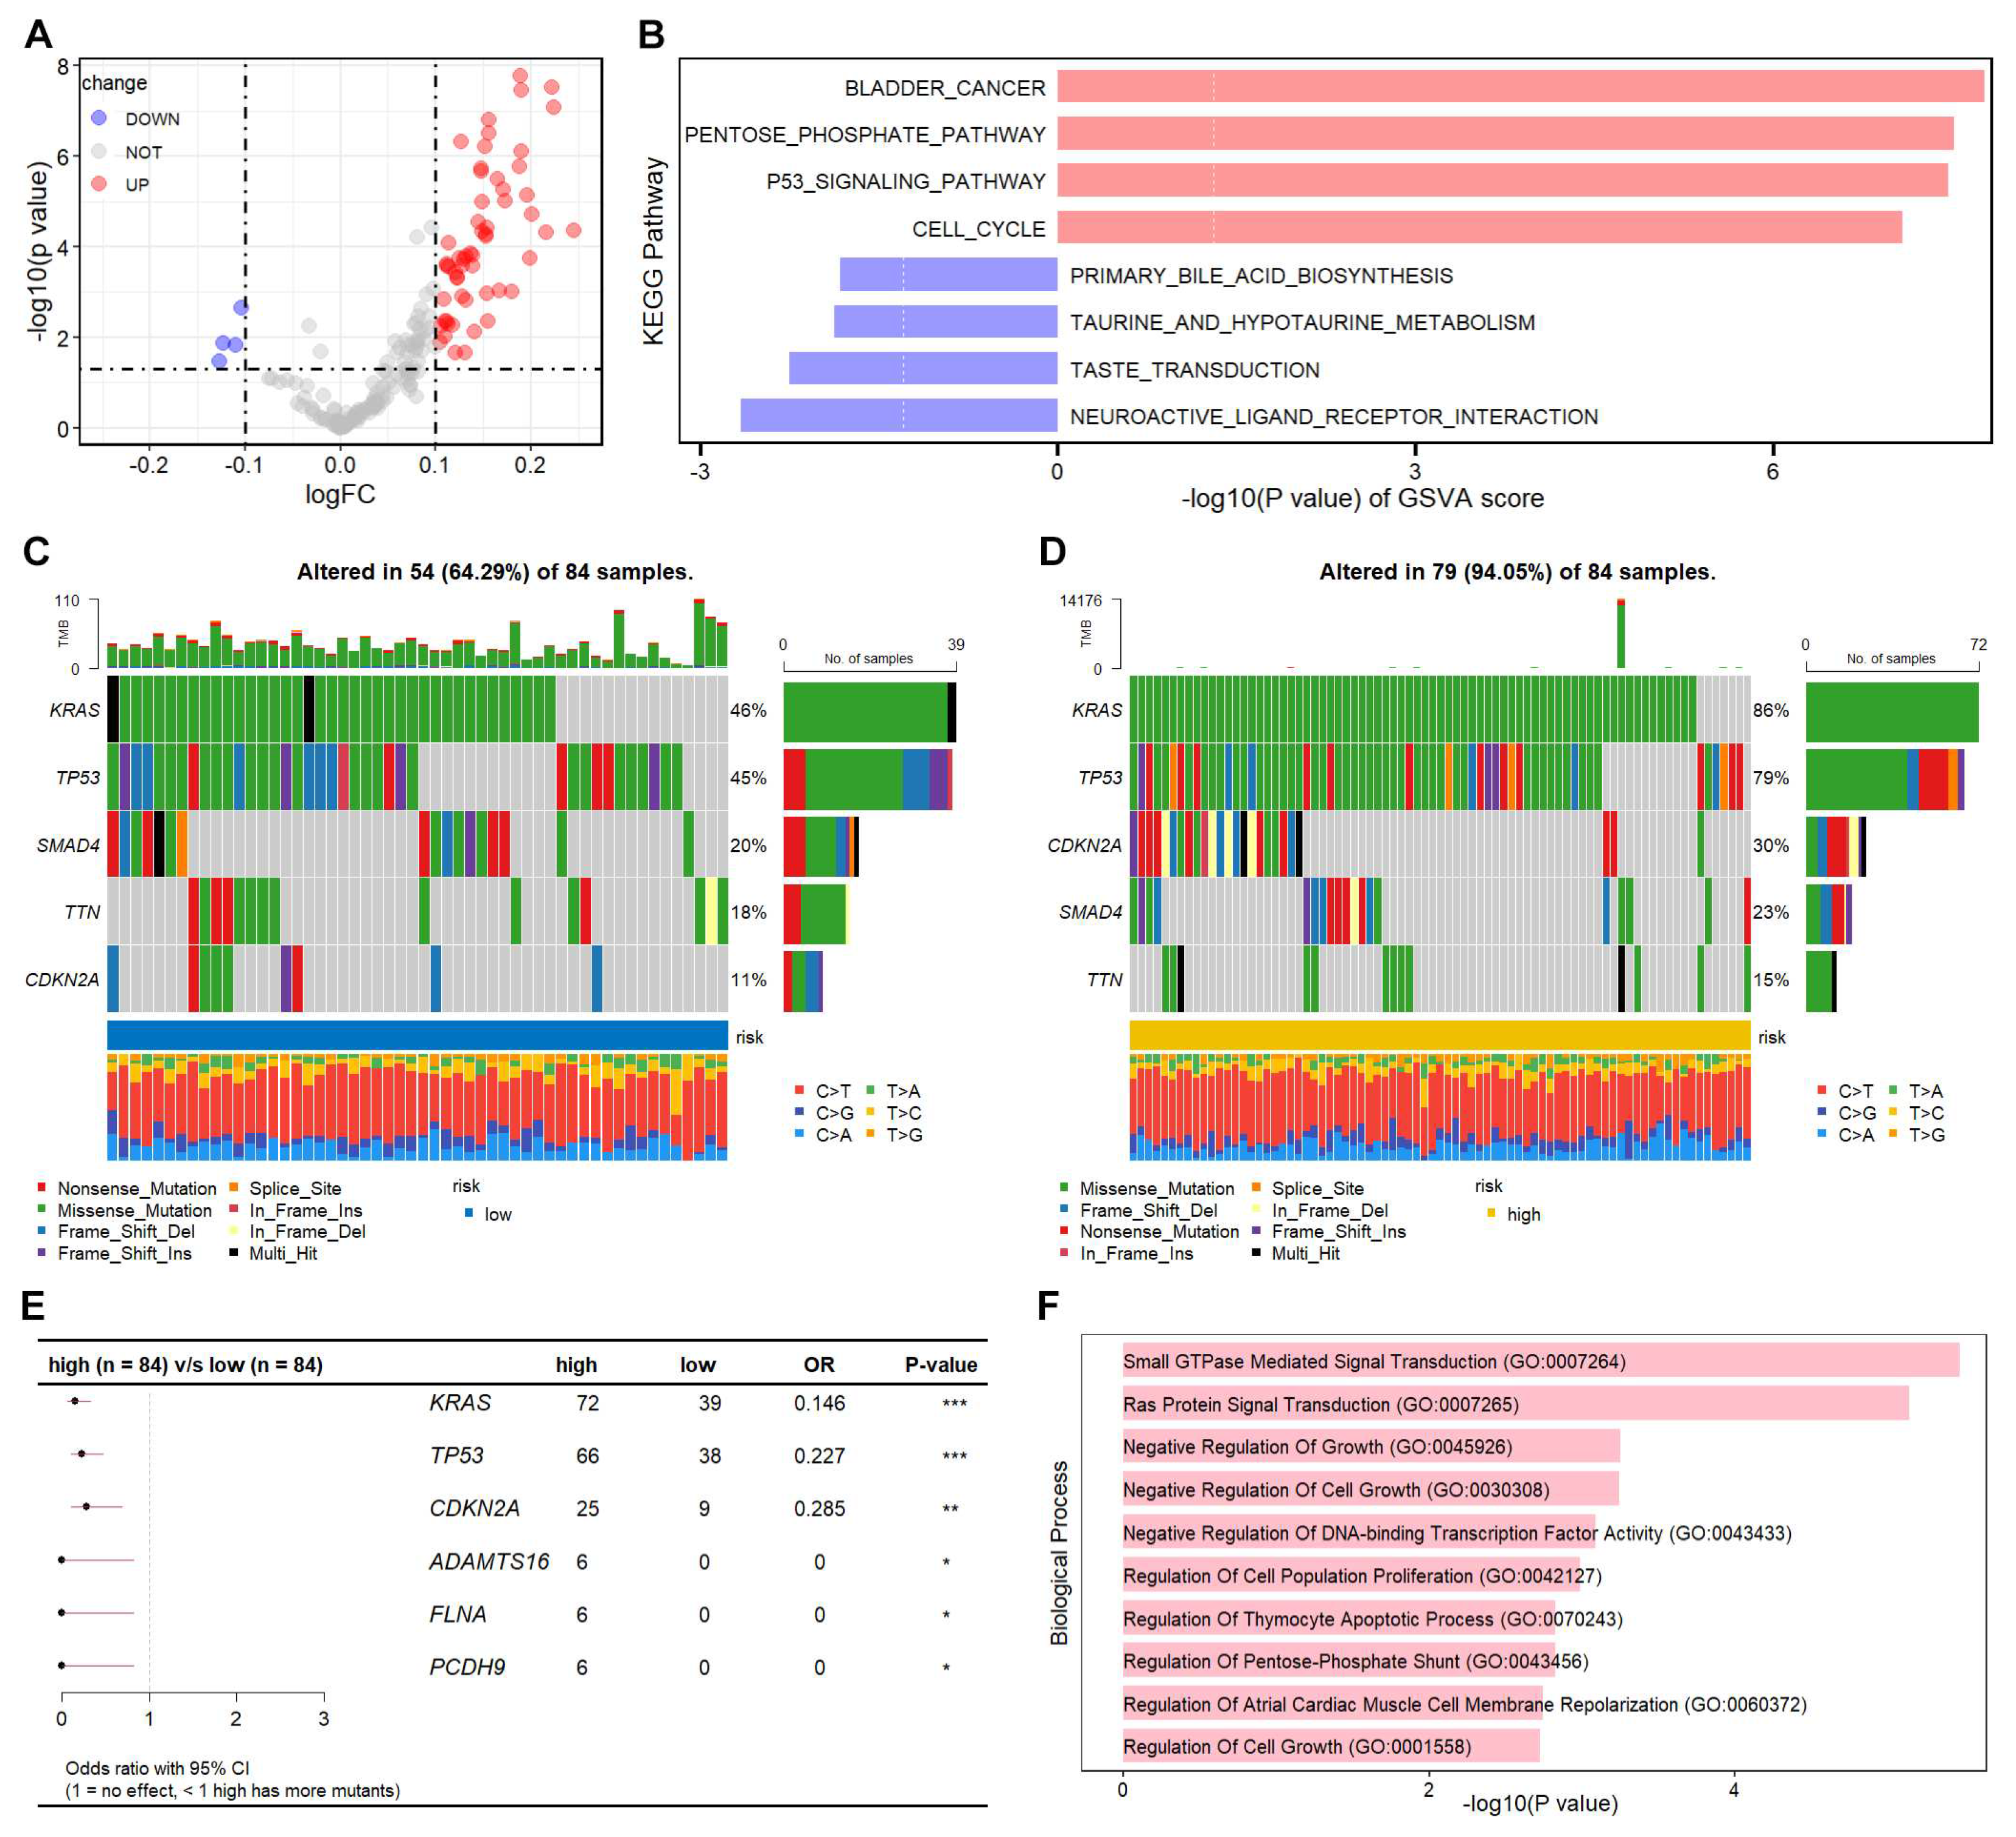
We further explored the molecular characteristics between high- and low-risk patients. GSVA is an unsupervised, non-parametric algorithm for estimating variation of pathway enrichment via transforming gene expression matrix to a gene-set matrix. GSVA was used to calculate the KEGG pathway scores in each sample, and the significant differential KEGG pathways were identified (
Figure 5A, Table S6). The top four KEGG pathways enriched in high-risk group were all involved in cancer development and progression (
Figure 5B). Moreover, the mutational landscape difference between high- and low-risk groups were analyzed.
KRAS,
TP53,
CDKN2A,
SMAD4, and
TTN were the top 5 genes with mutations in both groups. The mutation proportions of
KRAS,
TP53, and
CDKN2A were remarkably increased in high-risk patients (
Figure 5C,D). We systematically evaluated the mutational differences between the two groups, and identified six differentially mutated genes, including
KRAS,
TP53,
CDKN2A,
ADAMTS16,
FLNA, and
PCDH9 (
Figure 5E). The top 10 GO biological process terms were mainly focused on cell growth and apoptosis (
Figure 5F). These data suggest that the TEX-related signature could characterize PAAD patients with different molecular features and mutational landscapes.
(E) Forest plot of significantly different mutated genes between high- and low-risk patients. The differentially mutated genes were identified through performing fisher test using the mafCompare function from maftools R package, and the forest plot was drawn using maftools R package. (F) GO biological process enrichment analysis of significantly different mutated genes was performed using Enrichr (
https://maayanlab.cloud/Enrichr/enrich), and the top 10 GO terms were shown.
Immune characteristics of high- and low-risk groups
The immune cell abundance and immune function were estimated using previously published gene signatures [
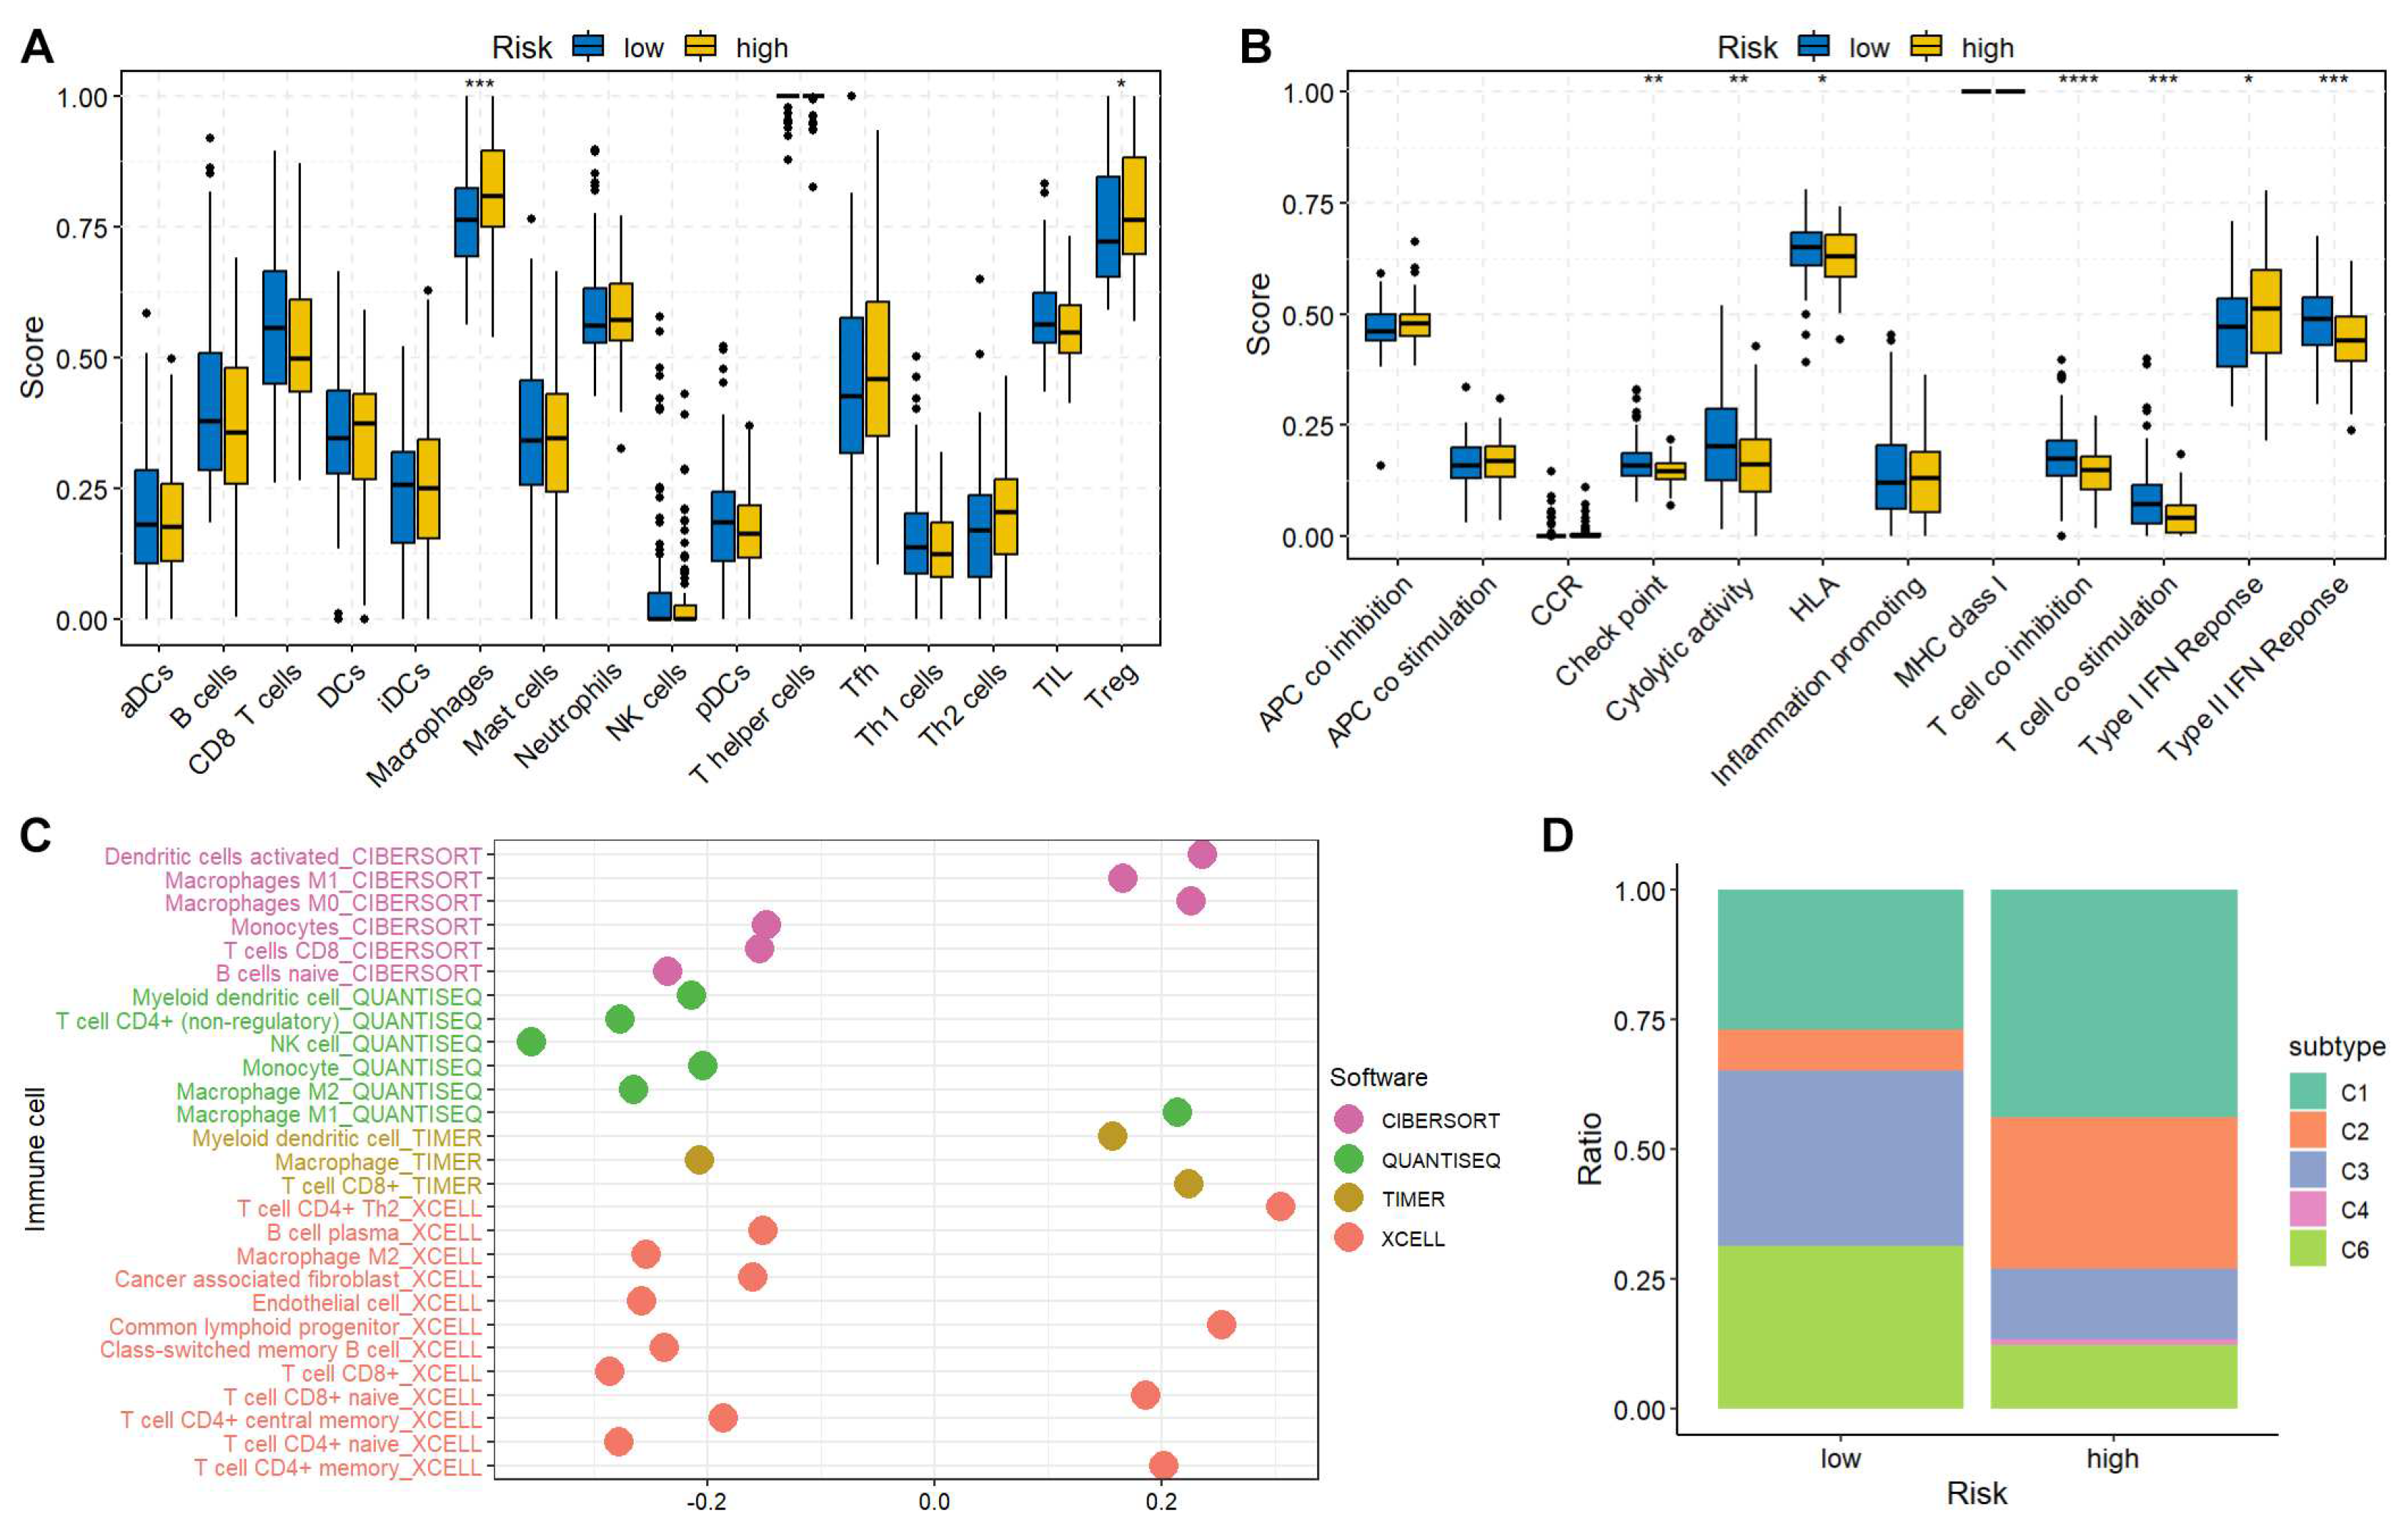
14]. The immune cell infiltration and immune function differences between high- and low-risk groups were compared using the Wilcoxon test. The high-risk patients tended to have more macrophages and regulatory T cells (Treg) (
Figure 6A). Decreased check point, cytolytic activity, HLA, T cell co-stimulation, and type II IFN response were found in high-risk group (
Figure 6B), indicating an immunosuppressive TME in high-risk patients. Additionally, the correlation between immune cell infiltration and risk score was investigated utilizing numerous algorithms. The results showed that the risk score was negatively correlated with NK and CD4
+ T cells (
Figure 6C). Moreover, the PAAD patients were further classified into C1~C6 immune subtypes. Interestingly, the C5 (Immunologically Quiet) was absent from both groups indicating the malignant feature of PAAD. The C4 (Lymphocyte Depleted), which displayed a more prominent macrophage signature and high M2 response, was only found in high-risk group, suggesting the immunosuppressive status (
Figure 6D).
The correlation between drug sensitivity and risk score
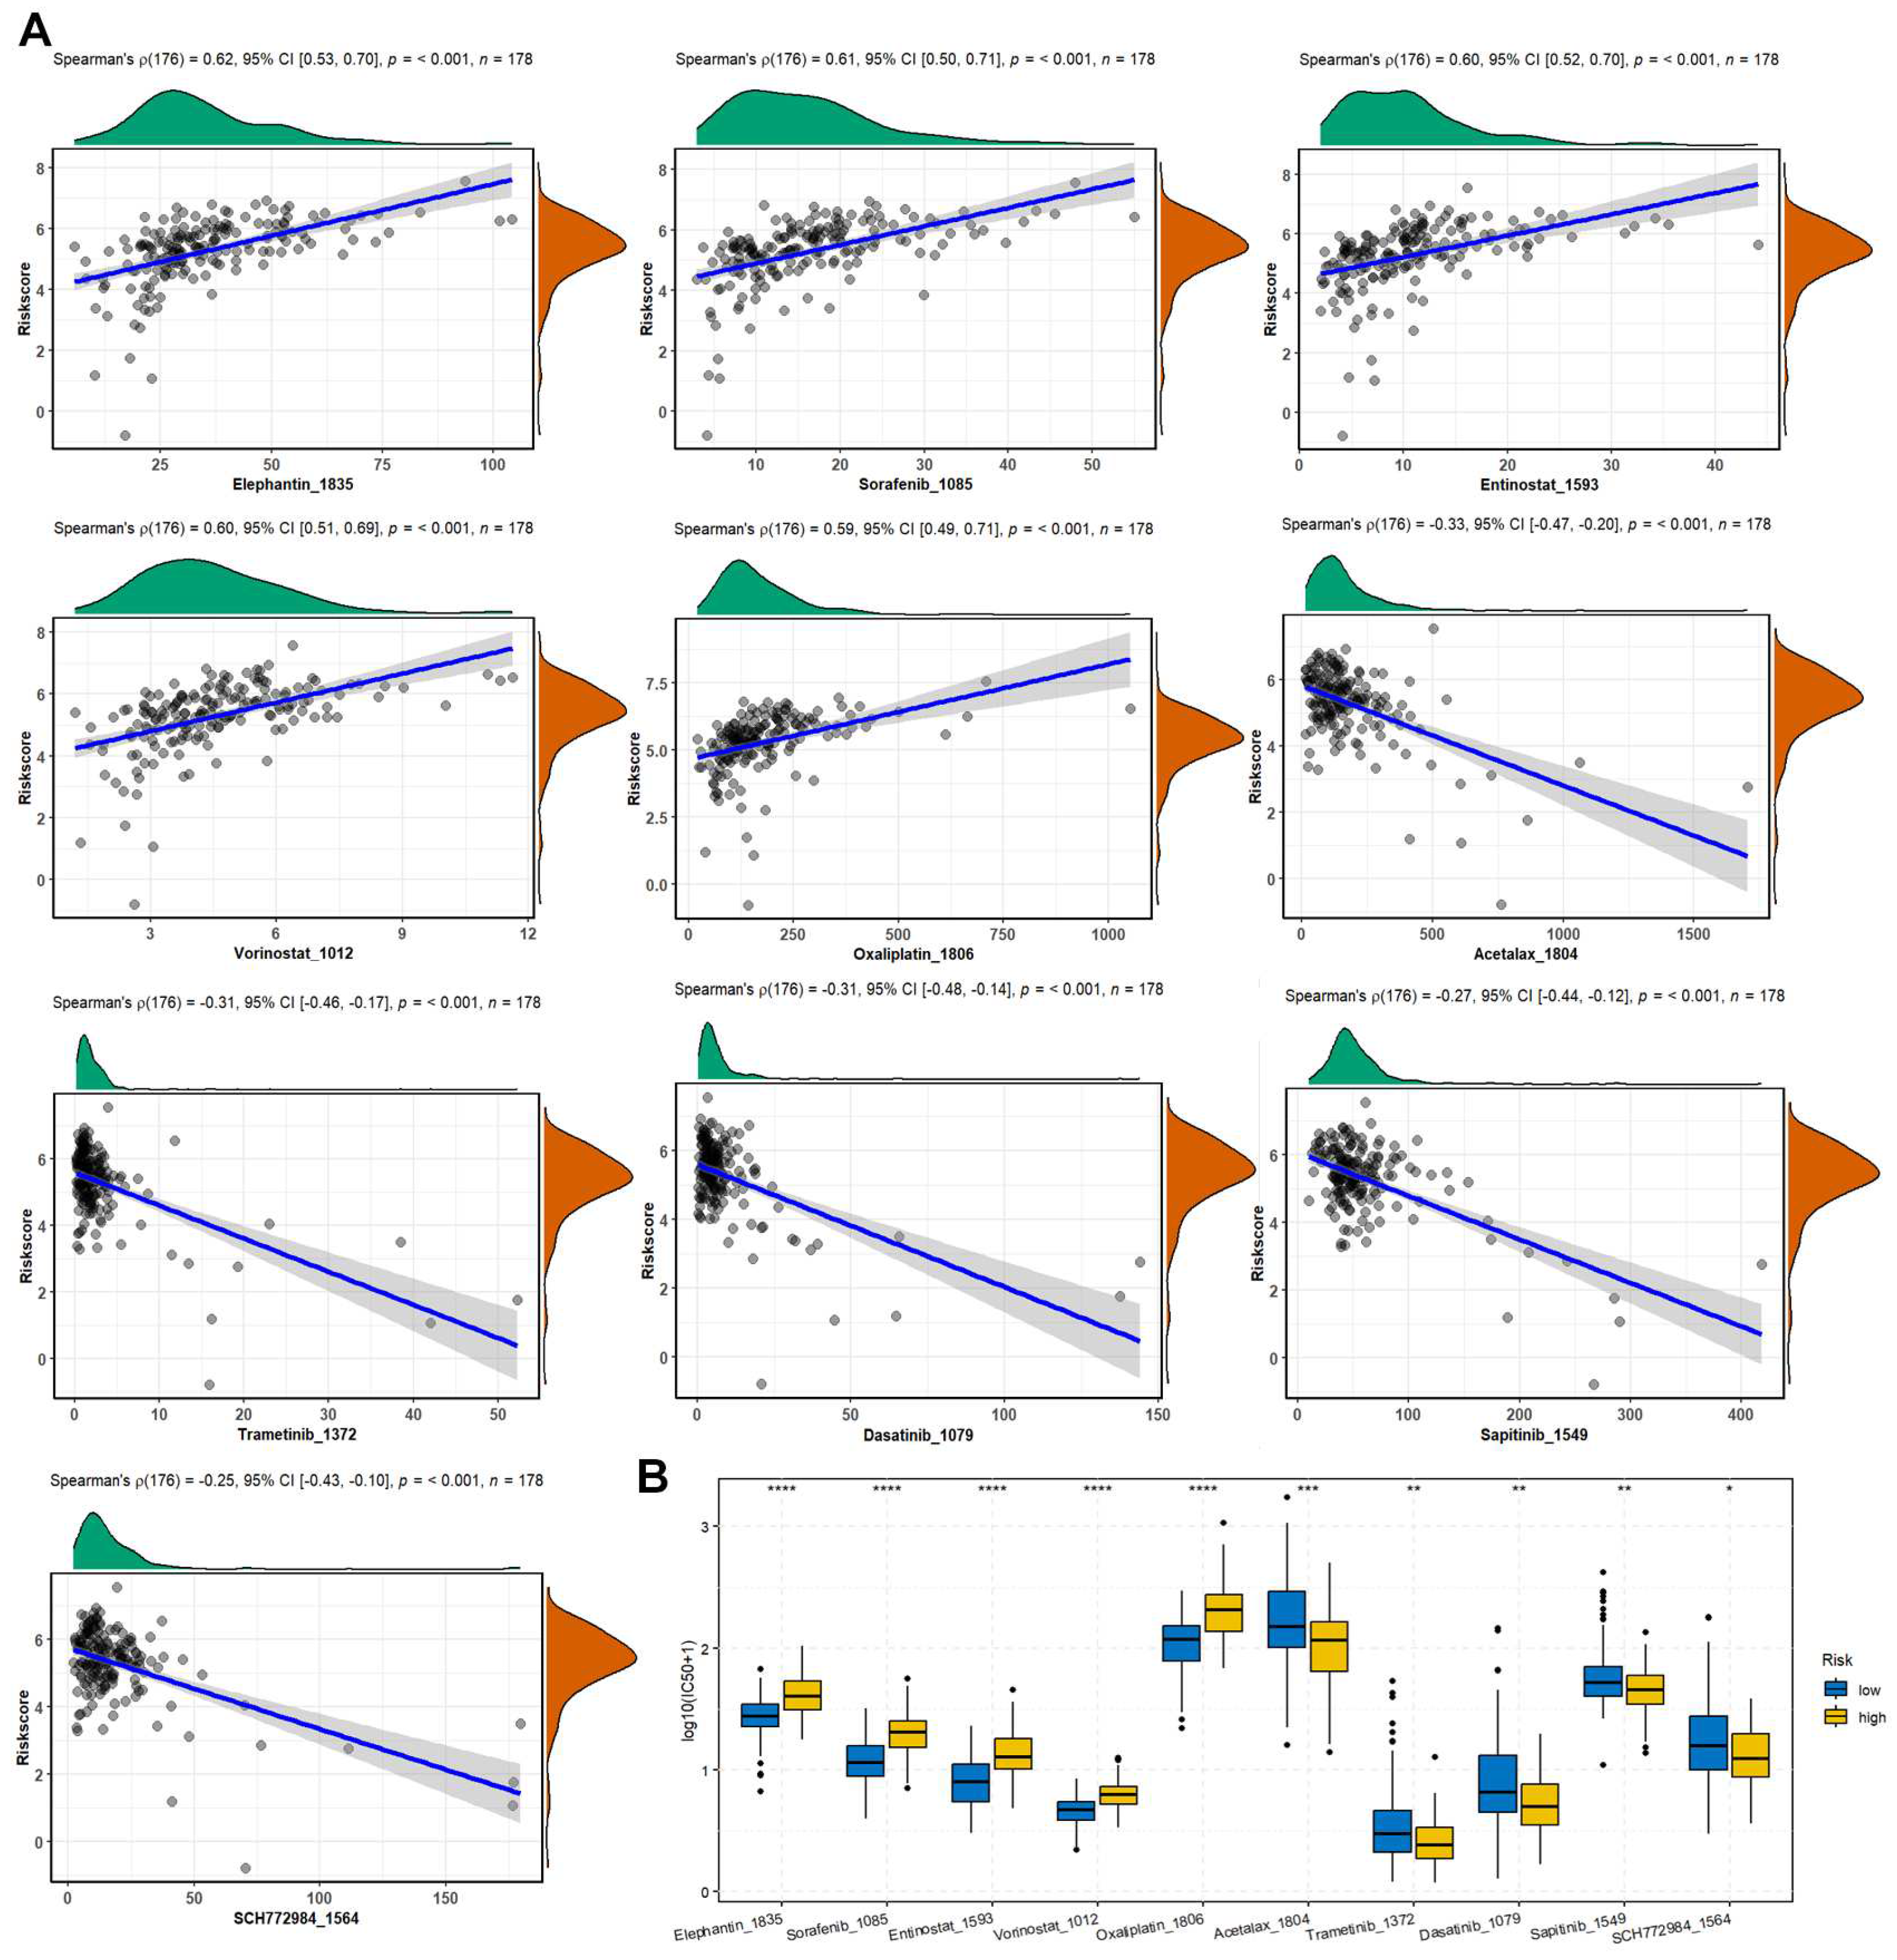
The predicted IC50 values of the TCGA-PAAD patients were obtained using the oncoPredict R package based on GDSC2 database. The spearman correlation analysis found that the risk scores were positively correlated with Elephantin, Sorafenib, Entinostat, Vorinostat, Oxaliplatin, while negatively correlated with Acetalax, Trametinib, Dasatinib, Sapitinib, and SCH772984 (
Figure 7A). Moreover, the positively correlated drugs showed significantly decreased IC50 in low-risk group compared with the high-risk group (
Figure 7B).
Expression validation of risk genes in PAAD tissues
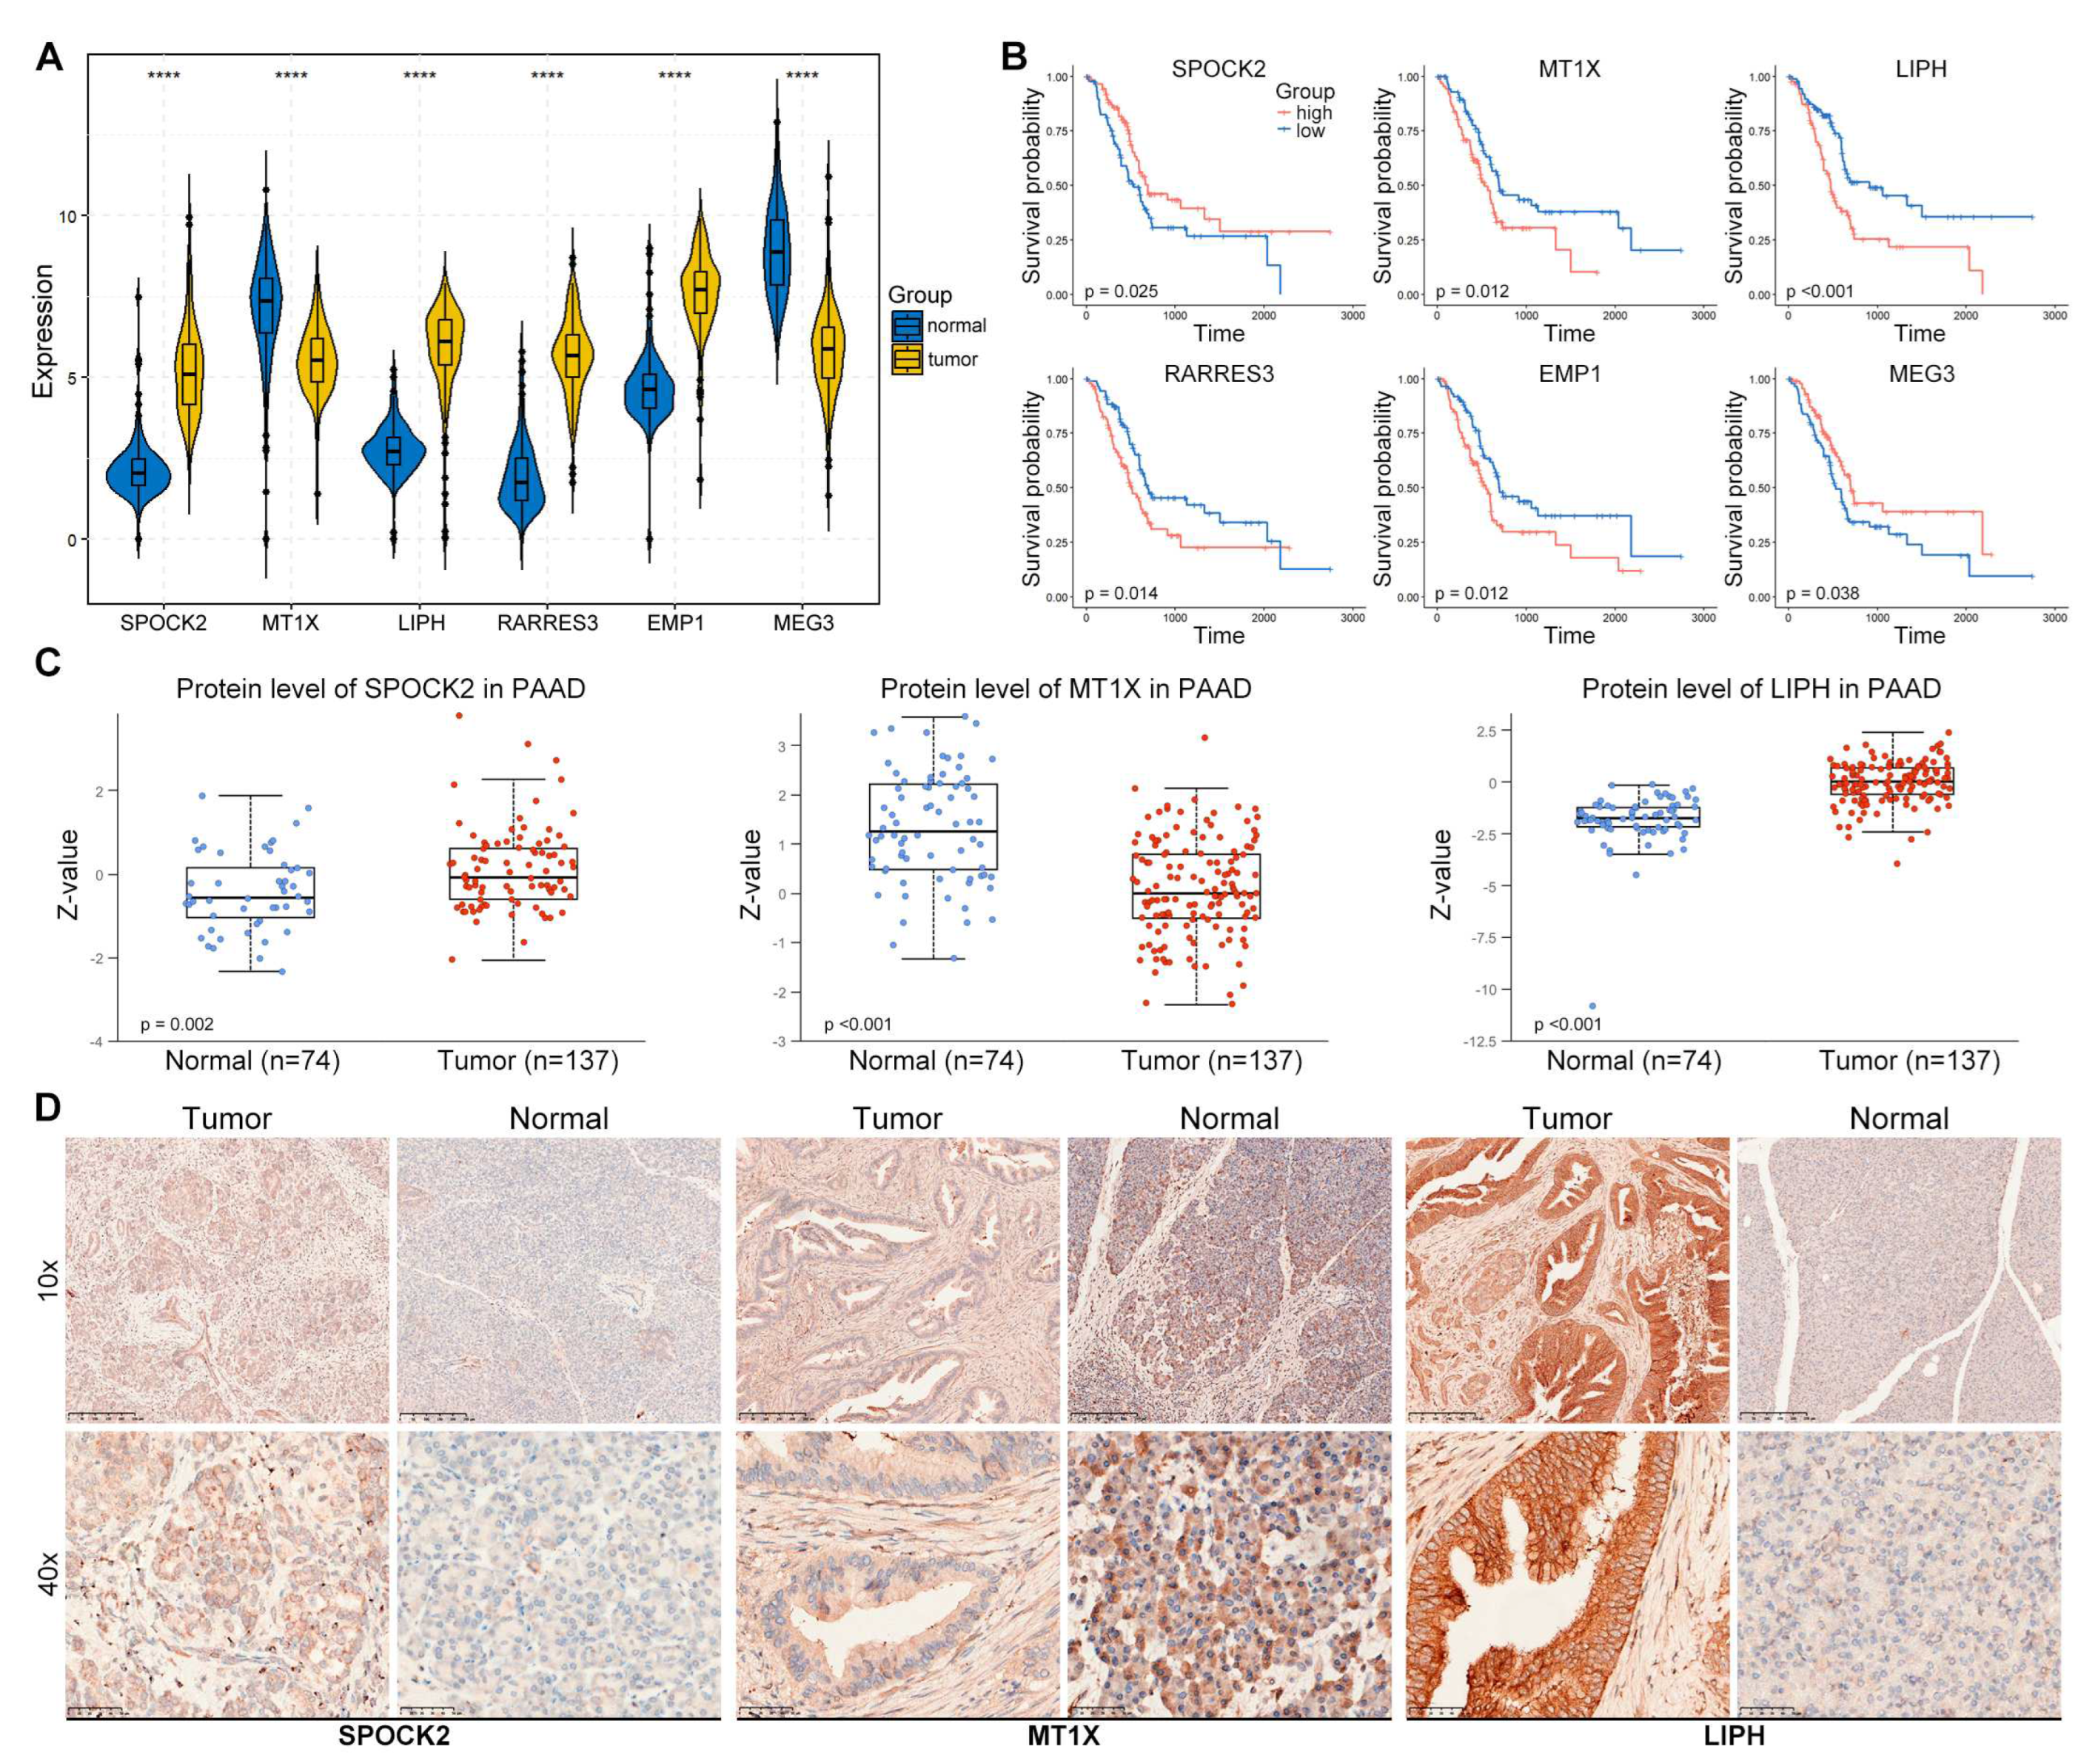
We further explored the expression of risk genes in PAAD tissues. The mRNA levels of these genes in TCGA-GTEx cohort showed that SPOCK2, LIPH, RARRES3, and EMP1 were significantly increased in tumor samples compared with normal tissues (
Figure 8A). The Kaplan-Meier curve of the high- and low-risk patients based on the expression of risk genes in TCGA cohort found that SPOCK2 and MEG3 were positively correlated with the OS of PAAD patients, while MT1X, LIPH, RARRES3, and EMP1 were negatively correlated with the OS of PAAD patients (
Figure 8B). The protein expression of several tumors from Clinical Proteomic Tumor Analysis Consortium (CPTAC) was analyzed by the The University of ALabama at Birmingham CANcer data analysis Portal (UALCAN,
https://ualcan.path.uab.edu/index.html) [
19]. The results from CPTAC database showed that the protein levels of SPOCK2 and LIPH were remarkably increased in PAAD tumor compared with normal tissues, while the protein level of MT1X was significantly decreased in PAAD tumors (
Figure 8C). In addition, our IHC staining demonstrated consistent results with CPTAC database, SPOCK2 and LIPH were increased while MT1X was decreased (
Figure 8D).
SPOCK2 may be a novel CD8TEX cellular marker
ScRNA-seq has promoted the understanding of tumor heterogeneity at the single-cell level [
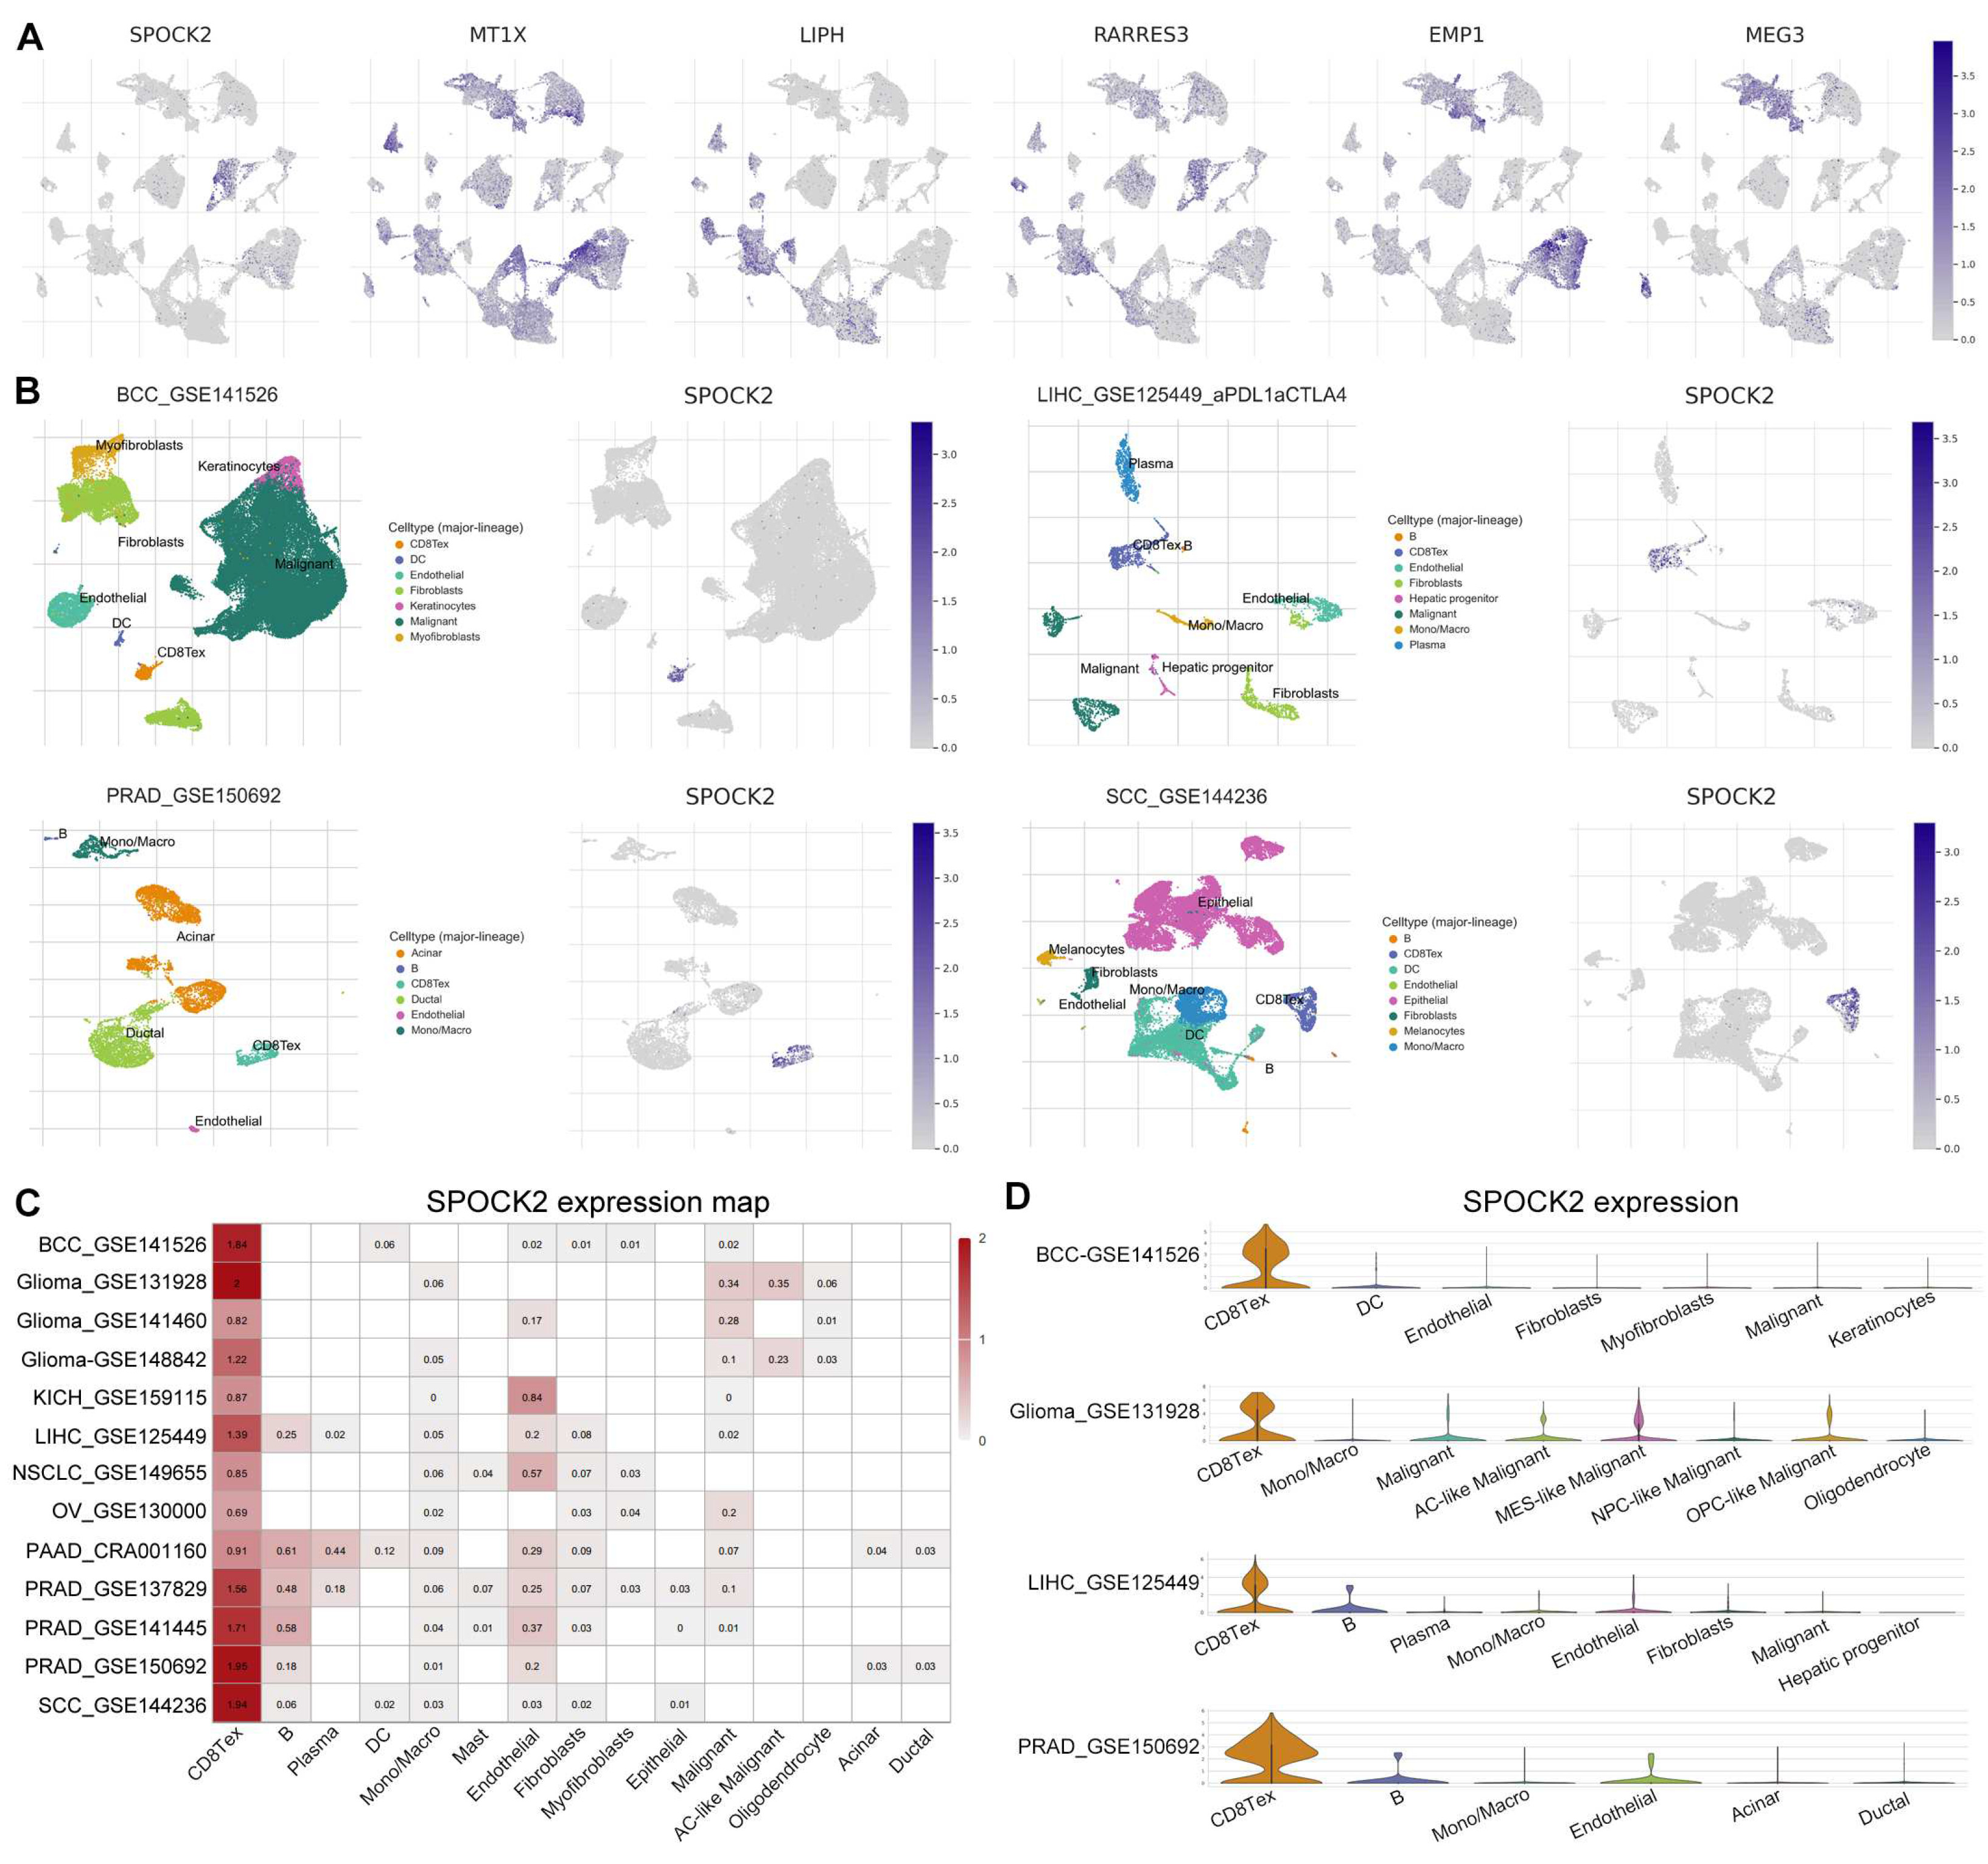
20]. We explored the expression of the risk genes in the TME using PAAD-CRA001160 dataset from TISCH database. Interestingly, the feature plots showed that SPOCK2 was almost exclusively expressed in CD8TEX cells (
Figure 2B,
Figure 9A). We further explored the expression of SPOCK2 in some tumors, including basal cell carcinoma (BCC), liver hepatocellular carcinoma (LIHC), prostate adenocarcinoma (PRAD), and squamous-cell carcinoma (SCC). Similarly, SPOCK2 was specifically and highly expressed in CD8TEX cells in BCC, LIHC, PRAD, and SCC (
Figure 9B). A heatmap of SPOCK2 across numerous tumors was drawn including glioma, kidney chromophobe (KICH), non-small-cell lung carcinoma (NSCLC), and ovarian serous cystadenocarcinoma (OV). The results revealed that SPOCK2 was specifically and highly expressed in CD8TEX cells compared with B cell, dendritic cell, monocyte, macrophage, fibroblast, and malignant cells (
Figure 9C,D). Collectively, these scRNA-seq results of numerous tumors strongly suggest that SPOCK2 may serve as a novel CD8TEX cellular marker.
Discussion
The lack of effective treatment makes PAAD one of the most lethal malignancies, although some advances have been achieved in surgical intervention, adjuvant therapy, and chemotherapy [
21]. Immunotherapy provides revolutionary strategies for the treatment of cancer and has rejuvenated the tumor immunology field [
22], which has been considered as the primary treatment for several tumors [
23]. Several types of immunotherapy, including ICIs, T-cell transfer therapy, monoclonal antibodies, treatment vaccines, and immune system modulators, have achieved durable clinical responses [
24], however, PDAC is almost unresponsive to immunotherapy due to low mutational loads, desmoplastic dense stroma, low number of tumor neoantigens, and “cold” TIME [
25]. With recent advances in scRNA-seq, systematic interrogation of the PAAD TME provided novel insights into the annotation of precise cellular composition in PAAD TME [
26]. TEX-related genes could be extracted from CD8TEX cells from scRNA-seq data, and TEX based gene signatures have been widely used to predict the prognostic, molecular and immune features, as well as therapy response in several tumors, including LIHC, lung adenocarcinoma, and NSCLC [
27,
28,
29,
30]. In this study, we identified and validated the TEX-related signature for predicting prognosis and immune response in PAAD by integrated analysis of scRNA-seq and bulk RNA sequencing data.
The CD8TEX cell related genes were extracted from PAAD scRNA-seq dataset from the TISCH database, which were merged with DEGs with prognostic potential in TCGA-GTEx cohort. Subsequently, univariate COX regression, LASSO regression, and stepwise multivariate Cox regression analysis were utilized to construct a final TEX-related risk model consisting of six genes. In the training TCGA cohort, we found low-risk patients had longer survival time, and TEX-related risk model was an independent prognostic indicator with more accurate prediction of clinical outcome than other clinical factors such as age, grade, and stage. Moreover, the prognostic potential of this risk model has been further validated in three external cohorts (ICGC-PACA-CA, ICGC-PAAD-US, and GSE71729), indicating the robustness of this model.
To gain more insight into the molecular properties of TEX-related risk model, we systematically evaluated the KEGG pathways using GSVA method. Cancer related KEGG pathways were highly enriched in high-risk PAAD patients, including P53 signaling pathway and cell cycle. As the mutational load was correlated with the prognostics and immune therapy response [
31], we further characterized the mutational landscapes in high- and low-risk patients. The top five mutated genes were similar between the two groups, however, the mutations in
KRAS,
TP53, and
CDKN2A were remarkably more prevalent in the high-risk group than the low-risk group. Surprisingly, 86% and 79% high-risk patients harbored KRAS and
TP53 mutation, whose mutation rates were more than 1.7 folds of the low-risk patients. PAAD genomic studies revealed activation mutations of
KRAS and inactivation mutations of
TP53,
SMAD4, and/or
CDKN2A in >50% of cases [
32]. Downstream signaling of mutant KRAS (mKRAS) orchestrates immunosuppressive TIME. mKRAS promoted autophagocytosis of cell surface MHC class I to prevent innate and adaptive anti-tumor immunity. mKRAS also promotes tumor immunoresistance by stabilizing PD-L1 mRNA [
33]. Moreover, mKRAS signaling stimulates tumor-intrinsic CXCL1 and GM-CSF expression leading to T-cell exclusion and myeloid-derived suppressor cell (MDSC) infiltration [
6]. Most mutations in tumor suppressor
TP53 was loss-of-function mutation [
34], especially in the DNA-binding domain, leading to tumor-promoting properties. Cerium oxide nanoparticles targeting mutant p53 protein displayed specific therapeutic efficacy in mutant p53 cancer cells, shedding light to the therapeutic strategy for high-risk patients [
35].
The TIME were also investigated to characterize their organization, immune function, and develop new treatments for PAAD. The high-risk patients showed immunosuppressive TME, characterized by increased infiltration of Treg cells and decreased antigen presentation, cytolytic activity, and check point immunological functions. Treg cells, characterized by the expression of FOXP3, are an immunosuppressive subset of CD4
+ T cells, and play essential roles in maintaining self-tolerance and hampering antitumor immune responses [
36]. Moreover, the risk score is negatively correlated with NK and CD4
+ T cells, essential components of innate and adaptive immune cells. In addition, the high-risk patients had unique immune subtypes. The lymphocyte depleted C4 subtype characterized by high M2 response was only observed in high-risk group.
Some recent studies provide positive results of immune therapy via epigenetic-transcriptional control. Li et al. reported that KDM3A regulated the expression of EGFR to suppress anti-tumor immunity in PAAD. Genetic ablation of KDM3A reduced the infiltration of cancer-associated fibroblasts, and promoted T cell infiltration, and sensitized tumors to combination immunotherapy [
37]. We found that the risk scores were positively correlated with several drugs. Moreover, the positively correlated drugs showed significantly decreased IC50 in low-risk group compared with the high-risk group, which may provide combination immunotherapy choice for further investigations. The IC50 of Sorafenib, a kinase inhibitor drug, was positively correlated with the risk score in PAAD patients. A recent meta-analysis of randomized trials of advanced hepatocellular carcinoma (HCC) patients revealed that survival outcome for Sorafenib has improved over time in advanced HCC [
38]. The IC50 of histone deacetylase inhibitor Entinostat was positively correlated with the risk score in PAAD patients. Entinostat was reported to convert immune-resistant PAAD into checkpoint-responsive tumor through reprogramming tumor-infiltrating myeloid-derived suppressor cells [
39]. These data may have essential implications for PAAD clinical trial design.
In addition to the mRNA expression of the risk genes, we further validated the protein levels of these risk genes from both proteomic database and our clinical specimens. Consistent with the gene expression changes in PAAD, SPOCK2 and LIPH were increased while MT1X was decreased in PAAD.
Finally, we also investigated the expression pattern of these risk genes within the TME of PAAD, and SPOCK2 was found to be specifically and highly expressed in CD8TEX cells in numerous tumors, including BCC, glioma, KICH, LIHC, NSCLC, OV, PAAD, PRAD, and SCC. Collectively, these scRNA-seq results at single cell level suggest that SPOCK2 may serve as a novel CD8TEX cellular marker.
In conclusion, we identified and validated a TEX-related gene signature with prognostic potential and acts as an independent indicator for predicting the clinical outcome of PAAD patients. Unique molecular and immunological features had been characterized in PAAD based on the TEX-related gene signature, and high-risk patients showed worse outcome and an immunosuppressive TME. This study provides deeper insights into T cell exhaustion in PAAD.
