Submitted:
29 January 2024
Posted:
31 January 2024
You are already at the latest version
Abstract
Keywords:
1. Introduction
2. Results
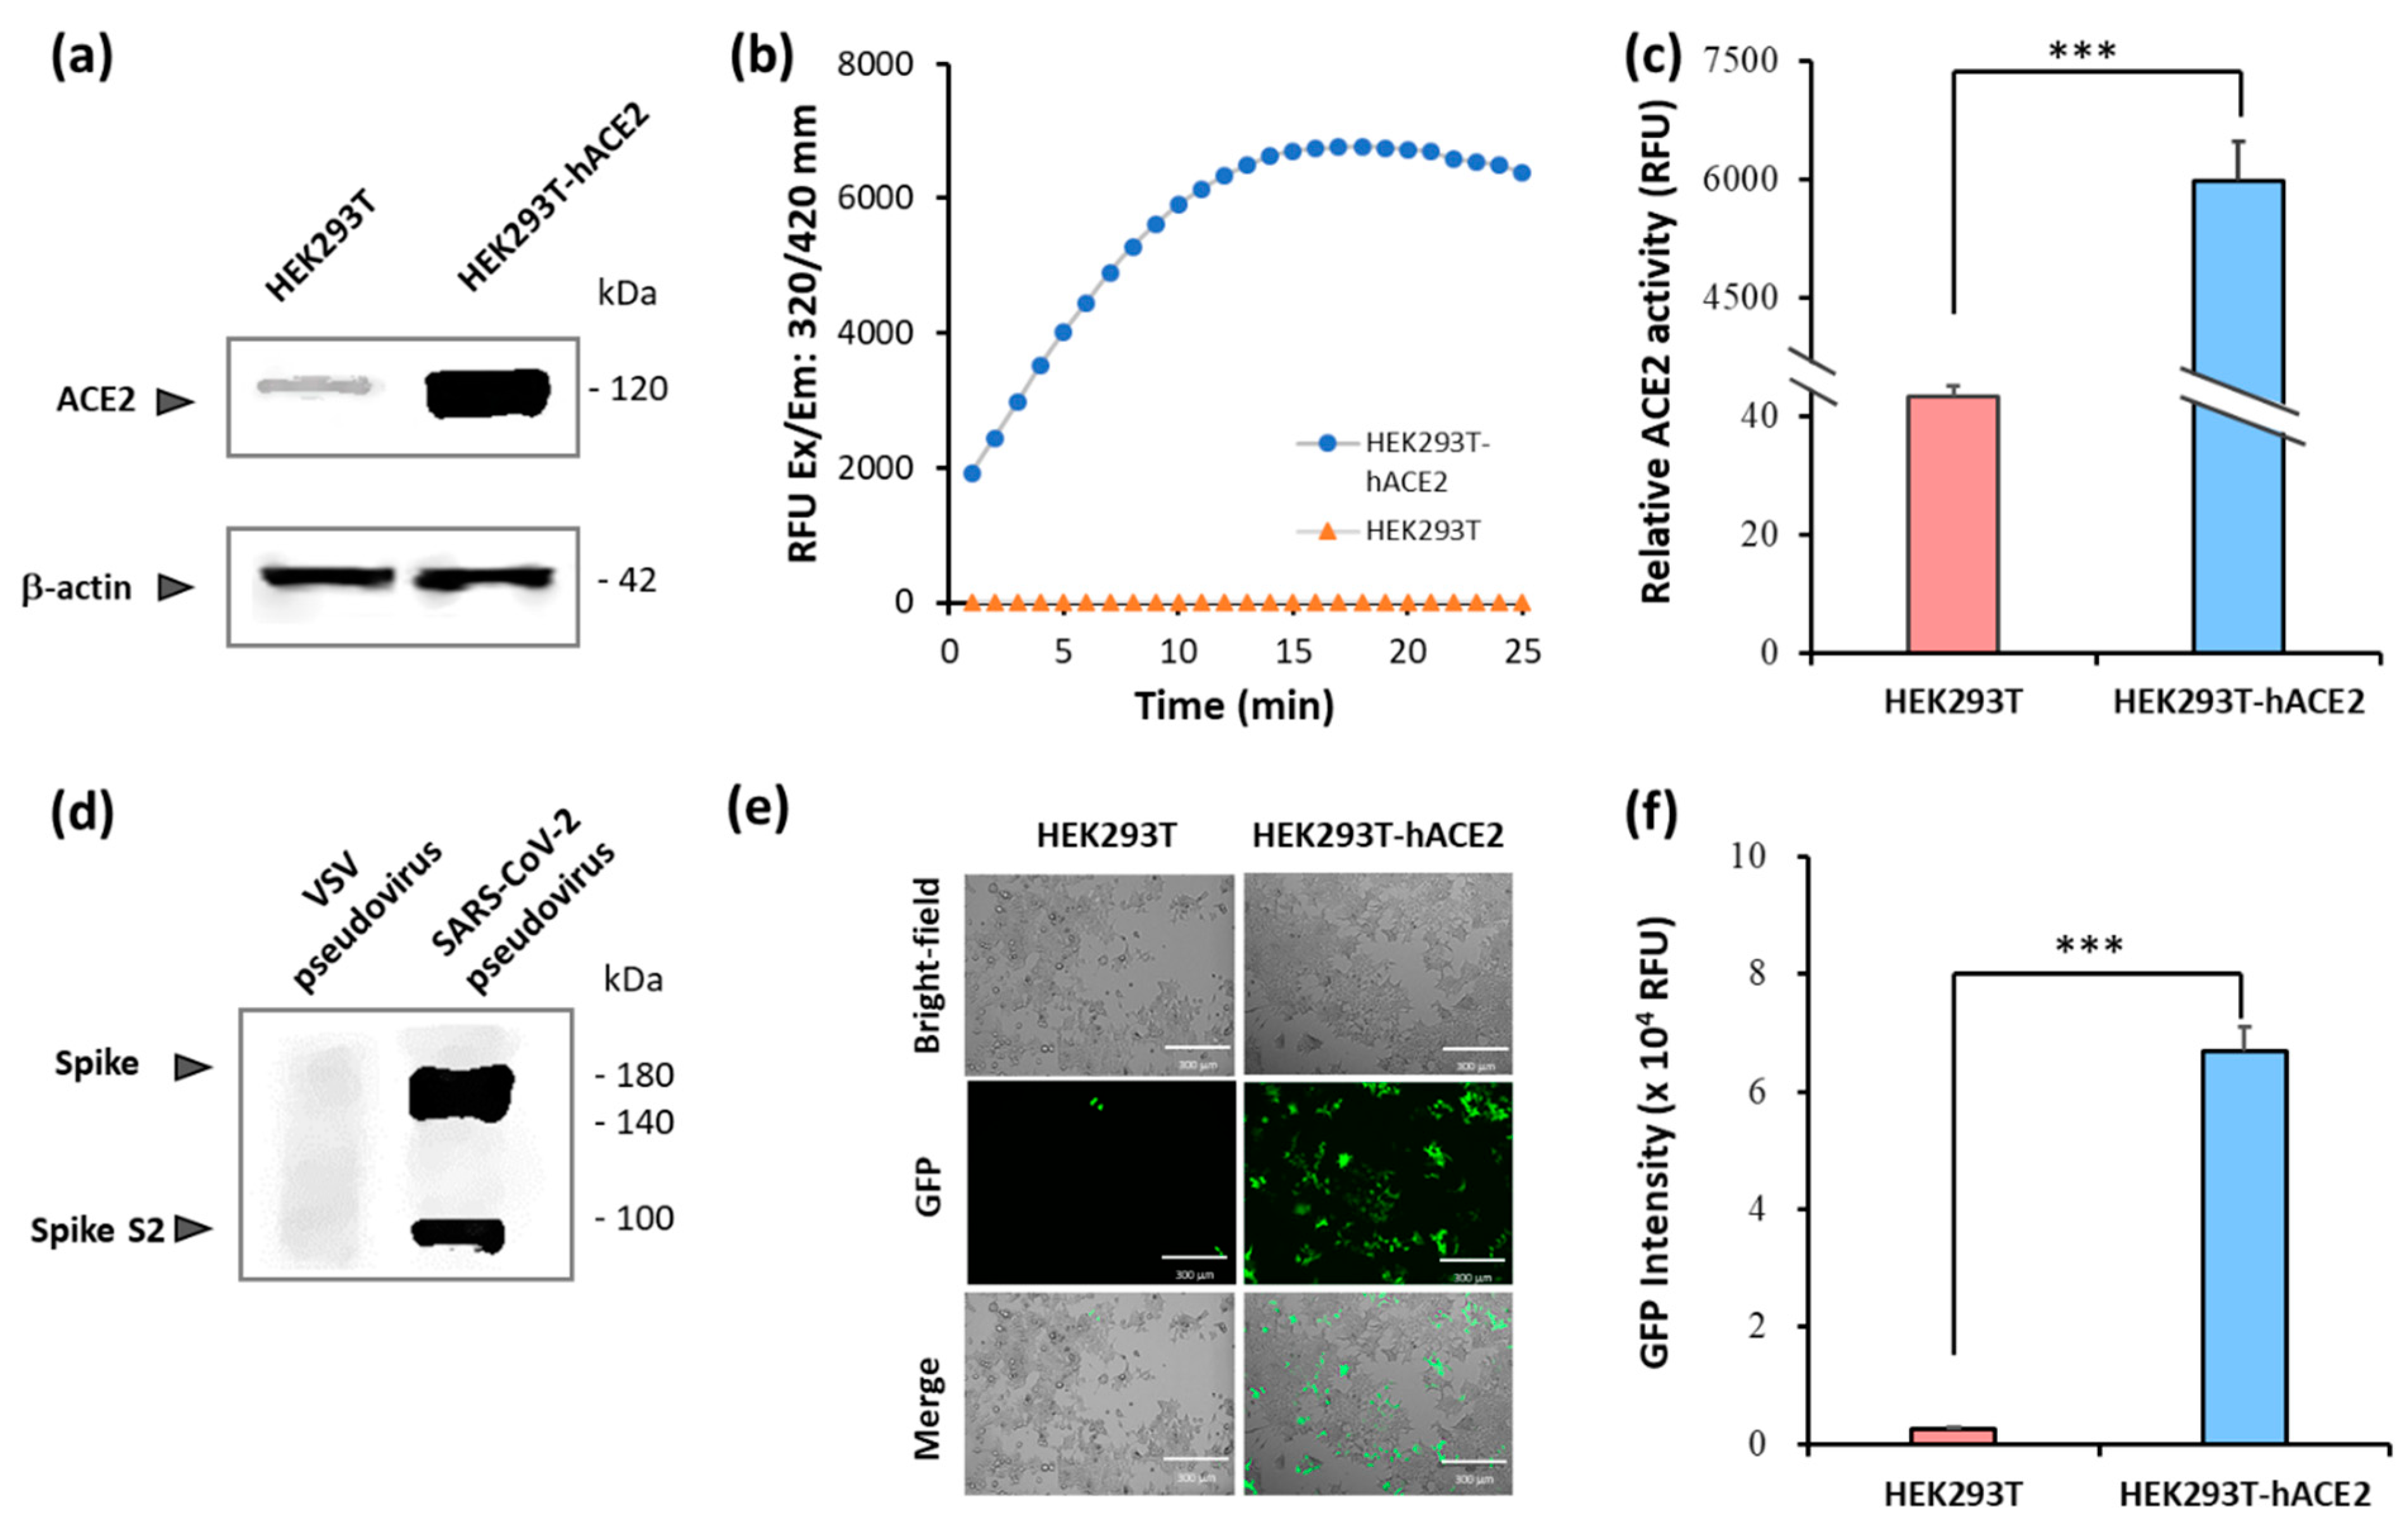
2.1. Establishment of pseudovirus system for evaluating binding efficacy of viral spike protein and hACE2 receptor
2.2. Identification of SARS-CoV-2 spike pseudovirus system for drug candidates
2.3. Assessment of inhibitory efficacy of herbs on pseudovirus infection
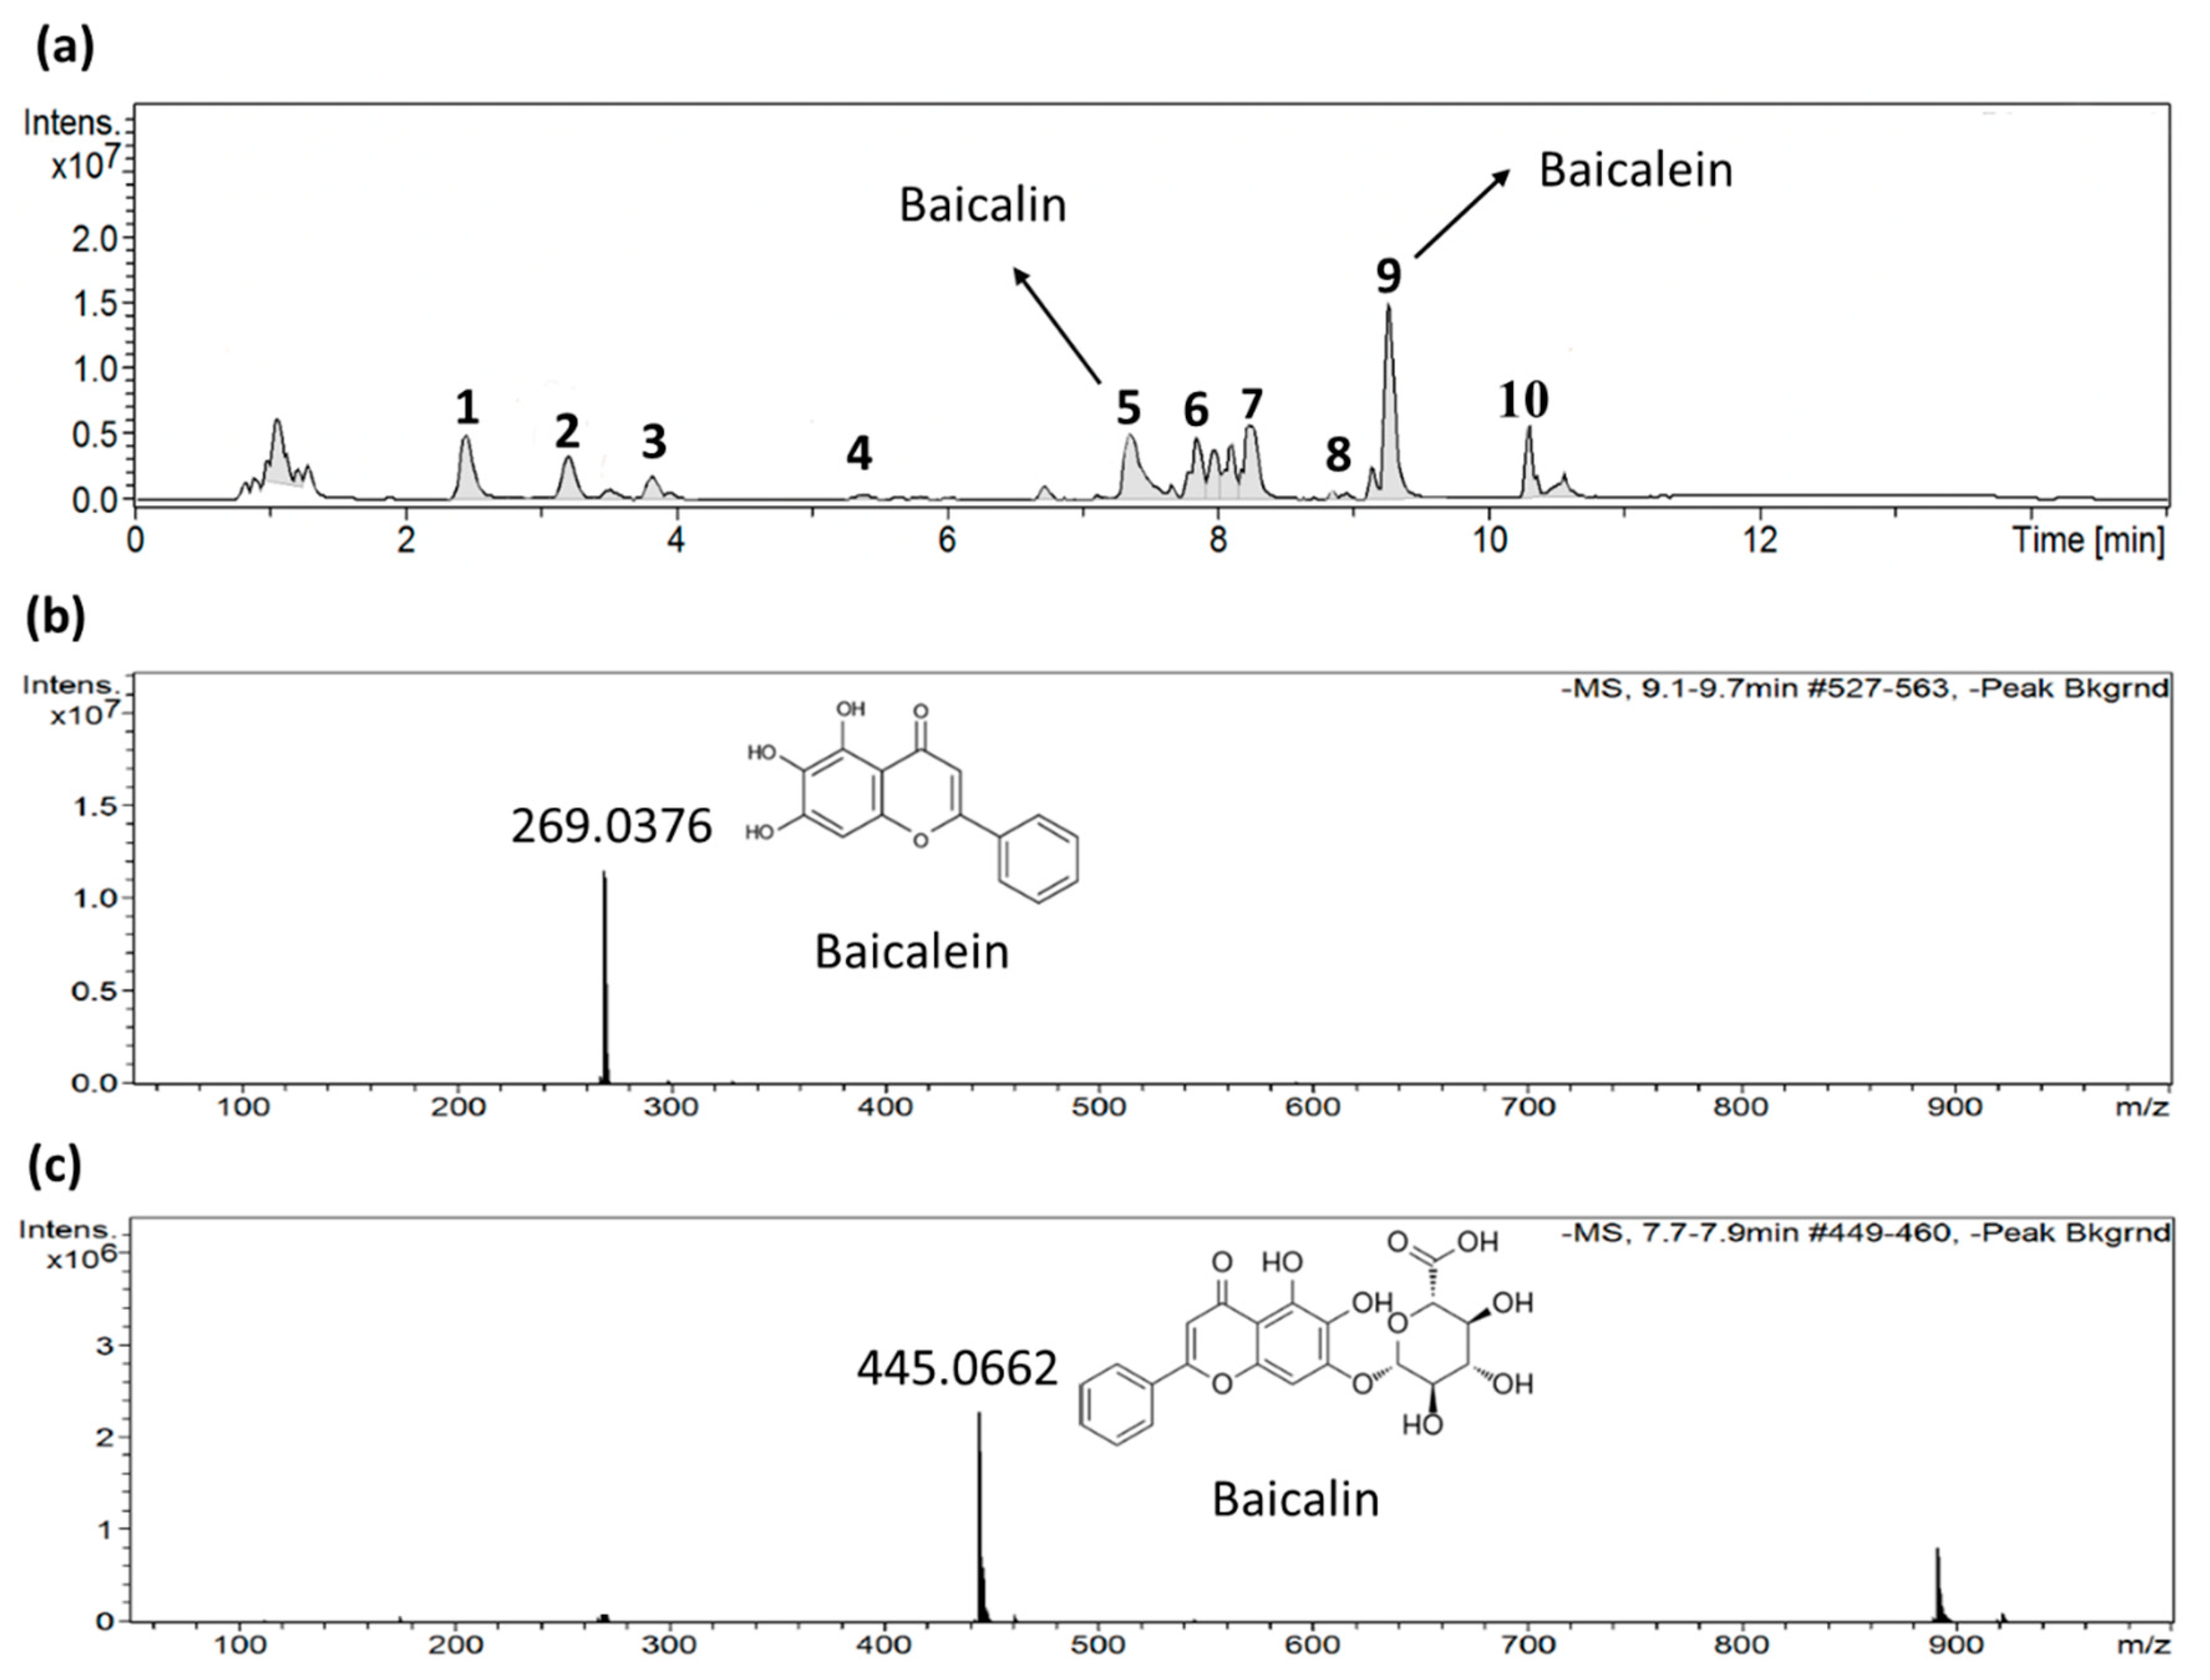
2.4. Identification of active ingredients in S. baicalensis
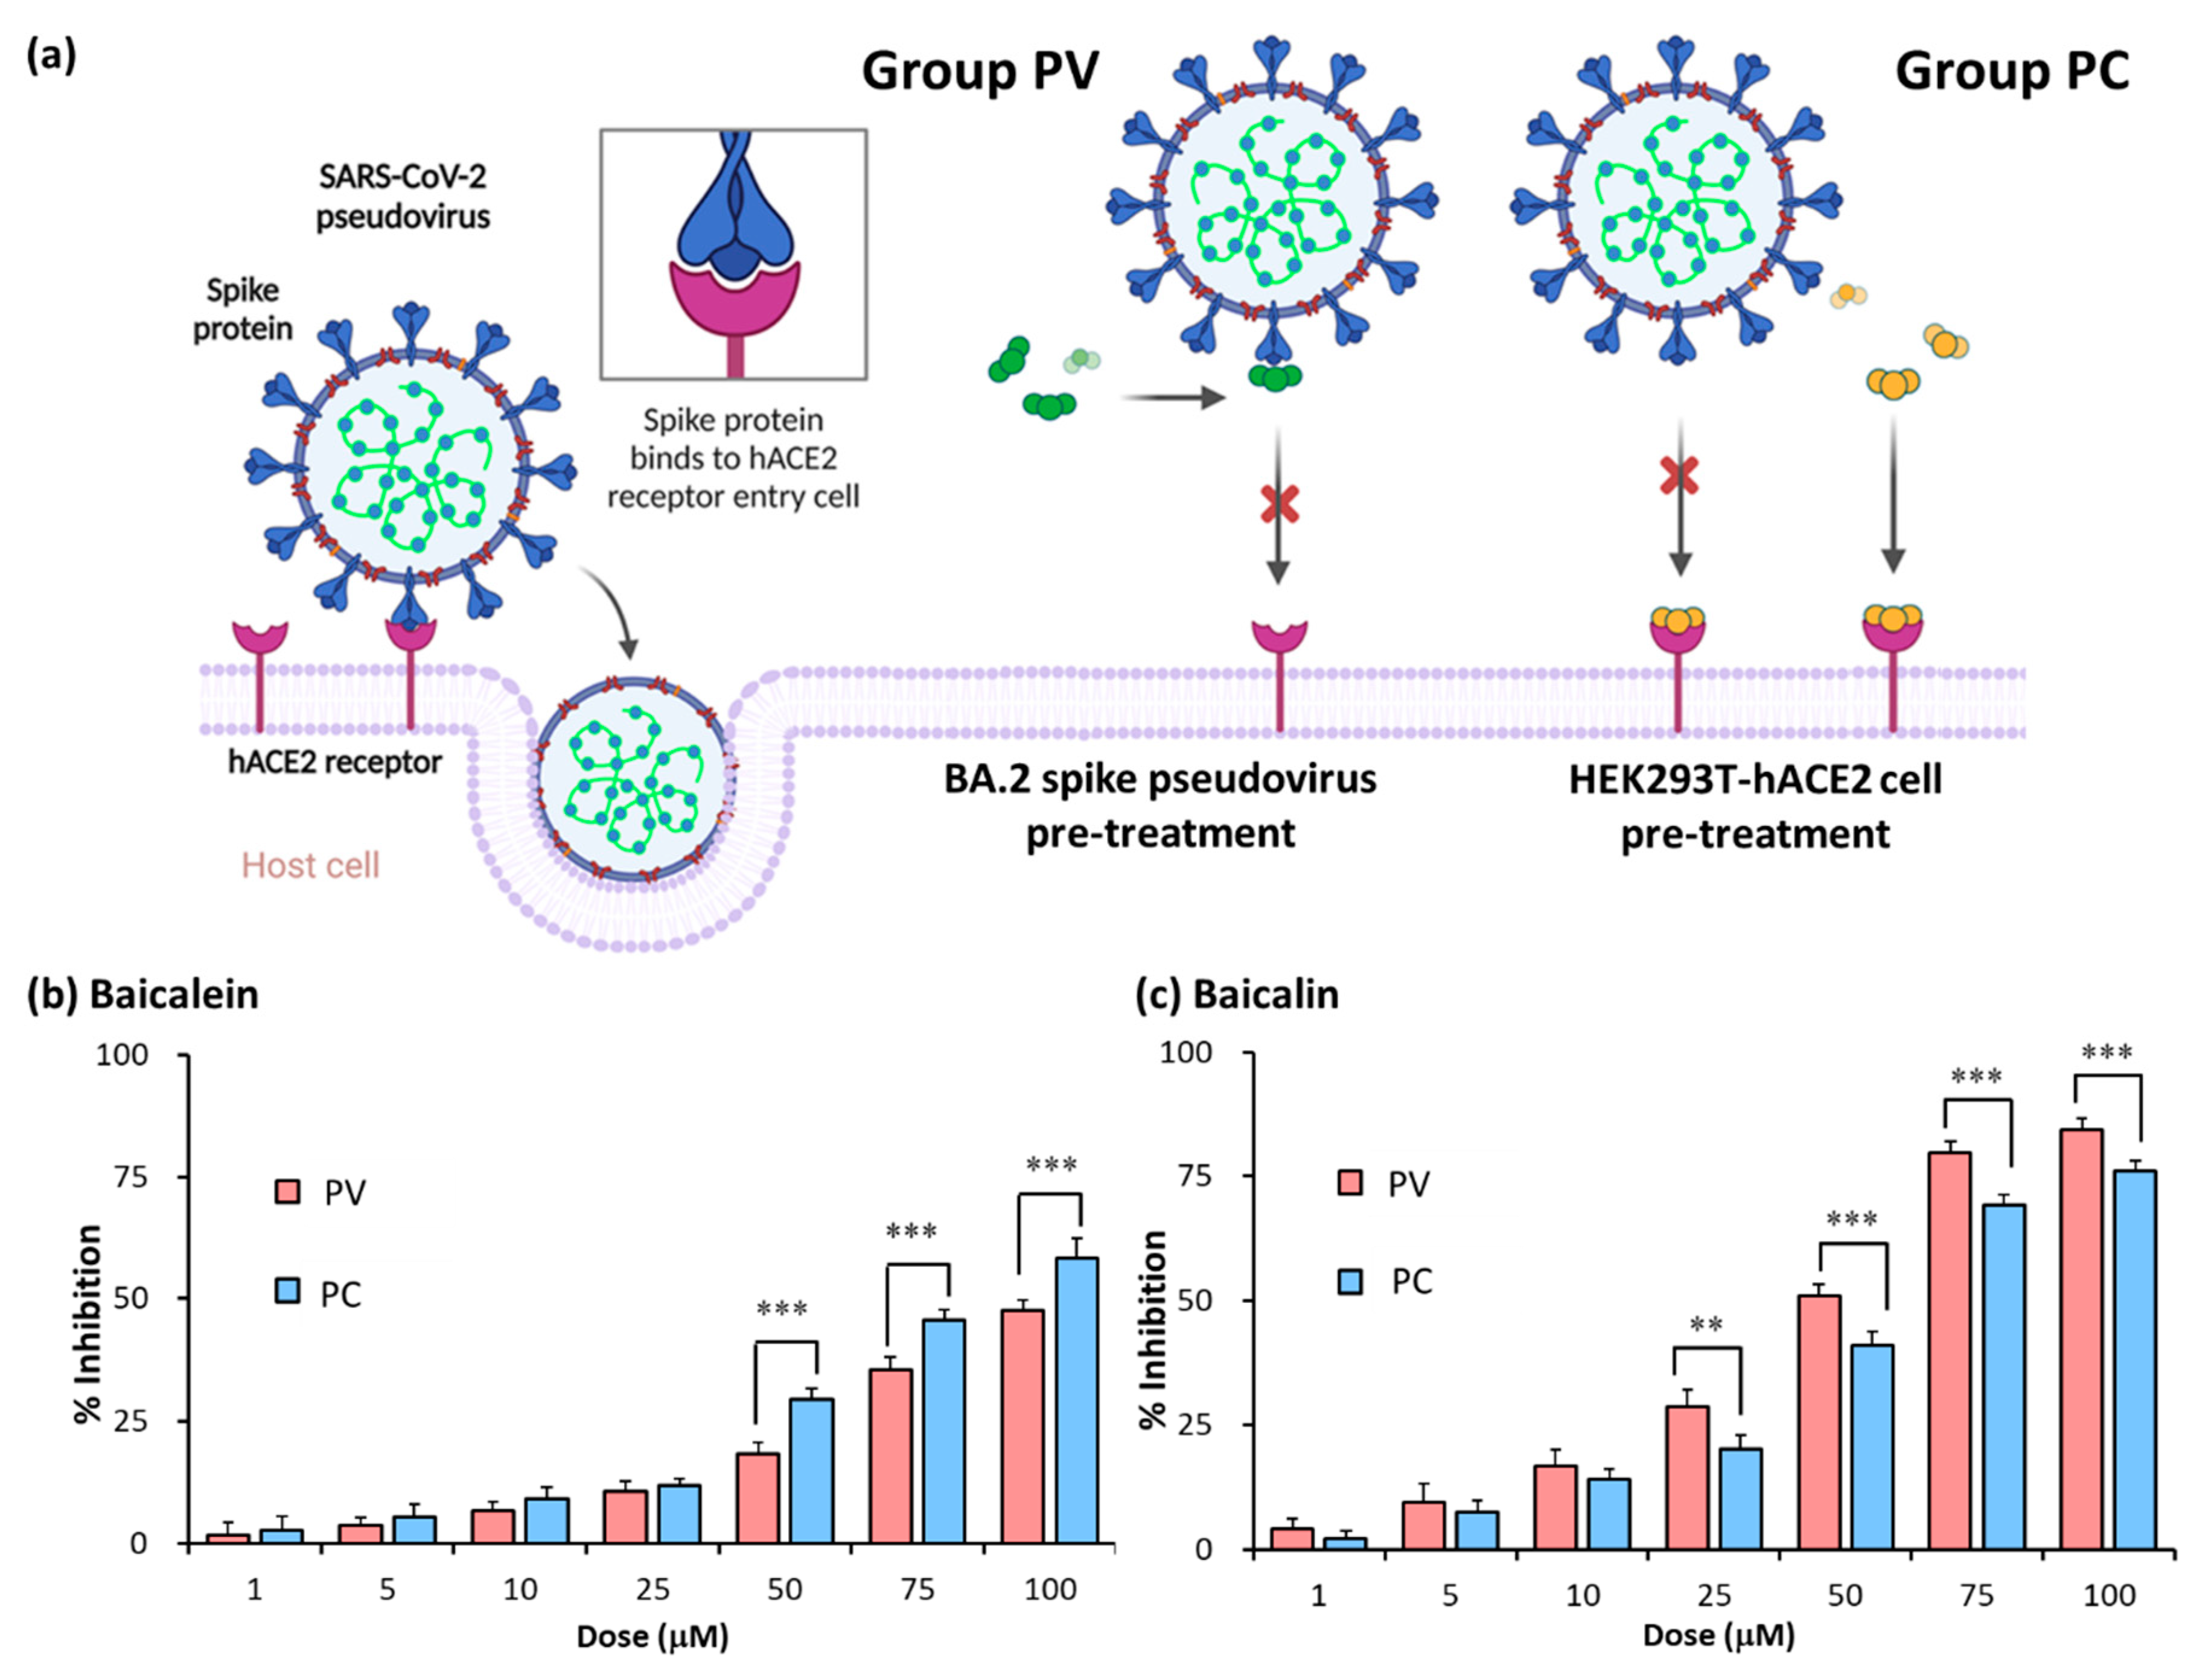
2.5. Baicalein and baicalin inhibition of Omicron spike pseudovirus infection
2.6. Synergistic effect of baicalein and baicalin on pseudovirus infection inhibition
3. Discussion
4. Materials and Methods
4.1. Chemicals and reagents
4.2. Cell culture and cell viability assay
4.3. Pseudovirus system
4.4. Pseudovirus infection inhibition assay
4.5. Protein extraction
4.6. Western blot
4.7. Extraction of each TCM
4.8. LC-MS analyses
4.9. Synergy scoring and detection
4.10. Statistical analysis
5. Conclusions
6. Patents
Author Contributions
Funding
Institutional Review Board Statement
Informed Consent Statement
Data Availability Statement
Acknowledgments
Conflicts of Interest
References
- Wang, M.; Cao, R.; Zhang, L.; Yang, X.; Liu, J.; Xu, M.; Shi, Z.; Hu, Z.; Zhong, W.; Xiao, G. Remdesivir and chloroquine effectively inhibit the recently emerged novel coronavirus (2019-nCoV) in vitro. Cell Res 2020, 30, 269–271. [Google Scholar] [CrossRef] [PubMed]
- Callaway, E. Beyond Omicron: what’s next for COVID’s viral evolution. Nature 2021, 600, 204–207. [Google Scholar] [CrossRef] [PubMed]
- Pustake, M.; Tambolkar, I.; Giri, P.; Gandhi, C. SARS, MERS and CoVID-19: An overview and comparison of clinical, laboratory and radiological features. J Family Med Prim Care 2022, 11, 10–17. [Google Scholar] [CrossRef] [PubMed]
- Saldivar-Espinoza, B.; Garcia-Segura, P.; Novau-Ferré, N.; Macip, G.; Martínez, R.; Puigbò, P.; Cereto-Massagué, A.; Pujadas, G.; Garcia-Vallve, S. The Mutational Landscape of SARS-CoV-2. Int J Mol Sci 2023, 24, 9072. [Google Scholar] [CrossRef] [PubMed]
- Chan, J.F.; Kok, K.H.; Zhu, Z.; Chu, H.; To, K.K.; Yuan, S.; Yuen, K.Y. Genomic characterization of the 2019 novel human-pathogenic coronavirus isolated from a patient with atypical pneumonia after visiting Wuhan. Emerg Microbes Infect 2020, 9, 221–236. [Google Scholar] [CrossRef] [PubMed]
- Chatterjee, S.; Bhattacharya, M.; Nag, S.; Dhama, K.; Chakraborty, C. A detailed overview of SARS-CoV-2 omicron: its sub-variants, mutations and pathophysiology, clinical characteristics, immunological landscape, immune escape, and therapies. Viruses 2023, 15, 167. [Google Scholar] [CrossRef] [PubMed]
- Lamkiewicz, K.; Esquivel Gomez, L.R.; Kühnert, D.; Marz, M. Genome structure, life cycle, and taxonomy of coronaviruses and the evolution of SARS-CoV-2. In Viral Fitness and Evolution: Population Dynamics and Adaptive Mechanisms; Springer: 2023; pp. 305–339.
- Hirano, T.; Murakami, M. COVID-19: a new virus, but a familiar receptor and cytokine release syndrome. Immunity 2020, 52, 731–733. [Google Scholar] [CrossRef] [PubMed]
- Yang, L.; Li, J.; Guo, S.; Hou, C.; Liao, C.; Shi, L.; Ma, X.; Jiang, S.; Zheng, B.; Fang, Y. SARS-CoV-2 variants, RBD mutations, binding affinity, and antibody escape. Int J Mol Sci 2021, 22, 12114. [Google Scholar] [CrossRef]
- Borkotoky, S.; Dey, D.; Hazarika, Z. Interactions of angiotensin-converting enzyme-2 (ACE2) and SARS-CoV-2 spike receptor-binding domain (RBD): a structural perspective. Mol Biol Rep 2023, 50, 2713–2721. [Google Scholar] [CrossRef]
- Reuter, N.; Chen, X.; Kropff, B.; Peter, A.S.; Britt, W.J.; Mach, M.; Überla, K.; Thomas, M. SARS-CoV-2 Spike Protein Is Capable of Inducing Cell–Cell Fusions Independent from Its Receptor ACE2 and This Activity Can Be Impaired by Furin Inhibitors or a Subset of Monoclonal Antibodies. Viruses 2023, 15, 1500. [Google Scholar] [CrossRef]
- Marshall, A.C. Traditional Chinese medicine and clinical pharmacology; Springer: 2020. 455–482.
- Lyu, M.; Fan, G.; Xiao, G.; Wang, T.; Xu, D.; Gao, J.; Ge, S.; Li, Q.; Ma, Y.; Zhang, H. Acta Pharm Sin B 2021, 11, 3337–3363. [CrossRef]
- Zhao, Z.; Li, Y.; Zhou, L.; Zhou, X.; Xie, B.; Zhang, W.; Sun, J. Prevention and treatment of COVID-19 using Traditional Chinese Medicine: A review. Phytomedicine 2021, 85, 153308. [Google Scholar] [CrossRef] [PubMed]
- Martín Giménez, V.M.; Modrego, J.; Gómez-Garre, D.; Manucha, W.; de Las Heras, N. Gut microbiota dysbiosis in COVID-19: Modulation and approaches for prevention and therapy. Int J Mol Sci 2023, 24, 12249. [Google Scholar] [CrossRef]
- Tsai, K.C.; Huang, Y.C.; Liaw, C.C.; Tsai, C.I.; Chiou, C.T.; Lin, C.J.; Wei, W.C.; Lin, S.J.; Tseng, Y.H.; Yeh, K.M.; et al. A traditional Chinese medicine formula NRICM101 to target COVID-19 through multiple pathways: A bedside-to-bench study. Biomed Pharmacother 2021, 133, 111037. [Google Scholar] [CrossRef] [PubMed]
- Chang, C.H.; Peng, W.Y.; Lee, W.H.; Lin, T.Y.; Yang, M.H.; Dalley, J.W.; Tsai, T.H. Biotransformation and brain distribution of the anti-COVID-19 drug molnupiravir and herb-drug pharmacokinetic interactions between the herbal extract Scutellaria formula-NRICM101. J Pharm Biomed Anal 2023, 115499. [Google Scholar] [CrossRef]
- Lin, C.H.; Chen, Y.J.; Lin, M.W.; Chang, H.J.; Yang, X.R.; Lin, C.S. ACE2 and a Traditional Chinese Medicine Formula NRICM101 Could Alleviate the Inflammation and Pathogenic Process of Acute Lung Injury. Medicina 2023, 59, 1554. [Google Scholar] [CrossRef]
- Wang, M.; Tao, L.; Xu, H. Chinese herbal medicines as a source of molecules with anti-enterovirus 71 activity. Chin Med 2016, 11, 1–26. [Google Scholar] [CrossRef] [PubMed]
- Zhao, T.; Tang, H.; Xie, L.; Zheng, Y.; Ma, Z.; Sun, Q.; Li, X. Scutellaria baicalensis Georgi. (Lamiaceae): a review of its traditional uses, botany, phytochemistry, pharmacology and toxicology. J Pharm Pharmacol 2019, 71, 1353–1369. [Google Scholar] [CrossRef] [PubMed]
- Chen, Q.; Lan, H.Y.; Peng, W.; Rahman, K.; Liu, Q.C.; Luan, X.; Zhang, H. Isatis indigotica: a review of phytochemistry, pharmacological activities and clinical applications. J Pharm Pharmacol 2021, 73, 1137–1150. [Google Scholar] [CrossRef]
- Kaul, R.; Paul, P.; Kumar, S.; Büsselberg, D.; Dwivedi, V.D.; Chaari, A. Promising antiviral activities of natural flavonoids against SARS-CoV-2 targets: systematic review. Int J Mol Sci 2021, 22, 11069. [Google Scholar] [CrossRef]
- Liu, H.; Ye, F.; Sun, Q.; Liang, H.; Li, C.; Li, S.; Lu, R.; Huang, B.; Tan, W.; Lai, L. Scutellaria baicalensis extract and baicalein inhibit replication of SARS-CoV-2 and its 3C-like protease in vitro. J Enzyme Inhib Med Chem 2021, 36, 497–503. [Google Scholar] [CrossRef]
- Yang, Y.; Islam, M.S.; Wang, J.; Li, Y.; Chen, X. Traditional Chinese Medicine in the Treatment of Patients Infected with 2019-New Coronavirus (SARS-CoV-2): A Review and Perspective. Int J Biol Sci 2020, 16, 1708–1717. [Google Scholar] [CrossRef]
- Ghosh, R.; Chakraborty, A.; Biswas, A.; Chowdhuri, S. Depicting the inhibitory potential of polyphenols from Isatis indigotica root against the main protease of SARS CoV-2 using computational approaches. J Biomol Struct Dyn 2022, 40, 4110–4121. [Google Scholar] [CrossRef]
- Thoene, J.; Gavin, R.F.; Towne, A.; Wattay, L.; Ferrari, M.G.; Navarrete, J.; Pal, R. In vitro activity of cysteamine against SARS-CoV-2 variants. Mol Genet Metab 2022, 137, 192–200. [Google Scholar] [CrossRef]
- Alonzi, T.; Aiello, A.; Repele, F.; Falasca, L.; Francalancia, M.; Garbuglia, A.R.; Delogu, G.; Nicastri, E.; Piacentini, M.; Goletti, D.; et al. Cysteamine exerts in vitro antiviral activity against the SARS-CoV-2 Delta and Omicron variants. Cell Death Discov 2020, 8, 288. [Google Scholar] [CrossRef]
- Wang, G.; Yang, M.L.; Duan, Z.L.; Liu, F.L.; Jin, L.; Long, C.B.; Zhang, M.; Tang, X.P.; Xu, L.; Li, Y.C.; et al. Dalbavancin binds ACE2 to block its interaction with SARS-CoV-2 spike protein and is effective in inhibiting SARS-CoV-2 infection in animal models. Cell Res 2021, 31, 17–24. [Google Scholar] [CrossRef]
- Hoffmann, M.; Jin, Y.; Pöhlmann, S. Dalbavancin: novel candidate for COVID-19 treatment. Cell Res 2021, 31, 243–244. [Google Scholar] [CrossRef]
- Fang, P.; Yu, M.; Shi, M.; Bo, P.; Gu, X.; Zhang, Z. Baicalin and its aglycone: a novel approach for treatment of metabolic disorders. Pharmacol Rep 2020, 72, 13–23. [Google Scholar] [CrossRef]
- Liang, S.; Deng, X.; Lei, L.; Zheng, Y.; Ai, J.; Chen, L.; Xiong, H.; Mei, Z.; Cheng, Y.-C.; Ren, Y. The comparative study of the therapeutic effects and mechanism of baicalin, baicalein, and their combination on ulcerative colitis rat. Front Pharmacol 2019, 10, 1466. [Google Scholar] [CrossRef]
- Dinda, B.; Dinda, S.; DasSharma, S.; Banik, R.; Chakraborty, A.; Dinda, M. Therapeutic potentials of baicalin and its aglycone, baicalein against inflammatory disorders. Eur J Med Chem 2017, 131, 68–80. [Google Scholar] [CrossRef]
- Song, J.W.; Long, J.Y.; Xie, L.; Zhang, L.L.; Xie, Q.X.; Chen, H.J.; Deng, M.; Li, X.F. Applications, phytochemistry, pharmacological effects, pharmacokinetics, toxicity of Scutellaria baicalensis Georgi. and its probably potential therapeutic effects on COVID-19: a review. Chin Med 2020, 15, 1–26. [Google Scholar] [CrossRef]
- Boozari, M.; Hosseinzadeh, H. Natural products for COVID-19 prevention and treatment regarding to previous coronavirus infections and novel studies. Phytother Res 2021, 35, 864–876. [Google Scholar] [CrossRef] [PubMed]
- Jia, K.; Li, Y.; Liu, T.; Gu, X.; Li, X. New insights for infection mechanism and potential targets of COVID-19: Three Chinese patent medicines and three Chinese medicine formulas as promising therapeutic approaches. Chin Herb Med. 2023, 15, 157–168. [Google Scholar] [CrossRef]
- Fuzimoto, A.D.; Isidoro, C. The antiviral and coronavirus-host protein pathways inhibiting properties of herbs and natural compounds-Additional weapons in the fight against the COVID-19 pandemic? J Tradit Complement Med 2020, 10, 405–419. [Google Scholar] [CrossRef]
- Carabelli, A.M.; Peacock, T.P.; Thorne, L.G.; Harvey, W.T.; Hughes, J.; 6, C.-G.U.C.d.S.T.I.; Peacock, S.J.; Barclay, W.S.; de Silva, T.I.; Towers, G.J. SARS-CoV-2 variant biology: immune escape, transmission and fitness. Nat Rev Microbiol 2023, 21, 162–177. [Google Scholar] [CrossRef]
- Fan, Y.; Li, X.; Zhang, L.; Wan, S.; Zhang, L.; Zhou, F. SARS-CoV-2 Omicron variant: recent progress and future perspectives. Signal Transduct Target Ther 2022, 7, 141. [Google Scholar] [CrossRef]
- Chun, J.M.; Kim, H.S.; Lee, A.Y.; Kim, S.H.; Kim, H.K. Anti-Inflammatory and Antiosteoarthritis Effects of Saposhnikovia divaricata ethanol Extract: In Vitro and In Vivo Studies. Evid Based Complement Alternat Med 2016, 2016, 2016, 1984238. [Google Scholar]
- Laldinsangi, C. The therapeutic potential of Houttuynia cordata: A current review. Heliyon 2022, 8, e10386. [Google Scholar] [CrossRef]
- Zhu, Y.; Han, Y.; Wang, W.; Liang, G.; Qi, J. Mulberry leaves attenuate D-galactose-induced aging in vivo and in vitro. J Ethnopharmacol 2023, 311, 116286. [Google Scholar] [CrossRef]
- Liu, J.; Meng, J.; Li, R.; Jiang, H.; Fu, L.; Xu, T.; Zhu, G.Y.; Zhang, W.; Gao, J.; Jiang, Z.H.; et al. Integrated network pharmacology analysis, molecular docking, LC-MS analysis and bioassays revealed the potential active ingredients and underlying mechanism of Scutellariae radix for COVID-19. Front Plant Sci 2022, 13, 988655. [Google Scholar] [CrossRef]
- Dinda, B.; Dinda, M.; Dinda, S.; De, U.C. An overview of anti-SARS-CoV-2 and anti-inflammatory potential of baicalein and its metabolite baicalin: Insights into molecular mechanisms. Eur J Med Chem 2023, 115629. [Google Scholar] [CrossRef]
- Gao, Y.; Snyder, S.A.; Smith, J.N.; Chen, Y.C. Anticancer properties of baicalein: a review. Med Chem Res 2016, 25, 1515–1523. [Google Scholar] [CrossRef]
- Yang, J.Y.; Ma, Y.X.; Liu, Y.; Peng, X.J.; Chen, X.Z. A Comprehensive Review of Natural Flavonoids with Anti-SARS-CoV-2 Activity. Molecules 2023, 28, 2735. [Google Scholar] [CrossRef]
- Lin, C.; Tsai, F.J.; Hsu, Y.M.; Ho, T.J.; Wang, G.K.; Chiu, Y.J.; Ha, H.A.; Yang, J.S. Study of Baicalin toward COVID-19 Treatment: In silico Target Analysis and in vitro Inhibitory Effects on SARS-CoV-2 Proteases. Biomed Hub 2021, 6, 122–137. [Google Scholar] [CrossRef]
- Zandi, K.; Musall, K.; Oo, A.; Cao, D.; Liang, B.; Hassandarvish, P.; Lan, S.; Slack, R.L.; Kirby, K.A.; Bassit, L.; et al. Baicalein and Baicalin Inhibit SARS-CoV-2 RNA-Dependent-RNA Polymerase. Microorganisms 2021, 9, 893. [Google Scholar] [CrossRef]
- Su, H.X.; Yao, S.; Zhao, W.F.; Li, M.J.; Liu, J.; Shang, W.J.; Xie, H.; Ke, C.Q.; Hu, H.C.; Gao, M.N.; et al. Anti-SARS-CoV-2 activities in vitro of Shuanghuanglian preparations and bioactive ingredients. Acta Pharmacol Sin 2020, 41, 1167–1177. [Google Scholar] [CrossRef] [PubMed]
- Zhu, D.; Su, H.; Ke, C.; Tang, C.; Witt, M.; Quinn, R.J.; Xu, Y.; Liu, J.; Ye, Y. Efficient discovery of potential inhibitors for SARS-CoV-2 3C-like protease from herbal extracts using a native MS-based affinity-selection method. J Pharm Biomed Anal 2022, 209, 114538. [Google Scholar] [CrossRef] [PubMed]
- Zhou, J.; Huang, J. Current findings regarding natural components with potential anti-2019-nCoV activity. Front Cell Dev Biol 2020, 8, 589. [Google Scholar] [CrossRef]
- Song, J.B.; Zhao, L.Q.; Wen, H.P.; Li, Y.P. Herbal combinations against COVID-19: A network pharmacology, molecular docking and dynamics study. J Integr Med 2023, 21, 593–604. [Google Scholar] [CrossRef] [PubMed]
- Shakhsi-Niaei, M.; Soureshjani, E.H.; Babaheydari, A.K. In silico comparison of separate or combinatorial effects of potential inhibitors of the SARS-CoV-2 binding site of ACE2. Iran J Public Health 2021, 50, 1028. [Google Scholar] [CrossRef]
- KalantarMotamedi, Y.; Eastman, R.T.; Guha, R.; Bender, A. A systematic and prospectively validated approach for identifying synergistic drug combinations against malaria. Malar J. 2018, 17, 160. [Google Scholar] [CrossRef]
- Ianevski, A.; Giri, A.K.; Gautam, P.; Kononov, A.; Potdar, S.; Saarela, J.; Wennerberg, K.; Aittokallio, T. Prediction of drug combination effects with a minimal set of experiments. Nat Mach Intell 2019, 1, 568–577. [Google Scholar] [CrossRef] [PubMed]
- Ianevski, A.; He, L.; Aittokallio, T.; Tang, J. SynergyFinder: a web application for analyzing drug combination dose–response matrix data. Bioinformatics 2017, 33, 2413–2415. [Google Scholar] [CrossRef] [PubMed]
- Yadav, B.; Wennerberg, K.; Aittokallio, T.; Tang, J. Searching for drug synergy in complex dose–response landscapes using an interaction potency model. Comput Struct Biotechnol J 2015, 13, 504–513. [Google Scholar] [CrossRef] [PubMed]
- Ianevski, A.; Giri, A.K.; Aittokallio, T. SynergyFinder 2.0: visual analytics of multi-drug combination synergies. Nucleic Acids Res 2020, 48, W488–W493. [Google Scholar] [CrossRef]
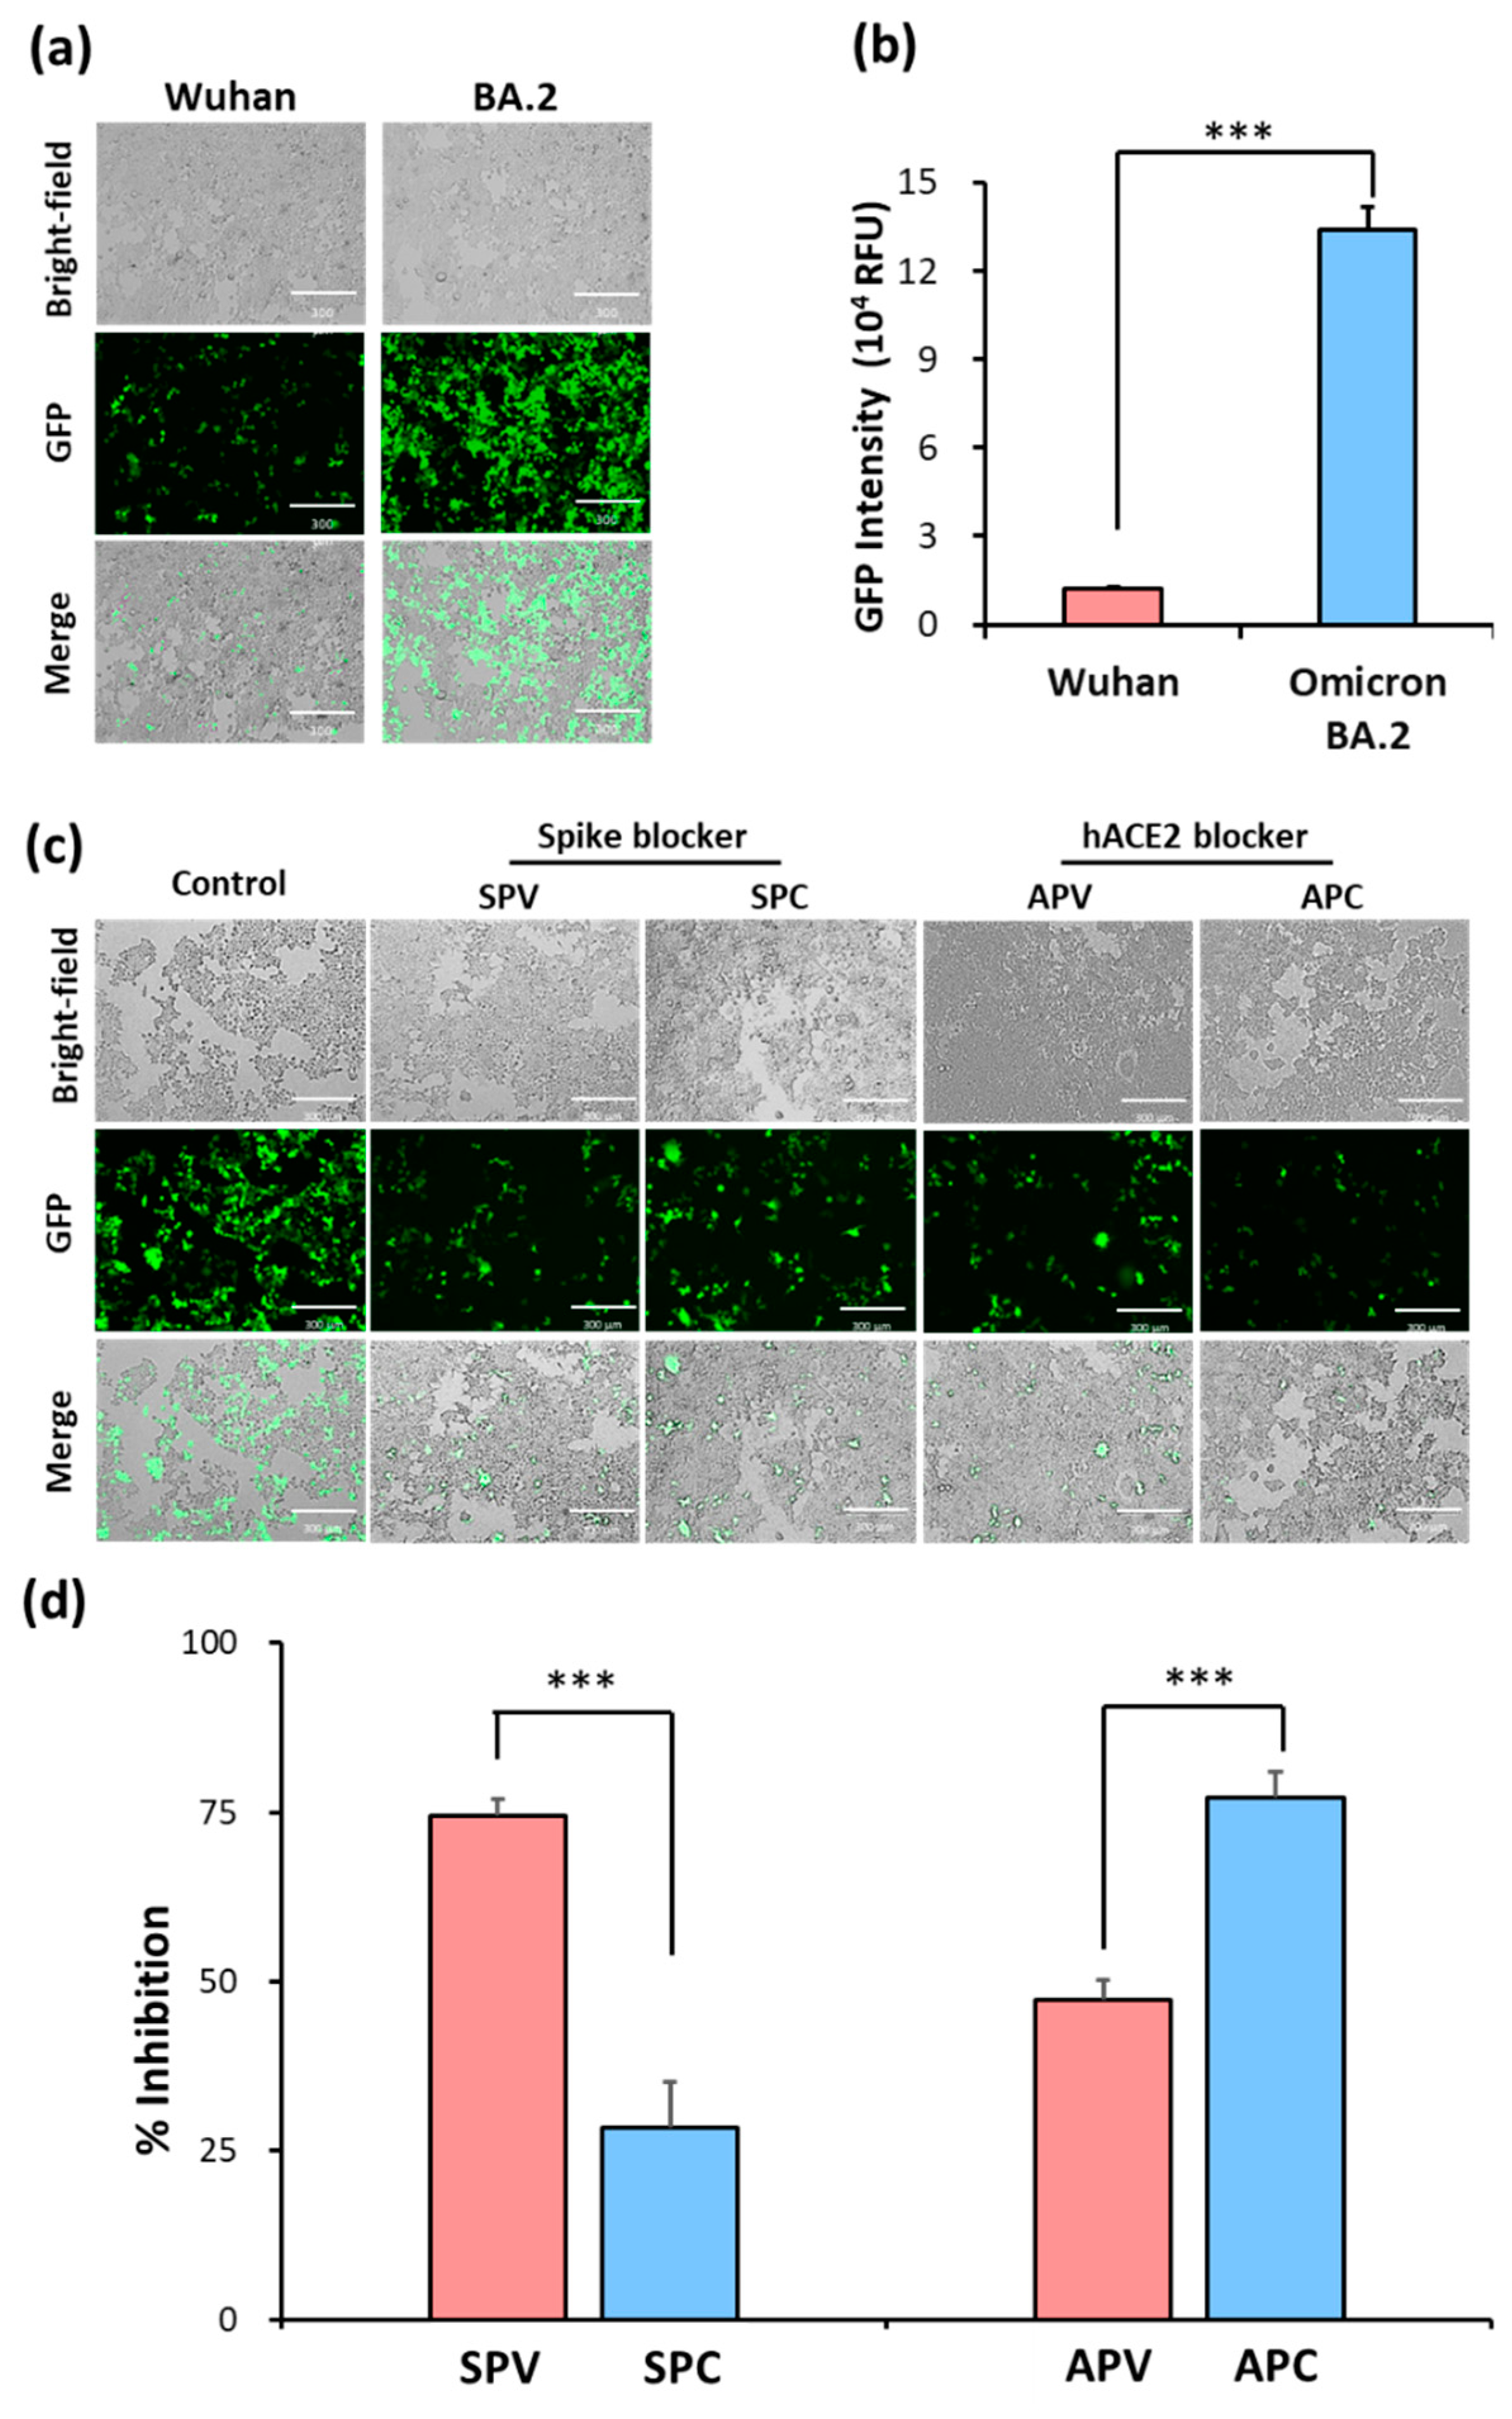

| Groups | Treatment |
|---|---|
| SPV | Spike blocker (Cysteamine) pre-treating with SARS-CoV-2 spike pseudovirus |
| SPC | Spike blocker pre-treating with HEK293T-hACE2 cells |
| APV | hACE2 blocker (Dalbavancin) pre-treating with SARS-CoV-2 spike pseudovirus |
| APC | hACE2 blocker pre-treating with HEK293T-hACE2 cells |
Disclaimer/Publisher’s Note: The statements, opinions and data contained in all publications are solely those of the individual author(s) and contributor(s) and not of MDPI and/or the editor(s). MDPI and/or the editor(s) disclaim responsibility for any injury to people or property resulting from any ideas, methods, instructions or products referred to in the content. |
© 2024 by the authors. Licensee MDPI, Basel, Switzerland. This article is an open access article distributed under the terms and conditions of the Creative Commons Attribution (CC BY) license (https://creativecommons.org/licenses/by/4.0/).


