
Submitted:
29 January 2024
Posted:
30 January 2024
You are already at the latest version
Abstract
Analyzing horse behavior is crucial for assessing training quality, particularly in accurately identifying actions like standing, walking, and running. Research has been conducted both domestically and internationally in this regard; however, challenges persist, including reliance on single sensors, poor real-time performance, and low identification accuracy. In view of these challenges, this study investigated real-time identification of horse behavior based on wearable devices. The system, centered around a microcontroller and utilizing a 4G network as a carrier, employs multi-axis IMU sensors as input sources to perceive horse posture. The study proposed a behavior classification method based on analysis of acceleration thresholds. The method consists primarily of two sequential stages: first, the resultant acceleration interval counting method, which employs a nonlinear segmentation approach for initial behavior classification; and second, the statistical analysis of variance parameters between segments, which when coupled with multi-level threshold processing, achieves a refined classification. Experimental results indicated that the interval counting method alone achieved an accuracy of 87.55%, while for the variance analysis method alone the accuracy was 90.87%. The proposed method, comprising the two stages, reached a classification accuracy of 91.57%, underpinning its usefulness in supporting future equine research.
Keywords:
horse
; behavior classification
; wearable devices
; threshold analysis
1. Introduction
The behavior of horses during training is one of the key indicators of their health and subjective states [1,2]. However, current methods still rely on riders’ self-observation and judgment, which is time-consuming, labor-intensive, and susceptible to individual subjective assessments [3]. In equine training, identifying different behavioral states such as standing, walking, and running holds significant value [4]. By observing a horse’s behaviors like standing, walking, and running, trainers can initially assess the overall health condition and adjust the training plans and methods. For instance, horses in the early stages of training benefit from more standing and walking exercises to build trust and fundamental skills, while for horses that require increased speed and strength, running becomes more crucial.
When it comes to analyzing equine behavior, many studies focus on machine learning and deep learning methods, which identify and predict horse behavior using large-scale datasets [5,6,7,8]. However, there are relatively few algorithms capable of real-time behavior recognition on hardware devices within resource-constrained environments such as STM32(The STM32 series is primarily designed for low power consumption and real-time control in embedded systems. With limited resources, it is not suitable for running deep learning or machine learning model algorithms.). Furthermore, current research on behavior recognition algorithms primarily focuses on analyzing behavioral patterns of sheep [9,10,11] and cattle [12,13,14]. Therefore, in developing a new horse behavior classification algorithm, this study referenced research methodologies from other domains. For instance, Enrico Casella et al. collected accelerometer data using a smartwatch application and employed novel outlier detection, feature extraction, and machine learning methods to analyze horse motion states through monitoring devices on the saddle and rider’s wrist [15]. Jamie Barwick utilized Quadratic Discriminant Analysis (QDA) to assess the recognition effectiveness of different accelerometer deployment methods (collar, leg, and ear tags) in identifying grazing, standing, and walking behaviors of sheep in the Australian sheep industry. Results indicated that the accelerometer deployed on the ear tag accurately predicted grazing, standing, and walking behaviors with accuracies reaching 94%, 96%, and 99% respectively [16]. Duc-Nghia Tran developed a novel cattle behavior recognition system using a combination of leg-mounted and collar-mounted accelerometers. Employing the Random Forest algorithm and extracted features (Root Mean Square, Standard Deviation, and Mean), it classified walking, feeding, lying, and standing behaviors of cows, achieving outstanding performance: 91.4% accuracy for feeding, 99.8% for lying, 88% for standing, and 99.8% for walking [17].
Horses and cattle/sheep exhibit significant differences in behavior. In training, horses typically require intervention from trainers and a more expansive space for running and practicing various equestrian skills. In contrast, cattle and sheep have relatively smaller activity areas, more suitable for leisurely grazing and wandering. Their movement is slower, unlike horses that require specialized training to enhance speed or running capabilities. The training objectives for horses are more diverse, including improving speed, endurance, skills, and performance, while training for cattle and sheep often emphasizes domestication and farm work. The distinctiveness in behavioral patterns poses new challenges for technological support in the equine industry. Despite significant advancements in animal behavior recognition, such as for sheep, cattle, and horses, effectively embedding behavior identification methods into hardware devices and achieving real-time analysis of horse behavior remains challenging [18]. Considering the vast training areas leading to incomplete network coverage in equestrian training facilities, this study aims to develop a novel lightweight algorithm using wearable devices that operate on a 4G module. This system not only enables real-time monitoring of equine states but also provides live behavioral data, offering comprehensive support for horse health and training management. The focus of this study is real-time horse behavior classification using algorithms embedded directly into hardware devices, thereby providing a more convenient and comprehensive solution for monitoring equine behavior. This novel wearable device solution holds promise for playing a significant role in horse training and health monitoring, enabling more efficient and reliable technical support for the equine industry. The overall algorithm and framework of this paper are illustrated in Figure 1.
The main contributions of this paper are:
- A wearable device, which centered around a microcontroller, that utilizes 4G network and IMU sensors to perceive and analyze the posture and behavioral states of horses.
- A real-time horse behavior recognition method which uses resultant acceleration thresholds that achieves behavior classification in horses through interval counting and statistical analysis of variance parameters between segments.
- The effectiveness of the proposed method is demonstrated through experimental verification.
The subsequent sections of this paper are structured as follows: Section 2 provides a detailed description of the design process of the wearable device, experimental procedures, acceleration data collection and processing, as well as the implementation of behavior analysis algorithm. Section 3 focuses on the validation results of the proposed algorithm on a test dataset. Finally, Section 4 and Section 5 delve into the discussion and conclusion of this research, respectively.
2. Materials and Methods
2.1. System Architecture
In this section, the entire system architecture (Figure 2) will be introduced, outlining the overall hardware design of the device and the software design process.
2.1.1. Hardware Design
The behavior data collection device encompasses multiple essential sensors (Figure 3) and connecting circuits. The STM32F103C8T6 serves as the core control unit, integrating various sensors to achieve motion detection, posture perception, and data transmission functionalities. The MPU6050 sensor is connected to the STM32 via the I2C interface and is responsible for accelerometer data collection. The display module is connected to the main control chip via the SPI interface for real-time data display. The power management module ensures stable device power supply, including the lithium battery charging management chip TP4054, linear regulator XC6206P302MR, and over-current protection chip SY6280. The 4G transmission module connects to the STM32 via the UART serial port interface, enabling data transmission to remote servers. The device’s schematic and PCB layout present detailed hardware connections and circuit layouts, while a 3D housing model was designed using SolidWorks. The overall hardware design (Figure 4) ensures the reliability and stability of the device.
2.1.2. Software and Algorithm Design
The main software design for the horse behavior monitoring device covers crucial steps of device initialization, data acquisition, data preparation, algorithm execution and computation. They involve interrupt priority configuration, initialization of delay functions, serial port settings, ADC initialization, sensor data retrieval, timer operations, behavior recognition, and data transmission. These steps achieve real-time monitoring of equine behavior and data transmission through well-designed and scheduled program execution, effectively ensuring the stability and reliability of the device functions. Figure 5 illustrates in detail the operational details and execution steps of the main program design, providing a clear visual representation of the entire device workflow.
2.2. Data Acquisition
The experiment took place at the Urumqi Wild Horse Group ranch in Xinjiang, China. It was conducted during the morning training sessions from 10:30 AM to 12:30 PM. Adult Akhal-Teke horses (Figure 6) were selected to ensure the comparability and stability of the research findings. These horses underwent rigorous screening to exclude individuals with health issues or behavioral abnormalities. Observers used timers to record the duration of each horse’s standing, walking, and running behaviors (Table 1), ensuring accurate timekeeping. In this study, six horses were observed, and acceleration data on each axis, as well as resultant acceleration data (Table 2), were collected using the proposed wearable devices. The range of three-axis acceleration values was ±4g (m/s²), and the range of three-axis angular velocity values was ±2000dps (°/s). The sensors had a sampling frequency of 2 Hz.
The purpose of this experiment was to validate the accuracy of the horse behavior recognition device during horse training by classifying their behavior. Concurrently, the device collects the three-axis acceleration data, computes the resultant acceleration data, analyzes the horse behavior data, and output the predicted classification, then transmit all of this information to a remote server. The specific experimental procedure is illustrated in Figure 7.
2.3. Data Processing
This study collected acceleration data signals in three directions (X, Y, Z) for horse behaviors including standing, walking, and running. The acceleration values for each axis are represented as ax, ay, and az. Ideally, when a horse is at rest, the data on the X and Y axes should be zero, while the Z-axis acceleration should be close to the gravitational acceleration. However, actual experimental data exhibited certain deviations from theoretical values due to variations in sensor placement. Additionally, there were some noise signals such as minor horse vibrations, neck movements, and noise originating from the detection circuitry. To minimize the impact of this noise on horse motion behavior data, a combined acceleration (ACC) was introduced to reflect the overall changes in horse behavior. The formula for the combined acceleration is denoted .
From Figure 8, it is observed that the introduction of combined acceleration provides a more stable metric for analyzing the standing, walking, and running behaviors of horses. This enhances the reliability of acquired data, enabling a better analysis of equine motion characteristics and behavioral patterns.
2.4. Algorithm Design
In the context of classifying horse behavior, embedded hardware devices exhibit limitations due to restricted resources like memory and processing capabilities, thereby preventing on-line application of extensive data or complex computational models for behavior classification. To overcome these challenges, this research distills fundamental principles from machine learning algorithms, then optimizing and simplifying them to suit the limitations of hardware resources.
The study of equine locomotion behavior provides a theoretical foundation for the algorithms. This research thoroughly investigated the combined acceleration changes during the standing, walking, and running behaviors of horses (Figure 9). Existing studies indicate a close relationship between horse movement behaviors, their biomechanics, and dynamic balance capabilities [19,20]. These three states exhibit distinct kinematic characteristics: minute muscle adjustments to maintain balance in the standing state, coordination of speed and limb movement during walking, and involving intense acceleration changes and dynamic muscle activity in the running state.
In this research, two statistical methods, analysis of variance (ANOVA) [21] and interval counting [22], were employed. ANOVA was utilized to assess the diversity between different sample sets, understanding variations in means, thereby assessing the similarity or dissimilarity among datasets. On the other hand, the interval counting method revealed the characteristics, trends, and outliers within the datasets by dividing the data into distinct intervals and calculating the frequency in each interval. This method aids in visualizing data distribution, facilitating a more accessible analysis and interpretation of data characteristics.
Therefore, this study proposed a threshold-based analysis method [23,24,25] for horse behavior classification. The method comprises two sequential stages: first, the cumulative acceleration interval counting method, and second, the combined acceleration variance analysis method. The objective is to deploy these methods into hardware-limited devices and directly generate outputs of classifying horse behaviors. The definition of horse behaviors [19] is outlined in Table 3:
2.4.1. Stage 1: Cumulative Acceleration Interval Counting Method
This study identified prominent features and trends from the analysis of a vast amount of cumulative acceleration data related to equine behaviors (Figure 10). These data clearly define the range of cumulative acceleration associated with horse behaviors (Table 4), effectively achieving classification and differentiating standing, walking, and running behaviors. These specific cumulative acceleration ranges constitute the boundary values for the horse behavior classification algorithm.
Specific analysis methods:
This function is a counting function, where represents a collection of cumulative acceleration values, where represents the nth cumulative acceleration. For each element in the array , if it satisfies , then the value of is 1; otherwise, its value is 0. By assessing all these cumulative acceleration values, the total count of elements within the range is obtained.
N represents the size of the data collection window, which is determined by the specific experimental setup. The symbol N in the subsequent text carries the same meaning, and represents motion behaviors. This function individually computes the number of cumulative acceleration values within specific intervals for standing, walking, and running behaviors. If this count exceeds (see Table 5) of the total array count, it is considered indicative of the corresponding behavior occurring.
2.4.2. Stage 2: Combined Acceleration Variance Analysis Method
Different from complex machine learning models, the Combined Acceleration Variance Analysis Method infers the behavior state of horses through simple mathematical operations. In this study, by calculating the variance of the combined acceleration data within different time intervals and analyzing the variance changes of horses in different behavioral states, the specific variance patterns under different motion states were obtained, as shown in Figure 11.
Through the analysis of test data from horses in different behavioral states, a characteristic range for the variance of combined acceleration can be obtained. These data demonstrate that when horses are in different motion states, their combined acceleration variance exhibits distinct numerical ranges and varying trends. Through multiple experiments, the boundaries for combined acceleration variance between standing and walking (Table 6), as well as between walking and running (Table 7), were determined. Based on the experimental results, this study defines the combined acceleration variance of horses in different behaviors as follows: when the horse is in a stationary state, it ranges from 0 to 1.2; during slow walking, it ranges from 1.2 to 29; and when the horse is running rapidly, it exceeds 29. These findings serve as crucial features for identifying the horse’s behavioral states.
Specific analysis methods:
-
Periodically collecting combined accelerometer data via a timer.is a set of combined acceleration values, where represents the nth combined acceleration.
-
Calculate the variance with a data collection window size of N.represents the variance, stands for the mean, calculated as .
The segmented function determines the behavior of the horse based on the variance of the combined acceleration data.
2.4.3. Threshold Analysis of Combined Acceleration
The Combined Acceleration Threshold Analysis method attempts to combine the advantages of the Stage 1 and Stage 2 methods to enhance the overall accuracy and robustness of behavior classification. Its core idea lies in leveraging the advantages of different stages, particularly focusing on their respective strengths in specific behavior recognition, aiming to enhance overall accuracy through integration.
-
The combined acceleration set with a data collection window size of N.
-
Count the data volume for standing behavior., is the indicator function.
- Calculate the variance within the interval.
The segmented function returns the final behavior. Firstly, the count is checked for the standing behavior; if the count meets the threshold, it is classified as standing. If it does not meet the threshold, then distinguishes between slow walking and running behavior based on the variance of the combined acceleration.
The pseudocode for the combined acceleration threshold analysis method is shown below:
| Algorithm 1: Combined Acceleration Threshold Analysis |
| acc_data:Array of combined accelerations samplingQuantity:Window size function main() { if (Interval_notation (acc_data) == 0) { // Interval counting method for behavior analysis return 0 //stand } mean = calculate_mean(acc_data, samplingQuantity) variance = calculate_variance(acc_data, samplingQuantity, mean) return determine_behavior(variance) } // Variance analysis method for behavior analysis function determine_behavior(variance) { if (variance <= 1.2) { return 0 // stand } else if (variance <= 29) { return 1 // walk } else return 2 // run } |
In the next section, we will attempt to validate the proposed algorithm through experiments conducted on a test dataset.
3. Results
3.1. Model Training Results
Figure 12 displays the confusion matrices for the results obtained from the three methods, including Stage 1, Stage 2, and the combined threshold analysis. Through the analysis of horse behavior classification results by the interval counting method (Figure 12a) and the variance analysis method (Figure 12b), the interval counting method exhibited a good accuracy rate in identifying the standing behavior (93.91%). Meanwhile, the variance analysis method showed excellent performance in distinguishing between walking (94.62%) and running (83.00%) behaviors but demonstrated lower accuracy in identifying the standing behavior (87.23%). The combined threshold analysis method (Figure 12c), which integrates the advantages of the two methods, demonstrated improved performance in identifying standing and walking behaviors, with accuracy rates reaching 94.00% and 93.53%, respectively. However, in recognizing the running behavior, its performance was similar to that of the variance analysis method, maintaining an accuracy level of 83.00%. Overall, this method notably enhances the identification of standing and walking behaviors.
Figure 13 illustrates the relationship between the window size (N) and the classification accuracy. In the interval counting method (Figure 13a), as the window size increases, the accuracy gradually improves, reaching its peak at a window size of 25 (87.55%), and then stabilizes thereafter. In the variance analysis method (Figure 13b), the accuracy demonstrates an increasing trend with the increase in window size, reaching its peak at a window size of 26 (90.87%). Therefore, with a window size of 26, a more precise analysis of horse behavior is achieved. The Combined Threshold Analysis method attains its highest overall behavior recognition accuracy at a window size of 26, reaching 91.57%.
3.2. Model Application
To validate the accuracy of the combined acceleration threshold analysis model, this study collected 20,000 data points for verification experiments. The objective is to assess the performance differences between these methods in recognizing horse behaviors. By employing the three algorithms for behavior prediction and comparing the predicted outcomes with the actual results, the following statistical data was obtained (Table 8). These three algorithms were employed for behavior recognition in horses, yielding different accuracy rates on specific datasets (Figure 14). The Cumulative Acceleration Interval Counting method achieved an accuracy rate of 82.49%, the Combined Acceleration Variance Analysis method reached an accuracy rate of 90.13%, while the Combined Acceleration Threshold Analysis method showed an accuracy rate of 90.91%. This indicates that the Combined Acceleration Threshold Analysis method outperforms the two methods applied alone, demonstrating a higher accuracy with the combined (or integrated) method.
The Combined Threshold Analysis Method combines the advantages of both Interval Counting Method and Variance Analysis Method for combined acceleration, significantly enhancing the accuracy of horse behavior recognition. Based on the experimental outcomes, the Combined Threshold Analysis Method offers a more comprehensive and accurate determination of horse behavior. This is attributed to its improved handling of intricate differences between behaviors and its ability to mitigate noises present in the data. The successful application and introduction of this method provide further evidence supporting the feasibility and effectiveness of amalgamating multiple algorithms for behavior recognition.
The wearable device utilizes a synthesized acceleration threshold for horse behavior classification and calculates motion time through the collection rate (Figure 15). The predicted standing time closely aligns with actual observations, but there are slight discrepancies in predicting walking and running times. Walking time tends to be overestimated, while running time is underestimated. Accurate time statistics are important for trainers to understand horse behavior patterns and optimize training plans. Furthermore, precise predictions of behavior-specific times contribute to an accurate assessment of horse behavior status, thereby improving the training effectiveness.
4. Discussion
4.1. Device and Algorithm
The hardware and the behavior classification algorithm play crucial roles in the horse behavior recognition system. This study adopts the STM32F103C8T6 microcontroller, MPU6050 six-axis accelerometer sensor, and a 4G communication module as the core components of this system. The STM32F103C8T6, with its advantages of stability, reliability, low power consumption, high performance, and diverse peripherals, provides a solid foundation for data acquisition and processing. Zhong Wu demonstrated the feasibility of using STM32 as the main controller chip in the equestrian posture detection system [26]. The MPU6050 six-axis accelerometer sensor is equipped with high-precision data acquisition capabilities, enabling it to capture subtle motion variations in horses across different behavioral states. Its built-in digital motion processor accurately identifies horse behaviors. In an experimental study on equine therapy, M. Ranciaro utilized the MPU6050 as a data acquisition tool, validating its accuracy [27]. The 4G communication module enables high-speed and stable data transmission, allowing the system to perform remote real-time monitoring. The combination of these hardware devices and algorithms is key to the successful operation of the equine behavior recognition system. The optimization of behavior classification algorithms allows the data collected from sensors to be thoroughly analyzed and utilized. The proposed Combined Acceleration Threshold Analysis Method presented in this paper serves as an effective approach for real-time data acquisition, enabling the identification of various behavioral states in horses. By employing a combined acceleration interval counting method and variance analysis, it achieved satisfactory accuracy in recognizing horse behaviors such as standing, walking, and running. The integration of hardware and algorithms has endowed the system with outstanding real-time performance and accuracy. The sensor’s data acquisition provides reliable data support for the algorithms, while the flexibility of the algorithms ensures the system’s adaptability and accuracy in recognizing different behavioral patterns. Overall, this combination has facilitated the precise identification of equine behavior, demonstrating excellent performance in practical applications.
Sandra Nauwelaerts explored the influence of acceleration on diverse horse gaits, encompassing walking, trotting, and cantering [6]. Their research offered valuable insights into the effects of acceleration on gait dynamics, contributing to a better understanding of equine motion. In contrast, our study concentrates on distinguishing horse behaviors by analyzing acceleration patterns in various states, thereby extending the fundamental discoveries made by Sandra Nauwelaerts. The results indicate that acceleration data not only enable effective gait classification but also play a crucial role in broader horse behavior monitoring. Our work validates the application of acceleration analysis and demonstrates how to translate these theoretical insights into practical applications for animal behavior monitoring. This study employs multi-axis IMU sensors to capture horse motion data and distinguishes standing, walking, and running behaviors through threshold analysis. F. M. Serra Bragança, on the other hand, concentrated on using IMU data combined with machine learning techniques to horse gait classification [7]. While both studies utilize IMU technology, our research emphasizes achieving real-time behavior recognition at the hardware level, rather than based on more computationally intensive machine learning algorithms. Our approach proves particularly effective in situations with limited computational resources, providing a concise and efficient solution for the on-line monitoring of horse behavior.
4.2. Data Collection Window
This study also investigated the impact of data collection window size on the classification behaviors in horse training. The research findings indicate that as the data collection window size increases, there is a corresponding improvement in the accuracy of behavior classification on the test dataset. This aligns with the results of Walton et al.’s study on the influence of window size on accuracy in behavior classification [28]. However, larger data collection windows led to a reduction in the volume of training and validation data, subsequently decreasing the classification accuracy. This is because larger data collection windows encompass multiple behaviors, and the selection of a data collection window is influenced by factors such as data collection frequency and the distribution of behavioral data. Mansbridge et al. conducted a study on the impact of data collection windows on sheep behavior classification [29], confirming the viewpoint that larger data collection windows are not necessarily better. Our study found that for analyzing horse behavior, a data collection window set at 26 achieved the optimal classification accuracy.
4.3. Classification Algorithm
This study presents the Combined Acceleration Threshold Analysis Classification Algorithm, a methodology that incorporates essential machine learning principles yet operates efficiently on hardware devices in a lightweight manner. By simplifying feature extraction and classification from the gathered acceleration data, the algorithm enables swift and accurate identification of a horse’s standing, walking, and running behaviors. The approach comprises two stages: the Interval Counting Method and the Variance Analysis Method. The stage one Interval Counting method is characterized by its minimal resource consumption and computational simplicity, making it well-suited for operation in resource-constrained environments. It allows for swift, real-time behavior monitoring. However, its accuracy might be constrained since it relies on counting results for behavior classification [22], and it may have limitations in adapting to complex behavioral scenarios. In contrast, the stage two Variance Analysis method provides a more comprehensive examination of motion characteristics, capable of distinguishing behaviors with diverse intensities and patterns [21]. Yet, this method demands greater computational resources and a more intricate implementation, leading to reduced efficiency when operating on resource-limited devices. Therefore, the Combined Acceleration Threshold Analysis method harmonizes the strengths of both the Interval Counting and the Variance Analysis methods. Through their complementarity, the combined method enhances the overall accuracy of behavior recognition. This method’s design compensates for individual algorithm limitations in specific aspects of behavior recognition, thereby enhancing the reliability of comprehensive behavior recognition. Table 9 illustrates the generalized models of the three behavior analysis methods.
During the training phase, the Combined Acceleration Threshold Analysis model exhibited an accuracy of 91.57%. However, when validating with new data, the accuracy dropped to 90.91%. Compared to the Interval Counting method with 82.49% and the Variance Analysis method with 90.13%, the Combined Acceleration Threshold Analysis still maintains a clear advantage of 90.91% accuracy when validating new data (Figure 16). Nevertheless, the slight reduction in accuracy during validation with new data suggests a need for improvement in its generalization ability. Further in-depth analysis and model refinement are required to enhance its performance on unknown datasets.
4.4. Conclusions and Future Work
The accuracy improvement of horse behavior recognition algorithms directly impacts the monitoring ability in horse training, potentially enhancing the welfare of horses [2]. Future research directions focus on developing more intelligent adaptive algorithms to accommodate complex behavior pattern requirements. This entails integrating other sensory data [30,31] and employing advanced machine learning methods to build more accurate models, necessitating ongoing improvements in chip technology and algorithm optimization. Such advancements not only enhance behavior recognition but also contribute to comprehensive improvements in horse training, aiming to enhance monitoring of equine health conditions.
5. Conclusions
In this study, we have developed a wearable device for real-time monitoring of horse behaviors and proposed a behavior classification method that is tailored for this device. The proposed method comprises two sequential stages: first, the Acceleration Interval Counting Method and second, the Acceleration Variance Analysis Method. By integrating the two methods into a single method called “Combined Acceleration Threshold Analysis method”, it accurately identifies equine stationary behavior by initially utilizing the interval counting method and subsequently distinguishes walking and running behaviors using variance analysis, enhancing the reliability and accuracy of the overall identification. Our study also investigated the impact of different data collection window sizes on identification accuracy, achieving the highest accuracy of 91.57% with a data collection window of 26. This behavioral identification method can be embedded into hardware devices, enabling the monitoring and identification of equine behavior, and directly outputting behavior status information, all in real-time. This experiment offers a new perspective on equine behavior monitoring, making identification more efficient and convenient, and holding a significant importance for equine training management. Additionally, it provides a critical reference for future research, offering potential for more reliable and efficient solutions in the field of equine behavior monitoring.
Author Contributions
Conceptualization, X.C., W.Z. and L.G.; methodology, X.C. and F.L; software, X.C. and F.L; validation, L.G., W.Z. and K.C.; formal analysis, L.G. and K.C.; investigation, K.C, Q.F. and J.L.; resources, L.G. and W.Z.; data curation, J.L. and Q.F.; writing—original draft preparation, X.C. and L.G.; writing—review and editing, P.K., L.G. and X.C.; visualization, X.C. and P.K.; supervision, P.K., L.G. and F.L.; project administration, W.Z. and L.G.; funding acquisition, W.Z. and K.C. All authors have read and agreed to the published version of the manuscript.
Funding
This research was funded by the Key R&D Program of Xinjiang Uygur Autonomous Region (2022B02027-2, 2023B02013).
Data Availability Statement
The data presented in this study are available upon request from the corresponding author.
Acknowledgments
We would like to express our gratitude to Xinjiang Wild Horse Culture Development Co., Ltd. for providing the experimental facilities and assist in the data acquisition.
Conflicts of Interest
The authors declare no conflict of interest.
References
- McGreevy, P.; Berger, J.; De Brauwere, N.; et al. Using the five domains model to assess the adverse impacts of husbandry, veterinary, and equitation interventions on horse welfare. Animals 2018, 8, 41. [Google Scholar] [CrossRef] [PubMed]
- Lesimple, C. Indicators of horse welfare: State-of-the-art. Animals 2020, 10, 294. [Google Scholar] [CrossRef] [PubMed]
- von Borstel, U.K.; Pasing, S.; Gauly, M. Towards a more objective assessment of equine personality using behavioural and physiological observations from performance test training. Appl. Anim. Behav. Sci. 2011, 135, 277–285. [Google Scholar] [CrossRef]
- McLean, A.N.; Christensen, J.W. The application of learning theory in horse training. Appl. Anim. Behav. Sci. 2017, 190, 18–27. [Google Scholar] [CrossRef]
- Eerdekens, A.; Deruyck, M.; Fontaine, J.; et al. Automatic equine activity detection by convolutional neural networks using accelerometer data. Comput. Electron. Agric. 2020, 168, 105139. [Google Scholar] [CrossRef]
- Nauwelaerts, S.; Zarski, L.; Aerts, P.; et al. Effects of acceleration on gait measures in three horse gaits. J. Exp. Biol. 2015, 218, 1453–1460. [Google Scholar] [CrossRef] [PubMed]
- Serra Bragança, F.M.; Broomé, S.; Rhodin, M.; et al. Improving gait classification in horses by using inertial measurement unit (IMU) generated data and machine learning. Sci. Rep. 2020, 10, 17785. [Google Scholar] [CrossRef] [PubMed]
- Thompson, C.J.; Luck, L.M.; Keshwani, J. Location on the body of a wearable accelerometer affects accuracy of data for identifying equine gaits. J. Equine Vet. Sci. 2018, 63, 1–7. [Google Scholar] [CrossRef]
- Fogarty, E.S.; Swain, D.L.; Cronin, G.M. Behaviour classification of extensively grazed sheep using machine learning. Comput. Electron. Agric. 2020, 169, 105175. [Google Scholar] [CrossRef]
- Jin, Z.; Guo, L.; Shu, H.; et al. Behavior Classification and Analysis of Grazing Sheep on Pasture with Different Sward Surface Heights Using Machine Learning. Animals 2022, 12, 1744. [Google Scholar] [CrossRef]
- Ren, K.; Karlsson, J.; Liuska, M.; et al. A sensor-fusion-system for tracking sheep location and behaviour. Int. J. Distrib. Sens. Netw. 2020, 16, 1550147720921776. [Google Scholar] [CrossRef]
- Benaissa, S.; Tuyttens, F.A.M.; Plets, D.; et al. On the use of on-cow accelerometers for the classification of behaviours in dairy barns. Res. Vet. Sci. 2019, 125, 425–433. [Google Scholar] [CrossRef] [PubMed]
- Li, Y.; Shu, H.; Bindelle, J.; et al. Classification and analysis of multiple cattle unitary behaviors and movements based on machine learning methods. Animals 2022, 12, 1060. [Google Scholar] [CrossRef]
- Wang, J.; He, Z.; Ji, J. IoT-based measurement system for classifying cow behavior from tri-axial accelerometer. Ciência Rural. 2019, 49. [Google Scholar] [CrossRef]
- Casella, E.; Khamesi, A.R.; Silvestri, S. Smartwatch application for horse gaits activity recognition[C]//2019 IEEE International Conference on Smart Computing (SMARTCOMP). IEEE, 2019; 409-416.
- Barwick, J.; Lamb, D.W.; Dobos, R.; et al. Categorising sheep activity using a tri-axial accelerometer. Comput. Electron. Agric. 2018, 145, 289–297. [Google Scholar] [CrossRef]
- Tran, D.N.; Nguyen, T.N.; Khanh, P.C.P.; et al. An iot-based design using accelerometers in animal behavior recognition systems. IEEE Sens. J. 2021, 22, 17515–17528. [Google Scholar] [CrossRef]
- Casella, E.; Khamesi, A.R.; Silvestri, S. A framework for the recognition of horse gaits through wearable devices. Pervasive Mob. Comput. 2020, 67, 101213. [Google Scholar] [CrossRef]
- Mills, D.S.; Nankervis, K.J. Equine behaviour: principles and practice; John Wiley & Sons, 2013. [Google Scholar]
- The domestic horse: the origins, development and management of its behaviour; Cambridge University Press, 2005.
- Larson, M.G. Analysis of variance. Circulation 2008, 117, 115–121. [Google Scholar] [CrossRef] [PubMed]
- Cerioli, M.R.; de, S. Oliveira F, Szwarcfiter J L. The interval count of interval graphs and orders: a short survey. J. Braz. Comput. Soc. 2012, 18, 103–112. [Google Scholar] [CrossRef]
- Jiang, C.; Qi, J.; Hu, T.; et al. Research on Six-Axis Sensor-Based Step-Counting Algorithm for Grazing Sheep. Sensors 2023, 23, 5831. [Google Scholar] [CrossRef]
- Barwick, J.; Lamb, D.W.; Dobos, R.; et al. Identifying sheep activity from tri-axial acceleration signals using a moving window classification model. Remote Sens. 2020, 12, 646. [Google Scholar] [CrossRef]
- Cervantes, I.; Gutiérrez, J.P.; García-Ballesteros, S.; et al. Combining threshold, thurstonian and classical linear models in horse genetic evaluations for endurance competitions. Animals 2020, 10, 1075. [Google Scholar] [CrossRef] [PubMed]
- Wu, Z.; Zhou, C. Equestrian sports posture information detection and information service resource aggregation system based on mobile edge computing. Mob. Inf. Syst. 2021, 2021, 1–10. [Google Scholar] [CrossRef]
- Ranciaro, M.; Santos, E.L.; Vara, M.F.F.; et al. Kinematic analysis of the evaluation of equine therapy patients with actimeter[C]//2018 Global Medical Engineering Physics Exchanges/Pan American Health Care Exchanges (GMEPE/PAHCE). IEEE, 2018: 1-5.
- Walton, E.; Casey, C.; Mitsch, J.; et al. Evaluation of sampling frequency, window size and sensor position for classification of sheep behaviour. R. Soc. Open Sci. 2018, 5, 171442. [Google Scholar] [CrossRef] [PubMed]
- Mansbridge, N.; Mitsch, J.; Bollard, N.; et al. Feature selection and comparison of machine learning algorithms in classification of grazing and rumination behaviour in sheep. Sensors 2018, 18, 3532. [Google Scholar] [CrossRef] [PubMed]
- Neethirajan, S. Transforming the adaptation physiology of farm animals through sensors. Animals 2020, 10, 1512. [Google Scholar] [CrossRef]
- Di Tocco, J.; Raiano, L.; Sabbadini, R.; et al. A wearable system with embedded conductive textiles and an imu for unobtrusive cardio-respiratory monitoring. Sensors 2021, 21, 3018. [Google Scholar] [CrossRef]
Figure 1.
The overall framework of behavior data collection, algorithm processing and analysis, and data transmission to end-users for monitoring.
Figure 1.
The overall framework of behavior data collection, algorithm processing and analysis, and data transmission to end-users for monitoring.
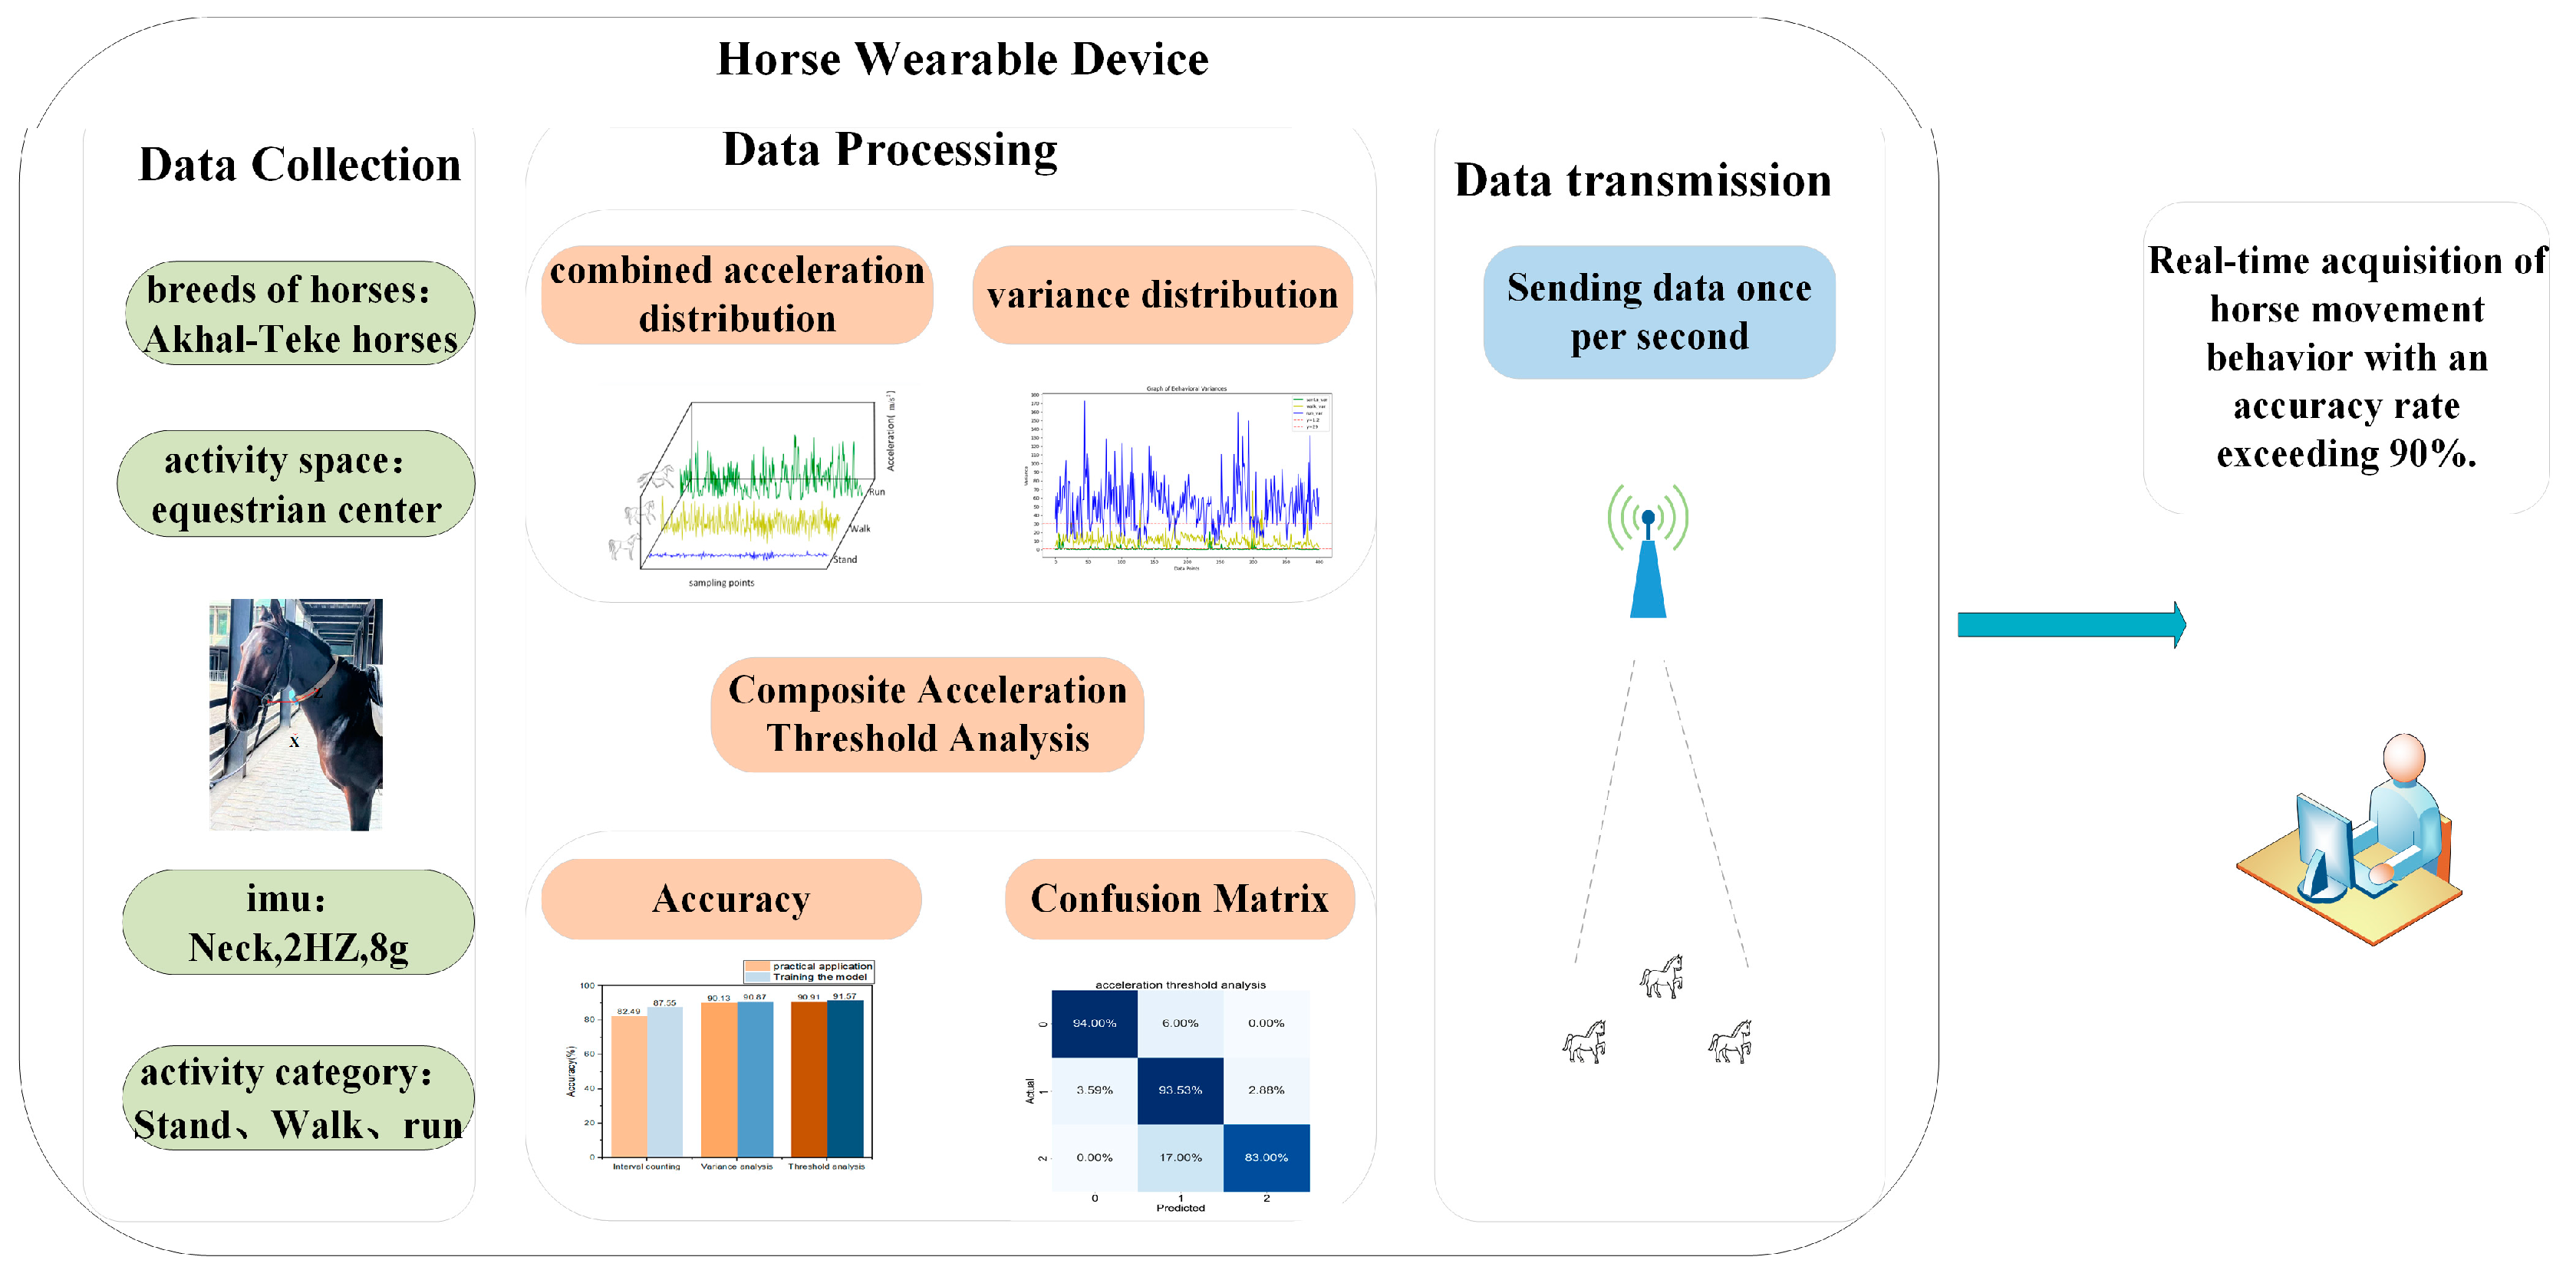
Figure 2.
The system architecture comprises wearable devices, data storage, and display, with the main program primarily running on the STM32.
Figure 2.
The system architecture comprises wearable devices, data storage, and display, with the main program primarily running on the STM32.
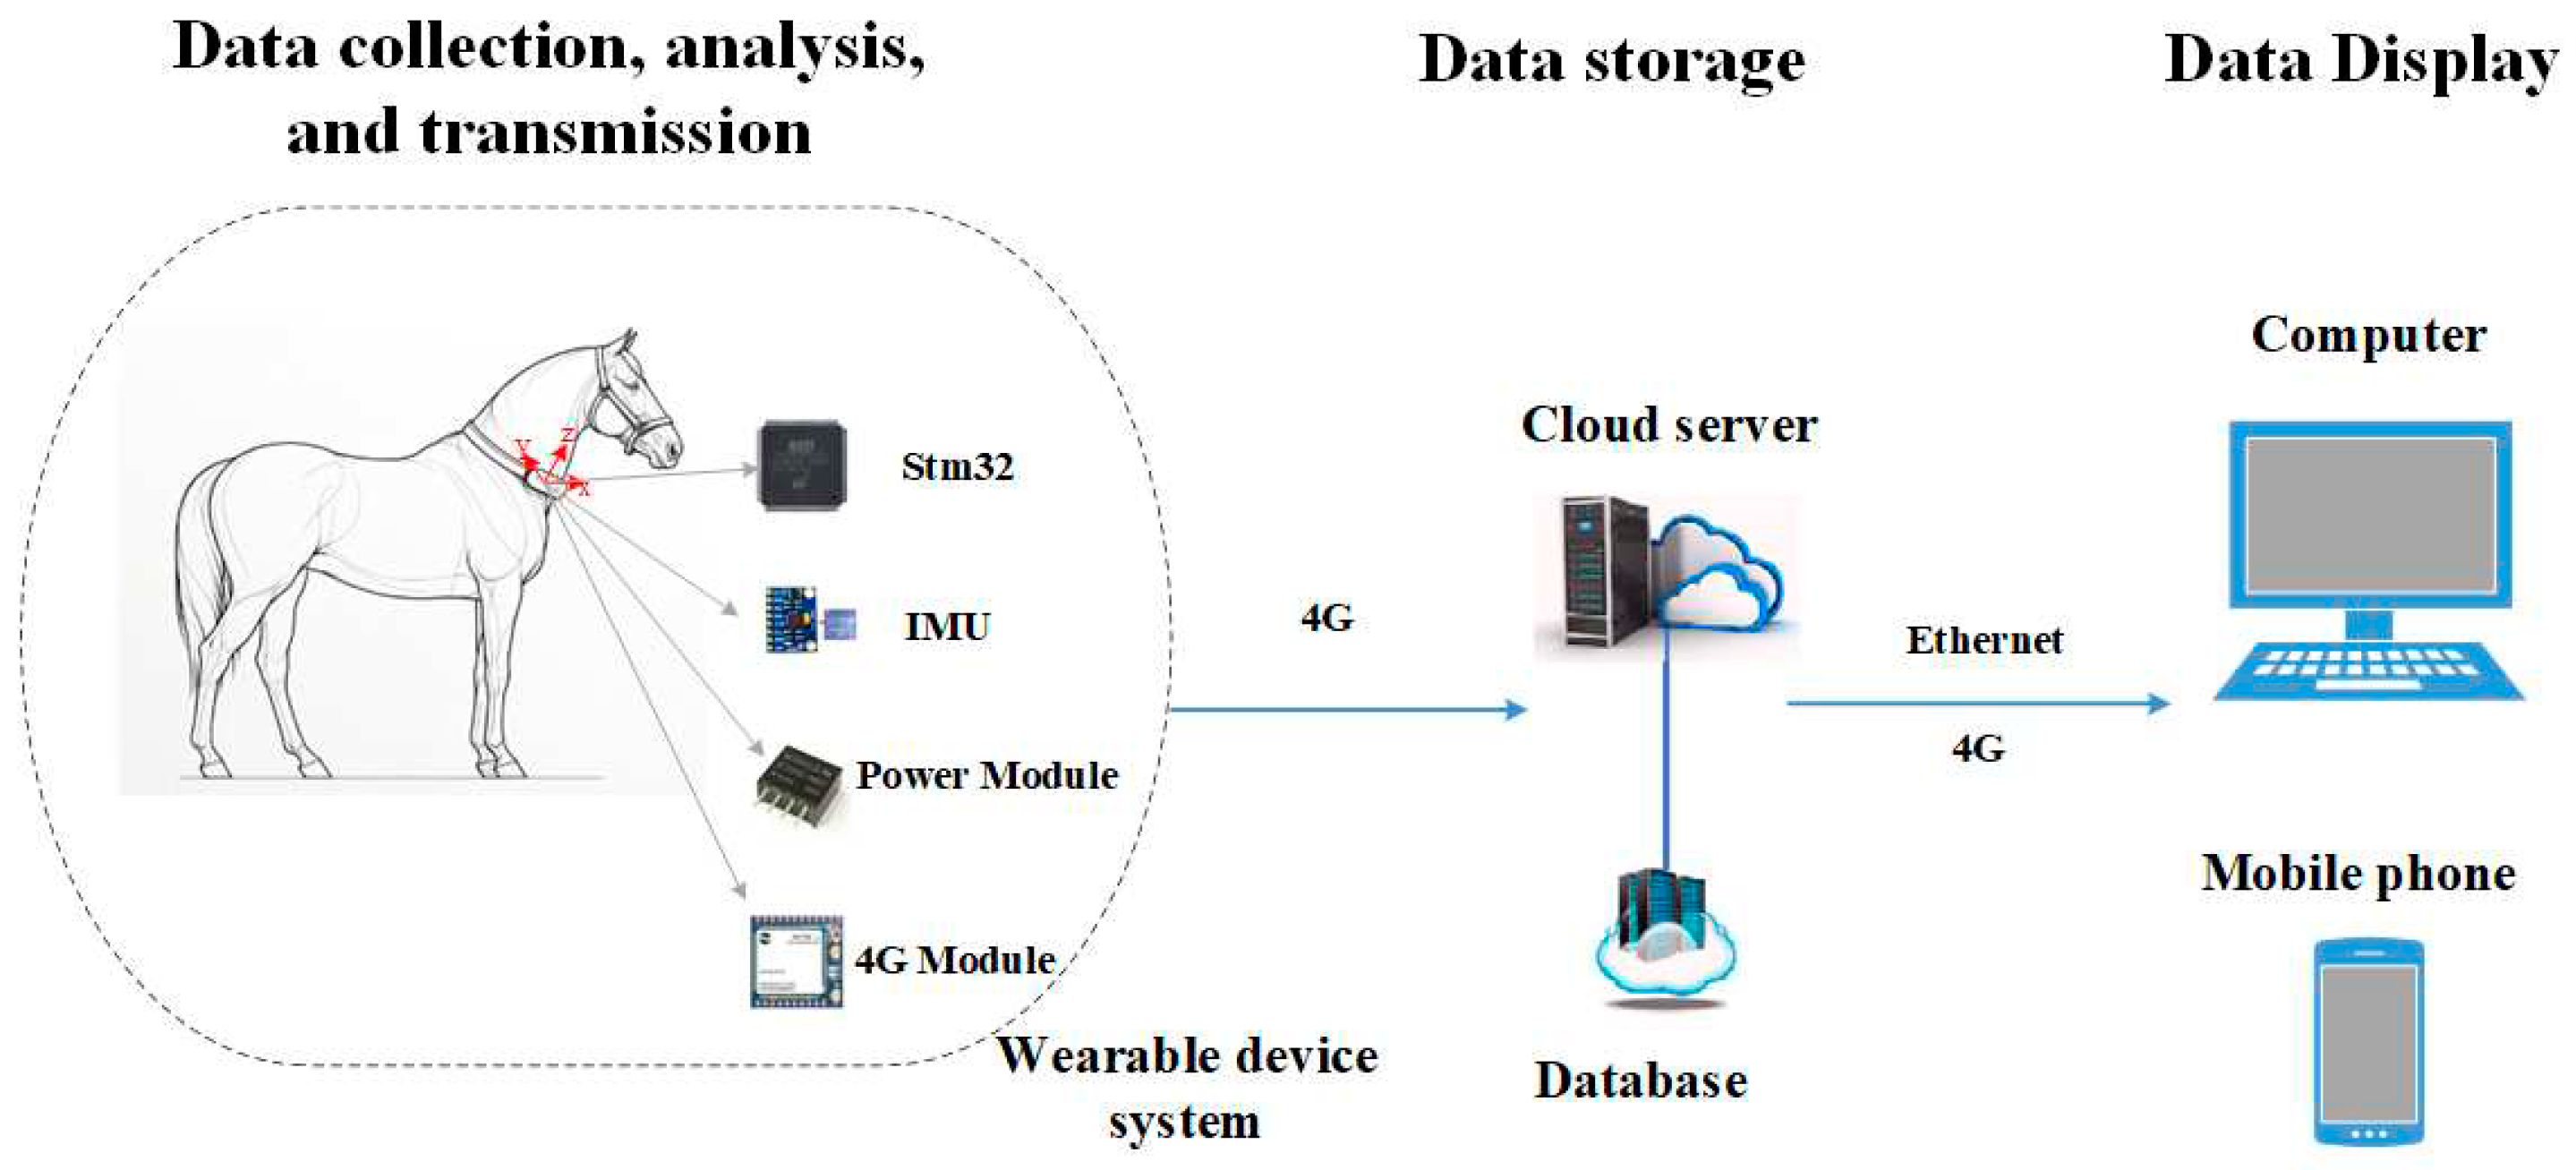
Figure 3.
Wearable device hardware includes STM32 main control chip, MPU6050, display module, 4G module, and power module.
Figure 3.
Wearable device hardware includes STM32 main control chip, MPU6050, display module, 4G module, and power module.
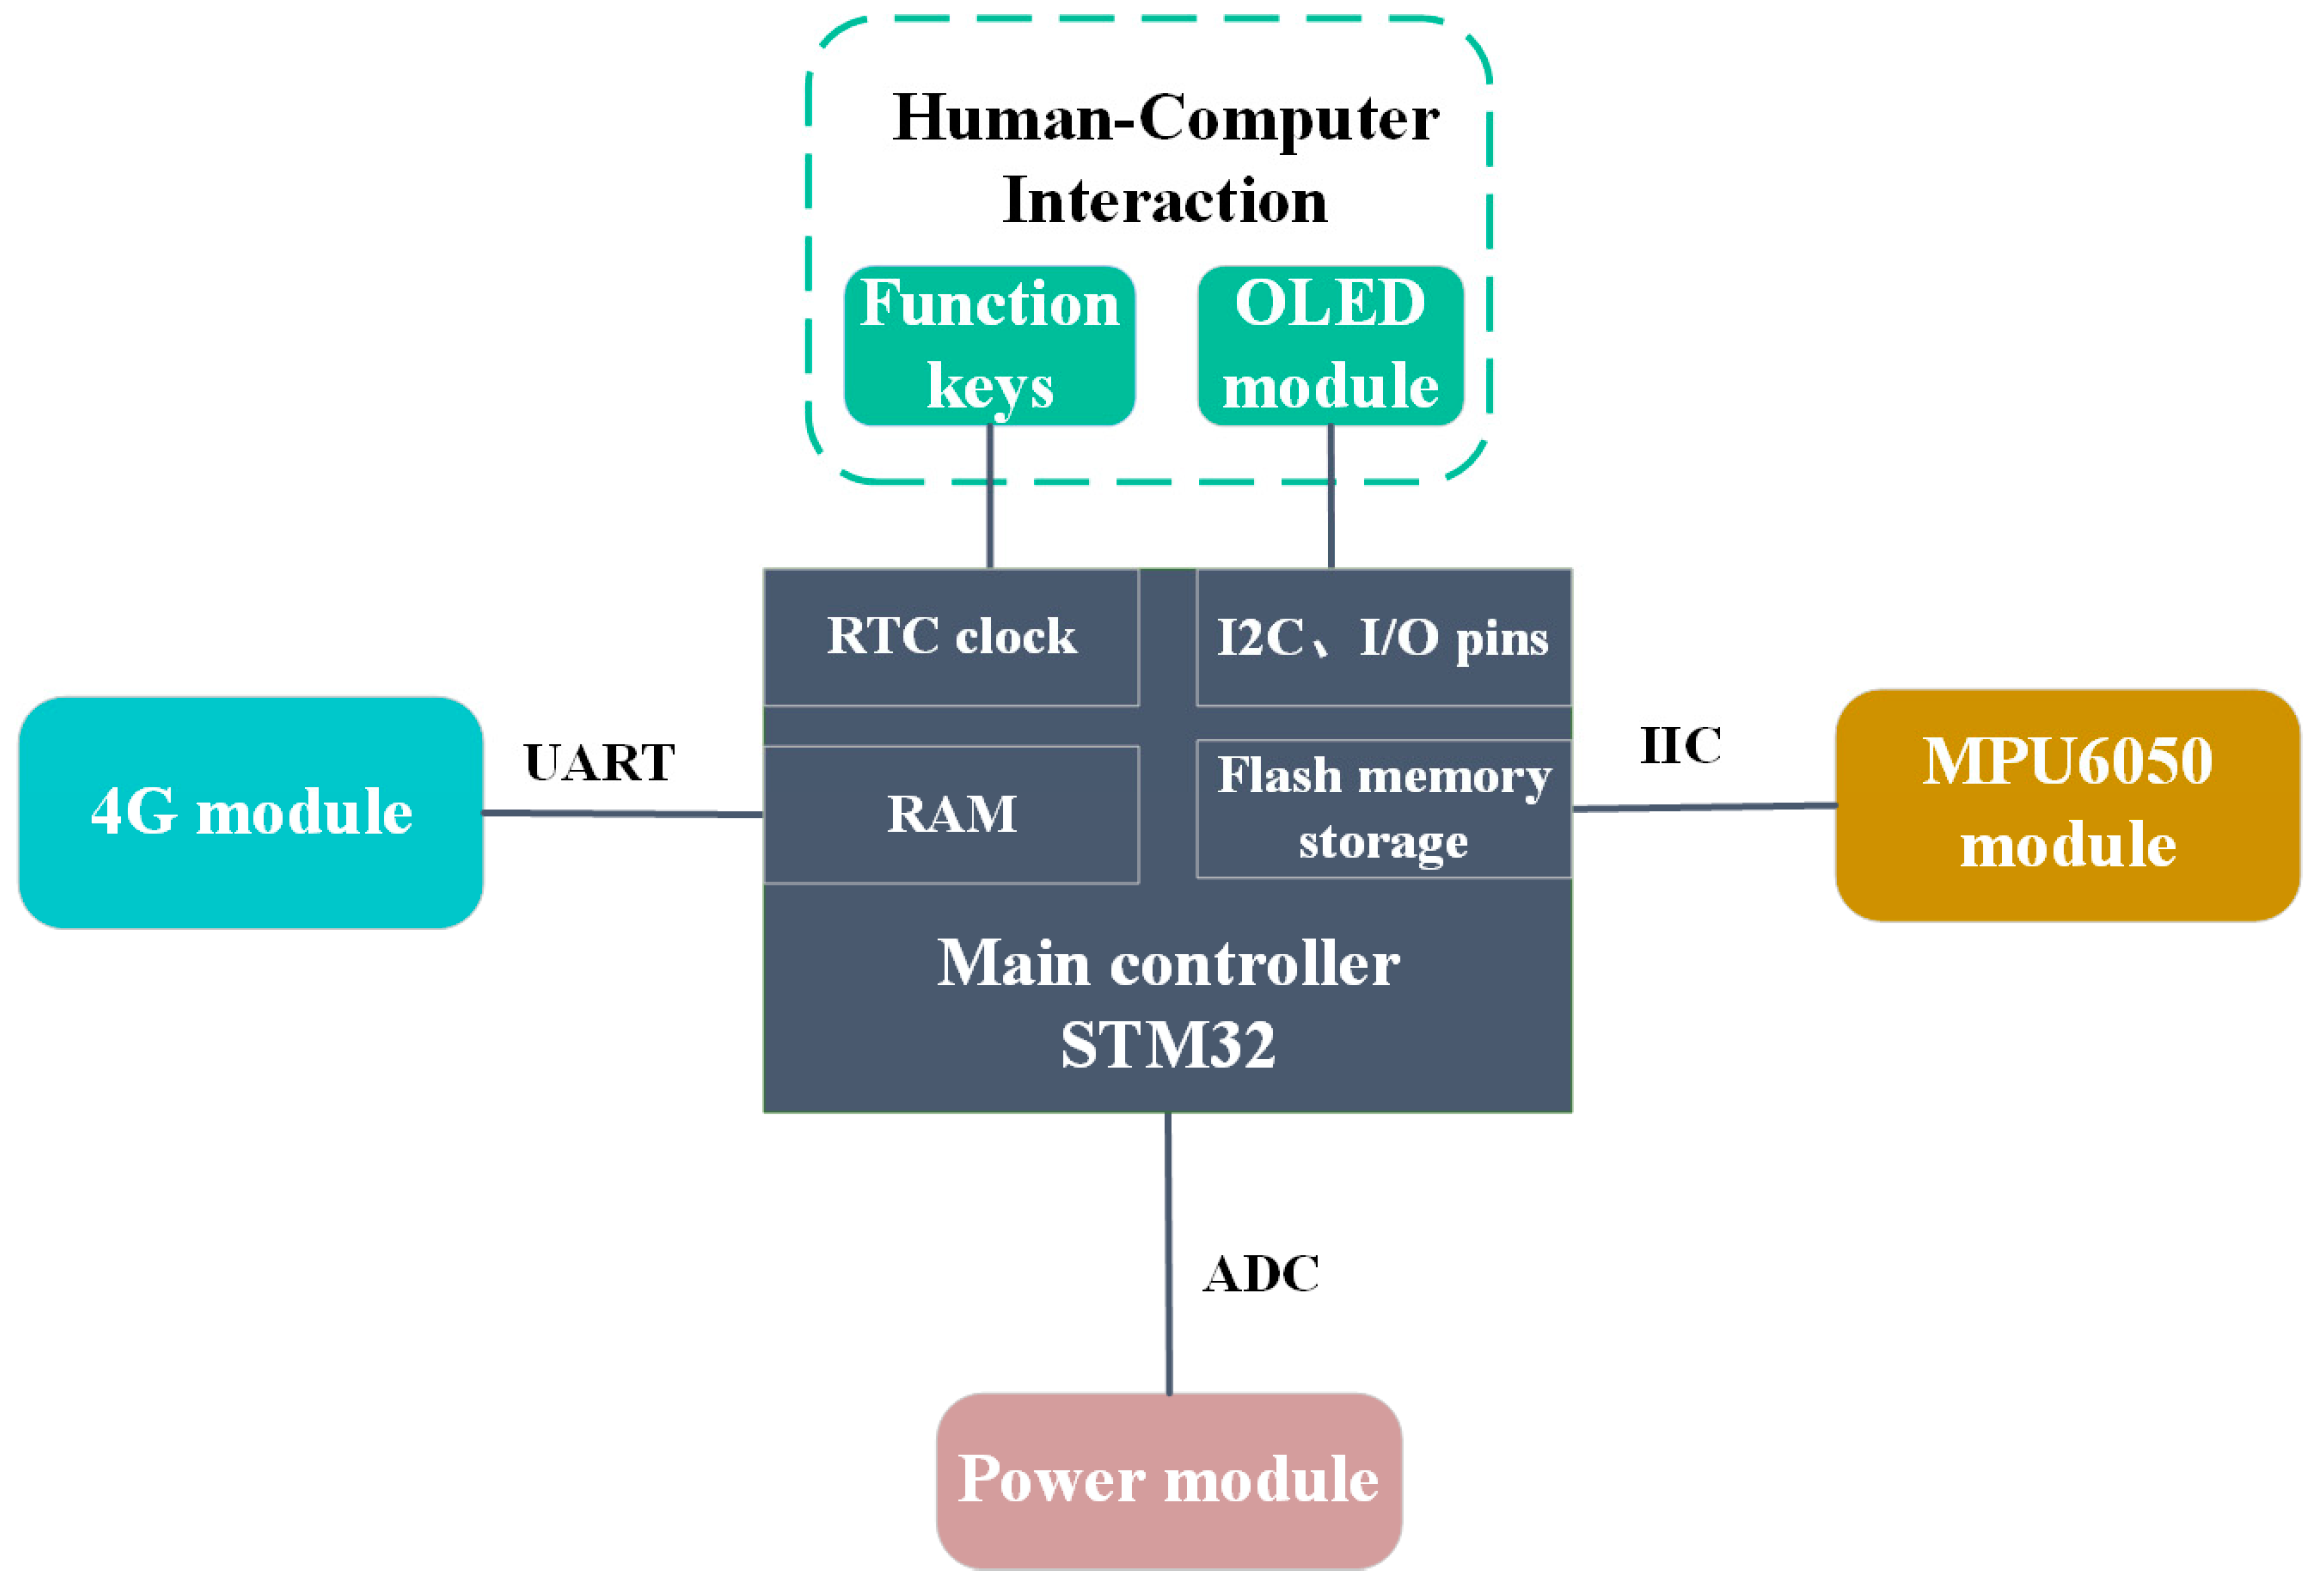
Figure 4.
Device Hardware.
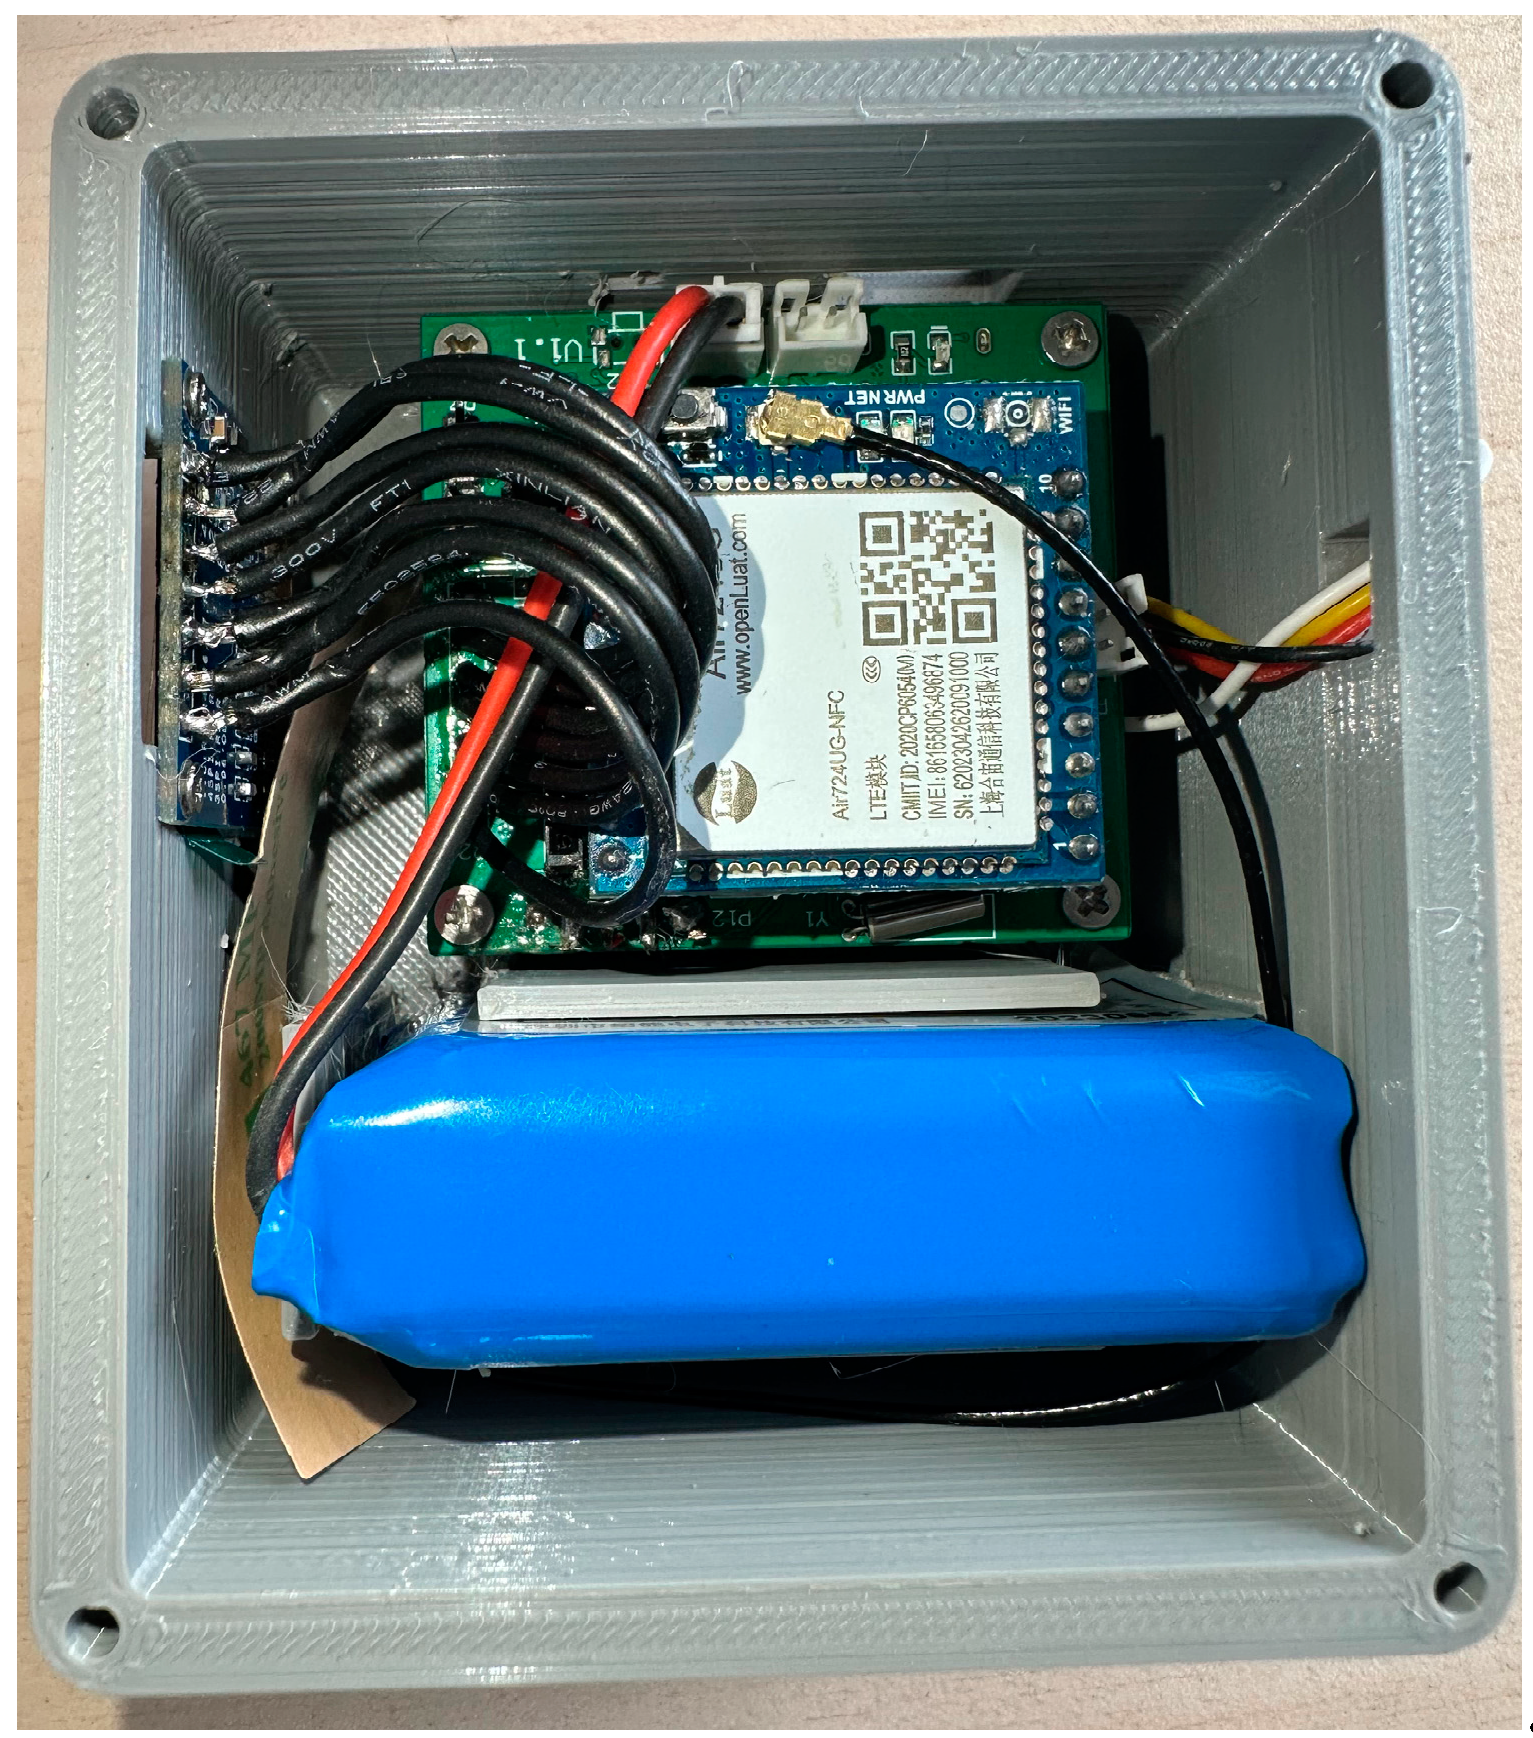
Figure 5.
The device program flowchart comprises three parts: (a) describes the main program execution flow, involving the use of Timers 2 and 3; (b) outlines the workflow specific to Timer 2; and (c) illustrates the workflow dedicated to Timer 3.
Figure 5.
The device program flowchart comprises three parts: (a) describes the main program execution flow, involving the use of Timers 2 and 3; (b) outlines the workflow specific to Timer 2; and (c) illustrates the workflow dedicated to Timer 3.
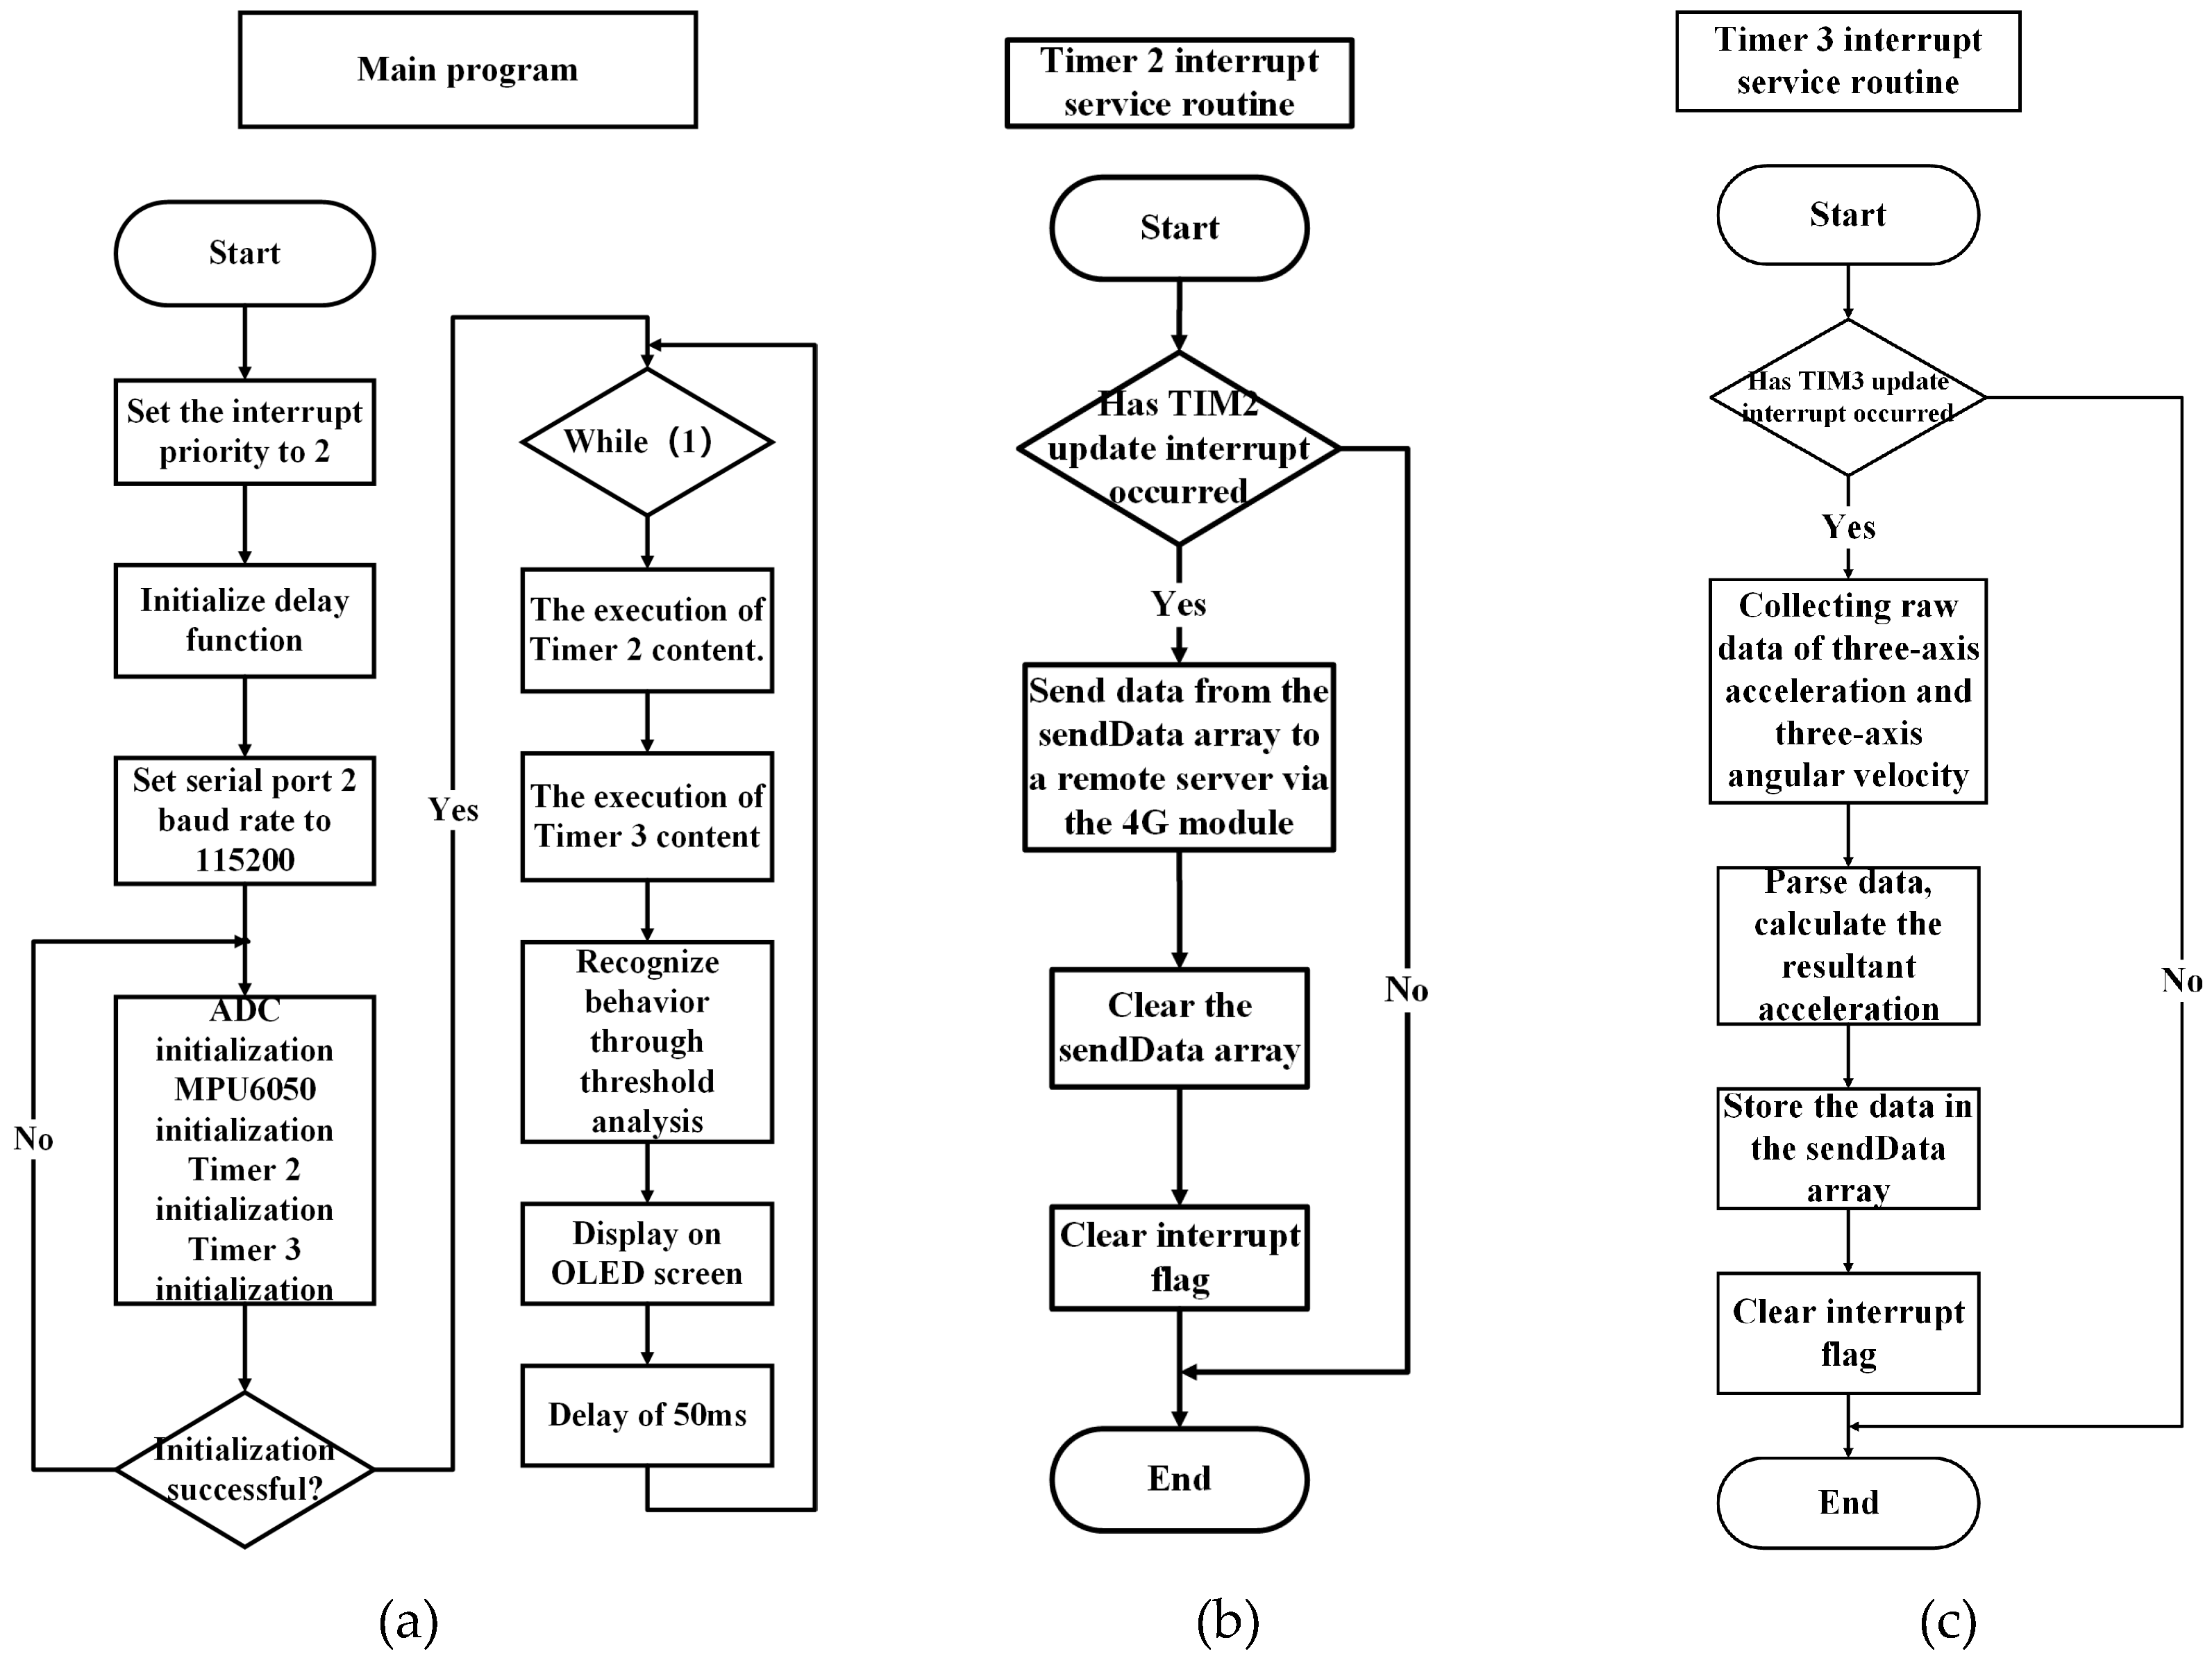
Figure 6.
On-site data acquisition using a wearable device placed on the neck of the horse.
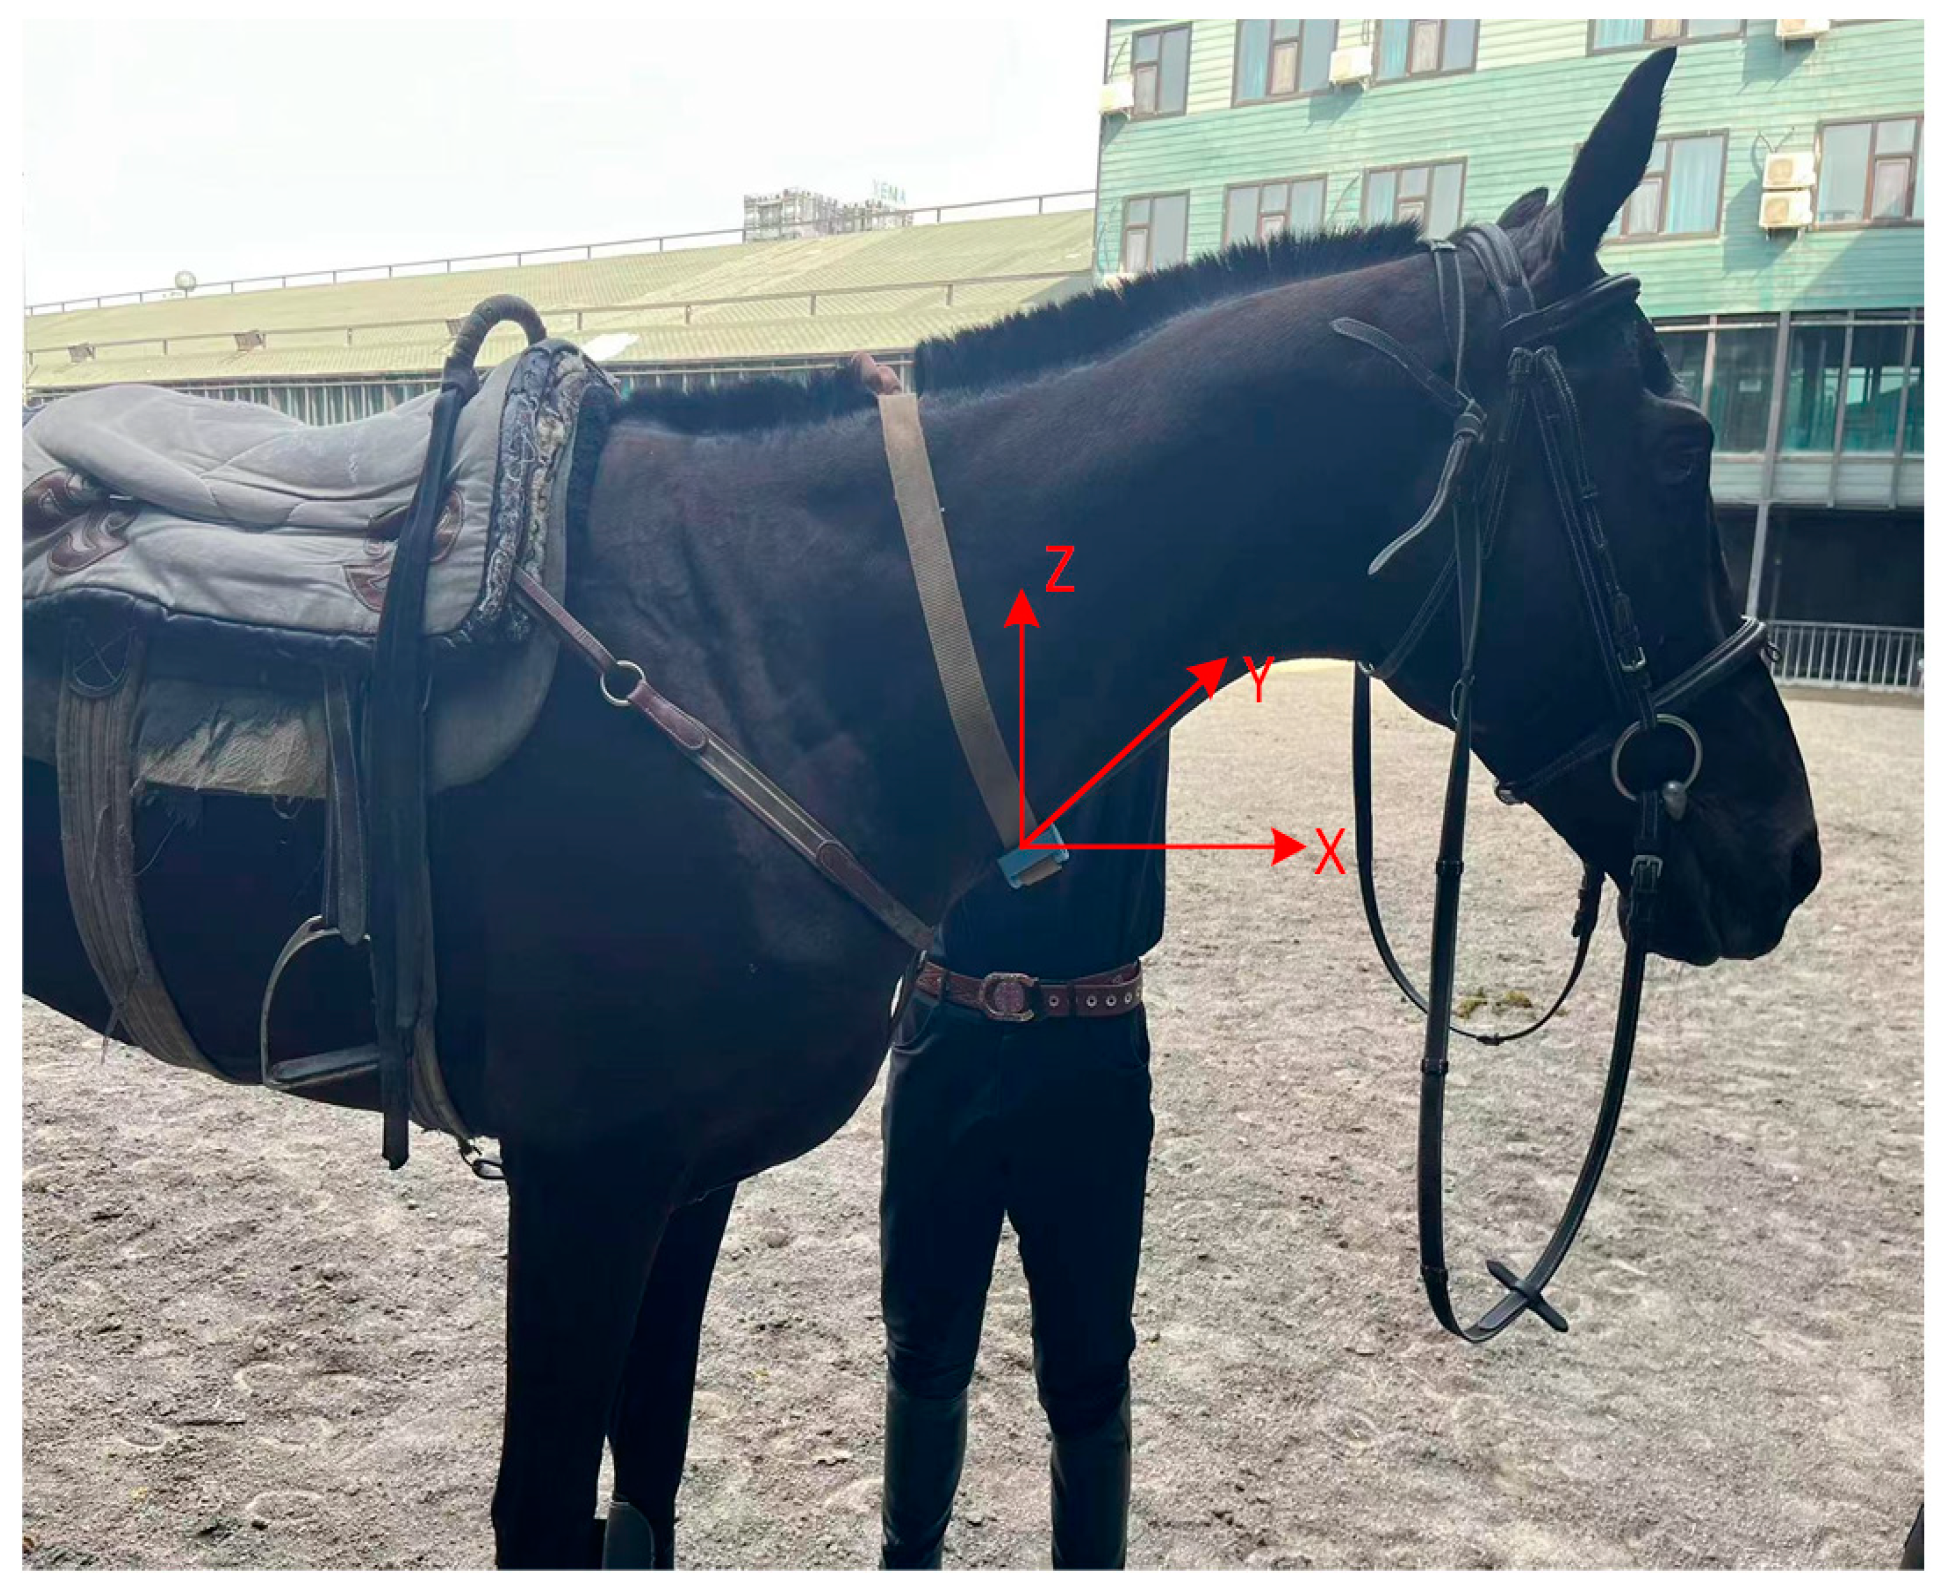
Figure 7.
Flowchart depicting the sequence of steps and procedures followed in the experiment.
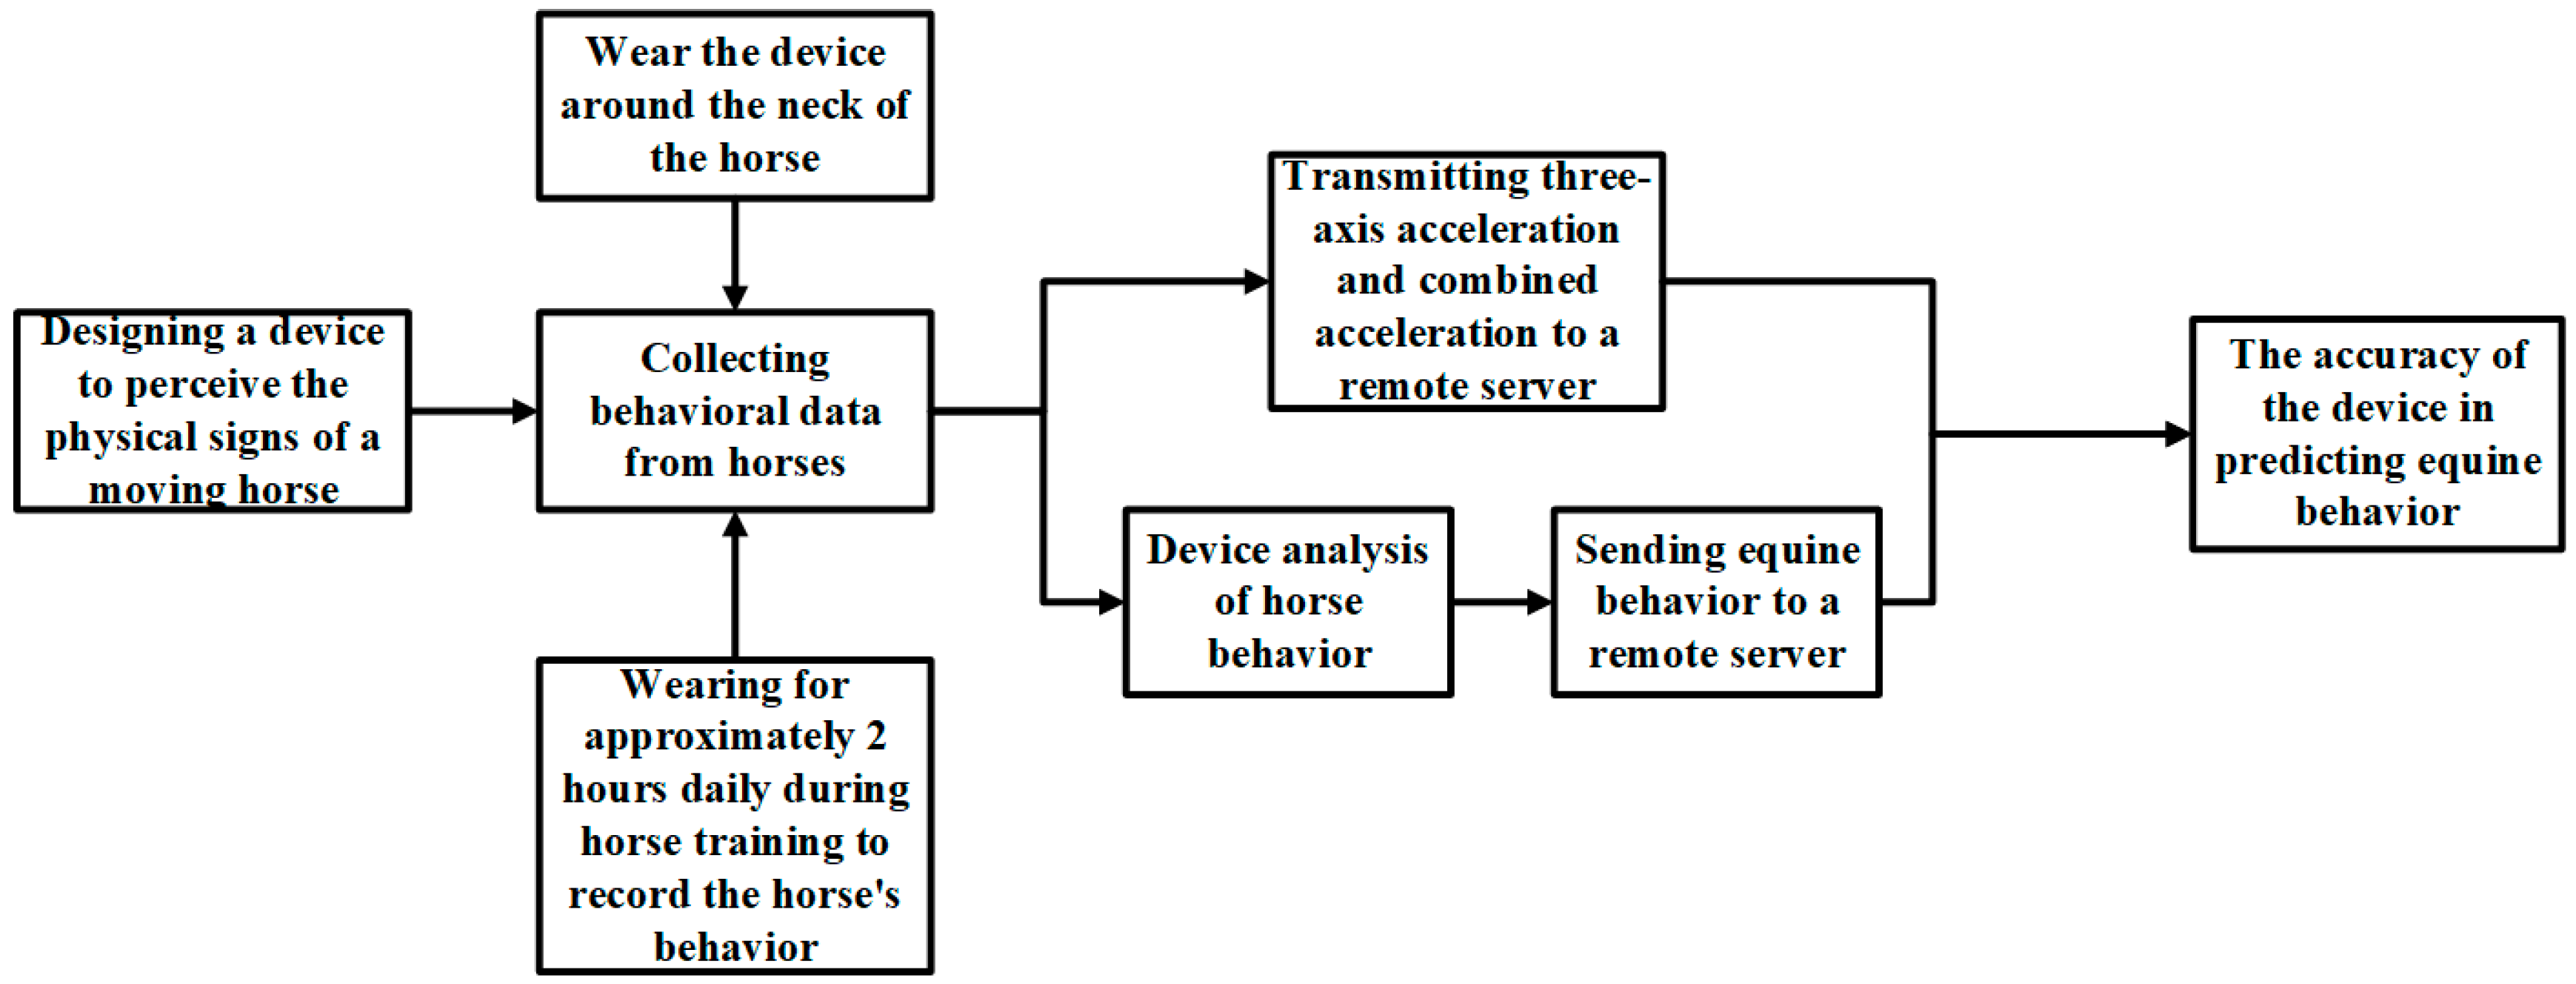
Figure 8.
Comparing three-axis acceleration and resultant acceleration in standing, walking, and running behaviors, showing reliability and stability of the resultant acceleration.
Figure 8.
Comparing three-axis acceleration and resultant acceleration in standing, walking, and running behaviors, showing reliability and stability of the resultant acceleration.
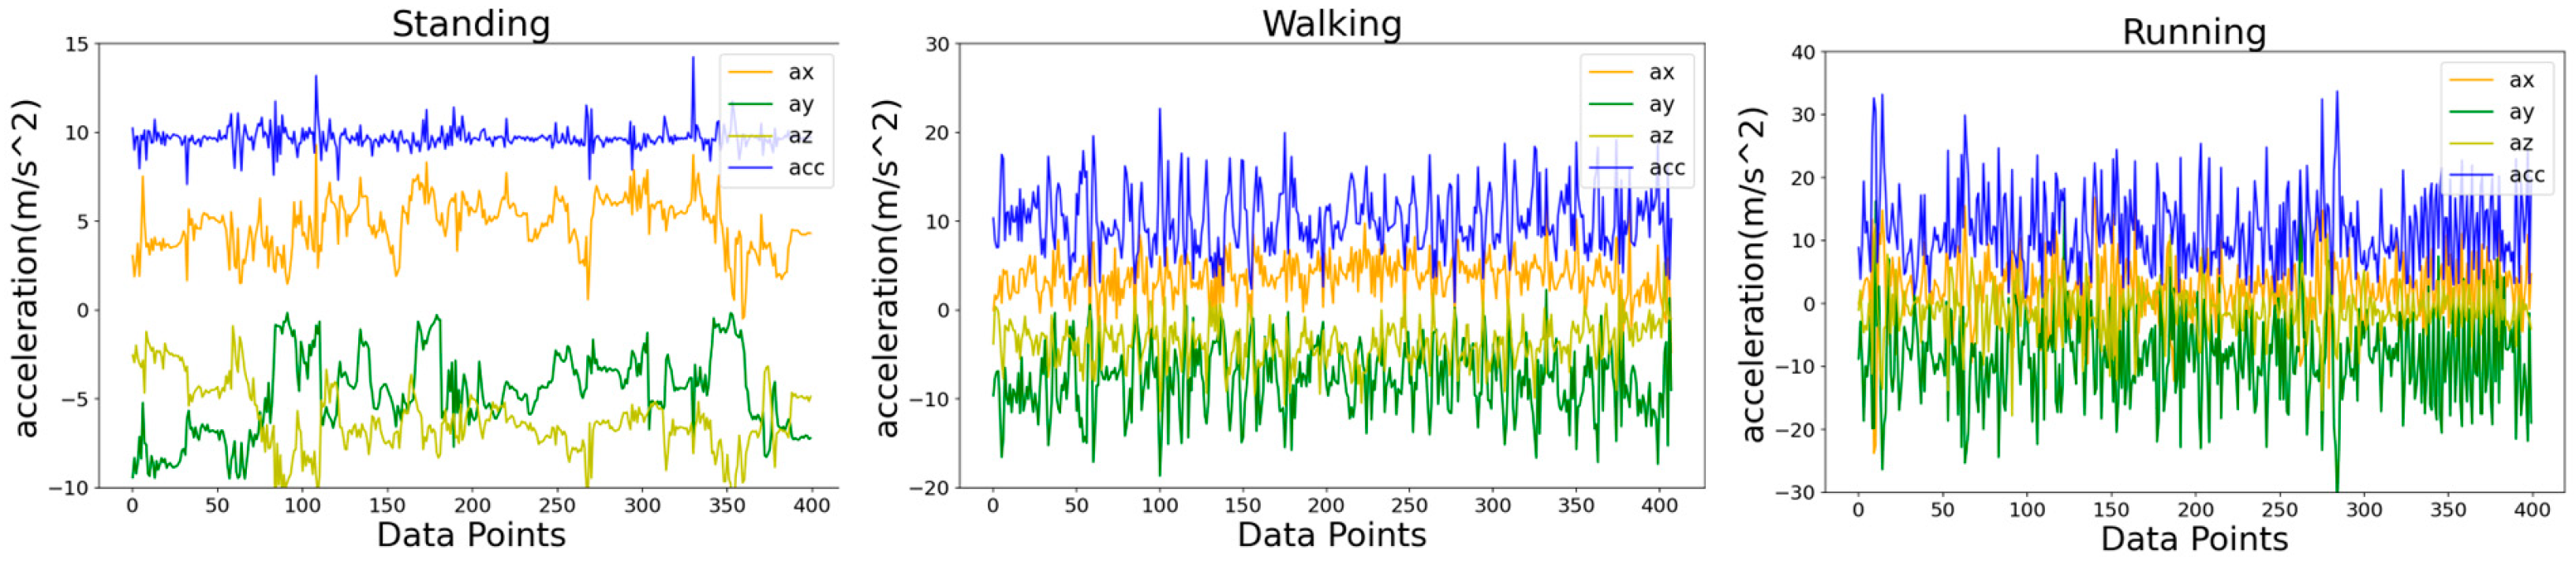
Figure 9.
Signal Characteristics of Combined Acceleration for Standing, Walking, and Running Behaviors in Three-Dimensional Space.
Figure 9.
Signal Characteristics of Combined Acceleration for Standing, Walking, and Running Behaviors in Three-Dimensional Space.
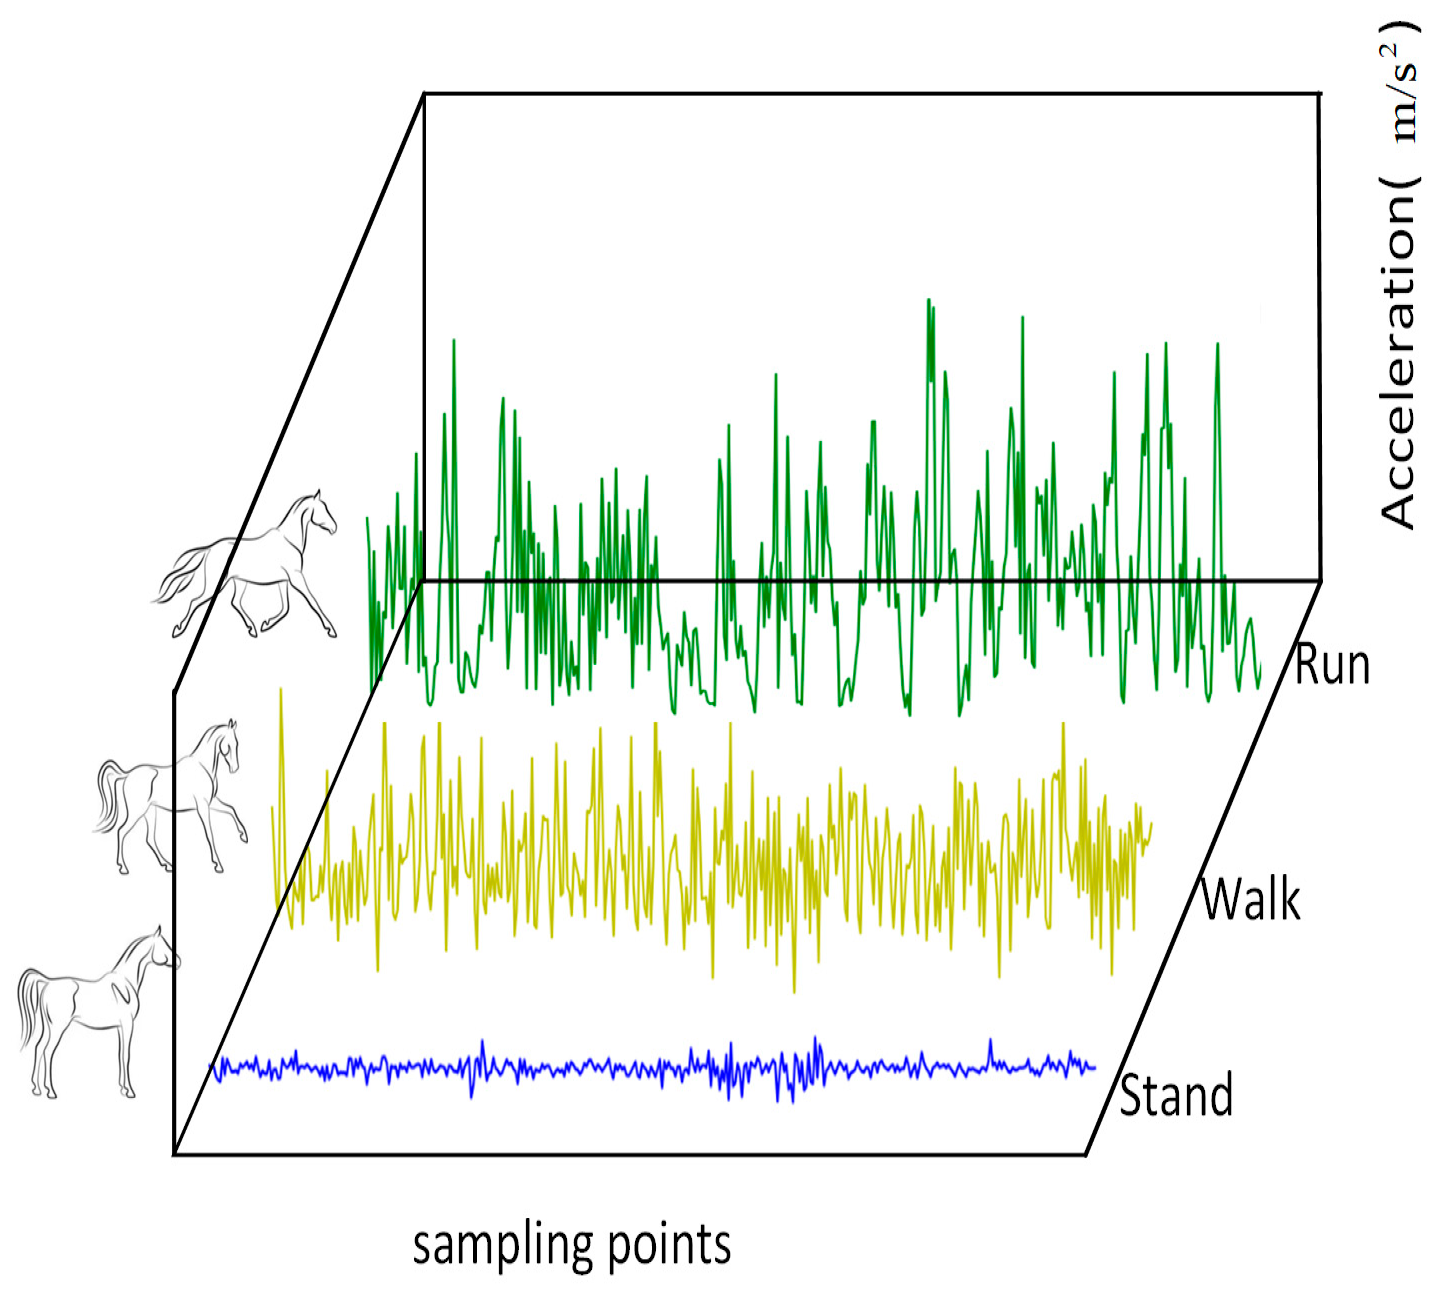
Figure 10.
Distribution Range of Cumulative Acceleration for Standing, Walking, and Running.
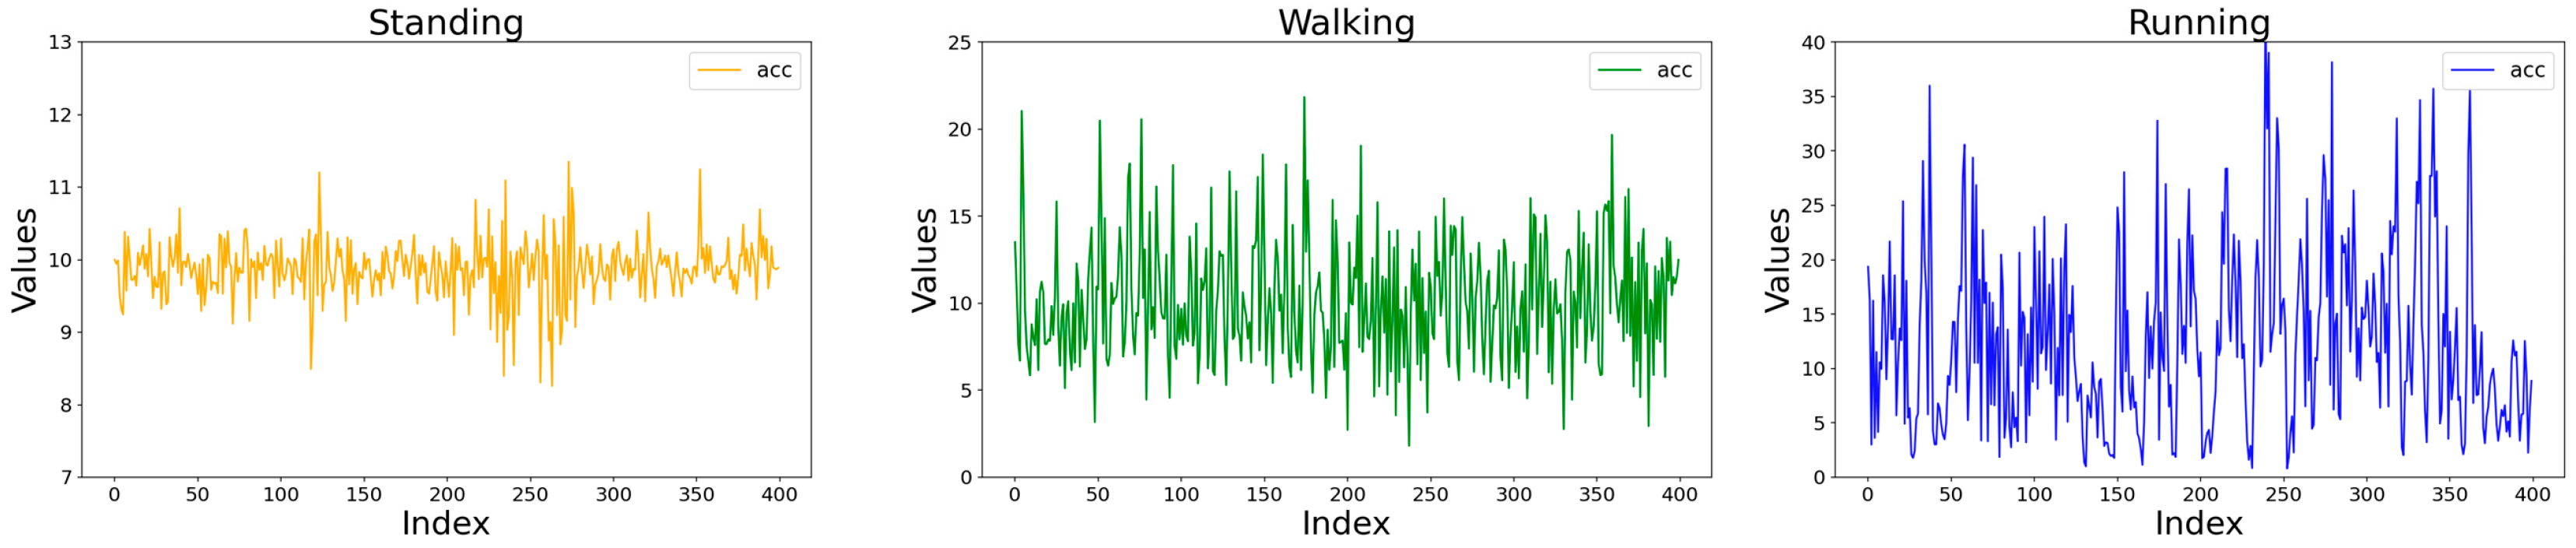
Figure 11.
Distribution range of the combined acceleration variance during standing, walking, and running behaviors.
Figure 11.
Distribution range of the combined acceleration variance during standing, walking, and running behaviors.
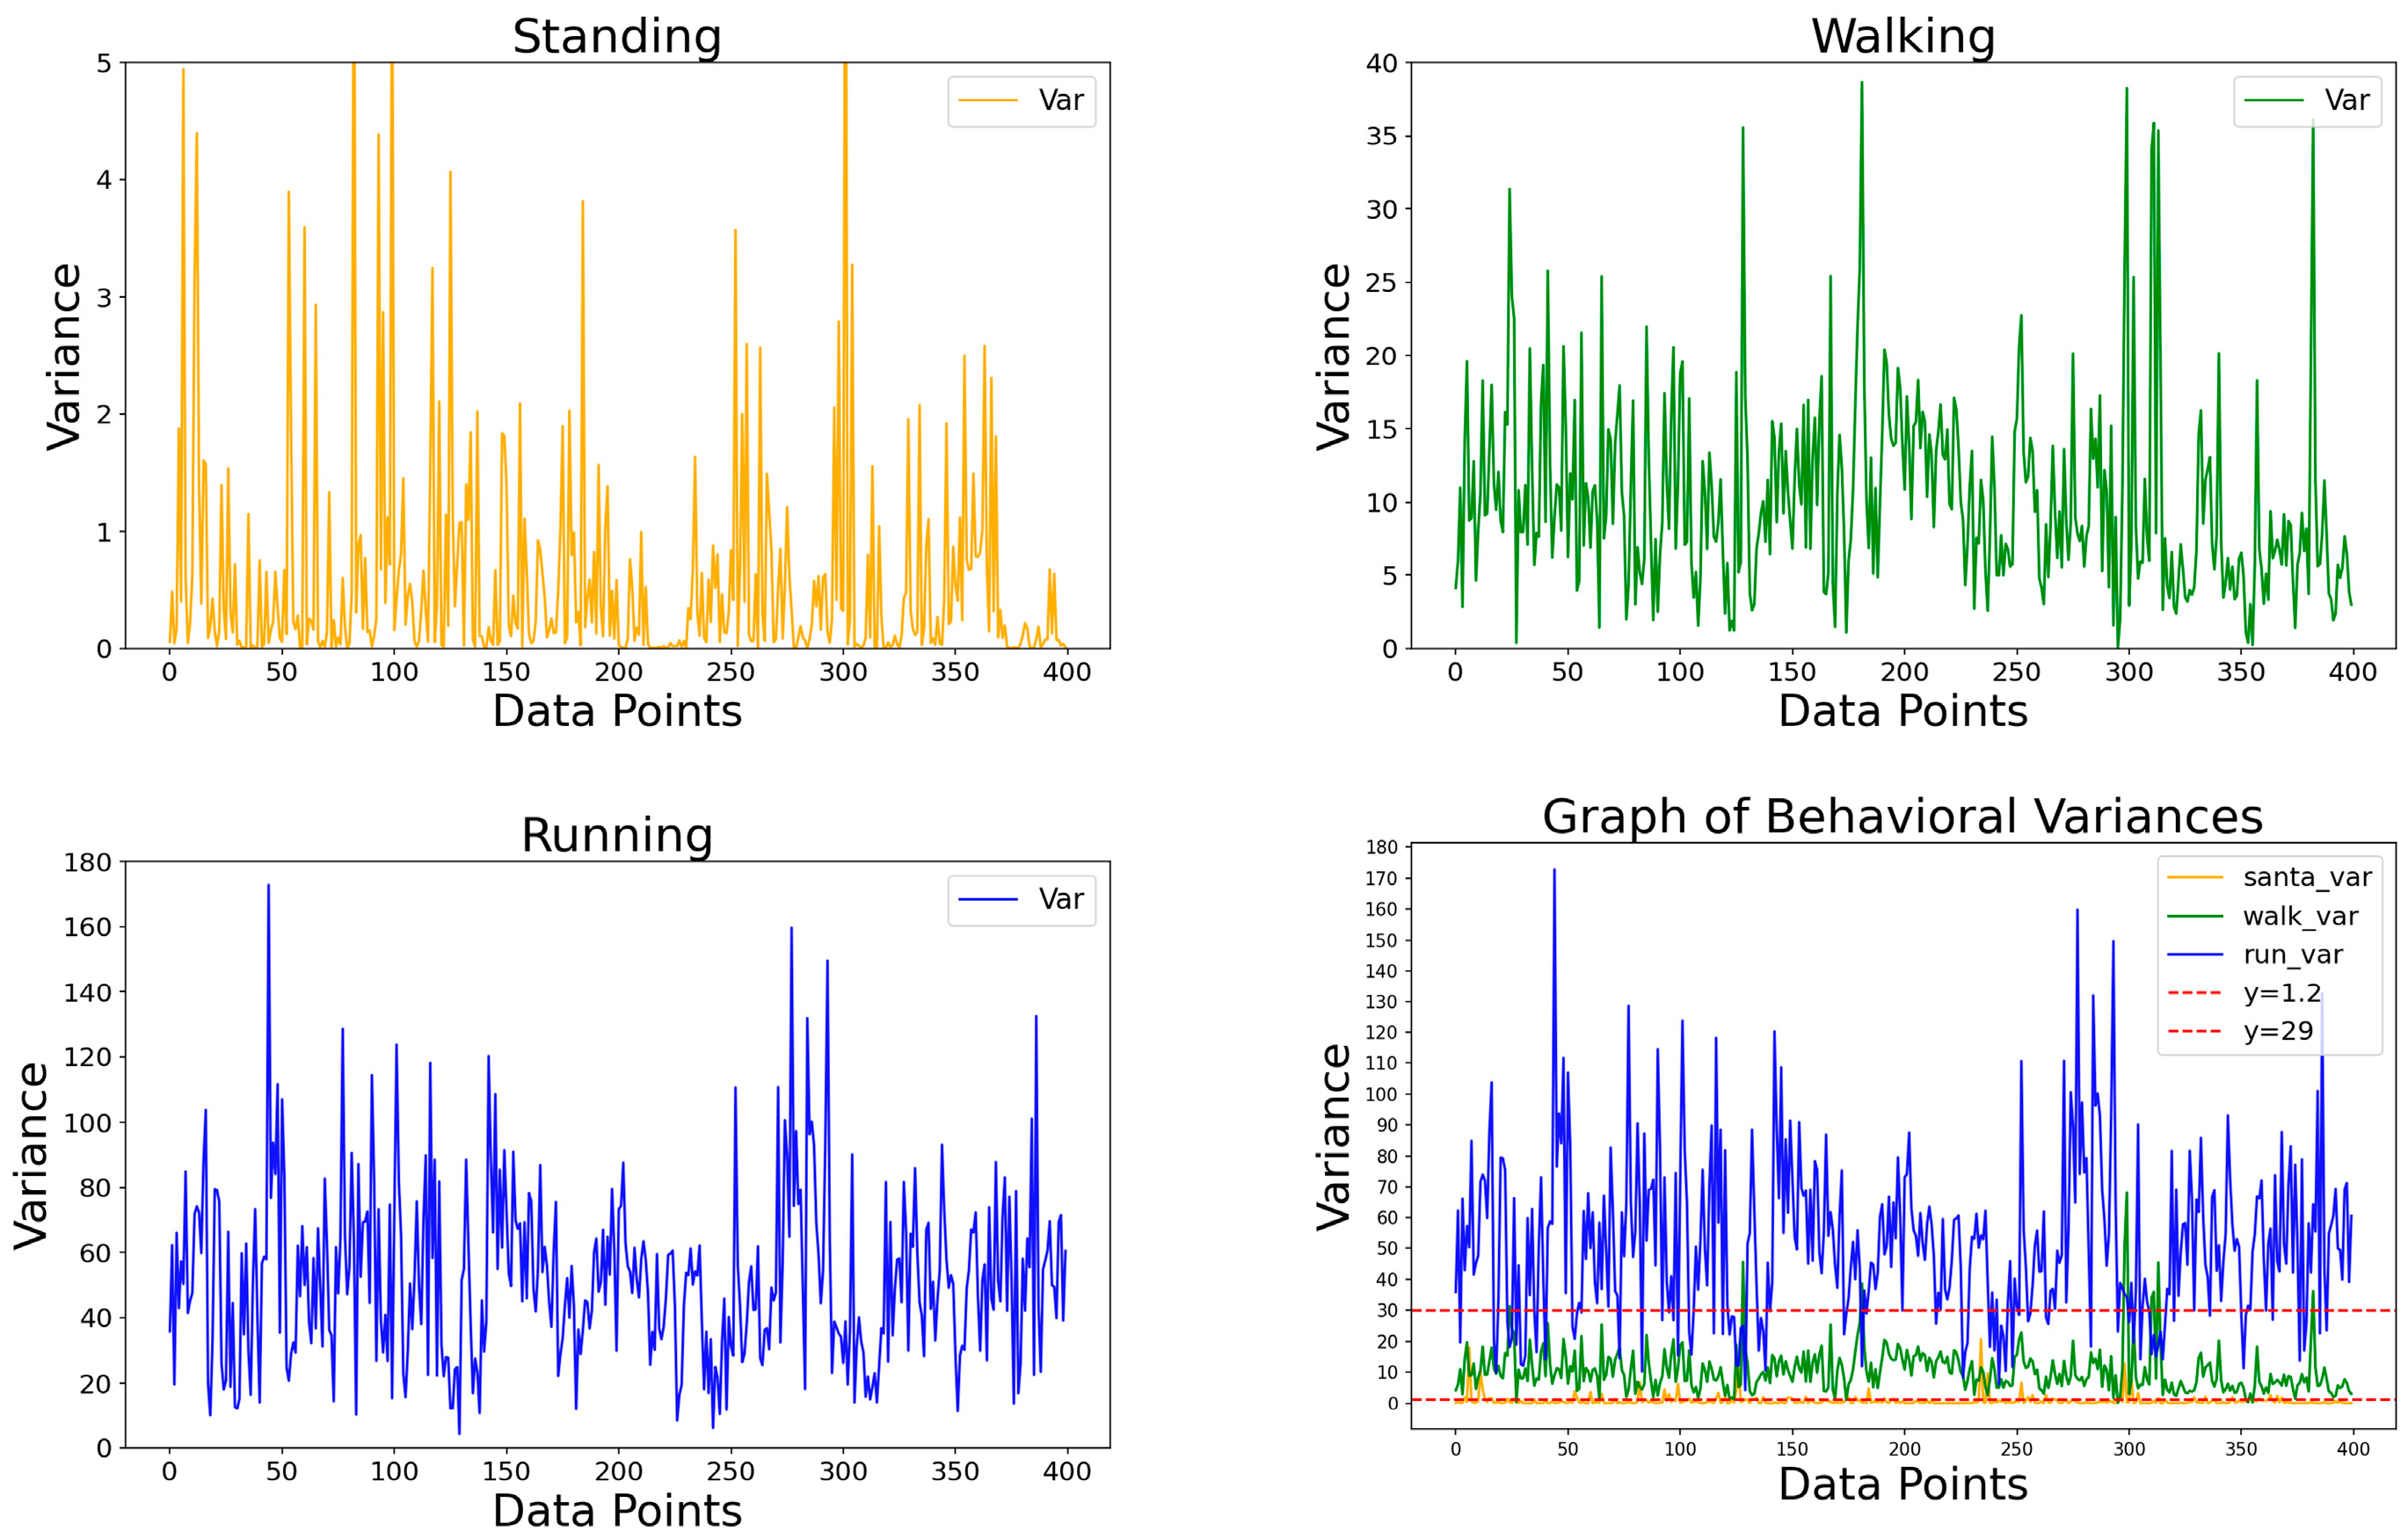
Figure 12.
Comparing the confusion matrices of the three methods: (a) the cumulative interval counting method, (b) the combined variance analysis method, and (c) the combined threshold analysis method.
Figure 12.
Comparing the confusion matrices of the three methods: (a) the cumulative interval counting method, (b) the combined variance analysis method, and (c) the combined threshold analysis method.
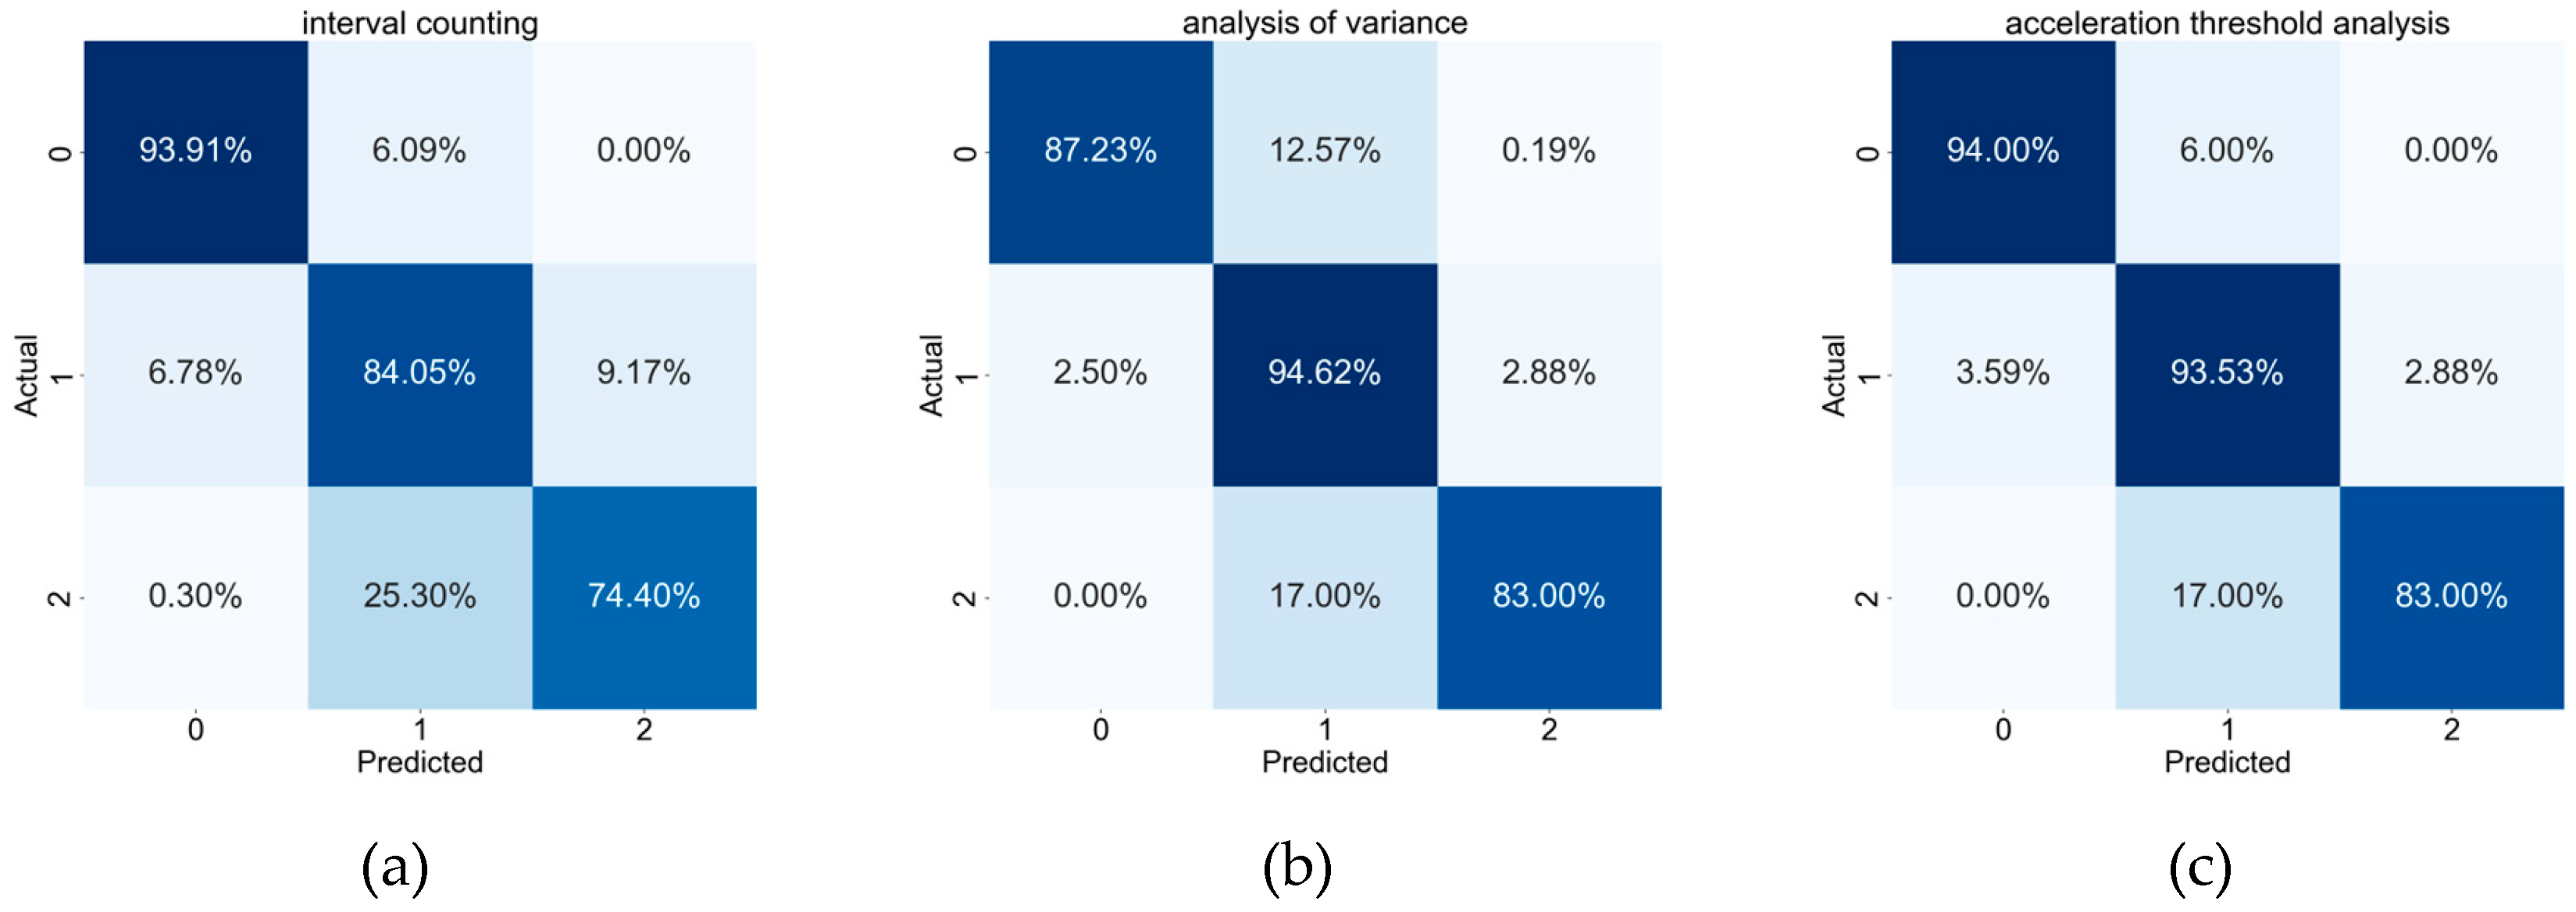
Figure 13.
Comparing the correlation between window size and the classification accuracy in (a) the Interval Counting Method, and (b) the Variance Analysis Method.
Figure 13.
Comparing the correlation between window size and the classification accuracy in (a) the Interval Counting Method, and (b) the Variance Analysis Method.
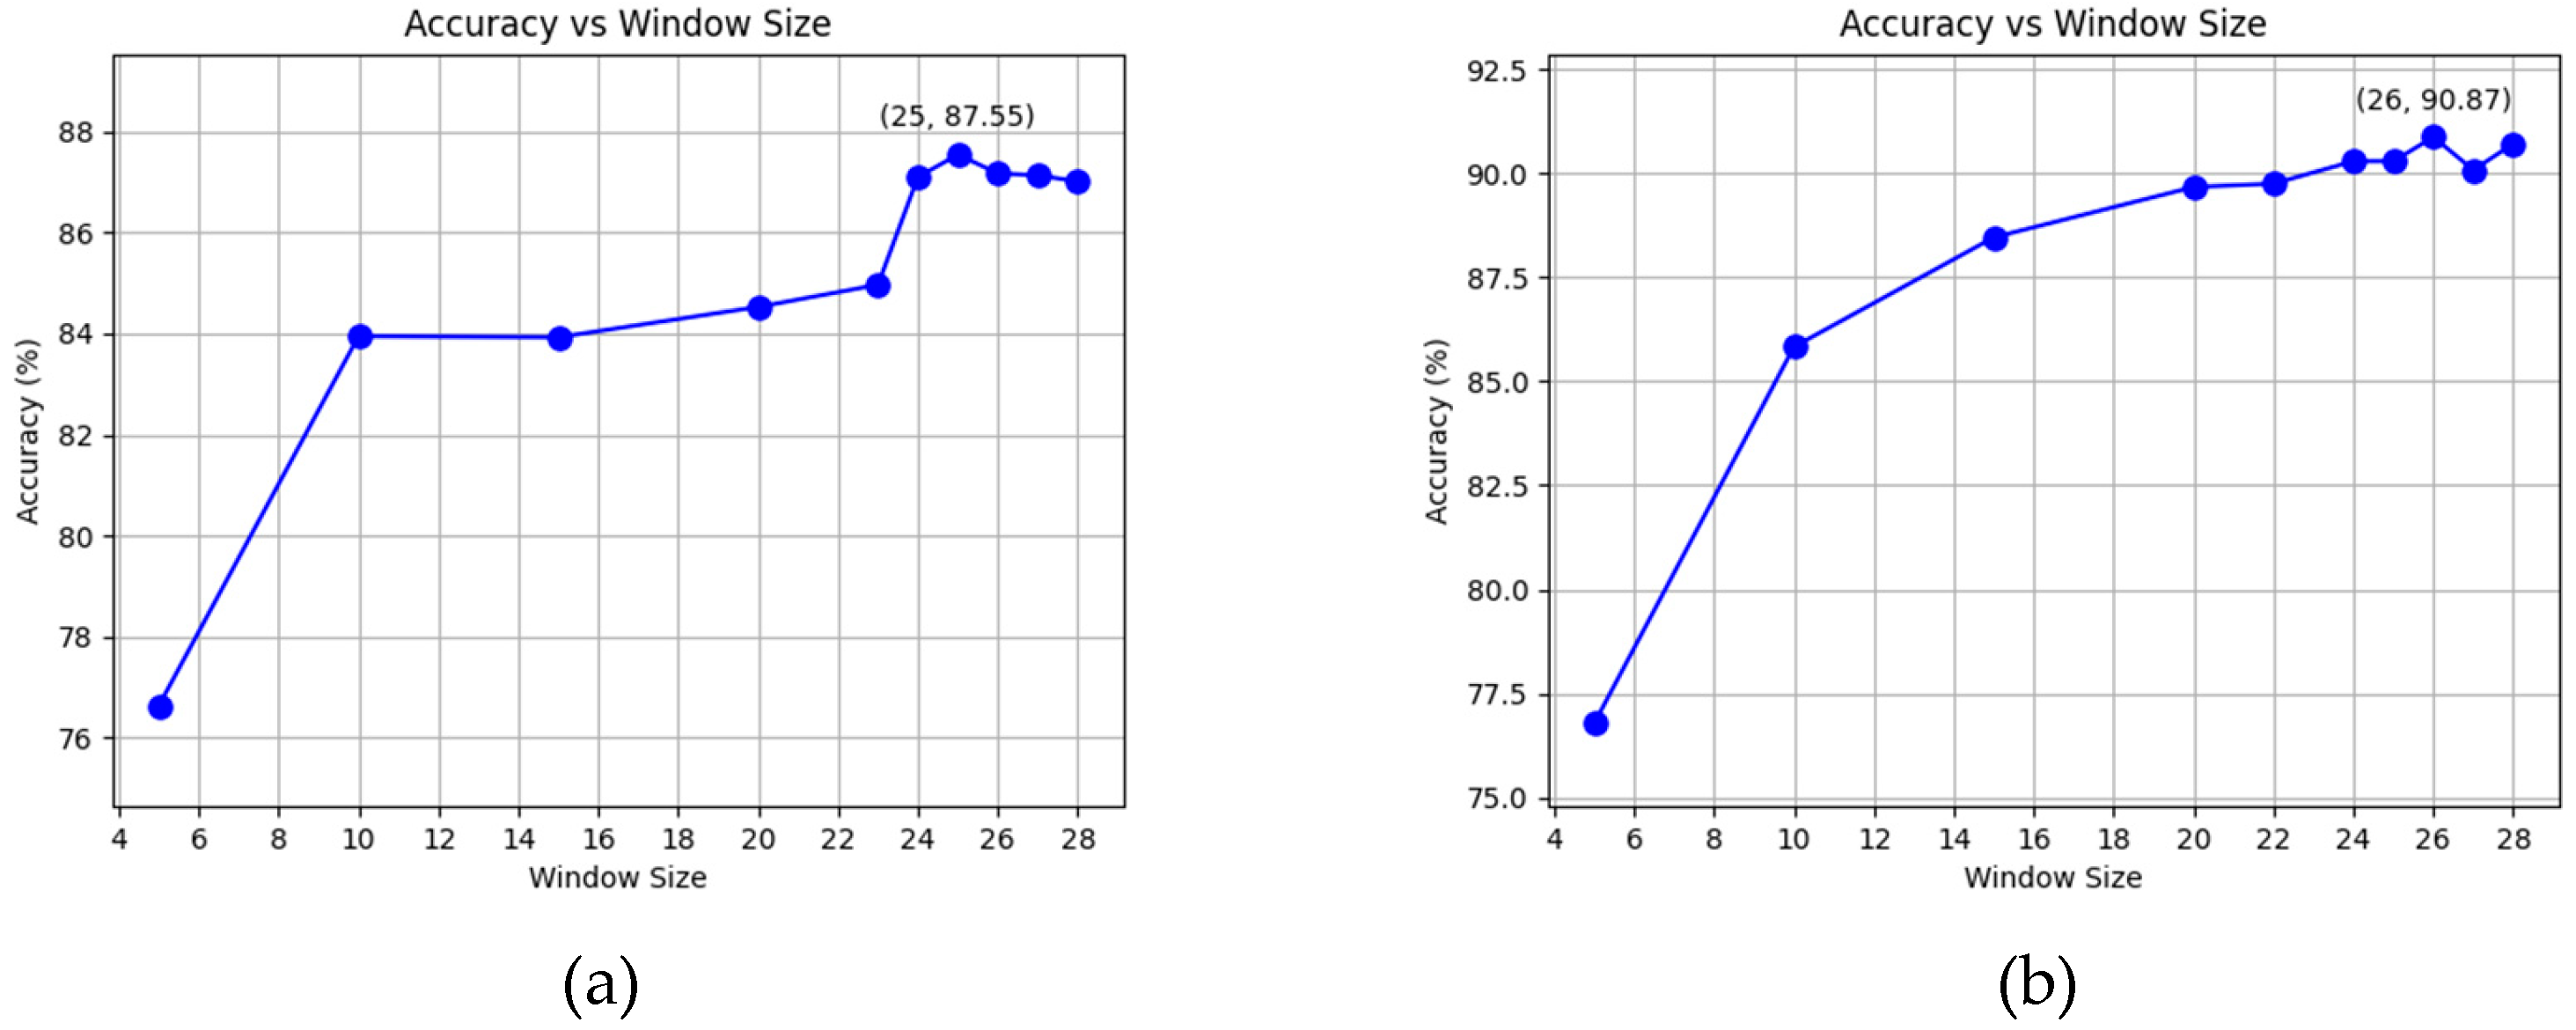
Figure 14.
Comparison of Accuracy between Interval Counting Method, Variance Analysis Method, and Combined Threshold Analysis Method, showing that the Combined Threshold Analysis Method achieves the highest accuracy.
Figure 14.
Comparison of Accuracy between Interval Counting Method, Variance Analysis Method, and Combined Threshold Analysis Method, showing that the Combined Threshold Analysis Method achieves the highest accuracy.
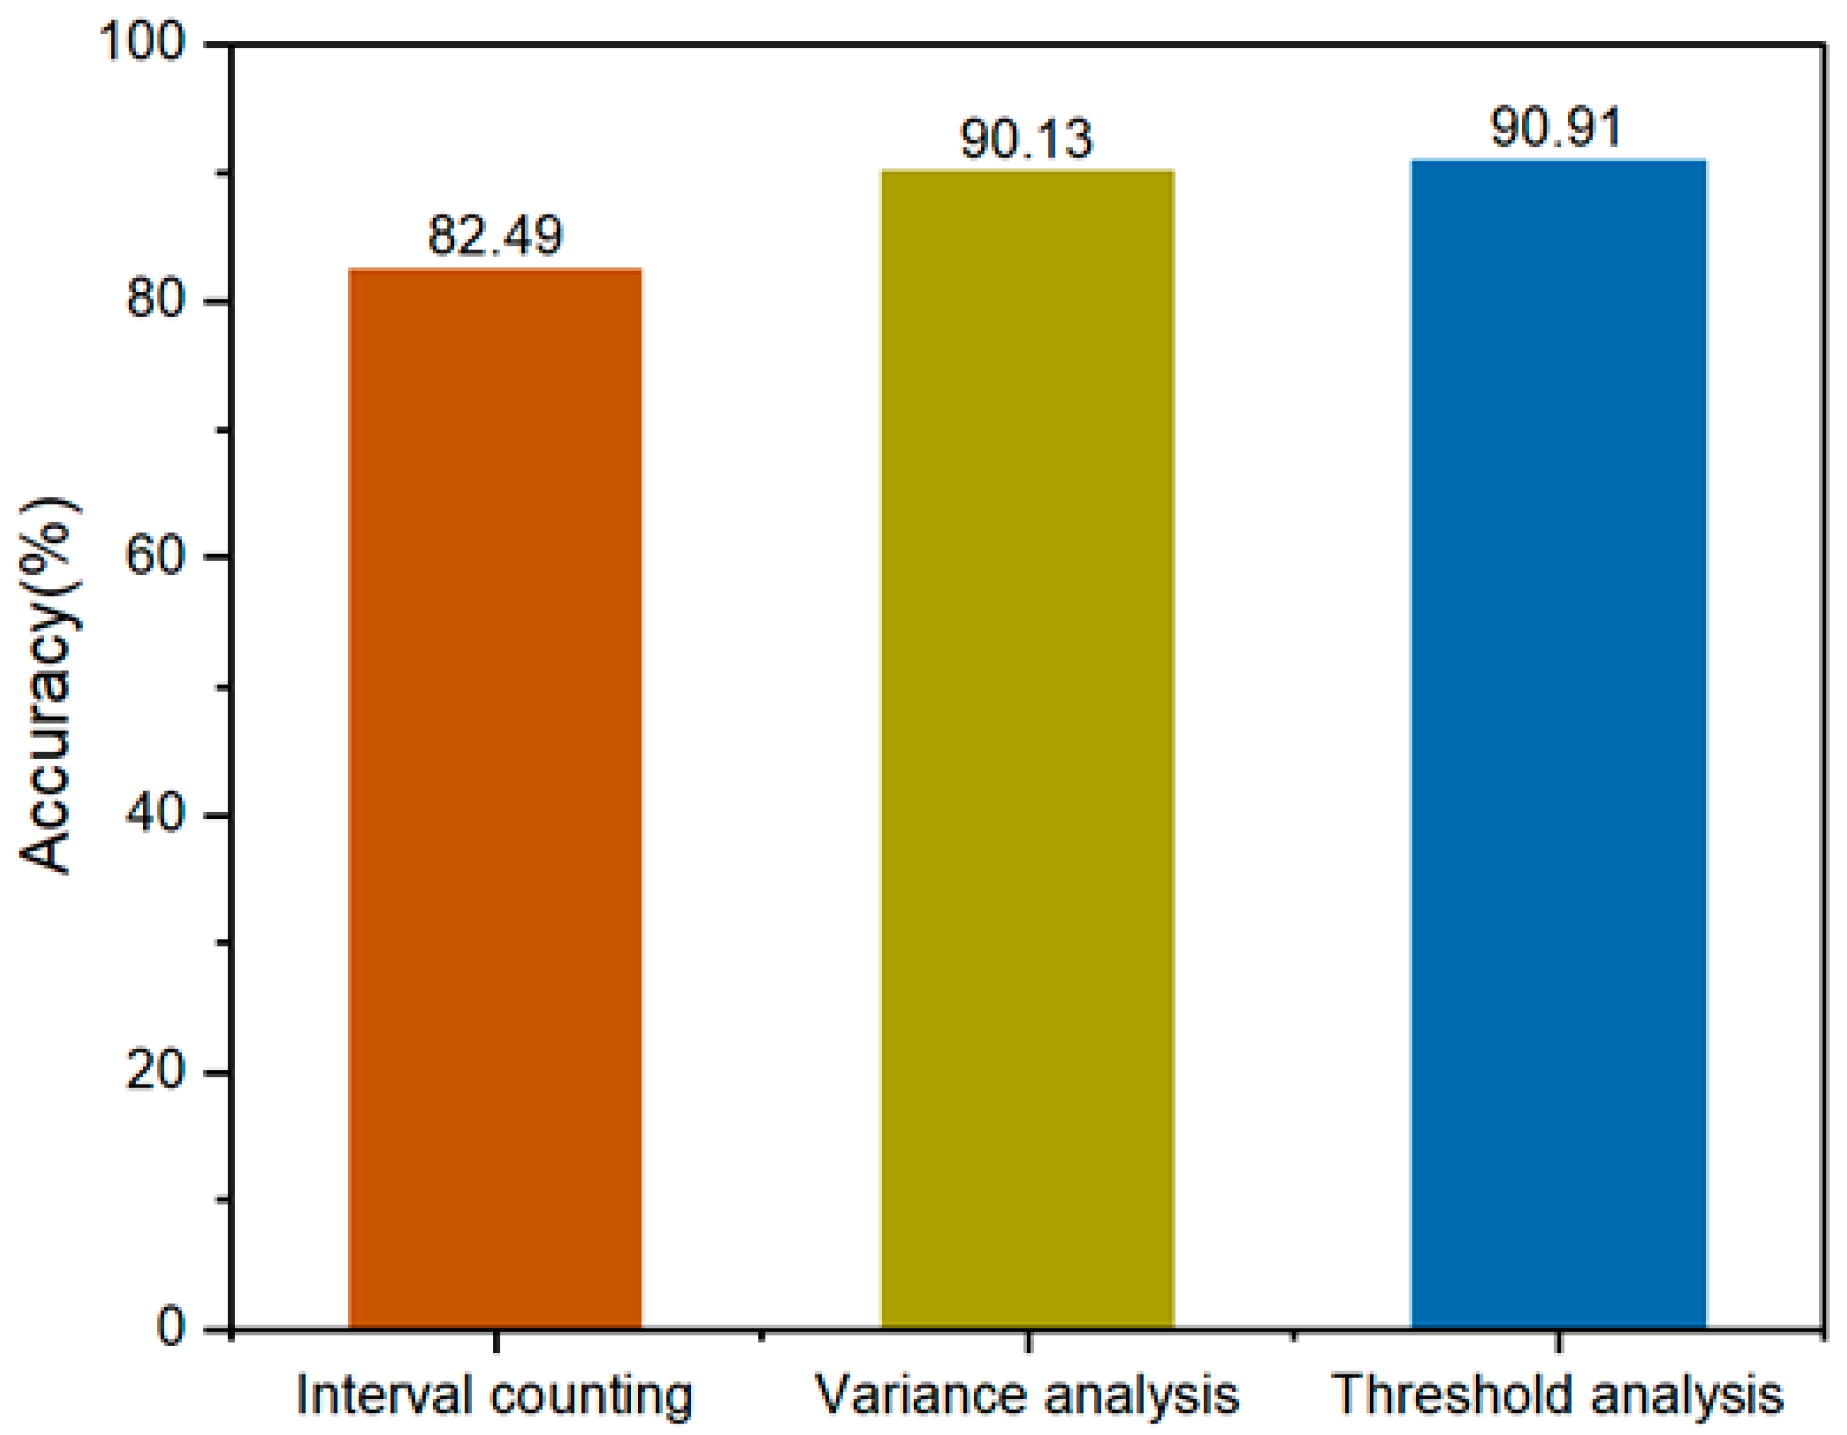
Figure 15.
Comparison results between actual and predicted motion times.
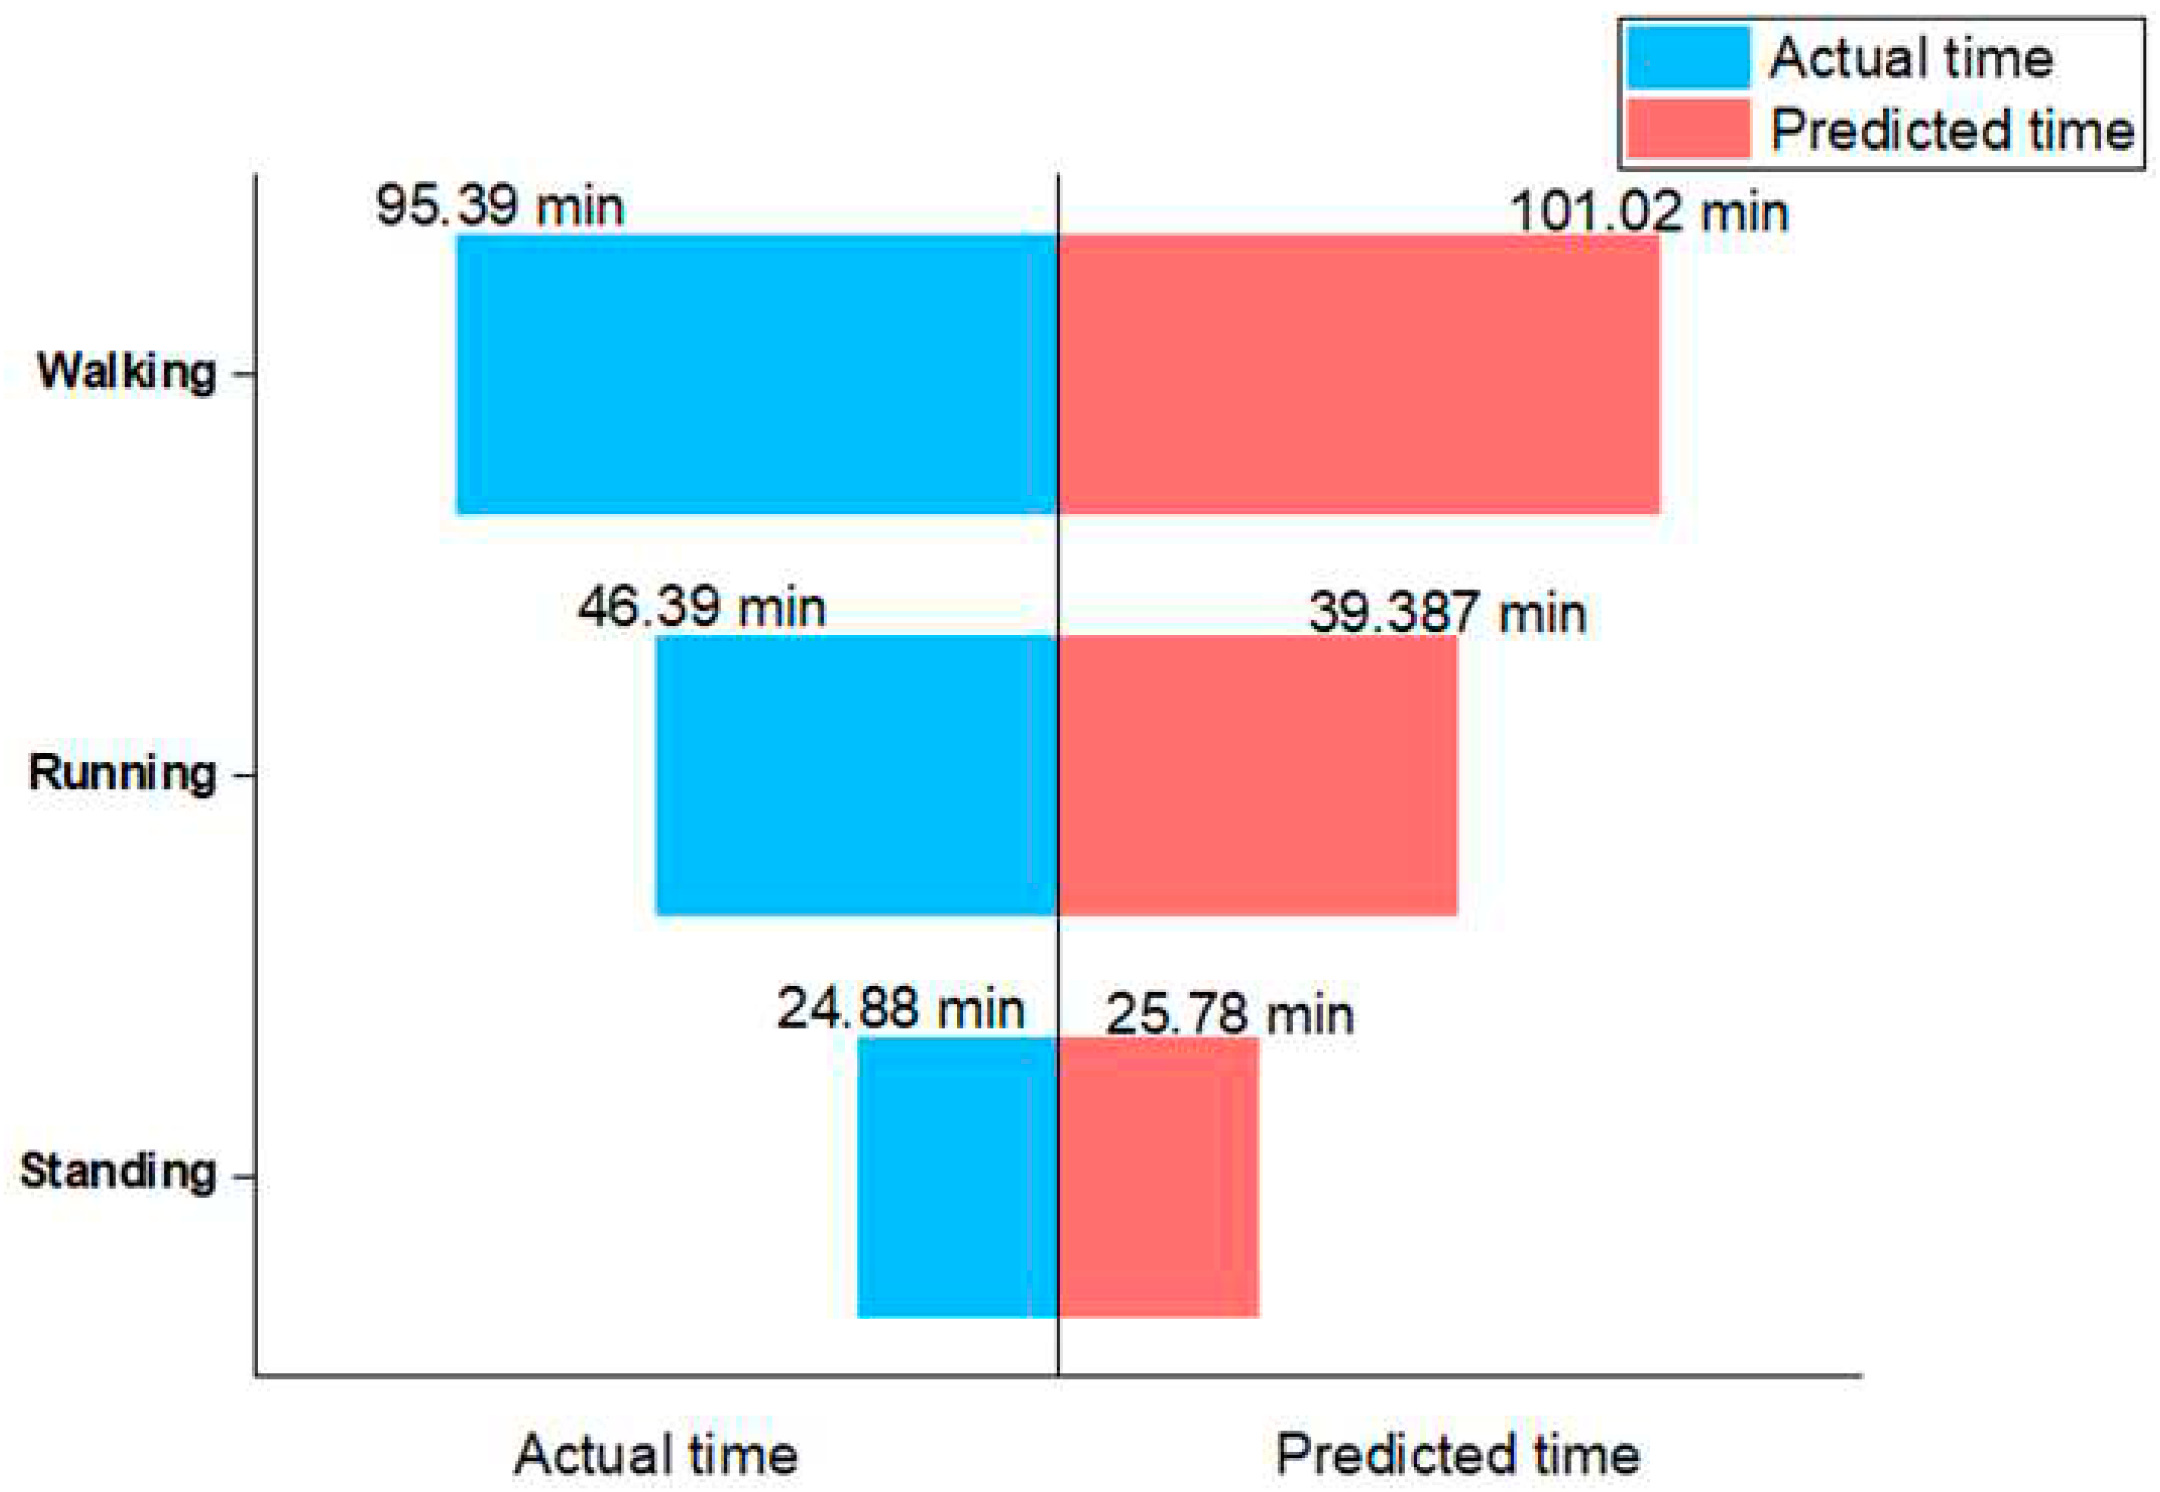
Figure 16.
Compares the accuracies between the Interval Counting Method, Variance Analysis Method, and Combined Threshold Analysis Method on both training models and practical applications.
Figure 16.
Compares the accuracies between the Interval Counting Method, Variance Analysis Method, and Combined Threshold Analysis Method on both training models and practical applications.
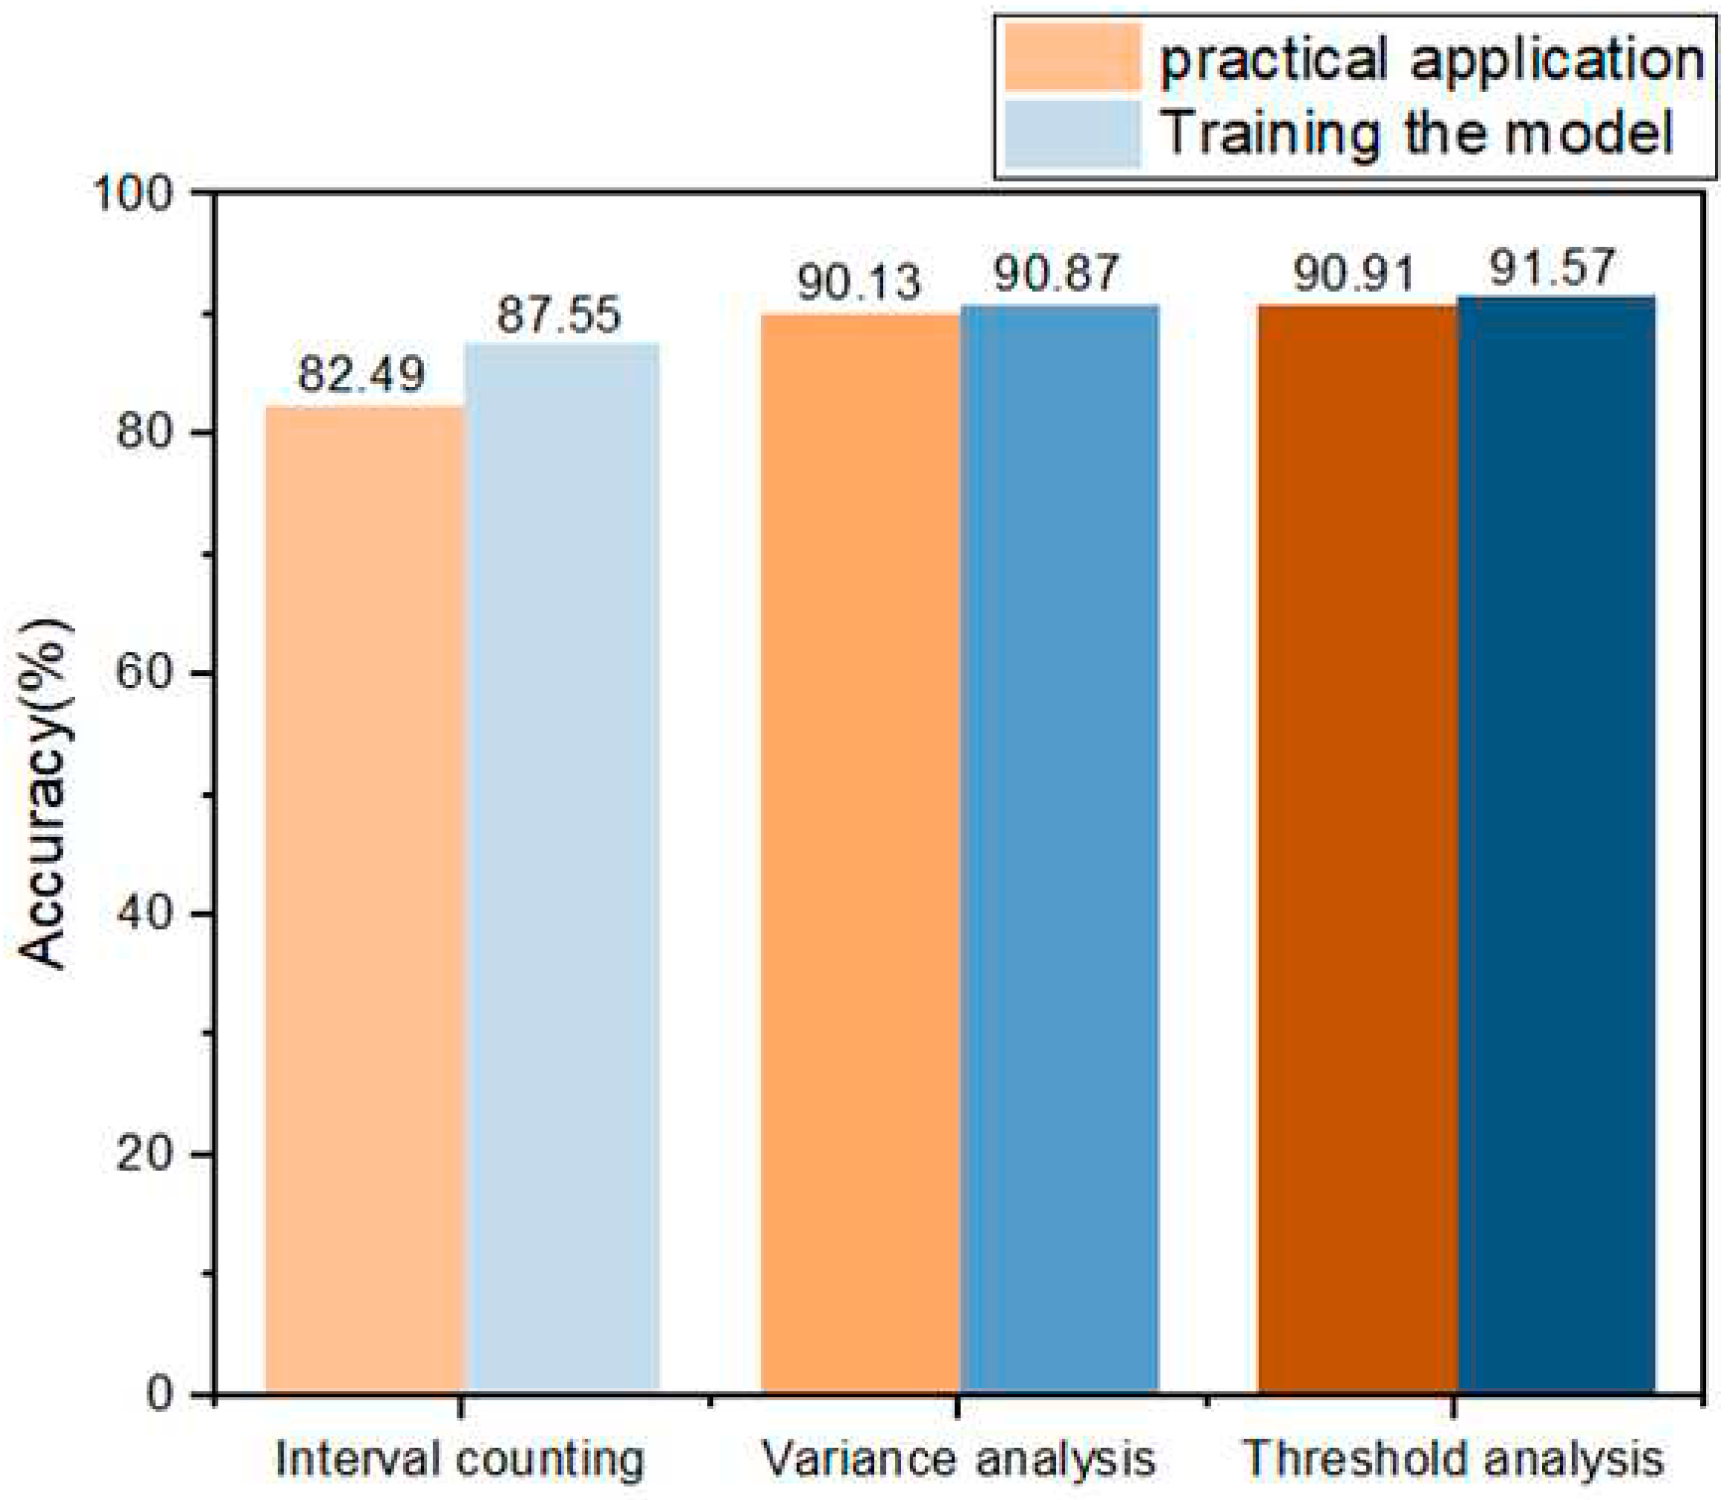

Table 1.
Record of the training experiment of one of the six horses.
| Category | Body Type | Wearing Location | Device ID | Time | Behavior | ||
|---|---|---|---|---|---|---|---|
| Standing | walking | Running | |||||
| Akhal-Tekehorses | Light Horse | Neck | 17 | 10:38 - 10:43 | √ | ||
| 10:43 – 10:46 | √ | ||||||
| 10:46 – 11:10 | √ | ||||||
| ⋮ | ⋮ | ⋮ | ⋮ | ||||
| 12:11 – 12:19 | √ | ||||||
Table 2.
Motion data for the horse of Table 1, with each row containing raw data for x, y, and z-axis accelerometer, as well as the resultant acceleration.
Table 2.
Motion data for the horse of Table 1, with each row containing raw data for x, y, and z-axis accelerometer, as well as the resultant acceleration.
| X-axis | Y-axis | Z-axis | ACC |
|---|---|---|---|
| -4.46 | 8.27 | -5.96 | 11.12 |
| -4.85 | 7.43 | -5.55 | 10.46 |
| -4.6 | 6.27 | -6.7 | 10.26 |
| -4.92 | 7.51 | -4.22 | 9.92 |
| -4.93 | 5.99 | -5.3 | 9.39 |
| -5.89 | 6.8 | -4.5 | 10.05 |
| -4.68 | 7.48 | -5.73 | 10.52 |
| -4.81 | 9.27 | -4.39 | 11.32 |
| -5.56 | 7.94 | -6.89 | 11.89 |
| -5.79 | 12.75 | -6.55 | 15.45 |
| -4.79 | 9.06 | -3.81 | 10.93 |
| -5.87 | 10.5 | -7.49 | 14.17 |
| -5.52 | 8.12 | -7.12 | 12.12 |
| -0.62 | 9.54 | -8.24 | 12.62 |
| -6.27 | 8.76 | -10.6 | 15.11 |
| -0.89 | 6.29 | -4.66 | 7.87 |
| -6.69 | 7.48 | -3.06 | 10.49 |
| -3.51 | 9 | -6.77 | 11.79 |
| -3.8 | 7 | -9.31 | 12.25 |
| -8.46 | 5.1 | -6.62 | 11.89 |
| -5.49 | 3.56 | -5.71 | 8.68 |
Table 3.
Definition of Horse Behaviors.
| Horse Behavior | Behavior Definition |
|---|---|
| Standing | The horse stops moving, stands with all four hooves on the ground, and maintains a stationary posture. |
| Walking | The horse maintains a lower speed and rhythm in its gait. Movement of the forelegs and hind legs is slower, and the body posture remains relatively stable. |
| Running | The horse displays increased movement in both forelegs and hind legs, showing a rocking motion in the body, often characterized by substantial lateral and longitudinal movements while running. |
Table 4.
Cumulative Acceleration Intervals for Standing, Walking, and Running Behaviors.
| Standing Behavior | The cumulative acceleration mainly falls within the range of [9.0, 10.5]. |
| Walking Behavior | The combined acceleration data range is mainly distributed within the interval [7.0, 15.0]. |
| Running Behavior | The combined acceleration data range is primarily distributed within the interval [2.0, 40.0]. |
Table 5.
The relationship between interval analysis threshold and classification accuracy.
| Interval Analysis Threshold | Behavior Classification Accuracy |
|---|---|
| 86.92% | |
| 87.19% | |
| 78.92% | |
| 74.13% |
Table 6.
Boundary of combined acceleration variance between standing and slow walking, experimentally validated with the highest classification accuracy when the boundary value is 1.2.
Table 6.
Boundary of combined acceleration variance between standing and slow walking, experimentally validated with the highest classification accuracy when the boundary value is 1.2.
| Variance Boundary Value | Behavior Classification Accuracy |
|---|---|
| 1.0 | 90.56% |
| 1.1 | 90.68% |
| 1.2 | 90.72% |
| 1.3 | 90.52% |
| 1.4 | 90.64% |
| 1.5 | 90.44% |
| 1.6 | 90.41% |
Table 7.
Combined acceleration variance threshold between walking and running, experimentally validated with the highest classification accuracy when the threshold value is 29.
Table 7.
Combined acceleration variance threshold between walking and running, experimentally validated with the highest classification accuracy when the threshold value is 29.
| Variance Boundary Value | Behavior Classification Accuracy |
|---|---|
| 20 | 87.23% |
| 25 | 89.83% |
| 27 | 90.37% |
| 28 | 90.79% |
| 29 | 90.87% |
| 30 | 90.72% |
| 31 | 90.68% |
| 32 | 90.60% |
Table 8.
Predicted Results of Horse Behavior Identification.
| Standing/Count | Walking /Count | Running /Count | |
|---|---|---|---|
| Actual value | 2986 | 11447 | 5567 |
| Predicted values using Combined Acceleration Interval Counting Method | 3068 | 7236 | 7696 |
| Predicted values using Combined Acceleration Variance Analysis Method | 2678 | 12538 | 4784 |
| Predicted values using Combined Acceleration Threshold Analysis Method | 3094 | 12122 | 4784 |
Table 9.
Generalized Models of Interval Counting Model, Variance Analysis Model, and Threshold Analysis Model.
Table 9.
Generalized Models of Interval Counting Model, Variance Analysis Model, and Threshold Analysis Model.
| Threshold Analysis Model | Interval Counting Model | Variance Analysis Model |
|---|---|---|
|
represents a set containing the interval counting model and the variance analysis model. denotes evaluating the model’s performance through experimentation. |
, represents the data point. N represents the number of data points that meet the condition. represents the threshold adjusted based on the scaling factor. |
represents data points, where L represents the lower threshold and U represents the upper threshold. represents the mean |
Disclaimer/Publisher’s Note: The statements, opinions and data contained in all publications are solely those of the individual author(s) and contributor(s) and not of MDPI and/or the editor(s). MDPI and/or the editor(s) disclaim responsibility for any injury to people or property resulting from any ideas, methods, instructions or products referred to in the content. |
© 2024 by the authors. Licensee MDPI, Basel, Switzerland. This article is an open access article distributed under the terms and conditions of the Creative Commons Attribution (CC BY) license (https://creativecommons.org/licenses/by/4.0/).
Copyright: This open access article is published under a Creative Commons CC BY 4.0 license, which permit the free download, distribution, and reuse, provided that the author and preprint are cited in any reuse.


