Submitted:
26 January 2024
Posted:
29 January 2024
You are already at the latest version
Abstract
This study analyzes the relationship between economic policy uncertainty (hereinafter EPU) and corporate value, and verifies the differential effects of EPU on corporate value according to corporate social responsibility (hereinafter CSR) activities. The study period was from 2010 to 2020, and the EPU indexes measured by Baker et al. (2016)'s method and Hexun's CSR scores for companies listed on the Chinese stock market were used. Hexun is one of the three major evaluation agencies in China, and the CSR scores evaluated by this agency have been widely used in previous studies as a representative indicator of Chinese companies' CSR performance. The results of this study are as follows. First, EPU and corporate value were found to have a negative (-) relationship. Second, active CSR activities relieved the negative (-) relationship between EPU and corporate value. Finally, companies were divided into groups according to CSR activity scores to analyze the relationship and according to the result, the negative (-) relationship between EPU and corporate value was greater in the groups with low CSR activity scores than in the groups with high CSR activity scores. A lag model was applied to control endogeneity, and the results were consistent with the main results above. Previous studies have mainly focused on microscopic factors to investigate factors affecting corporate value. This study focused on macroeconomic policies and paid attention to the effects of changes in the macroenvironment caused by economic policy uncertainty on corporate value. In addition, this study is meaningful in that it expanded previous studies related to CSR activities by confirming that active CSR activities can be an advantageous tool for overcoming EPU.
Keywords:
economic policy uncertainty (EPU)
; corporate social responsibility (CSR)
; firm value
1. Introduction
This study analyzes the relationship between economic policy uncertainty (hereinafter EPU) and firm value, and verifies the differential effects of EPU on firm value according to corporate social responsibility (hereinafter CSR) activities. Globalization is the current trend due to technological innovation and the development of the internet, and economic uncertainty has been heightened recently as economic and non-economic factors are mixed due to the shocks of US-China trade friction and COVID-19, etc. Consequently, national economic policies change frequently and interest in the effects of EPU on the global financial market has been growing.
EPU is related to the overall business activities of companies. An increase in EPU can make it difficult for managers to grasp the future business environment and restrict efficient decision-making and business management. Al-Thaqeb et al. (2019) [1] suggested that EPU can always cause side effects. An example is the recent economic downturn existing in many countries experiencing great policy uncertainty. First, according to the view that EPU greatly increases companies' wait-and-see attitude, it can be seen that the level of investment of firms is reduced or investments are delayed due to EPU through previous studies (Bernanke 1983 [2]; Gulen and Ion 2016 [3]). This can lead to a contraction of the real economy (Lee and Seo 2020 [4]). Meanwhile, there is also a view that EPU can increase agency costs by causing the problem of information asymmetry. A positive (+) relationship was shown between EPU and excess cash holdings (Demir and Ersan 2017 [5]; Duong et al. 2018 [6]; Phan et al. 2019 [7]; Shin 2012 [8]). Jensen (1986) [9] reported information asymmetry and agency costs as major factors for excess cash holdings, and Shin (2012) [8] verified the negative effect of excess cash holdings on shareholder value. Therefore, the increase in EPU can cause information asymmetry and agency problems thereby damaging corporate value. Yung and Root (2019) [10] reported that as EPU increases, the management attempts earnings management more frequently. This means that when the EPU is high, firm value can be damaged due to opportunistic earnings management by managers. Therefore, when the level of EPU is high, it is expected that the quality of accounting information will be low due to the agency problem, and due to the path as such, EPU is expected to have a negative effect on firm value. The relationship between EPU and firm value should be studied in-depth because studies on it have not yet been actively conducted. In particular, in the case of emerging markets, capital markets are not healthy, and additional studies on how EPU affects firm value should be conducted.
Therefore, the importance of studies on how managers can overcome crises and maintain safe business management in the face of the challenges posed by EPU is high. In an uncertain environment, stakeholders' confidence in the overall market dropped significantly, and in such cases, the level of trust in companies appeared to be more important (Sapienza and Zingales 2012 [11]). Companies that conducted CSR activities well in such situations will be able to deliver more powerful and reliable signals to their stakeholders (Godfrey 2005 [12]; Lins et al. 2017 [13]; Bouslah et al. 2018 [14]).
Various studies have been conducted on the relationship between CSR activities and firm value. Many studies have confirmed a significant positive (+) relationship between CSR activities and firm value (Na and Hong 2011 [15]; Cho et al. 2019 [16]). From the perspective of the agency theory, Cheng et al. (2014) [17] argued through empirical analysis that CSR activities can improve the transparency of accounting information. This means that companies that more actively engage in CSR activities can provide more non-financial information and can reduce information asymmetry problems and agency costs by transmitting positive signals to the outside. Meanwhile, companies that actively carry out CSR activities can gain social capital by gaining a good reputation in the market. Campbell (2007) [18] argued that CSR activities are closely related to the economic environment faced by companies. In a situation where ECU is high, CSR activities will receive more attention from stakeholders. In such cases, the social capital and reputation formed through the firm's active CSR activities play a role of protecting corporate assets in crisis situations (Lins et al., 2017 [13]). In summary, non-financial information provided through CSR activities alleviates information asymmetry and agency problems, and this effect may be greater when EPU is higher. This suggests that CSR activities can be a strategic means to overcome EPU.
On the other hand, when facing an uncertain environment, managers must allocate resources efficiently so that they can adapt well to environmental changes. CSR activities can improve a company's image, but they also incur costs (Pava and Krausz 1996 [19]). Therefore, studies on whether managers should actively carry out CSR activities with limited resources in the recent situation where economic policy uncertainty is high have an important practical implication. That is, it is necessary to study whether social capital and reputation acquired through firm’s active CSR activities can mitigate the negative effects of uncertainty.
Based on previous studies, this study will focus on the relationship between EPU and firm value, and the moderating effect of CSR activities on the foregoing relationship. The study period was from 2010 to 2020, and the EPU indexes measured by Baker et al. (2016) [20]'s method and Hexun's CSR scores for companies listed on the Chinese stock market were used. Hexun is one of the three major evaluation agencies in China, and the CSR scores evaluated by this agency have been widely used in previous studies as a representative indicator of Chinese companies' CSR performance (Pan et al. 2014 [21]; Yang et al. 2019 [22]).
The results of this study are as follows. First, EPU and corporate value were found to have a negative (-) relationship. This is consistent with previous studies that showed a negative (-) relationship between EPU and management performance (Pástor and Veronesi 2013 [23]; Yung and Root 2019 [10]; Al-Thaqeb et al. 2019 [1]). Second, active CSR activities relieved the negative (-) relationship between EPU and firm value. This is consistent with previous studies indicating that active CSR activities play a role in mitigating the problem of information asymmetry and protecting corporate assets in unstable times (Cheng et al. 2014 [17]; Godfrey 2005 [12]; Bouslah et al. 2018 [14]). Additionally, firms were divided into groups according to CSR activity scores to analyze the relationship and according to the result, the negative (-) relationship between EPU and corporate value was greater in the groups with low CSR activity scores than in the groups with high CSR activity scores. A lag model was applied to control endogeneity, and the results were consistent with the main results above. In addition, considering the robustness of the analysis results, the results were re-verified using the EPU index measured by Davis et al. (2019) [24]'s method, and the results consistent with the above results were obtained.
The contributions of this study are as follows. First, previous studies have mainly focused on microscopic factors to investigate factors affecting firm value. This study focused on macroeconomic policies and paid attention to the effects of changes in the macroenvironment caused by economic policy uncertainty on firm value. Second, when enacting economic policies, the policy-making body should consider the fact that frequent policy changes can negatively affect firm value and hinder corporate development. Third, this study is meaningful in that it expanded previous studies related to CSR activities by confirming that active CSR activities can be an advantageous tool for overcoming EPU. Finally, the implications of this study are in that this study can present the importance of CSR activities to companies and promote voluntary CSR activities by companies.
This study is as follows. Section II reviews previous studies and develops hypotheses, and Section III describes data collection and variable settings, and presents the research models. In addition, Section IV reports the empirical results, and Section V concludes this study and presents limitations and contributions.
2. Literature Review and Hypotheses Development
2.1. Economic Policy Uncertainty and Firm Value
Due to changes in government regulation and fiscal policies, EPU is related to overall corporate management activities and affects the financial market. Therefore, it is necessary to study the economic effects of EPU. The effects of EPU on companies are extensive, and thus previous studies have focused mainly on the effect of EPU on corporate decision-making.
Researchers have determined that companies consider EPU when making decisions, and have actively conducted studies on corporate investments and cash holdings. First, studies on the effect of EPU on corporate investments are as reviewed follows. Bernanke (1983) [2] verified the negative (-) relationship between high uncertainty and corporate investments. This means that in a situation where uncertainty is high, the management may reduce their investment plan or delay the execution of their investment plan considering the irreversibility of investments. Gulen and Ion (2016) [3] presented a significant negative (-) relationship between EPU and corporate investment activities. This negative (-) relationship was shown to be greater in companies with high investment irreversibility and those that rely on government spending. This can be interpreted as the management’s act of reducing investment activities in order to avoid the negative effect of uncertainties in the external environment.
Next, studies on EPU and cash holdings are reviewed. Demir and Ersan (2017) [5] verified the positive (+) relationship between EPU and the company's cash holding level. This means that the cost of raising capital rises when uncertainty rises and firms facing financial constraints hold more cash due to a precautionary motive. In addition, Duong et al. (2018) [6] and Phan et al. (2019) [7] also reported a significant positive (+) relationship between EPU and corporate cash holding levels. Cho (2020) [25] used quantile regression analysis to verify the relationship between South Korean companies' cash holdings and EPU. As a result of the analysis, a statistically significant positive (+) relationship between EPU and cash holdings was found in companies with high cash holding ratios.
On the other hand, relatively fewer studies have been conducted on the effect of EPU on firm value. Pástor and Veronesi (2013) [23] reported that stock prices typically fall when economic policy changes, and found that EPU increases the risk premium. This can be interpreted as indicating that investors demand additional compensations for EPU. Antonakakis et al. (2013) [26] analyzed the dynamic relationship between EPU and stock returns, and found a significant negative (-) relationship between EPU and stock returns. Kang et al. (2013) [27] also reported a significant negative (-) relationship between EPU and stock returns for US companies. Baker et al. (2016) [20] presented a positive (+) relationship between EPU and stock price volatility, and a negative (-) relationship between EPU and corporate investment. It has been shown that EPU increases stock price volatility. This shows that since the 2008 financial crisis, high EPU has fueled economic downturn and suppressed economic recovery.
Meanwhile, it can be predicted that the increase in EPU can lead to opportunistic earnings management by managers so that the negative effects on the quality of accounting information can damage firm value. Dhole et al. (2021) [28] reported a negative (-) relationship between EPU and the comparability of financial reporting. This phenomenon appeared stronger in companies with low quality of accruals. This shows that an increase in EPU lowers the comparability of financial reporting by making it difficult to predict future cash flows and increasing opportunistic earnings management behavior. In addition, Yung and Root (2019) [10] reported a significant positive (+) relationship between EPU and earnings management. It can be seen that the increase in EPU increases the opportunistic earnings management behavior of managers. This means that when EPU rises, the quality of accounting information may decrease so that eventually, firm value can be negatively affected.
To summarize the results of previous studies above, if EPU increases, companies will have more wait-and-see attitudes and prefer conservative management policies because it will be difficult to grasp the future business environment. Concretely, companies can abandon or delay investment plans and increase cash holdings. Investment delays can restrict companies’ normal business activities, and excess cash holdings can cause agency problems (Jesen 1986 [9]; Shin 2012 [8]). Eventually, excess cash holdings will hinder efficient resource allocation thereby negatively affecting corporate value. In addition, an increase in EPU can lead to opportunistic earnings management by managers to reduce firm value through a negative effect on the quality of accounting information.
2.2. Corporate Social Responsibility, Economic Policy Uncertainty, and Firm Value
Various studies on the effect of CSR activities on corporate value have been conducted around the world, but the conclusions of previous studies are not consistent. However, each country is standardizing the evaluation criteria for CSR activities, and most recent study results show that there is a positive (+) relationship between CSR activities and firm value (Na and Hong 2011 [15]). Cho et al. (2019) [16] revealed a positive (+) relationship between CSR activities and firm value. Heo and Chung (2010) [29] measured and analyzed CSR performance with the Economic Justice Index, and based on the results, he presented a significant positive (+) relationship between CSR performance and firm value, and found that corporate reputations were acting as a parameter in the relationship between CSR performance and firm value. It was found that the better the CSR performance, the higher the corporate reputation, and the increased corporate reputation increases the firm value.
Meanwhile, Kim (2021) [30] verified the relation between corporate CSR activities and corporate value with Chinese listed companies. According to the results of the analysis, CSR activities and corporate value showed a significant positive (+) relationship. Cheng et al. (2014) [17] presented a result indicating that the more active a company's CSR activities, the lower the financial constraints of the company. This means that corporate CSR activities can alleviate information asymmetry and agency problems by increasing stakeholder participation.
In addition, previous studies reported that corporate CSR activities contribute to the reduction of earnings management behaviors. Choi and Moon (2013) [31] reported that companies that engage in corporate CSR activities conduct less earnings management behaviors and have higher earnings sustainability than companies that do not. The results as such mean that corporate CSR activities increase accounting transparency. Martínez-Ferrero et al. (2015) [32] verified the negative (-) relationship between corporate CSR activities and discretionary accruals through an empirical analysis of internationally listed companies. Companies with active CSR activities strive to provide transparent accounting information as managers are motivated to maintain a higher corporate reputation.
Recent study paid attention to how corporate CSR activities affect companies in a crisis, and presented a background on which EPU and corporate CSR activities can be connected to each other. First, Lins et al. (2017) [13] reported that companies that conducted active CSR activities before and after the 2008 financial crisis not only had higher price earnings ratios but also showed higher profitability and growth potentials than companies that did not. This suggests that when a company’s overall reliability in the financial market drops, the company can mitigate the negative shock with its social capital accumulated through CSR activities.
Next, Bouslah et al. (2018) [14] reported that the negative (-) relationship between CSR performance and corporate risks appeared stronger during the financial crisis than before the crisis. This showed that corporate CSR activities have the effect of reducing risks in an uncertain economic environment and can have insurance benefits. Meanwhile, Chahine et al. (2021) [33] suggested that an increase in EPU lowers the forecast accuracy of financial analysts, and that the negative (-) relationship as such can be alleviated in the case of companies with active CSR activities. This can be interpreted as indicating that corporate CSR activities improve the quality of accounting information by providing non-financial information.
To summarize the results of previous studies above, it can be seen that information asymmetry problems can become serious when the business environment is uncertain and active CSR activities can alleviate information asymmetry and agency problems by providing non-financial information. Eventually, active CSR activities play a role in improving the quality of accounting information to enhance firm value.
2.3. Hypotheses Development
Maximization of firm value is the ultimate goal of corporate stakeholders. Firm value is closely related to the company's potential and future earning power. However, an increase in EPU can distort normal business activities to restrict efficient distribution of economic resources, and reduce the ability to generate profits. Bernanke (1983) [2] and Gulen and Ion (2016) [3] reported that the level of corporate investment decreases due to increases in EPU, and Dixit and Pindyck (1994) [34] reported that from the viewpoint of the irreversible investment theory, in cases where uncertainty is high, even if the present value of the investment is greater than 0, the company's investment will be postponed until new information is obtained. As a result, it is predicted that the ability to create future profits will be reduced in the case of companies that gave up investment opportunities (Demir and Ersan 2017 [5]; Duong et al. 2018 [6]; Phan et al. 2019 [7]). In addition, increases in EPU are linked to excess cash holdings. Shin (2012) [8] reported evidence indicating that in the case of South Korean companies, the longer the period of excess cash holdings, the greater the decline in shareholder value. This means that a company's excess cash holdings can destroy shareholder value and incur agency costs.
Meanwhile, it is reported that companies with high EPU show lower quality of accounting information and perform earnings management through accruals (Dhole et al. 2021 [28]; Yung and Root 2019 [10]). The earnings management reduces the reliability of accounting information to information users thereby reducing the usefulness of accounting information. Therefore, an increase in EPU will increase the opportunistic earnings management of managers and exacerbate the agency problem to undermine firm value. In addition, Antonakakis et al. (2013) [26] and Kang et al. (2013) [27] argued that EPU has a negative effect on the stock market.
Based on the previous studies above, it can be expected that if an increase in EPU induces managers’ wait-and-see attitudes and excess cash holdings and makes managers to conducts opportunistic earnings management, the quality of firm accounting information will be damaged. Therefore, the following hypothesis are established:
Hypothesis 1 (H1).
Economic policy uncertainty and firm value will have a negative relationship.
From the viewpoint of stakeholders, corporate CSR activities increase stakeholders' trust in the company and mitigate conflicts of interest (Freeman 1984 [35]). From the viewpoint of that perform CSR activities, negative effects of earnings management such as a fall of corporate image, decline in firm value, and decreases in sales can be greater than its positive effect. Therefore, it is generally expected that companies that well perform CSR activities will increase corporate value by improving the transparency of accounting information and suppressing opportunistic earnings management. Previous studies have shown evidence that a company's CSR activities and corporate value have a positive (+) relationship, and also presented evidence that the quality of accounting information is improved through active CSR activities (Na and Hong 2011 [15]; Kim et al. 2012 [36]; Choi and Moon 2013 [31]; Cheng et al. 2014 [17]; Kim 2021 [30]).
Meanwhile, the positive reputation built through corporate CSR activities plays a role in protecting corporate assets in crisis situations (Godfrey 2005 [12]). Lins et al. (2017) [13] and Bouslah et al. (2018) [14] reported that corporate reputation and social capital accumulated through corporate CSR activities are more beneficial during times of instability. That is, in times of high uncertainty in the business environment, firm’s CSR activities play a role in alleviating information asymmetry by increasing the usefulness of non-financial information.
As such, from the viewpoint of stakeholders, the social capital and reputation that companies acquire through CSR activities can be important resources to overcome EPU. It is expected that when the EPU is high, the non-financial information provided by active CSR activities will alleviate the information asymmetry problem. Active CSR activities can be expected to have a moderating effect to alleviates the negative (-) relationship between EPU and firm value. Therefore, the following hypothesis is established to verify the differential effect of CSR activities on the relationship between EPU and firm value:
Hypothesis 2 (H2).
Corporate social responsibility will alleviate the negative relationship between economic policy uncertainty and firm value.
3. Research Design and Data
3.1. Empirical Models
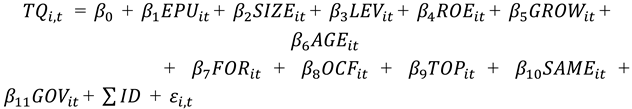
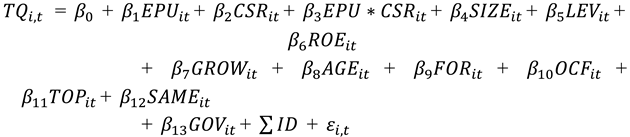
This study used the following regression model to verify the effect of EPU on firm value and the differential effects of EPU on firm value according to CSR activities. This study uses the China's EPU index measured using Baker et al. (2016) [20] method as EPU and uses Hexun's CSR index, a representative evaluation agency in China, for corporate’s CSR activities. According to previous studies, the EPU index is time series data, and may have of multicollinearity problems with year data. Therefore, the year dummy variable is not included in the model. For firm value, the value of Tobin's Q, which is the ratio of book value to market value, used by Chung and Pruitt (1994) [37], is applied. As the increase in EPU is expected to decrease the corporate value, the sign of in equation (1) is expected to be negative (–), and since the negative (–) relationship between EPU and firm value is expected to be alleviated as the company more actively engaged in CSR activities, the sign of in equation (2) is expected to be positive (+).
 |
(1) |
 |
(2) |
Control variables include SIZE, LEV, ROE, GROW, AGE, FOR, OCF, TOP, SAME, and COV, which influence firm value. SIZE is measured by taking the natural log of the total assets, and LEV represents leverage ratio, which is the value of debt divided by total assets. ROE stands for profitability and is the value of net profit divided by equity capital, GROW is the growth rate, measured as the sales in t minus sales in t–1, divided by sales in t–1. AGE is firm age, which is measured by taking the natural log of the listing period, and FOR is the foreign ownership. OCF is the value of operating cash flow divided by total assets, and TOP is share ratio of top 10 shareholders. SAME is an indicator variable equal to 1 if the manager is a director and representive, 0 if not, and GOV is an indicator variable qual to 1 if the firm is government-owned, 0 if not. Finally, ID is included to control industrial effects on firm value.
3.2. Measurement of Variables
3.2.1. EPU Index
This study used China's economic policy uncertainty index measured with Baker et al. (2016) [20] method. The usability of Baker's EPU index has been confirmed in previous overseas studies, and this index plays an important role in the field of studies on EPU and corporate finance (Gulen and Ion 2016 [3]; Al-Thaqeb et al. 2019 [1]). China's EPU index was built using South China Moring Post (SCMP), which is Hong Kong's leading English-language magazine. Since the EPU index is monthly data, the value obtained by dividing the weighted average of the monthly EPU indexes by 100 was used according to previous studies (Liu et al. 2015 [38]). The higher the EPU index, the higher the level of economic policy uncertainty.
3.2.2. CSR Activities
CSR activities use China’s Hexun CSR evaluation score. The CSR indicators that are the most frequently used in CSR studies on Chinese capital markets are the RKS and the Hexun score. According to a study conducted by Zhong et al. (2019) [39], the RKS score is suitable for measuring the quality of disclosure of CSR reports, and Hexun's score is more suitable for measuring CSR performance. This study used Hexun's CSR scores to measure the level of CSR activities. Hexun's CSR scores are evaluated and scored based on the stakeholder theory system, and are composed of five evaluation criteria classified into responsibilities for shareholders/employees, customers, suppliers, environment, and society. CSR evaluation scores and detailed evaluation criteria are disclosed on the Hexun website.
3.3. Samples and Data
This study analyzed non-financial businesses listed on the A market of the Shanghai and Shenzhen Stock Exchange in China from 2010 to 2020. The corporate financial information required for this study was collected from CSMAR (China stock market and accounting research database), Baker et al. (2016) [20] 's EPU index was used for economic policy uncertainty, and Hexun's score was used for CSR activity evaluation scores. Companies under special treatment, companies for which financial information-related data could not be obtained from CSMAR, and companies without CSR evaluation scores on the Hexun website were excluded from the samples. The final samples are 25,917 firm-years. In this study, each variable, except dummy and time series variables, was winsorized by considering observations with outlier values in the bottom 1% or less and the top 99% as outliers.
Table 1 shows the distribution of the samples by year. Although the number of listed companies is increasing year by year, variations by period are not.
Table 2 shows the distribution of the samples by industry. The ratios of manufacturing (64.51%) and information transmission and software information technology service (6.52%) were large, and the ratios of education and other service (0.18%) and the hygiene and social work (0.24%) were small.
4. Empirical Results
4.1. Descriptive Statistics
Table 3 shows the descriptive statistics of the variables used in the empirical analysis. The mean of TQ is 2.018 and the median is 1.607. EPU was found to have an average of 3.876, with a minimum value of 0.989 and a maximum value of 7.919. The average of CSR was 24.387, the median was 22.130, the overall scores were low, and the standard deviation was shown to be 15.551, which is larger compared to other variables. China is an emerging market, and it was shown that the levels of CSR activities were generally low and the difference between companies that actively perform CSR activities and companies that do not was large. The average and median of SIZE are 22.038 and 22.225, respectively, and the average and median of LEV are 0.425 and 0.420, respectively. The average ROE is 0.061, indicating that the return on equity is about 6.1%. The average GROW is around 17.2% and the average age of companies is 2.787. The average of FOR is 0.7%, indicating that the average ratio of foreign investments in enterprises is 0.7%. The mean values of OCF, DEP, and SAME are 0.048, 0.381, and 0.263, respectively. The share ratio of the 10 largest shareholders is about 58.58%, and the average GOV is 0.379, indicating a high share of state-owned enterprises.
4.2. Pearson Correlations
Table 4 shows the results of Pearson correlation analysis of major variables. TQ shows a significant negative (-) relationship with EPU, indicating that corporate value decreases when EPU is high. It is consistent with the prediction that EPU and corporate value will show a negative (-) relationship. TQ had significant negative (-) correlations with CSR, SIZE, LEV, AGE, FOR, TOP, and GOV, but significant positive (+) correlations with ROE, GROW, OCF, DEP, and SAME. That is, this indicates that when CSR activities are active, the size of the company is large, the company is old, the foreign ownership ratio is high, and the stock ratio of the 10 largest shareholders is high, the corporate value decreases and that when the profitability is high, the growth potential of the company increases, cash flow is large, the ratio of independent directors is high, and the director is the representatives, the firm value increases. Since the correlatios examined above is the result of uncontrolled other characteristics that affect firm value, we will analyze it after including other characteristics in the following.
4.3. Multivariate Results
4.3.1. EPU and Firm Value (H1)
Table 5 shows the results of regression analysis of equation (1) on the relationship between EPU and firm value. The F value of model was shown to be 237.78, which is significant at the 1% level, indicating that the study model is suitable, and the explanatory power (Adj R-Sq) was shown to be 22.37%. The variance inflation factor (VIF) of the independent variables used in the regression analysis in this study does not exceed 10, indicating that the multicollinearity problem is not serious. The results of analysis show that the regression coefficient of EPU is -0.042, which is a statistically significant negative (−) value at the 1% level. This indicates that the higher the EPU, the lower the firm value. This is a result that supports H1 of this study. These results can be interpreted as indicating that high EPU cases information asymmetry and agency problems so that stakeholders' confidence in the stock market and the company decreases. The regression coefficients of the control variables ROE, GROW, AGE, OCF DEP, SAME, and GOV were found to have significant positive (+) values. On the other hand, the regression coefficients of SIZE, LEV, FOR, and TOP were found to have significant negative (-) values.
4.3.2. CSR, EPU, and Firm Value (H2)
Table 6 shows the results of verifying whether CSR activities have a moderating effect in the negative relationship between EPU and firm value. The regression coefficient of EPU*CSR, which is an interaction term of EPU and CSR, is 0.001, and the t-value is 4.960, which is significant at the 1% level. The F value of model (2) is 237.78, which is significant at the 1% level, indicating that the study model is suitable, and the explanatory power (Adj R-Sq) was shown to be 22.34%. This is a result that supports H2 of this study. This indicates that in the case of companies with active CSR activities, the negative effect of EPU on corporate value can be reduced. From viewpoint of agents, this can be interpreted as indicating that non-financial information provided through active CSR activities alleviates information asymmetry and agency problems. Control variables appeared similar to the results in Table 5.
4.4. Additional Analysis
4.4.1. The Level of CSR Activities
Table 7 shows the results of regression analysis on the relationship between EPU and firm value by the level of CSR activities. Based on the median of the firm’s CSR score, it was divided into groups with active and passive CSR activities. First, when the group with passive CSR activities was examined, the regression coefficient of EPU, which represents the effect of EPU on corporate value, was found to be -0.057, which is a negative (−) value, and was shown to be statistically significant at the 1% level. The explanatory power (Adj R-Sq) of the results of the regression analysis was shown to be 26.62.
Next, when the group with active CSR activities was examined, the explanatory power (Adj R-Sq) of the results of regression analysis was shown to be 27.13%, and the explanatory power was shown to be higher in the group with active CSR activities. The regression coefficient of EPU, which indicates the effect of EPU on firm value, was found to be -0.025, which was a statistically significant negative (−) value at the 1% level. Therefore, the regression coefficient of EPU was larger than that of the group with passive CSR activities group. A significant difference appeared in the results of the Chow tests of the EPU coefficients of the group with active CSR activities and the group with passive CSR activities. That is, it can be seen that the negative effect of EPU on firm value is shown to be smaller in the group that is active in CSR activities than in the group that is passive in CSR activities. This can be interpreted as indicating that a group that is active in CSR reduces the level of information asymmetry by delivering reliable signals and providing useful non-financial information to stakeholders, thereby restoring the business environment that has been deteriorated due to the EPU. The control variables appeared similar to the results in Table 5.
4.4.2. Lag Model
Table 8 shows the results of re-testing H1 and H2 by applying the lag model to solve the endogeneity problem. Changes in economic policies in the previous period may be related to the business environment of the current period, and CSR activities in the previous period may affect the company's reputation among stakeholders in the current period. To consider the endogeneity problem as such that may exist, a lag model was applied to verify the hypotheses and using measured values of the EPU index and CSR score in the previous period. According to the result of re-verification of H1 and H2 applying the lag model, both the coefficients of LEPU and LEPU*LCSR had significant resultant values. That is, this means that the results of regression analysis applying the lag model support H1 and H2.
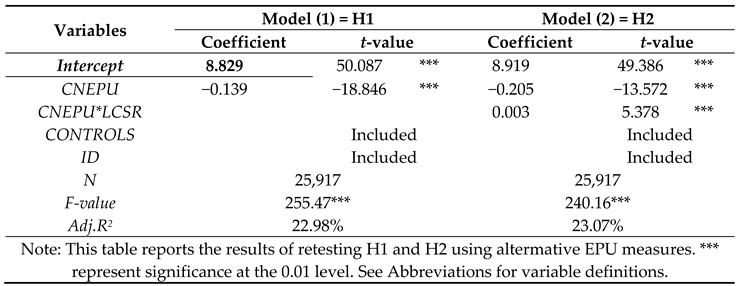
4.4.3. Robustness Test
Table 9 shows the results of re-testing H1 and H2 using alternative EPU measures. Although the usability EPU measured with Baker et al. (2016) [20] method has already been confirmed in many previous studies, in order to secure the robustness of the results of analysis, this study conducted investigation using the EPU measured with Davis et al. (2019) [24] method. According to the results, EPU and firm value showed a significant negative (-) relationship at the 1% level, and CSR activities showed a significant positive (+) moderating effect on the relationship at the 1% level. In model (1) and model (2), the results of analysis using Davis et al. (2019) [24] 's measured values were shown to be stronger compared to those using Baker et al. (2016) [20] 's measured values.
5. Conclusion
After the 2008 financial crisis, various countries have frequently adjusted their economic policies to cope with the shock of financial crises. Economic uncertainty has been heightened recently as economic and non-economic factors are mixed due to the shocks of US-China trade friction and COVID-19, etc. The exploration of whether such frequent economic policy changes will bring the financial market out of the shadow of a crisis or became burdens to companies has been conducted continuously. Al-Thaqebetal et al. (2019) [1] reviewed the literature on EPU, corporate decision-making, and financial markets and found that policy uncertainty had always led to negative consequences. Macroeconomic policies are one of major challenges faced by managers and stakeholders because they affect the entire production and management process of companies. Since companies cannot predict the future policy direction and business environment, they cannot but be disadvantageous in efficient decision-making and operational management. . Therefore, when the level of EPU is high, it is expected that the quality of accounting information will be low due to the agency problem, and due to the path as such, EPU is expected to have a negative effect on firm value.
The results of this study show that EPU has a negative impact on firm value. Next, active CSR activities relieved the negative (-) relationship between EPU and corporate value. This is consistent with previous studies indicating that active CSR activities play a role in mitigating the problem of information asymmetry and protecting corporate assets in unstable times (Cheng et al. 2014; Godfrey 2005; Bouslah et al. 2018). Additionally, companies were divided into groups according to CSR activity scores to analyze the relationship and according to the result, the negative (-) relationship between EPU and firm value was greater in the groups with low CSR activity scores than in the groups with high CSR activity scores. A lag model was applied to control endogeneity, and the results were consistent with the main results above. In addition, considering the robustness of the analysis results, the results were re-verified using the EPU index measured by Davis' method, and the results consistent with the above results were obtained.
Unlike previous studies, this study provides evidence from emerging market and investigates whether EPU is related to firm value, and further investigates whether CSR activities can ultimately become an active tool in that relationship. The contributions of this study are as follows. First, this study found that EPU can be one of the factors affecting firm value, which makes additional contributions to prior research on firm value. Second, the results of this study have great implication not only for firm and market participants, but also for policy authorities. Specifically, if CSR activities can alleviate the negative impact of EPU on firm value, it is firms can cope with the complex business environment caused by EPU through active CSR activities. Lastly, by reporting that the impact of EPU on firm value may vary depending on the level of CSR activities, we provided additional evidence for the hypothesis that there is a positive relationship between CSR activities and firm value.
This study may have the following limitations. First, EPU is not an observable value and thus is estimated. Although this study checked the robustness by applying the EPU index measured by two measurement methods, still there is a possibility that the index is not perfect due to the measurement methods. In addition, although a lag model was applied, it cannot be said that the endogeneity problem was completely excluded. Lastly, since the soundness of the stock market may be different between emerging and developed markets, the effects of changes in economic policies may differ between emerging and developed markets. Therefore, further studies are necessary.
Author Contributions
Conceptualization, J.L. and S.B.P.; Formal analysis, J.L.; Methodology, S.B.P.; Visualization, J.L.; Writing—original draft, J.L. and S.B.P.; Writing—review and editing, S.B.P. and J.L. All authors have read and agreed to the published version of the manuscript.
Funding
This work was supported by National University Development Project in 2020.
Institutional Review Board Statement
Not applicable.
Data Availability Statement
Not applicable.
Acknowledgments
The authors are grateful to the anonymous reviewers and editor for their comments and suggestions on this study.
Conflicts of Interest
The authors declare no conflict of interest.
Abbreviations
Dependent Variables
| TQ | = | Tobin’s Q, measured as total debt plus market value of equity divided by book value of total assets; |
Explanatory Variables
| EPU | = | China's economic policy uncertainty index measured with Baker et al. (2016) method (for the measurement method ofChina's EPU index, please refer to http://www.policyuncertainty.com/scmp_monthly.html); |
| CSR | = | the level of social responsibility activities measured by Hexun’s score ; |
Control variables
| SIZE | = | the natural log of total assets; |
| LEV | = | leverage ratio, the value of debt divided by total assets; |
| ROE | = | return on equity, the value of net profit divided by equity capital; |
| GROW | = | the growth rate, measured as the sales in t minus sales in t–1, divided by sales in t–1; |
| AGE | = | firm age, measured by taking the natural log of the listing period; |
| FOR | = | the foreign ownership; |
| OCF | = | the value of operating cash flow divided by total assets; |
| TOP | = | the share ratio of top 10 shareholders; |
| SAME | = | an indicator variable equal to 1 if the manager is a director and representive, 0 if not; |
| GOV | = | an indicator variable qual to 1 if the firm is government-owned, 0 if not; |
| ID | = | industry dummy. |
References
- Al-Thaqeb, S.A.; Algharabali, B.G. Economic policy uncertainty: A literature review. J. Econ. Asymmetries. 2019, 20, e00133. [Google Scholar] [CrossRef]
- Bernanke, B.S. Irreversibility, uncertainty, and cyclical invetment. Q. J. Econ. 1983, 98, 85–106. [Google Scholar] [CrossRef]
- Gulen, H.; Ion, M. Policy uncertainty and corporate investment. Rev. Financ. Stud. 2016, 29, 523–564. [Google Scholar] [CrossRef]
- Lee, K. Y.; Seo, Y. K. A study on the impact of Chinese economic policy uncertainty on long-term government bond yields. Korea-China Soc. Sci. Assoc. 2020, 18, 197–215. [Google Scholar] [CrossRef]
- Demir, E.; Ersan, O. Economic policy uncertainty and cash holdings: Evidence from BRIC countries. Emerg. Mark. Rev. 2017, 33, 189–200. [Google Scholar] [CrossRef]
- Duong, H.N.; Krishnamurti, C.; Nguyen, J. H.; Nguyen, M.; Rhee, S. G. The impact of economic policy uncertainty on stock liquidity: Cross-sectional effects and economic channels. SSRN. https://papers.ssrn.com. 2018, 3088922. [Google Scholar] [CrossRef]
- Phan, H.V.; Nguyen, N. H; Nguyen, H.T.; Hegde, S. Policy uncertainty and firm cash holdings. J. Bus. Res. 2019, 95, 71–82. [Google Scholar] [CrossRef]
- Shin, M.S. The effects of excess cash holdings on stockholder value of firms. J. Indus. Econ. Bus. 2012, 25, 2463–2483, https://www.kci.go.kr/kciportal/ci/sereArticleSearch/ciSereArtiView.kci?sereArticleSearchBean.artiId=ART00168 7191. [Google Scholar]
- Jensen, M. C. Agency costs of free cash flow, corporate finance, and takeovers. Am. Econ. Rev. 1986, 76, 323–329. [Google Scholar]
- Yung, K.; Root, A. Policy uncertainty and earnings management: International evidence. J. Bus. Res. 2019, 100, 255–267. [Google Scholar] [CrossRef]
- Sapienza, P.; Zingales, L. A trust crisis. Int. Rev. Financ. 2012, 12, 123–131. [Google Scholar] [CrossRef]
- Godfrey, P. C. The relationship between corporate philanthropy and shareholder wealth: A risk management perspective. Acad. Manage. Rev. 2006, 30, 777–798. [Google Scholar] [CrossRef]
- Lins, K. V.; Servaes, H.; Tamayo, A. Social capital, trust, and firm performance: The value of coporate social responsibility during the financial crisis. J. Financ. 2017, 72, 1785–1824. [Google Scholar] [CrossRef]
- Bouslah, K.; Kryzanowski, L.; M’Zali, B. Social performance and firm risk: Impact of the financial crisis. J. Bus. Ethics. 2018, 149, 643–669. [Google Scholar] [CrossRef] [PubMed]
- N, Y.; Hong, S.H. An empirical analysis on value relevance of corporate social responsibility activities by firm size. Korean Account. J. 2011, 20, 125–160. [Google Scholar]
- Cho, S. J.; Chung, C. Y.; Young, J. Study on the Relationship between CSR and Financial Performance. Sustainability. 2019, 11, 343. [Google Scholar] [CrossRef]
- Cheng, B.; Ioannou, I.; Serafeim, G. Corporate social responsibility and access to finance. Strateg. Manag. J. 2014, 35, 1–23. [Google Scholar] [CrossRef]
- Campbell, J. L. Why would corporations behave in socially responsible ways? An institutional theory of corporate social responsibility. Acad. Manage. Rev. 2007, 32, 946–967. [Google Scholar] [CrossRef]
- Pava, M. L.; Krausz, J. The association between corporate social-responsibility and financial performance: The paradox of social cost. J. bus. Ethics. 1996, 15, 321–357. [Google Scholar] [CrossRef]
- Baker, S. R.; Bloom, N.; Davis, S. J. Measuring economic policy uncertainty. Q. J. Econ. 2016, 131, 1593–1636, https://www.jstor.org/stable/20159168. [Google Scholar] [CrossRef]
- Pan, X.; Sha, J.; Zhang, H.; Ke, W. Relationship between corporate social responsibility and financial performance in the mineral Industry: Evidence from Chinese mineral firms. Sustainability. 2014, 6, 4077–4101. [Google Scholar] [CrossRef]
- Yang, M.; Bento, P.; Akbar, A. Does CSR influence firm performance indicators? Evidence from Chinese pharmaceutical enterprises. Sustainability, 2019, 11, 5656. [Google Scholar] [CrossRef]
- Pástor, Ľ.; Veronesi, P. Political uncertainty and risk premia. J. Financ. Econ. 2013, 110, 520–545. [Google Scholar] [CrossRef]
- Davis, S. J.; Liu, D.; Sheng, X. S. Economic policy uncertainty in China since 1949: The view from mainland newspapers. Working Paper, 2019, 1-35. 2019. [Google Scholar]
- Cho, S. B. Economic policy uncertainty and corporate cash holdings in Korea. J. Financ. Knowl. Stud. 2020, 18, 53–80, https://kiss.kstudy.com/Detail/Ar?key=3852644. [Google Scholar] [CrossRef]
- Antonakakis, N.; Chatziantoniou, I.; Filis, G. Dynamic co-movements of stock market returns, implied volatility and policy uncertainty. Econ. Lett. 2013, 120, 87–92. [Google Scholar] [CrossRef]
- Kang, W.; Ratti, R. A. Oil shocks, policy uncertainty and stock market return. J. Int. Financ. Mark. Inst. Money. 2013, 26, 305–318. [Google Scholar] [CrossRef]
- Dhole, S.; Liu, L.; Lobo, G. J. Mishra, S. Economic policy uncertainty and financial statement comparability. J. Account. Public Policy, 2021, 40, 106800. [Google Scholar] [CrossRef]
- Heo, M. O.; Chung, K. H. A study on relationship between CSR performance and corporate value: Focus on mediation effect of corporate reputation. J. Indus. Econ. Bus. 2010, 23, 749–771, https://www.dbpia.co.kr/pdf/pdfView.do?nodeId=NODE01639604. [Google Scholar]
- Kim, J. H. A study on the effect on corporate social responsibility of the Chinese companies on firm value. J. Econ. Stud. 2021, 39, 155–174, https://scholar.kyobobook.co.kr/article/detail/4010028363599. [Google Scholar] [CrossRef]
- Choi, H. J.; Moon, D. C. The relationship between corporate social responsibilities and accounting transparency. Korean Account. Rev. 2013, 38, 135–171, https://www.dbpia.co.kr/journal/articleDetail?nodeId=NODE10844559. [Google Scholar]
- Martínez-Ferrero, J.; Garcia-Sanchez, I. M.; Cuadrado-Ballesteros, B. Effect of financial reporting quality on sustainability information disclosure. Corp. Soc. Responsib. Environ. Manag. 2015, 22, 45–64. [Google Scholar] [CrossRef]
- Chahine, S.; Daher, M.; Saade, S. Doing good in periods of high uncertainty: Economic policy uncertainty, corporate social responsibility, and analyst forecast error. J. Financial Stab. 2021, 56, 100919. [Google Scholar] [CrossRef]
- Dixit, A. K.; Pindyck, R. S. Investment under Uncertainty. Princeton University Press. 1994. https://press.princeton. 9780. [Google Scholar]
- Freeman, R. E. Stakeholder management: Framework and philosophy. Springer Link, 1984. https://link.springer.com/chapter/10. 1007. [Google Scholar]
- Kim, Y. T.; Park, M. S.; Wier, B. Is earnings quality associated with corporate social responsibility? Account. Rev. 2012, 87, 761–796. [Google Scholar] [CrossRef]
- Chung, K. H.; Pruitt, S. W. A simple approximation of Tobin's q. Financ. Manag. 1994, 70–74. [Google Scholar] [CrossRef]
- Liu, L.; Zhang, T. Economic policy uncertainty and stock market volatility. Finance Res. Lett. 2015, 15, 99–105. [Google Scholar] [CrossRef]
- Zhong, M.; Xu, R.; Liao, X.; Zhang, S. Do CSR ratings converge in China? A comparison between RKS and Hexun scores. Sustainability, 2019, 11, 3921. [Google Scholar] [CrossRef]

Table 1.
Sample distribution by year.
| Year | Number | Percentage (%) | Cumulative percentage (%) |
|---|---|---|---|
| 2010 | 1,355 | 5.23 | 5.23 |
| 2011 | 1,700 | 6.56 | 11.79 |
| 2012 | 1,957 | 7.55 | 19.34 |
| 2013 | 2,078 | 8.02 | 27.36 |
| 2014 | 2,061 | 7.95 | 35.31 |
| 2015 | 2,142 | 8.26 | 43.57 |
| 2016 | 2,351 | 9.07 | 52.64 |
| 2017 | 2,649 | 10.22 | 62.86 |
| 2018 | 3,121 | 12.04 | 74.9 |
| 2019 | 3,193 | 12.32 | 87.22 |
| 2020 | 3,310 | 12.78 | 100 |
| Total | 5,178 | 100 | 100 |
Table 2.
Sample distribution by industry.
| Industry | Number | Percentage (%) | Cumulative percentage (%) |
|---|---|---|---|
| Agriculture, Foresty, and Fishing | 338 | 1.30 | 1.30 |
| Mining | 616 | 2.38 | 3.68 |
| Manufacturing | 16,718 | 64.51 | 68.19 |
| Power, Heat, and Gas Supply | 892 | 3.44 | 71.63 |
| Construction | 712 | 2.75 | 74.38 |
| Wholesale and Retail | 1,380 | 5.32 | 79.70 |
| Transportation | 854 | 3.30 | 83.00 |
| Accommodation and Food | 80 | 0.31 | 83.31 |
| Information Transmission and Software Information Technology Service | 1,691 | 6.52 | 89.83 |
| Real Estate | 1,112 | 4.29 | 94.12 |
| Rental and Business Service | 294 | 1.13 | 95.25 |
| Research and Technology Service | 243 | 0.94 | 96.19 |
| Repair, Environmental, and Public Facilities Management | 311 | 1.20 | 97.39 |
| Education and Other Service | 46 | 0.18 | 97.57 |
| Hygiene and Social Work | 61 | 0.24 | 97.81 |
| Culture, Sports, and Entertainment | 354 | 1.37 | 99.18 |
| Other | 215 | 0.83 | 100 |
| Total | 25,917 | 100 | 100 |
Table 3.
Descriptive statistics (N=25,917).
| Variable | Mean | Std. | Min | Median | Max |
|---|---|---|---|---|---|
| TQ | 2.018 | 1.261 | 0.861 | 1.607 | 8.197 |
| EPU | 3.876 | 2.480 | 0.989 | 3.639 | 7.919 |
| CSR | 24.387 | 15.551 | –3.260 | 22.130 | 74.370 |
| SIZE | 22.225 | 1.289 | 19.982 | 22.038 | 26.231 |
| LEV | 0.425 | 0.203 | 0.054 | 0.420 | 0.867 |
| ROE | 0.061 | 0.119 | –0.623 | 0.069 | 0.305 |
| GROW | 0.172 | 0.394 | –0.531 | 0.108 | 2.475 |
| AGE | 2.787 | 0.381 | 1.386 | 2.833 | 3.466 |
| FOR | 0.007 | 0.039 | 0.000 | 0.000 | 0.300 |
| OCF | 0.048 | 0.068 | –0.150 | 0.047 | 0.239 |
| TOP | 58.580 | 15.023 | 23.470 | 59.550 | 90.280 |
| DEP | 0.381 | 0.073 | 0.250 | 0.364 | 0.600 |
| SAME | 0.263 | 0.441 | 0.000 | 0.000 | 1.000 |
| GOV | 0.379 | 0.485 | 0.000 | 0.000 | 1.000 |
| Note: See Abbreviations for variable definitions. | |||||
Table 4.
Pearson correlations (N=25,917).
| Variable | TQ | EPU | CSR | SIZE | LEV | ROE | GROW | AGE | FOR | OCF | TOP | DEP | SAME | GOV |
|---|---|---|---|---|---|---|---|---|---|---|---|---|---|---|
| TQ | 1 | |||||||||||||
| EPU | –0.07 | 1 | ||||||||||||
| *** | ||||||||||||||
| CSR | –0.04 | –0.23 | 1 | |||||||||||
| *** | *** | |||||||||||||
| SIZE | –0.39 | 0.10 | 0.25 | 1 | ||||||||||
| *** | *** | *** | ||||||||||||
| LEV | –0.29 | –0.03 | –0.01 | 0.53 | 1 | |||||||||
| *** | *** | *** | ||||||||||||
| ROE | 0.09 | –0.07 | 0.45 | 0.10 | –0.15 | 1 | ||||||||
| *** | *** | *** | *** | *** | ||||||||||
| GROW | 0.04 | –0.09 | 0.10 | 0.03 | 0.04 | 0.24 | 1 | |||||||
| *** | *** | *** | *** | *** | *** | |||||||||
| AGE | –0.03 | 0.36 | –0.09 | 0.17 | 0.17 | –0.05 | –0.08 | 1 | ||||||
| *** | *** | *** | *** | *** | *** | *** | ||||||||
| FOR | –0.03 | –0.03 | 0.02 | –0.05 | –0.07 | 0.05 | 0.03 | –0.08 | 1 | |||||
| *** | *** | *** | *** | *** | *** | *** | *** | |||||||
| OCF | 0.13 | 0.11 | 0.17 | 0.05 | –0.17 | 0.29 | 0.01 | 0.03 | 0.04 | 1 | ||||
| *** | *** | *** | *** | *** | *** | ** | *** | *** | ||||||
| TOP | –0.29 | 0.01 | 0.16 | 0.14 | –0.08 | 0.20 | 0.10 | –0.19 | 0.17 | 0.12 | 1 | |||
| *** | * | *** | *** | *** | *** | *** | *** | *** | *** | |||||
| DEP | 0.06 | –0.00 | 0.01 | –0.04 | –0.06 | 0.02 | –0.00 | –0.06 | 0.01 | 0.01 | 0.04 | 1 | ||
| *** | *** | *** | *** | *** | *** | |||||||||
| SAME | 0.09 | 0.07 | –0.06 | –0.18 | –0.14 | 0.01 | 0.03 | –0.09 | 0.04 | –0.00 | 0.03 | 0.10 | 1 | |
| *** | *** | *** | *** | *** | *** | *** | *** | *** | *** | |||||
| GOV | –0.14 | –0.11 | 0.13 | 0.35 | 0.30 | –0.02 | –0.07 | 0.17 | –0.10 | –0.01 | –0.04 | –0.14 | –0.30 | 1 |
| *** | *** | *** | *** | *** | *** | *** | *** | *** | ** | *** | *** | *** | ||
| Notes: This table presents Pearson correlations. . ***, **, and * represent significance at the 0.01, 0.05, and 0.1 level, respectively. See Abbreviations for variable definitions. | ||||||||||||||
Table 5.
The relationship between EPU and firm value (N=25,917).
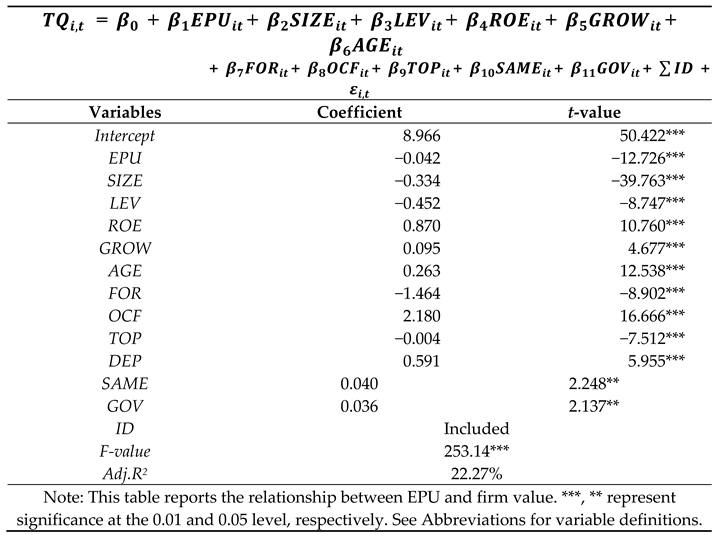
Table 6.
The effect of CSR on the relationship between EPU and firm value (N=25,917).
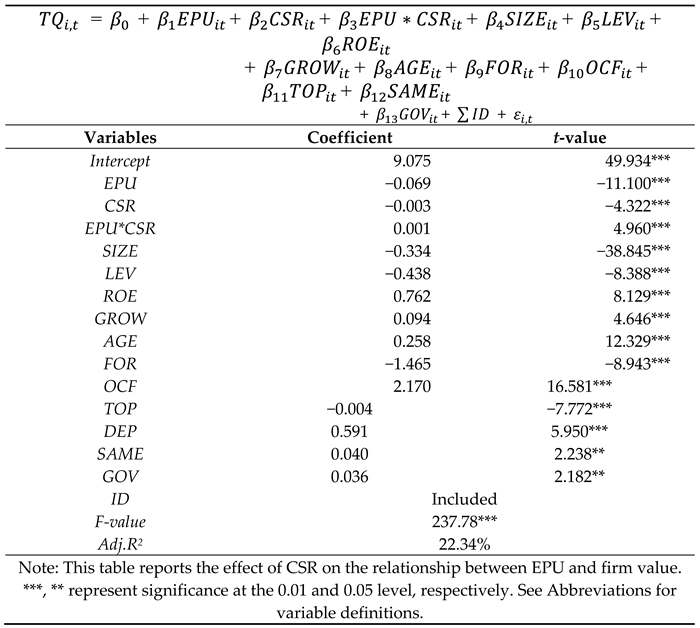
Table 7.
The relationship between EPU and firm value by the level of CSR activities.
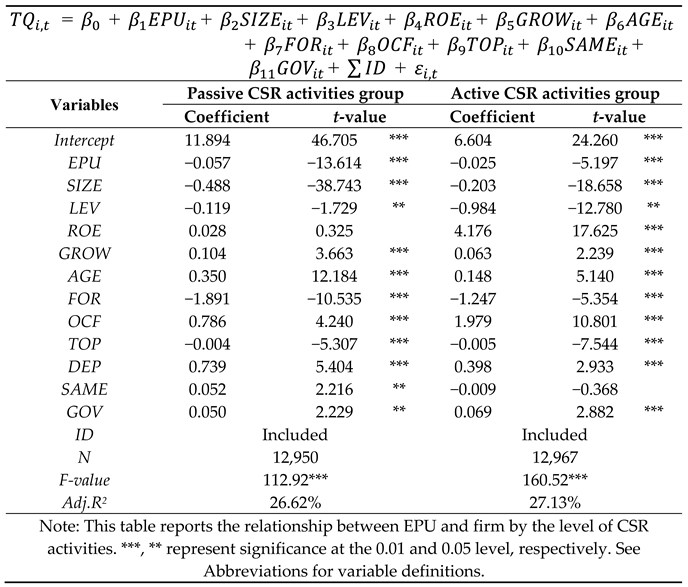
Table 8.
The results of re-testing H1 and H2 by applying the lag model.
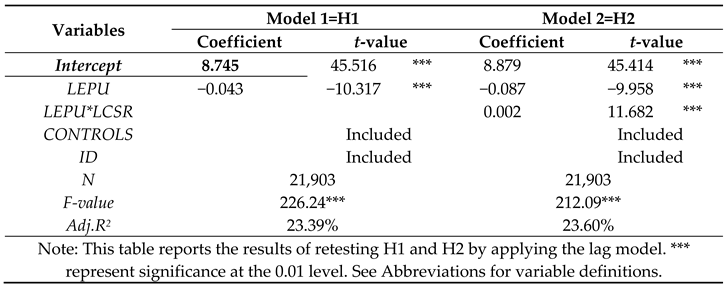
Table 9.
The results of re-testing H1 and H2 using alternative EPU measures.
Disclaimer/Publisher’s Note: The statements, opinions and data contained in all publications are solely those of the individual author(s) and contributor(s) and not of MDPI and/or the editor(s). MDPI and/or the editor(s) disclaim responsibility for any injury to people or property resulting from any ideas, methods, instructions or products referred to in the content. |
© 2024 by the authors. Licensee MDPI, Basel, Switzerland. This article is an open access article distributed under the terms and conditions of the Creative Commons Attribution (CC BY) license (http://creativecommons.org/licenses/by/4.0/).
Copyright: This open access article is published under a Creative Commons CC BY 4.0 license, which permit the free download, distribution, and reuse, provided that the author and preprint are cited in any reuse.


