Submitted:
24 January 2024
Posted:
25 January 2024
You are already at the latest version
Abstract
Background and Aims: The present study analyzed retrospectively the association between socioeconomic deprivation and graft and patient survival in a cohort of 2,568 adult recipients of a liver transplant between 1996 and 2022.
Materials and methods: The primary exposure was a nationally validated socioeconomic deprivation index (DI) at census block level and ranking from 1-5, with higher ranks indicating more significant socioeconomic deprivation.
Results: At a median (IQR) follow-up of 144.8 (204) months, the overall patient and graft survival rates were 92% and 90.4% at 1 year, 78.4% and 72.2% at 5 years, and 58% and 56.7% at 10 years. Recipients with a DI rank above the median (i.e., more deprived) had 1, 5, and 10-year patient and graft survival rates of 91% and 89.5%, 70.4% and 68.4%, 48% and 46.7%, respectively, versus 92% and 90.4%, 78.4% and 72.2%, and 58% and 56.7% for less deprived patients (log-rank p<0.001). More deprived patients had a higher risk of death (p<0.0001), hypertension (p<0.0001), obesity (p=0.02), diabetes mellitus (p=0.02), graft rejection (p<0.0001), chronic kidney dysfunction (p<0.0001), major cardiovascular events (p<0.0001) and de novo malignancies (p<0.0001) than less deprived recipients. The factors associated with the survival probability were younger donor and recipient ages (p=0.03 and 0.02, respectively), female recipient sex (p=0.04), absence of HCV (p<0.01), absence of HCC (p=0.02), absence of DM at transplantation (p=0.03) and 1 year (p=0.01), lower DI (p=0.02), lower MELD (0.02), shorter CIT (p=0.03), TAC (p=0.01), and EVR in the immunosuppressive regimen (p=0.02).
Conclusions: Patients from more deprived areas have a higher risk of death after liver transplantation. Pre- and post-transplant socioeconomic risk profiling is warranted to better tailor care to patient’s needs and expectations.
Keywords:
liver transplant
; poverty
; inequalities
; healthcare
; results
Introduction
Liver transplantation (LT) outcome depends on a complex interplay of surgical, medical, and socioeconomic factors (1). However, the impact of social determinants of healthcare on LT has not been fully explored, though their role in other medical and surgical fields has been largely investigated (2). Understanding the impact of socio-economic deprivation (SED) on health outcomes is an increasingly popular topic of research (3). Several social and environmental factors impact individual health, such as economic stress, limited access to healthcare facilities, poor air quality, high-density housing, insufficient infrastructure maintenance, and a lack of safe outdoor spaces (3-6). After controlling for individual medical variables, SED independently predicts specific poor health outcomes. This indicates that social and environmental barriers beyond the control of individual patients play a significant role in driving health outcomes (7,8)
LT is inequitably available, and disparities impact all its phases, from the referral of liver disease patients to long-term post-transplant care (9-24). In pediatric populations, SED is associated with delayed referral, higher waitlist mortality, and reduced access to living donor transplantation (9). Socially deprived children are twice as much less adherent to immunosuppression and have up to a 32% increased incidence of graft failure (15,16). Similarly, adult patients from deprived areas and racial minorities have a higher risk of not initiating the transplant evaluation, lower rates of waitlisting, and a 6% higher risk of not being transplanted (17). Furthermore, social deprivation is racially segregated, and Black recipients have an increased risk of post-transplant mortality by up to 21% (25). However, the mechanisms linking social deprivation to inferior outcomes are not entirely elucidated, and powered studies are still lacking.
SED is a crucial factor to consider for the best possible outcome of pediatric and adult LT (9,10). If we can understand the extent to which deprivation characteristics are associated with post-transplant outcomes, we can identify actionable objectives for health improvement (9,10). The current study conducted a retrospective analysis to investigate the correlation between neighborhood SED and patient and graft survival in a group of adult transplant recipients who underwent surgery between 1996 and 2022. The goal was to provide a better understanding of the social characteristics of LT candidates and recipients and establish recommendations for enhancing the outcomes of LT procedures.
Materials and Methods
Study Design
This was a retrospective, single-center study at an Italian, National Health System (NHS)-based liver transplant center.
Population
The study included all consecutive adult patients (≥18 years) who received a primary liver transplant from a deceased donor between January 1996 and December 31st, 2022, at our institution. Patients were excluded if they were transplanted with a split liver graft, with a graft from a donor after cardiocirculatory death (DCD), and received a combined transplant.
Data Source
For the current study, we used data from the regional transplant authority (CRT, Centro Regionale Trapianti) and the prospectively maintained recipient database of our institution. The CRT data system includes data on all donors, waitlisted candidates, and transplant recipients and provides regular oversight to the database’s integrity, validity, and transparency. The local ethics committee of the University of Pisa (Prot. 0036349/2020) approved all procedures.
Primary Exposure
Our primary exposure was a validated neighborhood DI derived from the 2011 Italian census data (indice di deprivazione, revisione del 2011, ID 2011_rev) updated in 2020 and calculated at the census block level (26,27). This index measures social and material deprivation at census block level in the presence of 5 conditions: 1) low educational level (as per patients aged 15-60 years with no higher than elementary school diploma); 2) unemployment, if physically active; 3) living in rental property; 4) living in a crowded house (≥5 family members per 100 square meters), and 5) living in a single-parent family with minor children. Each item was scored binomially [0,1], and the cumulative index was calculated as the sum of the 5 items, yielding 5 ranks (scores 0,1=very low; 2=low; 3=moderate; 4=high; 5=very high) with higher ranks [4,5] indicating more deprived living conditions. The DI was analyzed as a dichotomous measure below and above the median and then stratified into ranks.
Primary Outcomes
Our primary outcomes were post-transplant graft failure and patient death. The secondary outcomes were the incidence and severity of hepatic and extrahepatic complications. All these measures were evaluated as time-to-event occurrence.
Cut-Offs and Definitions
Cold ischemia time (CIT) was defined as the time from cross-clamping until removal of the organ from the ice for implantation, and warm ischemia time (WIT) as a time of ischemia during graft implantation. EAD was defined according to Olthoff et al. (28) MELD scores at transplant were recalculated retrospectively based on available laboratory data. HCV recurrence was diagnosed by liver biopsy in the presence of HCV-RNA positivity. HBV infection recurrence was defined as HBsAg (± HBV DNA) reappearance in previously seroconverted patients irrespective of liver function. Renal function was evaluated as an estimated glomerular filtration rate (eGFR) by the Modification of Diet in Renal Disease (MDRD)-4 formula. Chronic kidney dysfunction (CKD) was defined as: a) estimated glomerular filtration rate (eGFR) <60 ml/min/1.73m2 for a post-LT period greater than three months according to Kidney Disease: Improving Global Outcomes (KDIGO) criteria in patients with previous eGFR ≥60ml/min/1.73m2 (29); b) evidence of intrinsic renal disease (proteinuria or kidney disease at ultrasound) (29); or c) presence of end-stage renal disease requiring renal replacement therapy (29). Acute kidney injury (AKI) was defined as doubling of baseline serum creatine (sCr) and/or a ≥50% reduction in eGFR within 14 days (29). Deteriorating renal function was defined as ≥one-grade downward shift in the kidney function category according to the KDIGO classification system (30). A post-transplant diabetes mellitus (PTDM) was defined using the comprehensive American Diabetes Association (ADA) 2018 criteria (31).
Arterial hypertension was defined as the need for medication or blood pressure 140/90 mmHg at two following visits. Dyslipidemia was defined as hypercholesterolemia >220 mg/dL and/or hypertriglyceridemia >200 mg/dL at two following visits. Biliary complications included symptomatic and treated biliary fistula, biliary stones, anastomotic biliary strictures, and posttransplant ischemic-type biliary lesion (ITBL). ITBL was defined as any non-anastomotic stenosis associated with symptoms or signs requiring an endoscopic or surgical procedure without vascular complications.
Statistical Analyses
Descriptive statistics were calculated for donor and recipient demographics and transplant characteristics. We classified patients as ‘low’ and ‘high’ deprivation by dichotomizing the cohort at the median DI rank to analyze the relationship between the DI and graft/patient survival. The appropriate statistical test compared patient characteristics across low and high DI. The relationships between low/high deprivation and time to patient/graft survival were represented with Kaplan-Meier curves. Data were censored at the time of graft failure, death, or the latest follow-up (December 2023). To calculate the adjusted risk ratio (aRR) of post-transplant events across DI ranks, we used the conditional logistic regression approach, as indicated by Breslow et al. (32). We used Cox proportional hazard models to evaluate independent post-transplant graft failure and patient death hazards. In these models, we used the DI as a dichotomous variable (i.e., below and above the median) to quantify the relationship between neighborhood deprivation and graft failure/death. Independent hazards were also adjusted (aHR) for confounders with an acknowledged impact on transplant outcome: donor age; cause of donor death (cardiovascular versus trauma); recipient age indication to transplantation (using HBV as the reference category); model for end-stage liver disease (MELD) score at transplantation; cold ischemia time (CIT); immunosuppression (using a regimen of tacrolimus, mycophenolic acid derivatives, and short-term steroids as the reference category); use of ex-situ machine perfusion (MP) versus static cold storage (SCS); diabetes mellitus at transplant and 1 year, hypertension, chronic kidney dysfunction (CKD), and transplant era (before and after 2014). Owing to an NHS-based practice and the small percentage of non-Caucasian patients transplanted at our center (0.11%, data not shown), no information on patient ethnicity or insurance status was included in the current analysis because they could not be considered indicators of access to healthcare services in our country. Since complications within the first year after transplantation are more likely to be related to surgical/medical management, we performed sensitivity analyses that censored graft failure and death at 1 year after transplant. Graft failure and death hazards were again assessed with Cox proportional hazard models and adjusted as per above.
All statistical analyses and plots were run using the SPSS statistical package version 27.0 (SPSS Inc., Chicago, IL, USA). This study conforms to the ethical guidelines of the 1975 Declaration of Helsinki as reflected in a priori approval by the institution’s human research committee and was conducted according to the Strengthening the Reporting of Observational Studies in Epidemiology (STROBE) guidelines.
Results
Demographics and Clinical Characteristics
A total of 2,568 recipients matched the inclusion criteria (Table 1). Patients were predominantly male (72.5%) of a median (interquartile (IQR)) age of 56 (10) years. The most frequent chronic liver disease was HCV-related cirrhosis (48.7%), followed by HBV (26.0%) and alcohol-related liver disease (10.9%). HCC was present in 40.9% of cases. Median (IQR) lab-MELD at transplant was 12 (6); DM was present in 24.4% of cases, hypertension in 14.9% and CKD in 5.8%. The mean (SD) number of patient-year follow-up visits was 2.08 (0.4), i.e., 83.7% of those scheduled.
Neighborhood Deprivation Index
Patients came from 42 provinces, 17 in the South, 16 in the Center, 9 in the North, and 55 census blocks (Supplementary Table 1). Out of the total cohort of 2,568 patients, 56.7% were from Southern Italy (n=1,457), 41.4% from Central Italy (n=1,063), and only 1.8% from Northern Italy (n=48). As much as 22.3% of patients were from very low (=0,1) and low (=2) deprivation areas, respectively; 30.7% from moderately deprived areas (=3); 16.5% from high deprivation (=4), and 8.3% from very high deprivation areas. The cohort’s median (IQR) neighborhood DI rank was 3 (1). Supplementary Figure 1 shows the DI rank distribution according to the geographic area (South, Central, and North).
Donors and Transplant
Donors were predominantly male (63.2%) with a median (IQR) age of 63 (11) years. Median (IQR) donor ICU stay was 3 (4) days, and cerebrovascular accident (CVA) was the most frequent cause of donor death (75%). Cardiac arrest was reported in 10.9% of all donors. The median (IQR) CIT was 424 min, and machine perfusion (MP) was used in 0.7% of transplants (Table 1).
Causes of Death
At a median (IQR) follow-up of 144.8 (204) months, 810 patients (31.5%) died, and the causes of death are shown in Table 2. Recurrent HCV-related liver dysfunction was the most common cause occurring in 12.4% of patients. This was followed by de novo extrahepatic malignancies (5.0%), HCC recurrence (4.5%), infection (4.4%), and major cardiovascular events (MACE) (3.2%).
Re-Transplantation
During the follow-up period, 156 (6.1%) patients received 2 two transplants. The causes of re-transplantation were: 77 (2.9%) thrombosis/stenosis of the hepatic artery (HAT/HAS); 51 (2.0%) primary non-function (PNF)/early allograft dysfunction (EAD) of the liver graft; 23 (0.9%) cases of ischemic cholangiopathy; 3 (0.1%) cases of HCV recurrence and 2 (0.08%) patients with chronic rejection (Table 2).
Complications
The post-transplant complications of interest are shown in Table 3. Three-hundred-sixty-one (14.0%) patients had one de novo malignancy, and the most frequent were post-transplant lymphoproliferative disease (PTLD) (7.2%), followed by colon (1.7%), kidney (1.5%) and prostate cancer (1.3%).
During the follow-up, various complications were observed in patients: hypertension (61.9%), HCV recurrence (43.8%), biliary complications (22.9%), obesity (18.1%), diabetes (18.0%), CKD (14.7%), and MACE (13.0%). The cumulative incidence of treated and biopsy-proven acute rejection (t/BPAR) was 16.9%. HCC recurred in 14.4% of the 1,052 transplant patients with this indication (i.e., 5.9% of the overall cohort). A total of 1,901 patients (74%) presented >1 complication.
Demographic and Clinical Characteristics According to Di Strata
Table 4 shows the demographic and clinical characteristics of interest at transplantation according to the DI rank strata. To note, DM was numerically more common in patients from deprived areas, while hypertension and HCC were significantly more frequent in these populations.
Complications According to Di Strata
Table 5 illustrates the cumulative incidence of complications according to DI rank strata. When compared with recipients from less deprived areas (DI 1,2), patients with higher DI ranks (4,5) showed higher mortality (aRR=1.5; P<0.0001) with regard to de novo malignancies and MACE; higher incidence of hypertension (aRR=1.38; P<0.0001), obesity (aRR=1.42; P=0.02), DM (aRR=1.42; P=0.02), t/BPAR (aRR=1.8; P<0.0001), CKD (aHR=1.98; P<0.001), de novo malignancies (aRR=1.5; P<0.0001) and MACE (aRR=1.9; P<0.0001).
Patient and Graft Survival
Patient death and re-transplantation were considered graft loss. The actuarial (95% CI) patient survival of the overall study cohort was 90% (84.6%-98.3%), 73% (64.2%-78.6%), and 55% (49.8%-59.9%), at 1, 5, and 10 years, respectively, while the actuarial (95% CI) graft survival was 87.8% (91.6%-97.2%), 67.6% (62.2%-71.5%), 53.3% (49.6%-59.3%) at 1, 5, and 10 years, respectively (Figure 1).
In the group of transplant recipients with a DI rank below the median (i.e., less deprived), the patient and graft survival (95% CI) rates were as follows: 92.0% (85.6%-97.8%) and 90.4% (84.3%-92-4%) at 1 year, 78.4% (68.8%-80.1%) and 72.2% (66.7%-78.9%) at 5 years, and 58.0% (45.4%-62.1%) and 56.7% (43.2%-59.0%) at 10 years. For patients with a DI rank ≥ the median (i.e., more deprived), the survival rates (95% CI) were 91.2% (86.5%-95.4%) and 89.5% (82.1%-92.4%) at 1 year, 70.4% (63.5%-77.6%) and 68.4% (59.3%-78.7%) at 5 years, and 48.0% (40.3%-54.2%) and 46.7% (38.3%-52.1%) at 10 years, respectively (Figure 2). Patient and graft survival was significantly higher for patients from less deprived recipients (log-rank p<0.001).
Predictors of Survival
The univariable analysis showed that the chances of surviving after transplant were higher for recipients of younger grafts (p=0.0009), younger patients (p<0.0001), female patients (p=0.005), those with non-HCV liver disease as the reason for transplantation (p<0.0001), no presence of HCC at transplant (p=0.001), lower laboratory MELD score (p=0.002), lower DI scores (<0.0001), use of anti-IL2R as an induction agent (p<0.0001), TAC as the primary immunosuppressant (p<0.0001), use of EVR (p=0.01), and absence of DM at transplantation (p=0.02) and at 1 year after transplant (p=0.01) (data not shown). The Cox proportional hazards analysis revealed that several independent factors were associated with the survival probability (Table 6). These factors associated with successful liver transplantation include younger donor and recipient ages (p=0.03 and 0.02, respectively), female recipient sex (p=0.04), absence of HCV (p<0.01), absence of HCC (p=0.02), and absence of DM at transplantation (p=0.03) and 1 year (p=0.01), lower DI ranks (p=0.02), lower MELD scores (0.02), shorter CIT (p=0.03), TAC versus CyA (p=0.01), and EVR in the immunosuppressive regimen (p=0.02).
Discussion
There is increasing evidence on how socio-economic factors affect outcomes in pediatric LT (9-16), but information on adult recipients is limited, especially outside the US (17-25). To our knowledge, this is the first study from a European transplant center after the one by Menahem et al. in 2021 which focused only on HCC (22).
According to the literature, SED (socioeconomic deprivation) has a negative impact on all stages of the LT continuum, starting from pre-transplant evaluation to long-term post-transplant care. The socioeconomic status of individuals and communities significantly affects the outcomes of pre-transplant evaluations (17). A recent analysis carried out at a single center found that patients with liver disease who are socially deprived have a higher risk of not being listed for transplantation when compared to patients with higher socioeconomic status (20). The analysis found that socially deprived patients are also at a greater risk of not initiating the evaluation post-referral and dying without initiating the evaluation (20). Patients from social minority groups who live in neighborhoods with low SED are 31% more likely not to be listed for a transplant compared to patients from the same minority group living in neighborhoods with high SED (20). Furthermore, certain indications from deprived areas are less likely to be listed for transplantation. In a recent analysis of the UNOS registry 2008-2019, Cullaro et al. have shown that patients from the most deprived areas are the least likely to be listed for alcohol-related liver disease (OR=0.97, 95% CI=0.95-0.98) and have an increased rate of waitlist mortality (OR=1.1; 95% CI=1.06-1.14) (18).
The information on the impact of SED on the outcome of adult LT recipients is still lacking. Initial surveys (1987-2001) on the influence of neighborhood income, education, and insurance showed that education had a marginal influence on outcomes, and patients with Medicare and Medicaid had lower survival than those with private insurance (33). More recently, in a proportional hazards model analysis, LT recipients with the lowest socioeconomic status have an increased risk of death within 2 years after transplantation (HR=1.17; 95% CI=1.02-1.35) (23). After adjusting for differences in recipient characteristics, donor organ quality, transplant center volume/quality, geographic region, and DSA, being in the lowest SED quartile remained an independent predictor for patient but not graft survival (23). Adjusting for individual hospitals had minimal impact on patient survival hazard ratio, indicating that differences in SED groups did not result from hospital care (23).
SED is also associated with lower post-transplantation health-related quality of life (HR-QoL) (19). Additionally, recipients living in areas of least deprivation were less likely to suffer from anxiety (OR=0.05; 95%CI: 0.00-0.28; P=0.003) or depression (OR=0.13, 95%CI=0.02-0.56; P=0.009) (19). Extensive research has also shown that Black patients have worse outcomes than White patients, including lower graft function (34), inferior graft survival (35), and worse overall survival (36), revealing the role of racial disparities. This disparity has remained consistent over time (i.e., before and after the MELD era) (37) and persists after controlling for patient-level factors, such as socioeconomic status (23) and clinical covariates (34). Recent reports confirm that Black patients have a 21% higher mortality risk than White patients, but no effect modification by transplant center volume was found (38).
Due to the lack of available information from European LT centers and Italy, we designed the current retrospective study using a validated DI at the census block level (26,27). However, SED is a multidimensional construct in constant evolution, and no universal definition or measurement is available. According to widespread consensus, SED is the lack of social and economic resources necessary for a good quality of life (39), which highlights the ability of household resources to match the needs of its members beyond financial insufficiency (40). This ability is determined by the adequacy of income and the additional assets available to the household, such as savings and services, which can be used to achieve the desired standard of living (41). It includes poverty and a lack of access to education, healthcare, housing, and other essential needs (42). SED components are constantly changing, and items are being added according to location (i.e., Europe versus the US versus Asia), communities (i.e., neighborhood), culture, study designs, and objectives (42.43). Pursuing measurable SED indicators is an ongoing effort. It forms the foundation of the 2030 United Nations Member States agenda for Sustainable Development, emphasizing the significance of enhancing social protection and inclusion globally (44).
In agreement with previous observations, the current study confirms that patients from more deprived areas have an overall 14% higher risk of death than those from less deprived regions. Those originating from regions of the highest deprivation ranks (4,5) have a 50% higher RR of post-transplant death concerning de novo malignancies and MACE. Furthermore, recipients from more deprived areas show a higher incidence of cardiovascular, metabolic, and renal complications, as well as a higher risk of graft rejection. These risks were confirmed after adjustment for pre- and post-transplant demographic and clinical risk factors and immunosuppression. However, the study fails to explain the mechanisms leading to worse outcomes and a higher incidence of extra-hepatic complications in LT recipients. The observation that patients from more deprived areas were less likely to attend the scheduled follow-up visits must be interpreted with care since it may be accounted for by the diversity of local referral mechanisms and changing referral patterns over an extended observation period. Similarly, since deprivation appears to be geographically segregated in southern areas, the higher incidence of post-transplant malignancies may also be due to exposure to environmental pollutants or dietary contaminants. The current retrospective study could not explore these factors and call for appropriate investigations. Similarly, the incidence of diabetes mellitus and cardiovascular events could not be checked against lifestyle habits (i.e., smoking) and exercise nor the presence of co-existing morbidities impairing physical activity.
A notable limitation of the current study is that more than half (56.7%) of the cohort’s population comes from Southern Italy, whose DI is significantly higher than those of central and northern regions. A North-to-South deprivation gradient is acknowledged in our country, and it would be interesting to match our data at a national level to identify regional variations and future areas of intervention.
In conclusion, based on our data, the outcomes of LT are also dependent on the neighborhood deprivation of the areas where recipients live. We advocate incorporating the patient socio-economic profile to tailor appropriate interventions to pre- and post-transplant care and improve the long-term results of LT.
Supplementary Materials
The following supporting information can be downloaded at the website of this paper posted on Preprints.org.
Authors’ contributions
PDS: study conceptualization; data retrieval; manuscript writing. JB, CM: data retrieval and analysis. JD: data retrieval; investigation. DC: investigation; resources; data retrieval. QL: data analysis, draft evaluation, and editing. PM: draft evaluation and validation.
Financial support
None.
Acknowledgments
The authors owe a deep debt of gratitude to the nurse staff of the Coordinamento trapianti di fegato, University of Pisa Medical School Hospital.
Conflicts of interest
PDS has served as an advisory board member for Novartis, Astellas, and Chiesi.
Abbreviations
| ADA | American Diabetes Association |
| aHR | adjusted Hazard Ratio |
| AKI | acute kidney injury |
| CIT | cold ischemia time |
| CKD | chronic kidney dysfunction |
| DCD | donor after cardiocirculatory death |
| DI | deprivation index |
| DM | diabetes mellitus |
| EAD | early allograft dysfunction |
| eGFR | estimated GFR |
| GFR | glomerular filtration rate |
| HBsAg | Hepatitis B virus surface antigen |
| HBV | hepatitis B virus |
| HCV | hepatitis C virus |
| HR | hazard ratio |
| IQR | interquartile range |
| ITBL | ischemia-type biliary lesion |
| KIDIGO | Kidney Disease: Improving Global Outcomes |
| LT | liver transplantation |
| MACE | major cardiovascular event |
| MDRD | modification of diet in renal disease |
| MELD | model for end-stage liver disease |
| MP | machine perfusion |
| PTDM | post-transplant diabetes mellitus |
| RR | relative risk |
| SED | socio-economic deprivation |
| STROBE | Strengthening the Reporting of Observational Studies in Epidemiology |
References
- Zarrinpar, A., Busuttil, R. Liver transplantation: past, present, and future. Nat Rev Gastroenterol Hepatol 2013;10:434-440. [CrossRef]
- Yao L, Robert SA. The contributions of race, individual socioeconomic status, and neighborhood socioeconomic context on the self-rated health trajectories and mortality of older adults. Res Aging 2008;30(2):251-273. [CrossRef]
- Gaskin DJ, Roberts ET, Chan KS, McCleary R, Buttorff C, Delarmente BA. No man is an island: the impact of neighborhood disadvantage on mortality. Int J Environ Res Public Health 2019;16(7):1265. [CrossRef]
- Kirby JB, Kaneda T. Neighborhood socioeconomic disadvantage and access to health care. J Health Soc Behav 2005;46(1):15-31. [CrossRef]
- Ross CE, Mirowsky J. Neighborhood disadvantage, disorder, and health. J Health Soc Behav 2001;42(3):258-276.
- Wing JJ, Sánchez BN, Adar SD, Meurer WJ, Morgenstern LB, Smith MA, et al. Synergism of short-term air pollution exposures and neighborhood disadvantage on initial stroke severity. Stroke. 2017;48(11):3126-9. [CrossRef]
- Lusk JB, Hoffman MN, Clark AG, Bae J, Corsino L, Hammill BG. Neighborhood socioeconomic deprivation and 30-day mortality and readmission for patients admitted for diabetes management. Diabetes Care 2022;45(11):e169-170. [CrossRef]
- Lusk JB, Hoffman MN, Clark AG, Bae J, Luedke MW, Hammill BG. Association between neighborhood socioeconomic status and 30-day mortality and readmission for patients with common neurologic conditions. Neurology 2023. [CrossRef]
- Ebel NH, Lai JC, Bucuvalas JC, Wadhwani SI. A review of racial, socioeconomic, and geographic disparities in pediatric liver transplantation. Liver Transpl 2022;28(9):1520-1528. [CrossRef]
- Shifman HP, Huang CY, Beck AF, Bucuvalas J, Perito ER, Hsu EK, Ebel NH, Lai JC, Wadhwani SI. Association of state Medicaid expansion policies with pediatric liver transplant outcomes. Am J Transplant 2023 Sep 28:S1600-6135(23)00719-0. [CrossRef]
- Yalung JE, Shifman HP, Rasnick Manning E, Beck A, Bucuvalas J, Lai JC, Wadhwani SI. Ambient air pollution is associated with graft failure/death in pediatric liver transplant recipients. Am J Transplant 2023 Oct 26:S1600-6135(23)00817-1. [CrossRef]
- Wadhwani SI, Ge J, Gottlieb L, Lyles C, Beck AF, Bucuvalas J, Neuhaus J, Kotagal U, Lai JC. Racial/ethnic disparities in wait-list outcomes are only partly explained by socioeconomic deprivation among children awaiting liver transplantation. Hepatology 2022;75(1):115-124. [CrossRef]
- Wadhwani SI, Huang CY, Gottlieb L, Beck AF, Bucuvalas J, Kotagal U, Lyles C, Lai JC. Center variation in long-term outcomes for socioeconomically deprived children. Am J Transplant 2021;21(9):3123-3132. [CrossRef]
- Wadhwani SI, Gottlieb L, Bucuvalas JC, Lyles C, Lai JC. Addressing social adversity to improve outcomes for children after liver transplant. Hepatology 2021;74(5):2824-2830. Epub 2021 Oct 4. [CrossRef]
- Wadhwani SI, Beck AF, Bucuvalas J, Gottlieb L, Kotagal U, Lai JC. Neighborhood socioeconomic deprivation is associated with worse patient and graft survival following pediatric liver transplantation. Am J Transplant 2020;20(6):1597-1605. [CrossRef]
- Wadhwani SI, Bucuvalas JC, Brokamp C, Anand R, Gupta A, Taylor S, Shemesh E, Beck AF. Association between neighborhood-level socioeconomic deprivation and the medication level variability for children following liver transplantation. Transplantation 2020;104(11):2346-2353. [CrossRef]
- Yilma M, Cogan R, Shui AM, Neuhaus JM, Light C, Braun H, Mehta N, Hirose R. Community-level social vulnerability and individual socioeconomic status on liver transplant referral outcome. Hepatol Commun 2023;7(7):e00196. eCollection 2023 Jul 1. [CrossRef]
- Cullaro G, Ge J, Lee BP, Lai JC, Wadhwani SI. Association between neighborhood-based material deprivation and liver transplant waitlist registrants demographics and mortality. Clin Transplant 2023 Nov 8:e15189. Online ahead of print. [CrossRef]
- Sgrò A, Cambridge WA, McLean KA, Drake TM, Camilleri-Brennan J, Knight SR, Pius R, Wu DA, Wigmore SJ, Harrison EM. Is socioeconomic deprivation associated with worse quality of life, anxiety and depression in liver transplant recipients? A cross-sectional study in a national transplantation programme. BMJ Open 2023;13(8):e070422.
- Strauss AT, Moughames E, Jackson JW, Malinsky D, Segev DL, Hamilton JP, Garonzik-Wang J, Gurakar A, Cameron A, Dean L, Klein E, Levin S, Purnell TS. Critical interactions between race and the highly granular area deprivation index in liver transplant evaluation. Clin Transplant 2023 May;37(5):e14938. Epub 2023 Feb 27. [CrossRef]
- Henson JB, Chan NW, Wilder JM, Muir AJ, McElroy LM. Characterization of social determinants of health of a liver transplant referral population. Liver Transpl 2023;29(11):1161-1171. [CrossRef]
- Menahem B, Dejardin O, Alves A, Launay L, Lubrano J, Duvoux C, Laurent A, Launoy AG; French Liver Transplantation Group. Socioeconomic deprivation does not impact liver transplantation outcome for HCC: A survival analysis from a national database. Transplantation 2021;105(5):1061-1068. [CrossRef]
- Quillin RC III, Wilson GC, Wima K, Hohmann SF, Sutton JM, Shaw JJ, et al. Neighborhood level effects of socioeconomic status on liver transplant selection and recipient survival. Clin Gastroenterol Hepatol 2014;12:1934-1941. [CrossRef]
- Yoo HY, Thuluvath PJ. Outcome of liver transplantation in adult recipients: influence of neighborhood income, education, and insurance. Liver Transpl 2004;10:235-243. [CrossRef]
- Ross-Driscoll K, Kramer M, Lynch R, Plantiga L, Wedd J, Patzer R. Variation in racial disparities in liver transplant outcomes across transplant centers in the United States. Liver Transpl 2021;27(4):558-567. [CrossRef]
- Caranci N, Biggeri A, Grisotto L, Pacelli B, Spadea T, Costa G. L’indice di deprivazione italiano a livello di sezione di censimento: definizione, descrizione e associazione con la mortalità [The Italian deprivation index at census block level: definition, description and association with general mortality]. Epidemiol Prev 2010;34(4):167-176. [CrossRef]
- Rosano A, Pacelli B, Zengarini N, Costa G, Cislaghi C, Caranci N. Aggiornamento e revisione dell’indice di deprivazione italiano 2011 a livello di sezione di censimento [Update and review of the 2011 Italian deprivation index calculated at the census section level]. Epidemiol Prev 202;44(2-3):162-170.
- Olthoff KM, Kulik L, Samstein B, Kaminski M, Abecassis M, Emond J, Shaked A, Christie JD. Validation of a current definition of early allograft dysfunction in liver transplant recipients and analysis of risk factors. Liver Transpl 2010;16(8):943-949.
- KDIGO Clinical Practice Guideline for Acute Kidney Injury. Kidney International Supplements 2012;2(1):1-141. [CrossRef]
- Tonon M, Rosi S, Gambino CG, Piano S, Calvino V, Romano A, Martini A, Pontisso P, Angeli P. Natural history of acute kidney disease in patients with cirrhosis. J Hepatol 2021;74(3):578-583. [CrossRef]
- Diabetes Standards of Care: ADA guidelines (2018). Available at: http://diabetesed.net/wp-content/uploads/2017/12/2018-ADA-Standards-of-Care.pdf. Accessed Sep, 1st 2023.
- Breslow NE, Day NE, Halvorsen KT, Prentice RL, Sabai C. Estimation of multiple relative risk functions in matched case-control studies. Am J Epidemio 1978;108(4)299-307. [CrossRef]
- Yoo HY, Thuluvath PJ. Outcome of liver transplantation in adult recipients: influence of neighborhood income, education, and insurance. Liver Transpl 2004;10:235-243. [CrossRef]
- Quillin RC III, Wilson GC, Wima K, Hanseman DJ, Sutton JM, Shaw JJ, et al. Independent effect of Black recipient race on short term outcomes after liver transplantation. Surgery 2015;157:774-784. [CrossRef]
- Hong JC, Kosari K, Benjamin E, Duffy JP, Ghobrial RM, Farmer DG, et al. Does race influence outcomes after primary liver transplantation? A 23-year experience with 2,700 patients. J Am Coll Surg 2008;206:1009-1016; discussion 1016-1008. [CrossRef]
- OPTN/SRTR 2016 annual data report: preface. Am J Transplant 2018;18 (suppl 1):1-9.
- Ananthakrishnan AN, Saeian K. Racial differences in liver transplantation outcomes in the MELD era. Am J Gastroenterol 2008;103:901-910. [CrossRef]
- Ross-Driscoll K, Kramer M, Lynch R, Plantiga L, Wedd J, Patzer R. Variation in racial disparities in liver transplant outcomes across transplant centers in the United States. Liver Transpl 2021;27(4):558-567. [CrossRef]
- Townsend P. Poverty in the United Kingdom: A survey of household resources and standards of living. University of California Press, 1979.
- Fabrizi E, Mussida C, Parisi ML. Comparing material and social deprivation indicators: identification of deprived populations. Soc Indic Res 2023;165:999-1020. [CrossRef]
- Alkire S, Foster J. Counting and multidimensional poverty measurement. J Pub Econ 2011;95(7-8):476-487. [CrossRef]
- Fusco A, Guio AC, Marlier E. Building a material deprivation index in a multinational context: lessons from the EU experience: Lessons from the EU experience. In: Berenger V, Bresson F (eds) Poverty and social exclusion around the Mediterranean Sea. Economic studies in inequality, social exclusion, and well-being, vol 9. Springer, Boston, MA. [CrossRef]
- Dhongde S, Haveman R. Multi-dimensional deprivation in the US. Soc Indic Res 2017;133:477-500. [CrossRef]
- United Nations. Transforming our world: The 2030 Agenda for sustainable development. Retrieved January 2nd, 2024 20 from https:://sustainabledevelopment.un.org/post2015/transformingourworld.
Figure 1.
Patient and graft survival in the overall cohort of liver transplant recipients.
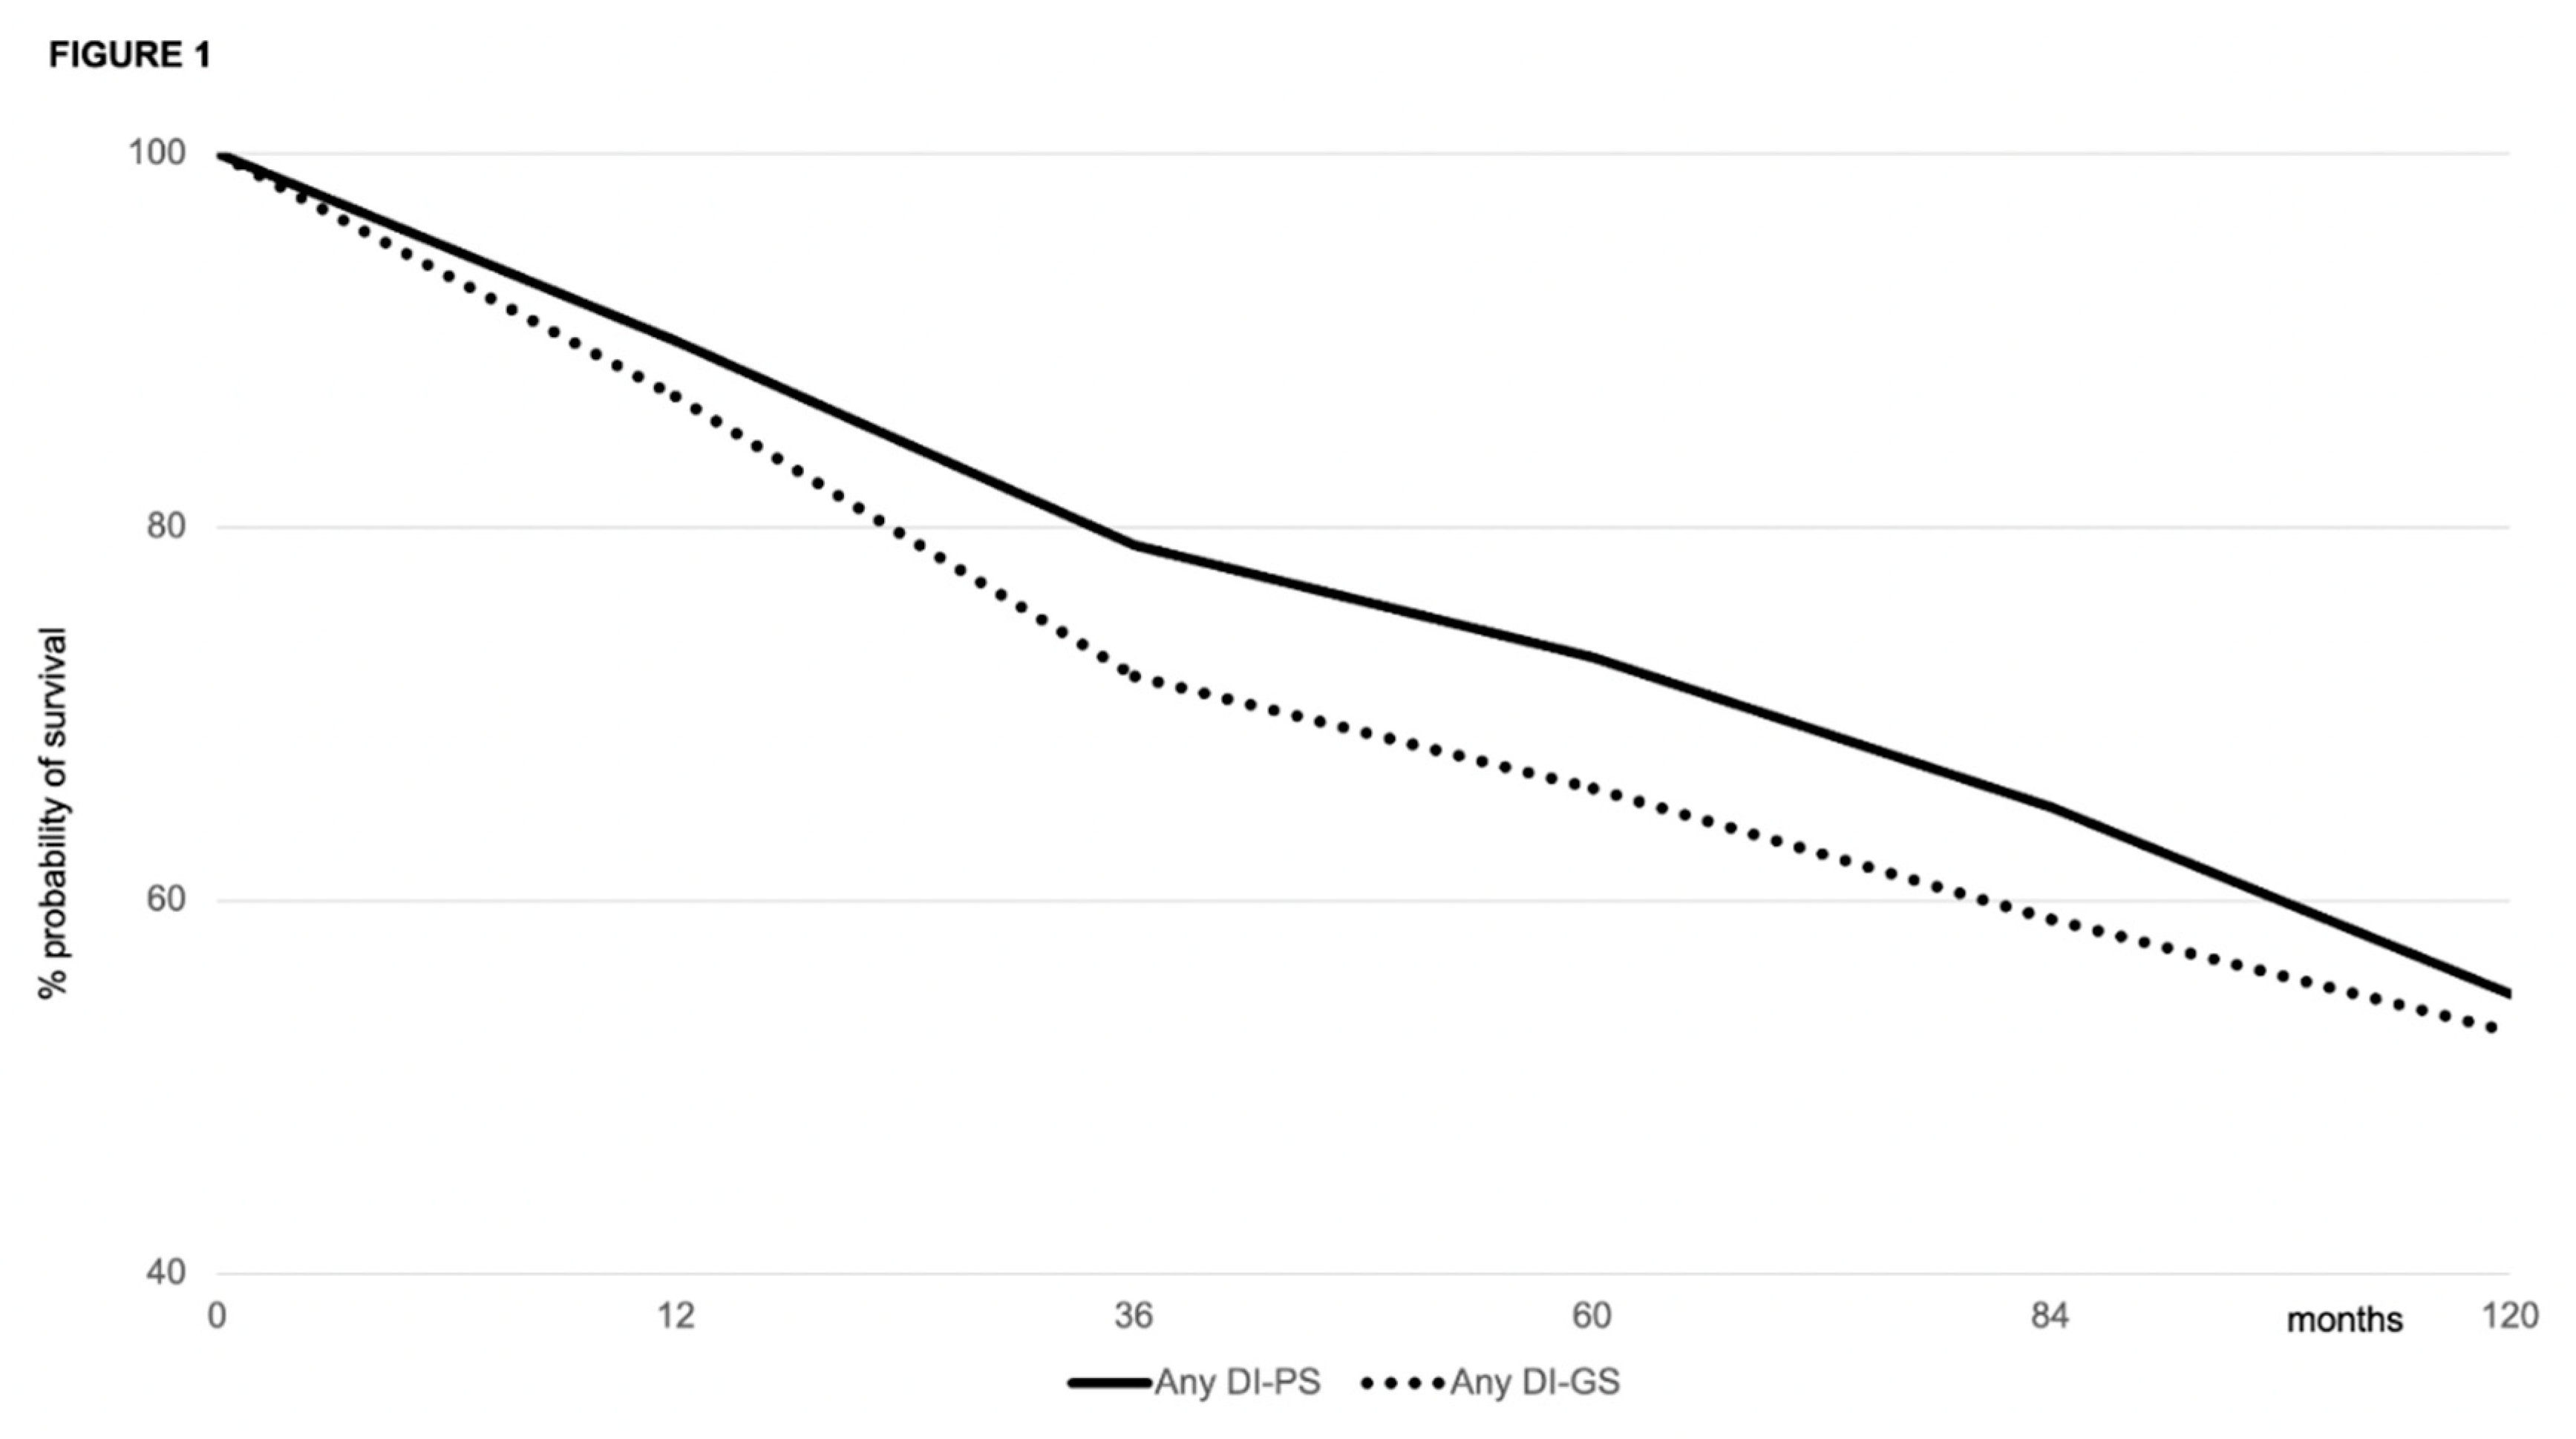
Figure 2.
Patient and graft survival for patients below the median DI rank (i.e., less deprived) versus those above the median DI rank (i.e., more deprived).
Figure 2.
Patient and graft survival for patients below the median DI rank (i.e., less deprived) versus those above the median DI rank (i.e., more deprived).
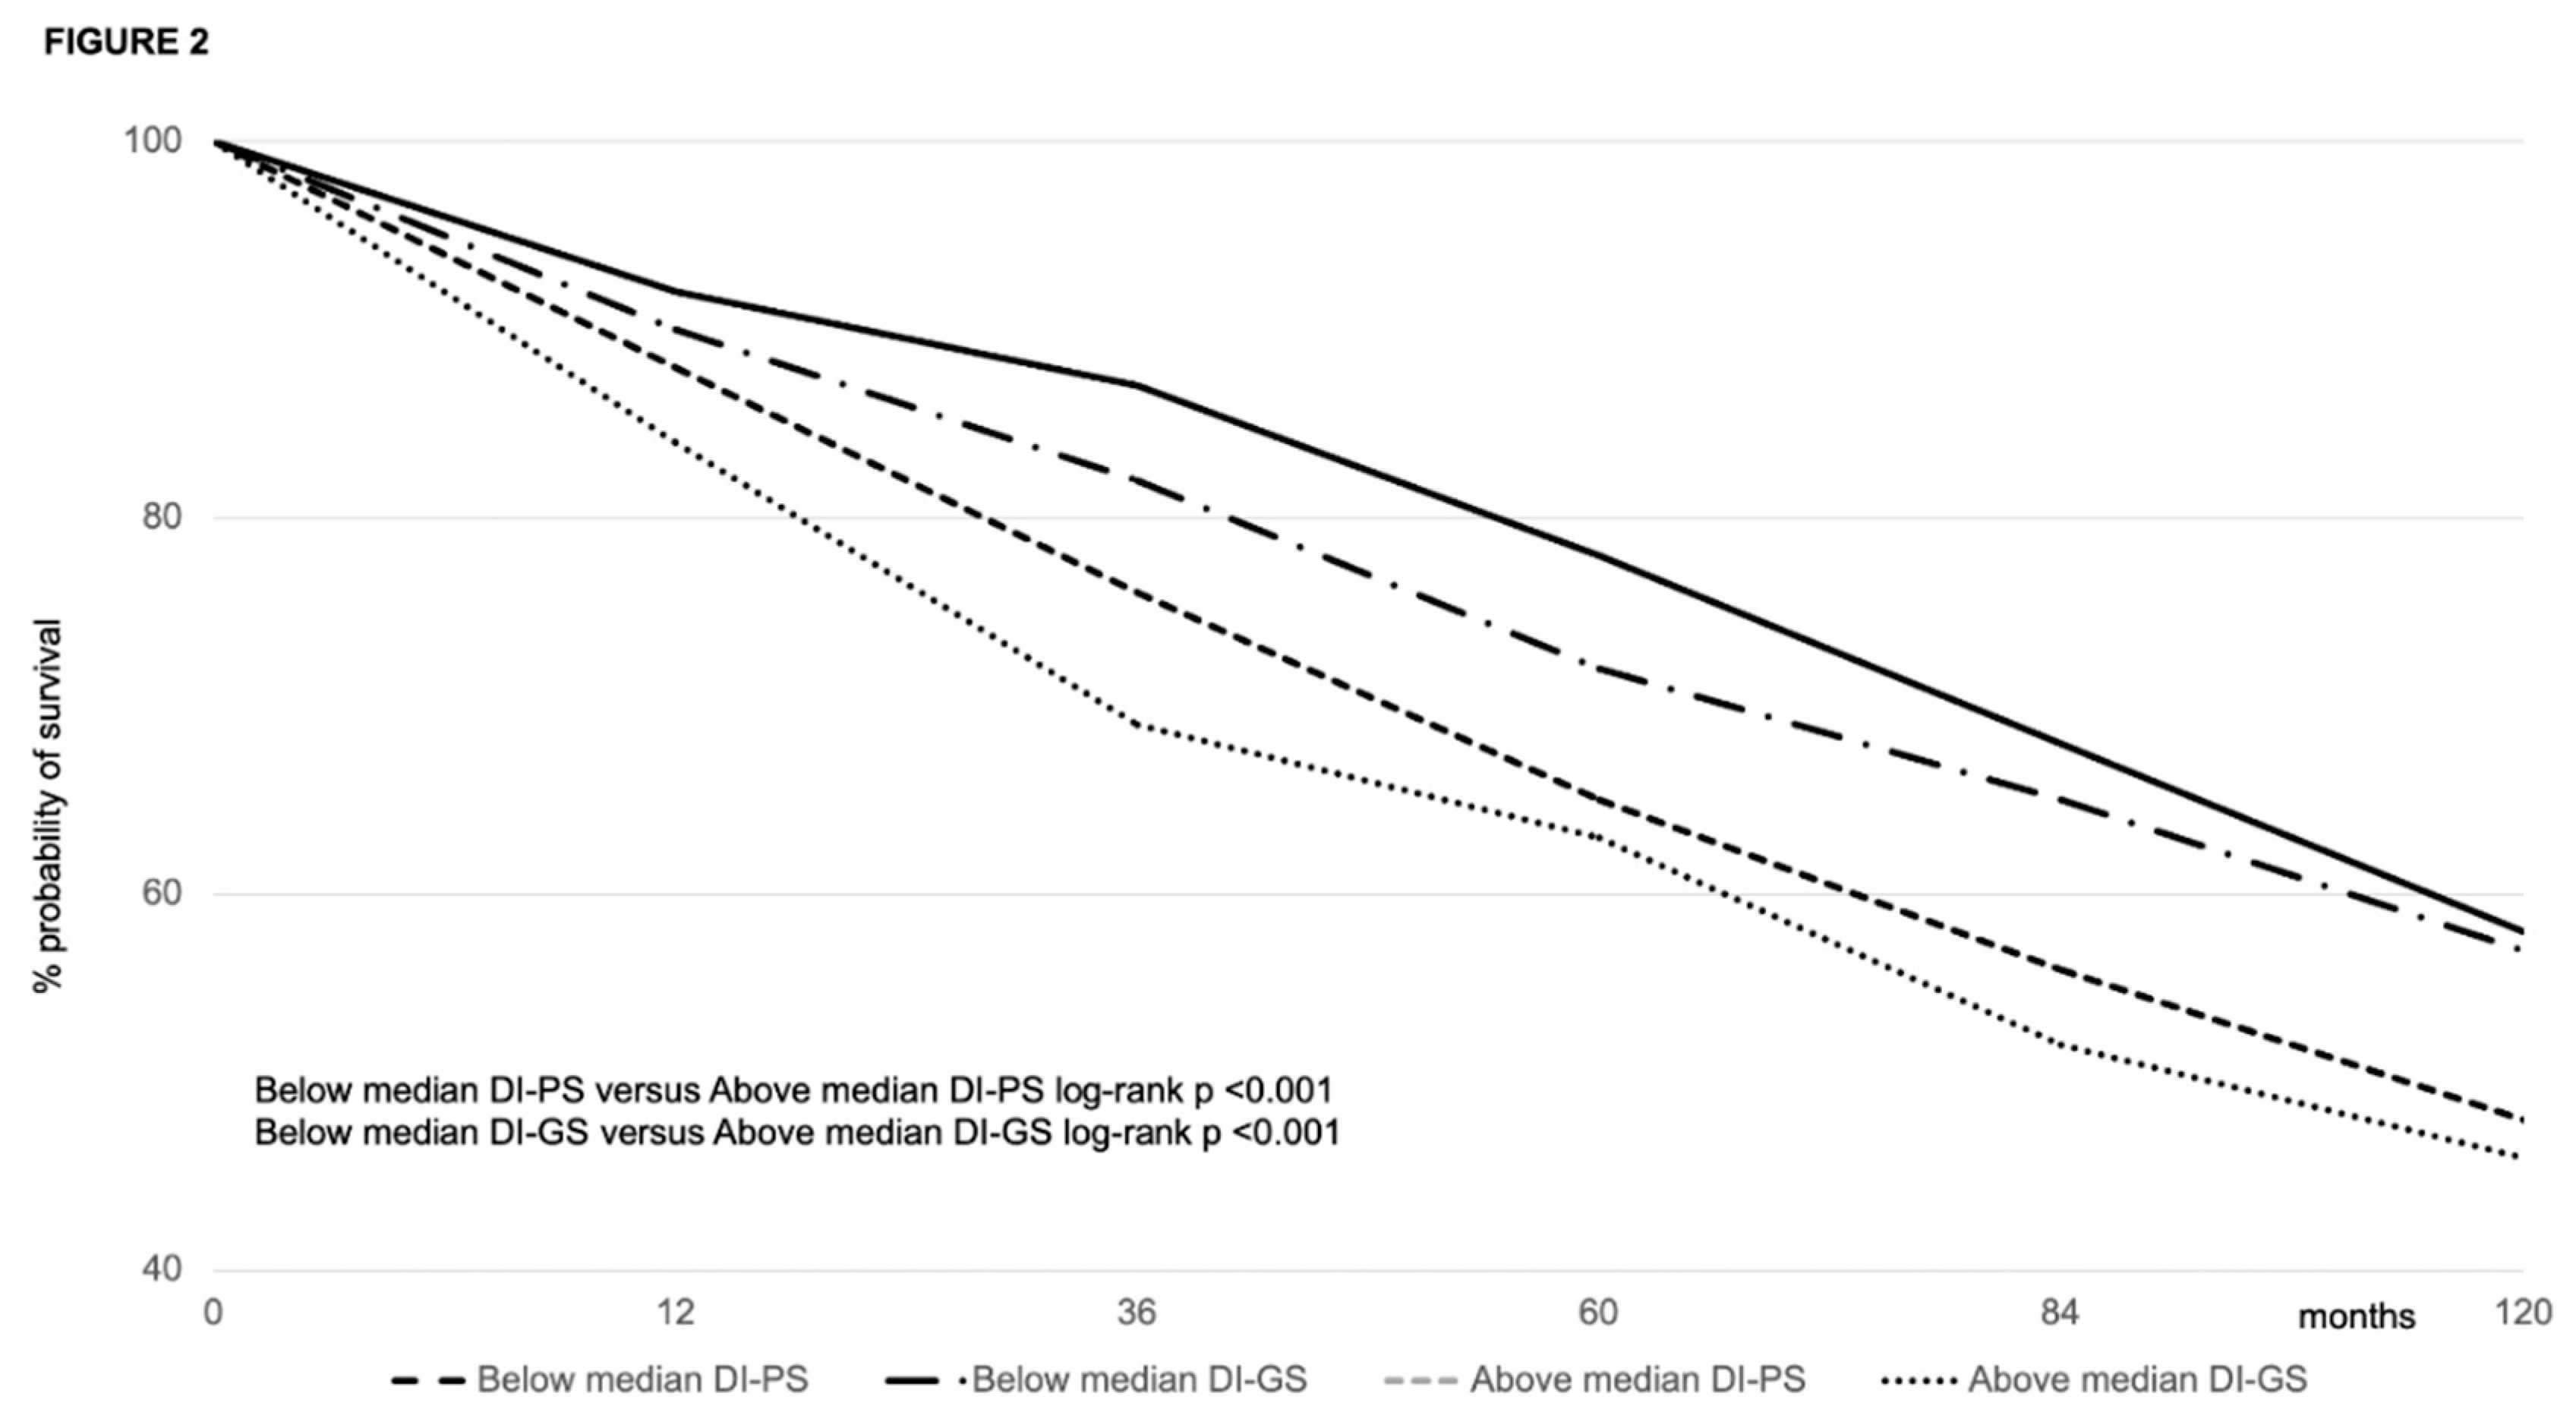

Table 1.
Demographic and clinical characteristics of interest of the study population.
| Variable | Value |
|---|---|
|
RECIPIENT 2,568 | |
| Male sex, n (%) | 1,872 (72.5) |
| Age at transplant (median, IQR), years | 56 (10) |
| Indication to transplant, n (%) HCV HBV (±HDV) HCV-HBV(±HDV) Alcohol MASLD Autoimmune/PSC Other Presence of HCC, n (%) |
1,253 (48.7) 668 (26.0) 95 (3.7) 282 (10.9) 102 (3.9) 133 (5.2) 35 (1.3) 1052 (40.9) |
| Lab-MELD at transplant (median, IQR) | 12 (6) |
| DM at transplant, n (%) | 626 (24.4) |
| CKD at transplant, n (%) | 149 (5.8) |
| Hypertension at transplant, n (%) | 382 (14.9) |
| Neighborhood DI rank, n (%) 1 (very low) 2 (low) 3 (moderate) 4 (high) 5 (very high) Median (IQR) DI rank |
572 (22.3) 572 (22.3) 788 (30.7) 424 (16.5) 212 (8.3) 3 (1) |
|
DONOR 2,568 | |
| Male sex, n (%) | 1,624 (63.2) |
| Age, median (IQR) | 63 (11) |
| ICU stay, median (IQR) days | 3 (4) |
| CVA as cause of death, n (%) |
1,926 (75) |
| Anti-HCV-positive, n (%) | 22 (0.85) |
| Anti-HBc-positive, n (%) | 334 (13.0) |
| Cardiac arrest episodes, n (%) | 282 (10.9) |
| Use of inotropes, n (%) | 2174 (84.7) |
|
TRANSPLANTATION |
2,568 |
| CIT, median (IQR) (min) | 424 (89) |
| MP, n (%) | 19 (0.7) |
| Re-transplantation, n (%) | 156 (6.1) |
| TAC, n (%) | 1,445 (56.3) |
| EVR, n (%) | 847 (32.9) |
| DM at 1 year, n (%) | 539 (20.9) |
| Attended follow-up visits*, n Scheduled follow-up visits, n Attended/scheduled follow-up visits, n (%) |
43,224 (i.e. 2.08 per patient-year) 51,630 (i.e. 2.2 per patient-year) 83.7% |
NOTE: CIT, cold-ischemia time; CKD, chronic kidney dysfunction; CVA, cardiovascular accident; DI, deprivation index; DM, diabetes mellitus; DPI, deprivation index; EVR, everolimus; HBc, hepatitis B core antigen; HBV, hepatitis B virus; HCC, hepatocellular carcinoma; HCV, hepatitis C virus; HDV, hepatitis delta virus; ICU, intensive care unit; IQR, interquartile range; MASLD, metabolic dysfunction associated steatotic liver disease; MELD, model for end-stage liver disease; MP, machine perfusion; PSC, primary sclerosing cholangitis; TAC, tacrolimus. *urgent/emergent outpatient visits excluded.
Table 2.
Causes of death and re-transplantation in the study population.
| Variable | Value Total patients = 2,568 |
|---|---|
| Death, n (%) HCV recurrence De novo malignancy HCC recurrence Infection/sepsis MACE Recurrent liver disease Stroke |
810 (31.5) 319 (12.4) 129 (5.0) 115 (4.5) 113 (4.4) 83 (3.2) 32 (1.2) 19 (0.7) |
| Re-transplantation, n (%) HAT/HAS PNF/EAD Ischemic cholangiopathy HCV recurrence) VBDS/Chronic rejection |
156 (6.1) 77 (2.9) 51 (2.0) 23 (0.9) 3 (0.11) 2 (0.08) |
NOTE: EAD, early allograft dysfunction; HAS, hepatic artery stenosis; HAT, hepatic artery thrombosis; HCC, hepatocellular carcinoma; HCV, hepatitis C virus; MACE, major cardiovascular event; PNF, primary non-function; VBDS, vanishing bile duct syndrome.
Table 3.
Post-transplant complications in the study population at the latest follow-up.
| Variable | Value Total patients = 2,568 |
|---|---|
| Hypertension, n (%) | 1,592 (61.9) |
| HCV recurrence, n (%) | 1,127 (43.8) |
| Biliary complications, n (%) Ischemic cholangiopathy |
590 (22.9) 493 (19.2) |
| Obesity, n (%) | 467 (18.1) |
| DM, n (%) | 462 (18.0) |
| t/BPAR, n (%) | 436 (16.9) |
| CKD, n (%) | 378 (14.7) |
| De novo malignancies*, n (%) PTLD Colon Kidney Prostate Laryngeal Breast Lung Uterus Anal Melanoma Cholangiocarcinoma Testis Of unspecified origin |
361 (14.0) 186 (7.2) 45 (1.7) 38 (1.5) 35 (1.3) 15 (0.6) 14 (0.5) 13 (0.5) 5 (0.2) 3 (0.1) 3 (0.1) 2 (0.06) 1 (0.03) 1 (0.03) |
| MACE, n (%) | 334 (13.0) |
| HCC recurrence, n (%) | 152 (5.9) |
| Neurologic, n (%) | 102 (3.9) |
| VBDS/chronic rejection, n (%) | 7 (0.2) |
| Patient with >1 complication, | 1,901 (74) |
NOTE: CKD, chronic kidney dysfunction; DM, diabetes mellitus; EAD, early allograft dysfunction; HAS, hepatic artery stenosis; HAT, hepatic artery thrombosis; HCC, hepatocellular carcinoma; HCV, hepatitis C virus; MACE, major cardiovascular event; PNF, primary non-function; PTLD, post-transplant lymphoproliferative disease; t/BPAR, treated biopsy-proven acute rejection; VBDS, vanishing bile duct syndrome. *Non-melanoma skin malignancies excluded.
Table 4.
demographic and clinical characteristics of the study population at transplantation by DI rank.
Table 4.
demographic and clinical characteristics of the study population at transplantation by DI rank.
| Variable | DI=1 (#572) | DI=2 (#572) |
DI=3 (#788) |
DI=4 (#424) |
DI=5 (212) |
P |
|---|---|---|---|---|---|---|
| RECIPIENT | ||||||
| Male sex, (%) |
412 (72.0) |
422 (73.7) |
560 (71.1) |
305 (71.9) |
173 (81.6) | 0.32 |
| Age at transplantation (median, IQR), years |
56 (9) |
58 (9) |
59 (10) |
57 (9) |
57 (8) |
0.78 |
| HCV, n (%) | 280 (48.9) | 291 (50.8) | 386 (48.9) | 206 (48.6) | 90 (42.4) | 0.13 |
| HCC, n (%) | 235 (41.1) | 242 (42.3) | 338 (42.8) | 178 (41.9) | 59 (27.8) | 0.001 |
| Lab-MELD at transplant (median, IQR) | 11 (7) | 13 (6) | 12 (5) | 13 (7) | 12 (5) | 0.37 |
| DM at transplant, n (%) | 137 (23.9) | 142 (24.8) | 176 (22.3) | 101 (23.8) | 70 (33.1) | 0.86 |
| CKD at transplant, n (%) | 35 (6.1) | 42 (7.3) | 39 (4.9) | 25 (5.9) | 8 (3.7) | 0.26 |
| Hypertension at transplant, n (%) | 52 (9.1) | 58 (10.1) | 94 (11.9) | 125 (29.4) | 53 (25.0) | <0.0001 |
| DONOR | ||||||
| Male sex, n (%) | 360 (63.0) | 372 (65.0) | 504 (63.9) | 272 (64.1) | 116 (54.7) | 0.11 |
| Age, median (IQR) | 62 (10) | 64 (12) | 63 (10) | 64 (9) | 63 (11) | 0.43 |
| ICU stay, median (IQR) days | 3 (3) | 4 (3) | 3 (4) | 4 (3) | 4 (3) | 0.89 |
| CVA as cause of death, n (%) | 425 (74.3) | 434 (75.9) | 598 (75.8) | 313 (73.8) | 156 (73.6) | 0.86 |
| Anti-HCV-positive, n (%) | 4 (0.7) | 3 (0.5) | 7 (0.9) | 6 (1.4) | 2 (0.9) | 0.64 |
| Anti-HBc-positive, n (%) | 75 (13.1) | 77 (13.4) | 102 (12.9) | 55 (12.9) | 25 (11.8) | 0.98 |
| Cardiac arrest episodes, n (%) | 70 (12.2) | 62 (10.8) | 85 (10.8) | 45 (10.6) | 20 (9.4) | 0.81 |
| Use of inotropes, n (%) | 483 (84.4) | 486 (84.9) | 661 (83.8) | 364 (85.8) | 180 (84.9) | 0.92 |
| TRANSPLANTATION | ||||||
| CIT, median (IQR) min | 434 (94) | 414 (88) | 412 (96) | 401 (87) | 422 (82) | 0.47 |
| MP, n (%) | 3 (0.5) | 6 (1.0) | 8 (1.0) | 1 (0.2) | 1 (0.5) | 0.46 |
| TAC, n (%) | 314 (54.9) | 326 (56.9) | 433 (54.9) | 245 (57.8) | 127 (59.9) | 0.82 |
| EVR, n (%) | 183 (31.9) | 177 (30.9) | 253 (32.1) | 153 (36.1) | 81 (38.2) | 0.79 |
| Attended/scheduled follow-up visits (%) | 92.2 | 94.3 |
87.8 |
76.1 |
68.2 | <0.0001 |
NOTE: CIT, cold ischemia time; CKD, chronic kidney dysfunction; CVA, cardiovascular accident; DI, deprivation index; DM, diabetes mellitus; EVR, everolimus; HBc, hepatitis B core; HCC, hepatocellular carcinoma; HCV, hepatitis C virus; ICU, intensive care unit; MELD, model for end-stage liver disease; MP, machine perfusion; TAC, tacrolimus.
Table 5.
Post-transplant complications in the study population at the latest follow-up by DI rank.
| Variable | DI=1 (#572) | DI=2 (#572) |
DI=3 (#788) |
DI=4 (#424) |
DI=5 (212) |
P |
|---|---|---|---|---|---|---|
| Death, n (%) HCV recurrence, n (%) De novo malignancy, n (%) HCC recurrence, n (%) Infection/sepsis, n (%) MACE, n (%) Recurrent liver disease, n (%) Stroke, n (%) Total |
69 (12.0) 20 (3.4) 23 (4.0) 22 (3.8) 8 (1.4) 5 (0.9) 4 (0.7) 151 (26.3) |
75 (13.1) 17 (2.9) 24 (4.2) 21 (3.6) 7 (1.2) 3 (0.5) 3 (0.5) 150 (26.2) |
86 (10.9) 37 (4.7) 44 (5.6) 45 (5.7) 25 (3.2) 12 (1.5) 7 (0.9) 256 (32.5) |
52 (12.2) 27 (6.4) 13 (3.1) 16 (3.8) 25 (5.9) 6 (1.4) 2 (0.5) 141 (33.2) |
37 (17.4) 28 (13.2) 11 (5.2) 9 (4.2) 18 (8.5) 5 (2.3) 3 (1.4) 110 (51.8) |
0.86 <0.0001 0.30 0.31 <0.0001 0.20 0.67 <0.0001 |
| Re-transplantation, n (%) HAT/HAS, n % PNF/EAD, n (%) Ischemic cholangiopathy, n (%) HCV recurrence, n (%) Chronic rejection, n (%) Total |
14 (2.4) 11 (1.9) 4 (0.7) 1 (0.2) 0 (0) 30 (5.2) |
18 (3.1) 12 (2.1) 6 (1.0) 2 (0.4) 1 (0.2) 39 (6.8) |
26 (3.2) 18 (2.3) 9 (1.1) 0 (0) 1 (0.12) 54 (6.8) |
10 (2.3) 7 (1.6) 3 (0.7) 0 (0) 0 (0) 20 (4.7) |
9 (4.2) 3 (1.4) 1 (0.5) 0 (0) 0 (0) 13 (6.1) |
0.62 0.90 0.82 0.99 0.99 0.48 |
| Hypertension, n (%) | 314 (54.9) | 323 (56.4) | 464 (58.8) | 312 (73.6) | 179 (84.4) | <0.0001 |
| HCV recurrence, n (%) | 276 (48.2) | 248 (43.3) | 323 (40.9) | 185 (43.6) | 95 (44.8) | 0.12 |
| Ischemic cholangiopathy, n (%) | 114 (19.9) | 119 (20.8) | 143 (18.1) | 85 (20.0) | 32 (15.1) | 0.37 |
| Obesity, n (%) | 82 (14.3) | 91 (15.9) | 157 (19.9) | 94 (22.2) | 43 (20.3) | 0.02 |
| DM, n (%) | 81 (14.2) | 92 (16.1) | 152 (19.3) | 93 (21.9) | 44 (20.7) | 0.02 |
| t/BPAR, n (%) | 67 (11.7) | 78 (13.6) | 143 (18.1) | 87 (20.5) | 61 (28.7) | <0.0001 |
| CKD | 50 (9.9) | 58 (11.9) | 107 (15.7) | 63 (16.7) | 56 (27.3) | <0.0001 |
| De novo malignancies*, n (%) | 64 (11.2) | 68 (11.8) | 117 (14.8) | 61 (14.4) | 51 (24.1) | <0.0001 |
| MACE, n (%) | 56 (8.7) | 61 (10.6) | 103 (13.1) | 68 (16.0) | 56 (26.4) | <0.0001 |
| HCC recurrence, n (%) | 31 (5.4) | 34 (5.9) | 47 (6.0) | 24 (5.6) | 16 (7.5) | 0.85 |
| Neurologic, n (%) | 23 (4.0) | 25 (4.4) | 27 (3.4) | 19 (4.5) | 8 (3.8) | 0.91 |
| VBDS/chronic rejection, n (%) | 3 (0.5) | 2 (0.3) | 0 (0) | 1 (0.2) | 0 (0) | 0.99 |
NOTE: CKD, chronic kidney dysfunction; DI, deprivation index; DM, diabetes mellitus; EAD, early allograft dysfunction; HAS, hepatic artery stenosis; HAT, hepatic artery thrombosis; HCC, hepatocellular carcinoma; HCV, hepatitis C virus; MACE, major cardiovascular event; PNF, primary non-function; t/BPAR, treated biopsy proven acute rejection; VBDS, vanishing bile duct syndrome. *non-melanoma skin malignancies excluded.
Table 6.
Results of the multivariable analysis of risk factors for patient survival.
| Variable | Coefficients (95%CI) |
SE | z | HR | p | |
|---|---|---|---|---|---|---|
| Pre-transplant | Patient female sex | 1.67 (-0.03;3.36) | 0.87 | 1.92 | 0.89 | 0.04 |
| Patient age | -0.01 (-0.00; 0.11) | 0.06 | 0.14 | 1.18 | 0.02 | |
| HCV versus HBV | -2.34 (-4.6; 0.07) | 1.15 | 2.02 | 1.32 | <0.01 | |
| HCC (yes/no) | 0.42 (-0.02; 0.81) | 0.2 | 2.06 | 1.22 | 0.02 | |
| Higher deprivation area | 0.82 (-0.78; 2.42) | 0.82 | 1.01 | 1.14 | 0.02 | |
| High lab-MELD | -1.18 (-1.63; 0.72) | 0.23 | 5.11 | 1.13 | 0.02 | |
| DM at transplant (yes/no) | -1.02 (-1.64; 0.78) | 1.2 | 2.01 | 1.14 | 0.03 | |
| CKD at transplant (yes/no) | -0.78 (-0.06; 1.23) | 0.34 | 2.23 | 1.08 | 0.06 | |
| Hypertension at transplant (yes/no) | -1.02 (-0.87; 1.13) | 1.1 | 2.24 | 1.02 | 0.75 | |
| Donor | Donor male sex | -0.05 (-0.09; 0.6) | 0.03 | 3.12 | 1.05 | 0.75 |
| Donor age | 0.11 (-0.01; 0.22) | 0.05 | 2.11 | 1.21 | 0.03 | |
| Longer ICU stay (days) | -0.04 (-0.08; 0.02) | 0.03 | 1.12 | 1.03 | 0.67 | |
| Longer CIT (min) | -1.09 (-3.24; 1.06) | 1.1 | 1 | 1.16 | 0.03 | |
| Donor cause of death (CVA versus other) | -0.06 (-0.09; 0.12) | 0.05 | 2.89 | 1.04 | 0.89 | |
| Donor cardiac arrest (yes/no) | -0.56 (-0.08; 1.13) | 0.44 | 2.12 | 1.08 | 0.07 | |
| Post-transplant | Post-transplant DM (yes/no) | -0.88 (-1.13; 0.56) | 1.08 | 1.78 | 1.05 | 0.06 |
| DM at 1 year (yes/no) | -0.98 (-1.23; 0.88) | 1.15 | 2.06 | 1.13 | 0.01 | |
| CKD (yes/no) | -0.03 (-0.00; 0.12) | 0.06 | 0.14 | 1.18 | 0.76 | |
| TAC versus CyA | 0.01 (0; 0.01) | 0 | 2.52 | 0.68 | 0.01 | |
| EVR | -0.88 (1.2; -0.46) | 0.21 | 3.66 | 0.66 | 0.02 | |
NOTE: The reference categories were: male for recipient sex; median age (56 years) for recipient age; median age (63 years) for donor age; median ICU stay (3 days) for donors; HBV as an indication to transplantation; median DI rank (3) for deprivation; median lab-MELD (12); median CIT (489 min). AFP, alpha-fetoprotein; CIT, cold-ischemia time; CVA, cardiovascular accident; CyA, cyclosporine; DM, diabetes mellitus; EVR, everolimus; HBV, hepartitis B virus; HCV, hepatitis C virus; MELD, model for end-stage liver disease; TAC, tacrolimus.
Disclaimer/Publisher’s Note: The statements, opinions and data contained in all publications are solely those of the individual author(s) and contributor(s) and not of MDPI and/or the editor(s). MDPI and/or the editor(s) disclaim responsibility for any injury to people or property resulting from any ideas, methods, instructions or products referred to in the content. |
© 2024 by the authors. Licensee MDPI, Basel, Switzerland. This article is an open access article distributed under the terms and conditions of the Creative Commons Attribution (CC BY) license (http://creativecommons.org/licenses/by/4.0/).
Copyright: This open access article is published under a Creative Commons CC BY 4.0 license, which permit the free download, distribution, and reuse, provided that the author and preprint are cited in any reuse.


