1. Introduction
MPA is widely used in the treatment of solid organ transplant patients as an immunosuppressant, usually in combination with tacrolimus (TAC) or cyclosporine (CsA) and corticosteroids to prevent graft rejection.MPA is metabolized by several uridine diphosphate glucoronosyltransferases into its inactive metabolite mycophenolic acid carboxybutoxyether(MPAG) and the pharmacologically active netabolite mycophenolic acid carboxyglucuronide (AcMPAG)[
1].Precursors of MPA include mycophenolate mofetil (MMF) and mycophenolate sodium (MPS). MPA-associated adverse effects such as infection, leukopenia, anemia, and gastrointestinal problems occur frequently. The pre-dose MPA plasma/serum concentration (MPA trough concentration, MPA-C0) is currently the most commonly used cinical MPA therapeutic drug monitoring(TDM) indicator and the area under the complete MPA concentration-time curve (MPA-AUC0-12) is the gold standard for evaluating MPA exposure levels in vivo.However, the correlation between these two commonly used monitoring indicators and drug-related adverse reactions was poor in most studies [
5].
It is reorted that some of MPA-related side effects were associated with its metabolites. MPAG has no inhibitory effect on IMPDH activity, but several studies had reported a correlation between MPAG exposure and adverse effects[
6].MPAG competes with MPA for the binding of plasma proteins, resulting in an increase of free MPA (fMPA) which is pharmacologically active [
7].Some studies have found that the pharmacokinetic parameters of MPAG (AUC0-4h,C0,Cmax) correlate with hemoglobin and hematocrit in KTRs, and MPAG levels may be a predictor of MPA-associated anemia[
8].Several studies have found significantly higher plasma concentrations of MPAG among transplant recipients with deteriorating renal function [9-13]. AcMPAG exhibits certain pharmacodynamic activities.AcMPAG has been shown in vitro to inhibit IMPDH and monocyte proliferation, which would increase the risk of opportunistic infections in transplant recipients [
14,
15].It has been found that higher AcMPAG AUC0-24 was found in hematopoietic stem cell transplant(HSCT) recipients with acute graft wart disease in the gastrointestinal tract [
16]. AcMPAG induces mRNA and protein expression of pro-inflammatory cytokines TNF-α and IL-6, which may lead to leukocyte activation and/or direct damage to the gastrointestinal mucosa in some HSCT patients causing inflammatory gastrointestinal symptoms[
17].It was also found in a cohort study that AcMPAG levels were positively correlated with bacterial infections in liver transplant recipients[
18]. These reports indicates monitoring of MPAG and AcMPAG concentration may be beneficial to the rational clinical usage of MPA.
Lymphocyte is the main target cell of immunosuppressive agents[
19].Therefore, the intra-lymphocyte drug concentration is believed to have a more direct relationship with the immunosuppressive efficacy. The detection of drug concentration in peripheral blood mononuclear cells (PBMCs) is a new technique for drug concentration analysis that has been explored by a few foreign scholars in recent years.Existing studies have mainly focused on PBMC-Tacrolimus (TAC) concentration and PBMC-cyclosporine (CsA) concentration. In recent years, PBMC-MPA concentration detection has gradually been reported.
The detection of intralcellular drug concentration is much more difficult than plasma or whole blood drug concentration and could not be achieved using routine clinical analitical method (e.g immunological technology). Only a few laboratories have established validated detection method based on ultra-performance liquid chromatography-tandem mass spectrometry (UPLC-MS/MS) technology for the concentration detection of PBMC-TAC, PBMC-CsA, and PBMC-MPA[
20,
21].To our knownledge, there have been no report available on the simultaneous quantitative detection of MPA and its metabolites in PMBCs.
In this study, we developed and analytically validated a UPLC-MS/MS based method for the determination of MPA and its metabolites concentrations in PBMCs (PBMC-MPA, PBMC-MPAG, MPA-AcMPAG).Blood samples from Chinese KTRs were analysed using this method and the clinical application value of those indicators in the prediction of infection after transplantation were assessed and compared with routine plasma MPA concentration.
2. Materials and Methods
2.1. Sample collection
Blank PBMCs were extracted from 30 heparin-anticoagulated whole blood from healthy volunteers.PBMC’s isolation was obtained by adapting the Leucosep® tubes manufacturer’s protocol.Briefly, the tubes containing the blood were centrifuged (2000 rpm, 5 min), followed by aspirating the middle white-membrane layers, combining all the layers, with equal amounts of PBS, and transferring them to 15 ml separator tubes( CORNING CentriStar, TM).Carefully pour the mixture into several 15 mL test tubes containing 4 mL of FicollPaque Plus solution without mixing.After centrifugation (500g, 30 minutes), the PBMC layers from the tubes were collected.The cells in each tube were washed with 10 mL of PBS (300 g, 10 min), centrifuged and the supernatant discarded, and then lysed with 10 ml of erythrocyte lysate for 20 min, then centrifuged and discarded after washing again with PBS and discarding the supernatant, finally resuspended with an appropriate amount of PBS. Thereafter, 50 uL of the suspension was used for cell counting on a Sysmex® XE- 2100 instrument (Sysmex Corporation, Kobe, Japan).And the remaining fractions were pooled, divided into several aliquots, and packed into EP tubes, each containing approximately 10*106 cells.After centrifugation (300 g, 10 min), these aliquots(50ul each)were stored at −80 °C until analysis for the use of the standards and QC samples blank matrix.
2.2. Reagents and Materials
HPLC-grade methanol, acetonitrile, and formic acid were obtained from Thermo Fisher (St. Louis, MO, USA).Ammonium acetate was obtained from Sigma-Aldrich (St. Louis, MO, USA).The standards of MPA and metabolites were Mycophenolic Acid (MPA) Mycophenolic acid carboxybutoxyether(MPAG)and acyl glucuronide of mycophenolic acid(AcMPAG)were purchased from TRC (Toronto, ON, Canada). We used a stable isotope-labeled internal standard in which MPA-d3 was purchased from TRC (Toronto, ON, Canada). Deionized water was prepared by a Milli-Q integral ultrapure water machine (Merck Millipore, Germany).
2.3. Equipments and Conditions
We used a triple quadrupole LC-MS/MS consisting of an ACQUITY UPLC system in combination with a Xevo TQ-S triple quadrupole mass spectrometer, from Waters (Milford, CT, USA). Method optimization was performed using an Acquity UPLC BEH C18 1.70 um 2.10 mm x 50 mm analytical column. The autosampler temperature was set at 8 ℃ and the column oven temperature was set to 60 ℃. Mobile phases A and B consisted of 2 mM ammonium acetate and 0.10% formic acid, the former in deionized water and the latter in methanol at a flow rate of 0.30 mL/min. The gradient elution program was set to 20% B for 1 min, then the percentage of B was increased to 90% B in 3.8 min, then adjusted to 20% B in 4.3 min, and held 20% B for 4.30 min until 5.0 min.The total injector run time was 5 min and the injection volume for a single analysis was 5 ul.
The mass spectrometer generates positive ions in electrospray ionization (ESI) mode and the analysis was performed in multiple reaction monitoring (MRM) mode. The m/z detected for MPA, MPAG, AcMPAG, and MPA-d3 were 321.27/207.15, 514.27/321.2, 514.26/321.2, and 324.26/210.15, respectively,which were shown in
Table 1.
2.4. Calibration Standards and Quality Control Samples
MPA standard was weighed to prepare 1.00 mg/mL stock solutions with methanol. MPAG and AcMPAG standards were weighed to prepare 0.10 mg/mL stock solutions with methanol. The isotope internal standard MPA-d3 wasweighed to make a 0.04 mg/mL stock solution with methanol.The stock solutions were dispensed into 1.50 mL centrifuge tubes and stored at -_80℃. Working solutions of MPA, MPAG, and AcMPAG standards were prepared in methanol/water (50/50).The internal standard was prepared in acetonitrile.
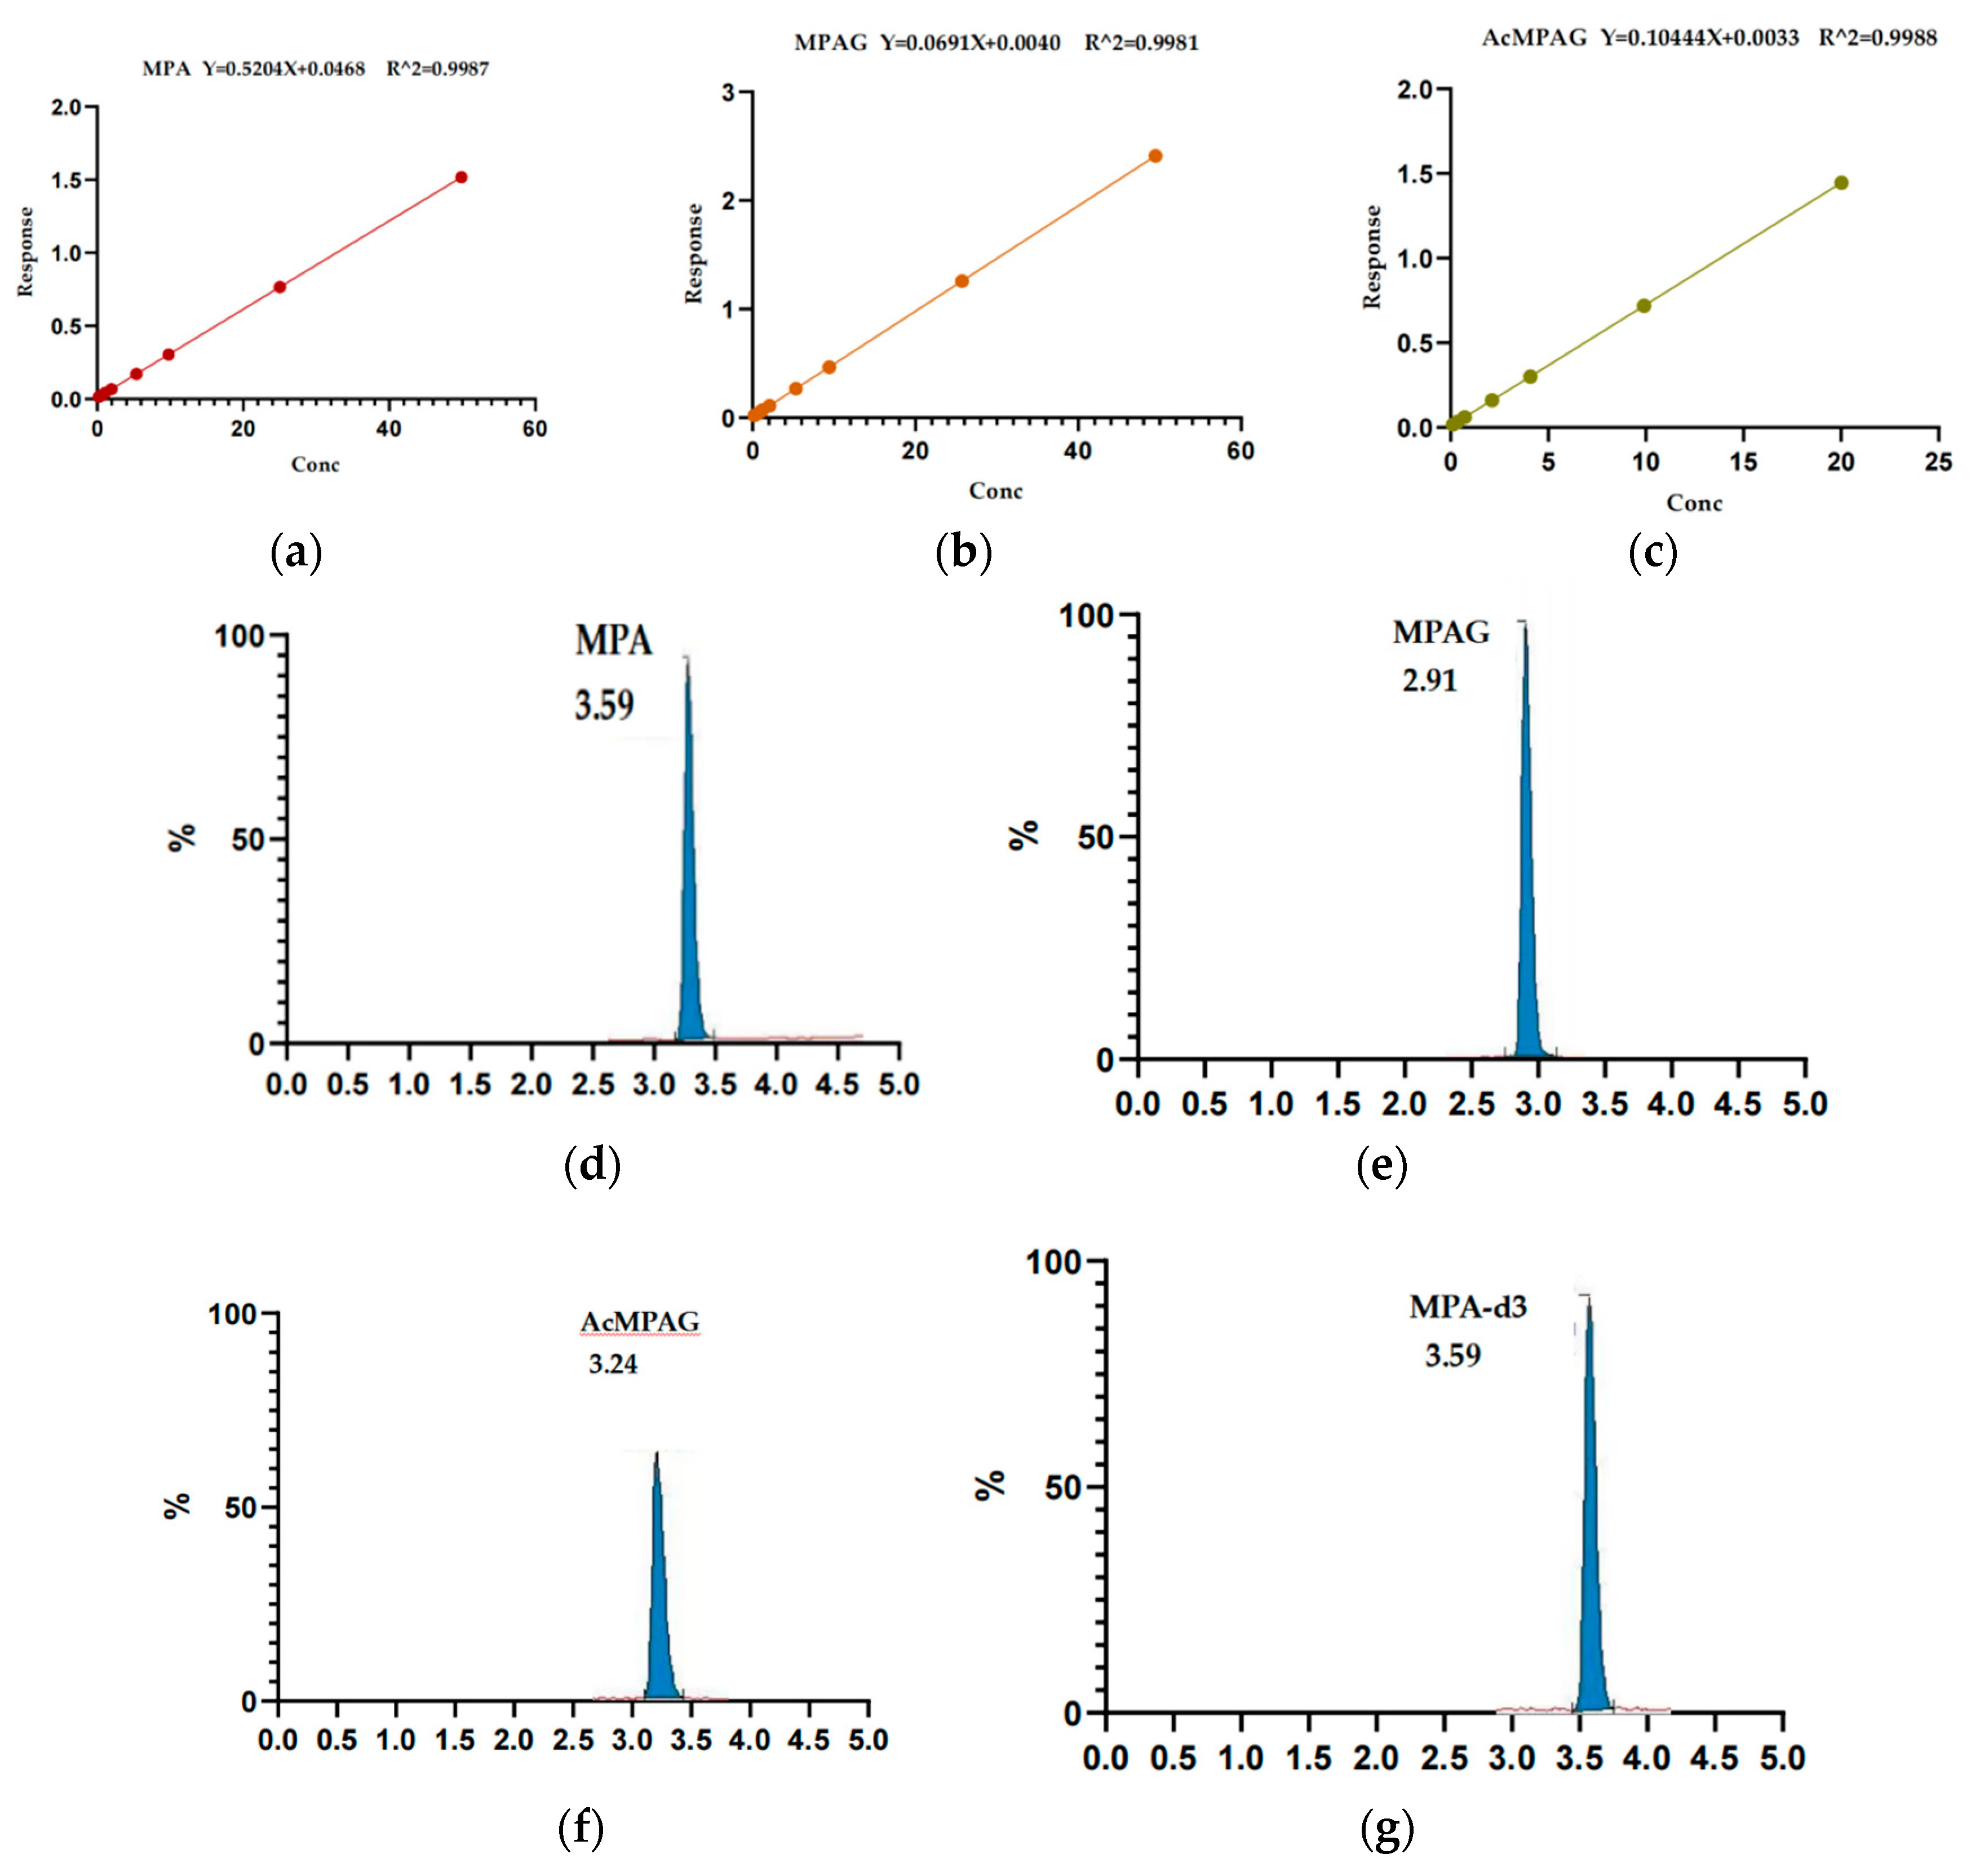
The concentration range of the calibrators were 0.0625, 0.125, 0.25, 0.5, 1.00, 2.00, 5.00, 10.00, 25.00, 50.00ng/ml for MPA;0.5, 1.00, 2.00, 5.00, 10.00, 25.00, 50.00ng/ml for MPAG;and 0.10, 0.20, 0.40, 0.80, 2.00, 4.00, 10.00, 20.00ng/ml for AcMPAG. For MPA, 0.050 ng/mL was set as the lower limit of quantitation (LLOQ),0.150 ng/mL was set as the low concentration quality control (LQC), 10.00 ng/mL was set as the medium concentration quality control (MQC), and 40.00 ng/mL was set as the high concentration quality control (HQC). For MPAG and AcMPAG, 0.500 ng/mL and 0.100ng/ml wereset as LLOQ,1.500 ng/mL and 0.3 ng/mL as LQC, 10.00 ng/mL and 4.00 ng/mL as MQC, and 40.00 ng/mL and 16.00 ng/mL as HQC.Healthy volunteers mixing PBMCs were used as a blank control.Calibration standards and quality control samples were prepared in healthy volunteers mixing PBMCs. Fresh calibration standards and QC samples were prepared for each analysis and discarded after the analysis was complete.
2.5. Sample pre-processing methods
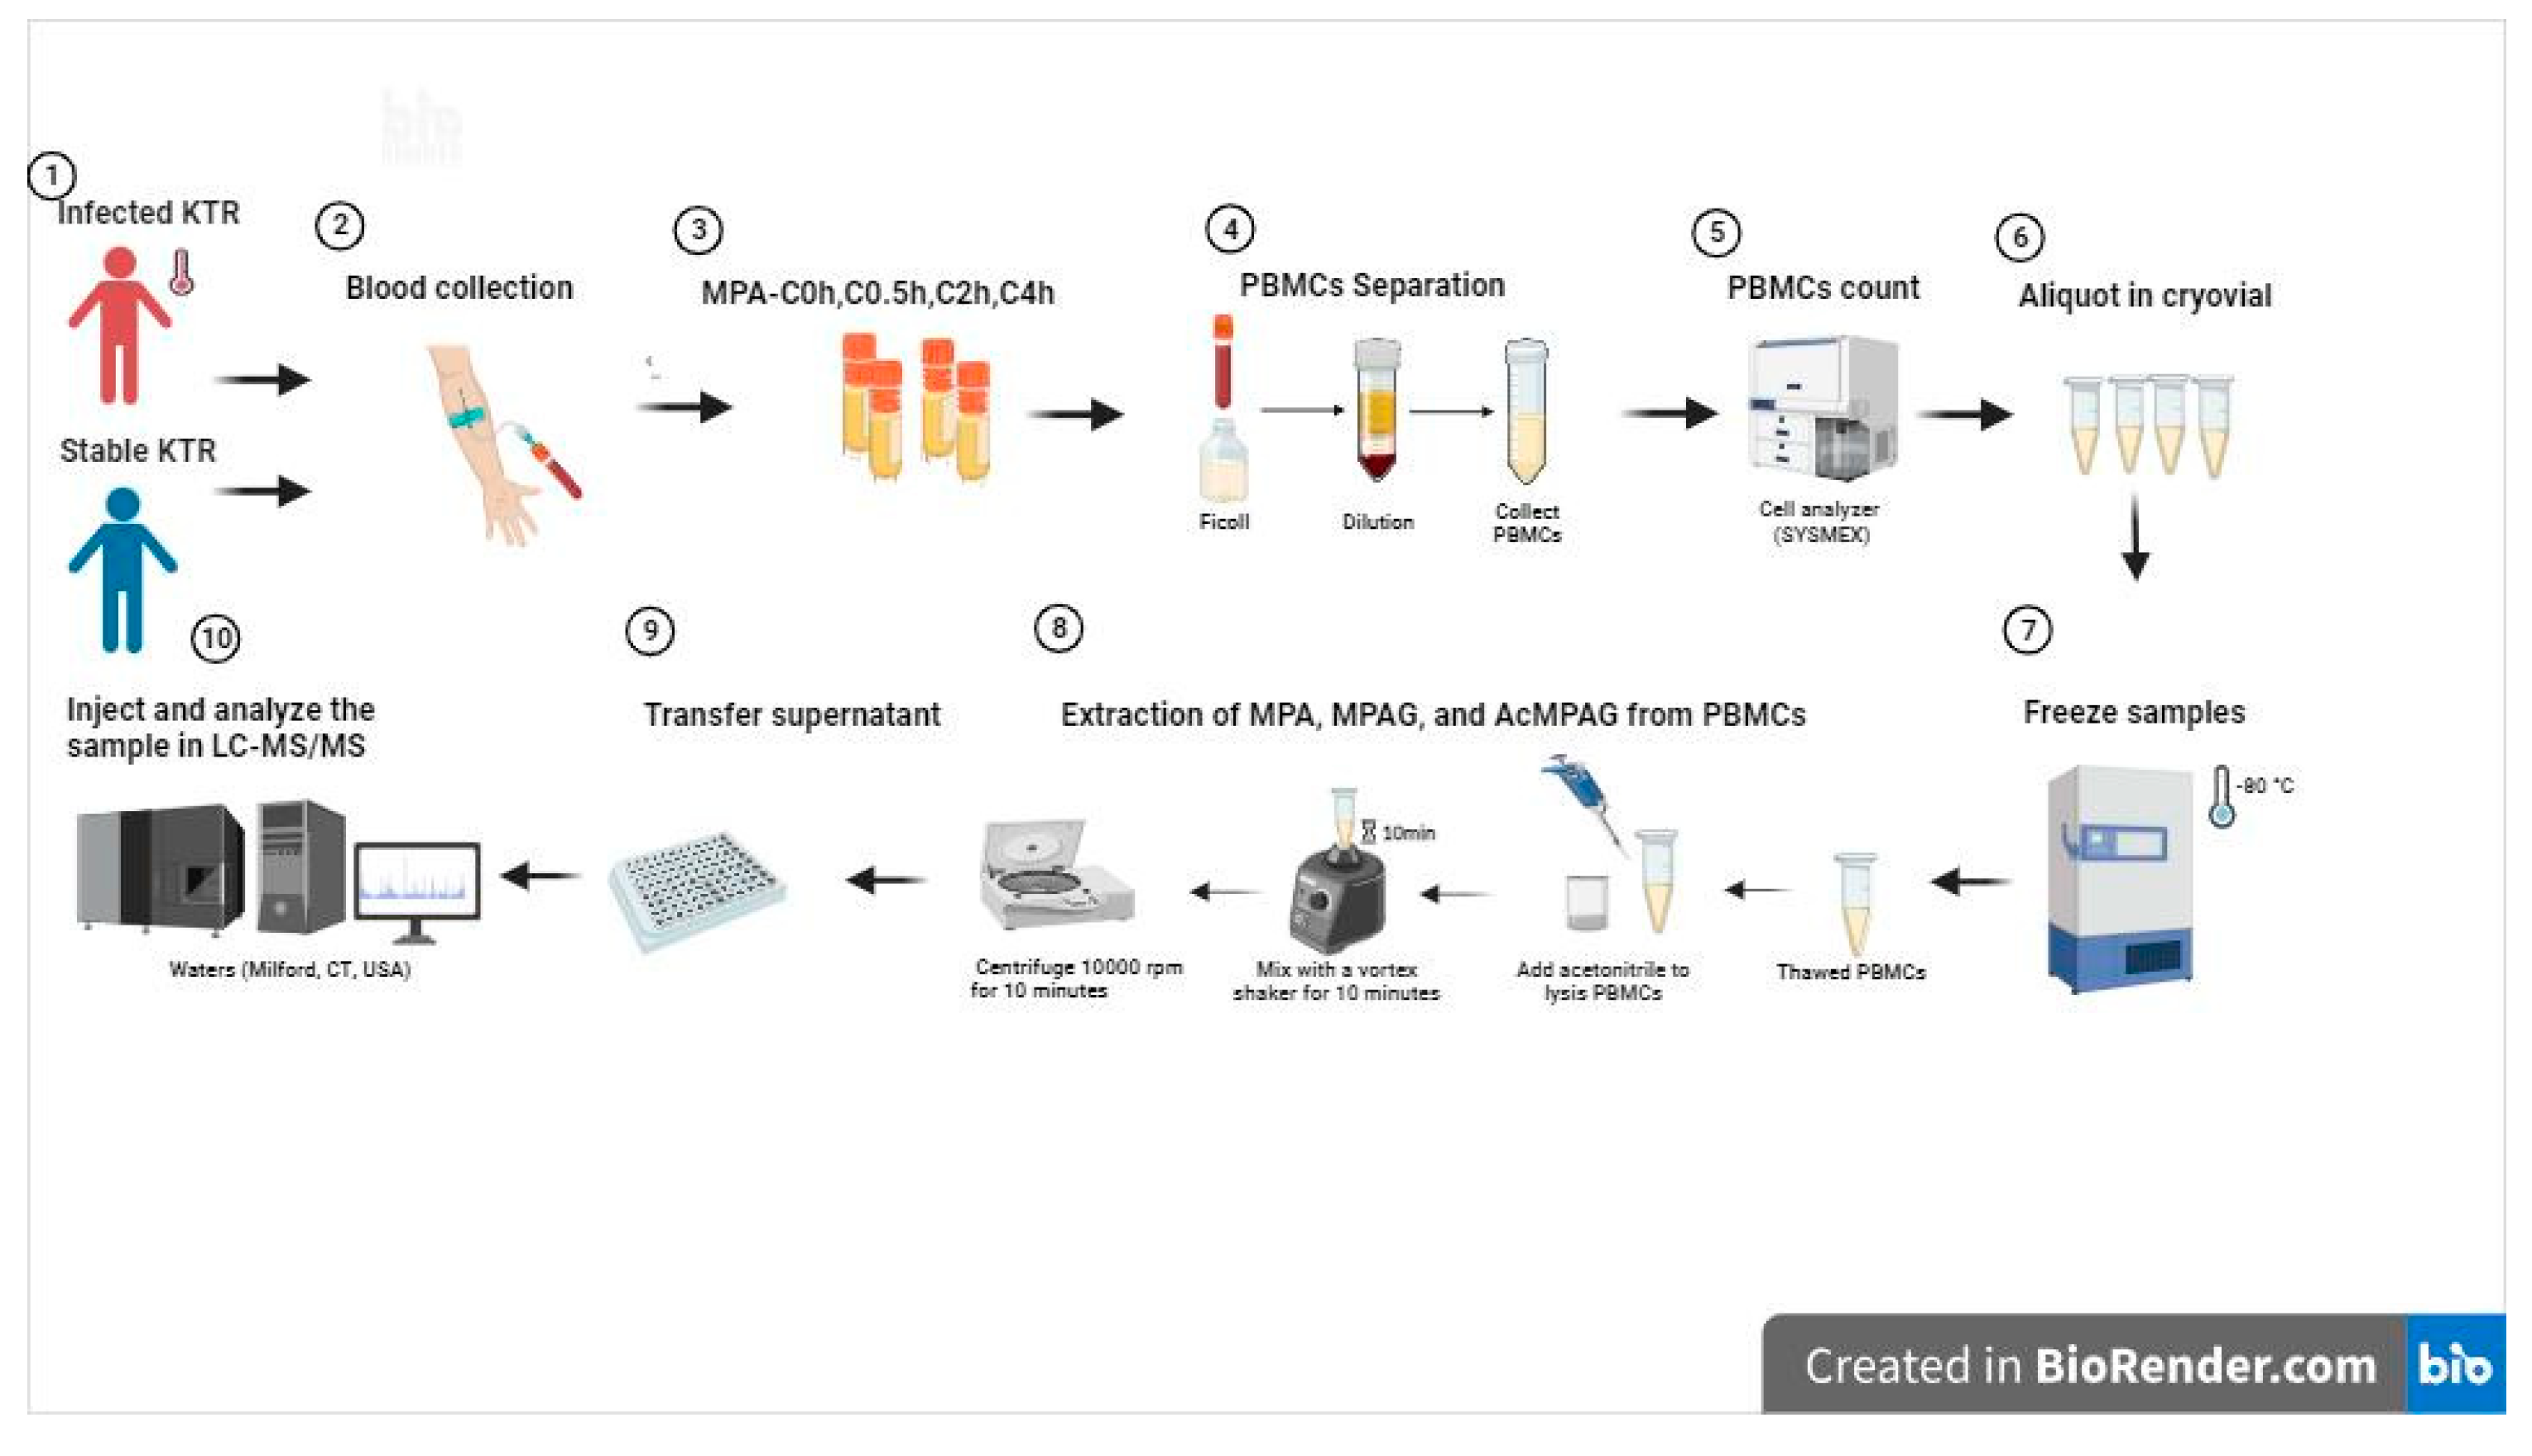
Acetonitrile precipitation was used to remove the proteins from PBMCs to extract the substances to be tested.Accurately aspirate 50µL of prepared standard curve or room temperature re-solubilized patient PBMCs into a 1.5mL EP tube. Then,100uL of acetonitrile and IS (1ng/mL d3-MPA) were added. After vigorous vortexing (10 min) and centrifugation (5 min, 12,000g, 4°C), 50ul of supernatant and 50ul mobile phase A were taken, and the mixture was transferred to the injection vial for LC-MS/MS analysis.
2.6. Bioanalytical Validation
Development and validation were carried out following the Food and Drug Admin- istration and European Medicines Agency guidelines for the validation of bioanalytical methods [
22,
23]. Accuracy was expressed by deviation %,calculated from [(measured concentration _ theoretical concentration) x 100]/theoretical concentration, precision was the coefficient of variation, the formula was CV (%) = (standard deviation/mean) x 100. N represented the number of sample preparations.
2.6.1. Standard Curve and Lower Limit of Quantitation
Prepared blank samples, zero concentration samples, and the concentration point samples.The standards used to build the standard curve.A sequence of injections was taken from the low-level standard to the high-level standard.The standard curve fitted linearly Y =aX + b with 1/X as a weighting factor, where X was the amount of MPA, MPAG, AcMPAG, and Y the ratio of the chromatographic peak areas (MPA/ISTD, MPAG/ISTD, AcMPAG/ISTD).If both the correlation coefficient (r2) was >0.99 and SD from the nominal concentrations was< 15%, except for the lower limit of quantification (LLOQ) (<20%), the curves were considered linear.The limit of detection (LOD) was calculated as the smallest detectable peak above baseline noise (signal/noise>3:1).Three samples with concentrations close to LOQ were selected, and each sample was repeated six times for three consecutive batches when the accuracy was 80%~120%, the precision (coefficient of variation CV) ≤ 20%, it was considered acceptable as the lower limit of quantification (LLOQ).
2.6.2. Selectivity and Carryover Effect
Six blank PBMCs from healthy volunteers were selected for selectivity evaluation. A blank sample was injected after the upper limit of the quantification sample to assess carryover effect and the experiment of carrying contamination rate was carried out by cross-injecting low and high concentration samples.
2.6.3. Matrix Effect and Extraction Recovery
Blank matrix samples were prepared from mixed PBMCs from healthy volunteers, 4 different level concentration analytes(LLOQ,LQC, MQC, and HQC)and internal standards were added after extraction, and pure solutions containing the same concentrations of analytes and internal standards were prepared to study the matrix effect. At the same time, corresponding LLOQ,LQC, MQC, and HQC were prepared to calculate extraction recovery.
2.6.4. Accuracy and precision
Four concentration levels, including LLOQ,LQC,MQC, and HQC, were prepared, five samples at one concentration level, three batches of analysis were completed within three days, and intra- and interassay analysis was performed to assess accuracy and precision.
2.6.5. Stability
The stability of MPA, MPAG, and AcMPAG in PBMCs was investigated under different conditions of time and temperature.Short-term room temperature stability was assessed by storing the QCs at room temperature for 3 hours and 8 hours before sample processing;Short-term refrigerated storage stability was assessed by storing the QCs in the 4°C refrigerator for 24 hours before sample processing;freeze/thaw stability was determined by freezing samples at -80℃ and thawing at room temperature in 3 cycles; post-extracted sample stability was evaluated by storing QCs in the autosampler for 24 hours after sample treatment;long-term stability was assessed by storing QCs at-80C for 24h, 48h, 72h, 7d, 14d.
Through the above experiments, the stability of MPA, MPAG, and AcMPAG under different storage conditions can be determined so that appropriate storage conditions can be selected to ensure the accuracy and reliability of the data in routine analysis.
2.7. Clinical Validation
2.7.1. Patients
The study cohort included patients who received kidney transplantation at the Kidney Transplant Center of West China Hospital.The KTRs who occurred infections with long-term primidone administration were considered as the infected group (n=8). The KTRs with regular long-term follow-ups who had healthy hepatic and renal function and hematology were treated as the stable group (n=7).The exclusion criteria included: renal allograft insuffificiency (eGFR <60 mL/min), hepatic insuffificiency, unstable serum creatinine level or allograft rejection past 1 year; any dose adjustment of immunosuppressants during the past one month; history of malignancy; gastrointestinal disease, and patients with poor compliance.All patients received a triple immunosuppressive regimen including MPA, CNIs, and glucocorticosteroids.4mL blood was collected in heparin anticoagulation tubes from MPA at 0h before, 0.5h after, 2h after, and 4h after dosing. The PBMCs were extracted within 8 hours after the detection of the plasma concentration.
2.7.2. Sample and data collection
Sample collection: PBMCs were collected from infected KTRs and stable KTRs at 0h before, 0.5h after, 2h after, and 4h after the dose of Snapdragon for evaluation of clinical applicability.PBMCs from patients were extracted in the same way as those from healthy volunteers.Other relevant clinical data collection:(Ⅰ)Age, sex, graft duration, dosage of immunosuppressants, history of malignancy, and gastrointestinal disease in the two groups;(Ⅱ)Drug levels in MPA plasma were assayed using Siemens V-TWIN autoanalyzer and accompanying reagents. Pre-dose (MPA-C0), 0.5h post-dose (MPA-C0.5), 2h post-dose (MPA-C2), 4h post-dose (MPA-C4), and simplified area under the curve (MPA-AUC0-4) were collected in plasma of both groups.(Ⅲ)Collected information related to pathogenic microbial results, molecular diagnostic results, imaging data, and clinical diagnosis at the time of hospital admission in the infected group. (Ⅳ)Collected laboratory test results of blood routine, urine routine, liver function, and kidney function of the two groups.
2.8. Statistical Analyses
Performance validation data were analyzed and calculated using SPSS Statistics software (2015, IBM, USA). GraphPad Prism 9.0 was used to analyze the clinical validation data, compare and correlate the two data sets, and finally graphing. The methodology established in this study has detailed experimental procedures, that is., visualizations were created through BioRender.com for better and intuitive understanding. We have obtained publication and license for the data from this website.The specific experimental Flow chart was shown in
Figure 1.
4. Discussion
Numerous methods and related studies have been reported on the detection of MPAG and AcMPAG levels in biological matrices such as plasma, saliva, and urine [
24].In recent years, the concentration of MPA in PBMCs has been gradually focused on, whereas no studies related to the detection of MPAG and AcMPAG concentrations in PBMCs have been reported.After the literature search review, to the best of our knowledge, the present study is the first method established based on UPLC-MSMS technology for the simultaneous quantitative determination in PBMCs for MPA and its two main metabolites, MPAG and AcMPAG concentrations.
In this study, a method for the simultaneous determination of MPA and its metabolites MPAG and AcMPAG concentrations in PBMCs using UPLC-MS/MS was developed and systematically and comprehensively validated for method performance with reference to guideline requirements.Our established quantitative analytical method showed good linearity in the ranges of MPA 0.0625-50 ng/ml, MPAG 0.5-50 ng/ml, and AcMPAG 0.1-20 ng/ml, and the selectivity, specificity, matrix effect, carry-over contamination, reproducibility, precision, and accuracy all met the requirements.Using acetonitrile precipitation of proteins effectively lysed the cells and released the drugs and metabolites to be tested, which simplified the sample pre-treatment process and shortened the pre-treatment time, and the chromatographic run time (5 min) was shorter, thus improving the clinical detection capability of the method, and making it suitable for the detection of the concentrations of MPA, MPAG, and AcMPAG in the samples of PBMCs from clinical patients.Few laboratories have reported LC-MSMS assays for PBMC-MPA concentrations.Bing Chen et al. reported a linear range of 0.098-39.2 ng/ml for the quantitative detection of PBMC-MPA by their method[
25]. The linear range of our method was 0.0625-50 ng/ml, with lower LLOQ, higher sensitivity, and a wider concentration range.At the same time, this method could accomplish the simultaneous detection of MPA and its metabolites MPAG and AcMPAG in PBMCs through one pre-processing and one sample run, which provided effective methodological support for a more efficient and comprehensive assessment of the drug metabolism status of MPA in renal transplant recipients.
It has been suggested that sufficient cell lysis to enable the full release of immunosuppressants was required to accurately determine the drug concentration in PBMCs.By reviewing the literature, we chose to use precipitated proteins for sample preprocessing.We observed the cell rupture under the microscope and compared the results of the drug concentration of the same sample under different sample pretreatment conditions, including different precipitants (methanol or acetonitrile), different mixing times (5min, 10min, 15min), and different centrifugation times (12000rpm *5min, *10min).It was found that the optimal extraction of MPA, MPAG, and AcMPAG from PBMCs could be achieved most efficiently using acetonitrile, vortexing for 10 minutes, and centrifugation at 12,000 rpm for 5 minutes.Compared with the other reports, our pre-treatment processing method was simpler and less time-consuming.
In the stability experiments, we found that MPA, MPAG, and AcMPAG in PBMCs could maintain their stability well when placed at room temperature for 8 hours or stored refrigerated at 4°C for 24 hours.The stability of MPA and MPAG in PBMCs was relatively stable under -80°C, but AcMPAG measured MQC and HQC levels lower than 34.94-36.23% of the basal levels after 24h of freezing and reconversion.Furthermore, the LQC of AcMPAG were detected at lower values as the freezing time progressed, degrading to 54.03%-56.83% of the basal value at each concentration level towards day 14.The three freeze-thaw cycles had no significant effect on the MPA and MPAG levels in PBMCs, whereas AcMPAG showed a significant decrease in concentration after the third freeze-thaw cycle.It has been reported in the literature that AcMPAG has similarly been found to exhibit limited stability, with AcMPAG in whole blood and non-acidified plasma decreasing significantly after 2-5 hours at room temperature[
17].Thus, samples required to detect the AcMPAG levels in PBMCs should be separated as soon as possible after collection and stored in refrigeration for no more than 24 h. Samples that cannot be detected in time should be frozen and thawed no more than 3 times after freezing at -80°C and stored for no more than 24h.It has been reported that acidification of plasma samples could avoid degradation of AcMPAG deglucuronidation, and we will continue to examine whether sample acidification can improve AcMPAG stability in PBMCs in subsequent studies.
Our center used the limited time-point sampling method to detect plasma MPA concentration as the clinical implementation of MPA therapeutic drug concentration monitoring (MPA-TDM) in renal transplant recipients, which was also a more recommended approach for MPA-TDM.In patients using mycophenolate mofetil (Snapdragon®), venous blood was taken before (0h), 0.5 hours (0.5h), 2 hours (2h), and 4 hours (4h) after drug dosing for MPA measurement.We used a sample collection method synchronized with the clinically available blood collection protocol to observe the pharmacokinetic distribution characteristics of MPA, MPAG, and AcMPAG in the PBMCs of KTRs and to evaluate their clinical value in infections.
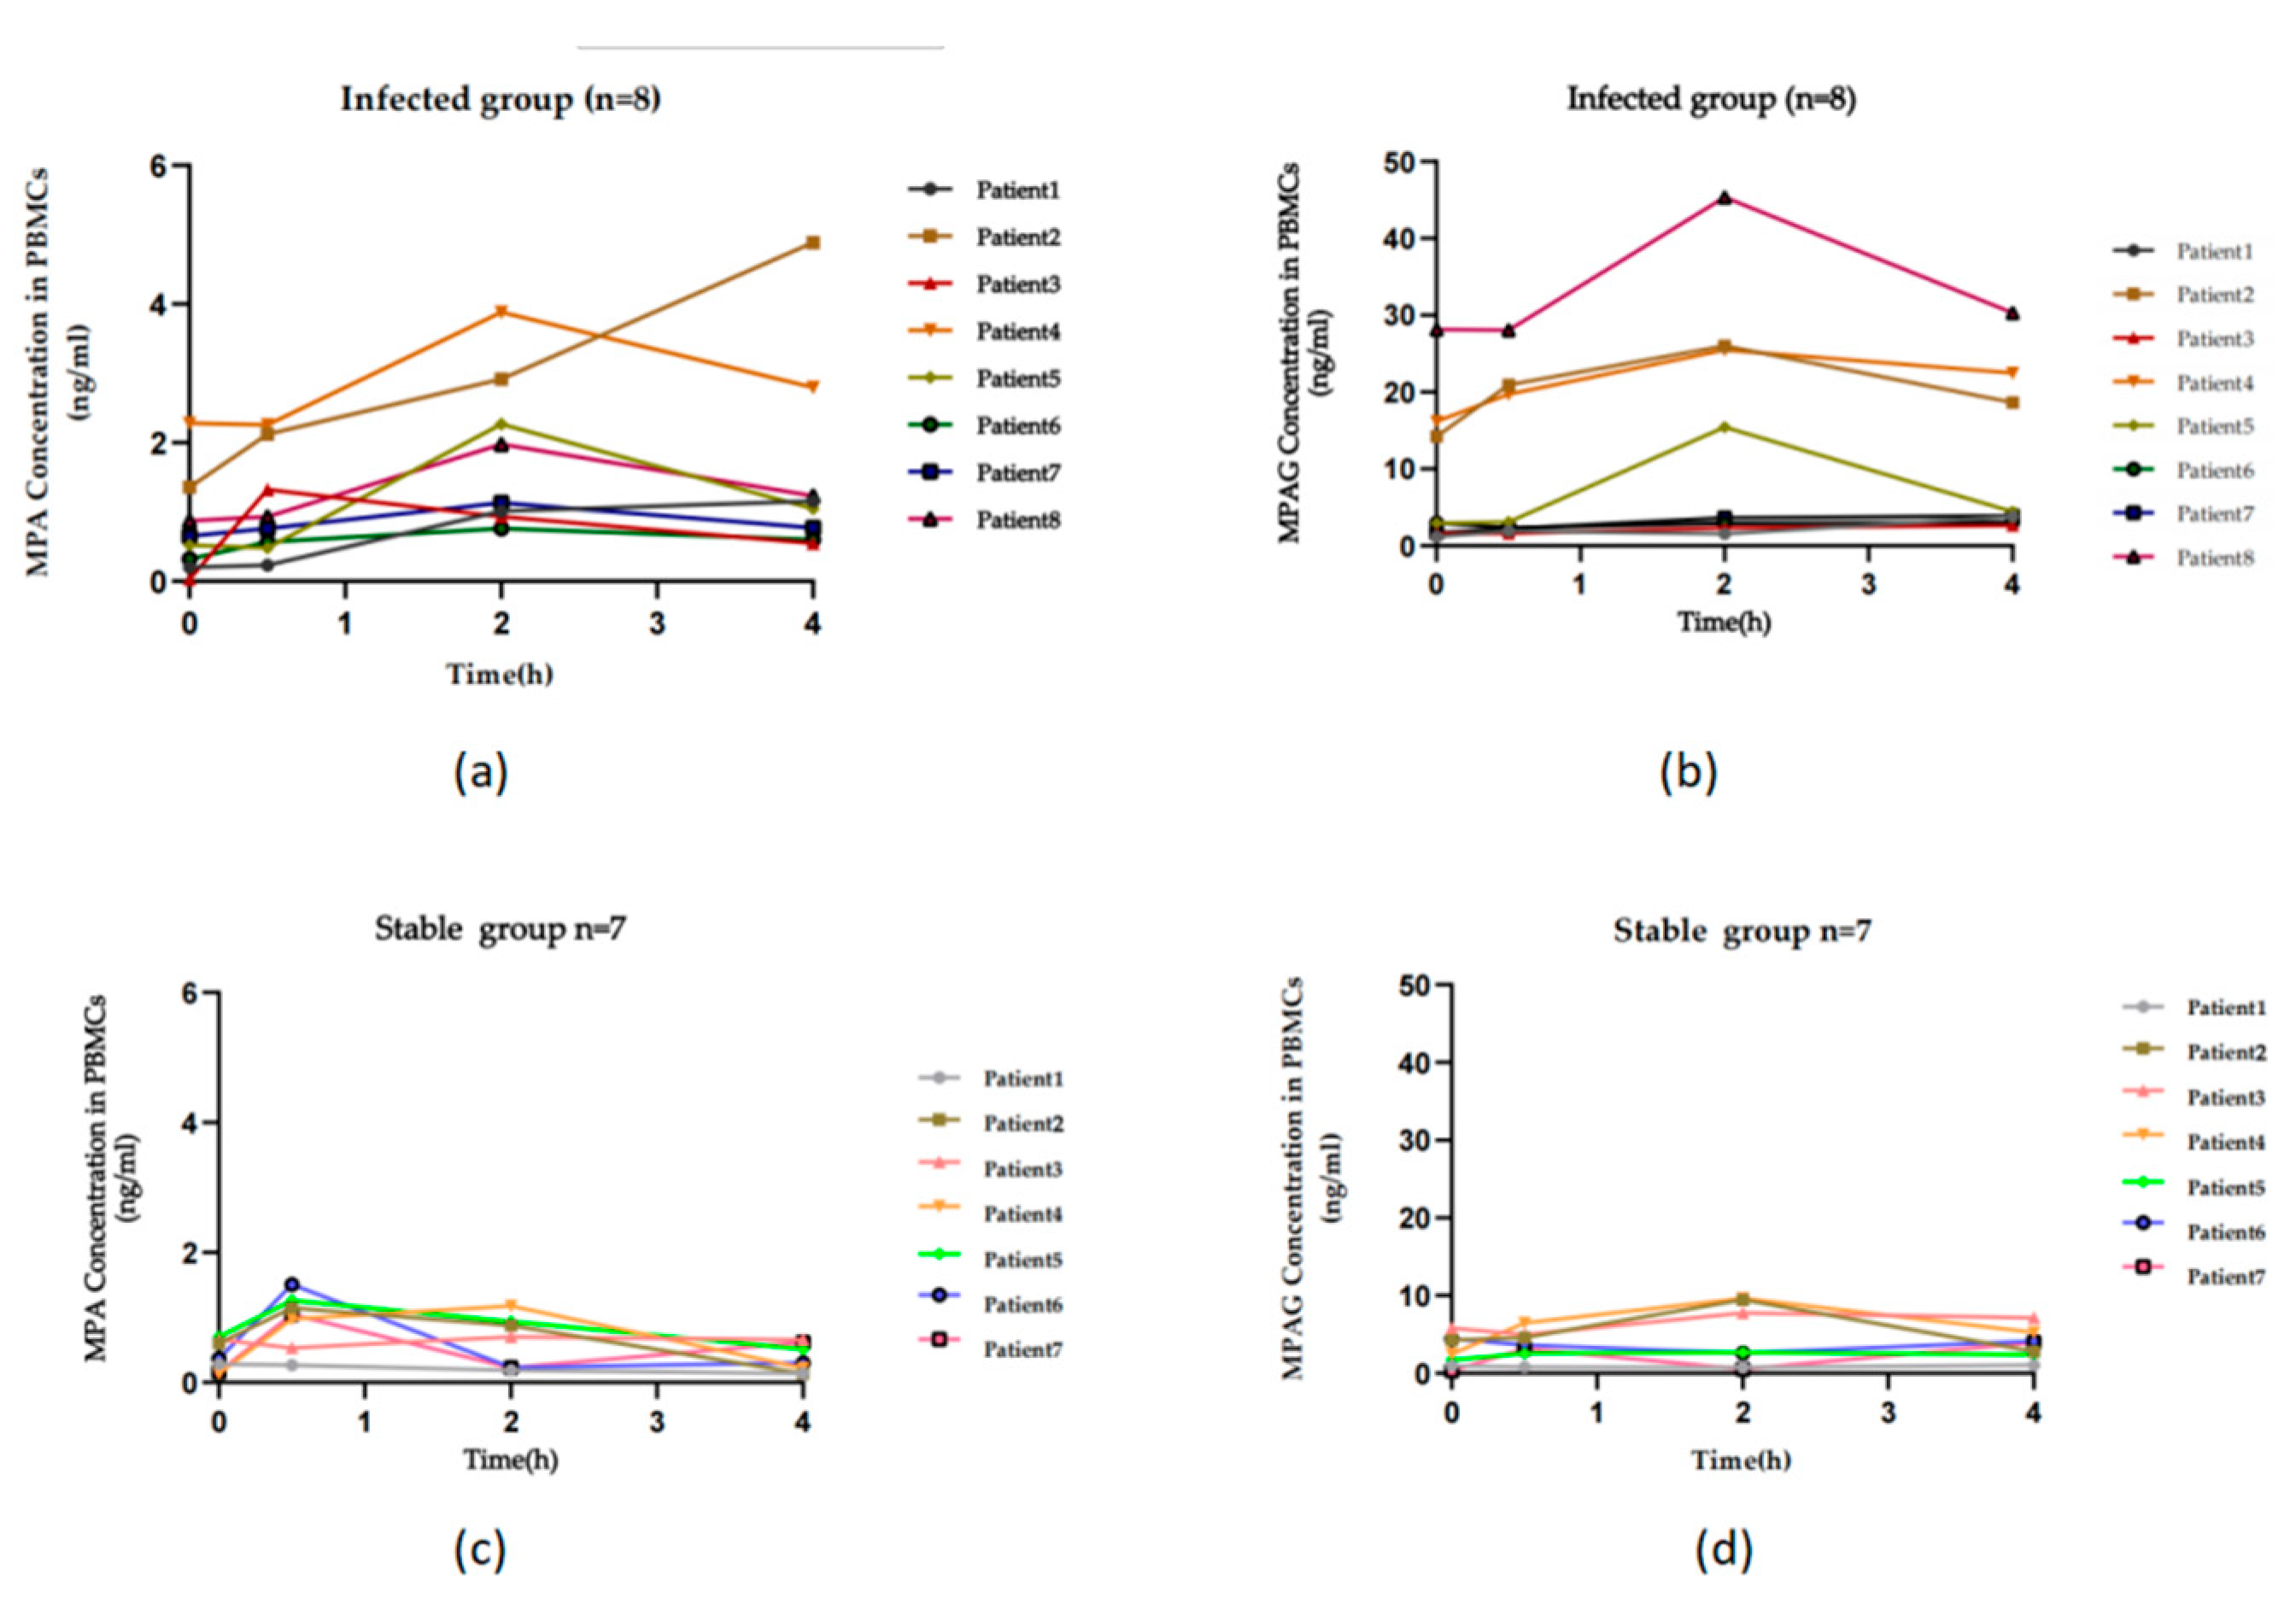
There were significant individual differences in theconcentrations of MPA and its major metabolite MPAG in PBMCs in KTRs.With the time-lapse after drug administration, MPA and MPAG levels in PBMCs showed a substantially simultaneous trend of concentration changes.The concentration of MPAG in PBMCs from renal transplant recipients was approximately 6.85-11.04 times higher than that of MPA.It has been reported that the concentration of MPAG in plasma was about 20-100 times higher than that of MPA[
27].Combined with the results of our study, we suggested that there were differences in the distribution characteristics of MPAG and MPA in plasma and PBMCs, and the differences between MPAG and MPA concentrations in PBMCs were smaller than those in plasma.AcMPAG was virtually undetectable at extremely low levels in PBMCs of KTRs, except in a few recipients.And reports have shown that the concentration of plasma AcMPAG was significantly lower than that of MPA and MPAG, at approximately 10-20% of the MPA concentration [
18].Since samples in our study were stored at -80°C for approximately 1 month, we could not eliminate the possibility of AcMPAG being undetectable due to the degradation.We therefore randomly collected samples from six KTRs, isolated PBMCs within 2 hours of sample collection, and immediately preprocessed the samples and assayed them, and the results similarly showed that AcMPAG was virtually undetectable.Our study suggested that a more sensitive method needs to be established to achieve reliable detection of the extremely low level of AcMPAG in PBMCs to provide clinical application.
Immunosuppressive therapy is an important part of the anti-rejection process after renal transplantation. Optimal immunosuppressive management is the foundation for successful kidney transplantation[
28,
29].Current studies on PBMC-MPA concentration have primarily focused on its association with graft rejection. It has been found that renal transplant recipients who developed rejection had significantly lower PBMC-MPA-C0 than patients without rejection (P=0.029), and there was a concentration-effect relationship between PBMC-MPA-C0 and the rejection severity[
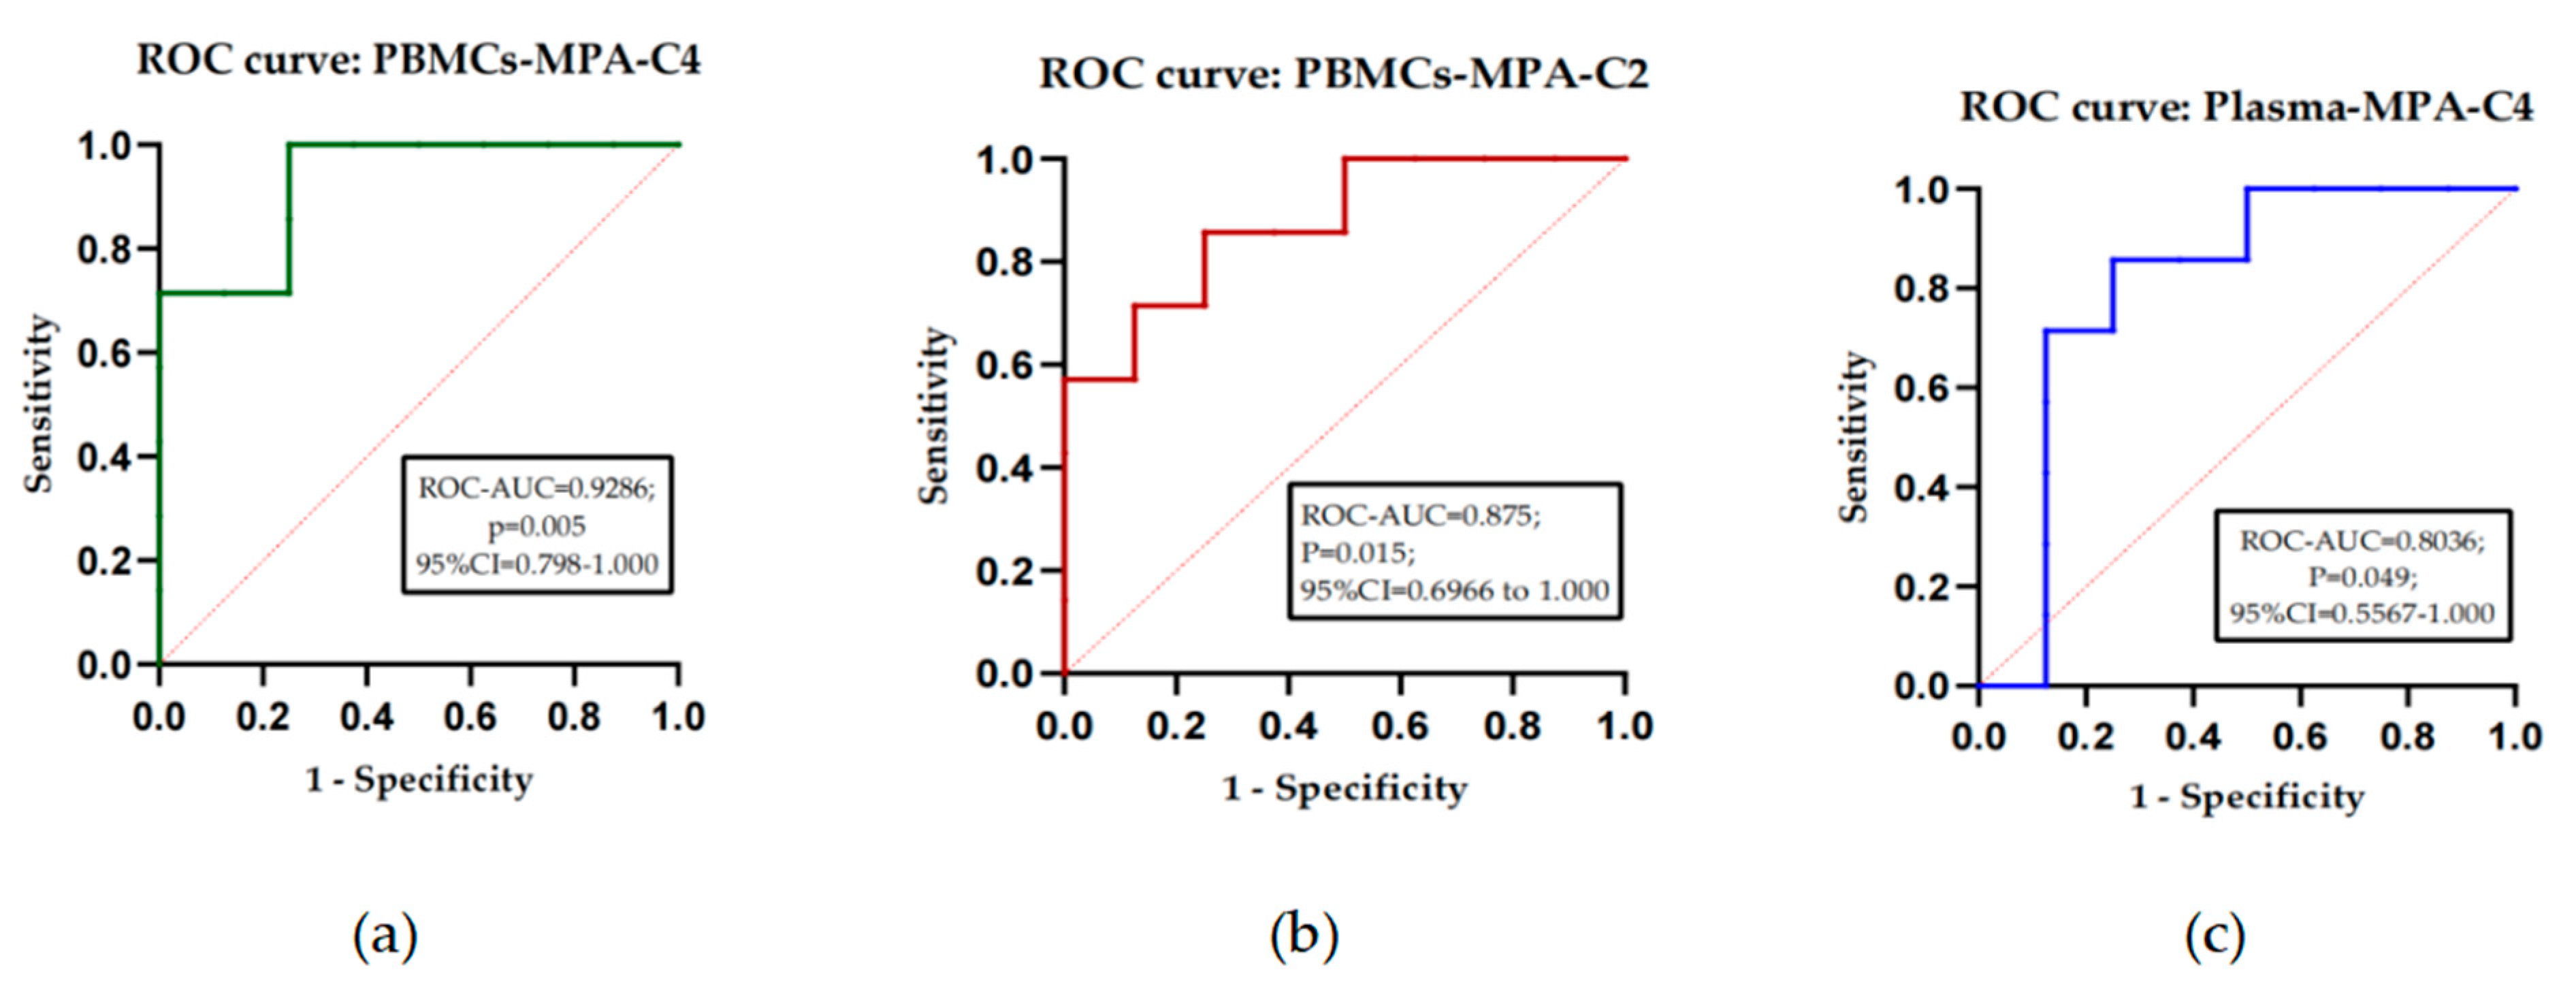
30]. However, studies on PBMC-MPA concentrations and infection in renal transplant recipients have hardly been reported.In this study, we found that the PBMCs of KTRs who developed infections had higher concentrations of MAP than the stable group, with significant mean PBMC-MPA concentrations at 2h post-dose and 4h post-dose.It has been confirmed in our previous study that the plasma MPA concentration at 4h post-dose in KTRs with infection was also significantly higher than that in the stable group. In the ROC curve analysis for the diagnosis of infection in KTRs, it was found that the diagnostic efficacy of PBMCs-MPA-C4 for infection was higher than that of PBMCs-MPA-C2 and higher than Plasma-MPA-C4. These results suggested that the level of MPA drug exposure in KTRs at 4 h post-dose may indeed be closely associated with infection, that MPA overexposure may be an important risk factor for the development of infection, and that the detection of MPA concentration in plasma or PBMC at 4 h post-dose may be a useful predictor of infection in KTRs.However, its exact clinical application value deserves further in-depth research by expanding the sampling volume.We also found that the concentration of MPAG in PBMCs at all time points was also higher in the infected group than the stable group of KTRs, but the difference was not statistically significant.
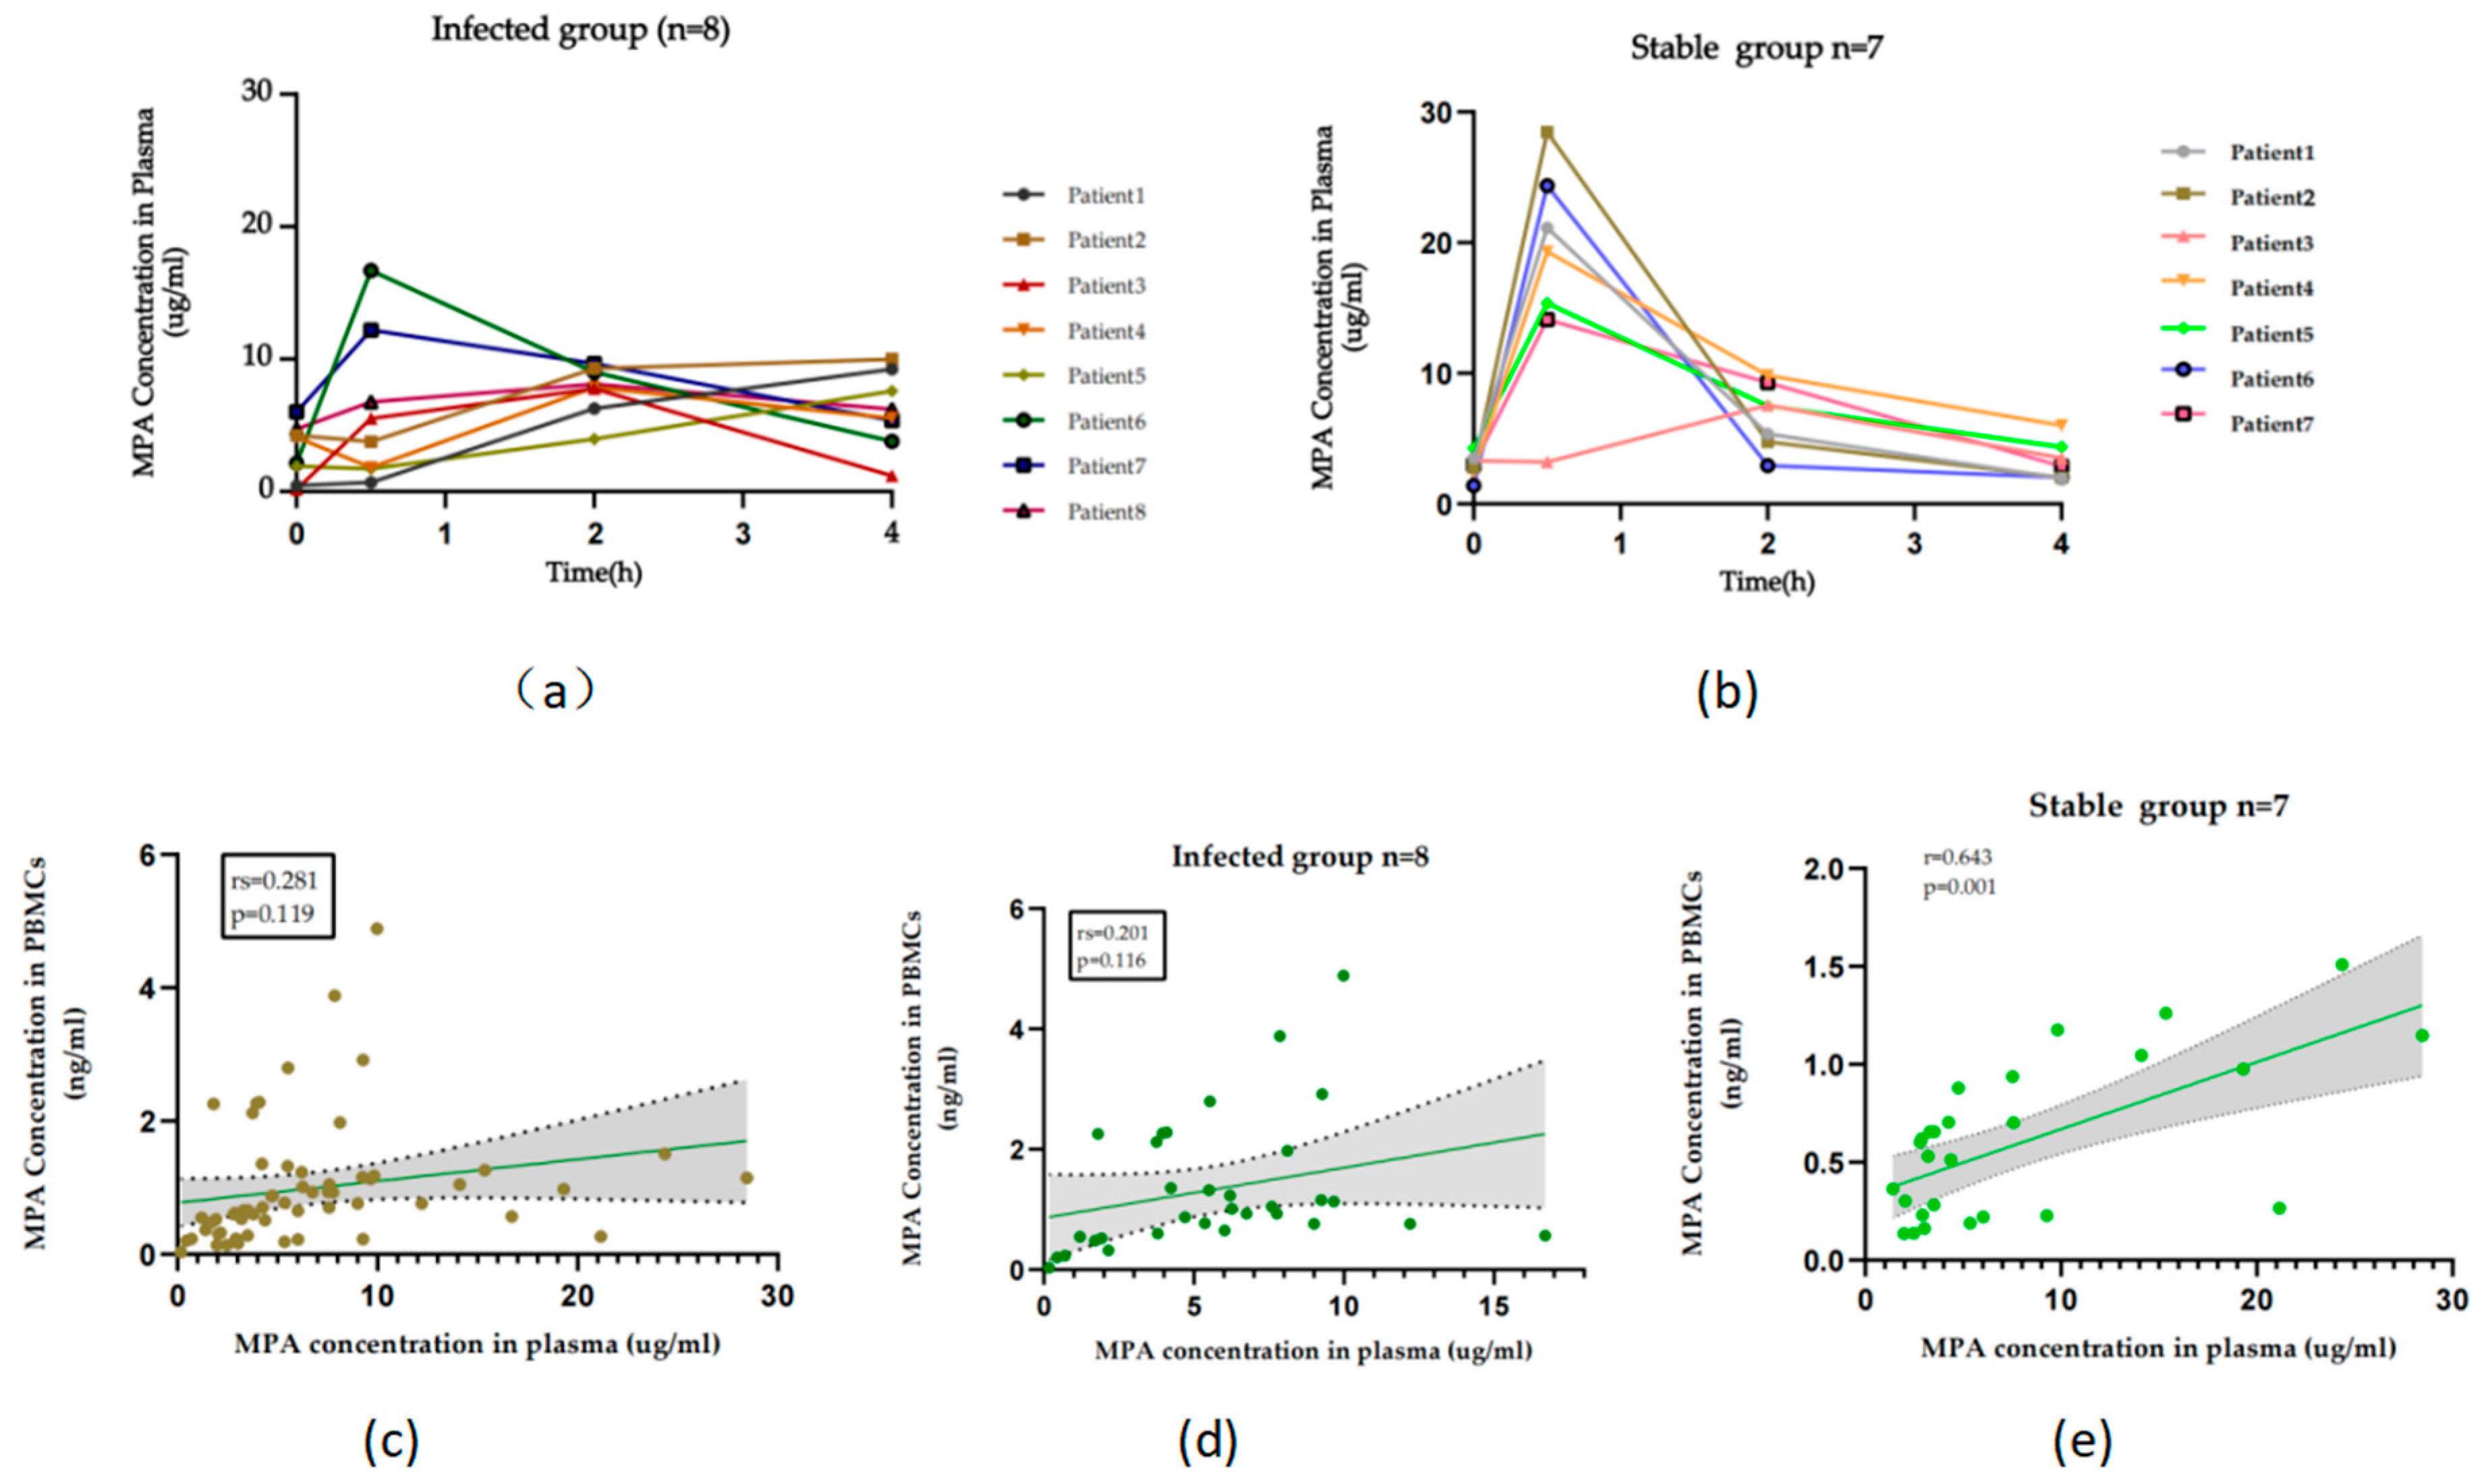
The plasma MPA concentration assay is currently the most commonly used marker for clinical MPA-TDM, which is convenient and automated.Although the PBMC-MPA concentration test is theoretically more responsive to the exposure level of the drug target and thus has a closer relationship with efficacy, it requires a more complex sample pretreatment process and more complicated assay techniques.We compared plasma MPA concentrations and PBMC-MPA concentrations in KTRs and found that while both presented similar drug concentration-time trends, the correlation was poor with each other.When correlation analyses were performed in subgroups, it was found that MPA concentrations in plasma correlated well with PBMCs in the stable group but poorly in the infected group, suggesting that PBMC-MPA but not Plasma-MPA monitoring may be necessary in infected KTRs. When comparing the infected and stable groups we also found that the mean concentration of PBMC-MPA was higher in the infected group than in the stable group at all four-time points, while plasma MPA concentration was higher in the infected group than in the stable group at four hours post-dose at only one-time point.With the overdose of immunosuppressants, there is an excessive suppression of the body’s immune defenses, leading to a decrease in the capacity of the immune system to resist the invasion of pathogens and infection may occur.Therefore, the results of this study indicated that PBMC-MPA concentration could more accurately reflect the immunosuppressive effect of MPA with a narrower range of fluctuation, and might be a more effective new marker for MPA-TDM.
However, there are some limitations in this study.Firstly, the assay was not sensitive enough to detect AcMPAG, leading to the fact that AcMPAG had not been accurately detected in most of the PBMCs. In the future, we will continue to optimize and improve the method for the detect sensitivity.Inadequate inclusion of clinical samples and insufficient time points for the assays may lead to bias in the assessment of PK parameters and clinical applications of MPA, MPAG, and AcMPAG in PBMCs.Follow-up studies remain necessary to expand the sample volume and increase the time points of blood collection for more intensive and detailed research.Finally, this study only focused on the relationship between MPA concentrations in plasma and PBMCs, and subsequent studies will add research on the relationship between MPAG and AcMPAG concentrations in plasma and PBMCs.
