INTRODUCTION
Population aging coupled with a sedentary lifestyle is one of the major challenges in Public Health [
1]. According to World Health Organization (WHO) data [
2], it is estimated that 3.2 million people die each year from physical inactivity. Causes of mortality are increased by between 20% and 30% among under-active individuals [
3]. Across the world, 31.1% adults are physically inactive, and this increases with age [
4].
In Brazil, the elderly population increase has been occurring in an accelerated manner, which requires immediate coping strategies and prevention of health problems, thus providing an active, healthy and independent aging [
5].
Health intervention strategies adopted in the Health System, especially those involving multicompetent actions, also including the practice of physical exercises, are effective in increasing the time spent practicing physical activity [
6].
The increase in the level of physical activity can cause positive effects among the individuals at advanced ages; among them, there is the improvement in muscular strength and resistance, increased aerobic capacity, greater joint flexibility, better balance and coordination, greater psychological well-being, weight loss and better management of chronic diseases or deficiencies [
7]. However, in studies conducted by Hoehner et al. [
8] In Latin America, there is a lack of evidence on the efficacy of physical activity interventions at community levels.
The implementation of programs and actions, and in particular actions aimed at the elderly, whether by universities or official bodies working on health promotion, present themselves as a new trend in social policies, which will have repercussions on new advances and lifestyles [
9], since physical activity is the factor that more consistently predicts healthy aging [
10] and there is strong evidence that it is highly cost effective. [
11]
The objective of this study was to analyze the effects of different physical exercise programs on the anthropometric, cardiovascular, metabolic and strength variables of elderly participants of health care programs.
METHODS
Design
This study is characterized as a controlled clinical trial. The study included elderly people of both genders, aged 60 to 80, patients of two-Family Health Units that offer physical activities for elderly groups, and physical activity programs for the elderly of the Federal University of Acre, all of them duly oriented by Physical Education professionals.
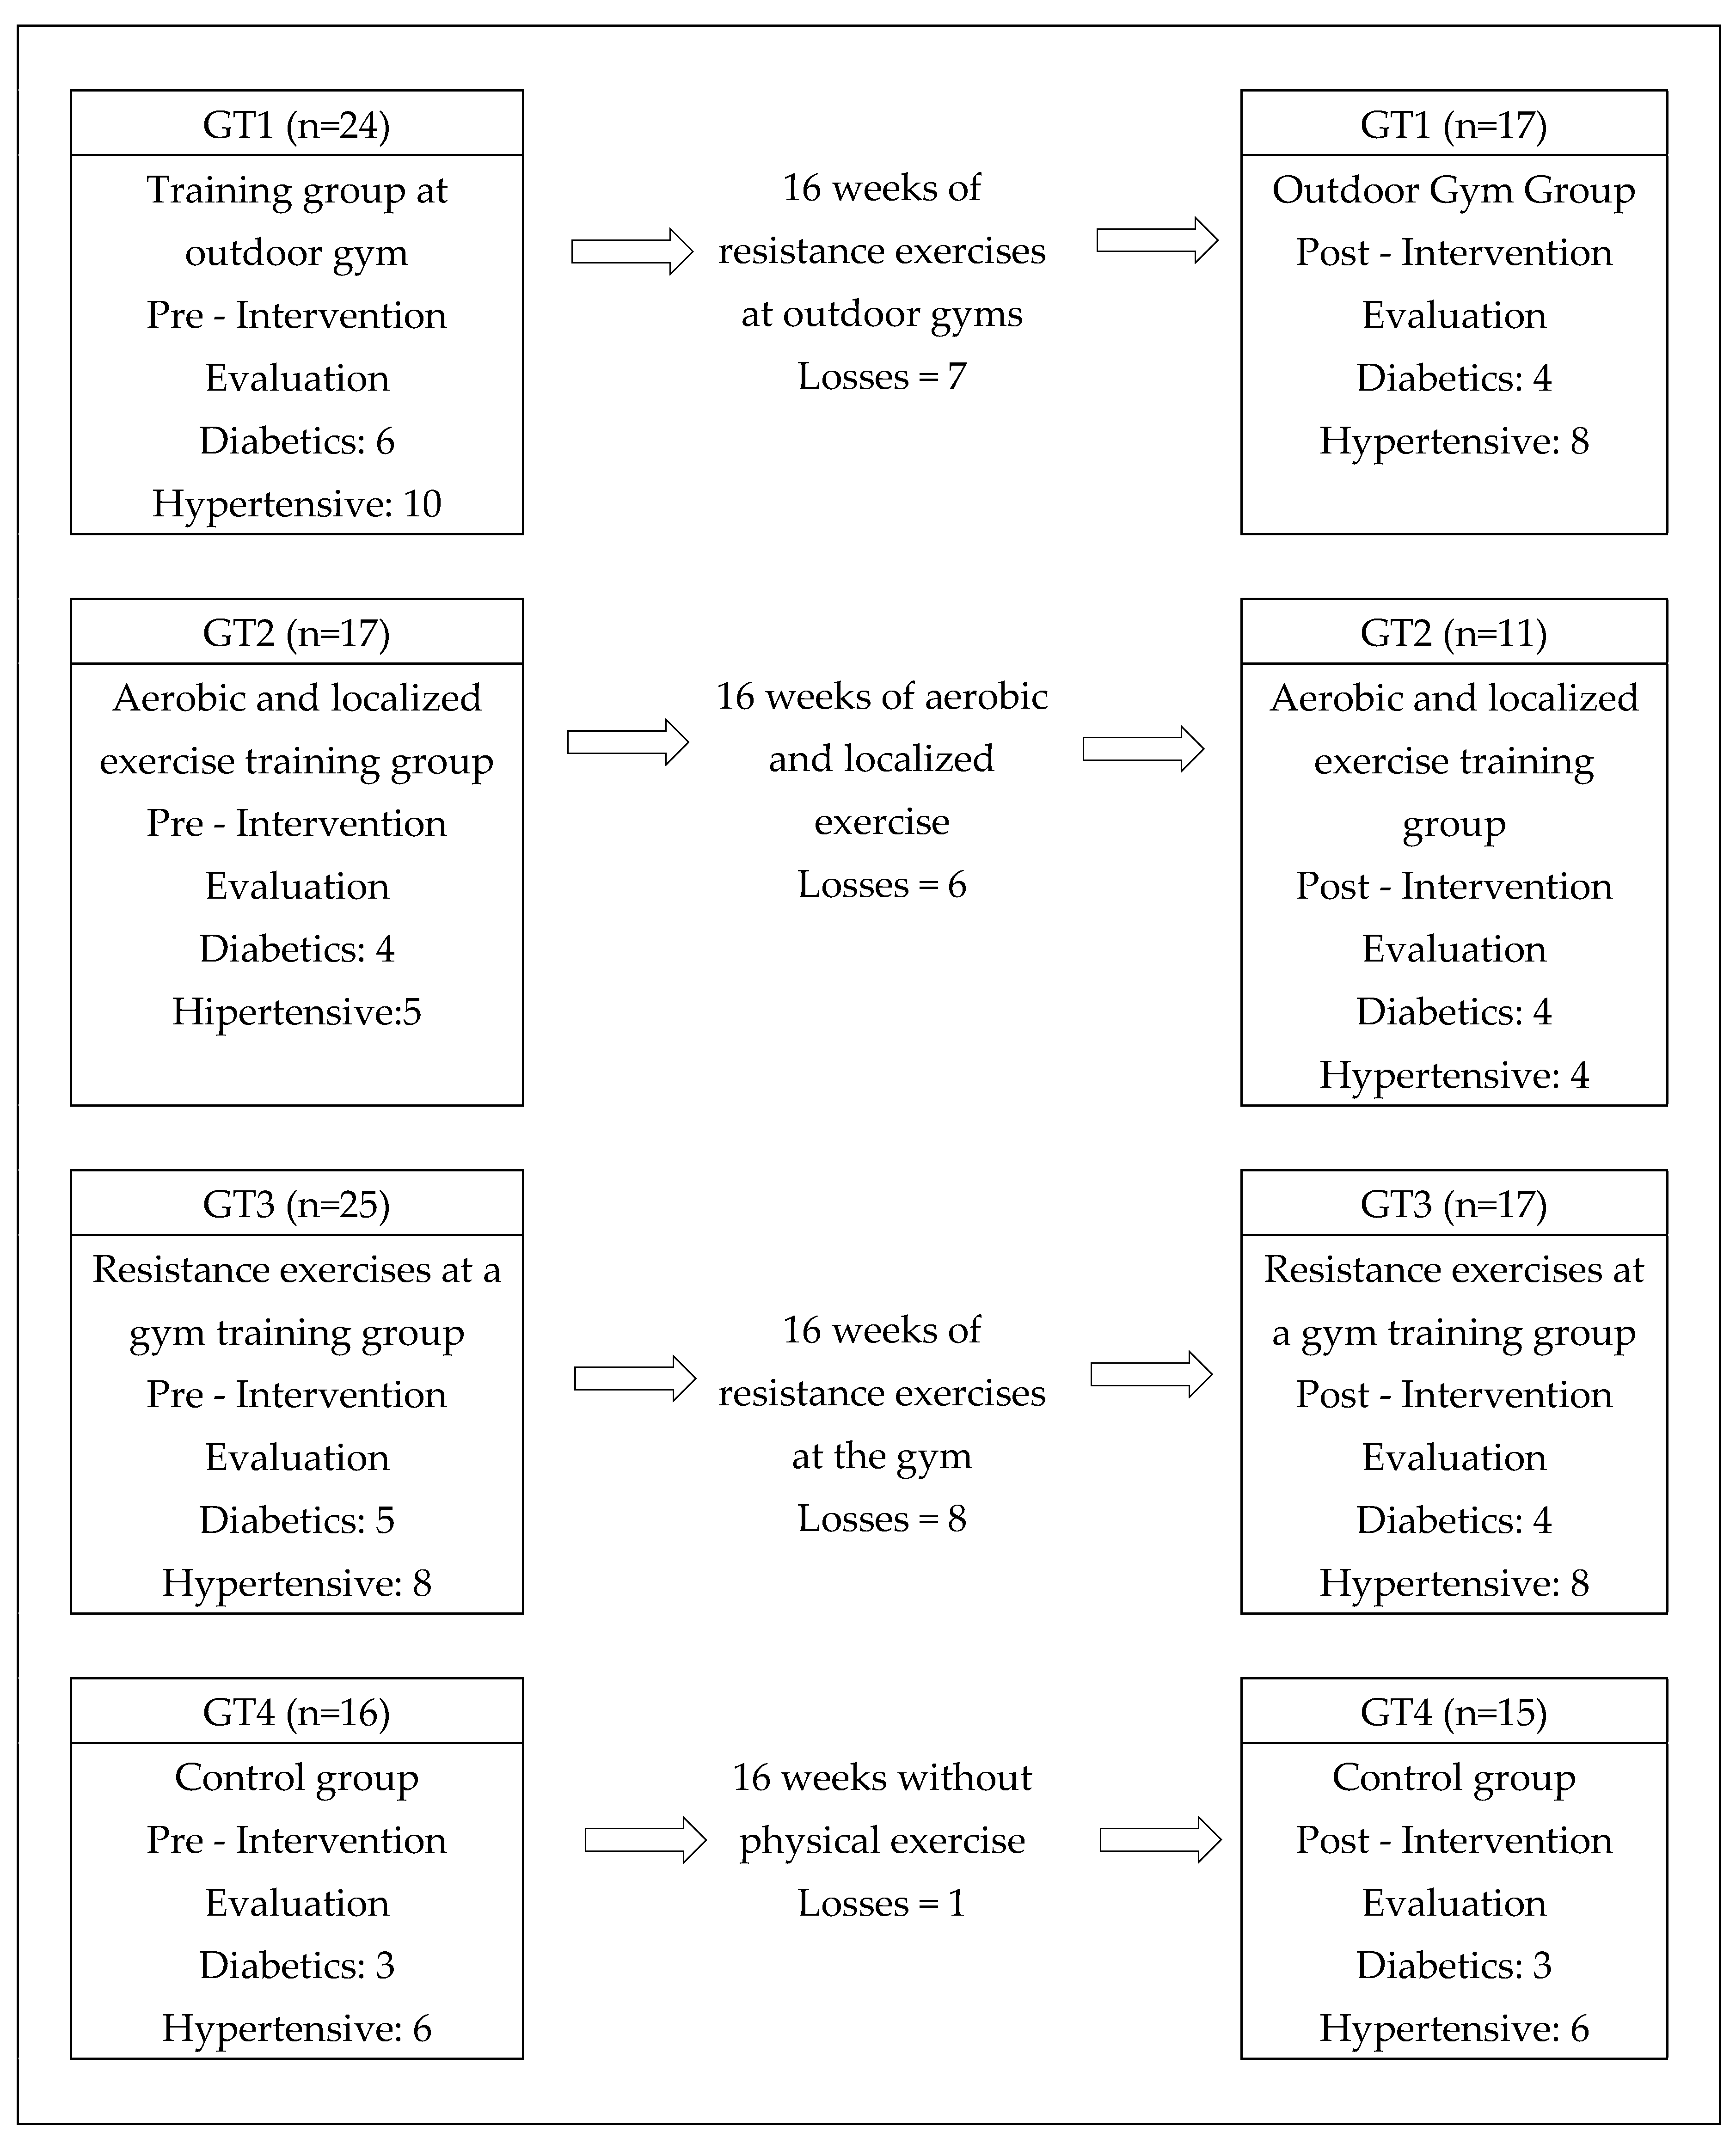
The study included 82 elderly people divided into three experimental groups, allocated according to the modality offered at the family health unit: GT1 (n = 24) Training group at open-air gyms - USF (Bairro Calafate); GT2 (n = 17) Aerobic and localized exercise training group - USF (Bairro Cadeia Velha); GT3 (n = 25) Resistance exercise training group (Active Elderly Extension Program at UFAC) and a control group: CG (n = 16), non-physical exercise practitioners - USF (Bairro Cadeia Velha).
Elderly individuals who had not exercised for at least one month, with the physical conditions to participate in the proposed activities were included in the study. Those who had any physical illness or restriction that prevented them from participating in the activities in a period exceeding one month were excluded; and so were those who attended the classes for less than 75% and those who did not attend the assessments.
The used sampling technique was a simple random sampling. The variable used for the study was weight, since it is related to the body mass index. A pilot sample of 50 individuals was considered. These results served as guidelines for obtaining the final sample size. A Student's t-value of 2.021, a sample variance of 140.12 Kg2 and a sample error of 5% of the mean were considered, that is, error = 3.396 with a confidence level of 95%.
Analyzed variables
The analyzed variables were collected before and after the intervention period in all groups. The anthropometry consisted of measuring weight, height and waist circumference, and calculating the body mass index (BMI) and percentage of body fat. To measure weight, a BALMAK scale, model 111, class III, with divisions of 0.100kg, capacity of 150kg and precision of 1 kg was used. In order to determine height, a Sanny® standing stadiometer was used. With the measures of weight and height, the body mass index (BMI) was calculated by dividing body mass (in kg) by height (in meters) raised squared. To measure the waist circumference (WC), a Sanny® inelastic tape was used, verified in the narrower region between the thorax and the hip, above the umbilical scar.
The skin folds (SF) were measured with a Sanny® scientific adipometer, accurate to 1mm, on the right side of the body, at four sites (subscapular, triceps, supra-iliac and medial calf). The equation of prediction of body density (BD) proposed by Petroski [
12] was applied, and for the calculation of fat percentage, the Siri equation [
13] was used.
Upper limb strength was measured by a hand grip test with a JAMAR Dynamometer, following the ASHT14 guidelines, being evaluated in a seated position and with an elbow at 90°, without moving it and at the signal of the evaluator, it was requested that it pressed the appliance as hard as possible.
To evaluate the strength and resistance of lower limbs, the sit-and-stand test was performed in 30 seconds, where the patient was sitting in a chair, arms crossed against the chest, and at the evaluator's signal, they got up and sat down completely, the maximum of possible times, during 30 seconds. [
15]
Participants were asked to fast for blood tests. Blood samples were collected at room temperature (in a reserved room at a temperature of 20ºC) by a qualified professional, with the subjects seated, by venipuncture after disinfecting the anterior antecubital cutaneous region of the arm with 95% alcohol. Five ml of blood were withdrawn in ETDA-K3 tubes, which were refrigerated and immediately transported to the laboratory to conduct the analyses. Glycemia, cholesterol and triglycerides analyses were performed using the enzymatic colorimetry method, with an Integra 400 equipment, and a Roche reagent kit. The used reagents were specific for each analysis (triglycerides - TRIGL, Glycemia - G gluc3, cholesterol - col chol 2).
Training Protocol
The experimental groups were submitted to 16 weeks of training, with a frequency of three weekly sessions with an average duration of 60 minutes per session.
GT1 performed exercises at outdoor gyms, which are a set of gym equipment deployed in easily accessible spaces. They use the weight of their own body in the execution of movements. Treatment consisted of 30 minutes of activities in a circuit on equipment with walk simulation, riding simulation, leg-press, seated row, vertical rotation, shoulder development and combined triple ski. After that, they participated in recreational activities or group dynamics, followed by stretching.
GT2 performed activities composed of aerobic exercises such as dancing and walking for 20 minutes, followed by exercises for the upper and lower limbs for 30 minutes, and stretching.
GT3 performed a resistance exercise program at the gym of the Federal University of Acre, consisting of exercises for the upper and lower limbs with mono and bi-articular movements. Sixty minutes of activities were performed, starting with a 10-minute walk on the treadmill and a resistance training in the form of a circuit composed of 10 exercises with two sets of 10 to 12 maximum repetitions and with 60 seconds of rest between the devices: bench press, slope supine, front pulley, triceps pulley, biceps screw, leg press 45º, knee extension, knee flexion, standing plantar flexion and straight abdominal on the ground. The loads were adjusted according to the individual progress of each participant.
CG did not practice oriented physical exercise during the intervention period.
Data Analysis
Initially, descriptive statistics were performed on the data, with position measurements (mean, median, mode, and percentiles) and dispersion (amplitude, variance, standard deviation, and standard error).
Afterward, the univariate analysis of these data was performed using the Shapiro-Wilk normality test and Kolmogorov-Smirnov test. The equal variance test would be applied if the normality test presented a result indicating normal distribution (P>0.05). For results with P>0.05, the paired T-Student test would follow; if P≤0.05, the paired T-Student test would follow the non-parametric Mann-Witney test. If the Shapiro-Wilk test presented a result indicating non-normal distribution (P≤0.05), the non-parametric Mann-Witney test would be applied directly.
Still, in the phase of the univariate analysis, the analysis of repeated measures ANOVA One Way was performed because they were the same individuals in different moments in each group. Then, the calculation of percentage variation was applied:
Next, multivariate data analysis was performed using data mining and machine learning techniques.
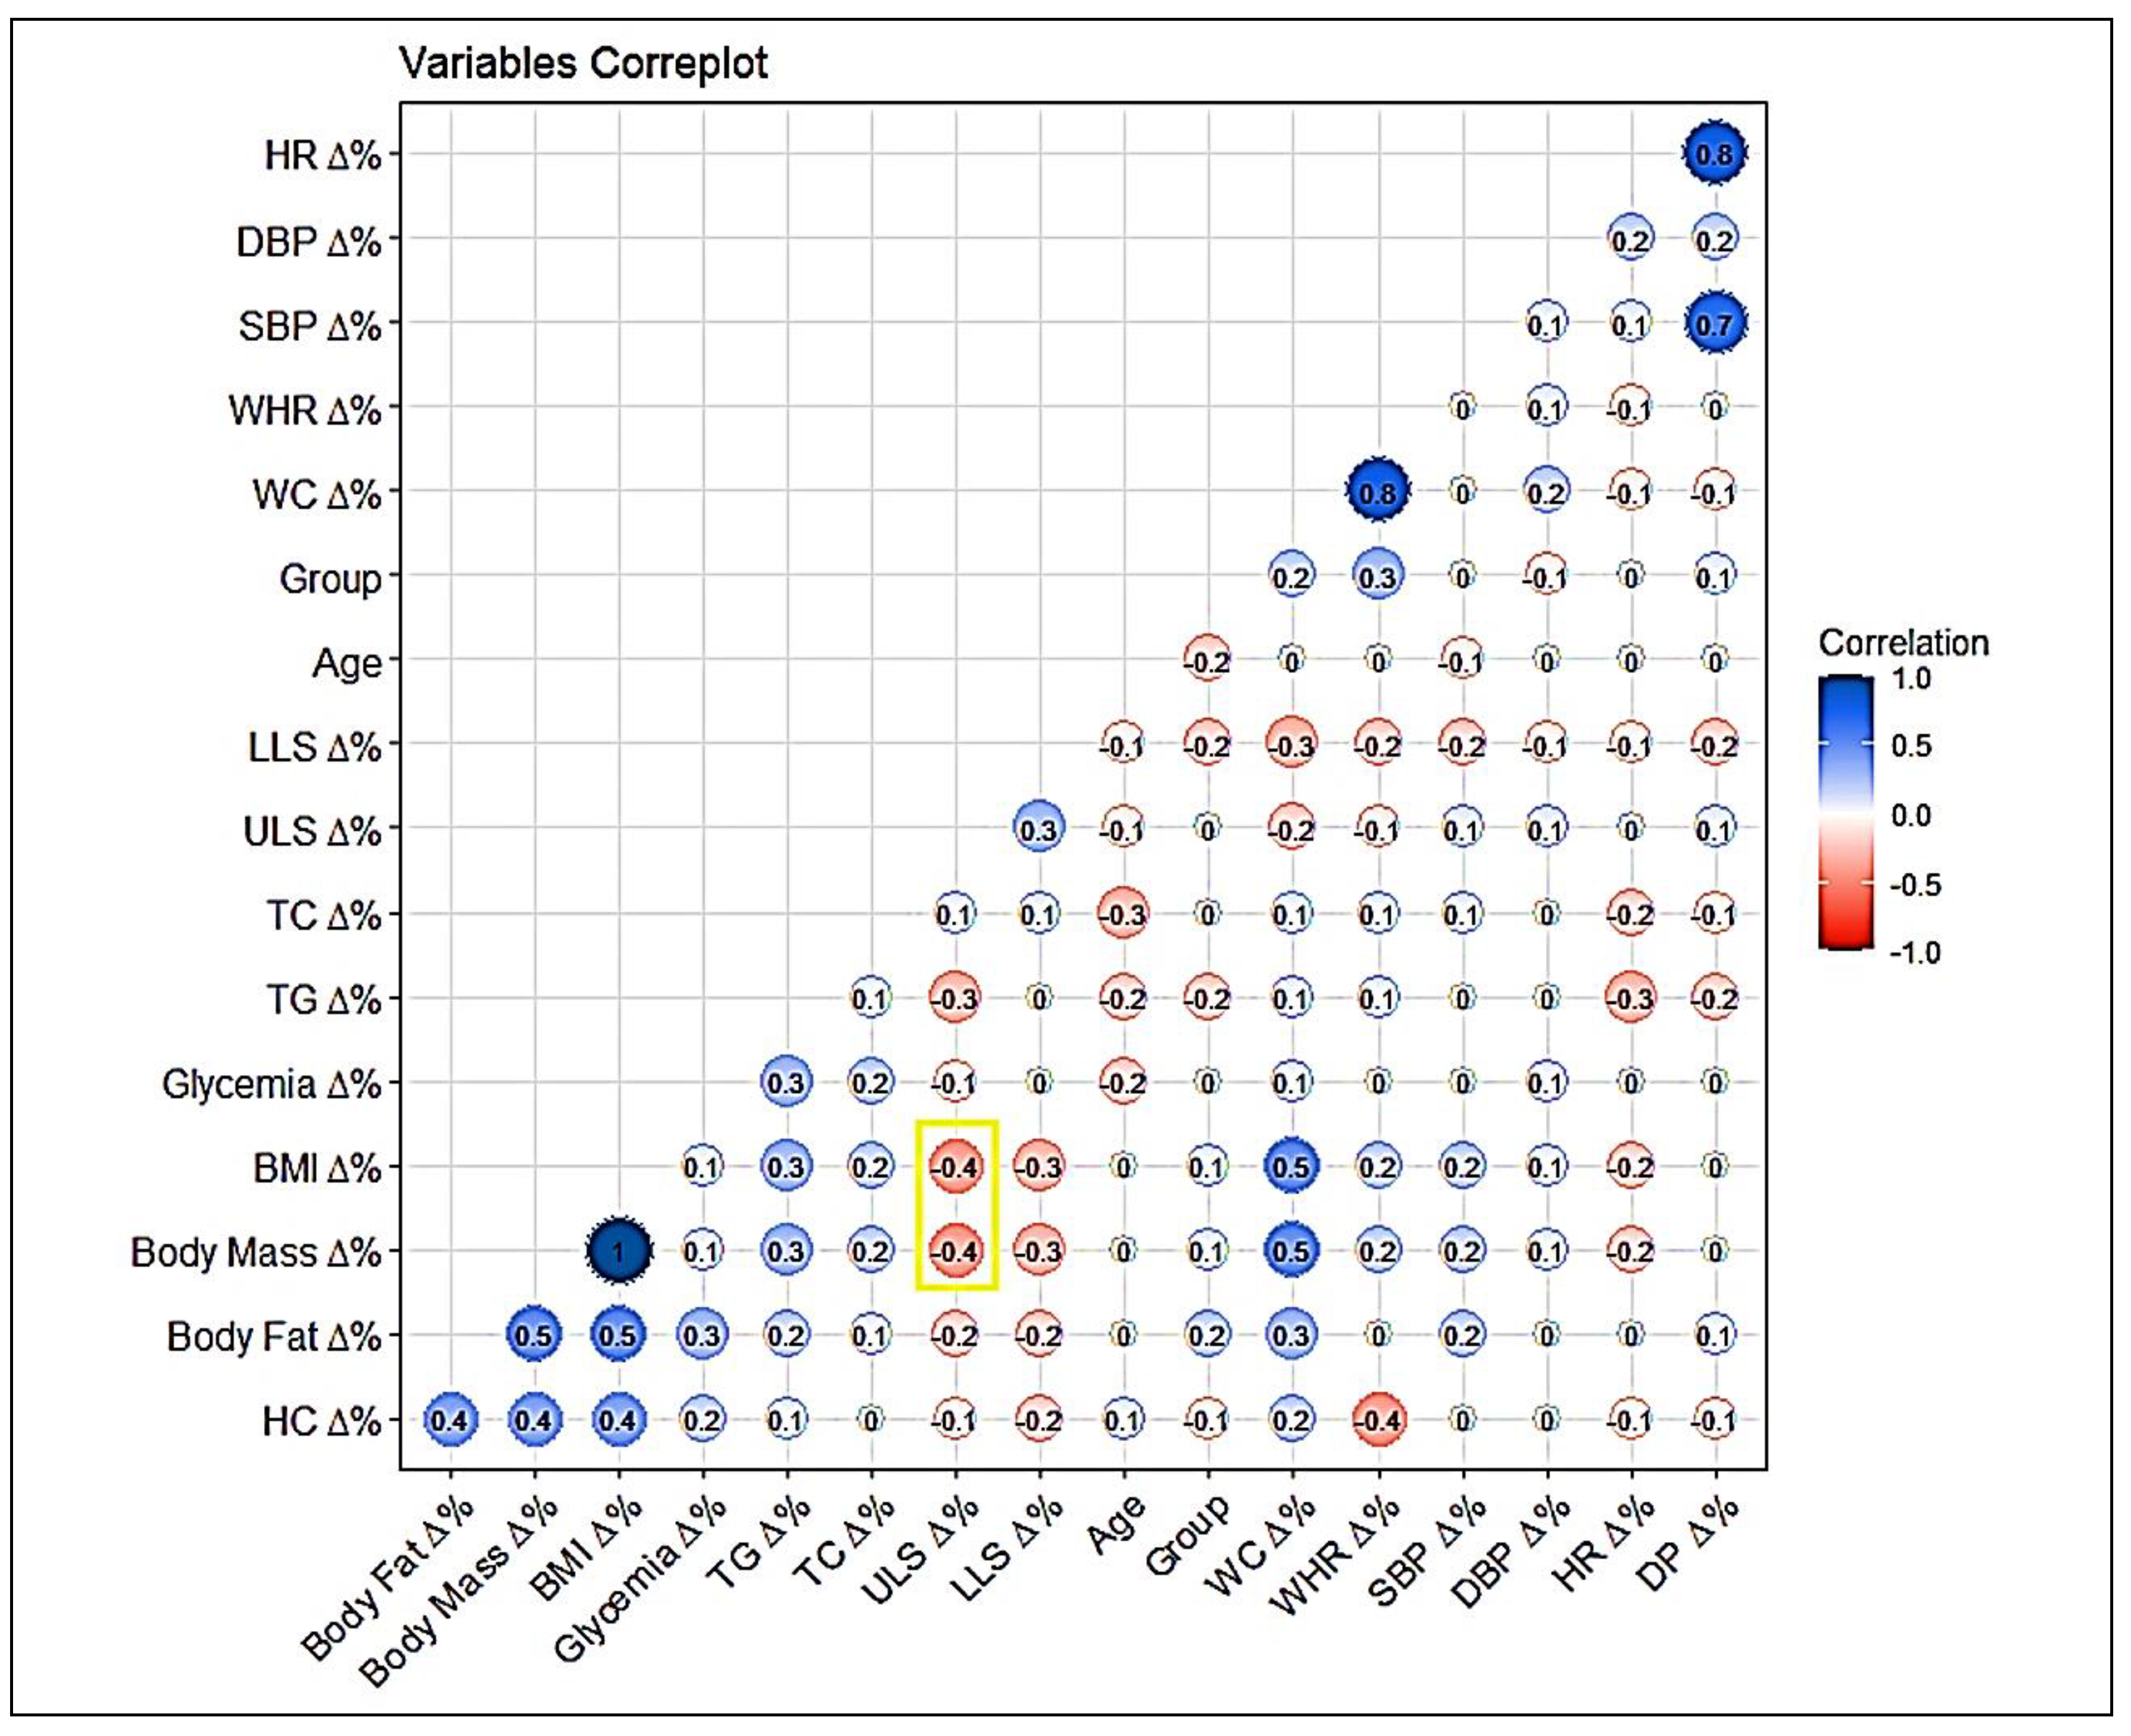
In this phase, in order to seek a bivariate measure between the data, because the observations contain quantitative values, the Pearson and Spearman correlation tests were applied, with the Pearson correlation being used for a visual analysis using the correplot (Correlation Plot) strategy and as an initial measure for the following machine learning analyses.
As exploratory models of machine learning: CLUSTER - Classical Clustering (Agglomerative Hierarchical Method); ORDINATION – Principal Component Analysis (PCA).
The Z score was previously applied to adjust observations measurement units, and the Fruchterman-Reingold algorithm was applied with Euclidian Similarity Index. [
16,
17]
Cohen’s equations [
18] were used to calculate the effect size for all variables to obtain Cohen d and r values:
Where M represents the means of observations and SD their respective standard deviations.
Table 1.
Values of effect size.
Table 1.
Values of effect size.
| Effect size |
Small |
Medium |
Large |
| Cohen r |
0.10 |
0.30 |
0.50 |
| Cohen d |
0.20 |
0.50 |
0.80 |
SigmaPlot 14.5 (Academic Perpetual License - Single User – ESD Systat® USA), R and R Studio (Free version for Windows), AcaStat 10.0 (Free version for Windows) and, Past 4.03 (Free version for Windows) was used to carry out the different statistical tests and produce the graphs.
Ethical aspects
The project was approved by the Comitê de Ética em Pesquisa para Seres Humanos da União Educacional do Norte - UNINORTE (Registration No. 59873816.9.0000.8028).
RESULTS
The study began with 82 elderly people who agreed to participate in the study, distributed in groups according to the criterion of proximity between residence and place of practice. Before the beginning of the interventions, the elderly filled out anamnesis fact sheets on their general health state and existence of diseases, such as hypertension and diabetes. During the interventions, the groups presented losses due to dropouts, disease affection and for attending less than 75% of the classes, as shown in the flowchart (
Figure 1).
Table 2 describes the characteristics of age, weight, BMI and gender of the elderly, according to the distribution in treatment and control groups.
Table 3 shows the values obtained in the anthropometric and physical conditioning variables before and after the intervention in each group. Taking into account classical tests such as the T-test between two means and ANOVA between three or more, it was only possible to observe a significant difference between the post and pre-GT3 time for ULS, between the post and pre GT2 time for LLS, between the post and pre GT3 time for LLS, the latter being different about CG and GT1. However, more holistic and integrated results will be observed in future tests.
Still observing the data from the classic tests mentioned above,
Table 4 showed a significant difference for glycemia GT2 and CG between the pre- and post-periods, also with more accurate analyses during the work.
Aiming to complete the phase of classical analysis of the variables,
Table 5 presented the results of the cardiovascular variables, including systolic blood pressure, diastolic blood pressure, heart rate, and double product, but without significant differences between times and groups. These results will be questioned after subsequent analyses within the present study.
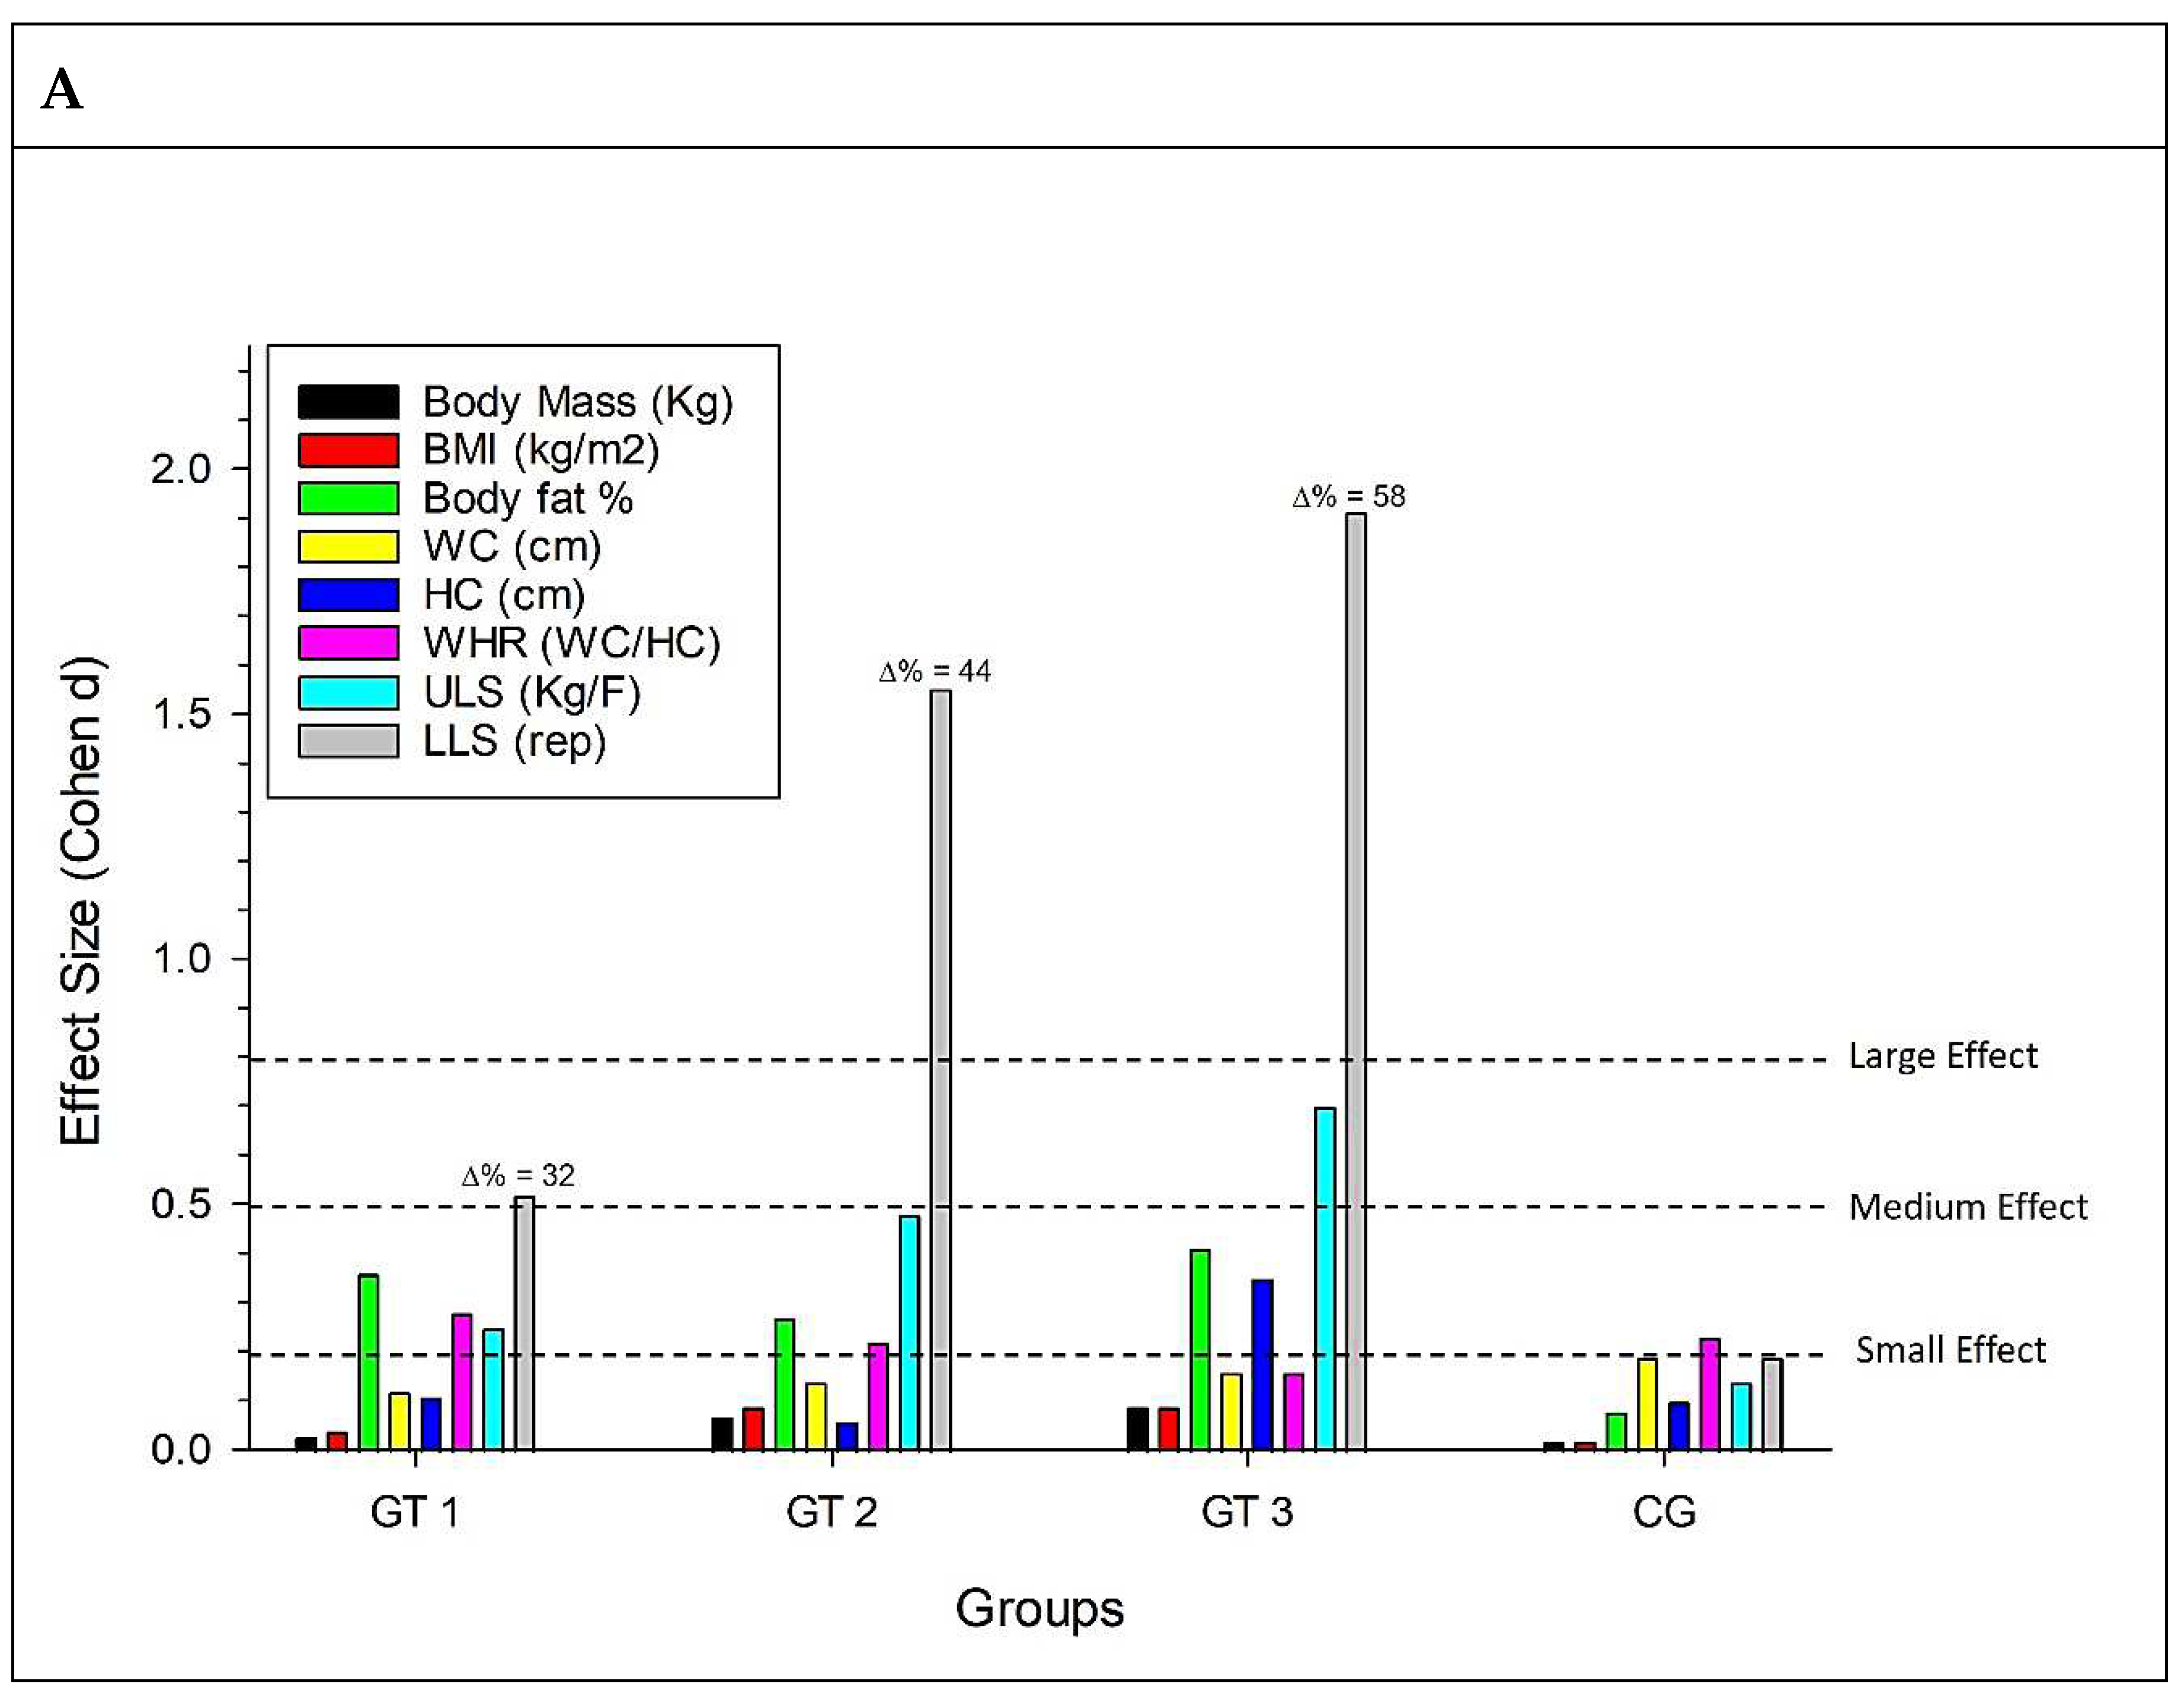
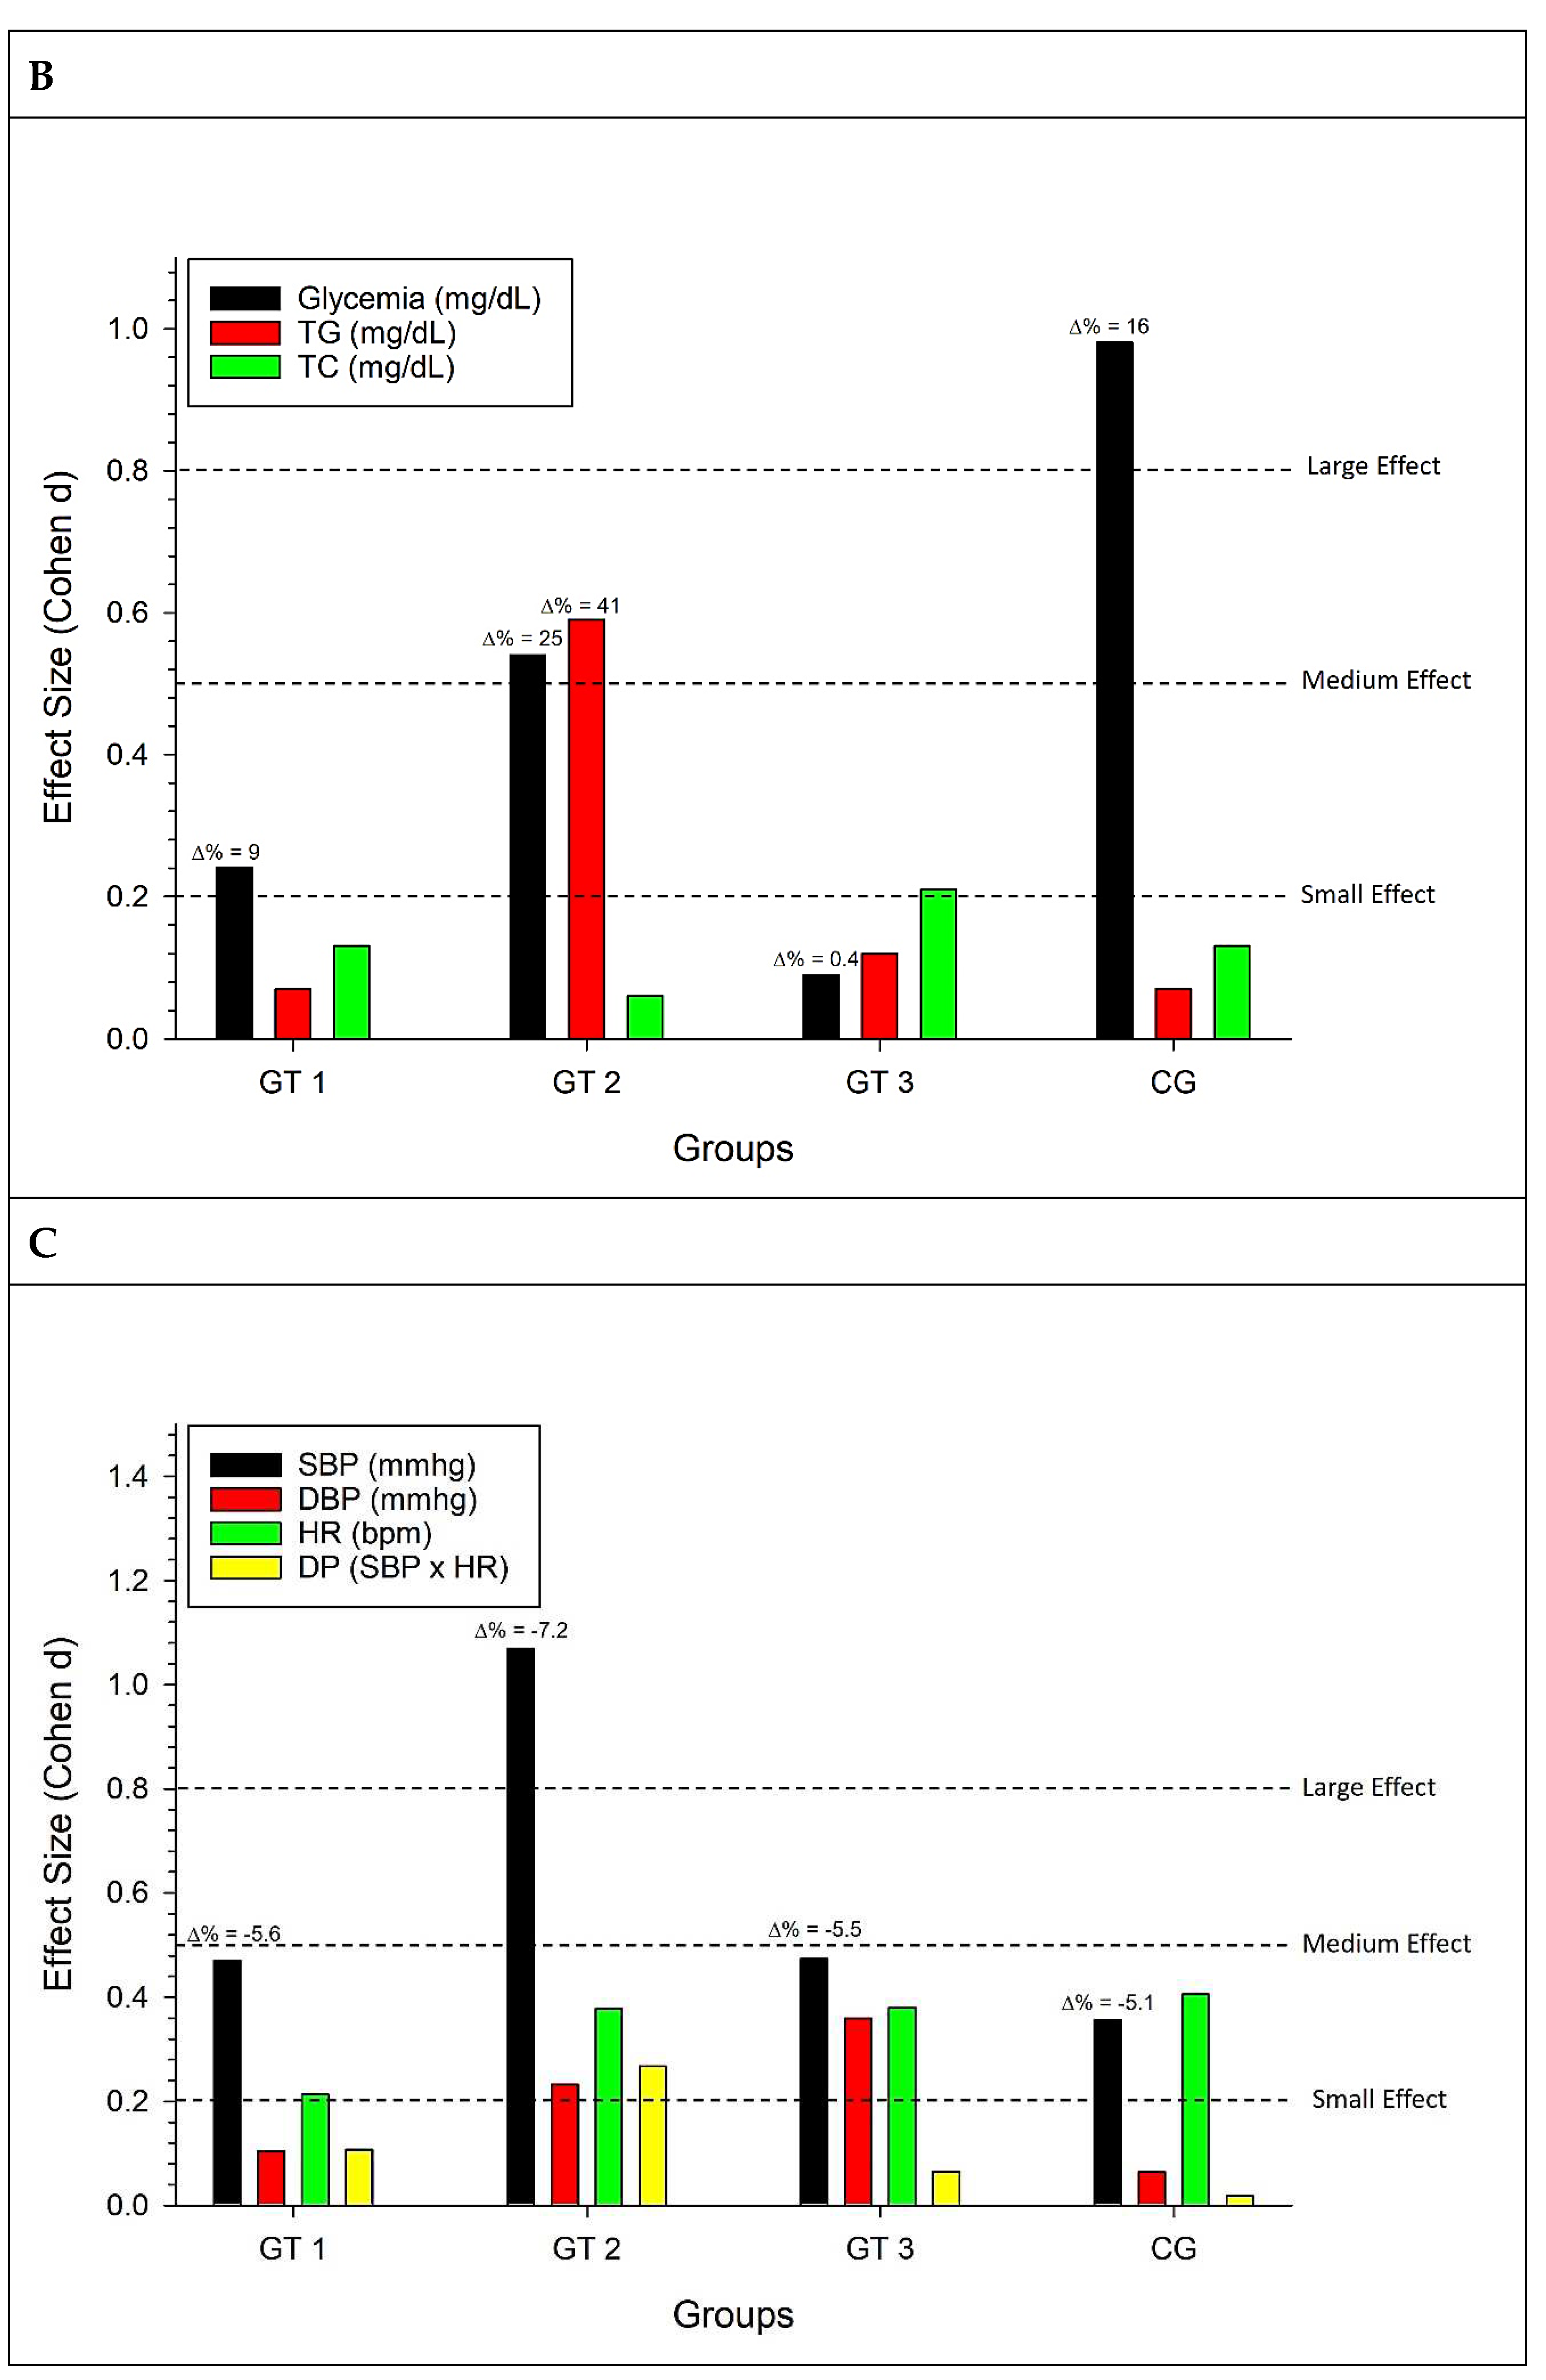
Figure 2 is revealed in graph A, which deals with morphofunctional variables for the GT1 group, a small effect for fat percentage, WHR, and ULS, and a medium effect for LLS. For the GT2 group, there was a small effect for fat percentage, WHR, and ULS and a large effect for LLS. For the GT3 group, there was a small effect for the percentage of fat and HC, a medium effect for ULS, and a large effect for LLS.
In graph B, which deals with biochemical variables, a small effect for glycemia in GT1, a medium effect for glycemia and triglycerides for GT2, a small effect for total cholesterol for GT3, and a large effect for glycemia in CG, with this effect being an increase in this analyte.
As for the cardiovascular variables (C), there is a small effect for SBP and HR in GT1, a small effect for DBP, HR, and DP, and a large effect for SBP in GT2, a small effect for SBP, DBP, and HR in GT3 and small effects for SBP and HR in CG.
Still seeking a holistic view of the data,
Figure 3 presented the association between the percentage variations of the study variables, with the Pearson correlation being calculated as quantitative data. It was possible to observe the correlation coefficients, with a highlight in yellow for the intriguing inverse correlation between BMI (P = 0.0007) and Body Fat% (P = 0.007) with ULS.
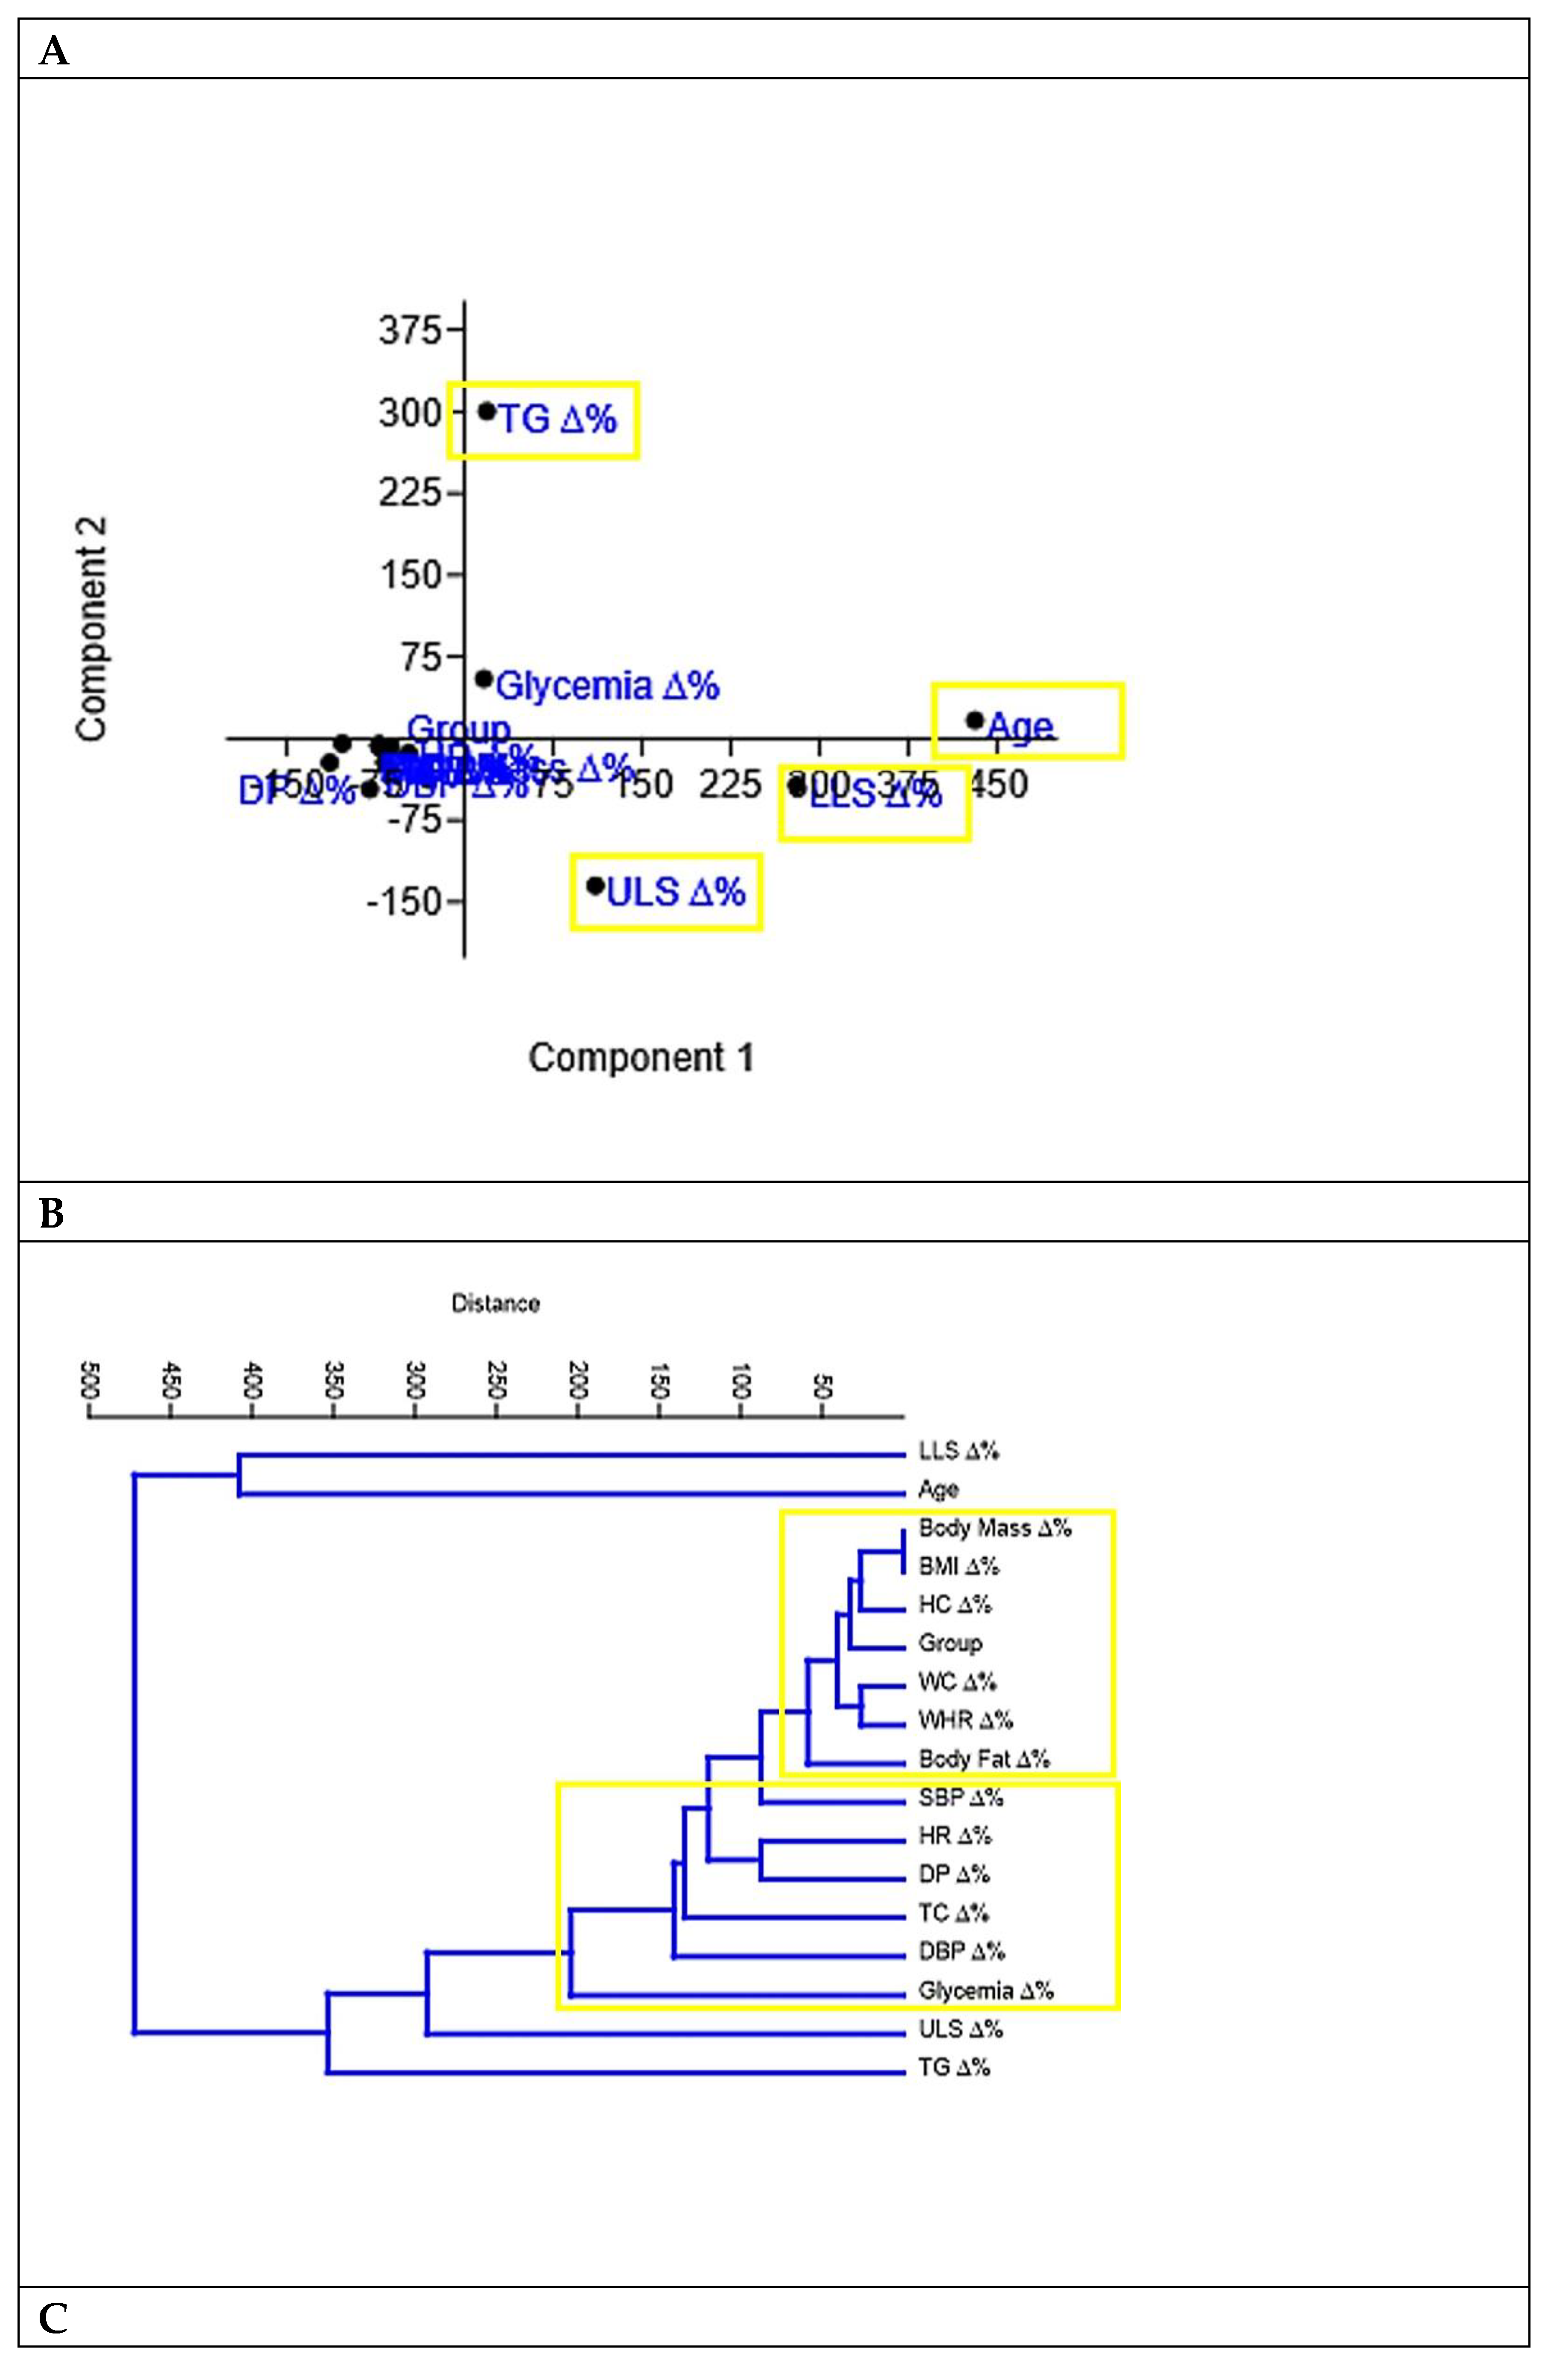
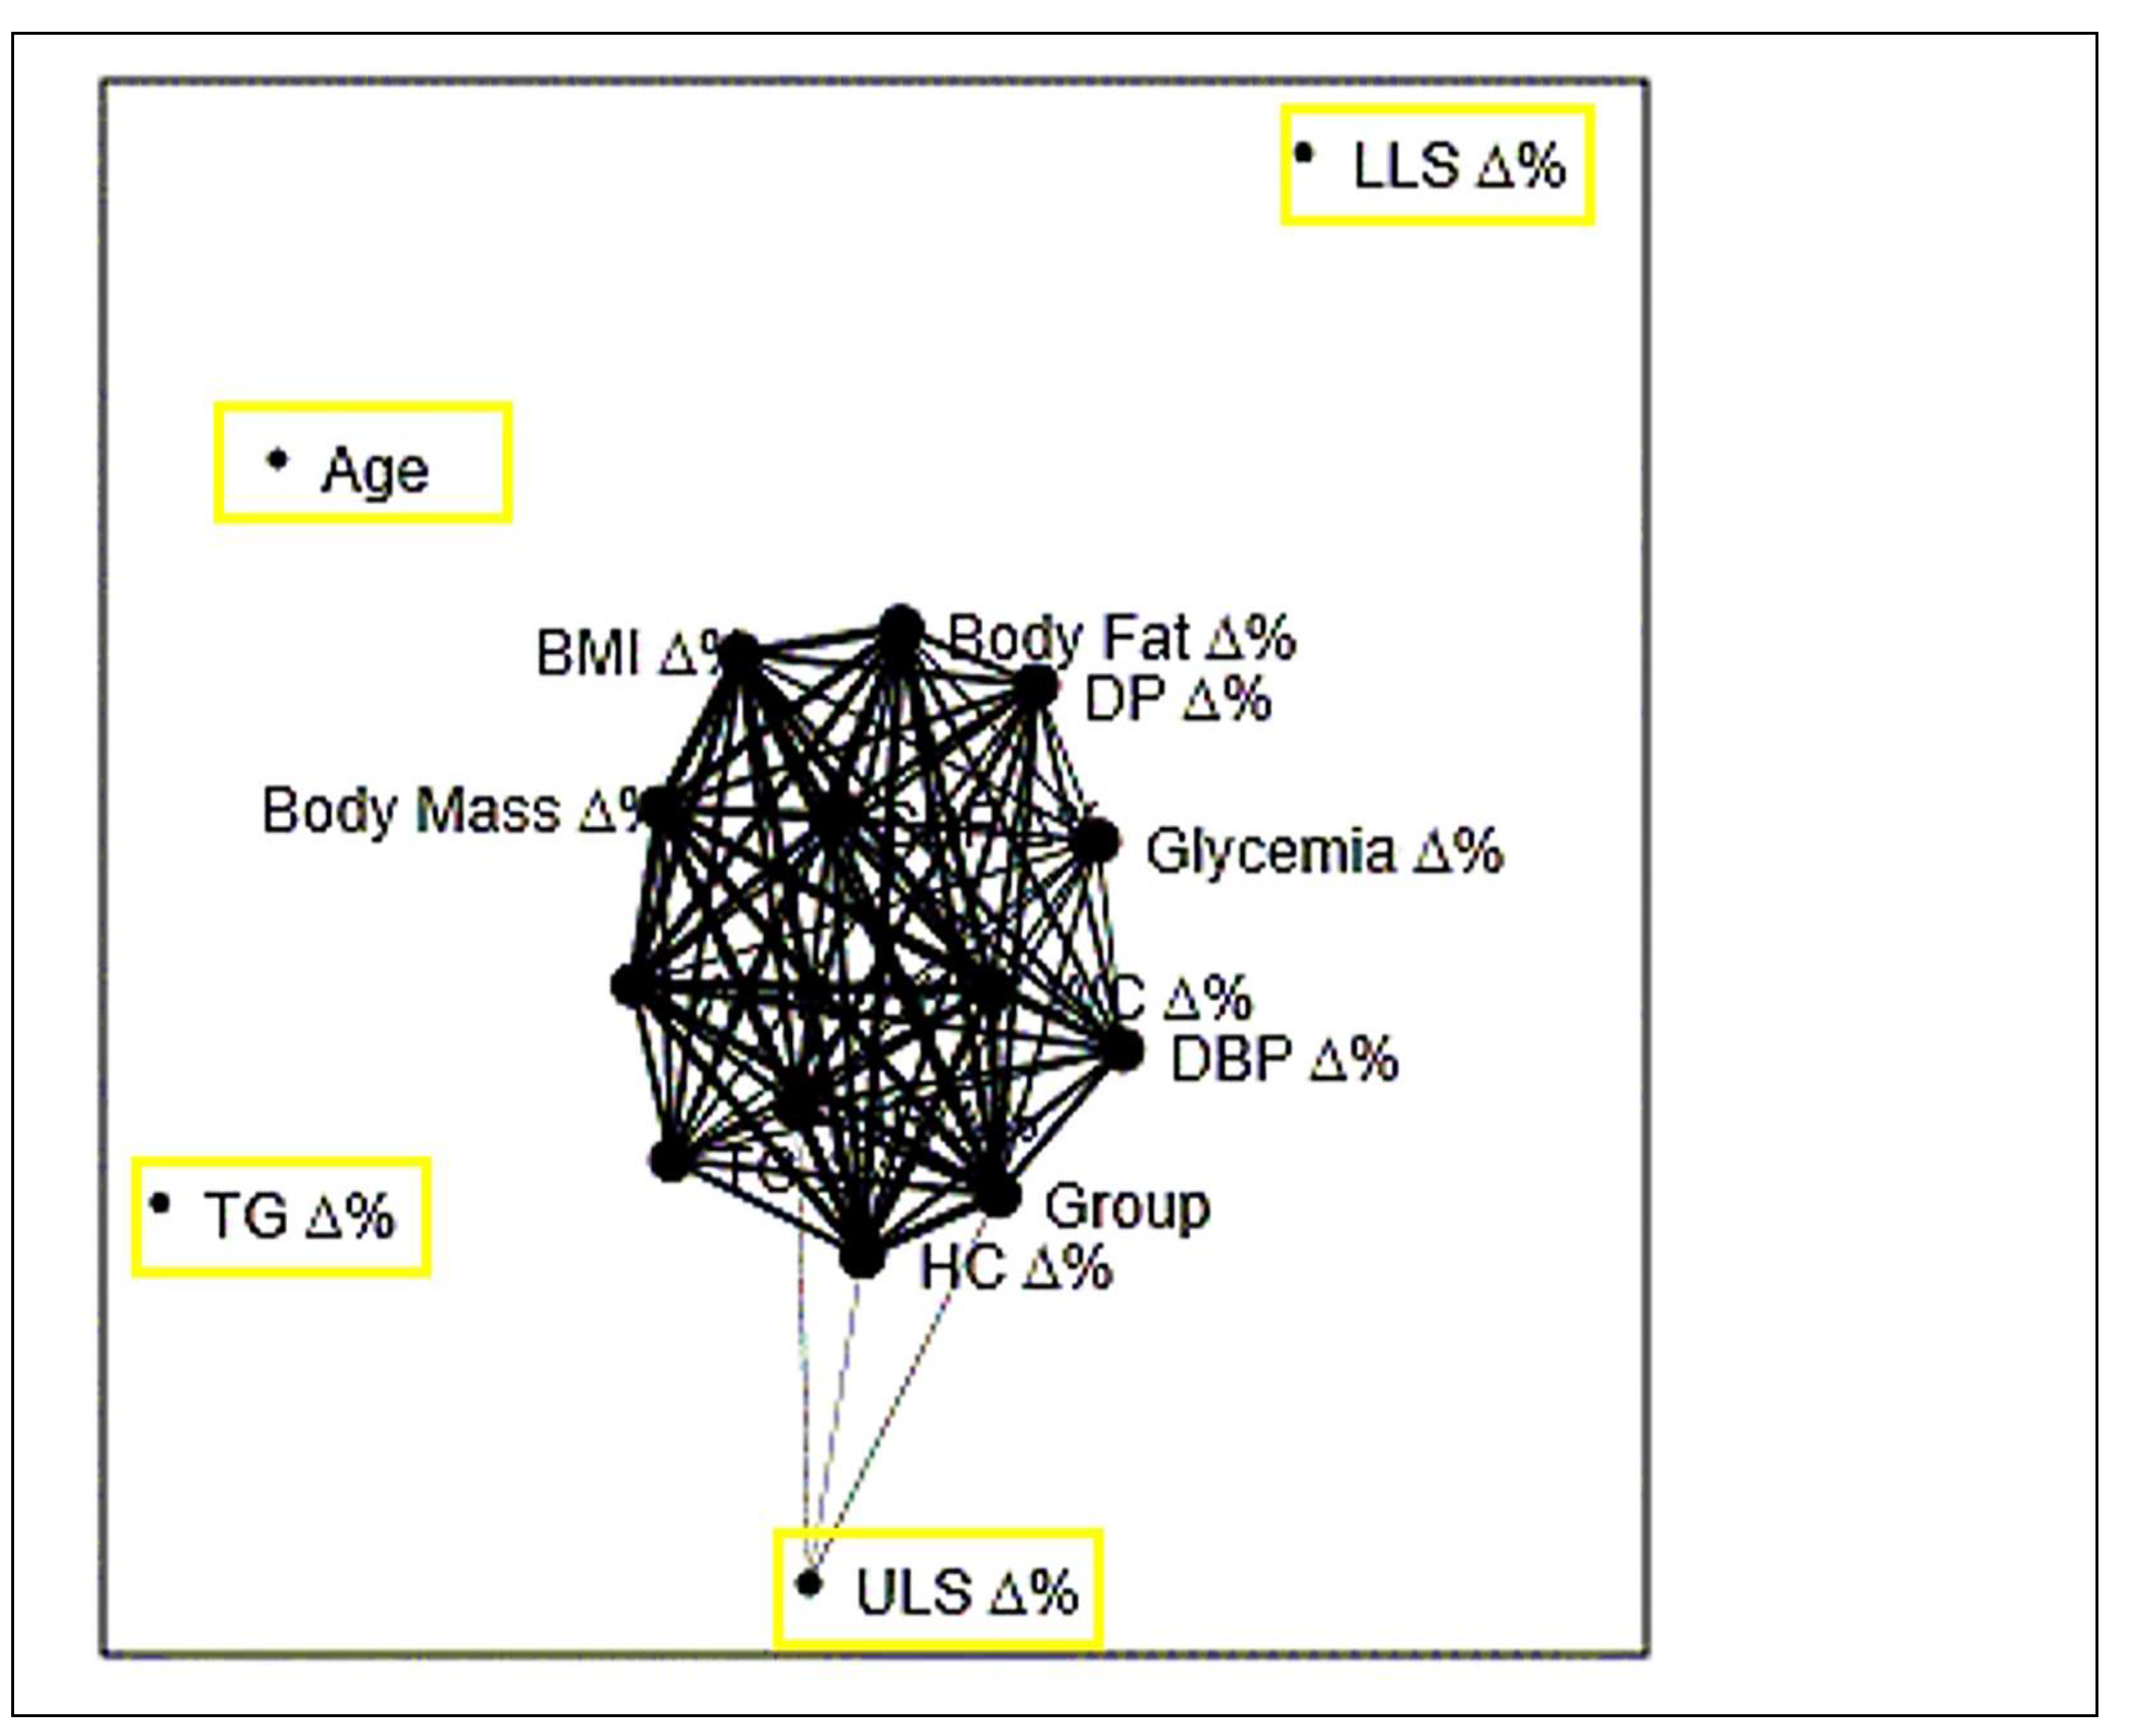
Figure 4 indicated through principal component analysis (A), cluster analysis (B) and network plot with Fruchterman-Reingold algorithm (C) that the variables TG, LLS and ULS were the ones that differed most in each type stimulus chosen as intervention in the present study.
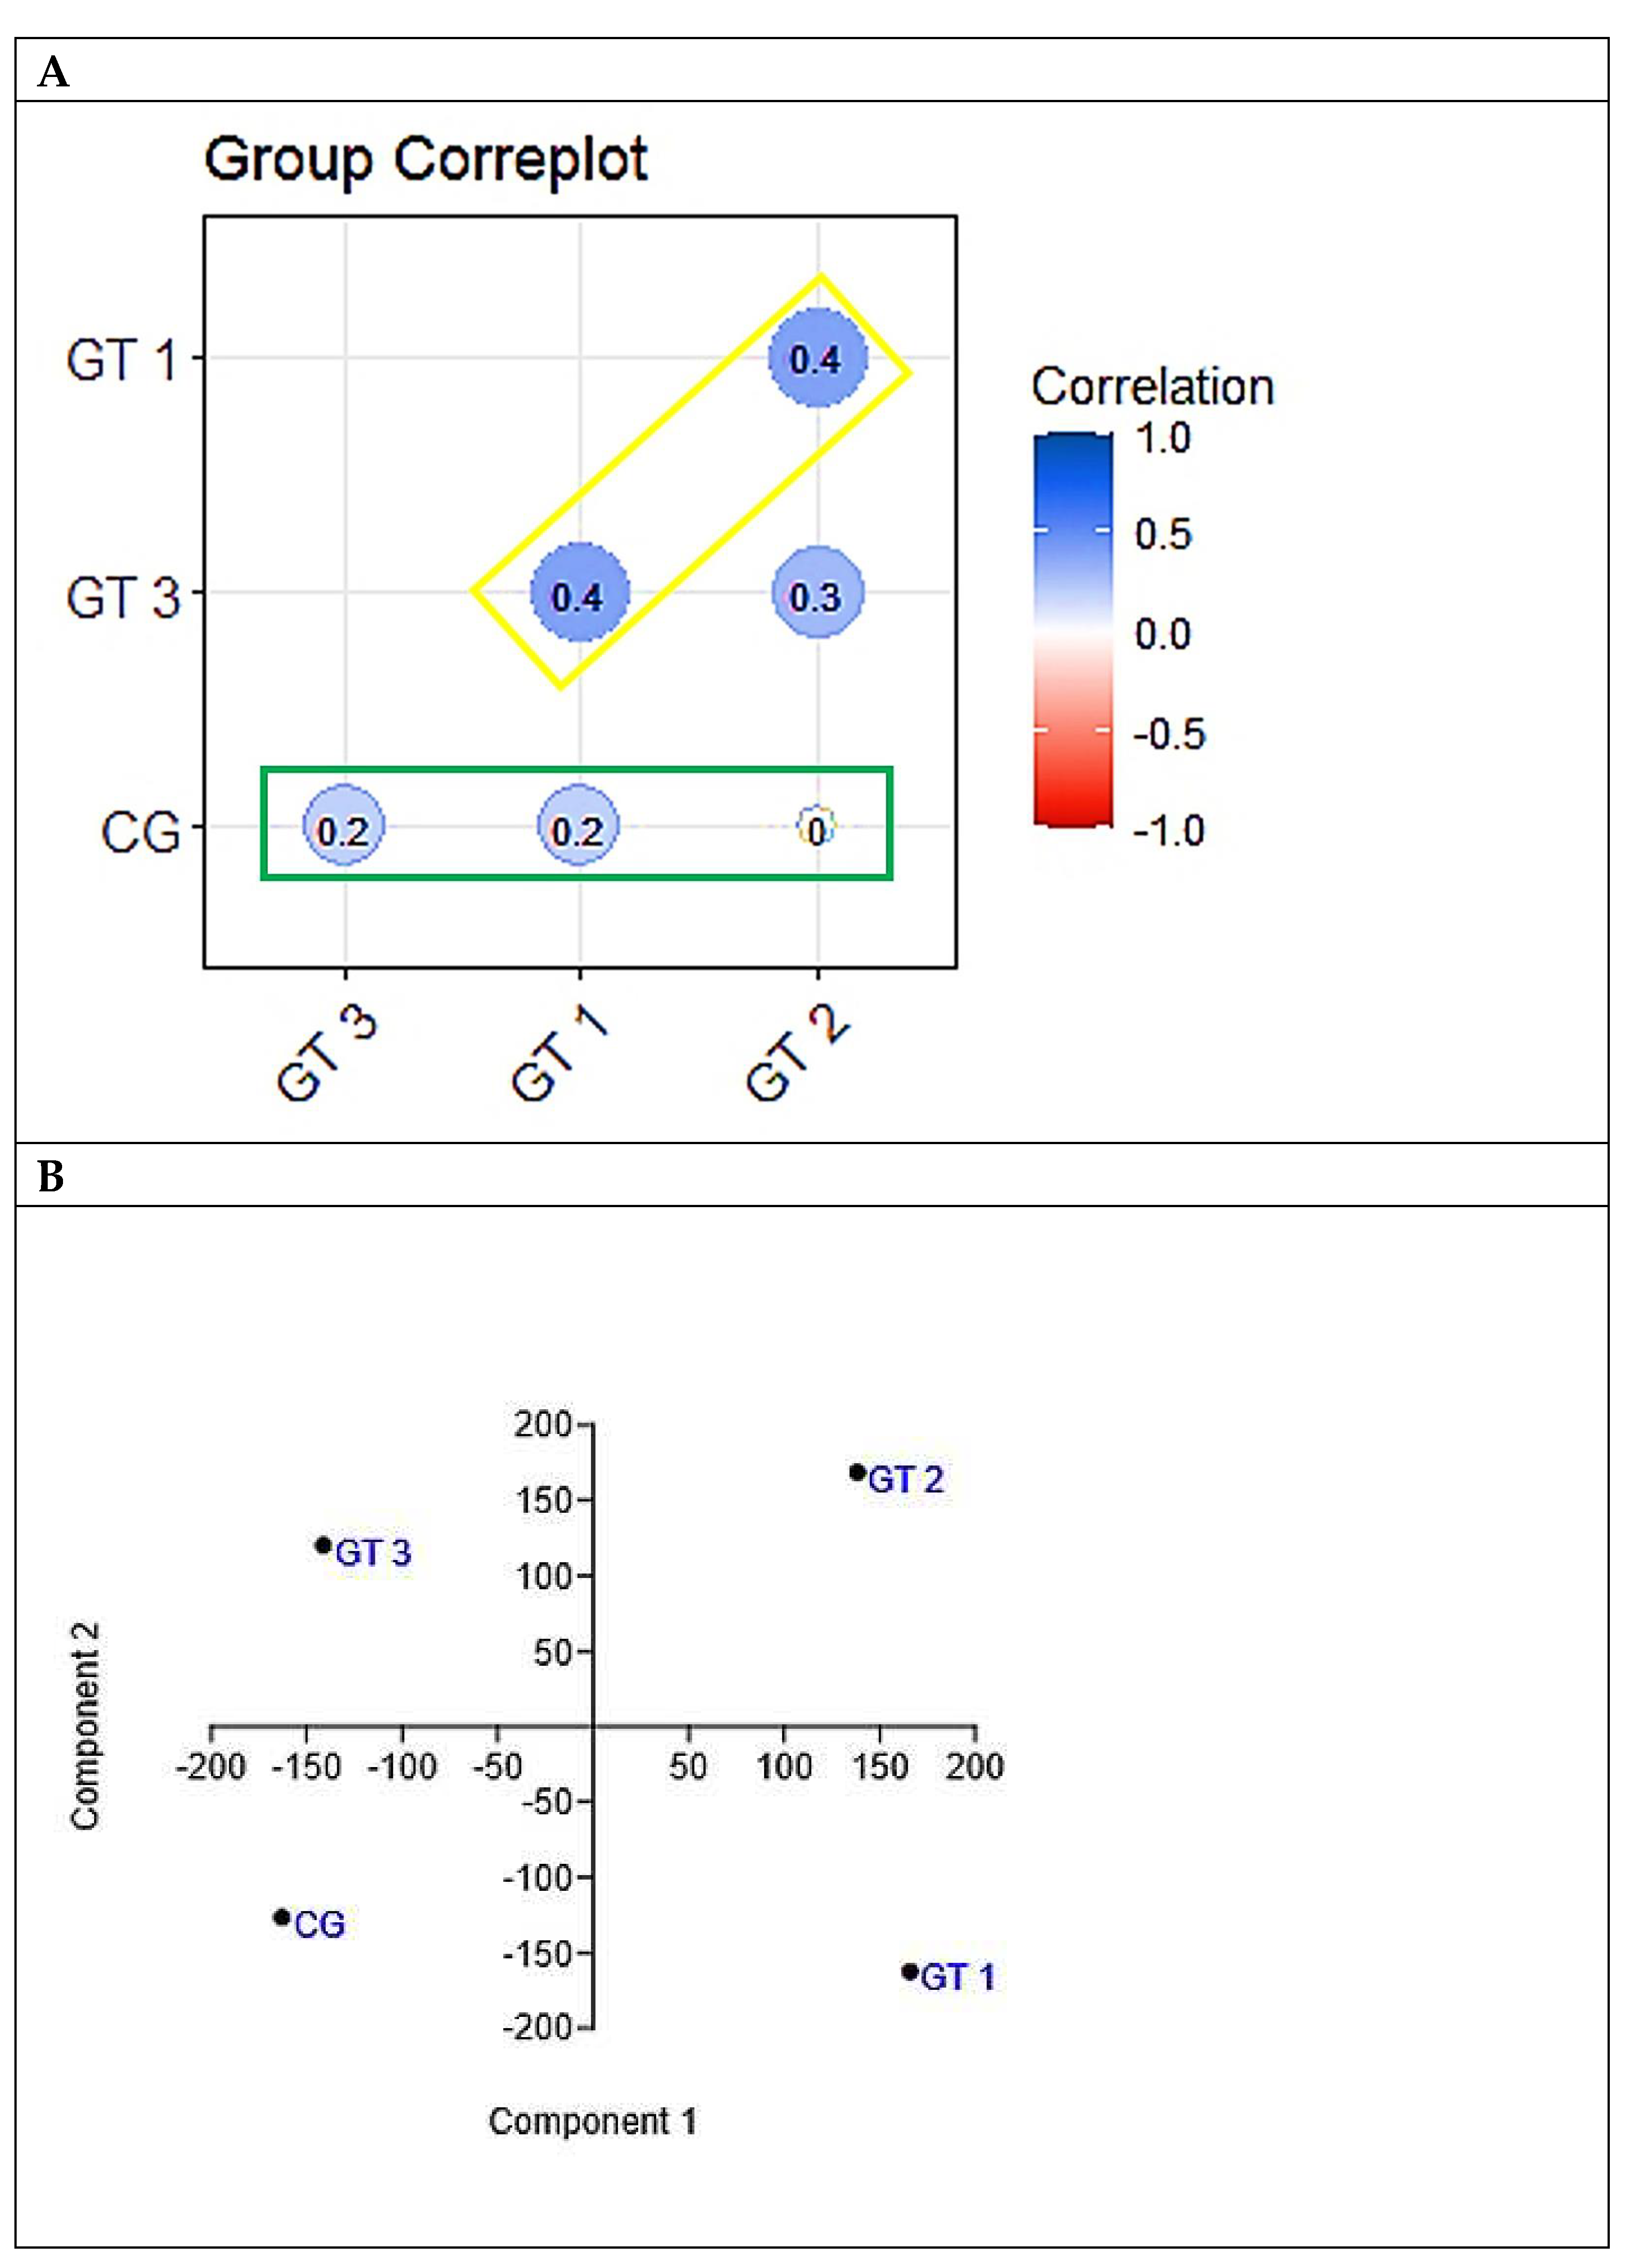
The results presented in
Figure 5A, indicating that no group had a significant correlation in the behavior of the variables with the control group, added to that presented in figure 5B, which revealed different behaviors between the four groups, give robustness to the findings that all forms of exercise caused changes morphofunctional, biochemical and cardiovascular in relation to the control group, but with specificities within each intervention group.
DISCUSSION
The initial BMI values presented by the experimental and control groups indicated overweight, which represents greater risks for the development of cardiovascular diseases and is considered as a strong indicator of mortality. [
19]
After the interventions, all intervention groups showed a decreasing trend, which is contrary to the increasing trend observed in the control group. The results of this study corroborate the one conducted by Filho et al. [
20], where, although the proposed exercise program significantly reduced the BMI of the elderly participants, they still had values above the mean for this population. These findings indicate the importance of continuity in exercise groups and possible adjustments of volume and intensity in the activities, in order to obtain desirable values.
The percentage of fat decreased in the experimental groups after the interventions with effects above 0.2 for all groups, demonstrating that participating in physical activity groups may be an important element in maintaining ideal fat levels, and also, in accordance with Aoyagi and Shephard, [
21] the accumulation of body fat (% fat and sum of skin folds) related to aging is more associated with lifestyle and physical activity level, rather than with aging itself.
GT3 presented greater fat loss (-7.72%) in comparison to the other groups, possibly due to the effect of resistance training. Burleson et al., [
22] when comparing resistance exercises with aerobic exercises, reported that resistance exercises would probably cause greater disturbance in the homeostasis than aerobic exercises, suggesting that, due to the high intensities involved, they could require a greater energy expenditure both during exercise and recovery. It is believed that this effect is due to the reduction in body fat deposits associated with weight training, a product of post-exercise oxygen consumption, caused by high-intensity stimulation, which could increase lipid oxidation after the effort. [
23]
Waist circumference showed a tendency to decrease in the treatment groups, this behavior being antagonistic to the control group. These results suggest that participation in activities was useful in controlling the increase in this variable, since the CG showed an increase in the period analyzed. Notably, fat accumulation in this age group occurs more widely in the intra-abdominal region than in the subcutaneous route. [
24] Hip circumference showed a greater reduction in GT3, twice as much as in GT1 and five times greater than in GT2. Thus, participating in physical exercise groups can be considered a protective factor, since abdominal obesity is more consistently related to a metabolic profile that predicts the risk of cardiovascular diseases than general obesity, [
25] and demonstrates an important association with physical disability. [
26]
In relation to the percentage variation in force, both ULS and LLS showed an increase, being in order of magnitude, lower in GT1, intermediate in GT2 and higher in GT3. Looking at the size of the effect, LLS was the one that showed the greatest effects, which were medium in GT1 and large in groups Gt2 and GT3. These are possibly explained by the fact that, generally speaking, higher intensity loads provide a significantly higher increase in force gains compared to lower loads, due to neural and hypertrophic adaptations promoted by the type of training. [
27] Vale et al. [
28] observed significant differences in the muscular strength of elderly women who practiced bodybuilding for 16 weeks in relation to the control group. Souza et al., [
29] when comparing the effect of different interventions on the maximum strength of elderly women, concluded that the bodybuilding group presented the highest values compared to the water gymnastics practitioners and to those not practicing physical exercises.
Similar results were found in the study by Queiroz and Munaro, [
30] with resistance training for a period of eight weeks, with 50% to 70% of 1RM, obtaining significant responses in the increase of the muscular strength of elderly women.
For biochemical variables, the GT1 and GT2 groups showed a more prominent increase in glycemia and triglycerides than GT1, with greater effects in GT2, perhaps due to a greater metabolic mobilization of energy substrates, without major changes in total cholesterol. Although it is described in literature that exercise induces important physiological changes, such as increased glucose uptake by muscles [
31] and increased lipid oxidation [
23], which may contribute to a decrease in blood glucose and lipid levels, the applied interventions were not enough to promote significant reductions. The results found in this analysis are supported by the study by Bemben, [
32] where after the interventions composed of resistance or aerobic exercises, no effect was observed in the lipid profile.
Finally, for cardiovascular variables, GT2 showed a greater reduction in the percentage change for SBP (large effect), but with an increase in DBP (medium effects in both groups), which is antagonistic to the other groups. It was also the GT2 that caused the largest percentage reduction in DP.
In the present study, the objective was to portray the daily reality of the elderly who participated in the research, therefore, they did not have nutritional orientation, following their routine eating habits, which may have influenced the final values found in the metabolic variables. In studies conducted by Stefanick et al. [
33] and Nieman et al., [
34] where groups with a combination of diet and exercise and exercise alone were compared, they found that there was a decrease in LDL and TC concentrations only in the group that performed the combination of diet and exercise.
CONCLUSION
The results of this study indicate that GT2 (group of aerobic and localized exercises) caused greater percentage reductions in body mass and BMI. However, GT3 (a group of resistance exercises at gyms) caused greater fat percentage reduction. The GT2 caused the greatest decrease in waist circumference, while the GT3 caused the largest decrease in hip circumference. The three groups induced an increase in strength (ULS and LLS). However, in ascending order, GT1 (group of resistance exercises in outdoor gyms) caused the smallest increase, GT2 an intermediate increase, and GT3 the greatest increase in strength, with effects considered big ones in GT2 and GT3. Finally, GT2 caused a greater percentage reduction in systolic blood pressure (large effect) and double product (small effect) than the other groups.
The three methods proved to be efficient, but with particularities that may reflect the choice of one over another due to health conditions, objectives to be achieved, or characteristics of the patient at the time of their choice by the prescriber.
Author contributions: ANS and RPMS Conceptualization; ANS, ASB, LCOG, AMMN and RPMS Data curation; ANS, ASB, LCOG, AMMN, TMF, MSB and RPMS Formal analysis; ANS, ATB, JAB, ACMC and RPMS Investigation; ANS and RPMS Methodology; RPMS Project administration; All authors Resources; Software; Supervision; Validation; Visualization; Writing - original draft; and Writing - review & editing.
Institutional Review Board Statement
The project was approved by the Human Research Ethics Committee, União Educacional do Norte - UNINORTE (Registration No. 59873816.9.0000.8028).
Informed Consent Statement
The informed consent to participate in the study was obtained from the participants.
Data Availability Statement
All data generated or analyzed during this study are included in this published article (and its supplementary information files).
Acknowledgments
We thank the Acre Health Department for allowing and supporting the study. Also to all the professionals at the Family Health Units for their support, and to the elderly for agreeing to participate in the experiment.
Conflicts of interest
The authors declare that they have no conflicts of interest.
References
- Veras, R. Envelhecimento populacional contemporâneo: demandas, desafios e inovações. Rev Saude Publica. 2009, 43, 548–554. [Google Scholar] [CrossRef] [PubMed]
- World Health Organization. Global health risks: mortality and burden of disease attributable to selected major risks. In Geneva: WHO; 2009.
- World Health Organization. Global recommendations on physical activity for health. In Geneva: WHO; 2010.
- Hallal, P.C.; Andersen, L.B.; Bull, F.C.; Guthold, R.; Haskell, W.; Ekelund, U.; et al. Global physical activity levels: Surveillance progress, pitfalls, and prospects. Lancet. 2012, 380, 247–257. [Google Scholar] [CrossRef] [PubMed]
- Mazo, G.Z.; Cardoso, A.S.; Dias, R.G.; Balbé, G.P.; Virtuoso, J.F. Do diagnóstico à ação: grupo de estudos da terceira idade: alternativa para a promoção do envelhecimento ativo. Rev Bras Ativ Fís Saúde 2009, 14, 65–70. [Google Scholar]
- Ribeiro, E.H.C.; Garcia, L.M.T.; Salvador, E.P.; Costa, E.F.; Andrade, D.R.; Latorre, M.R.D.O.; et al. Avaliação da efetividade de intervenções de promoção da atividade física no Sistema Único de Saúde. Rev Saude Publica. 2017, 51, 1–12. [Google Scholar] [CrossRef]
- Santana, M.S.; Chaves, E.M.M. Atividade Física e Bem-Estar na Velhice. Rev Salud Pública 2009, 11, 225–236. [Google Scholar] [CrossRef] [PubMed]
- Hoehner, C.M.; Ribeiro, I.C.; Parra, D.C.; Reis, R.S.; Azevedo, M.R.; Hino, A.A.; et al. Physical activity interventions in Latin America: expanding and classifying the evidence. Am J Prev Med. 2013, 44, e31–e40. [Google Scholar] [CrossRef] [PubMed]
- Benedetti, T.R.B.; Gonçalves, L.H.T.; Mota, J.A.P.D.S. Uma proposta de política pública de atividade física para idosos. Texto Context - Enferm. 2007, 16, 387–398. [Google Scholar] [CrossRef]
- de Le Costa, M.F.F.; Peixoto, S.V.; César, C.C.; Malta, D.C.; de Moura, E.C. Comportamentos em saúde entre idosos hipertensos, Brasil, 2006. Rev Saude Publica. 2009, 43 (Suppl. 2), 18–26. [Google Scholar] [CrossRef] [PubMed]
- World Health Organization. Global status report on noncommunicable diseases 2014. Geneva: WHO; 2014. 176 p.
- Petroski, E.L. Desenvolvimento e validação de equações generalizadas para a estimativa da densidade corporal em adultos. Universidade Federal de Santa Maria [Tese]; 1995.
- Siri, W.E. Body composition from fluid spaces and density. In: Brozek J. & Henschel, A. (Eds). Techniques for measuring body composition. Washington, DC: National Academy of Science, 1961. p. 223-244.
- Araújo, P.M.P. Introdução à avaliação do membro superior. In: SBTM. Recomendações para avaliação do membro superior. São Paulo: Sociedade Brasileira de Terapeutas da Mão; 2003.
- Rikli, R.; Jones, J. Development and Validation of a Functional Fitness Test for Community-Residing Older Adults. J Aging Phys Act. 1999, 7, 129–161. [Google Scholar] [CrossRef]
- Fruchterman, T.M.J.; Reingold, E.M. Graph drawing by force-directed placement. Software Practice and Experience. 1991, 21, 1129–1164. [Google Scholar] [CrossRef]
- Karmen, C.; Gietzelt, M.; Knaup-Gregore, P.; Ganzinger, M. Methods for a similarity measure for clinical attributes based on survival data analysis. BMC Med Inform Decis Mak. 2019, 19, 195. [Google Scholar] [CrossRef] [PubMed]
- Cohen, J. Quantitative methods in psychology. A power primer. Psychological Bulletin. 1992, 112, 155–159. [Google Scholar] [CrossRef] [PubMed]
- MacMahon, S.; Baigent, C.; Duffy, S.; Rodgers, A.; Tominaga, S.; Chambless, L.; et al. Body-mass index and cause-specific mortality in 900 000 adults: Collaborative analyses of 57 prospective studies. Lancet. 2009, 373, 1083–1096. [Google Scholar] [CrossRef]
- Filho, M.L.M.; Rodrigues, B.M.; Aidar, F.J.; Reis, V.M.; Polito, M.D.; Venturini, G.P.; et al. Influência dos exercícios aeróbio e resistido sobre perfil hemodinâmico e lipídico em idosas hipertensas. Rev Bras Ciên e Mov. 2011, 19, 15–22. [Google Scholar]
- Aoyagi, Y.; Shephard, R.J. Habitual physical activity and health in the elderly: The Nakanojo Study. Geriatr Gerontol Int. 2010, 10, S236–S243. [Google Scholar] [CrossRef]
- Burleson, M.A.; Bryant, H.S.; Stone, M.H.; Collins, M.A.; McBride, T.T. Effect of weight training exercise and treadmill exercise on post-exercise oxigen consumption. Med Sci Sport Exerc. 1998, 30, 518–522. [Google Scholar] [CrossRef] [PubMed]
- Poehlman, E.T.; Melby, C. Resistance training and ernergy balance. Int J Sport Nutr. 1998, 8, 143–159. [Google Scholar] [CrossRef] [PubMed]
- Cetin, D.C.; Nasr, G. Obesity in the elderly: More complicated than you think. Cleve Clin J Med. 2014, 81, 51–61. [Google Scholar] [CrossRef] [PubMed]
- Rexrode, K.M.; Carey, V.J.; Hennekens, C.H.; Walters, E.E.; Colditz, G.A.; Stampfer, M.J.; et al. Abdominal Adiposity and Coronary Heart Disease in Women. JAMA. 1998, 280, 1843–1848. [Google Scholar] [CrossRef]
- Angleman, S.B.; Harris, T.B.; Melzer, D. The role of waist circumference in predicting disability in periretirement age adults. Int J Obes. 2006, 30, 364–373. [Google Scholar] [CrossRef]
- Silva, N.L.; Farinatti, P.D.T.V. Influence of counter-resistance training variables on elderly muscular strength: a systematic review with emphasis on dose/response relationships. Rev Bras Med do Esporte. 2007, 13, 51–57. [Google Scholar] [CrossRef]
- De Vale, R.G.S.; Barreto, A.C.G.; Novaes J da, S.; Dantas, E.H.M. Effect of resistive training on the maximum strenght, flexibility and functional autonomy of elderly woman. Rev bras cineantropom desempenho hum. 2006, 8, 52–58. [Google Scholar]
- Souza LKDe Bortoluzzi, R.; Roncada, C.; Tiggemann, C.L.; Dias, C.P. Comparação da força e capacidade funcional entre idosos praticantes de musculação, hidroginástica e não praticantes de exercícios físicos. Rev Bras Geriatr e Gerontol. 2014, 17, 497–504. [Google Scholar] [CrossRef]
- Queiroz, C.O.; Munaro, H.L.R. Efeitos do treinamento resistido sobre a força muscular e a autopercepção de saúde em idosas. Rev Bras Geriatr e Gerontol. 2012, 15, 547–553. [Google Scholar] [CrossRef]
- Teran-Garcia, M.; Rankinen, T.; Koza R a Rao, D.C.; Bouchard, C. Endurance training-induced changes in insulin sensitivity and gene expression. Am J Physiol Endocrinol Metab. 2005, 288, E1168–78. [Google Scholar] [CrossRef] [PubMed]
- Bemben, D.A.; Bemben, M.G. Effects of resistance exercise and body mass index on lipoprotein-lipid patterns of postmenopausal women. J Strength Cond Res (Allen Press Publ Serv Inc). 2000, 14, 80–86. [Google Scholar] [CrossRef]
- Stefanick, M.L.; Mackey, S.; Sheehan, M.; Ellsworth, N.; Haskell, W.L.; Wood, P.D. Effects of Diet and Exercise in Men and Postmenopausal Women with Low Levels of HDL Cholesterol and High Levels of LDL Cholesterol. N Engl J Med. 1998, 339, 12–20. [Google Scholar] [CrossRef]
- Nieman, D.C.; Brock, D.W.; Butterworth, D.; Utter, A.C.; Nieman, C.C. Reducing diet and/or exercise training decreases the lipid and lipoprotein risk factors of moderately obese women. J Am Coll Nutr. 2002, 21, 344–350. [Google Scholar] [CrossRef]
|
Disclaimer/Publisher’s Note: The statements, opinions and data contained in all publications are solely those of the individual author(s) and contributor(s) and not of MDPI and/or the editor(s). MDPI and/or the editor(s) disclaim responsibility for any injury to people or property resulting from any ideas, methods, instructions or products referred to in the content. |
© 2024 by the authors. Licensee MDPI, Basel, Switzerland. This article is an open access article distributed under the terms and conditions of the Creative Commons Attribution (CC BY) license (http://creativecommons.org/licenses/by/4.0/).
