
Submitted:
10 January 2024
Posted:
11 January 2024
You are already at the latest version
Abstract
Metabolic Syndrome (MetS) is a serious condition that significantly increases the risk of cardiovascular diseases and the severity of type 2 diabetes, also impacting on the development and evolution of other chronic diseases. Predicting metabolic syndrome is a complex task due to the multifactorial nature of this condition, which involves a combination of various risk factors such as abdominal obesity, insulin resistance, dyslipidemia, and hypertension. The complex interplay of these factors makes it challenging to predict the syndrome. Both genetic predisposition and environmental factors also contribute to the development of metabolic syndrome. Metabolic syndrome affects diverse populations with different ethnicities, lifestyles, and socioeconomic backgrounds. Prediction models, in addition, need to account for population heterogeneity and consider variations in risk factors across different groups. The present study analyzed data from participants in a cohort from Mexico City to identify key risk factors in men and women, addressing the presence of unbalanced data. In order to tackle the issues posed by data imbalance data, SMOTE and ADASYN were applied to assess significant differences in the selection of risk factors for MetS prediction. Random Forest and RPART models using ADASYN and SMOTE demonstrated better performance, achieving a balanced accuracy of approximately 87%. In women, they highlighted sleep quality, anxiety factors, tobacco consumption, and nutritional components. In the case of men, stronger associations were identified with the social development index and factors related to gout in parents.
Keywords:
Poor quality sleep
; Social Development Index
; Nutrients
; Machine learning
; Features selection
; Balancing methods
; Mexico City
; Tlalpan 2020 cohort
1. Introduction
Metabolic Syndrome is a condition that increases the risk of developing or worsening several serious health conditions such as type 2 diabetes (one of its components), heart disease, and stroke, as well as cognitive decline and dementia [1]. Among the factors associated with MetS is poor quality of sleep or sleep disturbances such as insomnia, apnea, and snoring, which can, in turn, cause a range of other negative consequences [2,3]. In 2017, the National Health and Nutrition Survey of Mexico [4] estimated the prevalence of sleep disorders in Mexicans using a sample of 8,649 people older than 18 years old. The results showed a prevalence of snoring while sleeping of 48.5%, difficulty to sleep of 36.9%, and tiredness or fatigue during the day of 32.4%; likewise, insomnia was 18.8% more prevalent in women. In the apnea case, the result indicated that 23.7% had a higher risk of presenting apnea, especially the population overweight and obese, hypertensive, and those over 40 years of age. In another study, [5], the prevalence of insomnia was 36.7%, being more common among women (with a prevalence of 41.9%) than in men (with a prevalence of 36.7%). Sleep disorder treatment depends on the disorder type and the underlying cause. For this reason, it is necessary efforts to improve diagnosis and treatment.
Nutrition plays a crucial role in the development and management of metabolic syndrome. Metabolic syndrome is a cluster of conditions that includes abdominal obesity, insulin resistance, dyslipidemia, and hypertension. Poor dietary choices, along with other lifestyle factors, can contribute to the development and exacerbation of these risk factors [6,7]. Excessive caloric intake, especially from high-fat and high-sugar diets, contributes to obesity. Diets rich in added sugars and refined carbohydrates can contribute to insulin resistance, a key feature of metabolic syndrome. Low consumption of dietary fiber, commonly found in fruits, vegetables, and whole grains, is associated with insulin resistance. Diets high in saturated and trans fats can lead to dyslipidemia, characterized by elevated levels of triglycerides and low-density lipoprotein cholesterol, and decreased high-density lipoprotein cholesterol. This lipid profile is a risk factor for cardiovascular diseases associated with metabolic syndrome. In contrast, omega-3 fatty acids, found in fatty fish, flaxseeds, and walnuts, have been associated with favorable lipid profiles and may have a protective effect against metabolic syndrome [8,9,10].
In the same way, another factor significantly associated with MetS is social development index (SDI) [11], a composite measure of social and economic development. Countries with higher SDI tend to have better health outcomes, including lower rates of MetS [12], and an additional study connects the risk of MetS with economic and social vulnerability as well as inappropriate nutrition profiles [13]. Evidence suggests a close association between SDI and sleep disturbances may be influenced by social and economic factors, such as income and education. Therefore, studying the relationship between sleep disturbance, SDI, and MetS could help identify the social and economic determinants and the types of sleep disturbance that increase the prevalence of MetS. This could inform the development of more effective strategies for preventing and treating MetS and improving overall health and well-being. For this reason, developing automated approaches for diagnosing sleep disorders, identifying the determinants of SDI, and predicting MetS have become active research areas.
In the case of sleep disruption, machine learning has shown promise in improving the accuracy and efficiency of the diagnosis process. The work of Mencar et al. [14] presents the application of five machine learning models to predict the severity of obstructive sleep apnea syndrome (OSAS) using polysomnography data, where the random forest model got the highest accuracy (90.91%) and relevant features such as respiratory rate and oxygen saturation were extracted. Another study [15] applies a machine learning model to predict the presence of OSAS using clinical and demographic data. The random forest model performed best, achieving an accuracy of 87.1%. The most important predictors were body mass index (BMI), age and gender, besides additional predictors, such as neck circumference and smoking.
In another study by Eyvazlou et al. [16], an ANN model was developed to predict MetS based on sleep quality and work-related risk factors. The results showed that the ANN model could identify individuals at risk of MetS with a sensitivity of 74.1% and a specificity of 76.2%. Moreover, other studies [17,18] have also applied machine learning to understand the social determinants that affect and influence the health of individuals.
However, despite the excellent results described in previous studies, one of the most common challenges in medical diagnosis is the issue of class imbalance. This problem significantly impacts the performance of classifiers, as they tend to exhibit a bias towards the majority class, resulting in skewed outcomes. In this context, authors such as Kim et al. [19] propose a prediction model that utilizes balancing techniques to identify middle-aged Korean individuals at a high risk of MetS. The dataset used in their study comprises age, gender, anthropometric data, sleep quality, and blood indicators of 1991 individuals. The results showed that XGBoost, employing SMOTE, achieved an AUC of 85.1%.
As expected, nutrition and dietary habits are associated with MetS; Jung et al. [20] analyzed the association between dietary habits, shift work, and MetS in Korean women dedicated to being nurses. They found an association with alcohol, black coffee, and soft drinks consumption, applying a regression model. It is essential to mention that specific studies demonstrate the impact of nutrients associated with MetS [21], leading to helpful insights on lipid profiles, primarily those contained in fish (proteins, n-3 fatty acids, vitamin D, iodine, selenium, and taurine) [22]. Likewise, investigations through statistical analyses in Saudi Arabia [23] indicate that insufficient nutrients of vitamins A, C, E, K, calcium, zinc, and magnesium may increase the risk for MetS, mainly in adult women. Nevertheless, Bian et al. [24] found that vitamin B has a healthy impact on preventing MetS, and they made a regression model for a controlled study in Chinese adults.
The present study aims to examine the connection between the SDI, sleep disturbances, types of nutrients consumed, and MetS within a cohort from Mexico City. Our goal is to identify critical factors that may be key to reducing MetS incidence or severity by applying machine learning algorithms. Additionally, we will use data balancing techniques to improve the predictive performance of our models and enhance feature selection. By incorporating these methods, we aim to uncover valuable insights and contribute to developing more accurate and practical approaches for addressing MetS.
2. Materials and Methods
2.1. Data
Data for this study was derived from the baseline assessment of a cohort called Tlalpan 2020 from the National Institute of Cardiology Ignacio Chávez in Mexico City [25]. This project was authorized by the Institutional Bioethics Committee of the National Institute of Cardiology Ignacio Chavez under code 13-802. The dataset used in this investigation includes data from 3156 volunteers (all of them were informed of the research purposes and signed a letter of informed consent) about their anthropometric measurements, consumption of alcohol and tobacco, level of physical activity, level of economic income, level of education, anxiety, family history health, biomedical evaluation, quality of sleep and the amount of nutrients consumed.
2.1.1. Quality of sleep
The sleep quality was measured by Medical Outcomes Study (MOS) [26], a self-report for assessing sleep quality and quantity. This questionnaire includes 12 items about sleep disruption, snoring, sleep shortness of breath or headache, sleep adequacy, and sleep somnolence; it additionally measures the number of hours of sleep per day during the past four weeks. The MOS has been used in several research such as discriminating the quality of sleep among a Spanish postmenopausal population [27], diagnosing cases of apnea [28,29] or identifying sleep disturbance in patients with rheumatoid arthritis [30], among others.
2.1.2. Clinical and anthropometric parameters
Clinical and anthropometric data such as systolic blood pressure (SBP) and diastolic blood pressure (DBP) (measured according to standard procedure [31]) were collected, as well as waist circumference (WC), height and weight (measured according to ISAK [32]), in the case of BMI and the height-waist index (WHtR) these were calculated from primary measurement data.
2.1.3. Biochemical evaluation
The following laboratory tests measurements corresponding to blood samples were included: glucose (GLU), triglycerides (TGs), HDL cholesterol (HDL), LDL cholesterol (LDL), uric acid (URIC), atherogenic index (IAT), and sodium (NA).
2.1.4. Habits and factors associated with lifestyle
Furthermore, habit data was also collected, such as the smoking habit, alcohol consumption and physical activity (calculated based on the International Physical Activity Questionnaire, IPAQ, [33] by metabolic equivalents minutes/week, which are classified in the following categories: low, moderate, and high).
Education level was collected and classified into three categories: primary school, high school, and university studies, as well as postgraduate school. Similarly, we collected the level of economic income, which was classified into three categories based on the Mexican peso: low ($1.00 to $6,600.00), medium ($6,601.00 to $11,000.00), and high (more than $11,000.00), on a monthly basis.
2.1.5. Psychological stress level
2.1.6. Dietary information
To gather information about the frequency of food consumption and other dietary products, we utilize a software tool called the “Evaluation of Nutritional Habits and Nutrient Consumption System" [36]. This system examines the meals individuals have consumed over a day within the previous year and computes the quantity of nutrients ingested.
All data mentioned in this section are presented in the Table 1.
2.2. Methods
2.2.1. Feature selection
Feature selection is essential to identify and establish the most critical variables.
In this study, we employed logistic regression to measure the relationship between variables and class, alongside machine learning algorithms to discern the most significant features. The algorithms used were RF and RPART (see Methods below), applying the mean decrease accuracy for calculating variable importance which can be expressed as follows:
where: is the mean decrease impurity of the variable is the impurity of the node before the split; is the weighted impurity of the child nodes resulting from the split is the number of samples in the node before the split.
2.2.2. Balancing methods
Balancing methods such as SMOTE and ADASYN have helped address the class imbalance issue within our dataset.
ADASYN (Adaptive Synthetic Sampling), which is part of the UBL R package, takes a unique approach by generating synthetic samples based on the local density of minority class instances, with a focus on instances that are more challenging to learn. In this method, the parameter controls the desired balance rate between the minority and majority classes during the generation of synthetic samples. When is set to a value greater than 1, a proportionally larger number of synthetic samples will be generated relative to the instances of the minority class. This further increases the ratio between the minority and majority classes.
The second method, SMOTE (Synthetic Minority Oversampling Technique) of the performanceEstimation R package, generates synthetic samples for the minority class. In SMOTE, the k parameter determines the number of nearest neighbors used to generate synthetic samples. A small value of k can lead to an excessive generation of synthetic samples that may be too close together, resulting in model overfitting. Moreover, if k is too large, synthetic samples may be less representative of the minority class and fail to capture data variability adequately.
2.2.3. Methods
To build the models, we applied two machine learning algorithms, RF [37,38] and RPART [39,40], as well as PCA [41,42]. RF, introduced by Breiman [43], is a machine-learning algorithm combining multiple decision trees to create a model with the highest accuracy. Rpart (Recursive Partitioning and Regression Trees), by Breiman [44], works by recursively partitioning the input data based on predictor variables to create a tree-like structure. This algorithm aims to find the optimal splits in the data that maximize the homogeneity or purity of the resulting subgroups. Principal component analysis (PCA) is a data analysis technique used to simplify the complexity of data by reducing its dimensionality facilitating visualization and analysis.
2.3. Performance measures
To evaluate model performance, we used sensitivity, specificity, and balanced accuracy (B.ACC). These metrics provide a fair assessment of the model’s performance across all classes, considering the issue of class imbalance.
Where P = Positive, N = Negative, TP = True Positive, FN = False Negative, TN = True Negative and FP = False Positive, respectively.
3. Statistical analysis and development of prediction models
All experiments were performed using the R programming language (3.6.1) [45]. Min-max was used to normalize continuous variables, and dichotomous variables were represented as numbers. Figure 1 provides a general overview of the experimental process described in this section. To develop predictive models, it was necessary to process the data and implement a balancing technique. The minority class was oversampled, taking into account the majority class. As a first step, SMOTE was applied, and it was necessary to determine the best value of k (number of nearest neighbors), so experiments were conducted by varying k (here we present , , and ). In this process, the dataset was randomly divided into 70% for training and 30% for testing. To accomplish this task, we applied two machine learning algorithms, RF and RPART. In the case of RF, we varied the mtry parameter from 1 to 10 and considered ntree values of 100, 300, 500, and 1000 for each model.
Additionally, a subset of features was extracted in each created model using the variable importance (VarImp) of RF, and a 10-fold cross-validation was performed. Similarly, in the case of RPART, parameter tuning was conducted by considering , , and , using a 10-fold cross-validation. Likewise, a subset of features was extracted in each created model.
Once the feature subsets were obtained, along with the optimal value for each corresponding parameter of each algorithm and data balancing technique, we tested the generated feature subsets using RF and RPART. This was done by conducting 30 runs with different seeds to assess the performance of each model. In all experiments, a minimum of 30 independent runs were conducted for each algorithm using 30 different seeds. The mean and standard deviation of the performance measures were calculated for each of these runs.
4. Results
Understanding how MetS, nutrition, sleep disturbances, and SDI relate in men and women can have important clinical and public health implications. In this study, we used logistic regression before dataset balancing to pinpoint the critical variables associated with MetS in both female and male populations. Table 2 presents the results of the features and their corresponding values obtained. Detailed results for women can be found in Supplementary Table 1, and those for men are available in Supplementary Table 2.
Analyzing the data, in men, the top 10 variables most related to MetS are blood glucose (GLU), triglycerides (TRIG), waist circumference (WC), atherogenic index (IAT), systolic blood pressure (SBP), vitamin B12 (B12), body mass index (BMI), lactose (LACT), carbohydrates (CARBO), and high glucose levels based on the dietary survey (GLU_1). Conversely, in women, the ten most relevant variables include GLU, TRIG, WC, BMI, SBP, total proteins (PROTEI), fructose (FRUCT), high cholesterol total based on the dietary survey (CHOL_SN), uric acid (URIC), and cooper (CU). To achieve a more effective visualization of these prominent features from the logistic regression for both men and women, Figure 2 is presented. Pink triangle symbols represent the most substantial variables for women, while blue triangles represent those for men. A cautionary note must be made for the seemingly outlier behavior of blood glucose and triglycerides with very high coefficients. Let us recall that these features are closely related to the very definition of MetS. Such variables were included in our models only for the sake of database completeness and comprehensiveness.
Subsequently, we employed SMOTE and ADASYN with RF and RPART to reassess the most influential features associated with MetS prediction within a now balanced dataset. Following this, with the data balancing techniques effectively applied and their parameters fine-tuned, we extract feature subsets by utilizing RPART and RF for both women and men. Extracting features related to MetS in a balanced dataset improves model generalization (conducting training more evenly and accurately), optimizing performance and reducing overfitting. Considering the challenges associated with including all variables in a model, such as noise, redundancy, and overfitting, we extract the 17 variables with the highest values obtained in each model of RF and RPART after applying SMOTE and ADASYN.
The extracted feature subsets, along with their respective values, are presented in Table 3, Table 4, Table 5 and Table 6. These tables also detail the employed balancing technique for each set of variables and their corresponding parameters ranging from 1 to 5. Each subset was adjusted for its corresponding parameter—B for ADASYN and k for SMOTE, considering values of 1 and 5.
Similarly, Table 7 showcases the performance achieved by the RF algorithm, while Table 8 presents the performance of the RPART algorithm. In both tables, the Value column provides information regarding the relative importance of each feature.
4.1. Best Features for Men Using RF and ADASYN/SMOTE
Specifically, Table 3 exhibits four feature subsets obtained from male data using Random Forest with ADASYN and SMOTE. According to Table 7, the most effective subset was obtained by applying ADASYN with B = 1 with a balanced accuracy of 86.22% and a deviation standard of 0.26%.
The most influential feature in this subset is BMI, with a high importance value of 92.9499, followed by WEIGHT and energy efficiency (ENER_AD), with values of 49.4782 and 48.8887, respectively. The other listed features, such as educational lag (EDULAG), common-law marriage (LIV_TOG), durable goods (DURAB), and gout mother (MOTHERGT), also contribute to the model but to a lesser extent.
4.2. Best Features for Men Using RPART and ADASYN/SMOTE
In the case of features obtained by RPART, using both SMOTE and ADASYN, the results were slightly worse than those obtained with RF (see Table 3). In this scenario, the best subset was achieved by the subset with the parameter ADASYN = 5, which achieved an 82.32% balanced accuracy metric with a standard deviation of 0.99%.
Switching gears to the outcomes yielded by Random Forest with ADASYN using a B value of 5, BMI takes center stage with a substantial value of 683.74, signifying its paramount role in predicting the outcomes related to the examined condition. Following closely in significance are energy efficiency (ENERGY_AD) and educational lag (EDULAG), boasting values of 619.99 and 565.33, respectively, both making substantial contributions to predictive capability. ALCOHOL and WEIGHT also exhibit noteworthy importance with values of 355.97 and 295.25, underlining their relevance within the model. Moreover, features like divorced (DIVORC), no degree (NONE), and gout mother (MOTHERGT), while exerting a comparatively lower influence, still contribute to the model’s predictive capacity, as indicated by their respective values.
4.3. Best Features for Women Using RF and ADASYN/SMOTE
The Random Forest model using SMOTE with achieved the best performance for women, reaching an 88.50% accuracy with a standard deviation of 0.40% (see Table 7). In this case, Table 5 shows that BMI emerged as the foremost predictor, boasting a substantial value of 484.31, unequivocally underscoring the pivotal role of body mass index in forecasting MetS within this specific context. Furthermore, IAT (481.48) and WEIGHT (339.17) exhibited pronounced associations, reaffirming the significance of weight-related metrics.
Including sleep disturbances (SLPSNR1, SLPSOB1, BREATH, DROWSY, and SLPNOTQ) and even cholesterol levels (CHOL_ANT) among the influential variables underscores their pivotal contributions to MetS prediction in women. The importance of age (AGE) and SDI parameters like sanitary adequacy (SANITRY) is also noteworthy. It is essential to highlight that Psychological factors such as TRAIT_ANX (trait anxiety) were included, accounting for the potential influence of mental health aspects in MetS prediction.
4.4. Best Features for Women Using RPART and ADASYN/SMOTE
In this instance, SMOTE with k = 5, combined with RPART, achieves the best performance, attaining a balanced accuracy of 84.49% with a standard deviation of 1.43% (see Table 6). The results of the corresponding subset (RPART applied to women’s data using SMOTE with a parameter value, ) showed in Table 6 reveal that the most influential feature is IAT, with a value of 483.23, followed closely by BMI and WEIGHT, which have values of 410.37 and 409.78, respectively. Features like uric acid (URIC), snores during sleep (SLPSNR1), and smoking practice (SMOKING) also exhibit noticeable influence, indicating their relevance in understanding the targeted phenomenon. Conversely, features like maltose (MALT) and fructose (FRUCT) have relatively lower values; however, they can provide valuable information about dietary habits, nutritional deficiencies, or behaviors related to MetS.
The study’s results, employing Random Forest and RPART algorithms and SMOTE and ADASYN techniques for both genders, offer valuable insights. These results underscore the importance of health and lifestyle elements in MetS prediction, encompassing sleep disturbances, cholesterol levels, age, psychological factors, and SDI parameters.
4.5. Analyzing the best features using PCA
Based on the results of the features obtained in the best models, we used PCA to visually and graphically analyze the top features for men and women to explore potential correlations and latent patterns among these influential factors and reduce dimensionality to the extent possible.
In the case of men, we considered feature subsets obtained from the Random Forest model using ADASYN with B = 1 and RPART with ADASYN and B = 5. The subsequent features were integrated: BMI, WEIGHT, ENER_AD, EDULAG, LIV_TOG, DURAB, MOTHERGT, IAT, HEALTHAC, DIVORC, QUA_HOUS, STRATUM, FATHERGT, NONE, MARRIED, VALUE, URIC, SANITRY, SINGLE and ALCOHOL.
For women, we considered feature subsets obtained from the Random Forest model with SMOTE and and the RPART model with SMOTE and . These models are regarded because they achieved the highest performance (see Table 7 and Table 8. Extremely small percentage uncertainty values in Table 8 are shown rounded down to for clearer presentation). The following features were included: BMI, IAT, WEIGHT, URIC, SLPSNR1, CHOL_ANT, AGE, SLPSOB1, BREATH, TRAIT_ANX, SMO_PASS, SANITRY, MOTHERDL, DROWSY, SMOKING, SINGLE, EXSMOKER, SEC_SCHOOL, SLPNOTQ, SLPS3, SODIUM, ALCOHOL, SATFAT, MONFAT, NA, VITE, FATHERDB, SUCR, MARRIED, FRUCT, ZN, MALT.
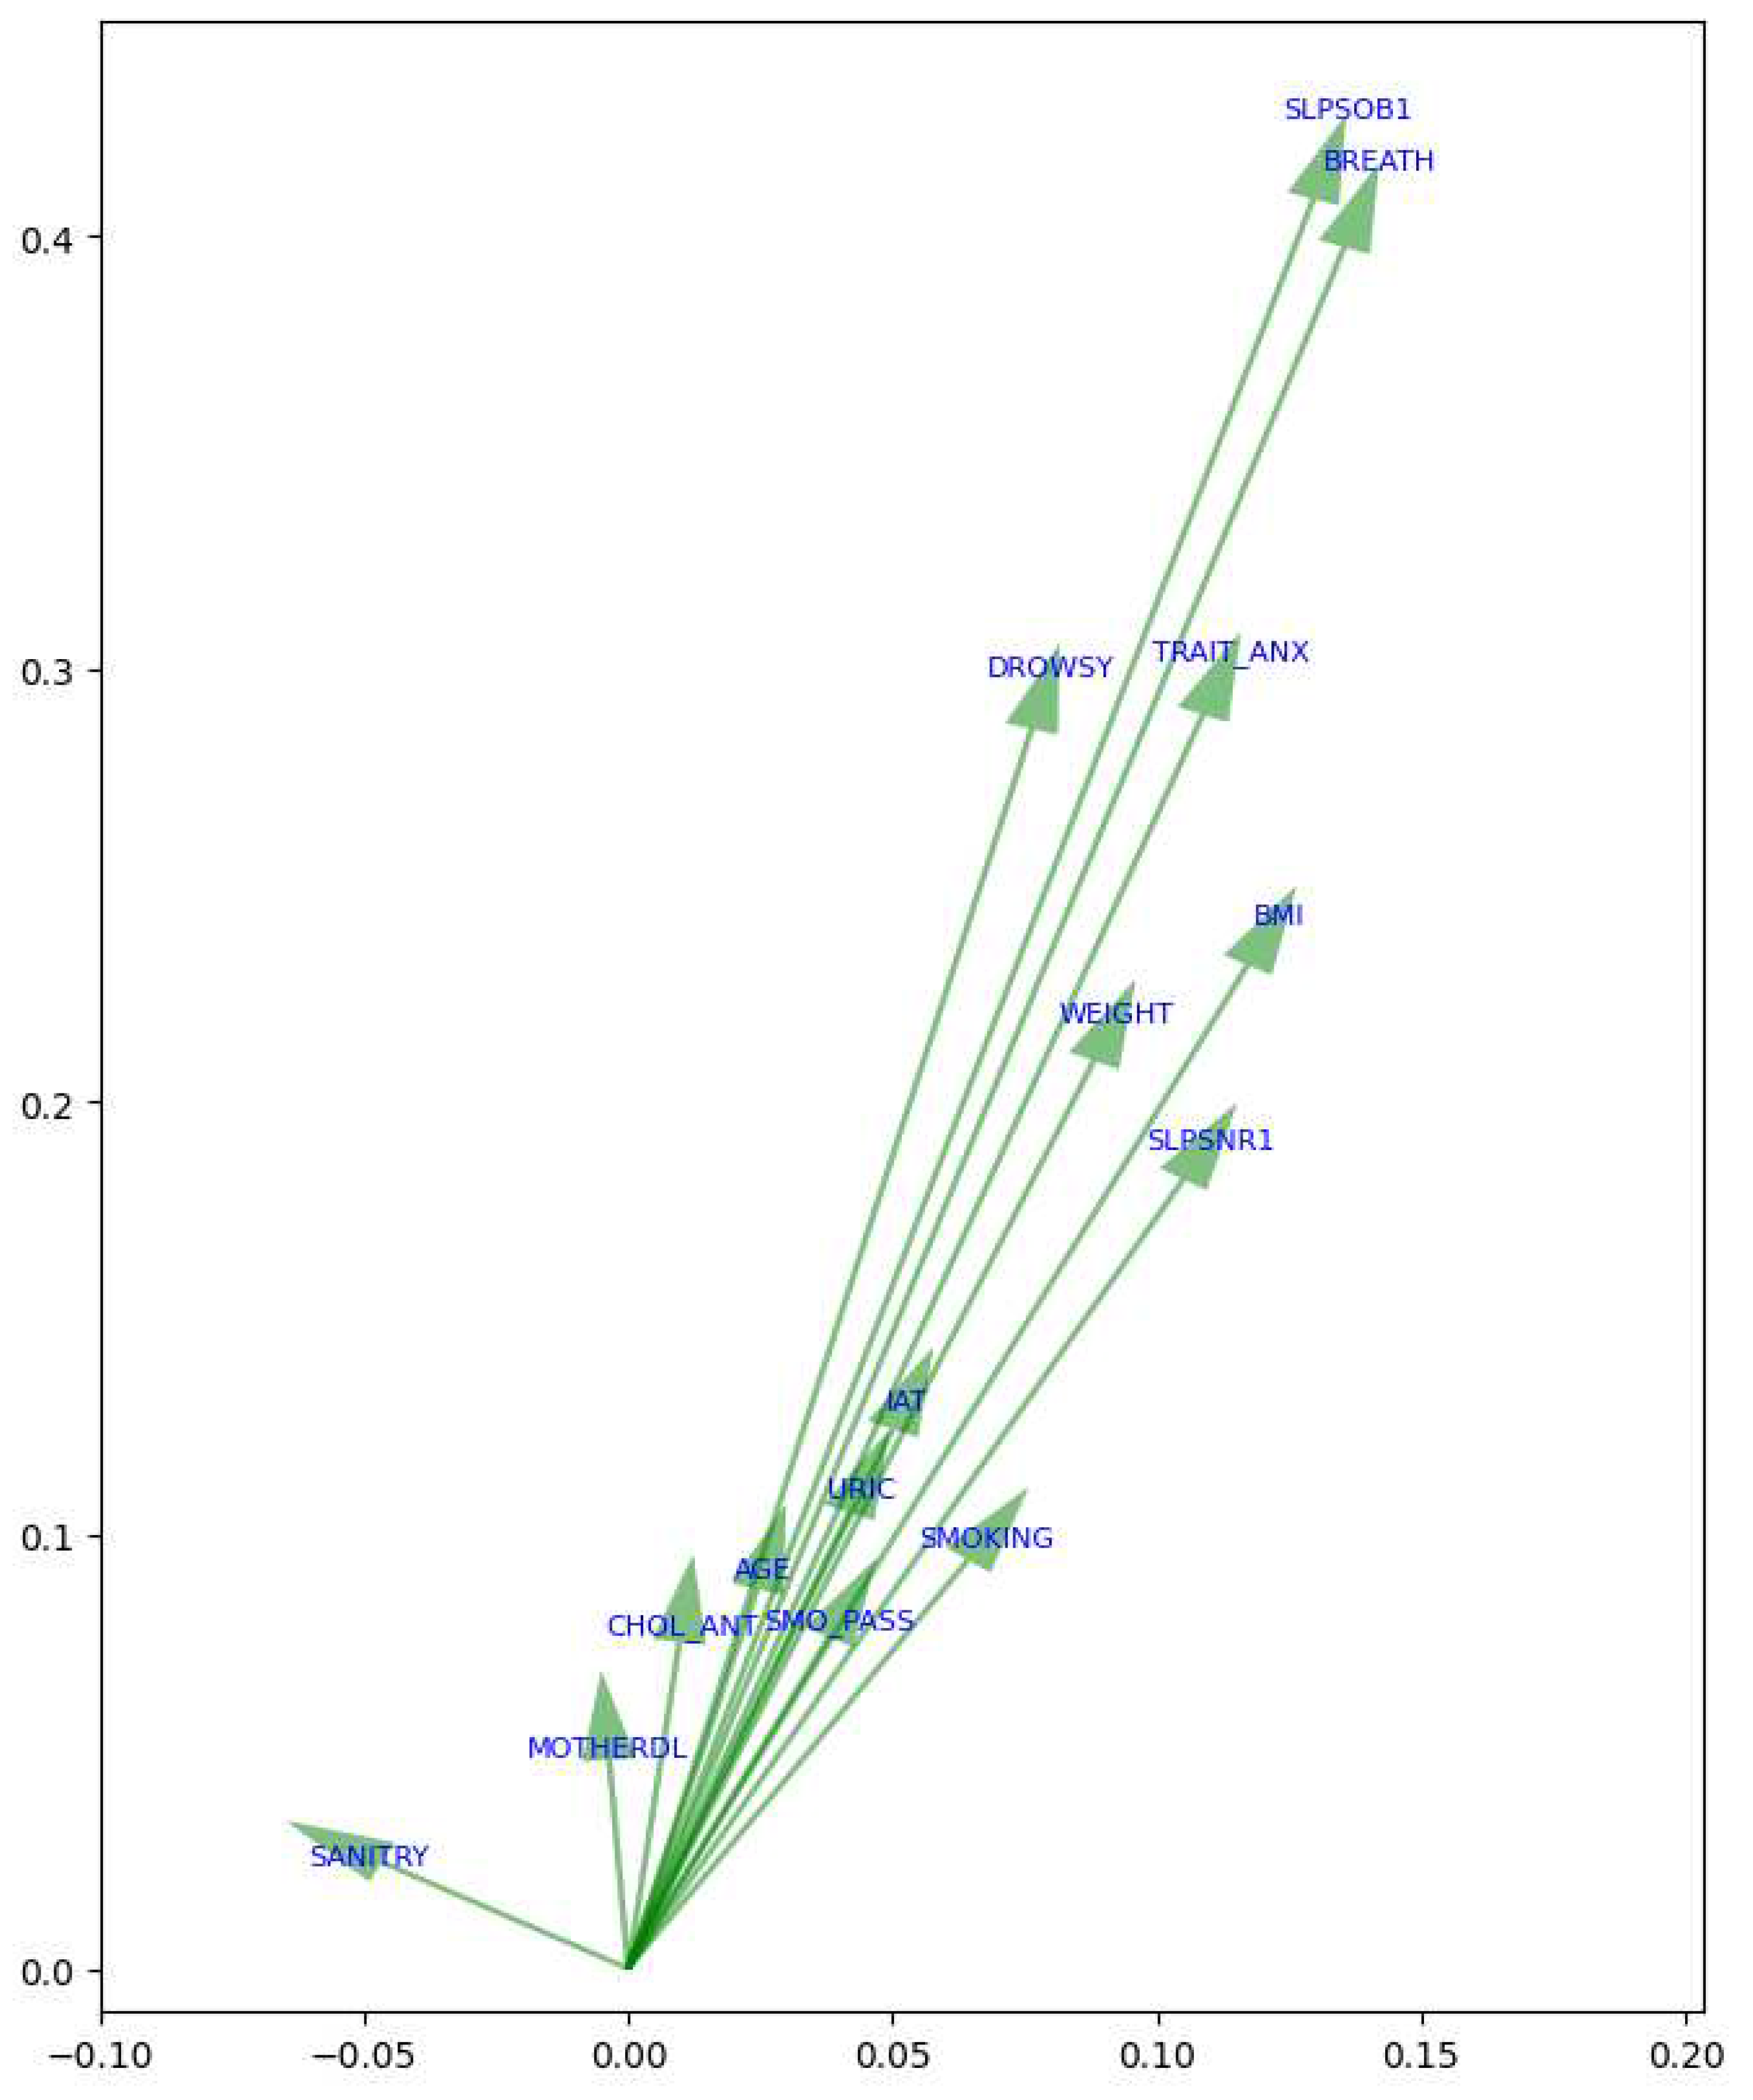
The PCA analysis, as shown in Figure 3, revealed the relative importance of features concerning MetS in men. The first principal component (PC1) was more influenced by features such as Weight (WEIGHT), body mass index (BMI), and SDI by value (VALUE), suggesting that these variables significantly contributed to the observed variability in the data. On the other hand, the second principal component (PC2) was more affected by features like educational lag (EDULAG) and socioeconomic stratum (STRATUM). These findings indicated that Weight and BMI were prominent factors in the context of MetS, as well as education and socioeconomic stratum. In this case, PC1 was considered the most significant component, as it had a magnitude of 0.508501, capturing most of the variability, while PC2 had a magnitude of 0.499809.
On the other hand, in the case of women (see Figure ??), features associated with the variability of MetS along PC1 were sodium levels based on the dietary survey (SODIUM), saturated fat (SATFAT), and monosaturated fat (MONFAT), which exhibit significant magnitudes in PC1. Furthermore, BMI also significantly influences PC1, indicating its association with this variability. Conversely, variables like sleep short (SLPSOB1) and waking up with shortness of breath (BREATH) demonstrate significant magnitudes in PC2. Similarly, trait anxiety (TRAIT_ANX) and feeling drowsy or sleepy (DROWSY) are also associated with variability in PC2. Therefore, considering the magnitudes in the principal components, the features in women associated with the risk of MetS include SODIUM, SATFAT, and MONFAT from PC1, as well as SLPNOTQ and SLPSOB1 from PC2.
5. Discussion
MetS is a severe and potentially life-threatening condition that significantly increases the risk of developing cardiovascular diseases also increasing the severity of diabetes. Over the years, several consistently highlighted risk factors have been associated with MetS. This study analyzed participant data from a cohort to identify the primary risk factors in both men and women, considering imbalanced data. Subsequently, data balancing techniques were applied to ascertain whether significant differences exist, contributing to selecting risk factors for MetS prediction. Using data balancing techniques is crucial in this context, as it helps ensure a more accurate and unbiased identification of relevant risk factors, especially when working with unevenly distributed data. In this study, we applied logistic regression to identify the risk factors in men and women that predict the occurrence of MetS within an imbalanced data environment.
5.1. Logistic regression
The logistic regression analysis in women demonstrates (as expected, of course) the strong connection between MetS and elevated glucose levels (GLU), in line with prior research [46,47] emphasizing the crucial role of glucose in MetS. Additionally, uric acid (URIC) is also identified as a significant risk factor in women [48,49,50]. Subsequent findings revealed other risk factors, including waist circumference (WC), body mass index (BMI), and systolic blood pressure (SBP), all essential components of MetS. WC is an indicator of abdominal obesity closely linked to insulin resistance, while BMI reflects the relationship between Weight and height, a significant obesity-related risk factor for MetS. Similarly, elevated SBP represents another component of MetS.
Furthermore, Figure 2 highlights additional significant factors derived from dietary data, including the intake of protein and fructose [51,52,53]. When these two nutrients are combined, they have been linked to an elevated risk of MetS [54]. Likewise, high copper (CU) consumption is evident, which can impact glucose regulation [3] and liver function, both crucial components in MetS [55]. These factors underscore the importance of moderate consumption of these nutrients in preventing MetS.
In the case of men, glucose (GLU) was identified as the primary factor associated with MetS, followed by triglycerides (TRIG), waist circumference (WC), the atherogenic index (IAT), and systolic blood pressure (SBP). Additionally, the consumption of lactose (LACT) [56] and carbohydrates (CARBO) [57] was noted among the nutrients. Elevated glucose, triglycerides, and waist circumference are critical markers of MetS, while the atherogenic index assesses cardiovascular risk. High systolic blood pressure is another significant component of this syndrome. Regarding lactose, it’s worth noting that certain dairy products may include added sugars, which can potentially increase the overall calorie intake [58], potentially contributing to obesity and insulin resistance, two critical factors in the onset of MetS. Moreover, high lactose consumption is associated with a risk factor for developing diabetes, cardiovascular diseases, and increased cholesterol levels [59,60].
It is possible that when working with unbalanced datasets, machine learning models like logistic regression tend to be biased towards the majority class. For this reason, data balancing techniques such as SMOTE and ADASYN were used to enable a more equitable training of the models to identify more precise relationships between variables and the MetS.
5.2. Use of machine learning with synthetic data
The most effective machine learning models for women revealed associations with attributes related to sleep quality, such as snores during sleep (SLPSNR1) [61], sleep short (SLPSOB1) [62], waking up with shortness of breath (BREATH) [63], restless sleep (SLPNOTQ) [64], and somnolence (SLPS3). Multiple studies have shown that poor sleep quality is closely linked to cardiovascular disease [65,66], diabetes [67], and MetS [68], as well as other adverse health outcomes. In the case of women, an increased likelihood of facing significant risks related to cardiovascular diseases and sleep problems has been observed, especially for those in the postmenopausal stage, which, in turn, can contribute to the development of risks associated with MetS [69]. Additionally, they highlighted factors related to anxiety (TRAIT_ANX), despite the association between MetS and anxiety remaining a subject of debate due to various issues [70], this study, like some others [71,72,73,74], identified anxiety as one of the critical factors that predisposing women to MetS.
In the same way, ex-smokers and current smokers (EXSMOKER, SMOKING) were found as features; based on this, it has been observed that both smokers and former smokers are predisposed to MetS. This finding is supported by various studies that suggest that smoking can have an adverse impact on blood lipid levels and lead to metabolic disturbances [75,76,77].
In women, nutritional components also appeared as relevant features, such as saturated fat (SATFAT), monounsaturated fat (MONFAT), sucrose (SUCR), fructose (FRUCT), and maltose (MALT). Based on this, a study has revealed that fructose, sucrose, and maltose are critical components of the leading nutrient pattern associated with a higher risk of MetS [54].
In the case of men, the most effective machine learning models displayed more pronounced associations with features linked to the SDI, encompassing energy efficiency (ENER_AD), educational lag (EDULAG), durable goods (DURAB, HEALTHHAC), quality and living space (QUA_HOUS), socioeconomic stratum (STRATUM), SDI by value (VALUE), and sanity adequacy (SANITRY). In studies [12,78,79,80], a significant association has been observed between a low socioeconomic level and the prevalence of metabolic syndrome. Furthermore, these models underscored variables related to parental gout conditions (MOTHERGT, FATHERGT). This supports research exploring the genetic predisposition to gout and suggests that a family history of this disease may increase the risk of other family members developing it [81]. This condition may also be related to metabolic syndrome due to poor dietary habits that could lead to obesity and insulin resistance [82,83].
5.3. Principal Component Analysis
Based on the resulting features obtained for men and women via machine learning models, we applied Principal Component Analysis to identify trends and potential correlations. The PCA conducted using the features obtained for men (Figure 3 and Figure 4) showed that PC1 (the most significant component) revealed a strong association of body-related factors, specifically Weight (WEIGHT) and body mass index (BMI). PC2 shows a strong correlation among variables related to the SDI. This indicates that the SDI plays a significant role in the onset of MetS, in addition to focusing on interventions related to Weight and obesity management.
Figure 3, depicts the distribution of participants in clusters, where Cluster 2, highlighted in green, turned out to be the cluster most predisposed to developing MetS. Additionally, Figure 4 offers a detailed view of the arrows and the direction of variables in the PCA. These arrows emphasize the contribution of individual features to the principal components.
In the context of MetS in women, the most influential factors in PC1 were factors related to dietary components such as sodium levels based on the dietary survey (SODIUM), saturated fats (SATFAT), and monounsaturated fats (MONFAT), sucrose (SUCR) and fructose (FRUCT), among others. PC2 exhibits a trend towards variables related to poor quality of sleep and anxiety, as sleep short (SLPSOB1), trait anxiety (TRAIT_ANX), SLPNOTQ, and somnolence (SLPS3) have significant values in this component. Other variables related to smoking and education (SEC_SCHOOL) also have a notable influence on this component. This suggests that dietary control is crucial in preventing MetS among women, as well as addressing poor sleep quality and anxiety. Hence PCA highlights relevant differences in the presentation and risk factors of MetS between men and women [84,85], an issue that is progressively gaining relevance in the biomedical literature [86].
The PCA results for women illustrated in Figure 6 shows the distribution of participants in clusters. Similarly to the men’s analysis, the cluster most predisposed to developing MetS was Cluster 2, depicted by yellow dots. Additionally, Figure 7 provides a closer examination of the arrows and the direction of variables in the PCA.
Figure 5.
Top features for men and women considering the results of RF and RPART applying balancing techniques.
Figure 5.
Top features for men and women considering the results of RF and RPART applying balancing techniques.
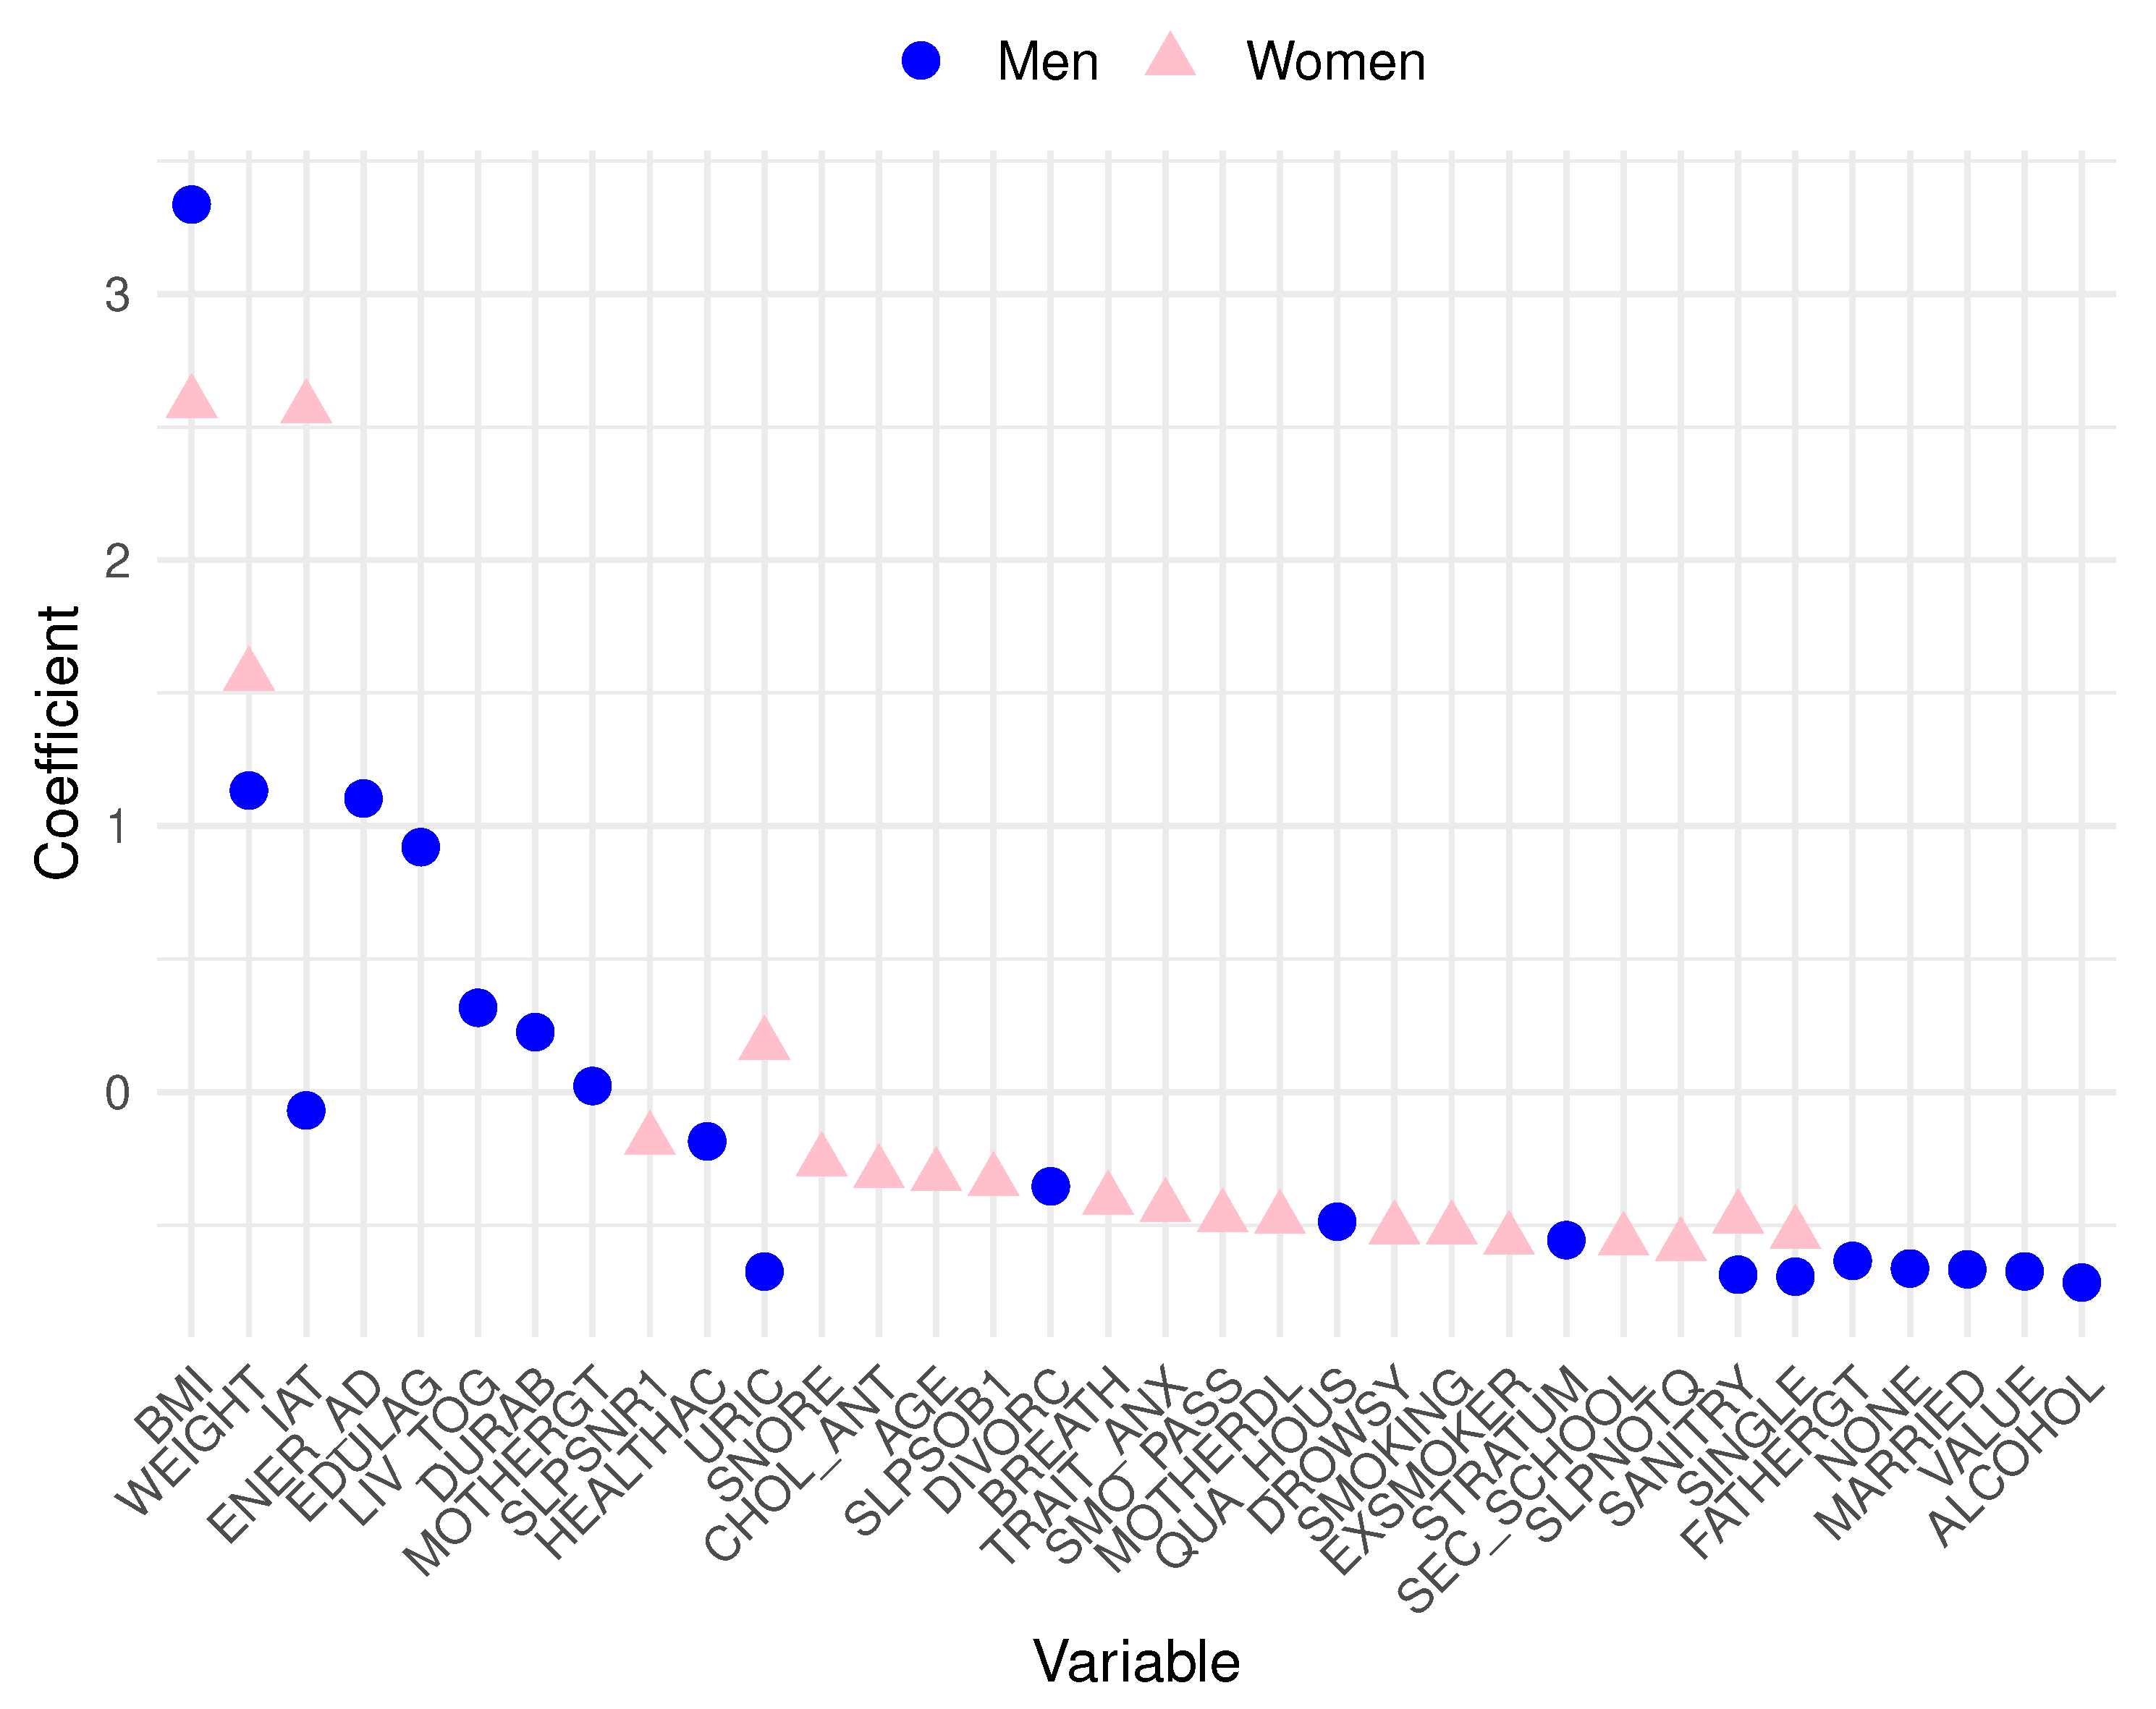
Figure 6.
PCA of features of Women for metabolic syndrome with clusters.
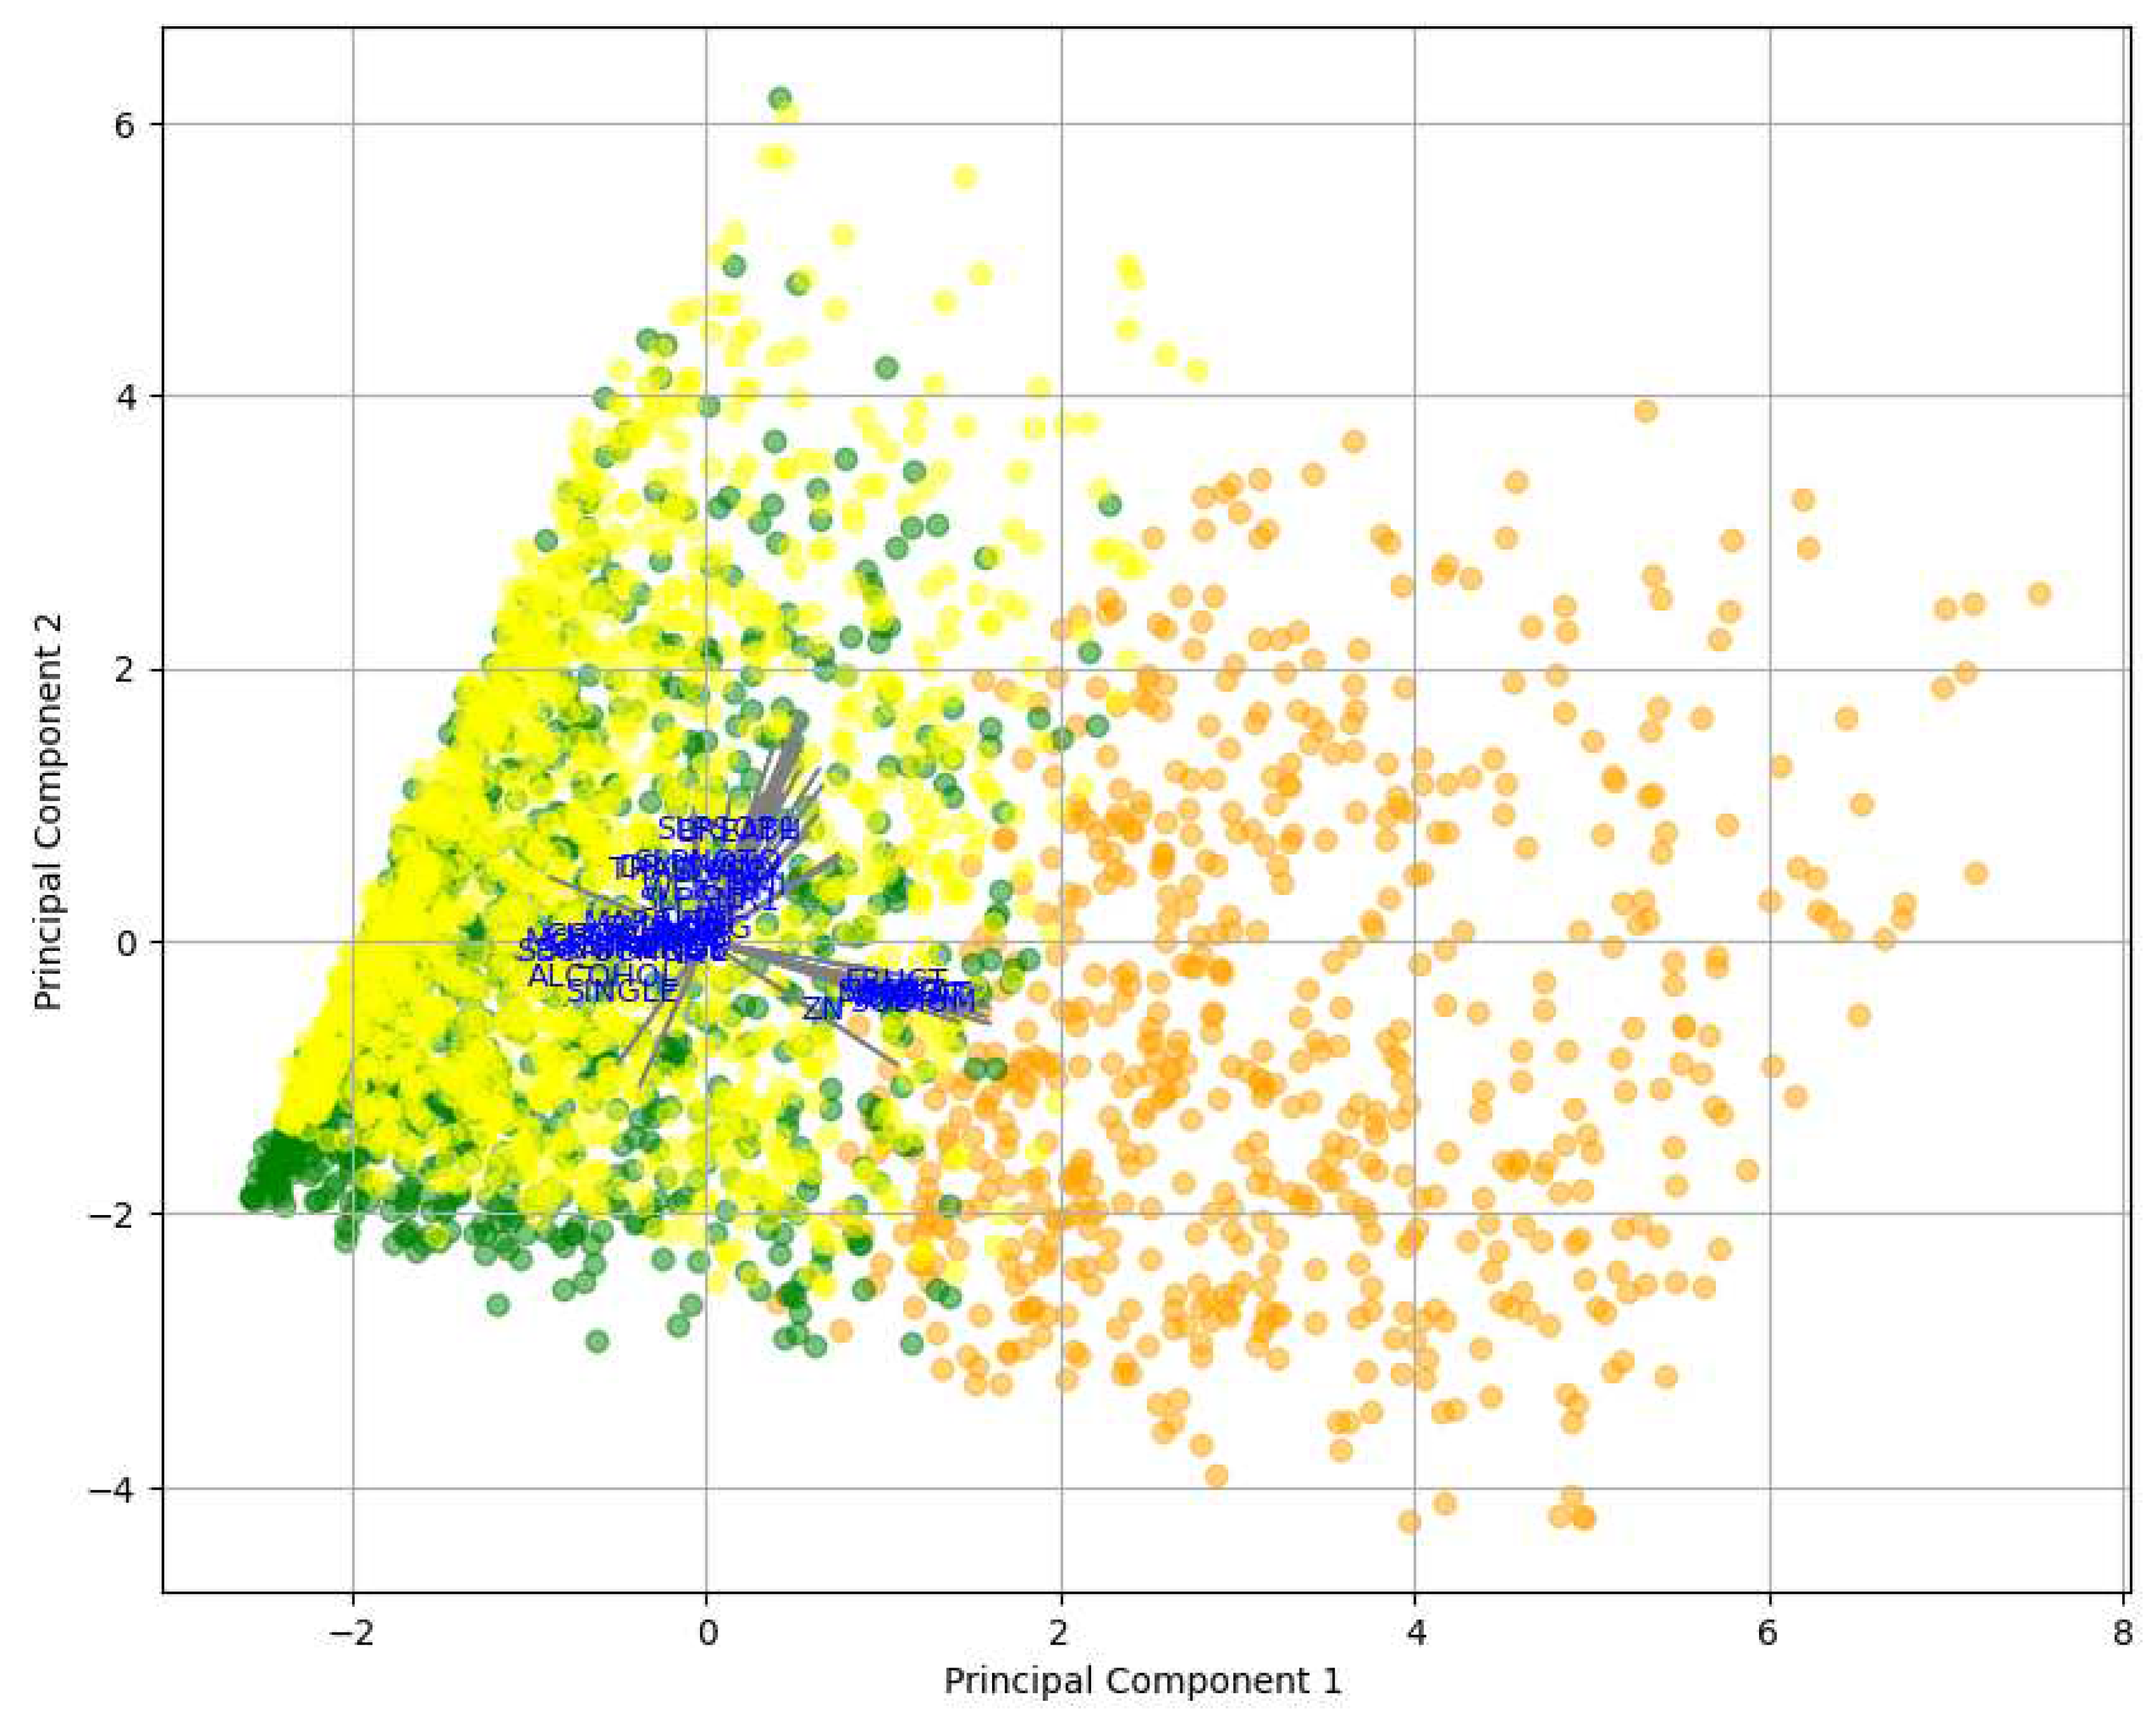
Figure 7.
Direction of variables in the PCA women.
6. Conclusion
In this study, we utilized logistic regression as the initial step before dataset balancing, aiming to discern the features closely related to MetS within both male and female populations. Our findings revealed that among men, the top 10 variables showed the strongest associations with MetS encompassed blood glucose (GLU), triglycerides (TRIG), waist circumference (WC), atherogenic index (IAT), systolic blood pressure (SBP), vitamin B12 (B12), body mass index (BMI), lactose (LACT), carbohydrates (CARBO), and high glucose levels derived from the dietary survey (GLU_1). Conversely, for women, the ten most pertinent variables included GLU, TRIG, WC, BMI, SBP, total proteins (PROTEI), fructose (FRUCT), high cholesterol levels as per the dietary survey (CHOL_SN), uric acid (URIC), and copper (CU).
Subsequently, we integrated the SMOTE and ADASYN techniques with RF and RPART methodologies to reevaluate the most influential features associated with MetS prediction within a balanced dataset. The extraction of features pertaining to MetS from a balanced dataset not only enhances model generalization, ensuring more even and accurate training but also leads to performance optimization while mitigating the risk of overfitting. The results highlighted striking differences between the presentations and risk factors for MetS between men and women, pointing out to the need of targeted and differentiated public health and medical interventions to cope with this syndromic disease.
Limitations
This research was based on data from a cohort of relatively healthy adult residents of Mexico City.
Author Contributions
GOGE: Conceptualization, Data Curation, Investigation, Software, Validation, Writing - original draft, Writing - review and editing; MMG: Investigation, Supervision, Data Curation, Writing - review and editing; TRR: Investigation, Software, Data Curation, Writing - review and editing; LEGM: Data Curation, Writing - review and editing; MFM: Investigation, Project Administration, Writing - review and editing; TP: Investigation, Project Administration, Writing - review and editing; LMAG: Investigation, Project Administration, Supervision, Writing - review and editing; EHL: Conceptualization, Formal Analysis, Methodology, Investigation, Funding acquisition, Writing - review and editing.
Funding
This research was supported by the National Council of Humanities, Sciences, and Technologies (CONAHCYT, México), Cátedras CONAHCYT 1591 and by Intramural funds from the National Institute of Genomic Medicine (INMEGEN, México).
Sample Availability
All relevant data is contained within the article: The original contributions presented in the study are included in the article/supplementary material; further inquiries can be directed to the corresponding author/s.
Acknowledgments
We want to extend our appreciation to Consejo Nacional de Humanidades Ciencias y Tecnología (CONAHCYT) (National Council of Humanities, Sciences, and Technologies) under the ‘Cátedras CONAHCYT’ program, No. 1591. The authors gratefully acknowledge Maite Vallejo and Tlalpan 2020 project advisory group for their logistic support in this work.
Conflicts of Interest
The authors declare no conflicts of interest.
References
- Raffaitin, C.; Feart, C.; Le Goff, M.; Amieva, H.; Helmer, C.; Akbaraly, T.; Tzourio, C.; Gin, H.; Barberger-Gateau, P. Metabolic syndrome and cognitive decline in French elders: the Three-City Study. Neurology 2011, 76, 518–525. [Google Scholar] [CrossRef]
- Lin, S.C.; Sun, C.A.; You, S.L.; Hwang, L.C.; Liang, C.Y.; Yang, T.; Bai, C.H.; Chen, C.H.; Wei, C.Y.; Chou, Y.C. The link of self-reported insomnia symptoms and sleep duration with metabolic syndrome: a Chinese population-based study. Sleep 2016, 39, 1261–1266. [Google Scholar] [CrossRef]
- Zhang, Y.; Jiang, X.; Liu, J.; Lang, Y.; Liu, Y. The association between insomnia and the risk of metabolic syndrome: A systematic review and meta-analysis. Journal of Clinical Neuroscience 2021, 89, 430–436. [Google Scholar] [CrossRef]
- Romero-Martínez, M.; Shamah-Levy, T.; Cuevas-Nasu, L.; Gómez-Humarán, I.M.; Gaona-Pineda, E.B.; Gómez-Acosta, L.M.; Rivera-Dommarco, J.Á.; Hernández-Ávila, M. Diseño metodológico de la encuesta nacional de salud y nutrición de medio camino 2016. Salud pública de México 2017, 59, 299–305. [Google Scholar] [CrossRef]
- Jiménez-Genchi, A.; Caraveo-Anduaga, J. Crude and adjusted prevalence of sleep complaints in Mexico City. Sleep Science 2017, 10, 113. [Google Scholar]
- Symonds, M.E.; Sebert, S.P.; Hyatt, M.A.; Budge, H. Nutritional programming of the metabolic syndrome. Nature Reviews Endocrinology 2009, 5, 604–610. [Google Scholar] [CrossRef]
- Feldeisen, S.E.; Tucker, K.L. Nutritional strategies in the prevention and treatment of metabolic syndrome. Applied physiology, nutrition, and metabolism 2007, 32, 46–60. [Google Scholar] [CrossRef]
- García-García, F.J.; Monistrol-Mula, A.; Cardellach, F.; Garrabou, G. Nutrition, bioenergetics, and metabolic syndrome. Nutrients 2020, 12, 2785. [Google Scholar] [CrossRef] [PubMed]
- Castro-Barquero, S.; Ruiz-León, A.M.; Sierra-Pérez, M.; Estruch, R.; Casas, R. Dietary strategies for metabolic syndrome: a comprehensive review. Nutrients 2020, 12, 2983. [Google Scholar] [CrossRef] [PubMed]
- Tamura, Y.; Omura, T.; Toyoshima, K.; Araki, A. Nutrition management in older adults with diabetes: a review on the importance of shifting prevention strategies from metabolic syndrome to frailty. Nutrients 2020, 12, 3367. [Google Scholar] [CrossRef] [PubMed]
- Wang, J.; Li, C.; Li, J.; Qin, S.; Liu, C.; Wang, J.; Chen, Z.; Wu, J.; Wang, G. Development and internal validation of risk prediction model of metabolic syndrome in oil workers. BMC Public Health 2020, 20, 1–12. [Google Scholar] [CrossRef]
- Abbate, M.; Pericas, J.; Yañez, A.M.; López-González, A.A.; De Pedro-Gómez, J.; Aguilo, A.; Morales-Asencio, J.M.; Bennasar-Veny, M. Socioeconomic inequalities in metabolic syndrome by age and gender in a Spanish working population. International Journal of Environmental Research and Public Health 2021, 18, 10333. [Google Scholar] [CrossRef]
- Blanquet, M.; Legrand, A.; Pélissier, A.; Mourgues, C. Socio-economics status and metabolic syndrome: A meta-analysis. Diabetes & Metabolic Syndrome: Clinical Research & Reviews 2019, 13, 1805–1812. [Google Scholar]
- Mencar, C.; Gallo, C.; Mantero, M.; Tarsia, P.; Carpagnano, G.E.; Foschino Barbaro, M.P.; Lacedonia, D. Application of machine learning to predict obstructive sleep apnea syndrome severity. Health informatics journal 2020, 26, 298–317. [Google Scholar] [CrossRef]
- Learning, M.U.S.M. Obstructive sleep apnea: a prediction model using supervised machine learning method. The Importance of Health Informatics in Public Health during a Pandemic 2020, 272, 387. [Google Scholar]
- Eyvazlou, M.; Hosseinpouri, M.; Mokarami, H.; Gharibi, V.; Jahangiri, M.; Cousins, R.; Nikbakht, H.A.; Barkhordari, A. Prediction of metabolic syndrome based on sleep and work-related risk factors using an artificial neural network. BMC endocrine disorders 2020, 20, 1–11. [Google Scholar] [CrossRef] [PubMed]
- Seligman, B.; Tuljapurkar, S.; Rehkopf, D. Machine learning approaches to the social determinants of health in the health and retirement study. SSM-population health 2018, 4, 95–99. [Google Scholar] [CrossRef] [PubMed]
- Baqui, P.; Marra, V.; Alaa, A.M.; Bica, I.; Ercole, A.; van der Schaar, M. Comparing COVID-19 risk factors in Brazil using machine learning: the importance of socioeconomic, demographic and structural factors. Scientific reports 2021, 11, 1–10. [Google Scholar] [CrossRef] [PubMed]
- Kim, J.; Mun, S.; Lee, S.; Jeong, K.; Baek, Y. Prediction of metabolic and pre-metabolic syndromes using machine learning models with anthropometric, lifestyle, and biochemical factors from a middle-aged population in Korea. BMC Public Health 2022, 22, 664. [Google Scholar] [CrossRef] [PubMed]
- Jung, H.; Dan, H.; Pang, Y.; Kim, B.; Jeong, H.; Lee, J.E.; Kim, O. Association between dietary habits, shift work, and the metabolic syndrome: the Korea nurses’ health study. International Journal of Environmental Research and Public Health 2020, 17, 7697. [Google Scholar] [CrossRef] [PubMed]
- Kern, H.J.; Mitmesser, S.H. Role of nutrients in metabolic syndrome: a 2017 update. Nutrition and dietary supplements 2018, 13–26. [Google Scholar] [CrossRef]
- Tørris, C.; Småstuen, M.C.; Molin, M. Nutrients in fish and possible associations with cardiovascular disease risk factors in metabolic syndrome. Nutrients 2018, 10, 952. [Google Scholar] [CrossRef]
- Al-Daghri, N.M.; Khan, N.; Alkharfy, K.M.; Al-Attas, O.S.; Alokail, M.S.; Alfawaz, H.A.; Alothman, A.; Vanhoutte, P.M. Selected dietary nutrients and the prevalence of metabolic syndrome in adult males and females in Saudi Arabia: a pilot study. Nutrients 2013, 5, 4587–4604. [Google Scholar] [CrossRef] [PubMed]
- Bian, S.; Gao, Y.; Zhang, M.; Wang, X.; Liu, W.; Zhang, D.; Huang, G. Dietary nutrient intake and metabolic syndrome risk in Chinese adults: a case–control study. Nutrition journal 2013, 12, 1–7. [Google Scholar] [CrossRef] [PubMed]
- Colín-Ramírez, E.; Rivera-Mancía, S.; Infante-Vázquez, O.; Cartas-Rosado, R.; Vargas-Barrón, J.; Madero, M.; Vallejo, M. Protocol for a prospective longitudinal study of risk factors for hypertension incidence in a Mexico City population: the Tlalpan 2020 cohort. BMJ open 2017, 7, e016773. [Google Scholar] [CrossRef]
- Stewart, A.L.; Ware, J.E. Measuring functioning and well-being: the medical outcomes study approach; duke university Press, 1992. [Google Scholar]
- Zagalaz-Anula, N.; Hita-Contreras, F.; Martínez-Amat, A.; Cruz-Díaz, D.; Lomas-Vega, R. Psychometric properties of the medical outcomes study sleep scale in Spanish postmenopausal women. Menopause 2017, 24, 824–831. [Google Scholar] [CrossRef]
- Akçay, B.D.; Akcay, D.; Yetkin, S. Turkish reliability and validity study of the medical outcomes study (MOS) sleep scale inpatients with obstructive sleep apnea. Turkish Journal of Medical Sciences 2021, 51, 268–279. [Google Scholar] [CrossRef]
- Kim, M.K.; You, J.A.; Lee, J.H.; Lee, S.A. The reliability and validity of the Korean version of the Medical Outcomes Study-Sleep Scale in patients with obstructive sleep apnea. Sleep Medicine Research 2011, 2, 89–95. [Google Scholar] [CrossRef]
- Wolfe, F.; Michaud, K.; Li, T. Sleep disturbance in patients with rheumatoid arthritis: evaluation by medical outcomes study and visual analog sleep scales. The Journal of Rheumatology 2006, 33, 1942–1951. [Google Scholar] [PubMed]
- Chobanian, A.V.; Bakris, G.L.; Black, H.R.; Cushman, W.C.; Green, L.A.; Izzo, J.L., Jr.; Jones, D.W.; Materson, B.J.; Oparil, S.; Wright, J.T., Jr.; et al. Seventh report of the joint national committee on prevention, detection, evaluation, and treatment of high blood pressure. hypertension 2003, 42, 1206–1252. [Google Scholar] [CrossRef]
- Marfell-Jones, M.J.; Stewart, A.; De Ridder, J. International standards for anthropometric assessment; 2012. [Google Scholar]
- Craig, C.L.; Marshall, A.L.; Sjöström, M.; Bauman, A.E.; Booth, M.L.; Ainsworth, B.E.; Pratt, M.; Ekelund, U.; Yngve, A.; Sallis, J.F.; et al. International physical activity questionnaire: 12-country reliability and validity. Medicine & science in sports & exercise 2003, 35, 1381–1395. [Google Scholar]
- Spielberger, C.D.; Smith, L.H. Anxiety (drive), stress, and serial-position effects in serial-verbal learning. Journal of Experimental Psychology 1966, 72, 589. [Google Scholar] [CrossRef] [PubMed]
- Horváth, A.; Montana, X.; Lanquart, J.P.; Hubain, P.; Szucs, A.; Linkowski, P.; Loas, G. Effects of state and trait anxiety on sleep structure: A polysomnographic study in 1083 subjects. Psychiatry research 2016, 244, 279–283. [Google Scholar] [CrossRef]
- Hernández-Avila, J.; gonzález-Avilés, L.; Rosales-Mendoza, E. Manual de usuario. SNUT Sistema de Evaluación de Hábitos Nutricionales y Consumo de Nutrimentos; Instituto Nacional de Salud Pública: México, 2003. [Google Scholar]
- Avcı, C.; Akbaş, A. Sleep apnea classification based on respiration signals by using ensemble methods. Bio-medical materials and engineering 2015, 26, S1703–S1710. [Google Scholar] [CrossRef] [PubMed]
- Shi, Y.; Ma, L.; Chen, X.; Li, W.; Feng, Y.; Zhang, Y.; Cao, Z.; Yuan, Y.; Xie, Y.; Liu, H.; et al. Prediction model of obstructive sleep apnea–related hypertension: Machine learning–based development and interpretation study. Frontiers in Cardiovascular Medicine 2022, 9, 1042996. [Google Scholar] [CrossRef]
- Xia, S.J.; Gao, B.Z.; Wang, S.H.; Guttery, D.S.; Li, C.D.; Zhang, Y.D. Modeling of diagnosis for metabolic syndrome by integrating symptoms into physiochemical indexes. Biomedicine & Pharmacotherapy 2021, 137, 111367. [Google Scholar]
- Al-Jedaani, A.W.; Aziz, W.; Alshdadi, A.A.; Alqarni, M.; Nadeem, M.S.A.; Wailoo, M.P.; Schlindwein, F.S. An Intelligent System Based on Heart Rate Variability Measures and Machine Learning Techniques for Classification of Normal and Growth Restricted Children. In WITS 2020: Proceedings of the 6th International Conference on Wireless Technologies, Embedded, and Intelligent Systems; Springer, 2022; pp. 101–111. [Google Scholar]
- Worachartcheewan, A.; Schaduangrat, N.; Prachayasittikul, V.; Nantasenamat, C. Data mining for the identification of metabolic syndrome status. EXCLI journal 2018, 17, 72. [Google Scholar]
- Li, J.; Zhang, Y.; Lu, T.; Liang, R.; Wu, Z.; Liu, M.; Qin, L.; Chen, H.; Yan, X.; Deng, S.; et al. Identification of diagnostic genes for both Alzheimer’s disease and Metabolic syndrome by the machine learning algorithm. Frontiers in Immunology 2022, 13, 1037318. [Google Scholar] [CrossRef]
- Breiman, L. Random forests. Machine learning 2001, 45, 5–32. [Google Scholar] [CrossRef]
- Breiman, L.; Friedman, J.H.; Olshen, R.A.; Stone, C.J. Classification and regression trees. In Brooks; Wadsworth and Brooks: Monterey, CA, USA, 1984. [Google Scholar]
- R Core Team, R: A Language and Environment for Statistical Computing; R Foundation for Statistical Computing: Vienna, Austria, 2013.
- Bentley-Lewis, R.; Koruda, K.; Seely, E.W. The metabolic syndrome in women. Nature clinical practice Endocrinology & metabolism 2007, 3, 696–704. [Google Scholar]
- Hakkarainen, H.; Huopio, H.; Cederberg, H.; Pääkkönen, M.; Voutilainen, R.; Heinonen, S. The risk of metabolic syndrome in women with previous GDM in a long-term follow-up. Gynecological Endocrinology 2016, 32, 920–925. [Google Scholar] [CrossRef]
- Kim, I.Y.; Han, K.D.; Kim, D.H.; Eun, Y.; Cha, H.S.; Koh, E.M.; Lee, J.; Kim, H. Women with metabolic syndrome and general obesity are at a higher risk for significant hyperuricemia compared to men. Journal of clinical medicine 2019, 8, 837. [Google Scholar] [CrossRef] [PubMed]
- King, C.; Lanaspa, M.A.; Jensen, T.; Tolan, D.R.; Sánchez-Lozada, L.G.; Johnson, R.J. Uric acid as a cause of the metabolic syndrome. Uric Acid in Chronic Kidney Disease 2018, 192, 88–102. [Google Scholar]
- Copur, S.; Demiray, A.; Kanbay, M. Uric acid in metabolic syndrome: Does uric acid have a definitive role? European journal of internal medicine 2022, 103, 4–12. [Google Scholar] [CrossRef]
- Taskinen, M.R.; Packard, C.J.; Borén, J. Dietary fructose and the metabolic syndrome. Nutrients 2019, 11, 1987. [Google Scholar] [CrossRef] [PubMed]
- Mortera, R.R.; Bains, Y.; Gugliucci, A. Fructose at the crossroads of the metabolic syndrome and obesity epidemics. Frontiers in Bioscience-Landmark 2019, 24, 186–211. [Google Scholar]
- Badely, M.; Sepandi, M.; Samadi, M.; Parastouei, K.; Taghdir, M. The effect of whey protein on the components of metabolic syndrome in overweight and obese individuals; a systematic review and meta-analysis. Diabetes & Metabolic Syndrome: Clinical Research & Reviews 2019, 13, 3121–3131. [Google Scholar]
- Khayyatzadeh, S.S.; Moohebati, M.; Mazidi, M.; Avan, A.; Tayefi, M.; Parizadeh, S.M.R.; Ebrahimi, M.; Heidari-Bakavoli, A.; Azarpazhooh, M.R.; Esmaily, H.; et al. Nutrient patterns and their relationship to metabolic syndrome in Iranian adults. European journal of clinical investigation 2016, 46, 840–852. [Google Scholar] [CrossRef] [PubMed]
- Lu, C.W.; Lee, Y.C.; Kuo, C.S.; Chiang, C.H.; Chang, H.H.; Huang, K.C. Association of serum levels of zinc, copper, and iron with risk of metabolic syndrome. Nutrients 2021, 13, 548. [Google Scholar] [CrossRef]
- Mirenayat, F.S.; Hajhashemy, Z.; Siavash, M.; Saneei, P. Effects of sumac supplementation on metabolic markers in adults with metabolic syndrome: a triple-blinded randomized placebo-controlled cross-over clinical trial. Nutrition Journal 2023, 22, 25. [Google Scholar] [CrossRef]
- Liu, Y.S.; Wu, Q.J.; Xia, Y.; Zhang, J.Y.; Jiang, Y.T.; Chang, Q.; Zhao, Y.H. Carbohydrate intake and risk of metabolic syndrome: A dose–response meta-analysis of observational studies. Nutrition, Metabolism and Cardiovascular Diseases 2019, 29, 1288–1298. [Google Scholar] [CrossRef]
- Song, W.O.; Wang, Y.; Chung, C.E.; Song, B.; Lee, W.; Chun, O.K. Is obesity development associated with dietary sugar intake in the US? Nutrition 2012, 28, 1137–1141. [Google Scholar] [CrossRef]
- Michaëlsson, K.; Wolk, A.; Langenskiöld, S.; Basu, S.; Lemming, E.W.; Melhus, H.; Byberg, L. Milk intake and risk of mortality and fractures in women and men: cohort studies. Bmj 2014, 349. [Google Scholar] [CrossRef]
- Lanou, A.J. Should dairy be recommended as part of a healthy vegetarian diet? Counterpoint. The American journal of clinical nutrition 2009, 89, 1638S–1642S. [Google Scholar] [CrossRef] [PubMed]
- Ma, J.; Zhang, H.; Wang, H.; Gao, Q.; Sun, H.; He, S.; Meng, L.; Wang, T. Association between self-reported snoring and metabolic syndrome: a systematic review and meta-analysis. Frontiers in neurology 2020, 11, 517120. [Google Scholar] [CrossRef] [PubMed]
- Xie, J.; Li, Y.; Zhang, Y.; Vgontzas, A.N.; Basta, M.; Chen, B.; Xu, C.; Tang, X. Sleep duration and metabolic syndrome: an updated systematic review and meta-analysis. Sleep Medicine Reviews 2021, 59, 101451. [Google Scholar] [CrossRef] [PubMed]
- Chasens, E.R.; Imes, C.C.; Kariuki, J.K.; Luyster, F.S.; Morris, J.L.; DiNardo, M.M.; Godzik, C.M.; Jeon, B.; Yang, K. Sleep and metabolic syndrome. Nursing Clinics 2021, 56, 203–217. [Google Scholar] [CrossRef] [PubMed]
- Lian, Y.; Yuan, Q.; Wang, G.; Tang, F. Association between sleep quality and metabolic syndrome: A systematic review and meta-analysis. Psychiatry research 2019, 274, 66–74. [Google Scholar] [CrossRef] [PubMed]
- Aziz, M.; Ali, S.S.; Das, S.; Younus, A.; Malik, R.; Latif, M.A.; Humayun, C.; Anugula, D.; Abbas, G.; Salami, J.; et al. Association of subjective and objective sleep duration as well as sleep quality with non-invasive markers of sub-clinical cardiovascular disease (CVD): a systematic review. Journal of atherosclerosis and thrombosis 2017, 24, 208–226. [Google Scholar] [CrossRef] [PubMed]
- Wipper, B.; Winkelman, J.W. The long-term psychiatric and cardiovascular morbidity and mortality of restless legs syndrome and periodic limb movements of sleep. Sleep Medicine Clinics 2021, 16, 279–288. [Google Scholar] [CrossRef] [PubMed]
- Chair, S.Y.; Wang, Q.; Cheng, H.Y.; Lo, S.W.S.; Li, X.M.; Wong, E.M.L.; Sit, J.W.H. Relationship between sleep quality and cardiovascular disease risk in Chinese post-menopausal women. BMC women’s health 2017, 17, 1–7. [Google Scholar] [CrossRef]
- Kang, K.W.; Kim, M.K.; Nam, T.S.; Kang, K.H.; Park, W.J.; Moon, H.S.; Oh, H.G.; Rhee, E.J.; Joo, E.Y. Association Between Sleep and the Metabolic Syndrome Differs Depending on Age. Journal of Sleep Medicine 2023, 20, 19–27. [Google Scholar] [CrossRef]
- Hery, C.M.B.; Hale, L.; Naughton, M.J. Contributions of the Women’s Health Initiative to understanding associations between sleep duration, insomnia symptoms, and sleep-disordered breathing across a range of health outcomes in postmenopausal women. Sleep health 2020, 6, 48–59. [Google Scholar] [CrossRef]
- Ji, S.; Chen, Y.; Zhou, Y.; Cao, Y.; Li, X.; Ding, G.; Tang, F. Association between anxiety and metabolic syndrome: An updated systematic review and meta-analysis. Frontiers in Psychiatry 2023, 14, 1118836. [Google Scholar] [CrossRef]
- Li, R.c.; Zhang, L.; Luo, H.; Lei, Y.; Zeng, L.; Zhu, J.; Tang, H. Subclinical hypothyroidism and anxiety may contribute to metabolic syndrome in Sichuan of China: a hospital-based population study. Scientific reports 2020, 10, 2261. [Google Scholar] [CrossRef]
- Peltzer, K.; Pengpid, S. Relationship between depression, generalized anxiety, and metabolic syndrome among Bhuddist temples population in Nakhon Pathom-Thailand. 2018. [Google Scholar]
- Rioli, G.; Tassi, S.; Mattei, G.; Ferrari, S.; Galeazzi, G.M.; Mancini, S.; Alboni, S.; Roncucci, L. The association between symptoms of anxiety, depression, and cardiovascular risk factors: results from an Italian cross-sectional study. The Journal of Nervous and Mental Disease 2019, 207, 340–347. [Google Scholar] [CrossRef]
- Berto, L.F.; Suemoto, C.K.; Moreno, A.B.; Maria de Jesus, M.F.; Nunes, M.A.A.; Maria del Carmen, B.M.; Barreto, S.M.; Diniz, M.d.F.H.S.; Lotufo, P.A.; Benseñor, I.M.; et al. Increased prevalence of depression and anxiety among subjects with metabolic syndrome in the Brazilian longitudinal study of adult health (ELSA-Brasil). Journal of the Academy of Consultation-Liaison Psychiatry 2022, 63, 529–538. [Google Scholar] [CrossRef]
- Kim, S.W.; Kim, H.J.; Min, K.; Lee, H.; Lee, S.H.; Kim, S.; Kim, J.S.; Oh, B. The relationship between smoking cigarettes and metabolic syndrome: A cross-sectional study with non-single residents of Seoul under 40 years old. PLoS One 2021, 16, e0256257. [Google Scholar] [CrossRef]
- Behl, T.A.; Stamford, B.A.; Moffatt, R.J. The Effects of Smoking on the Diagnostic Characteristics of Metabolic Syndrome: A Review. American Journal of Lifestyle Medicine 2023, 17, 397–412. [Google Scholar] [CrossRef]
- Youn, J.A.; Lee, Y.H.; Noh, M.S. Relationship between smoking duration and metabolic syndrome in Korean Former Smokers. Journal of the Korean Society for Research on Nicotine and Tobacco 2018, 9, 18–25. [Google Scholar] [CrossRef]
- Khambaty, T.; Schneiderman, N.; Llabre, M.M.; Elfassy, T.; Moncrieft, A.E.; Daviglus, M.; Talavera, G.A.; Isasi, C.R.; Gallo, L.C.; Reina, S.A.; et al. Elucidating the multidimensionality of socioeconomic status in relation to metabolic syndrome in the Hispanic Community Health Study/Study of Latinos (HCHS/SOL). International journal of behavioral medicine 2020, 27, 188–199. [Google Scholar] [CrossRef]
- Iguacel, I.; Börnhorst, C.; Michels, N.; Breidenassel, C.; Dallongeville, J.; González-Gross, M.; Gottrand, F.; Kafatos, A.; Karaglani, E.; Kersting, M.; et al. Socioeconomically disadvantaged groups and metabolic syndrome in European adolescents: The HELENA study. Journal of Adolescent Health 2021, 68, 146–154. [Google Scholar] [CrossRef]
- Atad, O.I.; Toker, S. Subjective workload and the metabolic syndrome: An exploration of the mediating role of burnout and the moderating effect of physical activity. International Journal of Stress Management 2023. [Google Scholar] [CrossRef]
- Dalbeth, N.; Stamp, L.K.; Merriman, T.R. The genetics of gout: towards personalised medicine? BMC medicine 2017, 15, 1–8. [Google Scholar] [CrossRef]
- Wang, L.; Zhang, T.; Liu, Y.; Tang, F.; Xue, F.; et al. Association of serum uric acid with metabolic syndrome and its components: a mendelian randomization analysis. BioMed Research International 2020, 2020. [Google Scholar] [CrossRef]
- Kim, S.K. Interrelationship of uric acid, gout, and metabolic syndrome: focus on hypertension, cardiovascular disease, and insulin resistance. Journal of Rheumatic Diseases 2018, 25, 19–27. [Google Scholar] [CrossRef]
- Gerdts, E.; Regitz-Zagrosek, V. Sex differences in cardiometabolic disorders. Nature medicine 2019, 25, 1657–1666. [Google Scholar] [CrossRef]
- Tramunt, B.; Smati, S.; Grandgeorge, N.; Lenfant, F.; Arnal, J.F.; Montagner, A.; Gourdy, P. Sex differences in metabolic regulation and diabetes susceptibility. Diabetologia 2020, 63, 453–461. [Google Scholar] [CrossRef]
- Faulkner, J.L.; Belin de Chantemèle, E.J. Sex hormones, aging and cardiometabolic syndrome. Biology of sex differences 2019, 10, 1–9. [Google Scholar] [CrossRef]
Figure 1.
Experimental process.
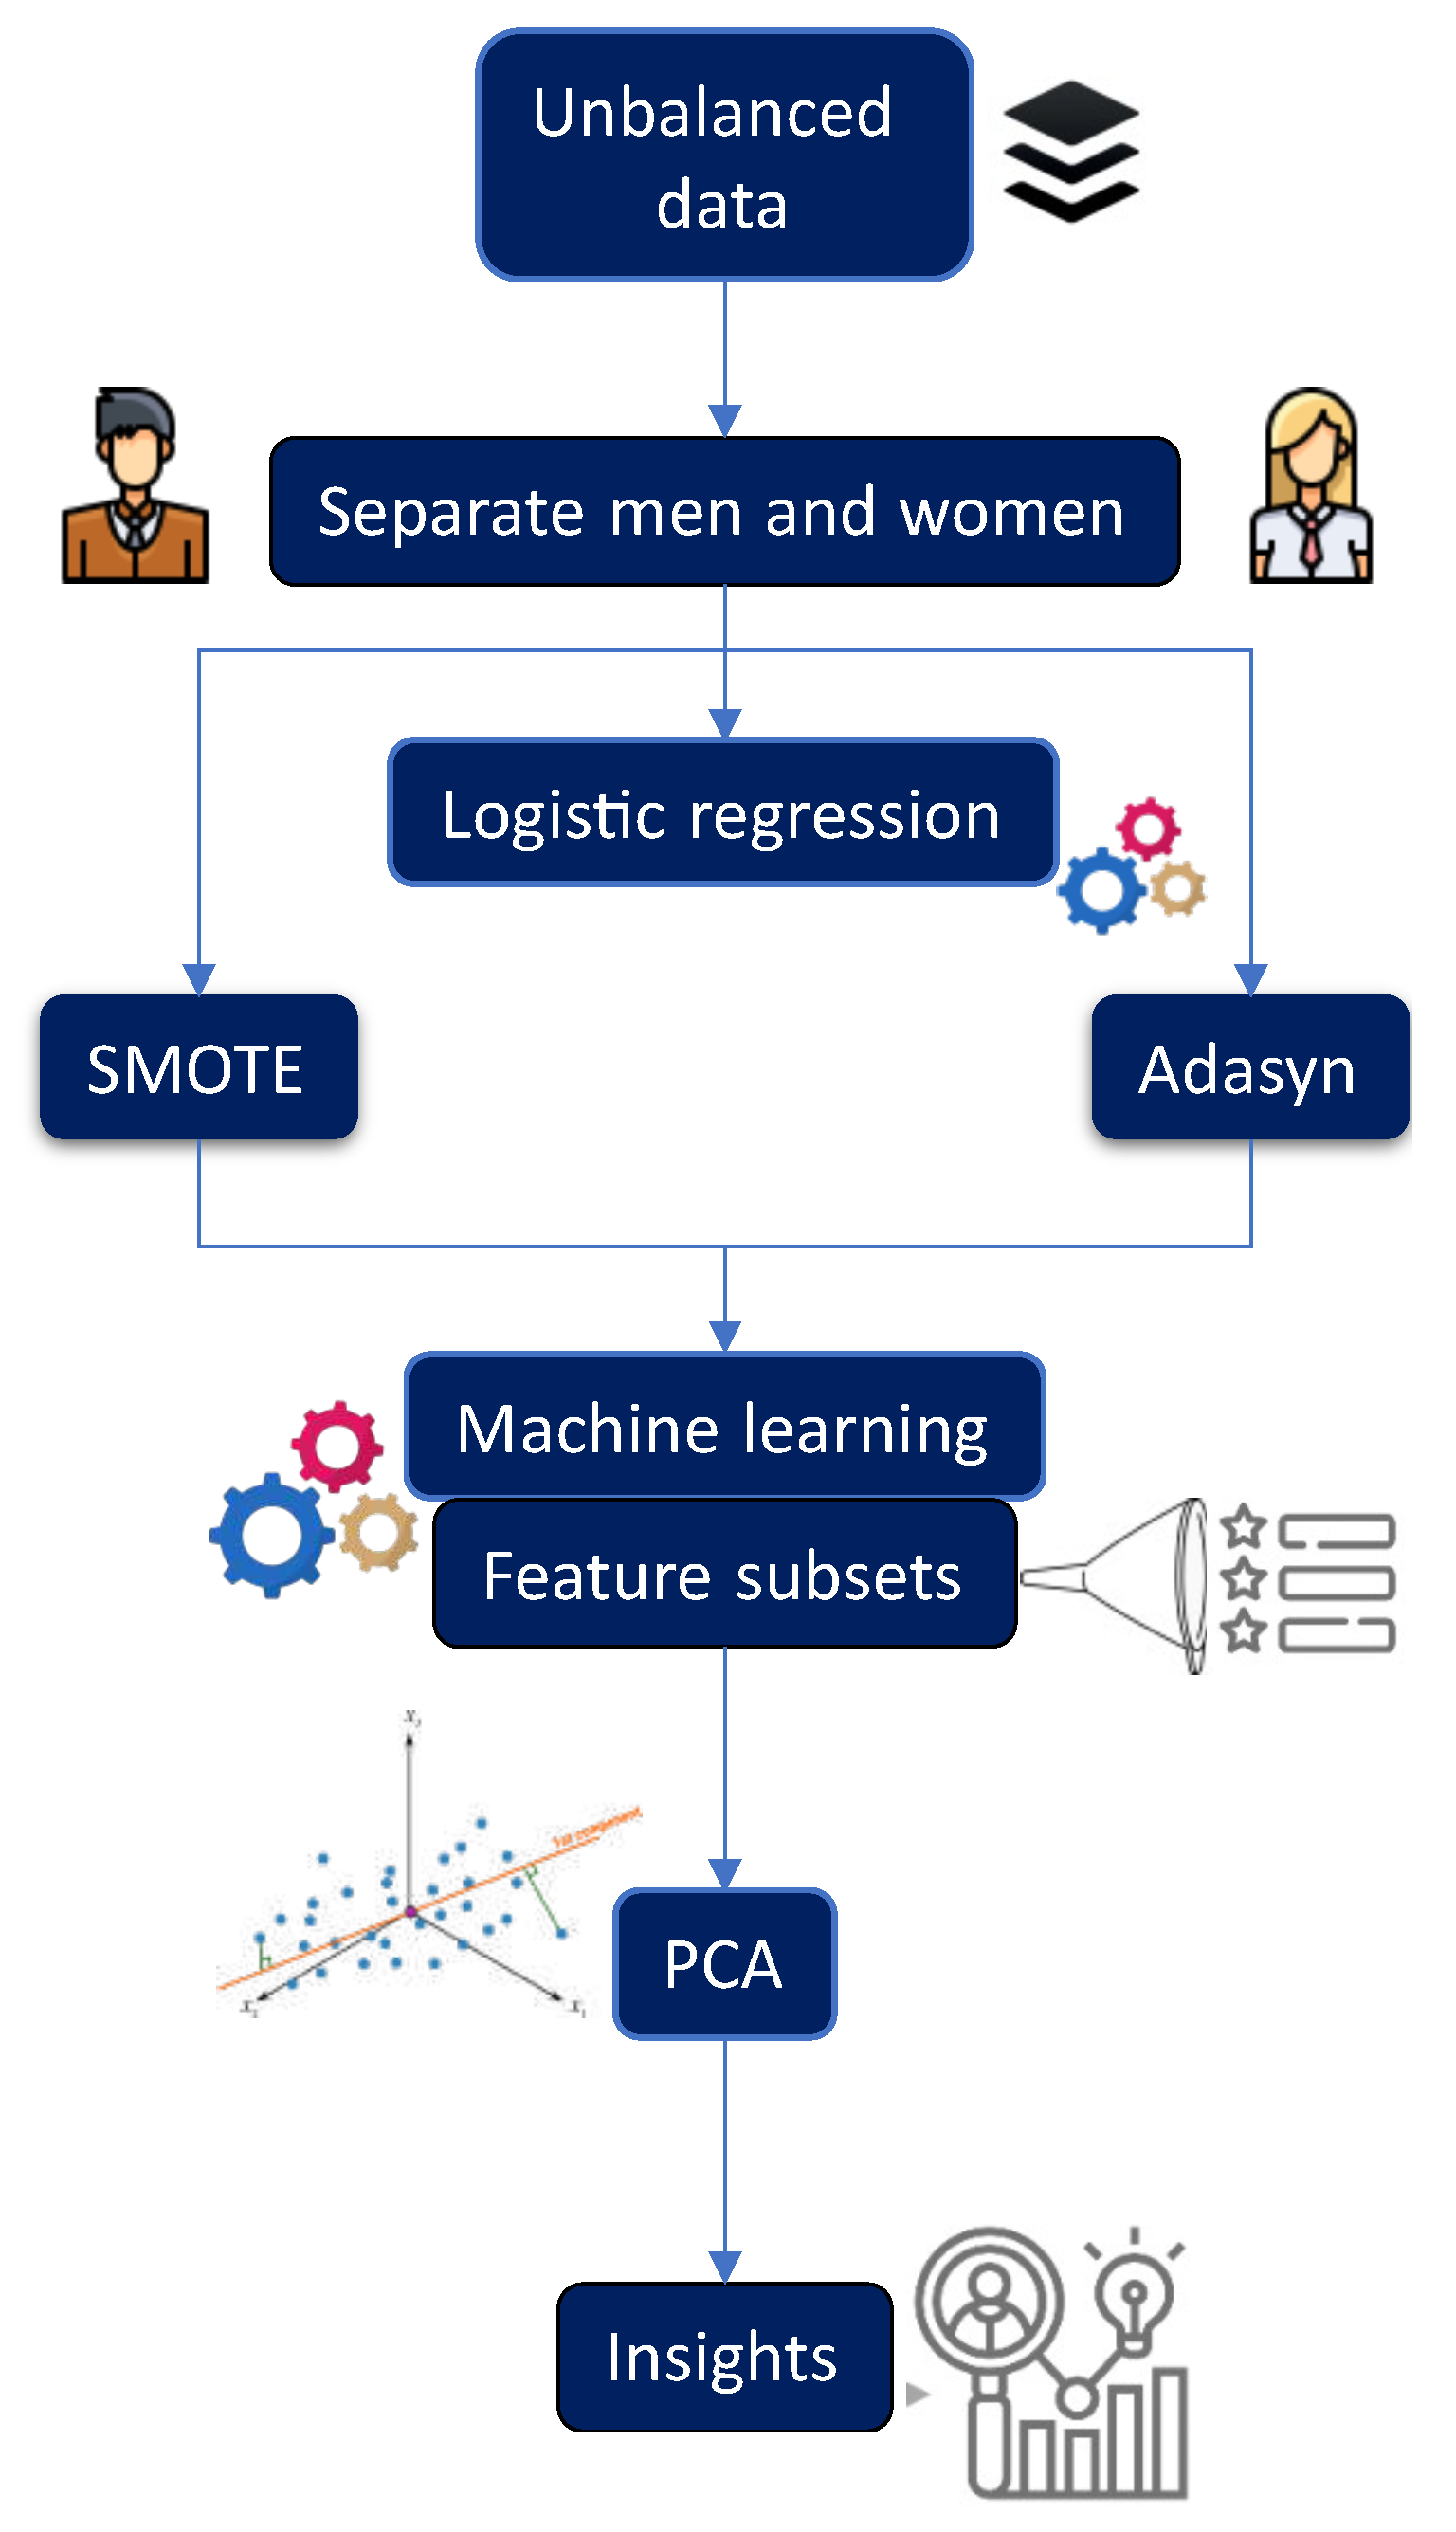
Figure 2.
The most important variables obtained through logistic regression for men and women before data balancing.
Figure 2.
The most important variables obtained through logistic regression for men and women before data balancing.
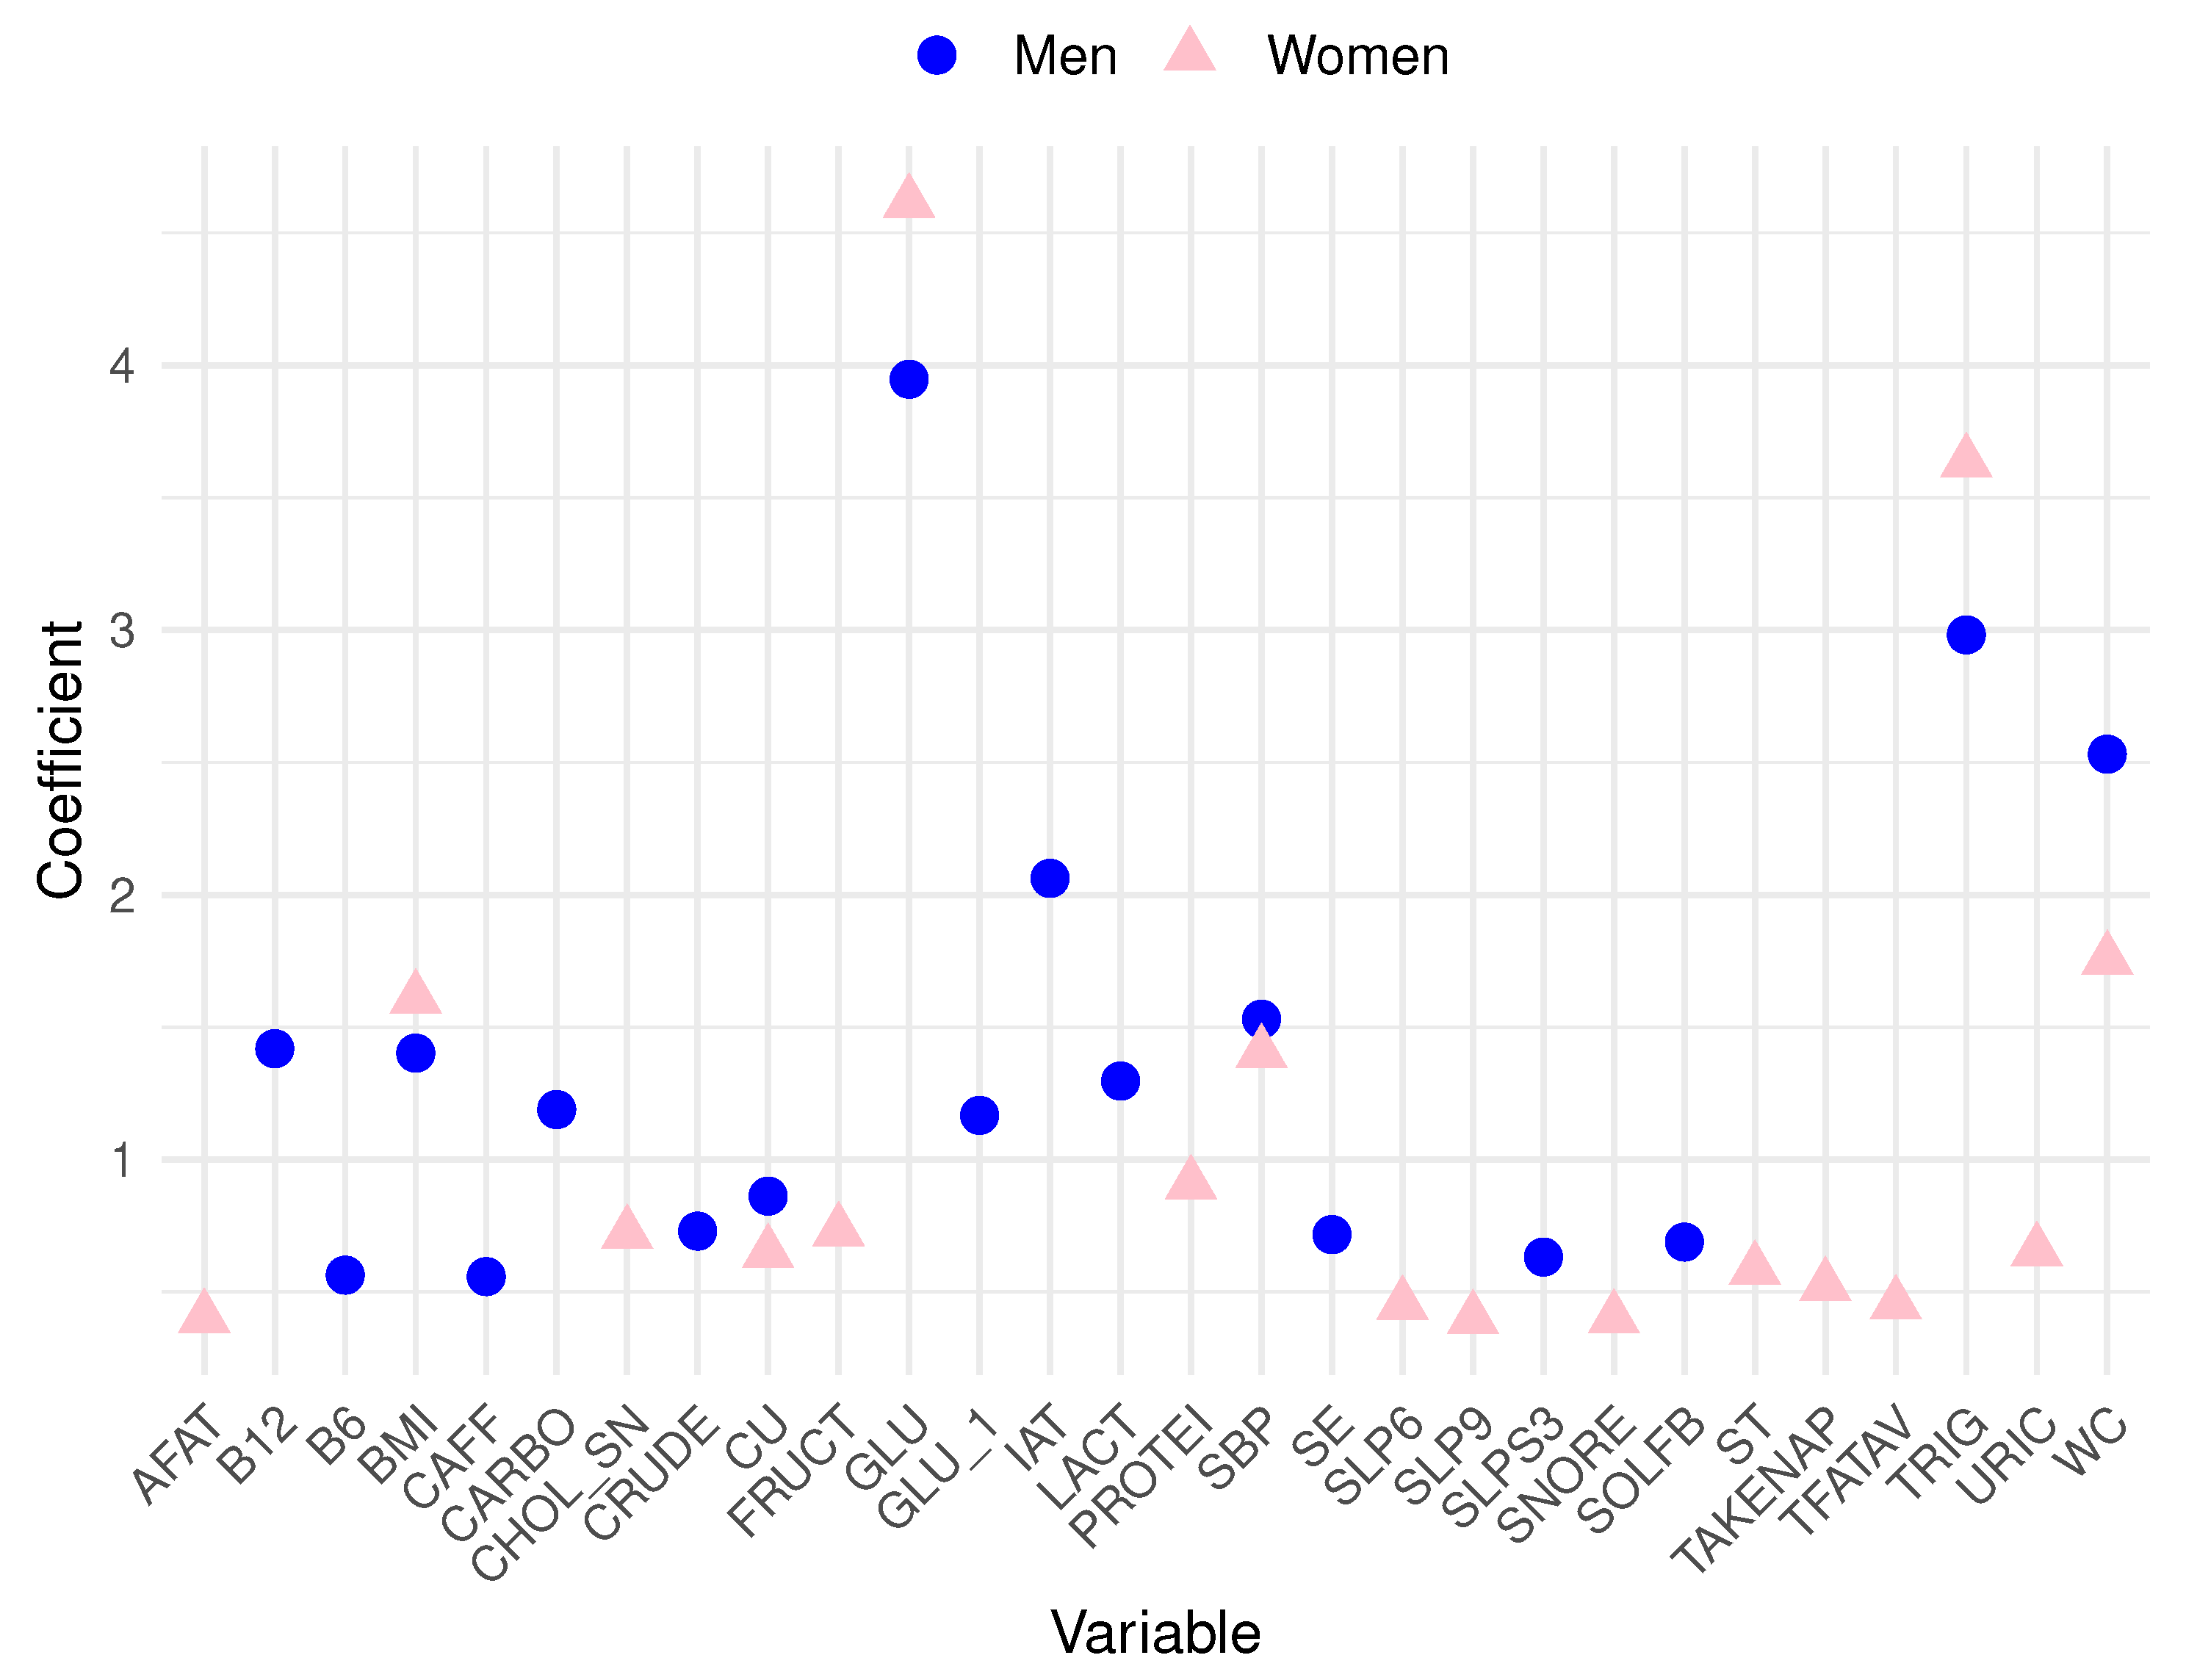
Figure 3.
PCA of features of men for metabolic syndrome with clusters.
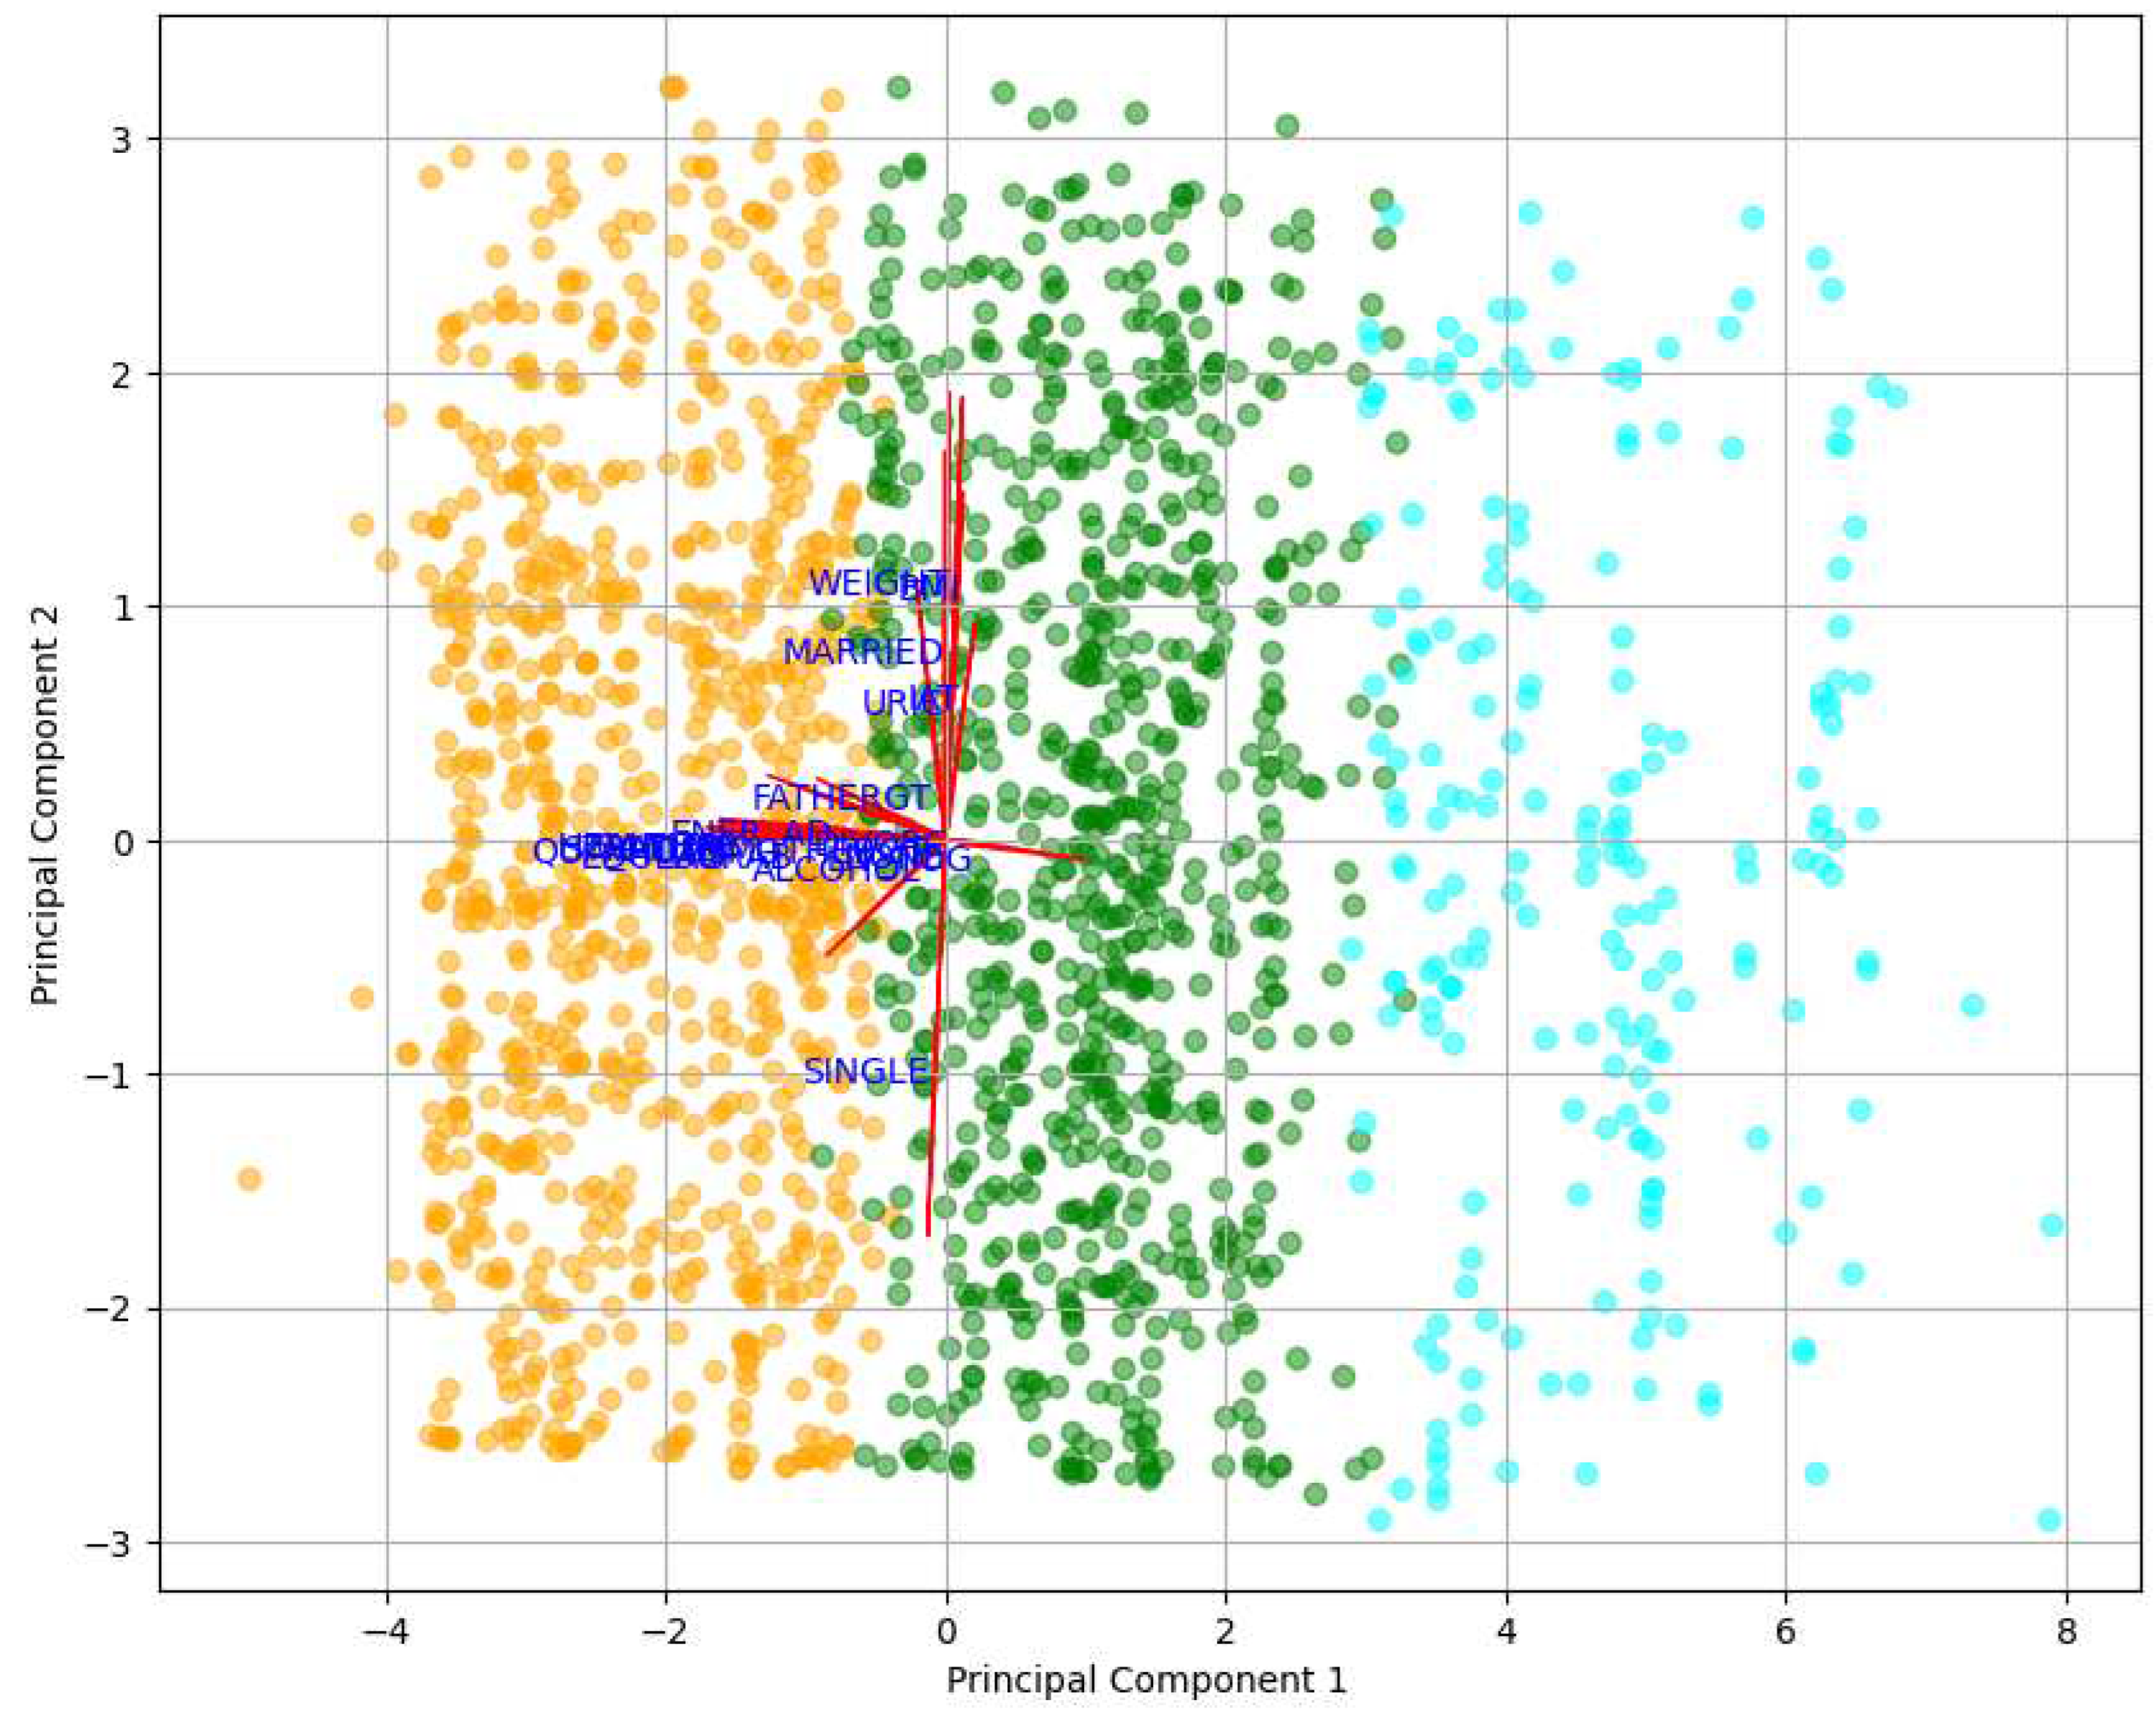
Figure 4.
Direction of variables in the PCA men.
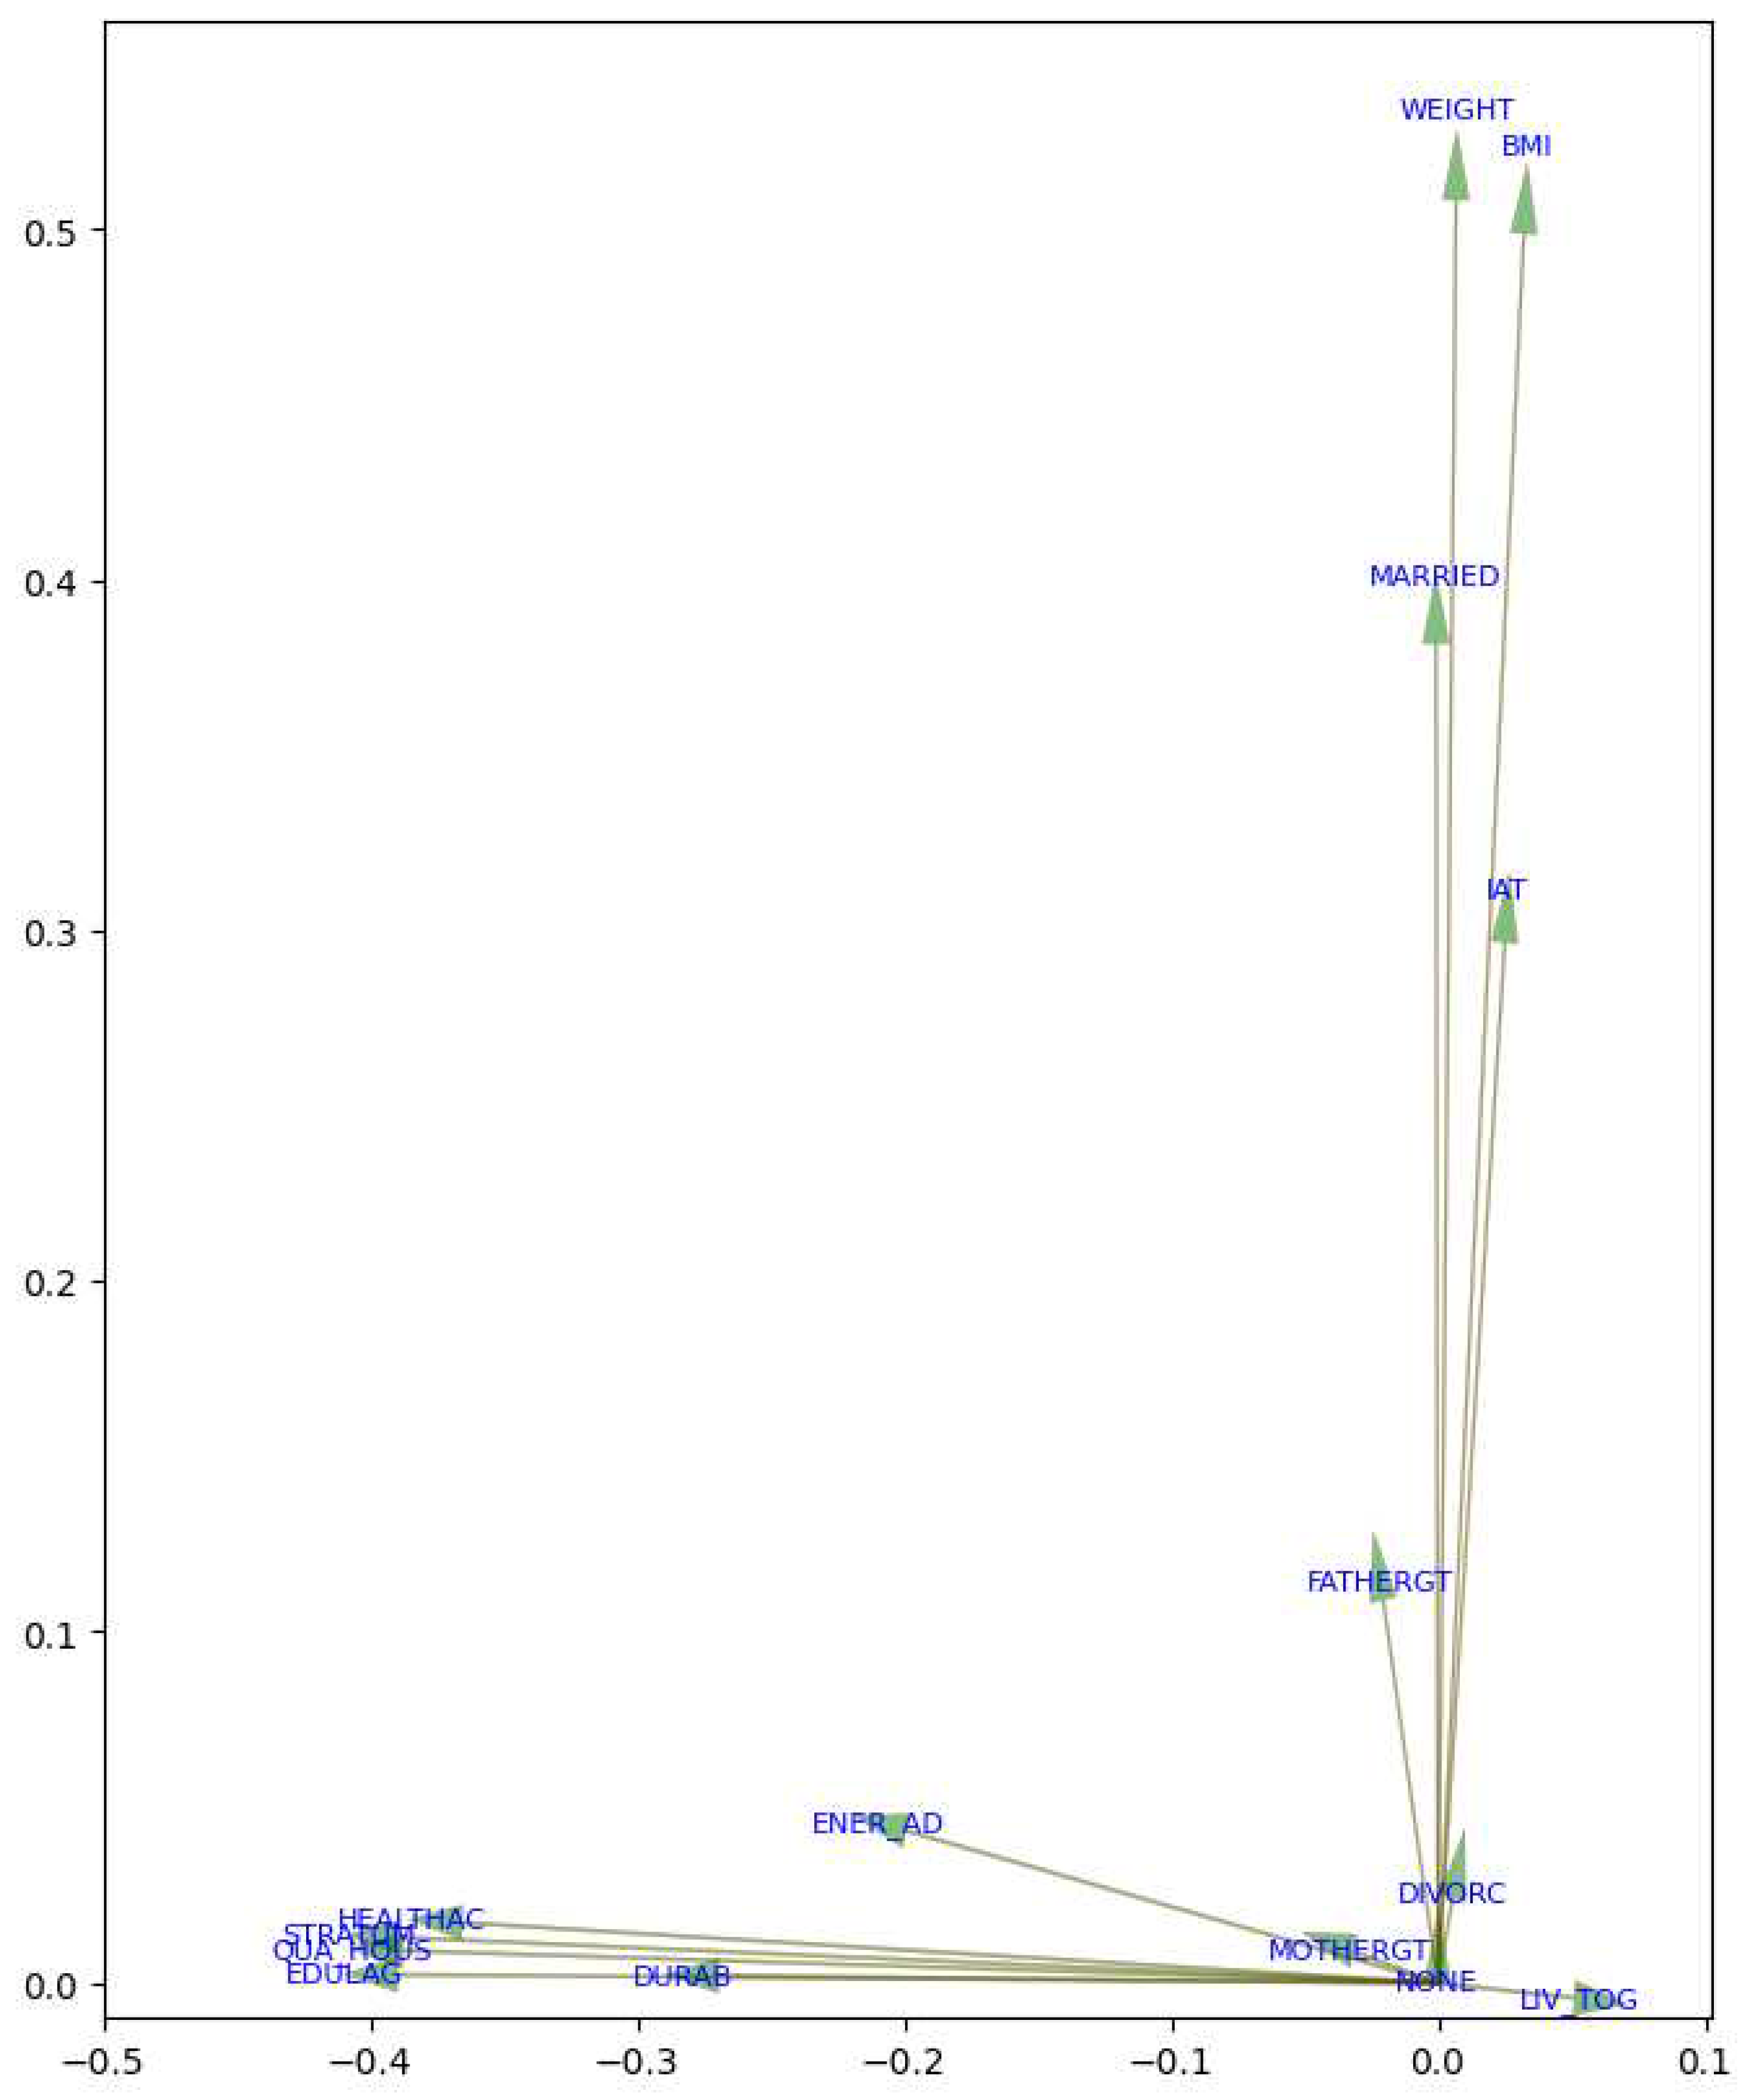

Table 1.
Dataset variables.
| Name variable | Description | Type |
|---|---|---|
| AGE | age | Continuous |
| WEIGHT | weight | Continuous |
| HEIGHT | height | Continuous |
| BMI | body mass index | Continuous |
| WC | waist | Continuous |
| SBP | systolic blood pressure | Continuous |
| DBP | diastolic blood pressure | Continuous |
| LIV_TOG | common-law marriage | Dichotomous |
| MARRIED | married | Dichotomous |
| SINGLE | single | Dichotomous |
| DIVORC | divorced | Dichotomous |
| VALUE | social development index by value | Continuous |
| STRATUM | socioeconomic stratum | Continuous |
| QUA_HOUS | quality and living space | Continuous |
| HEALTHAC | access to healthcare and social security | Continuous |
| EDULAG | educational lag | Continuous |
| DURAB | durable goods | Continuous |
| SANITRY | sanitary adequacy | Continuous |
| ENER_AD | energy efficiency | Continuous |
| ED_LEVEL | educational level in the neighborhood | Continuous |
| SEC_SCHOOL | secondary school | Dichotomous |
| DOCTORATE | doctorate | Dichotomous |
| MASTER | master | Dichotomous |
| SCHOOL | school | Dichotomous |
| BACHELORS | bachelor’s degree | Dichotomous |
| HIGH_SCHOOL | high school | Dichotomous |
| TECH_SCHOOL | technical school | Dichotomous |
| NONE | no degree | Dichotomous |
| TOTMET | metabolic Equivalent of Task | Continuous |
| STAT_ANX | state anxiety | Dichotomous |
| TRAIT_ANX | trait anxiety | Dichotomous |
| SLPNOTQ | sleep was not quiet | Continuous |
| BREATH | waking up with shortness of breath | Continuous |
| DROWSY | feel drowsy or sleepy | Continuous |
| TROBLS | trouble falling asleep | Continuous |
| AWAKEN | awaken during your sleep time | Continuous |
| STYAWKE | trouble staying awake | Continuous |
| TAKENAP | take naps of 5 minutes or longer | Continuous |
| SLPD4 | sleep disturbance | Continuous |
| SLPSNR1 | Snores during sleep | Continuous |
| SLPSOB1 | sleep short (headache) | Continuous |
| SLPA2 | sleep Adequacy | Continuous |
| SLPS3 | somnolence | Continuous |
| SLPQRAW | sleep quantity | Continuous |
| SLPOP1 | sleep quality | Dichotomous |
| SMOKING | smoking practice | Dichotomous |
| CURRENT | current smoker | Dichotomous |
| EXSMOKER | ex-smoker | Dichotomous |
| SMO_PASS | smoker passive | Dichotomous |
| ALCOHOL | alcohol consumption | Dichotomous |
| ENERGYDRK | energy drinks | Dichotomous |
| MOTHEROB | obesity mother | Dichotomous |
| FATHEROB | obesity father | Dichotomous |
| MOTHERDB | diabetic mother | Dichotomous |
| FATHERDB | diabetic father | Dichotomous |
| MOTHERHT | hypertension mother | Dichotomous |
| MOTHERHT | hypertension father | Dichotomous |
| MOTHERDL | dyslipidemia mother | Dichotomous |
| FATHERDL | dyslipidemia father | Dichotomous |
| MOTHERGT | gout mother | Dichotomous |
| FATHERGT | gout father | Dichotomous |
| URIC | uric acid | Continuous |
| CREA | creatinine | Continuous |
| HDLCO | high-density lipoprotein | Continuous |
| LDLCO | low-density lipoprotein | Continuous |
| GLU | blood glucose | Continuous |
| IAT | atherogenic index | Continuous |
| CHOL_ANT | cholesterol | Continuous |
| TRIG | triglycerides | Continuous |
| NA | sodium | Continuous |
| CALOR | energy | Continuous |
| PROTEI | total proteins | Continuous |
| APROT | proteins of animal origin | Continuous |
| CARBO | carbohydrates | Continuous |
| SUCR | sucrose | Continuous |
| FRUCT | fructose | Continuous |
| LACT | lactose | Continuous |
| ST | starch | Continuous |
| MALT | maltose | Continuous |
| GLU_1 | glucose levels based on the dietary survey | Continuous |
| CRUDE | crude fiber | Continuous |
| SOLFB | soluble dietary fiber | Continuous |
| INSFB | insoluble dietary fiber | Continuous |
| HEMCL | hemicellulose | Continuous |
| CALC | calcium | Continuous |
| IRON | total iron | Continuous |
| MAGN | magnesium | Continuous |
| PH | phosphorus | Continuous |
| K | potassium | Continuous |
| SODIUM | sodium levels based on the dietary survey | Continuous |
| ZN | zinc | Continuous |
| CU | copper | Continuous |
| MN | manganese | Continuous |
| SE | iodine | Continuous |
| VITC | vitamin C | Continuous |
| B1 | thiamine | Continuous |
| B2 | riboflavin | Continuous |
| B6 | vitamin B6 | Continuous |
| B12 | vitamin B12 | Continuous |
| VITK | vitamin K | Continuous |
| RETINOL | retinol | Continuous |
| VITD | vitamin D | Continuous |
| VITE | vitamin E | Continuous |
| CHOL_SN | cholesterol levels based on the dietary survey | Continuous |
| ALCO | alcohol levels based on the dietary survey | Continuous |
| CAFF | caffeine | Continuous |
| AFAT | animal fat | Continuous |
| VFAT | vegetable fat | Continuous |
| TFATAV | total fat: animal + vegetable | Continuous |
| SATFAT | saturated fat | Continuous |
| MONFAT | monounsaturated fat | Continuous |
| POLY | polyunsaturated fat | Continuous |
| MS | MetS | Dichotomous |
Table 2.
Features and values obtained through logistic regression for men and women.
| Women | Men | |||||
|---|---|---|---|---|---|---|
| Variable | Coeficient | P_value | Variable | Coeficient | P_value | |
| GLU | 4.61438598 | 6.24E-59 | GLU | 3.94711748 | 2.45E-39 | |
| TRIG | 3.63418178 | 1.18E-37 | TRIG | 2.98165065 | 3.25E-24 | |
| WC | 1.75532078 | 2.86E-09 | WC | 2.53131848 | 1.02E-09 | |
| BMI | 1.60919304 | 1.05E-06 | IAT | 2.06238741 | 5.13E-11 | |
| SBP | 1.40299133 | 1.15E-12 | SBP | 1.53063308 | 1.31E-11 | |
| PROTEI | 0.90748897 | 0.08529715 | B12 | 1.41903991 | 0.00880359 | |
| FRUCT | 0.73077934 | 0.23874313 | BMI | 1.40229014 | 0.00087404 | |
| CHOL_SN | 0.72037259 | 0.06868106 | LACT | 1.29691863 | 0.00581383 | |
| URIC | 0.65547784 | 0.01333401 | CARBO | 1.18935354 | 0.0886463 | |
| CU | 0.64813271 | 0.17111299 | GLU_1 | 1.1674073 | 0.10024746 | |
Table 3.
Features of men obtained using RF with SMOTE and ADASYN applied.
| ADASYN - B = 1 | ADASYN - B = 5 | SMOTE - K = 1 | SMOTE - K = 5 | |||||||
|---|---|---|---|---|---|---|---|---|---|---|
| Features | Value | Features | Value | Features | Value | Features | Value | |||
| BMI | 92.9499 | ENER_AD | 130.906694 | MOTHERDL | 204.657628 | BMI | 289.868211 | |||
| WEIGHT | 49.4782 | BMI | 104.213511 | ALCOHOL | 199.602686 | MOTHERDL | 172.071267 | |||
| ENER_AD | 48.8887 | WEIGHT | 81.5087781 | BMI | 198.579371 | WEIGHT | 169.929592 | |||
| EDULAG | 45.2797 | EDULAG | 67.7406035 | SLPSOB1 | 111.323472 | ALCOHOL | 131.283664 | |||
| LIV_TOG | 33.3601 | ALCOHOL | 62.4379604 | CURRENT | 95.3509822 | IAT | 93.2909179 | |||
| DURAB | 31.5583 | STRATUM | 57.134903 | BREATH | 80.8262246 | CHOL_ANT | 63.4703128 | |||
| MOTHERGT | 27.5583 | ED_LEVEL | 55.578244 | SLPD4 | 70.1756789 | NA | 49.2933568 | |||
| IAT | 25.7470 | NONE | 38.1101529 | CAFF | 68.9892898 | CREA | 45.8846962 | |||
| HEALTHAC | 23.4522 | DURAB | 36.4129389 | SLP6 | 60.2949079 | SINGLE | 44.6897663 | |||
| DIVORC | 20.1163 | VALUE | 36.0130176 | WEIGHT | 56.9297661 | SLPSNR1 | 35.672622 | |||
| QUA_HOUS | 17.4925 | DIVORC | 35.8243538 | TOTMET | 52.4806201 | MOTHERDB | 35.21356 | |||
| STRATUM | 16.1269 | FATHERGT | 33.7033121 | ALCO | 45.7609412 | ENERGYDRK | 34.0359073 | |||
| FATHERGT | 14.5872 | MASTER | 29.8751736 | AWAKEN | 39.0795326 | URIC | 31.8268793 | |||
| NONE | 14.0213 | PRIMARIA | 28.3852397 | IAT | 38.042823 | AGE | 27.9839119 | |||
| MARRIED | 13.9584 | SLPSNR1 | 27.9671847 | TROBLS | 36.7528999 | MARRIED | 27.8864259 | |||
| VALUE | 13.8059 | AGE | 24.3706018 | STYAWKE | 36.2387269 | DOCTORATE | 24.4733499 | |||
| URIC | 13.7930 | IAT | 22.0506592 | MALT | 34.3472852 | DIVORC | 24.142464 | |||
| SANITRY | 13.5609 | SANITRY | 21.924077 | BACHELORS | 33.7934562 | SLPOP1 | 23.8868609 | |||
| SINGLE | 13.4148 | SINGLE | 21.7818986 | MARRIED | 32.6228111 | SEC_SCHOOL | 22.755325 | |||
| ALCOHOL | 12.9798 | DOCTORATE | 19.8069099 | SLP9 | 31.0845509 | SLPQRAW | 20.666244 | |||
Table 4.
Features of men obtained using RPART with SMOTE and ADASYN applied.
| ADASYN - B = 1 | ADASYN - B = 5 | SMOTE - K = 1 | SMOTE - K = 5 | |||||||
|---|---|---|---|---|---|---|---|---|---|---|
| Features | Value | Features | Value | Features | Value | Features | Value | |||
| LIV_TOG | 447.069761 | BMI | 683.735277 | BMI | 185.940586 | BMI | 164.086828 | |||
| BMI | 402.975487 | ENER_AD | 619.998675 | WEIGHT | 131.361866 | WEIGHT | 132.276557 | |||
| ENER_AD | 338.664389 | EDULAG | 565.325738 | FATHERGT | 115.496204 | IAT | 131.937059 | |||
| EDULAG | 325.498647 | ALCOHOL | 355.970533 | MOTHERDL | 96.1708037 | SINGLE | 83.6531675 | |||
| DURAB | 285.861702 | WEIGHT | 295.254303 | IAT | 67.2839991 | MOTHERDL | 71.6947353 | |||
| SLP6 | 64.2112969 | DIVORC | 214.489844 | AGE | 40.9532174 | APROT | 47.2274885 | |||
| WEIGHT | 33.1175418 | NONE | 200.599299 | LACT | 28.7681412 | TFATAV | 22.4867652 | |||
| IAT | 27.5407406 | MOTHERGT | 178.450647 | MOTHERHT | 25.3414479 | ST | 20.7519258 | |||
| FATHEROB | 14.5734264 | PROTEI | 14.5865884 | HEALTHAC | 19.7752349 | |||||
| SLPSNR1 | 13.7361635 | CAFF | 14.1658755 | SATFAT | 17.5962564 | |||||
| ZN | 12.4515539 | HEIGHT | 16.3718359 | |||||||
| MN | 12.20696 | CHOL_ANT | 15.4222905 | |||||||
| IRON | 10.5317678 | MONFAT | 13.9908309 | |||||||
| VALUE | 10.2017285 | CREA | 13.6358167 | |||||||
| STYAWKE | 10.1887194 | URIC | 11.0085972 | |||||||
| MONFAT | 10.0410598 | AGE | 10.5421496 | |||||||
| CHOL_ANT | 9.78675973 | CALC | 10.0034374 | |||||||
| ST | 9.41791645 | SMOKING | 9.53883547 | |||||||
| SINGLE | 9.40405705 | LACT | 9.34161011 | |||||||
| SOLFB | 7.74765092 | TOTMET | 9.09355989 | |||||||
Table 5.
Features of women obtained using RF with SMOTE and ADASYN applied.
| ADASYN - B = 1 | ADASYN - B = 5 | SMOTE - K = 1 | SMOTE - K = 5 | |||||||
|---|---|---|---|---|---|---|---|---|---|---|
| Features | Value | Features | Value | Features | Value | Features | Value | |||
| BMI | 208.269603 | ENER_AD | 344.249674 | WEIGHT | 321.316267 | BMI | 484.307061 | |||
| IAT | 151.849516 | BMI | 210.90055 | IAT | 294.958989 | IAT | 481.475021 | |||
| WEIGHT | 98.3094923 | IAT | 173.895403 | BMI | 253.281611 | WEIGHT | 339.174822 | |||
| EDULAG | 98.0933243 | ALCOHOL | 146.230976 | EXSMOKER | 246.78181 | URIC | 142.754087 | |||
| LIV_TOG | 82.4204188 | DURAB | 142.91494 | MASTER | 241.332636 | SLPSNR1 | 92.0496746 | |||
| ENER_AD | 80.7154997 | EDULAG | 142.817907 | FATHERDL | 211.443455 | CHOL_ANT | 74.3706077 | |||
| URIC | 60.4722703 | WEIGHT | 128.038926 | CREA | 170.195583 | AGE | 72.769531 | |||
| VALUE | 53.5122927 | VALUE | 80.989846 | MOTHERHT | 125.867318 | SLPSOB1 | 70.1959444 | |||
| DURAB | 48.2486067 | NONE | 76.4699068 | SLPSOB1 | 125.384246 | BREATH | 60.3028803 | |||
| QUA_HOUS | 37.8080123 | QUA_HOUS | 62.8303545 | SMO_PASS | 86.2763209 | TRAIT_ANX | 56.4099594 | |||
| SLPSNR1 | 31.399627 | BACHELORS | 56.0706757 | BREATH | 83.1176663 | SMO_PASS | 50.8288614 | |||
| HEALTHAC | 30.6724986 | SANITRY | 52.5802813 | CHOL_ANT | 78.8668934 | SANITRY | 50.3648334 | |||
| SANITRY | 24.2597947 | HEALTHAC | 45.9188536 | SMOKING | 57.7946015 | MOTHERDL | 50.0567677 | |||
| ALCOHOL | 24.2064626 | URIC | 43.8531276 | TRAIT_ANX | 57.3909833 | DROWSY | 44.564559 | |||
| AGE | 21.594859 | SINGLE | 39.5694722 | SLPSNR1 | 51.1574483 | SMOKING | 44.5264858 | |||
| SINGLE | 18.0193809 | DIVORC | 37.3860944 | NA | 50.3156936 | SINGLE | 41.993735 | |||
| HIGH_SCHOOL | 17.1684616 | AGE | 33.8392029 | MARRIED | 48.4664641 | EXSMOKER | 38.9120379 | |||
| SLP6 | 16.0530682 | TECH_SCHOOL | 32.4092154 | SLPOP1 | 48.3006717 | SEC_SCHOOL | 38.4719692 | |||
| SOLFB | 14.4271683 | SCHOOL | 28.2955057 | SLPNOTQ | 35.6761924 | |||||
| FATHERGT | 13.8839264 | MARRIED | 27.6425229 |
Table 6.
Features of women obtained using RPART with SMOTE and ADASYN applied.
| ADASYN - B = 1 | ADASYN - B = 5 | SMOTE - K = 1 | SMOTE - K = 5 | |||||||
|---|---|---|---|---|---|---|---|---|---|---|
| Features | Value | Features | Value | Features | Value | Features | Value | |||
| BMI | 664.323812 | BMI | 1164.1686 | BMI | 427.45413 | IAT | 483.233069 | |||
| LIV_TOG | 535.392713 | DURAB | 1117.88127 | IAT | 363.893488 | BMI | 410.367827 | |||
| ENER_AD | 507.53479 | ENER_AD | 1090.27197 | SLPSNR1 | 259.475806 | WEIGHT | 409.777127 | |||
| EDULAG | 505.45874 | EDULAG | 772.049538 | SLPS3 | 259.475806 | URIC | 278.65513 | |||
| IAT | 468.310602 | ALCOHOL | 655.016952 | EXSMOKER | 217.54026 | SLPSNR1 | 86.0218576 | |||
| NONE | 533.217568 | SMOKING | 31.3976405 | |||||||
| IAT | 380.443927 | SLPS3 | 30.5201011 | |||||||
| WEIGHT | 366.577281 | SODIUM | 15.7251124 | |||||||
| VALUE | 104.231729 | ALCOHOL | 12.4735987 | |||||||
| TECH_SCHOOL | 92.1094015 | SATFAT | 12.1523683 | |||||||
| MONFAT | 12.1446951 | |||||||||
| NA | 11.2712045 | |||||||||
| VITE | 10.3455105 | |||||||||
| CHOL_ANT | 9.04441276 | |||||||||
| FATHERDB | 8.09870623 | |||||||||
| SUCR | 7.16739885 | |||||||||
| MARRIED | 6.39473684 | |||||||||
| FRUCT | 4.94398493 | |||||||||
| MALT | 4.8372105 |
Table 7.
Results of the random forest models applying SMOTE and ADASYN in men and women.
| Sex | Subset | Parameters | Balanced accuracy (%) | Sensitivity (%) | Specificity (%) |
|---|---|---|---|---|---|
| Men | ADASYN, B = 1 | Mtry = 9 | 86.22 | 90.93 | 81.50 |
| Ntree = 200 | ± 0.26 | ± 0.60 | ± 0.41 | ||
| Men | ADASYN, B = 5 | Mtry = 8 | 85.56 | 87.85 | 83.26 |
| Ntree = 200 | ± 0.34 | ± 0.49 | ± 0.55 | ||
| Men | SMOTE, K = 1 | Mtry = 10 | 82.86 | 91.51 | 74.21 |
| Ntree = 200 | ± 1.66 | ± 0.68 | ± 3.45 | ||
| Men | SMOTE, K = 5 | Mtry = 10 | 75.43 | 90.48 | 60.39 |
| Ntree = 100 | ± 1.29 | ± 0.95 | ± 2.50 | ||
| Women | ADASYN, B = 1 | Mtry = 10 | 87.12 | 91.10 | 83.15 |
| Ntree = 200 | ± 0.25 | ± 0.40 | ± 0.29 | ||
| Women | ADASYN, B = 5 | Mtry = 10 | 86.73 | 88.62 | 84.84 |
| Ntree = 300 | ± 0.20 | ± 0.24 | ± 0.36 | ||
| Women | SMOTE, K = 1 | Mtry = 10 | 82.55 | 90.48 | 74.62 |
| Ntree = 300 | ± 0.71 | ± 0.39 | ± 1.46 | ||
| Women | SMOTE, K = 5 | Mtry = 10 | 88.50 | 91.91 | 85.10 |
| Ntree = 300 | ± 0.40 | ± 0.42 | ± 0.75 |
Table 8.
Results of the RPART models applying SMOTE and ADASYN in men and women.
| Sex | Subset | Parameters | Balanced accuracy (%) | Sensitivity (%) | Specificity (%) |
|---|---|---|---|---|---|
| Men | ADASYN, B = 1 | cp = 0.05 | 82.14 | 81.57 | 82.71 |
| ± 1.75 | ± 3.38 | ± 2.07 | |||
| Men | ADASYN, B = 5 | cp = 0.05 | 82.32 | 82.87 | 81.77 |
| ± 0.99 | ± 4.67 | ± 5.02 | |||
| Men | SMOTE, K = 1 | cp = 0.001 | 75.41 | 73.09 | 77.73 |
| ± 2.78 | ± 4.07 | ± 5.36 | |||
| Men | SMOTE, K = 5 | cp = 0.002 | 74.67 | 71.96 | 77.38 |
| ± 2.78 | ± 4.07 | ± 5.36 | |||
| Women | ADASYN, B = 1 | cp = 0.05 | 78.90 | 69.96 | 87.84 |
| ± 0.31 | ± 0.00 | ± 0.62 | |||
| Women | ADASYN, B = 5 | cp = 0.05 | 78.90 | 69.96 | 87.84 |
| ± 0.31 | ± 0.00 | ± 0.62 | |||
| Women | SMOTE - K = 1 | cp = 0.001 | 80.86 | 79.85 | 81.87 |
| ± 1.91 | ± 3.79 | ± 3.57 | |||
| Women | SMOTE - K = 5 | cp = 0.005 | 84.49 | 84.20 | 84.79 |
| ± 1.43 | ± 3.01 | ± 2.51 |
Disclaimer/Publisher’s Note: The statements, opinions and data contained in all publications are solely those of the individual author(s) and contributor(s) and not of MDPI and/or the editor(s). MDPI and/or the editor(s) disclaim responsibility for any injury to people or property resulting from any ideas, methods, instructions or products referred to in the content. |
© 2024 by the authors. Licensee MDPI, Basel, Switzerland. This article is an open access article distributed under the terms and conditions of the Creative Commons Attribution (CC BY) license (http://creativecommons.org/licenses/by/4.0/).
Copyright: This open access article is published under a Creative Commons CC BY 4.0 license, which permit the free download, distribution, and reuse, provided that the author and preprint are cited in any reuse.


