Preprint
Article

Control Device for Dual Battery Block and Fuel Cell Hybrid Power System for Electric Vehicles

Altmetrics

Downloads

133

Views

47

Comments

0

This version is not peer-reviewed

Submitted:

03 January 2024

Posted:

09 January 2024

You are already at the latest version

Alerts
Abstract
This work aims to study and analyze a hybrid power system for electric vehicles consisting of a dual low and high-rate lithium battery block and a fuel cell. In this configuration, the high-rate lithium battery powers the electric vehicle in high power demand processes like acceleration mode or on an uphill road; the low-rate battery operates at a low output power range, servicing the auxiliary systems and low power loads and the fuel cell supplies energy at intermediate power demand conditions, normal driving mode, constant velocity, or flat and downhill terrain. The dual power system improves global efficiency since every power unit operates optimally depending on driving conditions. Power sharing optimizes the lithium battery performance and fuel cell capacity, minimizing the size and weight of each energy system and enlarging the driving range. A comparative study between different lithium battery configurations and fuel cell shows an efficiency improvement of 31.4% for the hybrid dual battery block and fuel cell operating in low, high, and intermediate output power ranges, respectively. The study bases on a simulation process recreating current driving conditions for electric cars in urban, peripheral, and intercity routes. An alternative solution consisting of a hybrid system, fuel cell and a high rate lithium battery produces a 29 % power gain.
Keywords: 
Subject: Engineering  -   Automotive Engineering

INTRODUCTION

Today, the lithium batteries are the current power sources for electric vehicles because of their high specific energy and power density, which make them especially suitable for driving conditions [1,2,3,4,5,6,7,8,9,10]. They offer high lifespan, low maintenance, and reasonable high autonomy, meaning good driving range [11,12]. Lithium batteries are less sensitive than other type of batteries to changes in discharge conditions, with low influence of discharge rate on its capacity; nevertheless, sudden changes in power demand provokes a capacity variation, thus of driving range [13,14]. An additional effect due to continuous variation of the discharge rate generates aging effects, which reduce battery lifespan [15,16,17,18,19,20]. This situation is unavoidable since driving includes acceleration and deceleration processes, changes in vehicle velocity, and power demand variation at uphill road segments.
Many studies focus the performance characterization of lithium batteries under variable driving conditions, which include dynamic conditions [21,22,23,24,25,26] and thermal effects [27,28,29,30,31]. Indeed, changes in temperature generate either a reduction or increase of battery capacity and driving range as well as lifetime lowering [32,33,34,35]. Among the many parameters that influence the lithium battery performance, sudden changes in draining current is perhaps the most important [36,37].
Driving protocols devoted to analyze the response of lithium batteries to operational driving conditions, like NEDC [38,39,40], WLTP [41,42,43], FTP-75 [44,45,46] or JC08 [47,48,49], show how the battery reacts to sudden changes in vehicle speed, thus in discharge rate, to estimate the driving range for electric vehicles. These protocols evidence a reduction in driving range if dynamic conditions include higher and longer acceleration, as in the case of NEDC and WLTP [50,51,52,53,54]. This latter protocol replaces the former one because it represents a more realistic layout of current driving mode in our society, where acceleration occurs more often and lasts longer [55,56].
The implementation of electric vehicles equipped with lithium batteries is a political decision to reduce GHG emissions, especially in urban zones where pollution is critical [57,58,59,60,61,62,63,64]; however, the limited autonomy compared to internal combustion engine (ICE) cars represents a barrier for future customers [65,66,67,68,69,70,71]. The increasing battery autonomy and EV driving range is one of the main subjects of present research in the lithium batteries field and electric vehicle applications.
Another problem derived from using electric vehicles is the frequent battery recharge, which means to get access to a recharge point connected to grid. In urban areas a private or public charging station is the solution, but the density of this type of installations is still scarce in many cities [72,73,74,75,76,77,78]. This situation represents a significant drawback in the implementation of EVs because the fear of a sudden vehicle stop due to total discharge of the battery is an impediment on the acquisition of electric vehicles by future customers.
A compromise solution between environmental protection and easy access to quick energy release from fossil fuels is the hybrid (HEV) or plug-in hybrid electric vehicle (PHEV), where a combination of ICE car and EV occurs. The hybridization between internal combustion engine and electric motor provides long driving range and lower carbon emissions than conventional cars only powered by ICE, but continues having pollutant effects and still requires charging the battery, either from the grid like in plug-in hybrid electric vehicles or from the combustion engine as in HEV [79,80,81,82,83,84,85,86,87,88,89,90,91,92,93].
Alternative powering system is the fuel cell electric vehicle (FCEV), which depends on hydrogen supply for operating. FCEV also works on electricity generated at the fuel cell; therefore, its autonomy depends on the hydrogen stored in the fuel tank. Driving range for FCEV currently exceeds the EV autonomy [94,95,96,97,98] but still requires a hydrogen recharging process; the great advantage is the quickness of the process, faster than recharging an electric battery.
Fuel cell cars have significant advantages regarding electric vehicles, like quicker fuel recharge, longer driving range, and less weight [99,100,101,102,103,104,105,106]; however, fuel cell suffers from lower performance when releasing energy at high rates, which makes them unsuitable for sudden quick discharges [107,108,109,110,111]. Proton exchange fuel cells (PEM), which equip electric vehicles, traditionally show low specific power, forcing them to modify fuel cell structure to face high power demand rates, such as accelerations or uphill road segments [112,113,114,115]. Other types of fuel cells show higher performance to high discharge rates but suffer from slow energy release, which is incompatible with driving conditions [116,117,118].
Combining a high-rate lithium battery for heavy driving conditions, a low-rate battery for auxiliary services and small electric loads, and a fuel cell for medium power rates provides a very effective hybrid system to power electric vehicles in any condition. This configuration reduces the size and weight of the electric vehicle power source, enhances the performance, increases the energy efficiency, and enlarges the driving range.
On the other hand, a hybrid system like the one proposed in this paper is suitable to operate on single power source, battery or fuel cell or in combined mode with both power sources supplying energy simultaneously, if necessary. Additionally, this configuration is able to switch from one power source to another if the electric vehicle control system determines the driving conditions enhances the power system global efficiency with the switching.
A fuel cell and lithium battery hybrid system allows preserving energy for emergency situations, like the miscalculation of driving range resulting in unexpected sudden stop of the electric vehicle because of power exhaustion.

THEORETICAL FUNDATIONS

Proton Exchange Membrane Fuel Cell (PEMFC) output power operates in a high range, depending on the set configuration. PEMFC characterizes by a low voltage, typically 1.23 volts per cell in ideal conditions, and a limited delivering intensity depending on the cell size.
Since the voltage of a Fuel Cell depends on the activation, ohmic and concentration processes, we may establish
V F C = V r Δ V = V r Δ V a c t Δ V o h m Δ V c o n c
Vr is the reversible voltage of the fuel cell, and ΔV is the voltage drop [119] due to activation [120,121,122], ohmic [123], and concentration [124] processes.
The global current generated by a fuel cell depends on the hydrogen flow according to the following expression:
I F C = 3.2 x 10 19 ρ H 2 V ˙ H 2 M H 2
ρ, M, and V ˙ are the density, molecular weight, and hydrogen flow, respectively.
Combining equations 1 and 2 and considering that the reversible fuel cell voltage and the voltage drop, ΔV, are constant:
P F C = 3.2 x 10 19 ( V r Δ V ) m ˙ H 2 M H 2 = k H 2 m ˙ H 2
With:
k H 2 = 3.2 x 10 19 ( V r Δ V ) M H 2
MH2 is the hydrogen molecular weight.
Fuel cell delivers power within variable efficiency depending on the power rate, as shown in Figure 1 [125].
We observe in Figure 1 that fuel cell operates at optimum efficiency when delivering 25% of its maximum output power. Since in electric vehicles, the output power changes according to driving conditions, fuel cell cannot operate at maximum efficiency at all times; therefore, to optimize the operation of the hybrid power system, it is recommended to set up a high efficiency range in which the fuel cell should operate. To maximize the fuel cell efficiency during electric vehicle operation, we select a maximum efficiency variation of 10% from the peak value, from 0.54 to 0.60, according to data shown in Figure 1. This range corresponds to an output power factor from 0.10 to 0.48, which means the fuel cell should cover the electric vehicle power demand within 10% to 48% range.
If we apply fuel cell efficiency curve to driving conditions, it is necessary to obtain an algorithm that matches the efficiency evolution; since the curve is complex and does not respond to a low degree polynomial function, we divide the curve in section where different algorithms apply. According to this methodology, we ca express the fuel cell efficiency as:
η F C = | 9.342 F P 0 < F P < 0.038 18.823 F P 2 + 5.5899 F P + 0.1914 0.038 < F P < 0.172 0.603 0.0286 ( F P 0.172 ) 0.172 < F P < 0.275 0.6 0.213 ( F P 0.275 ) 0.275 < F P < 1.0
FP is the output power factor.
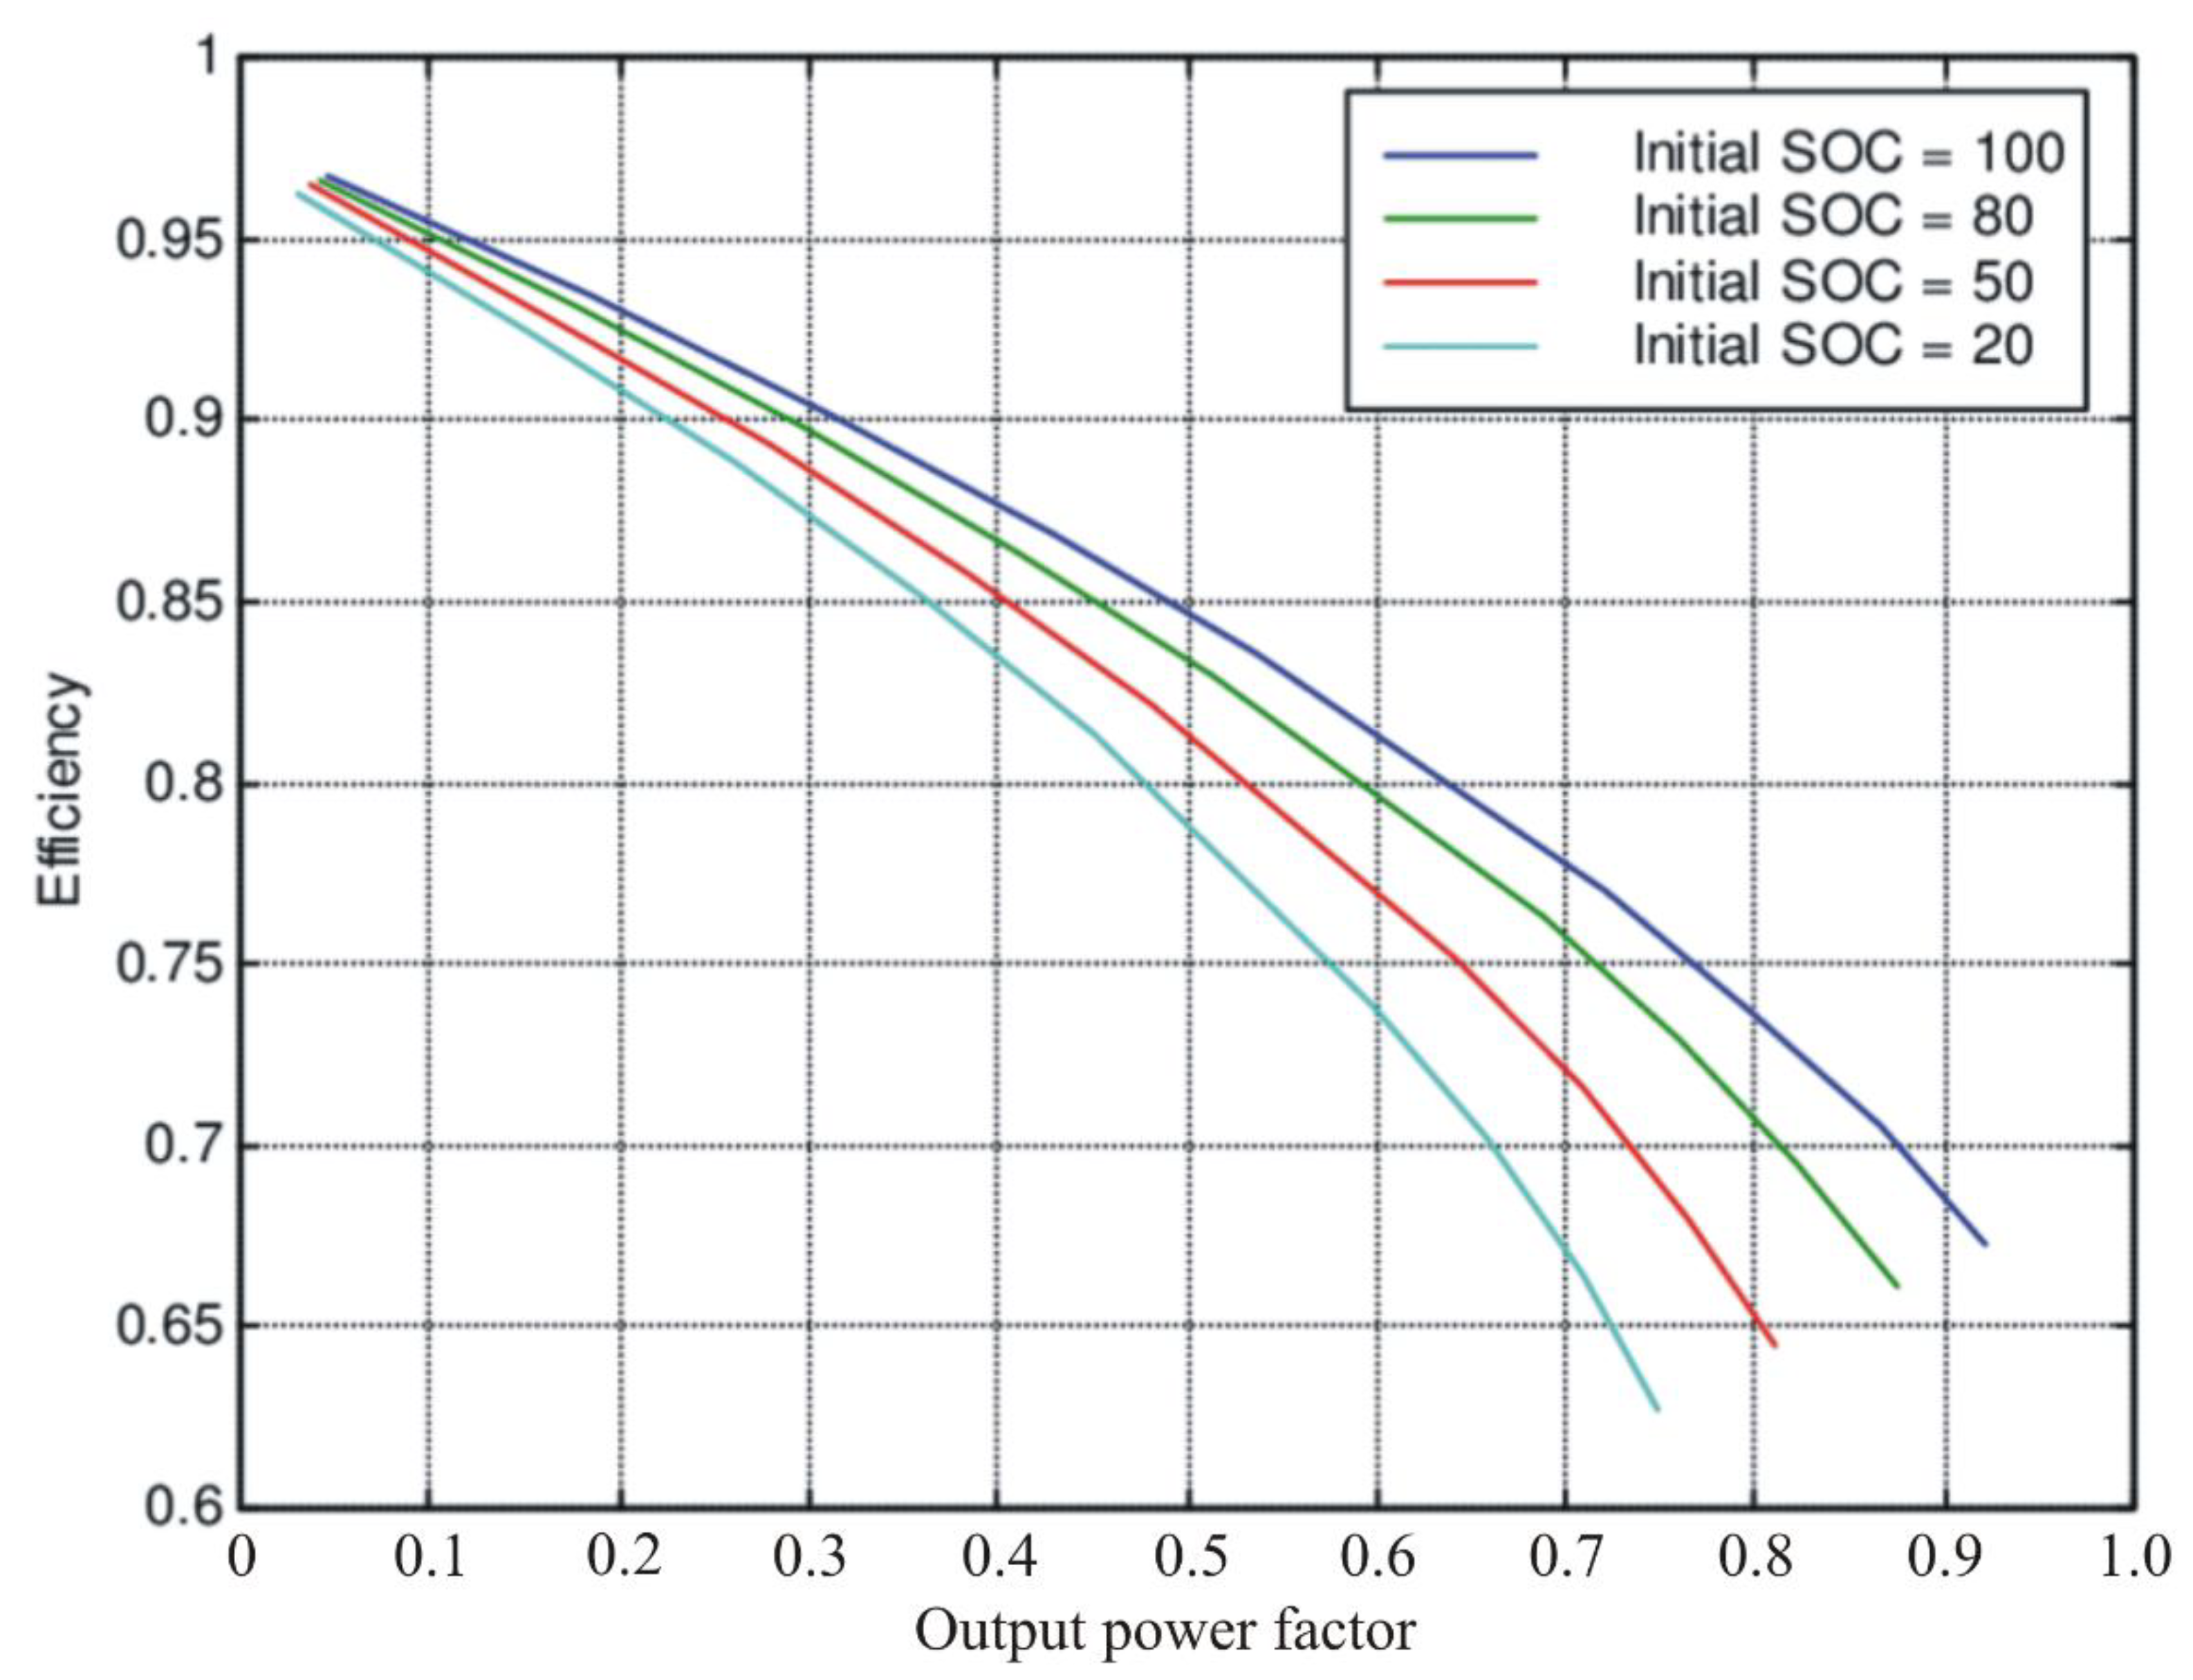
In the case of lithium batteries the efficiency curve dependence on output power factor shows a similar evolution than for fuel cells (Figure 2).
If we define the maximum electric vehicle power as P E V o , applying equation 3, we have:
m ˙ H 2 = F P P E V o k H 2 = P F C k H 2
Equation 6 provides the hydrogen mass flow required to generate the electric vehicle power demand within the optimum setup range for the fuel cell efficiency. FP moves in the range 0.1<FP<0.48.
Lithium battery discharge efficiency evolves with output power factor depending on the state of charge, as represented in Figure 2.
To facilitate the operation with the lithium battery efficiency shown in Figure 2, we correlated the efficiency curves to a third degree polynomial function, resulting the following correlation functions:
η = | 0.5205 F P 3 + 0.5771 F P 2 0.441 F P + 0.9997   ( R 2 = 0.9981 )   ( S O C = 100 ) 0.5170 F P 3 + 0.5530 F P 2 0.468 F P + 0.9950   ( R 2 = 0.9962 )   ( S O C = 80 ) 0.5770 F P 3 + 0.5290 F P 2 0.4855 F P + 0.994   ( R 2 = 0.9973 )   ( S O C = 50 ) 0.6325 F P 3 + 0.5050 F P 2 0.503 F P + 0.993   ( R 2 = 0.9955 )   ( S O C = 20 )
Since a battery during discharge changes the state of charge continuously, we correlated the coefficient of the algorithm representing the battery discharge efficiency, which results in the following expression:
η = a 1 F P 3 + a 2 F P 2 + a 3 F P + a 4
Where coefficients ai depend on the battery state of charge (SOC). On the other hand, coefficients also depend on the type of battery, low or high rate; therefore, we correlate coefficients for both types of battery obtaining:
a 1 = | 0.0018 ( S O C ) 0.6695   ( l o w r a t e ) 0.0002 ( S O C ) 0.5030   ( h i g h r a t e ) a 2 = | 0.0012 ( S O C ) + 0.4566   ( l o w r a t e ) 0.0008 ( S O C ) + 0.4890   ( h i g h r a t e ) a 3 = | 0.0006 ( S O C ) 0.5147   ( l o w r a t e ) 0.0013 ( S O C ) 0.5760   ( h i g h r a t e ) a 4 = | 3 x 10 5 ( S O C ) + 0.9923   ( l o w r a t e ) 0.0002 ( S O C ) + 0.9762   ( h i g h r a t e )
For electric vehicle power demand below the lower threshold of fuel cell output power, we should use the low-rate discharge lithium battery since the discharge rate for this power range is low; however, for power demand above the upper threshold of the fuel cell output power, the high rate discharge lithium battery should power the electric vehicle.
Power requirement in electric vehicles derived from the classic dynamic equation:
P E V = [ m a + κ v 2 + μ m g + m g sin α ] v
The term into brackets represents the global force on the electric vehicle, and <v> is the average velocity. Global force consists of four terms, inertial (ma), drag (κv2), rolling (μmg), and uphill or downhill (mgsinα) force, where m, a and v are the vehicle mass, acceleration and speed, κ and μ the drag and rolling coefficient, and α the road tilt.
The control system should detect the vehicle speed and acceleration to calculate power demand. Drag coefficient derives from the vehicle aerodynamic coefficient through the equation [126]:
κ = 1 2 ρ C x S
Where ρ is the air density, Cx is the aerodynamic coefficient, and S the vehicle front surface.
Since the aerodynamic coefficient and front surface are characteristic parameters for every vehicle, and the air density remains constant within the operating temperature range, we may consider the drag coefficient is constant.
Rolling coefficient depends on vehicle speed and tires pressure as in [127]:
μ = 0.005 + 1 p ( 0.01 + 9.5 x 10 7 v 2 )
Where p is the pressure of the vehicle tires in bars and the vehicle speed, v, is expressed in km/h.
In case we consider the influence of vehicle speed on the rolling coefficient, we should apply the following expression:
μ ( v ) = 0.01 ( 1 + 0.036 v )
If we consider ambient temperature and vehicle speed combined influence:
μ ( T a m b , v ) = 1.9 x 10 6 T a m b 2 2.1 x 10 4 T a m b + 0.013 + 5.4 x 10 5 v
We calculate the rolling coefficient measuring the ambient temperature and vehicle speed and applying equation 14.
Control system determines tilt road from an installed altimeter, from Google Maps or equivalent application [128].
Control system determines vehicle speed combining distance over time data and acceleration from the expression [129]:
a = ( v f 2 v i 2 ) / 2 d
Since in acceleration processes, the velocity changes, the control system uses short distance step in equation 15.

CONTROL SYSTEM

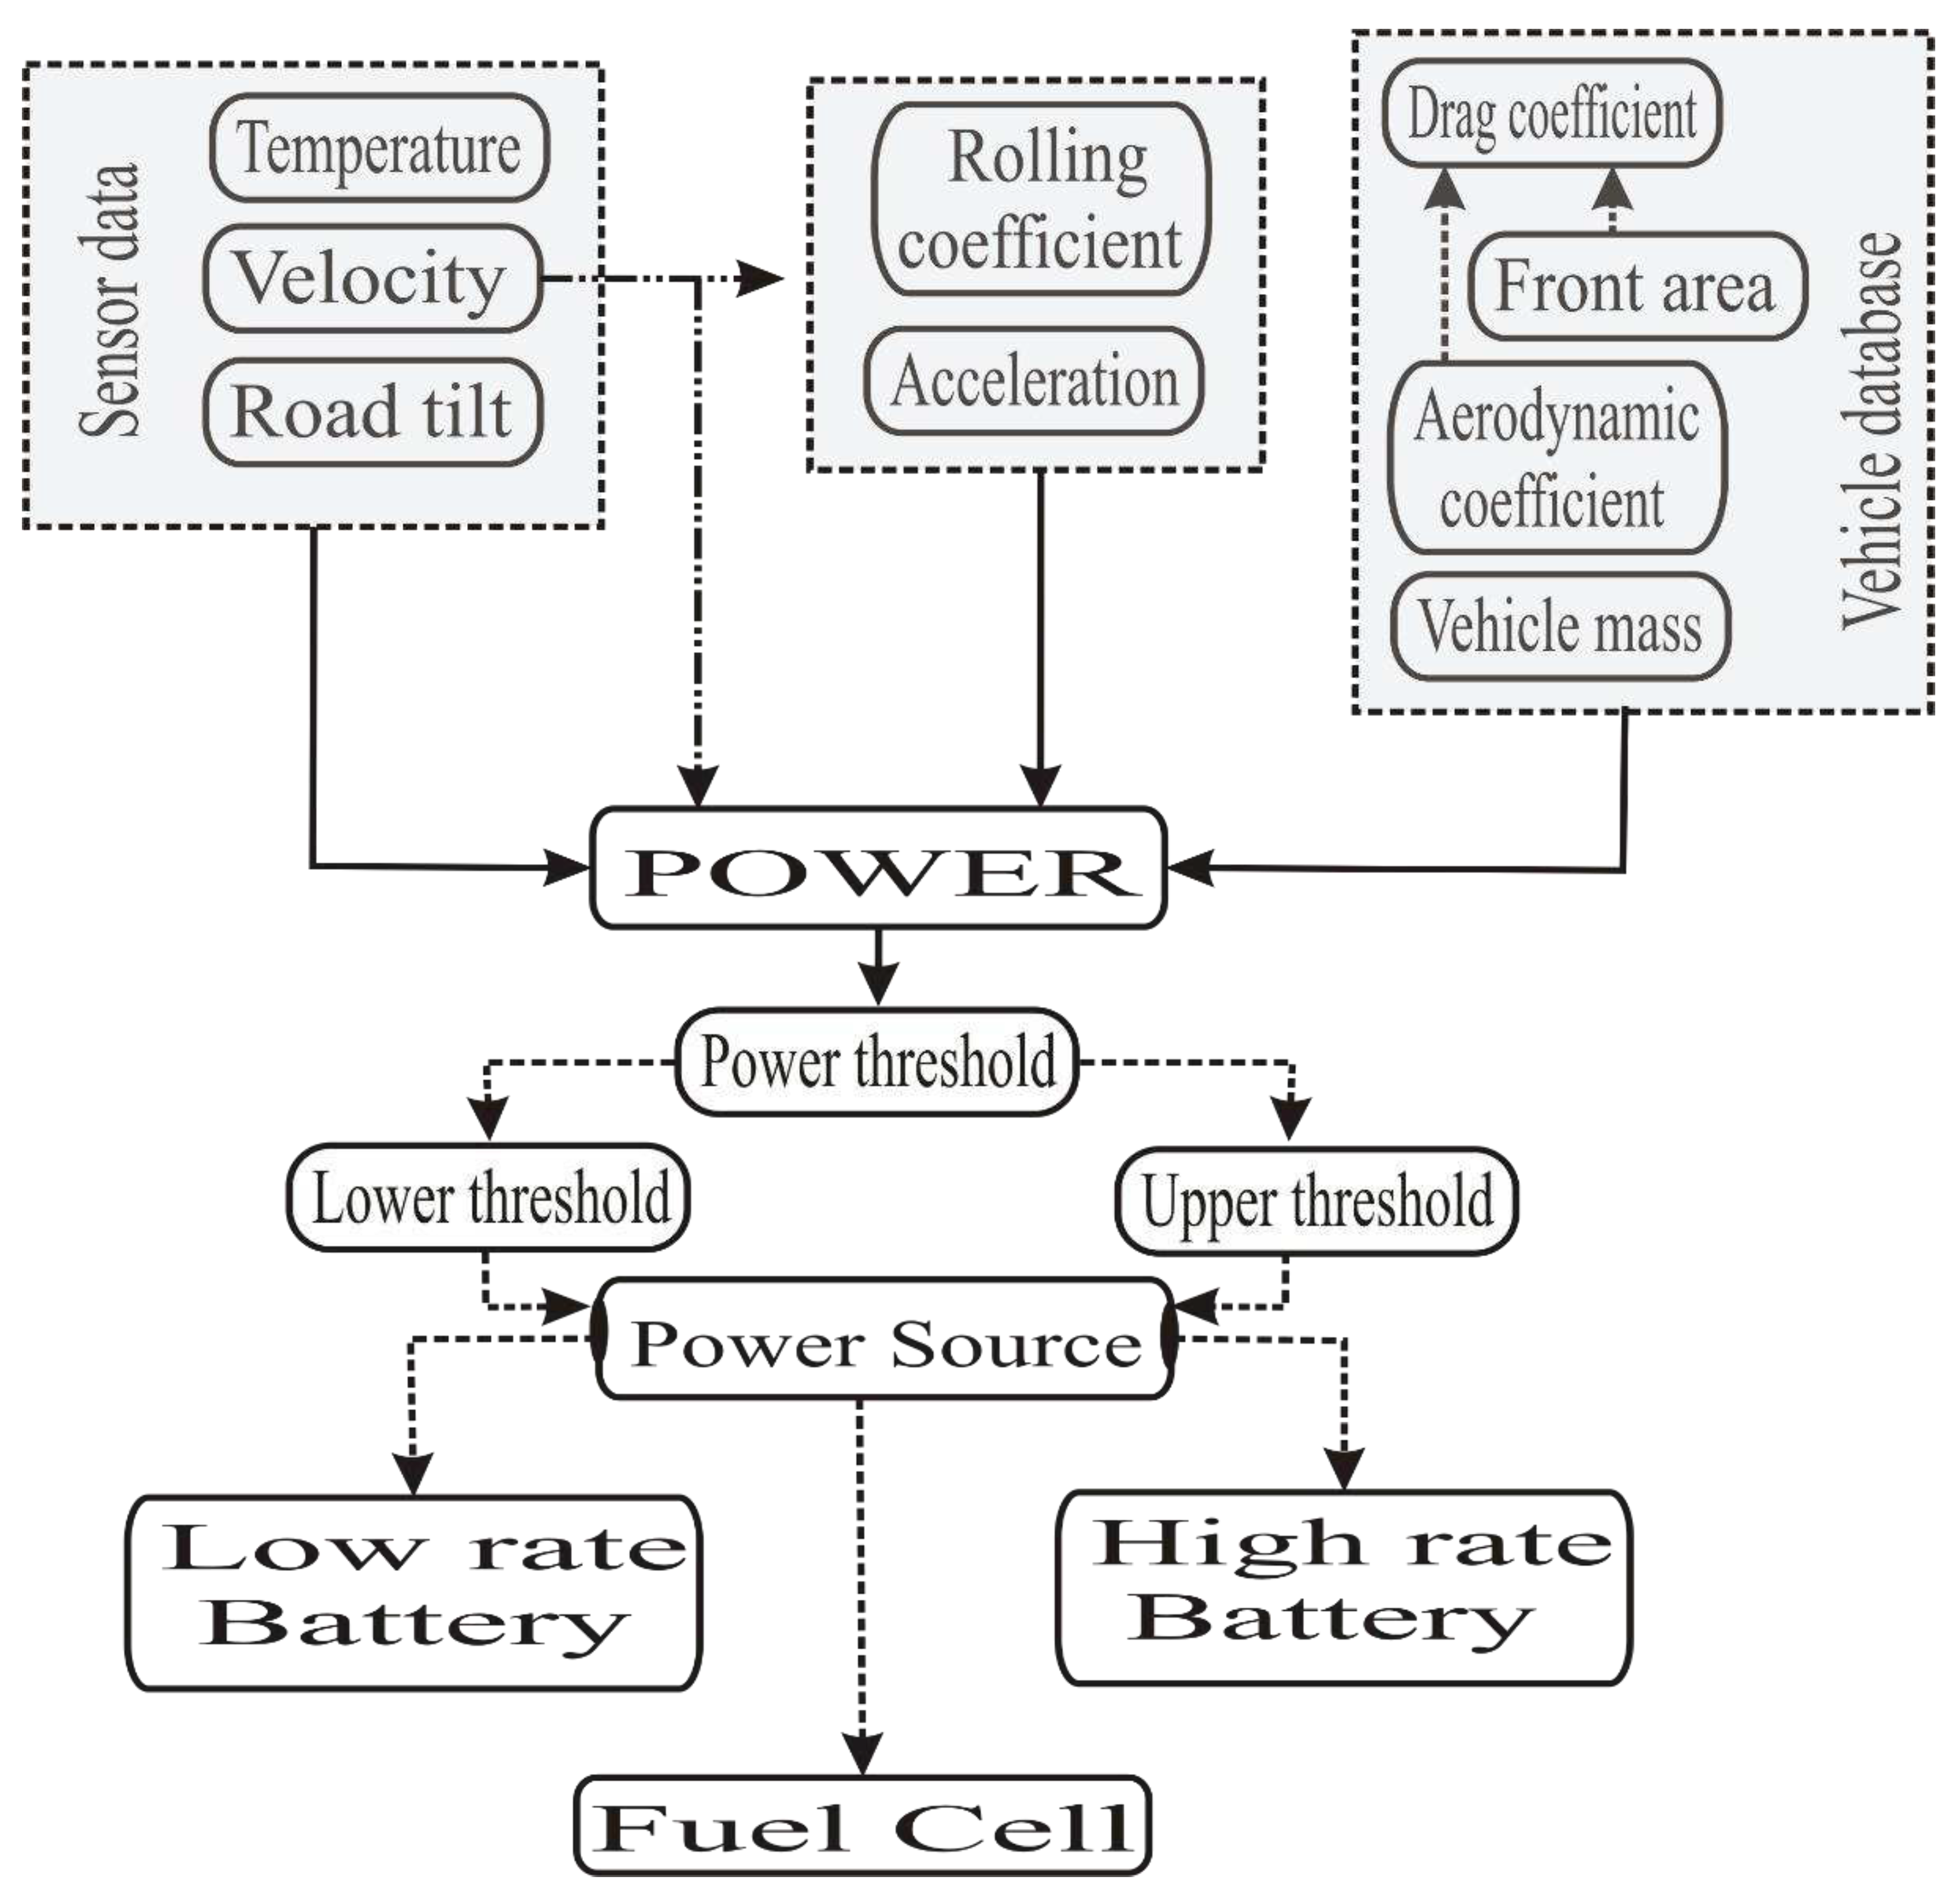
Once all parameters involved in the power demand algorithm are known, control system calculates the power demand, comparing the value to the setup threshold, switching from one power source to another, as shown in Figure 3.
The control system collects data from the vehicle database and sensors, determines the dynamic force parameters, and calculates the power demand; then, it compares the obtained value to the setup lower and higher threshold and engages the corresponding power source, low rate battery if the power demand is below lower threshold, high rate battery if above upper threshold, and fuel cell if power requirement is between thresholds.
The control system automatically commutes from one power source to another, with switching time less than 0.1 seconds, because of the built-in electronic control; therefore, the electric vehicle powertrain never runs out of energy.
The control system also evaluates the depth of discharge of the two batteries, applying the following algorithm:
D O D i = I D , i t i C r , i
Sub-index i denotes the route segment.
ID is the discharge current, t is the operation time, and Cr is the current battery capacity, which depends on the discharge rate as:
C r , i = C n ( I r e f I D , i ) 0.0148
Cn is the nominal battery capacity provided by the manufacturer, and Iref is the reference discharge current corresponding to the nominal capacity.
Combining equations 16 and 17:
D O D i = t i C n ( I D , i ) 1.0148 ( I r e f ) 0.0148
Applying Ohm’s law:
D O D i = t i C n ( P i ) 1.0148 ( I r e f ) 0.0148 ( V b a t ) 1.0148
Because nominal battery capacity, reference discharge time and battery voltage are set up, equation 19 converts into:
D O D i = K ( P i ) 1.0148 t i
Where:
K = 1 C n ( I r e f ) 0.0148 ( V b a t ) 1.0148
Since the control system calculates the power demand, Pi, and measures the operating time, ti, it determines the battery depth of discharge for every route segment.
The control system adds the calculated DOD values and compares the cumulated data with the limit DOD value for the battery; when reaching this value, the control system blocks access to this battery and connects to the other one, if available, or to the fuel cell is both batteries are exhausted.
The control system regulates the hydrogen flow to the fuel cell according to equation 5; provided we configure the fuel, the reversible cell voltage, and the voltage drop are known; therefore, the hydrogen mass flow only depends on the cell power consumption, PFC, which is determined using equation 6.

ENGINEERING DESIGN

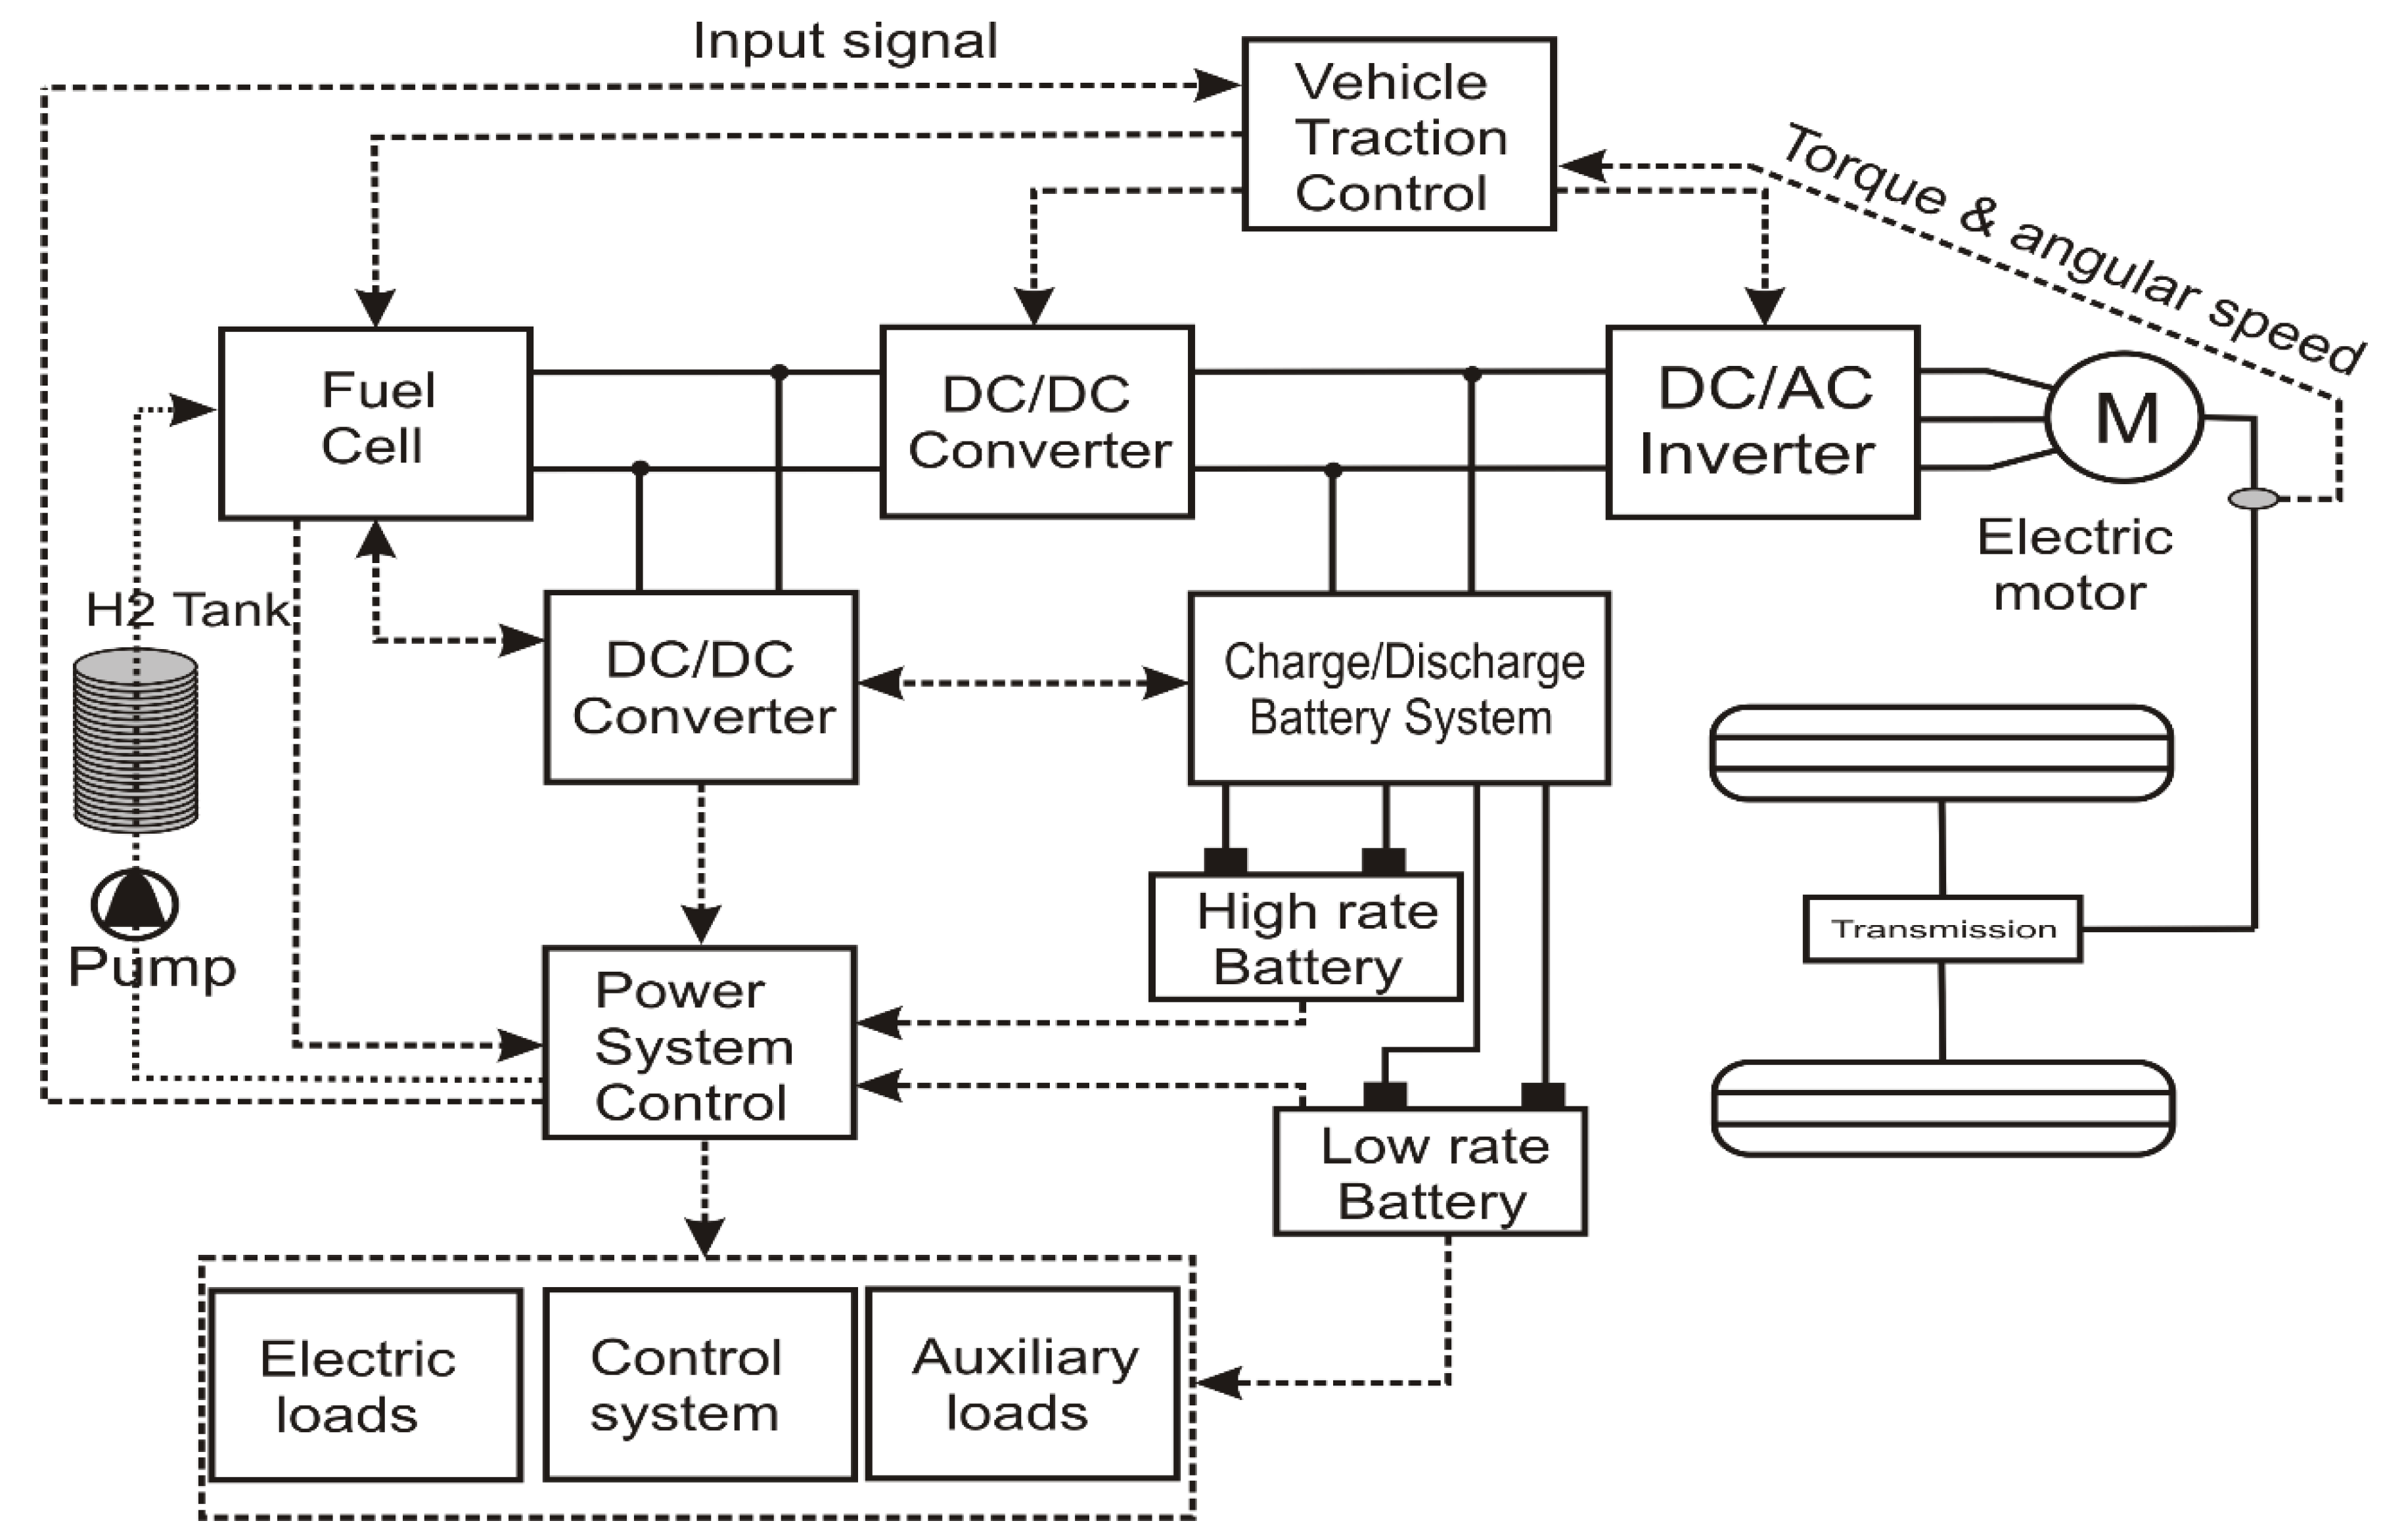
Hybrid fuel cells and lithium battery power systems for electric vehicles respond to a layout shown in Figure 4.
The basic structure of a fuel cell power system in an electric vehicle consists of a series and parallel fuel cell grouping to generate the required voltage and current to supply power to the electric motor. Figure 4 shows the schematic layout of the fuel cell power system for an electric vehicle.
Power system shown in Figure 4 operates under the control protocol set up by the implemented software, which includes the output power factor thresholds and the criteria corresponding to the specific power source configuration.
The power system control activates or deactivates every power source according to the power demand and the output power factor. The activation and deactivation occurs automatically, with no delay, thanks to the system electronic control, which ensures a continuous power supply to the electric vehicle at all times.
The power source supplies energy not only to run the vehicle but to serve the auxiliary elements, which means a negligible fraction of the global consumed energy, especially when compared to the required energy to power the vehicle.

SIMULATION

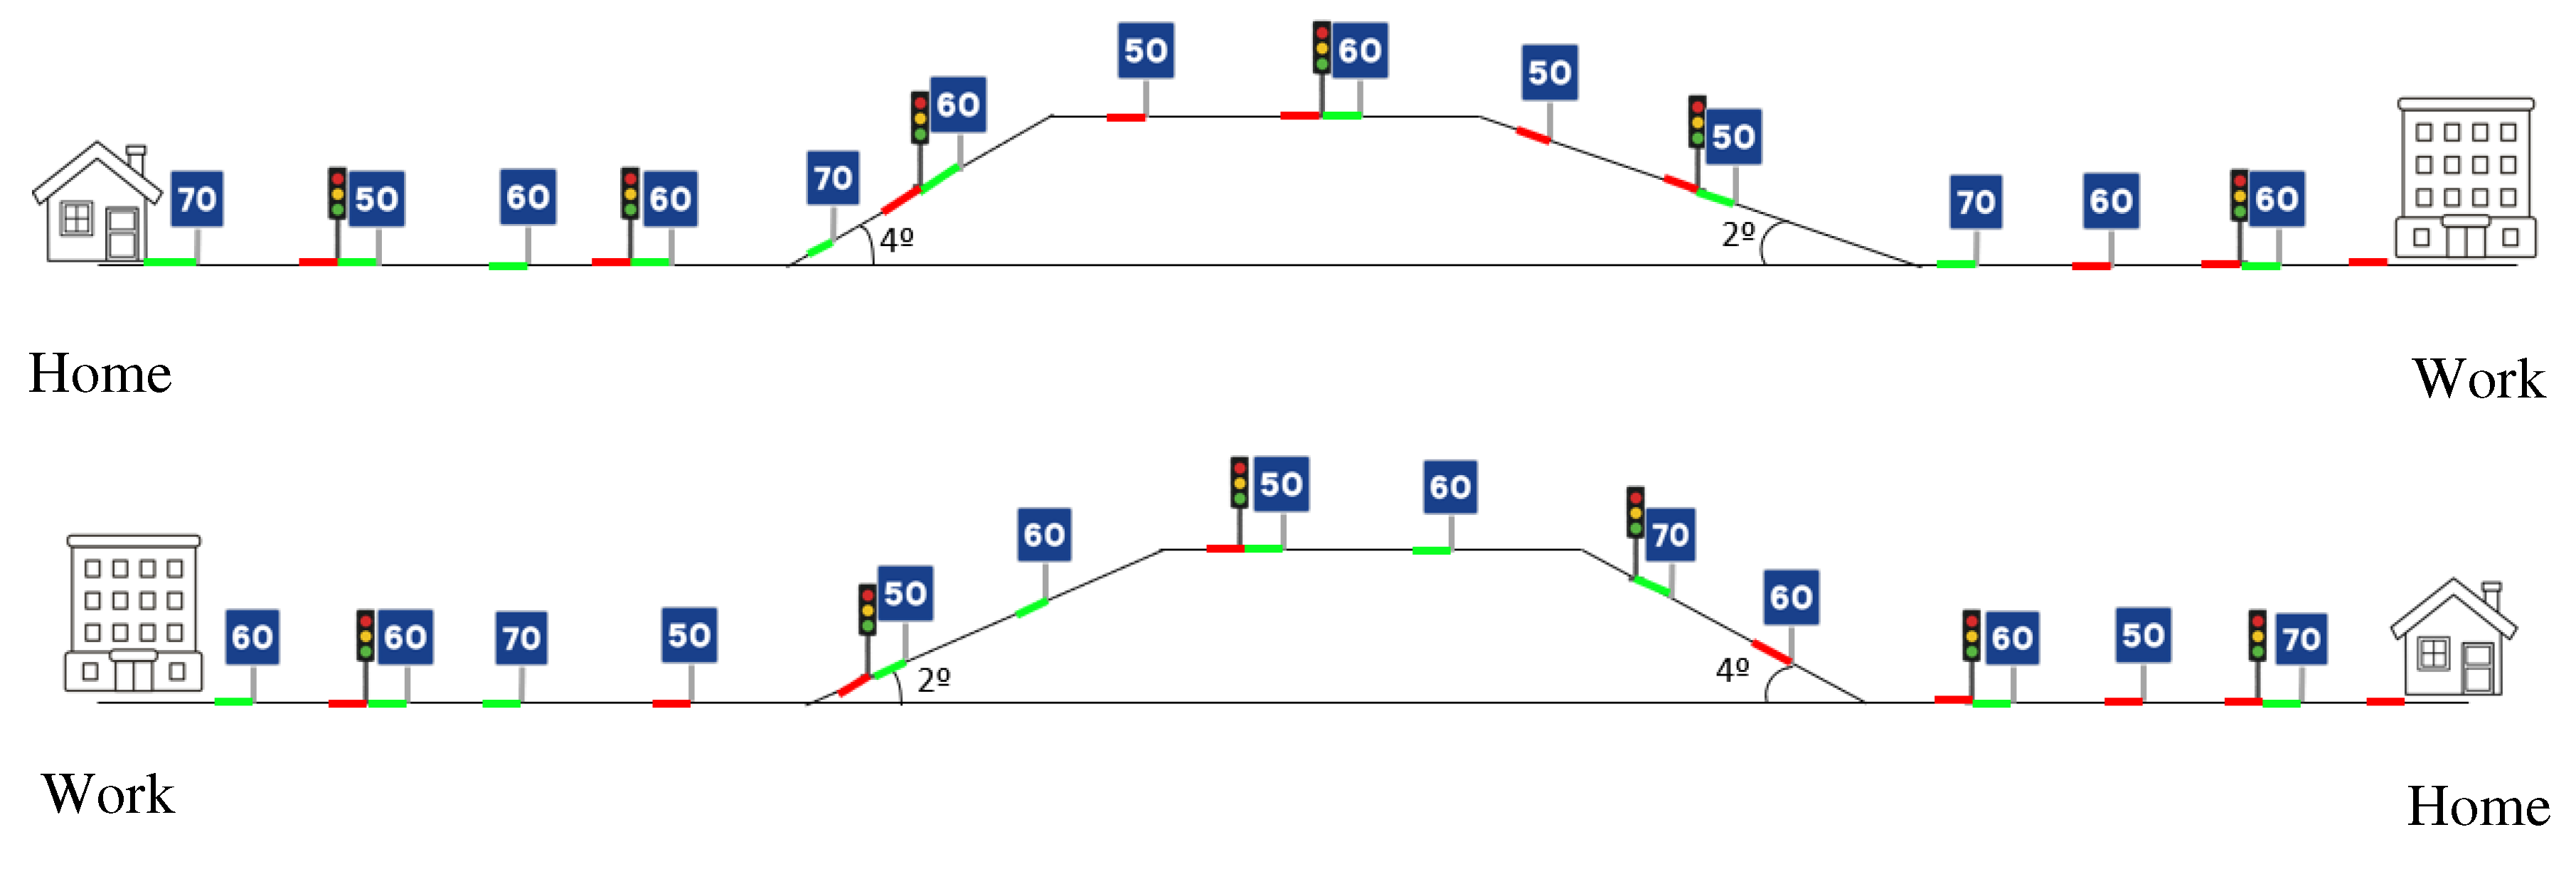
Hybrid system evaluation requires a simulation process that reflects the driving conditions, whichever they are. To facilitate the analysis of the hybrid system performance, we define a specific route which includes all road types and driving conditions, say horizontal, uphill and downhill road, acceleration, deceleration and constant driving. Combining all them, we obtain a route like the one shown in Figure 5 [130].
Green, red and gray segments in Figure 5 represent the acceleration, deceleration and constant velocity processes. We consider an urban standard round trip route for a total driving time of 20 minutes and a travelling distance of 20 km each way.
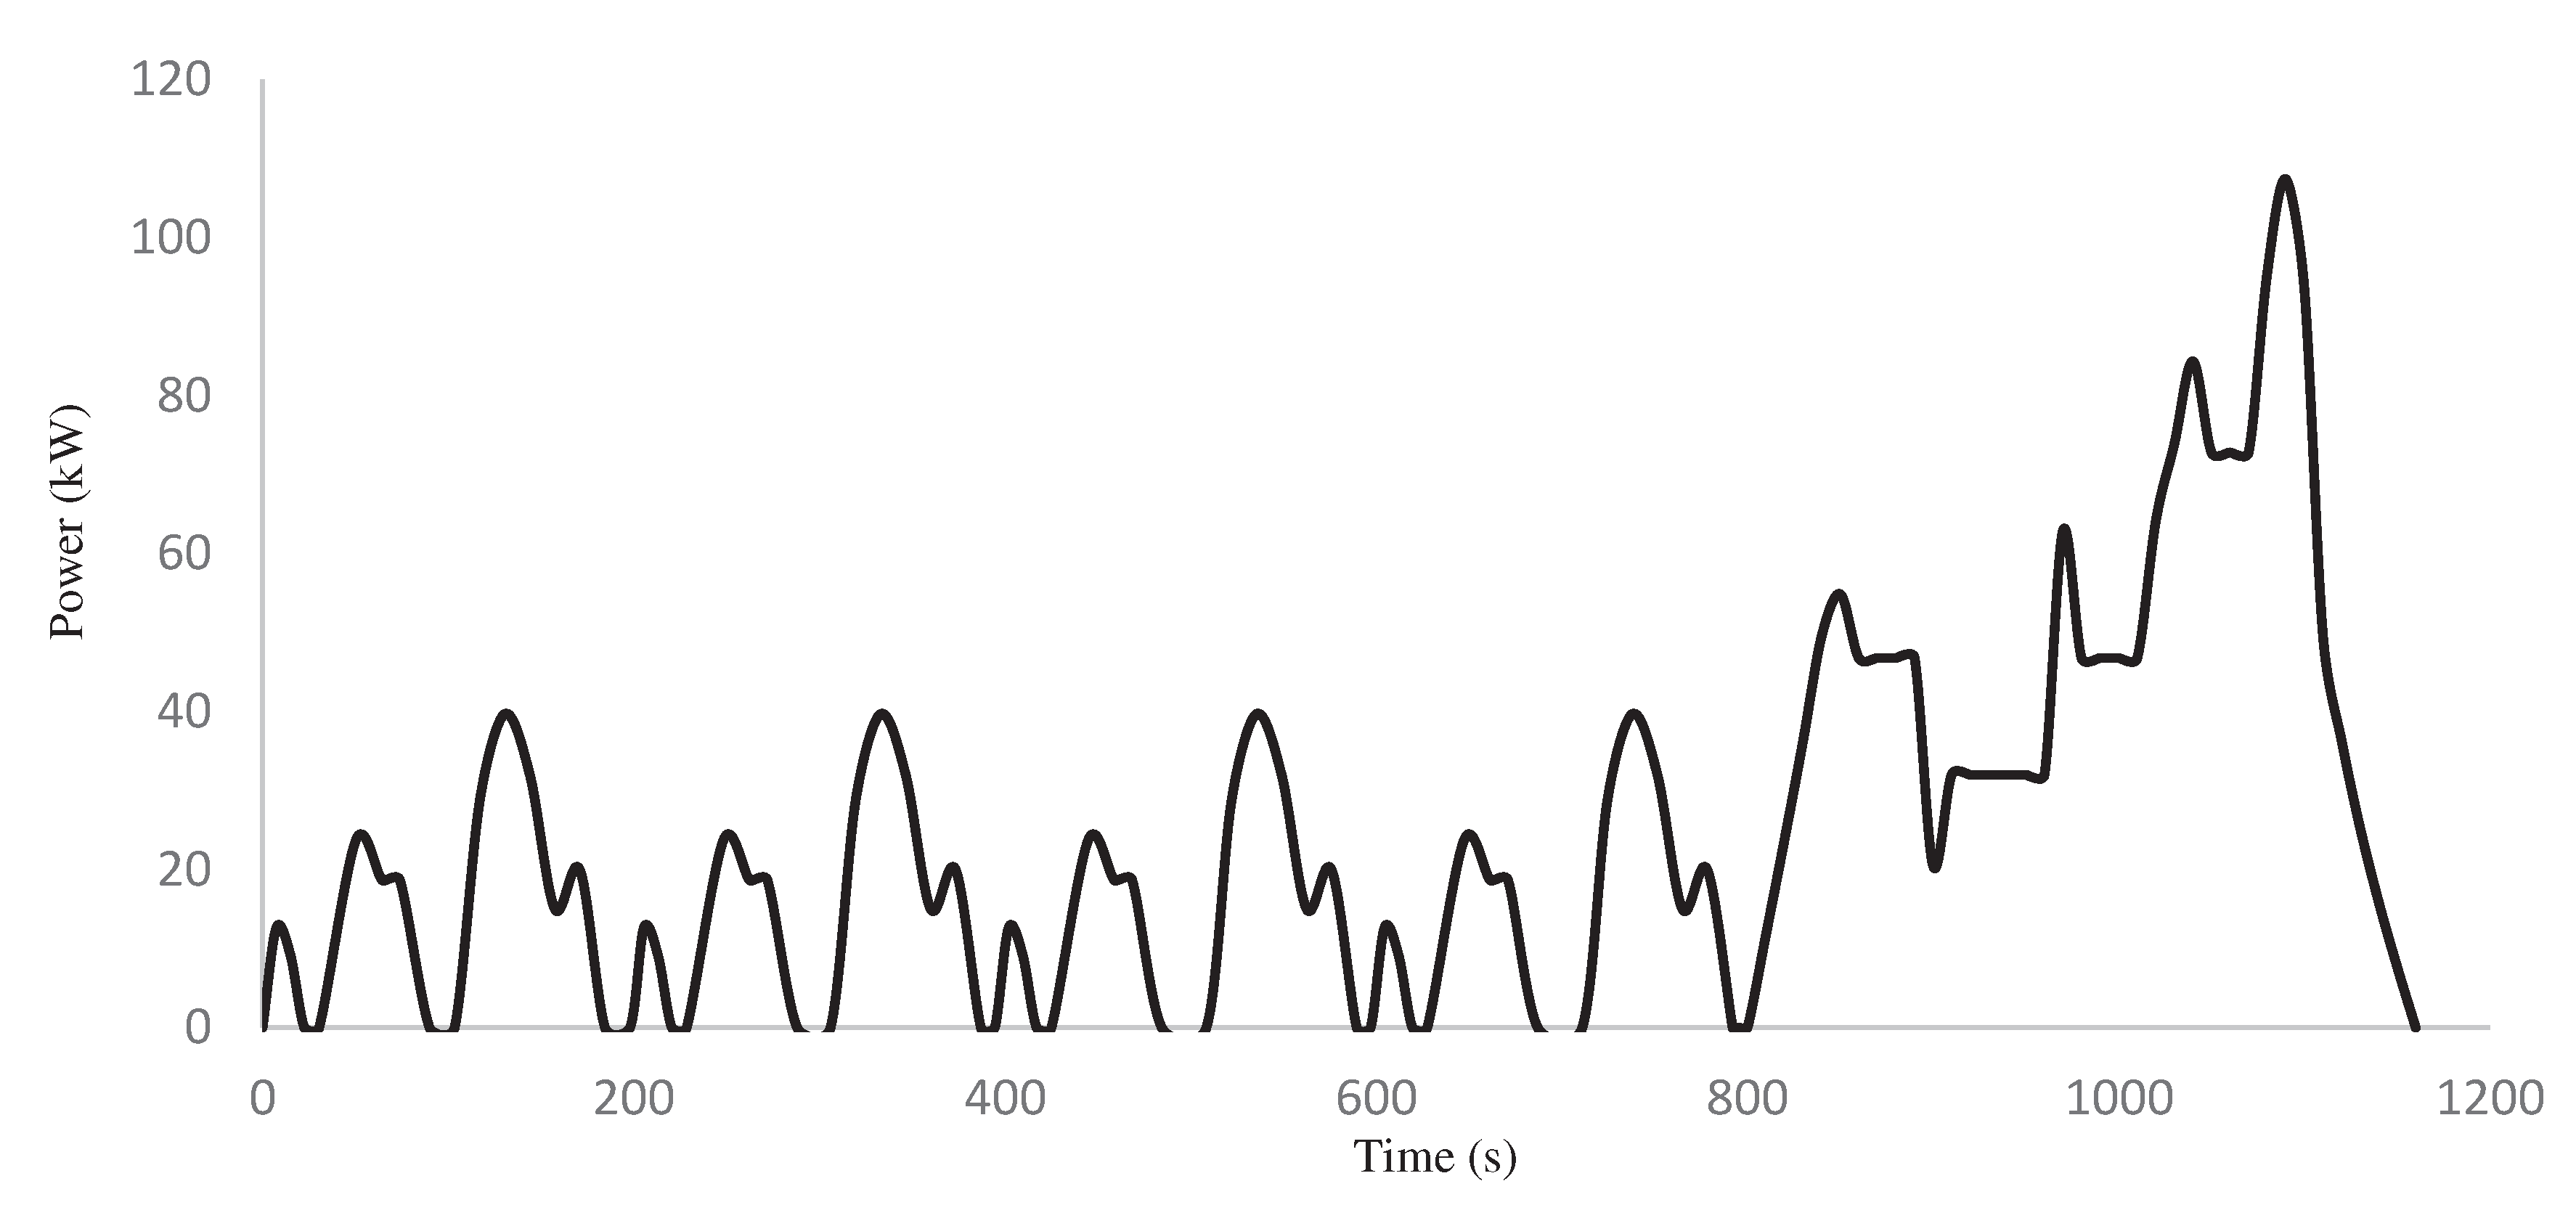
Applying driving conditions to the round trip route shown in Figure 3, we obtain the evolution of the power demand (Figure 6) [21].
Values for Figure 6 derive form the electric vehicle characteristics listed in Table 1.
Integrating power evolution in Figure 6 over the time, results a consumed energy of 4.568 kWh. Test runs on an electric vehicle prototype equipped with a 60 kWh battery. Partial distance corresponding to the running test is 30 kilometers. Therefore, the electric vehicle prototype driving range results 394 km, consistent with standard values in commercial electric vehicles.
We consider an electric vehicle powered by a 145 CV (106 kW) electric engine to run the simulation. Applying the fuel cell efficiency curve, we divide the power range in three sections: lower than 10%, between 10% and 48%, and higher than 48% of the maximum power source; therefore, power thresholds are 10.6 kW and 50.9 kW.
To analyze the different power configurations, we develop the simulation for the following cases (Table 2):
Depending on the configuration adopted for the electric vehicle power system, we have different energy consumption for the low, medium and high section; therefore, for the global process. Table 3 shows the simulation results for the configurations indicated in Table 2.
The analysis of simulation results show that D-configuration is the one that uses less energy, therefore, the most efficient. The use of Fuel Cell for low and medium output power, C-configuration, increases the energy consumption and penalizes the efficiency. Nevertheless, using the Fuel Cell only for low output power range, B-configuration, produces better results with lower energy consumption and higher efficiency. An intermediate value for the consumed energy and system efficiency occurs for the A-configuration, where high rate battery is omitted, and Fuel Cell powers the vehicle for medium and high output power factor.
We size the power source elements applying the configuration criteria set up in Table 2 to simulation results in Table 3. Table 4 shows the energy capacity, in kWh, of the three power units depending on the power source configuration.
We rounded energy capacity values to accommodate simulation results to commercial data.
Since Fuel Cell has no storage energy but a hydrogen reservoir, we should convert energy capacity in Table 4 into hydrogen mass storage. Applying equations 4 and 6 and considering the standard values for a PEMFC [107]:
Preprints 95366 i001
Which results in the following values:
Table 5. Hydrogen mass flow for the Fuel Cell unit (kg/s).
Configuration A B C D
Low 6.758 3.296 8.237 4.941
Applying the Fuel Cell operational time for every configuration, and considering a 500 atmosphere tank pressure, the hydrogen tank volume results (Table 6):
The analysis of results from Table 6 shows that A and C configuration requires a rank volume that exceeds the current value for a light electric vehicle; therefore, these configurations are unsuitable for commercial applications.
B-configuration requires a lower hydrogen tank but needs larger high rate battery capacity, which means more space and higher cost, since the high rate batteries are more expensive than low rate ones.
On the other hand, D-configuration is more complex than B-configuration since it requires two type of lithium battery instead of a single one. Nevertheless, the higher cost of high rate lithium battery compensates the additional cost of the more complex layout.

CONCLUSIONS

The combination of Fuel Cell with low and high rate lithium batteries for powering electric vehicles results the most efficient configuration of hybrid power source, minimizing the global energy consumption when used for the appropriate output power range. In this case, we recommend using the low rate battery for the low output power range, the Fuel Cell for the intermediate output power range, and the high rate battery for high output power range. Output power range is 0% to 10% for low one, 10% to 48% for intermediate, and above 48% for high one.
An alternative solution is a hybrid Fuel Cell and high rate lithium battery, which shows a less complex structure and a little higher energy consumption. This configuration operates with the Fuel Cell for the low output power range and within the high rate lithium battery for intermediate and high output power range. Despite an apparent less complex layout for this configuration, it may not represent a cheaper system since bigger size of the high rate lithium battery compensates for the extra cost of double lithium battery system.
Alternative configurations like using the low rate lithium battery for the low output power range and Fuel Cell for intermediate and high range, or Fuel Cell for low and intermediate output power range and high rate lithium battery for high output power range are not suitable for commercial applications because of the large hydrogen tank required to service the Fuel Cell unit.

References

  1. Ogura, K., & Kolhe, M. L. (2017). Battery technologies for electric vehicles. In Electric Vehicles: Prospects and Challenges (pp. 139-167). Elsevier. [CrossRef]
  2. Chen, X., Shen, W., Vo, T. T., Cao, Z., & Kapoor, A. (2012, December). An overview of lithium-ion batteries for electric vehicles. In 2012 10th International Power & Energy Conference (IPEC) (pp. 230-235). IEEE. [CrossRef]
  3. Liu, W.; Placke, T.; Chau, K. Overview of batteries and battery management for electric vehicles. Energy Rep. 2022, 8, 4058–4084. [CrossRef]
  4. Kennedy, B.; Patterson, D.; Camilleri, S. Use of lithium-ion batteries in electric vehicles. J. Power Sources 2000, 90, 156–162. [CrossRef]
  5. Lowe, M., Tokuoka, S., Trigg, T., & Gereffi, G. (2010). Lithium-ion batteries for electric vehicles. The US Value Chain, Contributing CGGC researcher: Ansam Abayechi.
  6. Zeng, X.; Li, M.; Abd El-Hady, D.; Alshitari, W.; Al-Bogami, A.S.; Lu, J.; Amine, K. Commercialization of Lithium Battery Technologies for Electric Vehicles. Adv. Energy Mater. 2019, 9, 1900161. [CrossRef]
  7. Diouf, B.; Pode, R. Potential of lithium-ion batteries in renewable energy. Renew. Energy 2015, 76, 375–380. [CrossRef]
  8. Perner, A., & Vetter, J. (2015). Lithium-ion batteries for hybrid electric vehicles and battery electric vehicles. In Advances in battery technologies for electric vehicles (pp. 173-190). Woodhead Publishing. [CrossRef]
  9. Vidyanandan, K. V. (2019). Batteries for electric vehicles. Power Management Institute.
  10. Lai, X.; Chen, Q.; Tang, X.; Zhou, Y.; Gao, F.; Guo, Y.; Bhagat, R.; Zheng, Y. Critical review of life cycle assessment of lithium-ion batteries for electric vehicles: A lifespan perspective. eTransportation 2022, 12. [CrossRef]
  11. Lu, L.; Han, X.; Li, J.; Hua, J.; Ouyang, M. A review on the key issues for lithium-ion battery management in electric vehicles. J. Power Sources 2013, 226, 272–288. [CrossRef]
  12. Affanni, A.; Bellini, A.; Franceschini, G.; Guglielmi, P.; Tassoni, C. Battery Choice and Management for New-Generation Electric Vehicles. IEEE Trans. Ind. Electron. 2005, 52, 1343–1349. [CrossRef]
  13. C. Armenta-Déu, J.P. Carriquiry, S. Guzmán (2019) Capacity correction factor for Li-ion batteries: Influence of the discharge rate. Journal of Energy Storage, Volume 25, October 2019, 100839. [CrossRef]
  14. C. Armenta-Déu (2021) Reduction of Electric Vehicle Driving Range due to Battery Capacity Fading. Journal of Automobile Engineering and Applications, Volume 8, Issue 2. [CrossRef]
  15. Atalay, S.; Sheikh, M.; Mariani, A.; Merla, Y.; Bower, E.; Widanage, W.D. Theory of battery ageing in a lithium-ion battery: Capacity fade, nonlinear ageing and lifetime prediction. J. Power Sources 2020, 478, 229026. [CrossRef]
  16. Broussely, M.; Biensan, P.; Bonhomme, F.; Blanchard, P.; Herreyre, S.; Nechev, K.; Staniewicz, R. Main aging mechanisms in Li ion batteries. J. Power Sources 2005, 146, 90–96. [CrossRef]
  17. Fernández, I.; Calvillo, C.; Sánchez-Miralles, A.; Boal, J. Capacity fade and aging models for electric batteries and optimal charging strategy for electric vehicles. Energy 2013, 60, 35–43. [CrossRef]
  18. Omar, N., Firouz, Y., Gualous, H., Salminen, J., Kallio, T., Timmermans, J. M., ... & Van Mierlo, J. (2015). Aging and degradation of lithium-ion batteries. In Rechargeable lithium batteries (pp. 263-279). Woodhead Publishing. [CrossRef]
  19. Keil, P.; Jossen, A. Aging of Lithium-Ion Batteries in Electric Vehicles: Impact of Regenerative Braking. World Electr. Veh. J. 2015, 7, 41–51. [CrossRef]
  20. Collath, N.; Tepe, B.; Englberger, S.; Jossen, A.; Hesse, H. Aging aware operation of lithium-ion battery energy storage systems: A review. J. Energy Storage 2022, 55. [CrossRef]
  21. M. Martínez-Arriaga, C. Armenta-Déu (2020) Simulation of the Performance of Electric Vehicle Batteries under variable Driving Conditions. Journal of Automobile Engineering and Applications, Volume 7, Issue 3, Pages 1-15.
  22. L. García-Arranz, C. Armenta-Déu (2021) Performance Tests to Determine Driving Range in Electric Vehicles. Journal of Mechatronics and Automation, Volume 8, Issue 2, pages 10-20. [CrossRef]
  23. Desantes, J.; Novella, R.; Pla, B.; Lopez-Juarez, M. Effect of dynamic and operational restrictions in the energy management strategy on fuel cell range extender electric vehicle performance and durability in driving conditions. Energy Convers. Manag. 2022, 266. [CrossRef]
  24. Al-Wreikat, Y.; Serrano, C.; Sodré, J.R. Driving behaviour and trip condition effects on the energy consumption of an electric vehicle under real-world driving. Appl. Energy 2021, 297, 117096. [CrossRef]
  25. Szumska, E.M.; Jurecki, R.S. Parameters Influencing on Electric Vehicle Range. Energies 2021, 14, 4821. [CrossRef]
  26. Varga, B.O.; Sagoian, A.; Mariasiu, F. Prediction of Electric Vehicle Range: A Comprehensive Review of Current Issues and Challenges. Energies 2019, 12, 946. [CrossRef]
  27. C. Armenta-Déu, B. Boucheix (2022) Seasonal Temperature Impact on the Driving Range of Electric Vehicles: Effects on Carbon Emissions Saving. Journal of Alternate Energy Sources and Technology, Volume 12, Issue 2, pages 10-34.
  28. C. Armenta-Déu, B. Giorgi (2022) Influence of Climatic Changes onto the Performance of Electric Vehicles. Journal of Automobile Engineering and Applications, Volume 9, Issue 2, pages 43-58.
  29. C. Armenta-Déu, B. Boucheix (2023) Evaluation of Lithium-Ion Battery Performance Under Variable Climatic Conditions: Influence on the Driving Range of Electric Vehicles. Future Transportation, 3, 535-551. [CrossRef]
  30. C. Armenta-Déu, B. Giorgi (2023) Analysis of Influence of Variable Meteorological Conditions on Driving Range. Future Transportation, 3, 626-642. [CrossRef]
  31. Steinstraeter, M.; Heinrich, T.; Lienkamp, M. Effect of Low Temperature on Electric Vehicle Range. World Electr. Veh. J. 2021, 12, 115. [CrossRef]
  32. Belt, J.R.; Ho, C.D.; Miller, T.J.; Habib, M.A.; Duong, T.Q. The effect of temperature on capacity and power in cycled lithium ion batteries. J. Power Sources 2005, 142, 354–360. [CrossRef]
  33. Lu, Z.; Yu, X.; Wei, L.; Cao, F.; Zhang, L.; Meng, X.; Jin, L. A comprehensive experimental study on temperature-dependent performance of lithium-ion battery. Appl. Therm. Eng. 2019, 158, 113800. [CrossRef]
  34. Bandhauer, T.M.; Garimella, S.; Fuller, T.F. A Critical Review of Thermal Issues in Lithium-Ion Batteries. J. Electrochem. Soc. 2011, 158, R1. [CrossRef]
  35. M. Hanako Olmedilla.Ishishi, C. Armenta-Déu (2020) Seasonal Variation of Electric Vehicle Autonomy: Application to AC/DC Dual Voltage Operation. Journal of Mechatronics and Automation, Volume 7, Issue 3, pages 1-16. [CrossRef]
  36. Lu, Z.; Yu, X.; Zhang, L.; Meng, X.; Wei, L.; Jin, L. Experimental investigation on the charge-discharge performance of the commercial lithium-ion batteries. Energy Procedia 2017, 143, 21–26. [CrossRef]
  37. Ma, S.; Jiang, M.; Tao, P.; Song, C.; Wu, J.; Wang, J.; Deng, T.; Shang, W. Temperature effect and thermal impact in lithium-ion batteries: A review. Prog. Nat. Sci. 2018, 28, 653–666. [CrossRef]
  38. Testing and Assessment Protocol Release 2.0». FIA Foundation. Updated on 20th, April, 2012.
  39. Emission Test Cycles ECE 15 + EUDC / NEDC». DieselNet.
  40. New European Driving Cycle. https://en.wikipedia.org/wiki/New_European_Driving_Cycle [Accessed online: 20/12/2023].
  41. Worldwide harmonized Light vehicles Test Procedure (WLTP) - Transport - Vehicle Regulations - UNECE Wiki”. wiki.unece.org.
  42. WLTPfacts.eu - Worldwide Harmonised Light Vehicle Test Procedure”. WLTPfacts.eu.
  43. Worldwide Harmonised Light Vehicles Test Procedure. https://en.wikipedia.org/wiki/Worldwide_Harmonised_Light_Vehicles_Test_Procedure [Accessed online: 20/12/2023 ].
  44. Dynamometer Drive Schedules”. US EPA. Retrieved 26 April 2014.
  45. DieselNet Emission Test Cycles - FTP-75.
  46. FTP-75. https://en.wikipedia.org/wiki/FTP-75#cite_note-EPA_cycles-5 [Accessed online: 20/12/2023].
  47. Japan Automobile Manufacturers Association (JAMA) (2009). “From 10•15 to JC08: Japan’s new economy formula”. News from JAMA. Retrieved 9 April 2012. Issue No. 2, 2009.
  48. Prius Certified to Japanese 2015 Fuel Economy Standards with JC08 Test Cycle”. Green Car Congress. 11 August 2007. Retrieved 9 April 2012.
  49. Japanese JC08Test. Fuel Economy in automobiles. https://en.wikipedia.org/wiki/Fuel_economy_in_automobiles#JC08 [Accessed online: 20/12/2023].
  50. Emissions Tests Explained. Rivervale. https://www.rivervaleleasing.co.uk/guides/leasing-overview/difference-between-wltp-and-nedc-emissions-tests-explained [Accessed online: 20/12/2023].
  51. Lee, H.; Lee, K. Comparative Evaluation of the Effect of Vehicle Parameters on Fuel Consumption under NEDC and WLTP. Energies 2020, 13, 4245. [CrossRef]
  52. Liu, X.; Zhao, F.; Hao, H.; Chen, K.; Liu, Z.; Babiker, H.; Amer, A.A. From NEDC to WLTP: Effect on the Energy Consumption, NEV Credits, and Subsidies Policies of PHEV in the Chinese Market. Sustainability 2020, 12, 5747. [CrossRef]
  53. Koszałka, G.; Szczotka, A.; Suchecki, A. Comparison of fuel consumption and exhaust emissions in WLTP and NEDC procedures. Combust. Engines 2019, 179, 186–191. [CrossRef]
  54. Karamangil, M.I.; Tekin, M. Comparison of fuel consumption and recoverable energy according to NEDC and WLTP cycles of a vehicle. CT&F-Ciencia, Tecnología y Futuro 2022, 12, 31–38. [CrossRef]
  55. WLTP cycle replaces NEDC.Eurococ. https://www.eurococ.eu/en/blog/wltp-cycle-replaces-nedc/#:~:text=The%20WLTP%20simulates%20the%20real,reflect%20real-world%20driving%20conditions.
  56. Peter Kasten, Ruth Blanck (2017) The changeover from the NEDC to the WLTP and its impact on the effectiveness and the post-2020 update of the CO2 emission standards. Öko-Institut.
  57. Leard, B., & McConnell, V. Progress and potential for electric vehicles to reduce carbon emissions (No. 20-24). Washington, DC, USA: Resources for the Future.
  58. Canals Casals, L.; Martinez-Laserna, E.; Amante García, B.; Nieto, N. Sustainability analysis of the electric vehicle use in Europe for CO2 emissions reduction. J. Clean. Prod. 2016, 127, 425–437. [CrossRef]
  59. Mehlig, D.; Staffell, I.; Stettler, M.; ApSimon, H. Accelerating electric vehicle uptake favours greenhouse gas over air pollutant emissions. Transp. Res. Part D: Transp. Environ. 2023, 124. [CrossRef]
  60. Ghosh, A. Possibilities and Challenges for the Inclusion of the Electric Vehicle (EV) to Reduce the Carbon Footprint in the Transport Sector: A Review. Energies 2020, 13, 2602. [CrossRef]
  61. Fuinhas, J.A.; Koengkan, M.; Leitão, N.C.; Nwani, C.; Uzuner, G.; Dehdar, F.; Relva, S.; Peyerl, D. Effect of Battery Electric Vehicles on Greenhouse Gas Emissions in 29 European Union Countries. Sustainability 2021, 13, 13611. [CrossRef]
  62. Afkhami, B.; Akbarian, B.; Ansari, E. Adoption of battery electric vehicles for reduction of greenhouse gases and air pollutant emissions: A case study of the United States. Energy Storage 2021, 4, e280. [CrossRef]
  63. Ajanovic, A.; Haas, R. Dissemination of electric vehicles in urban areas: Major factors for success. Energy 2016, 115, 1451–1458. [CrossRef]
  64. Kester, J.; Noel, L.; de Rubens, G.Z.; Sovacool, B.K. Policy mechanisms to accelerate electric vehicle adoption: A qualitative review from the Nordic region. Renew. Sustain. Energy Rev. 2018, 94, 719–731. [CrossRef]
  65. Adhikari, M.; Ghimire, L.P.; Kim, Y.; Aryal, P.; Khadka, S.B. Identification and Analysis of Barriers against Electric Vehicle Use. Sustainability 2020, 12, 4850. [CrossRef]
  66. Panwar, U., Kumar, A., & Chakrabarti, D. Barriers in implementation of electric vehicles in India. International Journal of Electric and Hybrid Vehicles 2019, 11, 195-204. [CrossRef]
  67. Chidambaram, K.; Ashok, B.; Vignesh, R.; Deepak, C.; Ramesh, R.; Narendhra, T.M.; Usman, K.M.; Kavitha, C. Critical analysis on the implementation barriers and consumer perception toward future electric mobility. Proc. Inst. Mech. Eng. Part D: J. Automob. Eng. 2022, 237, 622–654. [CrossRef]
  68. Sopha, B.M.; Purnamasari, D.M.; Ma’mun, S. Barriers and Enablers of Circular Economy Implementation for Electric-Vehicle Batteries: From Systematic Literature Review to Conceptual Framework. Sustainability 2022, 14, 6359. [CrossRef]
  69. Mahdavian, A.; Shojaei, A.; Mccormick, S.; Papandreou, T.; Eluru, N.; Oloufa, A.A. Drivers and Barriers to Implementation of Connected, Automated, Shared, and Electric Vehicles: An Agenda for Future Research. IEEE Access 2021, 9, 22195–22213. [CrossRef]
  70. Krishna, G. Understanding and identifying barriers to electric vehicle adoption through thematic analysis. Transp. Res. Interdiscip. Perspect. 2021, 10, 100364. [CrossRef]
  71. O’Neill, E.; Moore, D.; Kelleher, L.; Brereton, F. Barriers to electric vehicle uptake in Ireland: Perspectives of car-dealers and policy-makers. Case Stud. Transp. Policy 2018, 7, 118–127. [CrossRef]
  72. Falchetta, G.; Noussan, M. Electric vehicle charging network in Europe: An accessibility and deployment trends analysis. Transp. Res. Part D: Transp. Environ. 2021, 94, 102813. [CrossRef]
  73. Hall, D., Moultak, M., & Lutsey, N. (2017). Electric vehicle capitals of the world. ICCT White Paper.
  74. Trends incharging infrastructure. Global EV Outlook 22. International Energy Agency (IEA). https://www.iea.org/reports/global-ev-outlook-2022/trends-in-charging-infrastructure [Accessed online: 23/12/2023].
  75. Charging stations. Electromaps. A wallbox company. https://www.electromaps.com/en/charging-stations [Accessed online: 23/12/2023].
  76. AmpUp EV Charging”. www.ampup.io. [Accessed online: 23/12/2023].
  77. Electric vehicle charging network. https://en.wikipedia.org/wiki/Electric_vehicle_charging_network#cite_note-AmpUp-20 [Accessed online: 23/12/2023].
  78. EV Charging Stations Data. Eco-movement. https://www.eco-movement.com/charging-station-dataset-demo/?gclid=EAIaIQobChMIhpmk2cu1gwMVkpNoCR1VEQnJEAMYASAAEgJhpfD_BwE [Accessed online: 23/12/2023].
  79. Qawasmeh, B. R., Al-Salaymeh, A., Swaity, A., Mosleh, A., & Boshmaf, S. Investigation of performance characteristics of hybrid cars. Environmental Engineering 2017, 14, 59-69.
  80. Asfoor, M. S., Sharaf, A. M., & Beyerlein, S. (2014, May). Use of GT-Suite to study performance differences between internal combustion engine (ICE) and hybrid electric vehicle (HEV) powertrains. In The International Conference on Applied Mechanics and Mechanical Engineering (Vol. 16, No. 16th International Conference on Applied Mechanics and Mechanical Engineering., pp. 1-16). Military Technical College.
  81. Penina, N., Turygin, Y. V., & Racek, V. (2010, June). Comparative analysis of different types of hybrid electric vehicles. In 13th Mechatronika 2010 (pp. 102-104). IEEE.
  82. Elkelawy, M.; Mohamad, H.A.E.; Samadony, M.; Elbanna, A.M.; Safwat, A.M.S.M. A comparative study on developing the Hybrid-Electric Vehicle Systems and Its Future Expectation over the Conventional Engines cars. J. Eng. Res. 2022. [CrossRef]
  83. Awadallah, M., Tawadros, P., Walker, P., Zhang, N., & Tawadros, J. (2017, June). A Comparative Fuel Analysis of a novel HEV with conventional vehicle. In 2017 IEEE 85th vehicular technology conference (VTC Spring) (pp. 1-6). IEEE. [CrossRef]
  84. Dong, H.; Fu, J.; Zhao, Z.; Liu, Q.; Li, Y.; Liu, J. A comparative study on the energy flow of a conventional gasoline-powered vehicle and a new dual clutch parallel-series plug-in hybrid electric vehicle under NEDC. Energy Convers. Manag. 2020, 218, 113019. [CrossRef]
  85. Kumar, A.; Thakura, P.R. ADVISOR-Based Performance Analysis of a Hybrid Electric Vehicle and Comparison with a Conventional Vehicle. IETE J. Res. 2020, 69, 753–761. [CrossRef]
  86. Howey, D.; Martinez-Botas, R.; Cussons, B.; Lytton, L. Comparative measurements of the energy consumption of 51 electric, hybrid and internal combustion engine vehicles. Transp. Res. Part D: Transp. Environ. 2011, 16, 459–464. [CrossRef]
  87. Veza, I.; Asy’Ari, M.Z.; Idris, M.; Epin, V.; Fattah, I.R.; Spraggon, M. Electric vehicle (EV) and driving towards sustainability: Comparison between EV, HEV, PHEV, and ICE vehicles to achieve net zero emissions by 2050 from EV. Alex. Eng. J. 2023, 82, 459–467. [CrossRef]
  88. Doust, M.; Otkur, M. Carbon footprint comparison analysis of passenger car segment electric and ICE propelled vehicles in Kuwait. Alex. Eng. J. 2023, 79, 438–448. [CrossRef]
  89. Carlson, R.’.; Lohse-Busch, H.; Diez, J.; Gibbs, J. The Measured Impact of Vehicle Mass on Road Load Forces and Energy Consumption for a BEV, HEV, and ICE Vehicle. SAE Int. J. Altern. Powertrains 2013, 2, 105–114. [CrossRef]
  90. Sinha, R. (2023). Comparative Environmental Impact Analysis of Electric, Hybrid, and Conventional Internal Combustion Engine Vehicles. [CrossRef]
  91. Garcia, A., Monsalve-Serrano, J., Villalta, D., & Tripathi, S. (2022). Electric vehicles vs e-fuelled ICE vehicles: comparison of potentials for life cycle CO 2 emission reduction (No. 2022-01-0745). SAE Technical Paper.
  92. Graham, R. (2001). Comparing the benefits and impacts of hybrid electric vehicle options. Electric Power Research Institute (EPRI), Palo Alto, CA, Report, 1000349.
  93. Huang, Y.; Surawski, N.C.; Organ, B.; Zhou, J.L.; Tang, O.H.H.; Chan, E.F.C. Fuel consumption and emissions performance under real driving: Comparison between hybrid and conventional vehicles. Sci. Total Environ. 2019, 659, 275–282. [CrossRef]
  94. De Wolf, D., & Smeers, Y. Comparison of Battery Electric Vehicles and Fuel Cell Vehicles. World Electric Vehicle Journal 2023, 14, 262. [CrossRef]
  95. Prathibha, P. K., Samuel, E. R., & Unnikrishnan, A. (2020). Parameter study of electric vehicle (EV), hybrid EV and fuel cell EV using advanced vehicle simulator (ADVISOR) for different driving cycles. In Green Buildings and Sustainable Engineering: Proceedings of GBSE 2019 (pp. 491-504). Springer Singapore. [CrossRef]
  96. Loengbudnark, W.; Khalilpour, K.; Bharathy, G.; Taghikhah, F.; Voinov, A. Battery and hydrogen-based electric vehicle adoption: A survey of Australian consumers perspective. Case Stud. Transp. Policy 2022, 10, 2451–2463. [CrossRef]
  97. Lee, U.; Jeon, S.; Lee, I. Design for shared autonomous vehicle (SAV) system employing electrified vehicles: Comparison of battery electric vehicles (BEVs) and fuel cell electric vehicles (FCEVs). Clean. Eng. Technol. 2022, 8. [CrossRef]
  98. Thomas, C. Fuel cell and battery electric vehicles compared. Int. J. Hydrogen Energy 2009, 34, 6005–6020. [CrossRef]
  99. Thomas, C. E., James, B. D., Lomax Jr, F. D., & Kuhn Jr, I. F. Fuel options for the fuel cell vehicle: hydrogen, methanol or gasoline? International Journal of Hydrogen Energy 2000, 25, 551-567. [CrossRef]
  100. De Wolf, D., & Smeers, Y. Comparison of Battery Electric Vehicles and Fuel Cell Vehicles. World Electric Vehicle Journal 2023, 14, 262. [CrossRef]
  101. Cano, Z.P.; Banham, D.; Ye, S.; Hintennach, A.; Lu, J.; Fowler, M.; Chen, Z. Batteries and fuel cells for emerging electric vehicle markets. Nat. Energy 2018, 3, 279–289. [CrossRef]
  102. Offer, G.J.; Howey, D.; Contestabile, M.; Clague, R.; Brandon, N.P. Comparative analysis of battery electric, hydrogen fuel cell and hybrid vehicles in a future sustainable road transport system. Energy Policy 2010, 38, 24–29. [CrossRef]
  103. Pramuanjaroenkij, A.; Kakaç, S. The fuel cell electric vehicles: The highlight review. Int. J. Hydrogen Energy 2023, 48, 9401–9425. [CrossRef]
  104. Wishart, J. (2014). Fuel cells vs Batteries in the Automotive Sector. Intertek Technol Report.
  105. Das, H.S.; Tan, C.W.; Yatim, A.H.M. Fuel cell hybrid electric vehicles: A review on power conditioning units and topologies. Renew. Sustain. Energy Rev. 2017, 76, 268–291. [CrossRef]
  106. Emadi, A., & Williamson, S. S. (2004, June). Fuel cell vehicles: opportunities and challenges. In IEEE Power Engineering Society General Meeting, 2004. (pp. 1640-1645). IEEE. [CrossRef]
  107. Barbir, F. (2012). PEM fuel cells: theory and practice. Academic press.
  108. Benziger, J.; Chia, E.; Moxley, J.; Kevrekidis, I. The dynamic response of PEM fuel cells to changes in load. Chem. Eng. Sci. 2005, 60, 1743–1759. [CrossRef]
  109. Schmittinger, W.; Vahidi, A. A review of the main parameters influencing long-term performance and durability of PEM fuel cells. J. Power Sources 2008, 180, 1–14. [CrossRef]
  110. Wu, H.-W. A review of recent development: Transport and performance modeling of PEM fuel cells. Appl. Energy 2016, 165, 81–106. [CrossRef]
  111. Yan, Q.; Toghiani, H.; Causey, H. Steady state and dynamic performance of proton exchange membrane fuel cells (PEMFCs) under various operating conditions and load changes. J. Power Sources 2006, 161, 492–502. [CrossRef]
  112. Li, H.; Zhao, H.; Jian, S.; Tao, B.; Gu, S.; Xu, G.; Wang, G.; Chang, H. Designing proton exchange membrane fuel cells with high specific power density. J. Mater. Chem. A 2023, 11, 17373–17391. [CrossRef]
  113. Mishra, V.; Yang, F.; Pitchumani, R. Analysis and design of PEM fuel cells. J. Power Sources 2005, 141, 47–64. [CrossRef]
  114. Wang, Y., Diaz, D. F. R., Chen, K. S., Wang, Z., & Adroher, X. C. Materials, technological status, and fundamentals of PEM fuel cells–a review. Materials today 2020, 32, 178-203. [CrossRef]
  115. Zamora, I.; Martin, J.S.; Aperribay, V.; Torres, E.; Eguia, P. Influence of the rated power in the performance of different proton exchange membrane (PEM) fuel cells. Energy 2010, 35, 1898–1907. [CrossRef]
  116. Mekhilef, S.; Saidur, R.; Safari, A. Comparative study of different fuel cell technologies. Renew. Sustain. Energy Rev. 2012, 16, 981–989. [CrossRef]
  117. Carrette, L., Friedrich, K. A., & Stimming, U. Fuel cells: principles, types, fuels, and applications. ChemPhysChem 2000, 1, 162-193. [CrossRef]
  118. Tomczyk, P. MCFC versus other fuel cells—Characteristics, technologies and prospects. Journal of Power sources 2006, 160, 858-862. [CrossRef]
  119. Benmouiza, K.; Cheknane, A. Analysis of proton exchange membrane fuel cells voltage drops for different operating parameters. Int. J. Hydrogen Energy 2018, 43, 3512–3519. [CrossRef]
  120. Xu, Z.; Qi, Z.; He, C.; Kaufman, A. Combined activation methods for proton-exchange membrane fuel cells. J. Power Sources 2006, 156, 315–320. [CrossRef]
  121. Van Der Linden, F.; Pahon, E.; Morando, S.; Bouquain, D. A review on the Proton-Exchange Membrane Fuel Cell break-in physical principles, activation procedures, and characterization methods. J. Power Sources 2023, 575. [CrossRef]
  122. Qi, Z.; Kaufman, A. Quick and effective activation of proton-exchange membrane fuel cells. J. Power Sources 2003, 114, 21–31. [CrossRef]
  123. Dey, T.; Singdeo, D.; Bose, M.; Basu, R.N.; Ghosh, P.C. Study of contact resistance at the electrode–interconnect interfaces in planar type Solid Oxide Fuel Cells. J. Power Sources 2013, 233, 290–298. [CrossRef]
  124. Chae, K.J.; Choi, M.; Ajayi, F.F.; Park, W.; Chang, I.S.; Kim, I.S. Mass Transport through a Proton Exchange Membrane (Nafion) in Microbial Fuel Cells. Energy Fuels 2007, 22, 169–176. [CrossRef]
  125. Armenta-Déu, C.; Arenas, A. Performance Analysis of Electric Vehicles with a Fuel Cell–Supercapacitor Hybrid System. Eng 2023, 4, 2274–2292. [CrossRef]
  126. Armenta-Déu, C., & Olmedilla-Ishishi, M. H. Seasonal variation of electric vehicles autonomy: application to AC/DC dual voltage operation. Journal of Mechatronics and Automation 2020, 7, 1-15. [CrossRef]
  127. C. Armenta-Déu, Q. Jach (2022) Battery/Supercapacitor Hybrid System for Electric Vehicles. Journal of Automobile Engineering and Applications, Volume 9, Issue 2, pages 20-42.
  128. Armenta-Déu, C.; Cattin, E. Real Driving Range in Electric Vehicles: Influence on Fuel Consumption and Carbon Emissions. World Electr. Veh. J. 2021, 12, 166. [CrossRef]
  129. Martínez-Arriaga, M., & Armenta-Déu, C. Simulation of the performance of electric vehicles batteries under variable driving conditions. J. Automob. Eng. Appl 2020, 7, 1-15. [CrossRef]
  130. C. Armenta-Déu, L. Carmona, C. Rincón (2023) Analysis and evaluation of electric vehicles carbon footprint. Journal of Energy, Environment and Carbon Credits (under review).
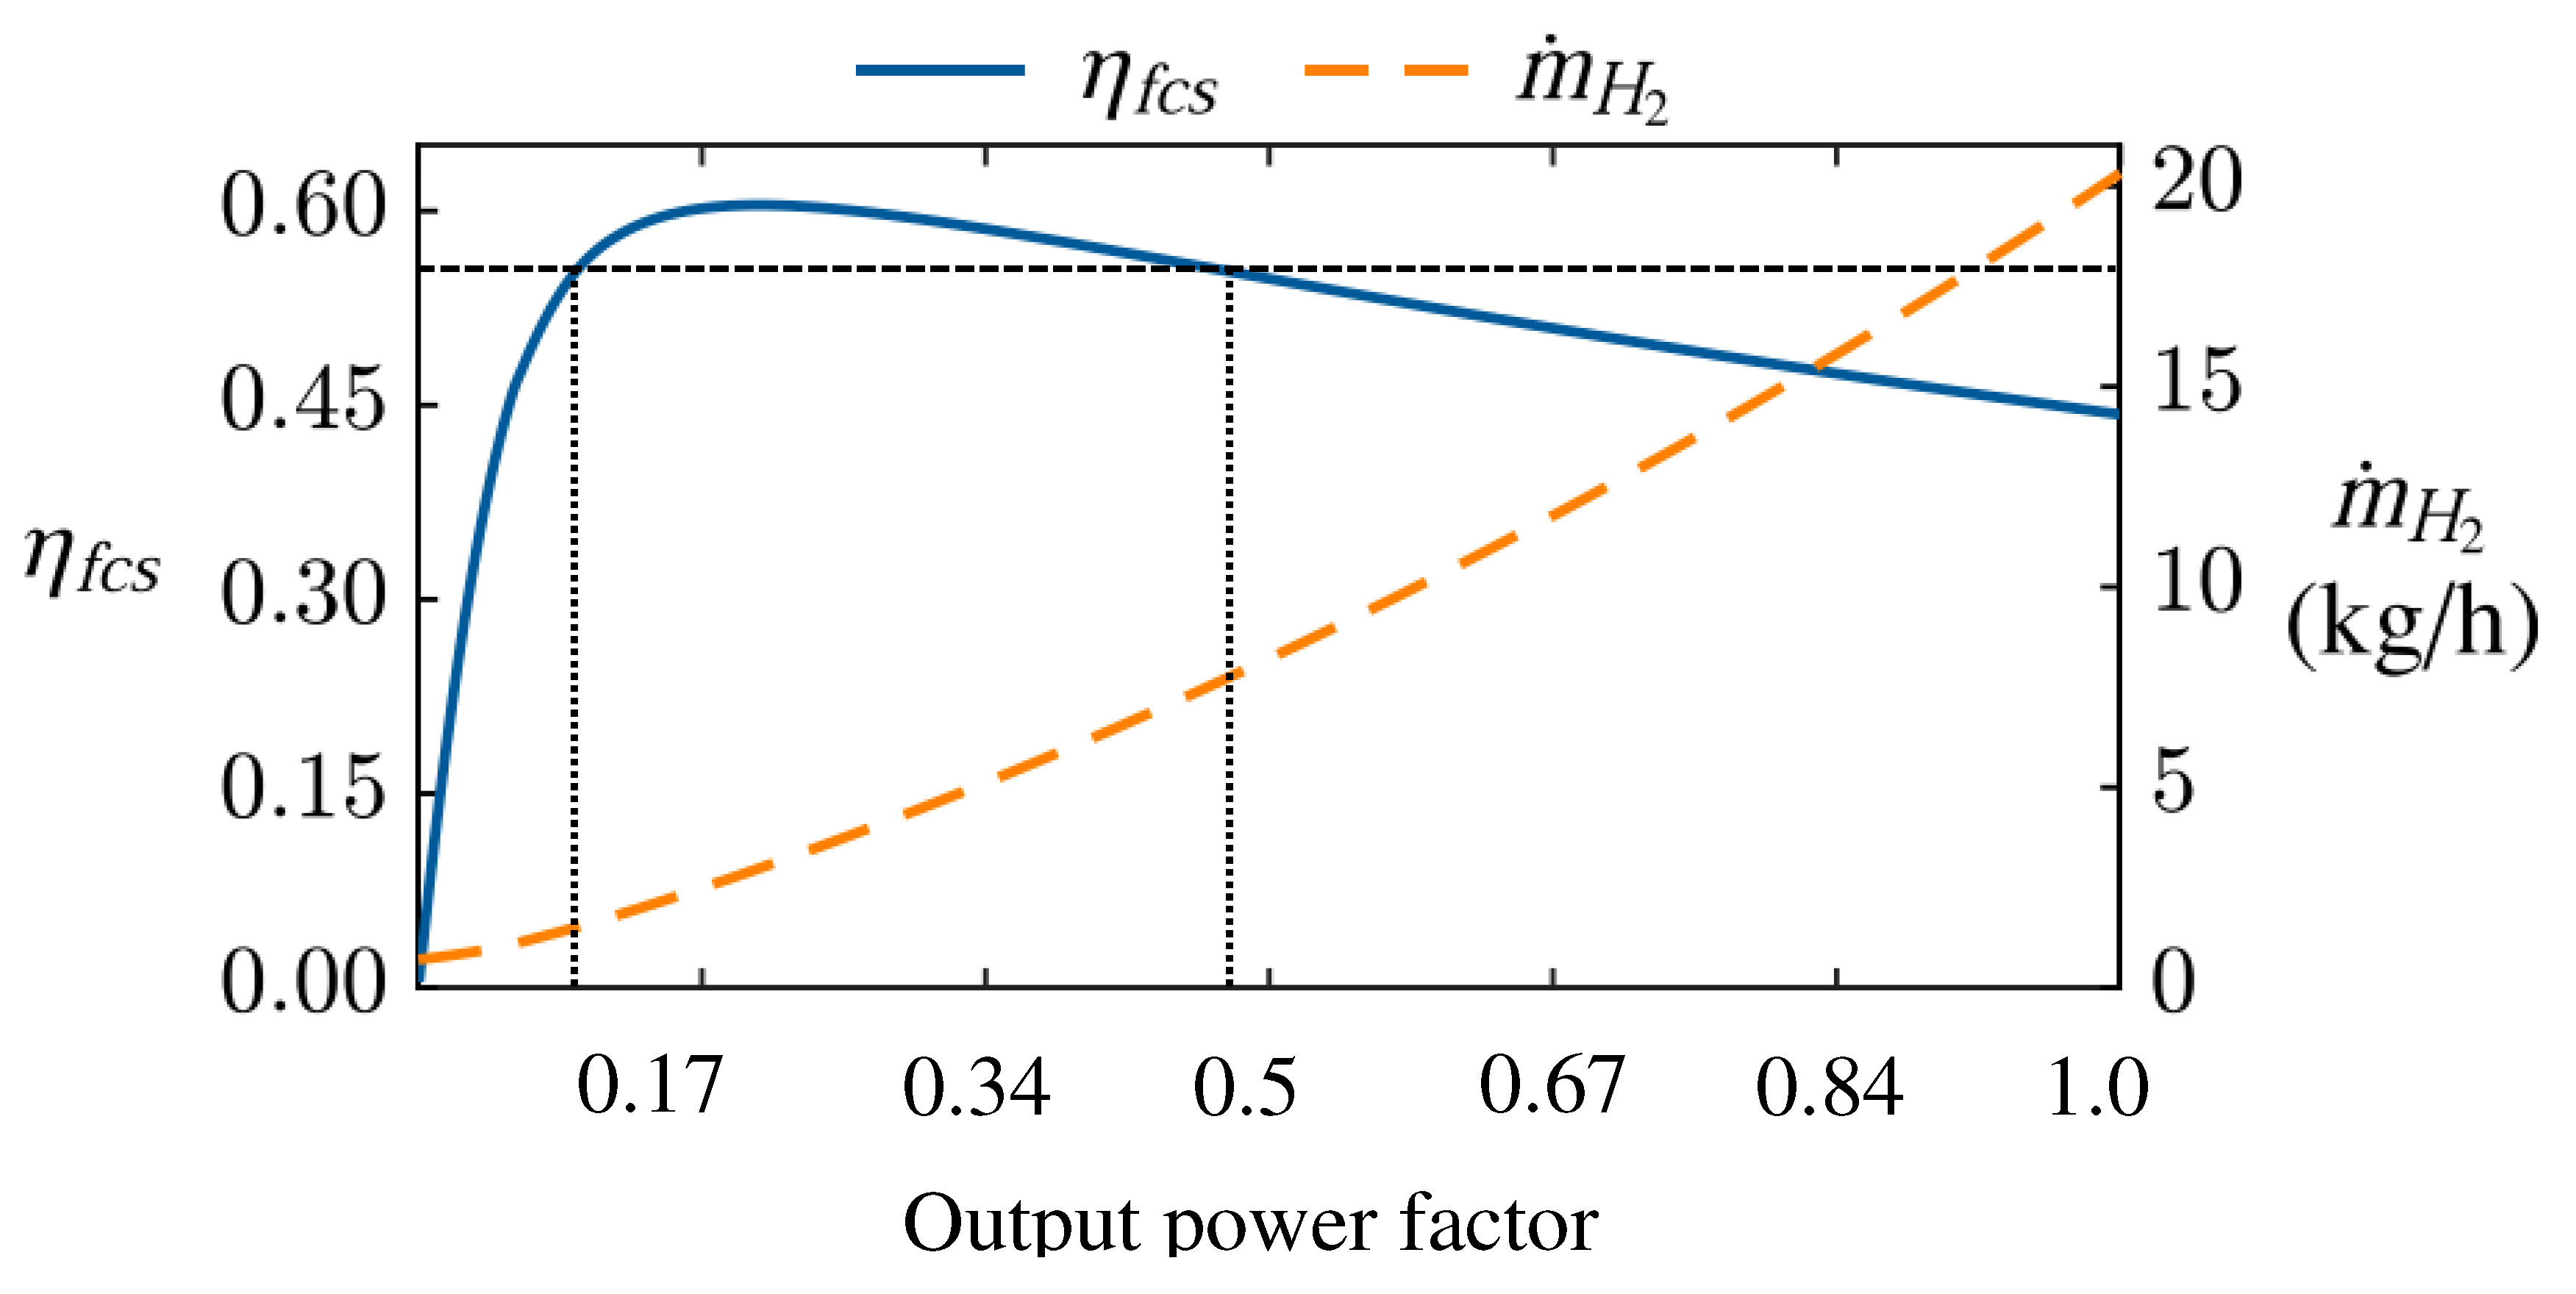
Figure 1. Efficiency and hydrogen consumption rate for a Fuel Cell Electric Vehicle.
Preprints 95366 g001
Figure 2. Discharge efficiency of lithium batteries as a function of the state of charge.
Preprints 95366 g002
Figure 3. Control System Flowchart.
Preprints 95366 g003
Figure 4. Schematic view of a Hybrid Fuel Cell-Lithium Battery Power System for Electric Vehicles.
Preprints 95366 g004
Figure 5. Simple daily round trip route.
Preprints 95366 g005
Figure 6. Evolution of the power demand with time.
Preprints 95366 g006
Table 1. Electric vehicle characteristics.
Parameter Unit Symbol Value
Weight kg m 1644
Front area m2 S 2.5
Aerodynamic coefficient --- Cx 0.30
Rolling coefficient --- μ 0.015
Air density kg/m3 ρ 1.133
Table 2. Power source configuration.
Power demand range (kW) → 0-10.6 10.6-50.9 50.9-106
Power source configuration
A Low rate battery Fuel Cell
B Fuel Cell High rate battery
C Fuel Cell High rate battery
D Low rate battery Fuel Cell High rate battery
Table 3. Energy consumption (kWh) for different power source configuration.
Configuration A B C D
Low 7,686 57,803 57,803 7,686
Medium 86,655 40,410 86,655 86,655
High 31,854 15,269 15,269 15,299
Total 126,195 113,482 159,727 109,641
Table 4. Energy capacity (kWh) for the power units.
Configuration Low rate battery Fuel Cell High rate battery
A 7.7 118.5 ---
B --- 57.8 55.7
C --- 144.5 15.3
D 7.7 86.7 15.3
Table 6. Hydrogen tank volume (liters).
Configuration A B C D
Low 118.1 29.9 194.8 72.1
Disclaimer/Publisher’s Note: The statements, opinions and data contained in all publications are solely those of the individual author(s) and contributor(s) and not of MDPI and/or the editor(s). MDPI and/or the editor(s) disclaim responsibility for any injury to people or property resulting from any ideas, methods, instructions or products referred to in the content.
Copyright: This open access article is published under a Creative Commons CC BY 4.0 license, which permit the free download, distribution, and reuse, provided that the author and preprint are cited in any reuse.
Prerpints.org logo

Preprints.org is a free preprint server supported by MDPI in Basel, Switzerland.

Subscribe

© 2024 MDPI (Basel, Switzerland) unless otherwise stated