Submitted:
05 January 2024
Posted:
08 January 2024
Read the latest preprint version here
Abstract
Previous high throughput screening studies indicated trans-eQTLs tend to be tissue specific. In this study, I probed if this feature can be used to identify tissue-specific gene regulatory networks. eQTL data (P<5e-8) for 16,259 were identified and their summary association statistics were obtained from the eQTLGene database. Next, eQTLs that display both cis and trans regulatory effects were selected and the association between their corresponding genes were examined using Mendelian randomization. A total of 169 genes that exerted trans-regulatory impacts on 692 genes were identified. 90% of the genes (N=749) aggregated into a gene regulatory network significantly enriched in hemo-immune processes. The robustness of finding was confirmed through simulation. The identified network displayed the scale-free topology. This provided the reason to examine the association of the network’s hub genes with the phenome. The outcome of analyses revealed GSDMB and ORMDL3 impact several disorders of immune origin and ALDH2 overexpression contributes to obesity. This study reports trans-eQTLs can be used to identify tissue-specific gene regulatory networks and describes a workflow to achieve this purpose. The network identified in this study showed scale-free topology suggesting the hub genes of a GRN could be targeted to prevent disease outcomes.
Keywords:
trans-eQTLs
; tissue specificity
; gene regulatory network
; scale-free network
1. Introduction
The development of high throughput screening
methods provided the opportunity to systematically investigate the
transcriptome and map the underlying eQTLs. Results from these studies are
usually publicly available as data files that summarize the nature of association
between genomic variants (SNPs) and a transcript abundance. Findings from these
studies have increased our understanding of the genetic architecture of
transcriptome. A finding from these studies is the evidence that trans-eQTLs
tend to be tissue specific [1,2,3]. Building
upon this notion, in this study, I examined whether trans-eQTLs can be used as
clues to identify gene regulatory networks (GRNs) that are specific to a tissue
or a cell type.
The combination of active genes and the
interactions between them within a cell generates a GRN that enables a cell to
fulfill its function. Several experimental and computational methods exist for
the identification of GRNs. However, such methods require access to individual
level data which is not always feasible due to privacy concerns or other
logistical considerations.[4] The method
proposed in this study, uses eQTL summary association statistics data that are
readily available upon publication. In the following sections, I described the
method and the outcomes of the analyses.
2. Materials and Methods
eQTL data:
Previously, eQTLGen consortium has investigated the
genetic architecture of blood gene expression by incorporating eQTL data from
37 datasets, compromising a total of 31,684 blood samples.[5] After processing eQTL data (P<5e-8)
from this database, I found trans-eQTLs for 3,628 genes, and cis-eQTLs (P<5e-8)
for 15,786 genes (a total of 16,259 genes).
To understand the distribution of eQTLs and account
for the linkage disequilibrium (LD) between them for downstream analyses. I
generated a list of independent (r2<0.05) eQTLs per gene using
the clump algorithm implemented in PLINK (v.1.9)[6].
In summary, the algorithm takes a list of eQTLs and their P-values, conducts LD
pruning, and returns a list of eQTLs in linkage equilibrium and prioritized by
P-values. The clump algorithm requires access to a genotype panel to compute LD
values. For this purpose, I used a subset of genotype data from the 1000
genomes (phase 3), compromising 503 individuals of European ancestry.
Following the LD pruning, the phenotypic variance (, proportion of variation in a gene expression)
attributed to an eQTL was calculated, as previously described[7] using the equation:
Where is the frequency of effect allele and is its regression coefficient derived from the
association model. eQTLGen consortium reported Z-scores instead of regression
coefficients. As such, a conversion was made using the equation[8]:
To understand the distribution of eQTLs with regard
to genes, the ANNOVAR software (version June 2020)[9]
was used to annotate eQTLs.
Finding genes that mediate trans effects:
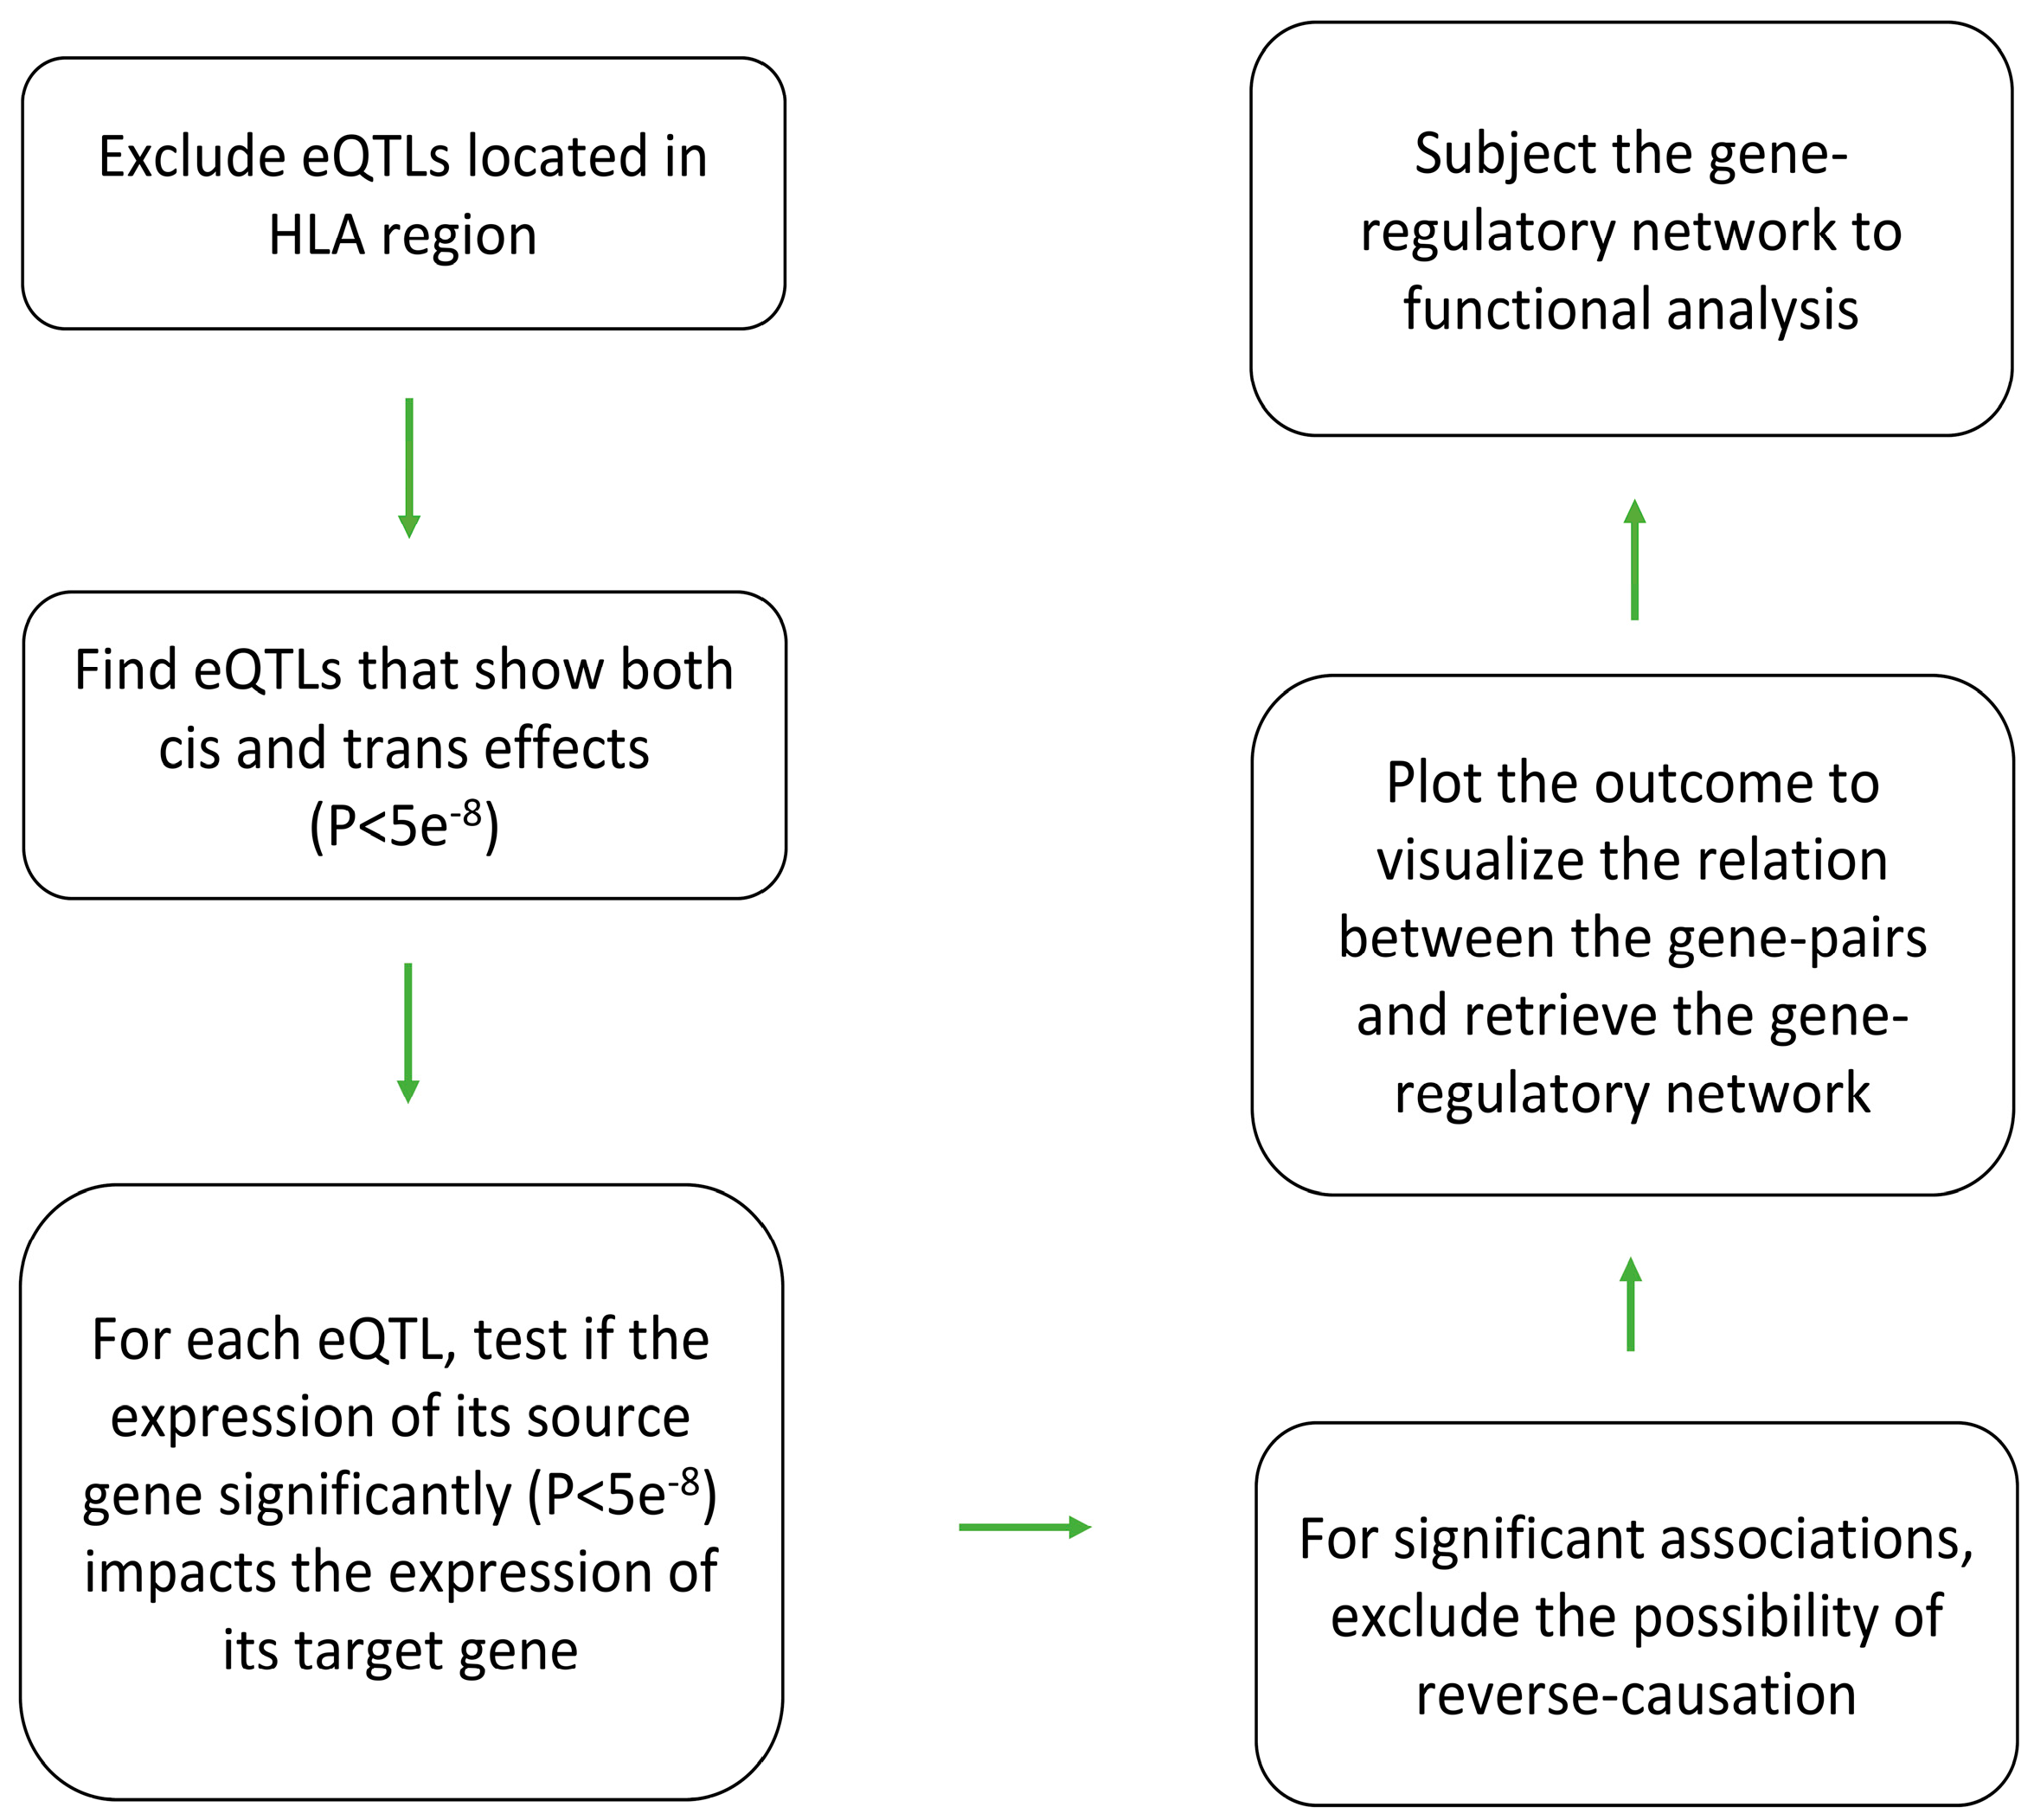
I used the procedure outlined in Figure 1 to
identify gene(s) through which a trans-eQTL exerts its impact. Initially,
trans-eQTLs that mapped to the HLA region (coordinates:
chr6:28,477,797-33,448,354, based on GRCh37) were removed. This is due to the complex
linkage disequilibrium structure of the HLA region and the bias it may
introduce in the results. Then trans-eQTLs and cis-eQTLs were matched to find
eQTLs that show both cis and trans regulatory effects. Next, I used the GSMR
software(version 1.1.1) [10] to examine the
association between the gene linked to the cis-effect (source gene) and the
gene linked to the trans-effect (target gene) using Mendelian randomization. For
gene pairs that show significant association (P<5e-8), I then
swapped the place of the source gene and the target gene and re-examined the
association to exclude the possibility of reverse causation. Mendelian
randomization (MR) is a statistical method that can investigate the relation
between two biological entities by assessing the nature of their associations
to the same set of reference SNPs. To prevent bias, SNPs that are chosen for MR
analysis must pass a number of criteria. First, they must not be in linkage
equilibrium, therefore I excluded SNPs that the LD among them exceeds r2<0.05
(based on genotype data available from the 1000 genomes on subjects of European
ancestry). Second, they must not show a pleiotropic effect (i.e., source gene ←
SNP → target gene). Such SNPs were excluded from the instrument using the HEIDI
test (P<0.01) implemented in the GSMR software. Third, they must be
significantly associated with the exposure (source gene). For this purpose,
SNPs that were associated with the source gene at GWAS significance level
(P<5e-8) were selected.
Following MR analysis, gene pairs that showed
significant evidence of association (P<5e-8) were selected and
plotted using the Cytoscape software (version 3.10.1)[11] in order to find if they form a network. DAVID
functional tool (version 2023q4)[12,13] was
used to identify biological processes that are overrepresented among the
identified genes.
Figure 1.
eQTL-based analytical pipeline that was used to identify and characterize gene-regulatory networks in blood. Initially, eQTLs that mapped to the HLA region were excluded due to the complex LD structure of this region and a possible impact it may have on the results. Then, eQTLs (P<5e-8) that display both trans and cis effects were selected. Next, Mendelian randomization was used to examine if change in the expression of the source gene (associated with the cis effect) impacts (P<5e-8) the expression of the target gene (associated with the trans effect). Reverse MR was also conducted by swapping the places of the source and the target gene in the equation to rule out the possibility of bi-directional association. The source-target gene pairs obtained from this step, then were plotted to view the nature of relation between them. Functional analysis was also performed to search for enrichment of biological processes among the identified genes.
3. Results
General characteristics of trans-eQTLs:
In the eQTLGen consortium, the authors reported
trans-eQTLs (P<5e-8) for 3,628 genes. After taking the linkage
disequilibrium among SNPs into account and conducting the clumping analysis, a
total of 9,882 independent trans-eQTLs were identified (Table S1). On
average, a trans-eQTL explained 0.4% of variation in the expression of a gene
which was lower than the value I computed for a cis- eQTL (1%). By annotating
the trans-eQTLs, I noted the majority are located in genic regions (73%,
N=7,207). This suggests the likely mechanism through which a trans-eQTL acts is
by changing the expression of a gene which in turn impacts the expression of
the target gene.
A number of trans-eQTLs had large impacts on
expression of genes (Table S1). For example, rs1427407-T within BCL11A
gene on chromosome 2, explained 12% of variation in expression of the gamma
globin gene (HBG1); furthermore, rs9399137-C within the intergenic
region of HBS1L-MYB on chromosome 6 explained 14% of variation in
expression of HBG1. These findings are in line with previously published
results indicating trans acting loci on chromosomes 6 and 2 impact the
expression of HBG1.[14]
ARHGEF3 locus is reported to impact platelet
activation. Here, I found rs1354034-T within this gene contributes to
this effect by impacting the expression levels of several genes involved in
cellular adhesion including ITGB3, PPBP, PARVB, ITGA2B,
SH3BGRL2, MMRN1, and CALD1. Additional examples of
trans-eQTLs with large impact are available from Table S1.
While majority of genes were associated with a few
number of trans-eQTLs, I noted a number of genes are associated with numerous
loci, indicating they have a polygenic mode of inheritance. For example, HBM
(hemoglobin subunit mu), CLEC1B (calcium-dependent lectin domain family
1 member B), MYL9 (myosin light chain 9), and ABCC3 (ATP binding
cassette subfamily C member 3), were under the regulatory impact of more than
20 independent trans-eQTLs (P<5e-8) spread across the genome (Figure
S1).
Identifying the source genes:
I used the analytical pipeline described in Figure 1 to identify source gene(s) through which a trans-eQTL acts. Initially, I
searched for eQTLs (P<5e-8) that display both trans and cis
effects. Next, Mendelian randomization was used to examine if change in the
expression of the source gene impacts the expression of the target gene.
Reverse MR was also conducted by swapping the places of the source and the
target gene in the equation to rule out the possibility of bi-directional
association.
Following this procedure, I identified a total of 169 genes that exerted the trans-regulatory impact (P<5e-8) on
692 genes (Table S2). The source-target gene pairs obtained from this
step, then were plotted to view the nature of relation between them. Figure
2 provides an overview of the interactions between the identified gene
pairs. 90% of genes (N=749) aggregated into a network. The outcome of gene
ontology enrichment analysis highlighted overrepresentation of hemo-immune
processes among genes of the network (Table 1).
Figure 2.
Overview of gene-pairs identified in this study and the nature of associations among them. Mendelian randomization revealed a total of 169 genes that exerted trans-regulatory impacts on 692 genes. Majority of gene pairs aggregated into a network with the scale free topology. An edge with an arrow end indicates as the expression of the source gene increases, the expression of the target gene increases as well; whereas, an edge with a T end indicates an inverse association. Summary association statistics detailing the nature of association between gene pairs are provided in Table S2.
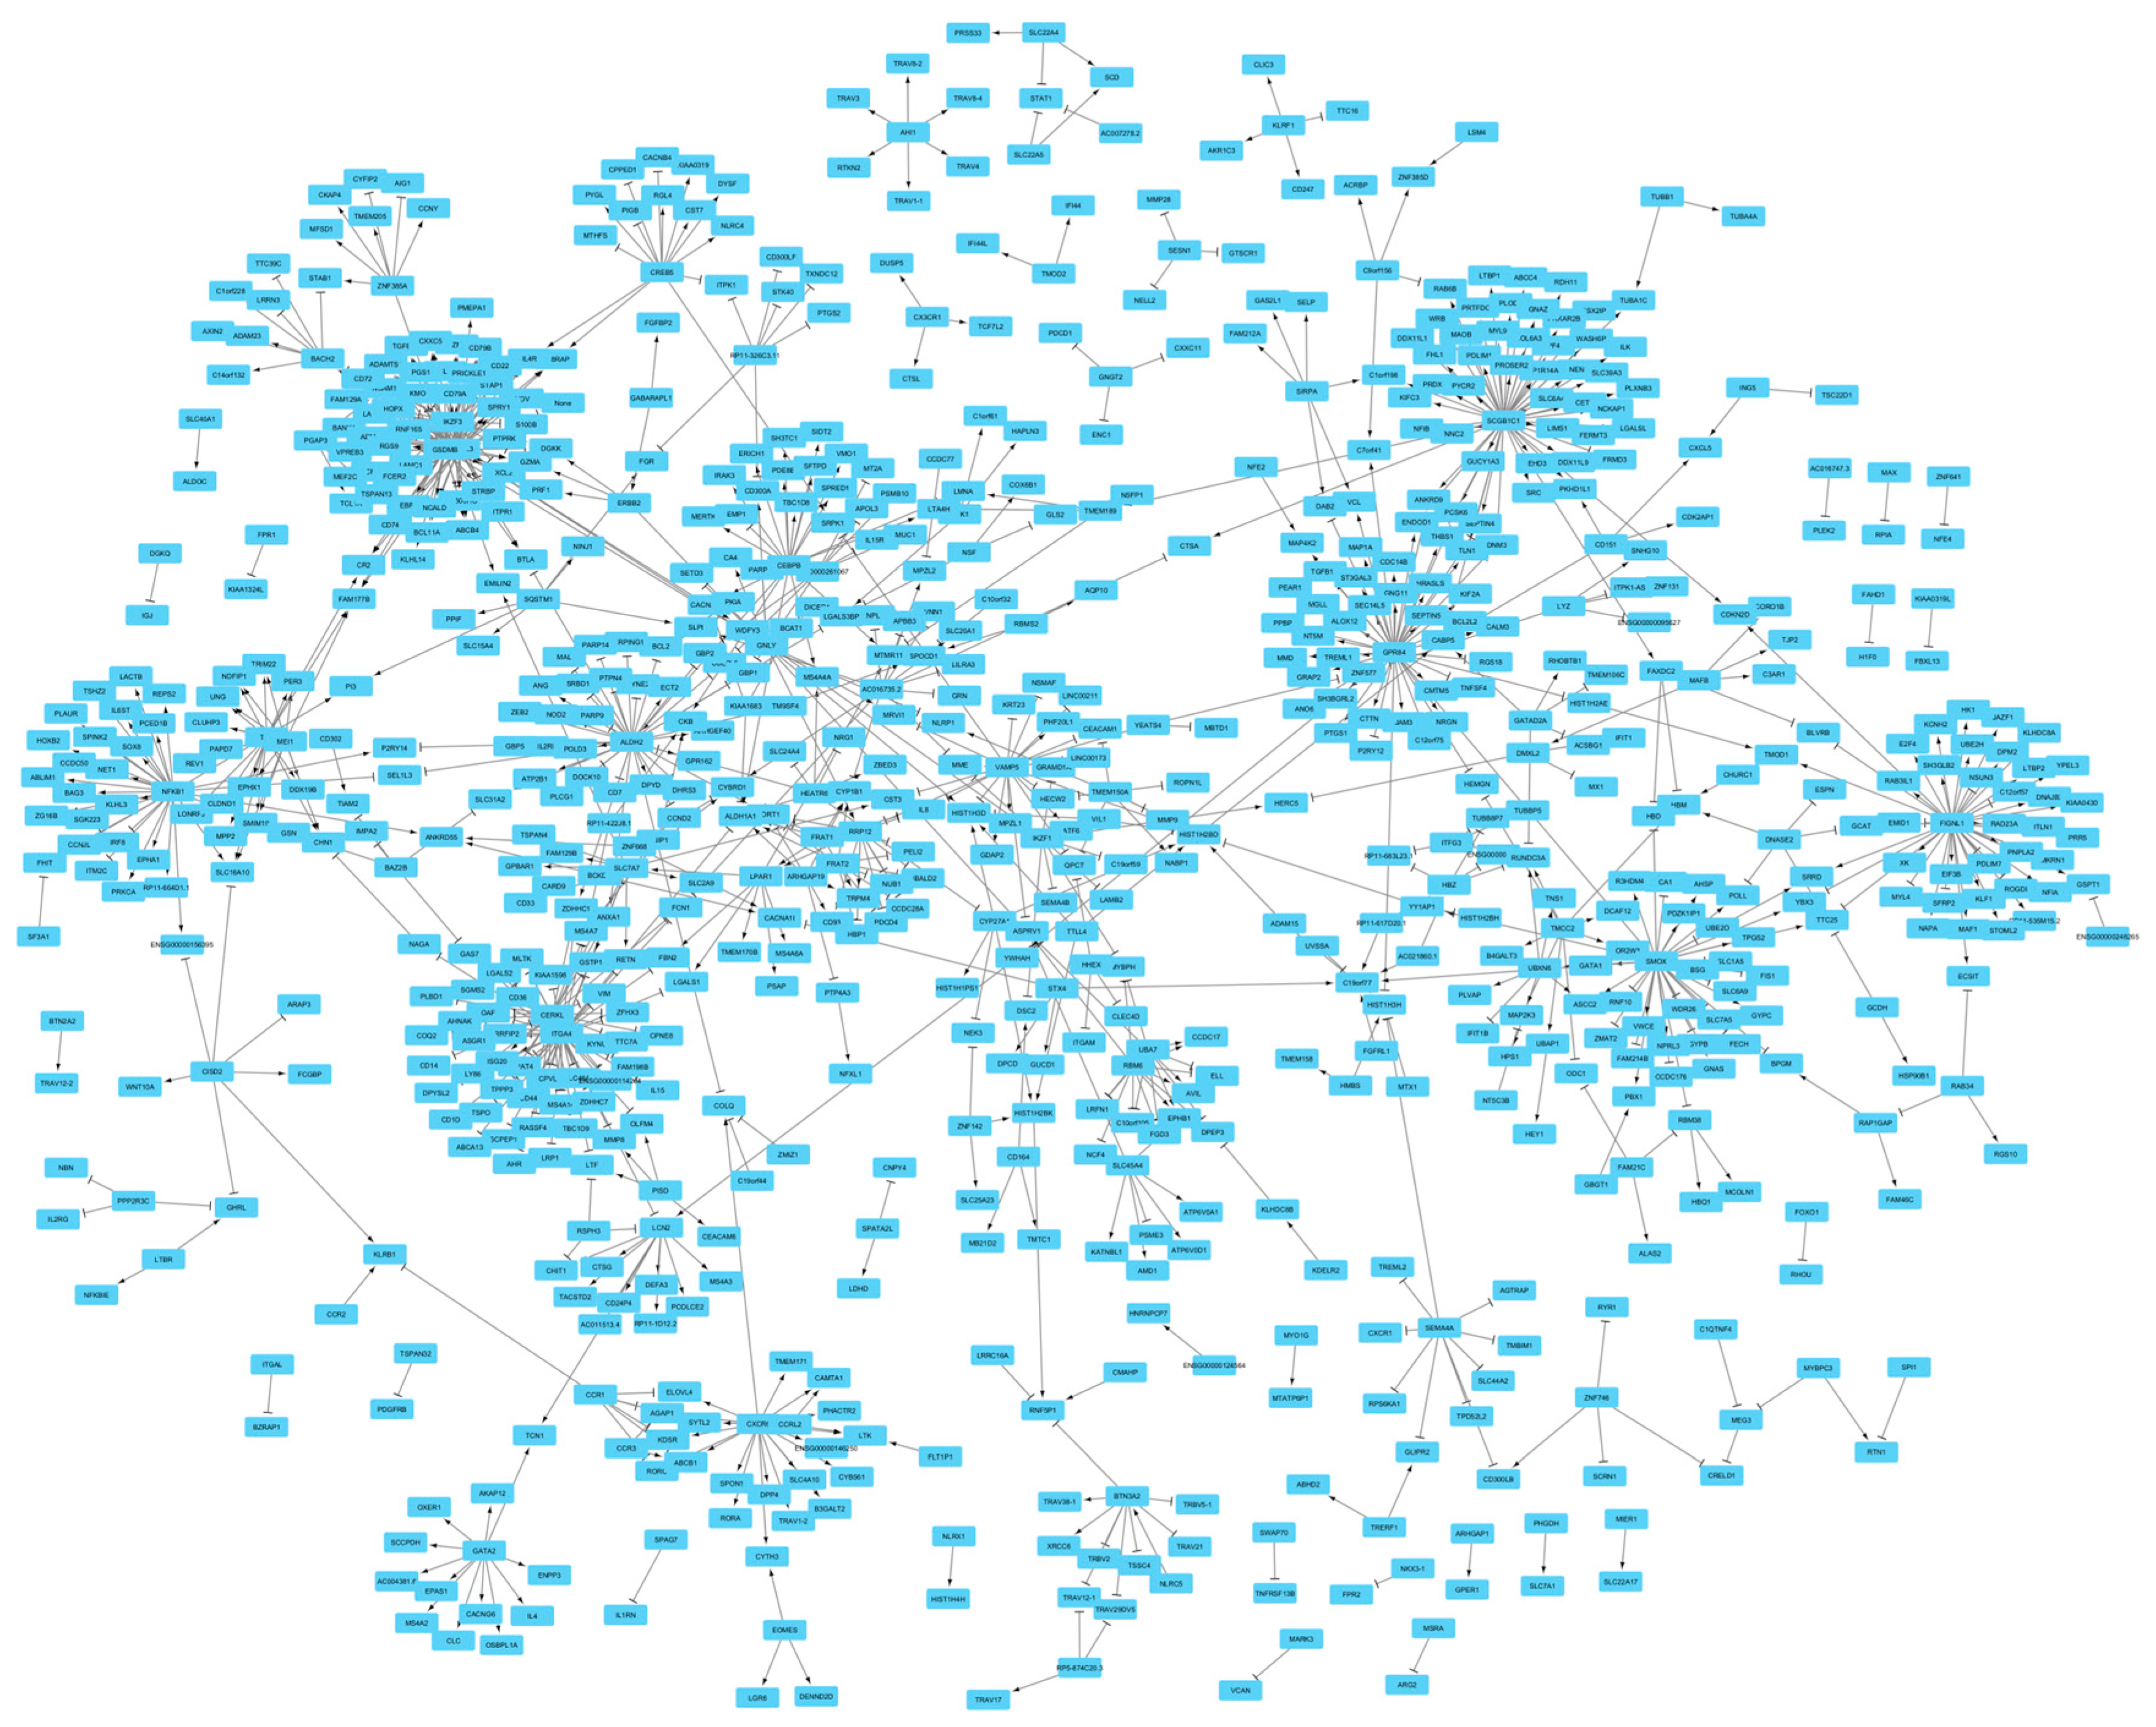

Table 1.
Biological processes that are overrepresented in genes of the main network.
| GO Term | Description | Fold Enrichment | P | Corrected P* |
| 0071222 | Cellular response to lipopolysaccharide | 4.5 | 3.1e-11 | 1.1e-7 |
| 0006955 | Immune response | 2.5 | 1.3e-7 | 4.6e-4 |
| 0006954 | Inflammatory response | 2.5 | 8.9e-7 | 0.003 |
| 0007155 | Cell adhesion | 2.2 | 2.0e-6 | 0.007 |
| 0070527 | Platelet aggregation | 6.5 | 5.7e-6 | 0.02 |
| 0098609 | Cell-cell adhesion | 3.2 | 1.2e-5 | 0.04 |
| 0019722 | Calcium-mediated signaling | 4.5 | 1.3e-5 | 0.05 |
* P-values corrected for multiple testing.
To examine the validity of the results, a simulation step was also undertaken by generating 1000 random genesets that had similar size to the network (N=749 genes). I then searched for biological processes that are significantly associated with each geneset using gprofiler2[15] that allows systematic search for enriched GO-biological processes through its R package (version 0.2.2). The outcome of the analyses was mainly null and revealed a few unrelated biological processes (Table S3).
As depicted in Figure 2, the main network displayed a scale-free topology. Distribution of the nodes by the frequency of their edges also indicated a power law distribution (Figure S2). 88% of the nodes had in average 1.5 edges while a group of 10 nodes (SCGB1C1, ORMDL3, GSDMB, ITGA4, GPR84, FIGNL1, ALDH2, SMOX, CERKL, and NFKB1) had more than 30 edges (accounted for 22% of interactions in the network). In a scale free network targeting the hub nodes are key in regulating the function of the network. As such, I investigated the association of the identified hub genes with the phenome. The analysis revealed ORMDL3, and GSDMB on chromosome band 17q21 are associated with several diseases of immune origin. Both genes appeared to be co-expressed as their underpinning eQTLs display correlated effect sizes (Figure S3). Mendelian randomization then revealed higher expression of these genes contribute to higher risks of allergic disease, asthma, atrial fibrillation but lower risks of primary biliary cholangitis, inflammatory bowel disease, rheumatoid arthritis and lower levels of HDL (Table 2). Furthermore, I noted an association between ALDH2 and obesity related traits. The outcome of Mendelian randomization revealed higher expression of ALDH2 contributes to higher risk of obesity (Table S4).
Table 2.
Higher expression of GSDMB and ORMDL3 impact several diseases of polygenic nature.
| Trait information | GSDMB expression | ORMDL3 expression | |||||
| Name | PMID | B | SE | P | B | SE | P |
| Asthma | 32296059 | 0.11 | 0.01 | 3.10E-71 | 0.13 | 0.01 | 1.40E-67 |
| Allergic disease | 29083406 | 0.07 | 0.01 | 2.70E-29 | 0.07 | 0.01 | 1.60E-27 |
| Atrial fibrillation | 30061737 | 0.04 | 0.01 | 1.30E-10 | 0.05 | 0.01 | 8.90E-11 |
| Type 1 diabetes | 25751624 | -0.13 | 0.02 | 6.20E-10 | -0.15 | 0.02 | 5.60E-10 |
| Rheumatoid arthritis | 24390342 | -0.09 | 0.02 | 1.10E-08 | -0.11 | 0.02 | 1.20E-08 |
| Primary biliary cirrhosis | 26394269 | -0.23 | 0.04 | 1.90E-10 | -0.28 | 0.04 | 1.20E-11 |
| HDL cholesterol | 32203549 | -0.02 | 0.002 | 1.00E-33 | -0.03 | 0.002 | 1.50E-36 |
| Ulcerative colitis | 26192919 | -0.13 | 0.01 | 5.70E-21 | -0.15 | 0.02 | 1.00E-20 |
| Crohn's disease | 26192919 | -0.12 | 0.01 | 8.20E-20 | -0.14 | 0.02 | 1.10E-19 |
4. Discussion
Gene regulatory network (GRN) enables a cell to specialize in carrying out its function. There are various cell types in the body and identification of their GRNs are important for various biological purposes including to better diagnose and treat diseases. There are currently several approaches that can investigate such networks by analyzing the raw data available at individual levels. This hinders the possibility of collaboration among researchers in order to combine their data, to map gene-regulatory networks with higher statistical power. Furthermore, the differences in clinical settings of cohorts could impact the expression of genes and as such the inferences at the network level. Advances in GWAS studies have provided standard methods in cataloging SNPs underpinning a biological feature (i.e. a trait or a functional element); furthermore, the methods developed through GWAS studies allow eliminating systematic disturbances from non-genetics resources. Building upon these progresses, in this study, I provided a workflow that can be used to infer the GRNs specific to a tissue or a cell type. By applying the workflow to eQTL data for blood, I detected gene pairs that aggregated into a gene-regulatory network. Examining the function of the network revealed it is associated with hemo-immune processes.
The topology of the network resembles the properties of a scale free network[16]. A core of 10 genes (1.3% of nodes) accounted for 22% of the interactions and the distribution of interactions per gene followed a power law distribution. If this happens to be the case in other cell types then this provides a convenient path for therapeutic interventions, because a scale free network is manageable by targeting its hub genes.
On average a trans-eQTL explained 0.4% of variation in expression of a gene which is in line with previous findings. Therefore, studies that aim to identify GRNs using trans-eQTLs, should obtain their eQTL data from studies with large sample sizes. For a well-powered analysis (statistical power>80%), the eQTL data (with P<5e-8) should come from a study with a sample size ≥ 11,000 individuals.
eQTL studies tend to report significant findings only, however, to fairly examine the association between two genes, access to full GWAS summary statistics data is required. This is important considering there are genes under the influence of numerous loci (Figure S1). Although, in the past publishing the full GWAS summary statistics was not feasible due to computational limits. Such a practice should not be a concern at present.
By examining the association of the network’s hub genes with the phenome. I found GSDMB and ORMDL3 impact several diseases of immune origin. Higher expression of these genes contributed to higher risks of allergic disease, asthma, atrial fibrillation but lower risks of primary biliary cholangitis, inflammatory bowel disease, rheumatoid arthritis and lower levels of HDL. This finding indicates therapeutic approaches that aim to change the expression of these genes, should find an optimal threshold that balances the antagonistic peliotropic effect of these genes. Otherwise, side effects are expected.
ORMDL3 is localized to the endoplasmic reticulum and regulates downstream pathways including sphingolipids, metalloproteases, remodeling genes, and chemokines. GSDMB encodes gasdermin B, a member of gasdermin domain containing proteins which are involved in different processes associated with cellular state, such as cell cycle control, differentiation, and apoptosis.[17] The analyses revealed higher expression of these genes have concordant effects on several disorders of immune origin. Therefore, they may act through the same molecular pathway to impact diseases of immune origin. In this regard, inflammation is notable because ORMDL3 is involved in the development of the unfolded protein response, which triggers an inflammatory response including the formation of gasdermin pores on cellular wall and pyroptosis.
I also found an association between ALDH2 and the risk of obesity. Higher expression of ALDH2 contributed to higher risk of obesity. Several mechanisms have been suggested in this regard including the impact of ALDH2 on alcohol use behavior and subsequent changes on energy intake, appetite control, systemic inflammation, hormone levels, etc., as well as, the impact of ALDH2 on oxidizing the endogenous acetaldehyde during the oxidative stress.[18]
In summary, in this study, I provided a workflow to identify gene-regulatory networks in a tissue by leveraging publicly available eQTL data and considering trans-eQTLs as reference points. The identified network showed a scale-free topology suggesting the hub genes of a GRN could be targeted to prevent the disease outcomes.
Supplementary Materials
The following supporting information can be downloaded at: Preprints.org, Figure S1: Manhattan plots summarizing distribution of eQTLs; Figure S2: The distribution of edges per node in the network show power law distribution; Figure S3. GSDMB and ORMDL3 are correlated with regard to their eQTLs; Table S1: Characterization of independent trans-eQTLs (r2<0.05) used in this study; Table S2: Gene pairs identified through Mendelian randomization and the nature of association between them; Table S3: The outcome of simulation analysis based on 1000 randomly generated genesets; Table S4: Higher expression of ALDH2 is associated with higher risk of obesity.
Funding
This research received no external funding.
Institutional Review Board Statement
Not applicable
Informed Consent Statement
Not applicable
Data Availability Statement
eQTL summary association statistics were obtained from the eQTLGen consortium (https://www.eqtlgen.org/phase1.html). 1000 Genomes genotype data (phase 3) was obtained from https://www.cog-genomics.org/plink/2.0/resources#phase3_1kg.
Acknowledgments
This research work was enabled in part by computational resources and support provided by the Compute Ontario and the Digital Research Alliance of Canada.
Conflicts of Interest
The author declares no conflict of interest.
References
- Consortium, G. The GTEx Consortium atlas of genetic regulatory effects across human tissues. Science 2020, 369, 1318–1330. [Google Scholar] [CrossRef] [PubMed]
- Price, A.L.; Helgason, A.; Thorleifsson, G.; McCarroll, S.A.; Kong, A.; Stefansson, K. Single-tissue and cross-tissue heritability of gene expression via identity-by-descent in related or unrelated individuals. PLoS genetics 2011, 7, e1001317. [Google Scholar] [CrossRef] [PubMed]
- Nica, A.C.; Dermitzakis, E.T. Expression quantitative trait loci: present and future. Philosophical Transactions of the Royal Society B: Biological Sciences 2013, 368, 20120362. [Google Scholar] [CrossRef] [PubMed]
- Badia-i-Mompel, P.; Wessels, L.; Müller-Dott, S.; Trimbour, R.; Ramirez Flores, R.O.; Argelaguet, R.; Saez-Rodriguez, J. Gene regulatory network inference in the era of single-cell multi-omics. Nature Reviews Genetics 2023, 1–16. [Google Scholar] [CrossRef] [PubMed]
- Võsa, U.; Claringbould, A.; Westra, H.-J.; Bonder, M.J.; Deelen, P.; Zeng, B.; Kirsten, H.; Saha, A.; Kreuzhuber, R.; Yazar, S.; et al. Large-scale cis- and trans-eQTL analyses identify thousands of genetic loci and polygenic scores that regulate blood gene expression. Nature genetics 2021, 53, 1300–1310. [Google Scholar] [CrossRef] [PubMed]
- Chang, C.C.; Chow, C.C.; Tellier, L.C.; Vattikuti, S.; Purcell, S.M.; Lee, J.J. Second-generation PLINK: rising to the challenge of larger and richer datasets. GigaScience 2015, 4. [Google Scholar] [CrossRef] [PubMed]
- Park, J.-H.; Wacholder, S.; Gail, M.H.; Peters, U.; Jacobs, K.B.; Chanock, S.J.; Chatterjee, N. Estimation of effect size distribution from genome-wide association studies and implications for future discoveries. Nature genetics 2010, 42, 570–575. [Google Scholar] [CrossRef] [PubMed]
- Zhu, Z.; Zhang, F.; Hu, H.; Bakshi, A.; Robinson, M.R.; Powell, J.E.; Montgomery, G.W.; Goddard, M.E.; Wray, N.R.; Visscher, P.M.; et al. Integration of summary data from GWAS and eQTL studies predicts complex trait gene targets. Nature genetics 2016, 48, 481–487. [Google Scholar] [CrossRef] [PubMed]
- Wang, K.; Li, M.; Hakonarson, H. ANNOVAR: functional annotation of genetic variants from high-throughput sequencing data. Nucleic Acids Research 2010, 38, e164–e164. [Google Scholar] [CrossRef] [PubMed]
- Zhu, Z.; Zheng, Z.; Zhang, F.; Wu, Y.; Trzaskowski, M.; Maier, R.; Robinson, M.R.; McGrath, J.J.; Visscher, P.M.; Wray, N.R.; et al. Causal associations between risk factors and common diseases inferred from GWAS summary data. Nature communications 2018, 9, 224. [Google Scholar] [CrossRef] [PubMed]
- Shannon, P.; Markiel, A.; Ozier, O.; Baliga, N.S.; Wang, J.T.; Ramage, D.; Amin, N.; Schwikowski, B.; Ideker, T. Cytoscape: a software environment for integrated models of biomolecular interaction networks. Genome research 2003, 13, 2498–2504. [Google Scholar] [CrossRef]
- Huang, D.W.; Sherman, B.T.; Lempicki, R.A. Systematic and integrative analysis of large gene lists using DAVID bioinformatics resources. Nature protocols 2009, 4, 44–57. [Google Scholar] [CrossRef]
- Huang, D.W.; Sherman, B.T.; Lempicki, R.A. Bioinformatics enrichment tools: paths toward the comprehensive functional analysis of large gene lists. Nucleic Acids Research 2009, 37, 1–13. [Google Scholar] [CrossRef] [PubMed]
- Lettre, G.; Sankaran, V.G.; Bezerra, M.A.C.; Araújo, A.S.; Uda, M.; Sanna, S.; Cao, A.; Schlessinger, D.; Costa, F.F.; Hirschhorn, J.N.; et al. DNA polymorphisms at the BCL11A, HBS1L-MYB, and beta-globin loci associate with fetal hemoglobin levels and pain crises in sickle cell disease. Proceedings of the National Academy of Sciences 2008, 105, 11869–11874. [Google Scholar] [CrossRef] [PubMed]
- Kolberg, L.; Raudvere, U.; Kuzmin, I.; Adler, P.; Vilo, J.; Peterson, H. g:Profiler—interoperable web service for functional enrichment analysis and gene identifier mapping (2023 update). Nucleic Acids Research 2023, 51, W207–W212. [Google Scholar] [CrossRef] [PubMed]
- Barabási, A.-L.; Albert, R. Emergence of scaling in random networks. Science 1999, 286, 509–512. [Google Scholar] [CrossRef] [PubMed]
- Das, S.; Miller, M.; Broide, D.H. Chapter One - Chromosome 17q21 Genes ORMDL3 and GSDMB in Asthma and Immune Diseases. In Advances in Immunology, Alt, F.W., Ed.; Academic Press: 2017; Volume 135, pp. 1-52. [CrossRef]
- Hu, C. Aldehyde dehydrogenases genetic polymorphism and obesity: from genomics to behavior and health. Aldehyde Dehydrogenases: From Alcohol Metabolism to Human Health and Precision Medicine 2019, 135–154. [Google Scholar] [CrossRef]
Disclaimer/Publisher’s Note: The statements, opinions and data contained in all publications are solely those of the individual author(s) and contributor(s) and not of MDPI and/or the editor(s). MDPI and/or the editor(s) disclaim responsibility for any in-jury to people or property resulting from any ideas, methods, instructions or products referred to in the content. |
© 2024 by the authors. Licensee MDPI, Basel, Switzerland. This article is an open access article distributed under the terms and conditions of the Creative Commons Attribution (CC BY) license (http://creativecommons.org/licenses/by/4.0/).
Copyright: This open access article is published under a Creative Commons CC BY 4.0 license, which permit the free download, distribution, and reuse, provided that the author and preprint are cited in any reuse.


