Submitted:
03 January 2024
Posted:
04 January 2024
You are already at the latest version
Abstract
Keywords:
1. Introduction
2. Results
2.1. IbEXP gene identification and characterization in sweetpotato
2.2. Phylogenetic relationship of IbEXPs in sweetpotato
2.3. Chromosome localization of sweetpatato IbEXP genes
2.4. Collinearity analysis of sweetpatato IbEXP proteins
2.5. Collinearity analysis of EXP genes between sweetpatato and other plants
2.6. Motif, conserved domain and gene structure analysis of IbEXPs
2.7. Cis-element prediction in IbEXPs promoter regions
2.8. Transcriptome-wide identification of IbEXPs genes associated with tuberous root development and their expression profiles in different tissues
2.9. Expression pattern analysisis of IbEXPs genes under multiple hormone treatment and abiotic stresses
3. Discussion
3.1. Characterization of IbEXPs in sweetpotato
3.2. Evolutionary relationship and collinearity analysis of IbEXPs in sweetpotato
3.3. Expression patterns and functional prediction of IbANCs in sweetpotato
4. Conclusion
5. Materials and Methods
5.1. Identification of IbEXPs genes in sweetpotato
5.2. Sequence alignment and phylogenetic analysis of EXP proteins
5.3. Analysis of motif pattern, conserved domain and protein property of IbEXPs
5.4. Chromosomal location and collinearity analysis of IbEXPs
5.5. Plant materials and treatments of abiotic stresses and hormones
5.6. RNA extraction and qRT-PCR analysis
5.7. Statistical analyses
Supplementary Materials
Author Contributions
Funding
Institutional Review Board Statement
Informed Consent Statement
Data Availability Statement
Conflicts of Interest
References
- Cosgrove, D. J. Growth of the plant cell wall. Nature Reviews Molecular Cell Biology 2005, 6, 850–861. [Google Scholar] [CrossRef] [PubMed]
- Cosgrove, D. J. Plant cell wall extensibility: connecting plant cell growth with cell wall structure, mechanics, and the action of wall-modifying enzymes. Journal of Experimental Botany 2015, 67, 463–476. [Google Scholar] [CrossRef] [PubMed]
- Höfte, H.; Voxeur, A. Plant cell walls. Current Biology 2017, 27, R865–R870. [Google Scholar] [CrossRef] [PubMed]
- Santiago, T. R.; Pereira, V. M.; de Souza, W. R.; Steindorff, A. S.; Cunha, B. A. D. B.; Gaspar, M.; Fávaro, L. C. L.; Formighieri, E. F.; Kobayashi, A. K.; Molinari, H. B. C. Genome-wide identification, characterization and expression profile analysis of expansins gene family in sugarcane (Saccharum spp.). PLOS ONE 2018, 13, e0191081. [Google Scholar]
- Zhang, B.; Gao, Y.; Zhang, L.; Zhou, Y. The plant cell wall: Biosynthesis, construction, and functions. Journal of Integrative Plant Biology 2021, 63, 251–272. [Google Scholar] [CrossRef] [PubMed]
- Lin, C.; Choi, H.-S.; Cho, H.-T. Root Hair-Specific EXPANSIN A7 Is Required For Root Hair Elongation in Arabidopsis. Molecules and cells 2011, 31, 393–397. [Google Scholar] [CrossRef] [PubMed]
- Cosgrove, D. J. Plant expansins: diversity and interactions with plant cell walls. Current Opinion in Plant Biology 2015, 25, 162–172. [Google Scholar] [CrossRef] [PubMed]
- Yang, Z.; Zheng, J.; Zhou, H.; Chen, S.; Gao, Z.; Yang, Y.; Li, X.; Liao, H. The soybean β-expansin gene GmINS1 contributes to nodule development in response to phosphate starvation. Physiologia Plantarum 2021, 172, 2034–2047. [Google Scholar] [CrossRef]
- Cosgrove, D. J. Loosening of plant cell walls by expansins. Nature 2000, 407, 321. [Google Scholar] [CrossRef]
- Marowa, P.; Ding, A.; Kong, Y. Expansins: roles in plant growth and potential applications in crop improvement. Plant Cell Reports 2016, 35, 949–965. [Google Scholar] [CrossRef] [PubMed]
- McQueen-Mason, S. J.; Cosgrove, D. J. Expansin Mode of Action on Cell Walls (Analysis of Wall Hydrolysis, Stress Relaxation, and Binding). Plant Physiology 1995, 107, 87–100. [Google Scholar] [CrossRef] [PubMed]
- Yennawar, N. H.; Li, L.-C.; Dudzinski, D. M.; Tabuchi, A.; Cosgrove, D. J. Crystal structure and activities of EXPB1 (Zea m 1), a β-expansin and group-1 pollen allergen from maize. Proceedings of the National Academy of Sciences 2006, 103, 14664–14671. [Google Scholar] [CrossRef] [PubMed]
- Jin, K.-M.; Zhuo, R.-Y.; Xu, D.; Wang, Y.-J.; Fan, H.-J.; Huang, B.-Y.; Qiao, G.-R. Genome-Wide Identification of the Expansin Gene Family and Its Potential Association with Drought Stress in Moso Bamboo. International Journal of Molecular Sciences 2020, 21, 9491. [Google Scholar] [CrossRef] [PubMed]
- Georgelis, N.; Yennawar, N. H.; Cosgrove, D. J. Structural basis for entropy-driven cellulose binding by a type-A cellulose-binding module (CBM) and bacterial expansin. Proceedings of the National Academy of Sciences 2012, 109, 14830–14835. [Google Scholar] [CrossRef] [PubMed]
- Sampedro, J.; Cosgrove, D. J. The expansin superfamily. Genome biology 2005, 6, 242.1–242.11. [Google Scholar] [CrossRef] [PubMed]
- Kende, H.; Bradford, K.; Brummell, D.; Cho, H.-T.; Cosgrove, D.; Fleming, A.; Gehring, C.; Lee, Y.; McQueen-Mason, S.; Rose, J. Nomenclature for members of the expansin superfamily of genes and proteins. Plant Molecular Biology 2004, 55, 311–314. [Google Scholar] [CrossRef] [PubMed]
- Zhang, B.; Chang, L.; Sun, W.; Ullah, A.; Yang, X. Overexpression of an expansin-like gene, GhEXLB2 enhanced drought tolerance in cotton. Plant Physiology and Biochemistry 2021, 162, 468–475. [Google Scholar] [CrossRef] [PubMed]
- Kong, Y.; Wang, B.; Du, H.; Li, W.; Li, X.; Zhang, C. GmEXLB1, a Soybean Expansin-Like B Gene, Alters Root Architecture to Improve Phosphorus Acquisition in Arabidopsis. Frontiers in Plant Science 2019, 10, 808. [Google Scholar] [CrossRef]
- Boron, A. K.; Van Loock, B.; Suslov, D.; Markakis, M. N.; Verbelen, J.-P.; Vissenberg, K. Over-expression of AtEXLA2 alters etiolated arabidopsis hypocotyl growth. Annals of Botany 2014, 115, 67–80. [Google Scholar] [CrossRef] [PubMed]
- Choi, D.; Cho, H.-T.; Lee, Y. Expansins: expanding importance in plant growth and development. Physiologia Plantarum 2006, 126, 511–518. [Google Scholar] [CrossRef]
- Li, Y.; Jones, L.; McQueen-Mason, S. Expansins and cell growth. Current Opinion in Plant Biology 2003, 6, 603–610. [Google Scholar] [CrossRef]
- Choi, D.; Kim, J. H.; Lee, Y. Expansins in Plant Development. In Advances in Botanical Research; Academic Press, 2008; Vol. 47, pp. 47–97. [Google Scholar]
- Ashwin Narayan, J.; Chakravarthi, M.; Nerkar, G.; Manoj, V. M.; Dharshini, S.; Subramonian, N.; Premachandran, M. N.; Arun Kumar, R.; Krishna Surendar, K.; Hemaprabha, G.; Ram, B.; Appunu, C. Overexpression of expansin EaEXPA1, a cell wall loosening protein enhances drought tolerance in sugarcane. Industrial Crops and Products 2021, 159, 113035. [Google Scholar] [CrossRef]
- McQueen-Mason, S.; Durachko, D. M.; Cosgrove, D. J. Two endogenous proteins that induce cell wall extension in plants. The Plant Cell 1992, 4, 1425–1433. [Google Scholar] [PubMed]
- Dong, B.; Wang, Q.; Zhou, D.; Wang, Y.; Miao, Y.; Zhong, S.; Fang, Q.; Yang, L.; Xiao, Z.; Zhao, H. Abiotic stress treatment reveals expansin like A gene OfEXLA1 improving salt and drought tolerance of Osmanthus fragrans by responding to abscisic acid. Horticultural Plant Journal 2023. [Google Scholar] [CrossRef]
- Brasileiro, A. C. M.; Lacorte, C.; Pereira, B. M.; Oliveira, T. N.; Ferreira, D. S.; Mota, A. P. Z.; Saraiva, M. A. P.; Araujo, A. C. G.; Silva, L. P.; Guimaraes, P. M. Ectopic expression of an expansin-like B gene from wild Arachis enhances tolerance to both abiotic and biotic stresses. The Plant Journal 2021, 107, 1681–1696. [Google Scholar] [CrossRef] [PubMed]
- Yang, J.; Zhang, G.; An, J.; Li, Q.; Chen, Y.; Zhao, X.; Wu, J.; Wang, Y.; Hao, Q.; Wang, W.; Wang, W. Expansin gene TaEXPA2 positively regulates drought tolerance in transgenic wheat (Triticum aestivum L.). Plant Science 2020, 298, 110596. [Google Scholar] [CrossRef] [PubMed]
- Chen, Y.; Ren, Y.; Zhang, G.; An, J.; Yang, J.; Wang, Y.; Wang, W. Overexpression of the wheat expansin gene TaEXPA2 improves oxidative stress tolerance in transgenic Arabidopsis plants. Plant Physiology and Biochemistry 2018, 124, 190–198. [Google Scholar] [CrossRef] [PubMed]
- Ren, Y.; Chen, Y.; An, J.; Zhao, Z.; Zhang, G.; Wang, Y.; Wang, W. Wheat expansin gene TaEXPA2 is involved in conferring plant tolerance to Cd toxicity. Plant Science 2018, 270, 245–256. [Google Scholar] [CrossRef] [PubMed]
- Chen, Y.; Han, Y.; Kong, X.; Kang, H.; Ren, Y.; Wang, W. Ectopic expression of wheat expansin gene TaEXPA2 improved the salt tolerance of transgenic tobacco by regulating Na+/K+ and antioxidant competence. Physiologia Plantarum 2017, 159, 161–177. [Google Scholar] [CrossRef] [PubMed]
- Liu, H.; Li, H.; Zhang, H.; Li, J.; Xie, B.; Xu, J. The expansin gene PttEXPA8 from poplar (Populus tomentosa) confers heat resistance in transgenic tobacco. Plant Cell, Tissue and Organ Culture (PCTOC) 2016, 126, 353–359. [Google Scholar] [CrossRef]
- Minoia, S.; Boualem, A.; Marcel, F.; Troadec, C.; Quemener, B.; Cellini, F.; Petrozza, A.; Vigouroux, J.; Lahaye, M.; Carriero, F.; Bendahmane, A. Induced mutations in tomato SlExp1 alter cell wall metabolism and delay fruit softening. Plant Science 2016, 242, 195–202. [Google Scholar] [CrossRef] [PubMed]
- Kaur, P.; Samuel, D. V. K.; Bansal, K. C. Fruit-specific Over-expression of LeEXP1 Gene in Tomato Alters Fruit Texture. Journal of Plant Biochemistry and Biotechnology 2010, 19, 177–183. [Google Scholar] [CrossRef]
- Chen, Y.-h.; Xie, B.; An, X.-h.; Ma, R.-p.; Zhao, D.-y.; Cheng, C.-g.; Li, E.-m.; Zhou, J.-t.; Kang, G.-d.; Zhang, Y.-z. Overexpression of the apple expansin-like gene MdEXLB1 accelerates the softening of fruit texture in tomato. Journal of Integrative Agriculture 2022, 21, 3578–3588. [Google Scholar] [CrossRef]
- Sane, V. A.; Chourasia, A.; Nath, P. Softening in mango (Mangifera indica cv. Dashehari) is correlated with the expression of an early ethylene responsive, ripening related expansin gene, MiExpA1. Postharvest Biology and Technology 2005, 38, 223–230. [Google Scholar] [CrossRef]
- Li, X.; Zhao, J.; Tan, Z.; Zeng, R.; Liao, H. GmEXPB2, a Cell Wall β-Expansin, Affects Soybean Nodulation through Modifying Root Architecture and Promoting Nodule Formation and Development. Plant Physiology 2015, 169, 2640–2653. [Google Scholar] [CrossRef] [PubMed]
- Zou, H.; Wenwen, Y.; Zang, G.; Kang, Z.; Zhang, Z.; Huang, J.; Wang, G. OsEXPB2, a β-expansin gene, is involved in rice root system architecture. Molecular Breeding 2015, 35, 41. [Google Scholar] [CrossRef]
- Guo, W.; Zhao, J.; Li, X.; Qin, L.; Yan, X.; Liao, H. A soybean β-expansin gene GmEXPB2 intrinsically involved in root system architecture responses to abiotic stresses. The Plant Journal 2011, 66, 541–552. [Google Scholar] [CrossRef]
- Wang, Y.; Ma, N.; Qiu, S.; Zou, H.; Zang, G.; Kang, Z.; Wang, G.; Huang, J. Regulation of the α-expansin gene OsEXPA8 expression affects root system architecture in transgenic rice plants. Molecular Breeding 2014, 34, 47–57. [Google Scholar] [CrossRef]
- Wang, L.; Wang, W.; Miao, Y.; Peters, M.; Schultze-Kraft, R.; Liu, G.; Chen, Z. Development of transgenic composite Stylosanthes plants to study root growth regulated by a β-expansin gene, SgEXPB1, under phosphorus deficiency. Plant Cell Reports 2023, 42, 575–585. [Google Scholar] [CrossRef] [PubMed]
- Che, J.; Yamaji, N.; Shen, R. F.; Ma, J. F. An Al-inducible expansin gene, OsEXPA10 is involved in root cell elongation of rice. The Plant Journal 2016, 88, 132–142. [Google Scholar] [CrossRef] [PubMed]
- Li, Y.; Tu, L.; Pettolino, F. A.; Ji, S.; Hao, J.; Yuan, D.; Deng, F.; Tan, J.; Hu, H.; Wang, Q.; Llewellyn, D. J.; Zhang, X. GbEXPATR, a species-specific expansin, enhances cotton fibre elongation through cell wall restructuring. Plant Biotechnology Journal 2016, 14, 951–963. [Google Scholar] [CrossRef] [PubMed]
- Ma, N.; Wang, Y.; Qiu, S.; Kang, Z.; Che, S.; Wang, G.; Huang, J. Overexpression of OsEXPA8, a Root-Specific Gene, Improves Rice Growth and Root System Architecture by Facilitating Cell Extension. PLOS ONE 2013, 8, e75997. [Google Scholar] [CrossRef] [PubMed]
- Pien, S.; Wyrzykowska, J.; McQueen-Mason, S.; Smart, C.; Fleming, A. Local expression of expansin induces the entire process of leaf development and modifies leaf shape. Proceedings of the National Academy of Sciences 2001, 98, 11812–11817. [Google Scholar] [CrossRef] [PubMed]
- Gray-Mitsumune, M.; Blomquist, K.; McQueen-Mason, S.; Teeri, T. T.; Sundberg, B.; Mellerowicz, E. J. Ectopic expression of a wood-abundant expansin PttEXPA1 promotes cell expansion in primary and secondary tissues in aspen. Plant Biotechnology Journal 2008, 6, 62–72. [Google Scholar] [CrossRef] [PubMed]
- Liu, W.; Xu, L.; Lin, H.; Cao, J. Two Expansin Genes, AtEXPA4 and AtEXPB5, Are Redundantly Required for Pollen Tube Growth and AtEXPA4 Is Involved in Primary Root Elongation in Arabidopsis thaliana. Genes 2021, 12, 249. [Google Scholar] [CrossRef] [PubMed]
- Choi, D.; Lee, Y.; Cho, H.-T.; Kende, H. Regulation of Expansin Gene Expression Affects Growth and Development in Transgenic Rice Plants. The Plant Cell 2003, 15, 1386–1398. [Google Scholar] [CrossRef] [PubMed]
- Chen, F.; Bradford, K. J. Expression of an Expansin Is Associated with Endosperm Weakening during Tomato Seed Germination1. Plant Physiology 2000, 124, 1265–1274. [Google Scholar] [CrossRef] [PubMed]
- Calderini, D. F.; Castillo, F. M.; Arenas-M, A.; Molero, G.; Reynolds, M. P.; Craze, M.; Bowden, S.; Milner, M. J.; Wallington, E. J.; Dowle, A.; Gomez, L. D.; McQueen-Mason, S. J. Overcoming the trade-off between grain weight and number in wheat by the ectopic expression of expansin in developing seeds leads to increased yield potential. New Phytologist 2021, 230, 629–640. [Google Scholar] [CrossRef] [PubMed]
- Chen, F.; Dahal, P.; Bradford, K. J. Two Tomato Expansin Genes Show Divergent Expression and Localization in Embryos during Seed Development and Germination. Plant Physiology 2001, 127, 928–936. [Google Scholar] [CrossRef]
- Zenoni, S.; Reale, L.; Tornielli, G. B.; Lanfaloni, L.; Porceddu, A.; Ferrarini, A.; Moretti, C.; Zamboni, A.; Speghini, A.; Ferranti, F.; Pezzotti, M. Downregulation of the Petunia hybrida α-Expansin Gene PhEXP1 Reduces the Amount of Crystalline Cellulose in Cell Walls and Leads to Phenotypic Changes in Petal Limbs. The Plant Cell 2004, 16, 295–308. [Google Scholar] [CrossRef] [PubMed]
- Arisha, M. H.; Aboelnasr, H.; Ahmad, M. Q.; Liu, Y.; Tang, W.; Gao, R.; Yan, H.; Kou, M.; Wang, X.; Zhang, Y.; Li, Q. Transcriptome sequencing and whole genome expression profiling of hexaploid sweetpotato under salt stress. BMC genomics 2020, 21, 197. [Google Scholar] [CrossRef] [PubMed]
- Liu, Q. Improvement for agronomically important traits by gene engineering in sweetpotato. Breeding Science 2017, 67, 15–26. [Google Scholar] [CrossRef] [PubMed]
- Ahn, Y. O.; Kim, S. H.; Kim, C. Y.; Lee, J.-S.; Kwak, S.-S.; Lee, H.-S. Exogenous sucrose utilization and starch biosynthesis among sweetpotato cultivars. Carbohydrate Research 2010, 345, 55–60. [Google Scholar] [CrossRef] [PubMed]
- Li, M.; Chen, L.; Lang, T.; Qu, H.; Zhang, C.; Feng, J.; Pu, Z.; Peng, M.; Lin, H. Genome-Wide Identification and Expression Analysis of Expansin Gene Family in the Storage Root Development of Diploid Wild Sweetpotato Ipomoea trifida. Genes 2022, 13, 1043. [Google Scholar] [CrossRef] [PubMed]
- Yang, J.; Moeinzadeh, M. H.; Kuhl, H.; Helmuth, J.; Xiao, P.; Haas, S.; Liu, G.; Zheng, J.; Sun, Z.; Fan, W.; Deng, G.; Wang, H.; Hu, F.; Zhao, S.; Fernie, A. R.; Boerno, S.; Timmermann, B.; Zhang, P.; Vingron, M. Haplotype-resolved sweet potato genome traces back its hexaploidization history. Nature Plants 2017, 3, 696–703. [Google Scholar] [CrossRef] [PubMed]
- Han, Z.; Liu, Y.; Deng, X.; Liu, D.; Liu, Y.; Hu, Y.; Yan, Y. Genome-wide identification and expression analysis of expansin gene family in common wheat (Triticum aestivum L.). BMC genomics 2019, 20, 101. [Google Scholar] [CrossRef] [PubMed]
- Zhang, W.; Yan, H.; Chen, W.; Liu, J.; Jiang, C.; Jiang, H.; Zhu, S.; Cheng, B. Genome-wide identification and characterization of maize expansin genes expressed in endosperm. Molecular Genetics and Genomics 2014, 289, 1061–1074. [Google Scholar] [CrossRef] [PubMed]
- Liu, C.; Fu, M.; Guo, F.; Wu, C. Genome-wide identification of expansin gene family in barley and drought-related expansins identification based on RNA-seq. Genetica 2021, 149, 283–297. [Google Scholar] [CrossRef] [PubMed]
- Chen, S.; Luo, Y.; Wang, G.; Feng, C.; Li, H. Genome-wide identification of expansin genes in Brachypodium distachyon and functional characterization of BdEXPA27. Plant Science 2020, 296, 110490. [Google Scholar] [CrossRef] [PubMed]
- Zhu, Y.; Wu, N.; Song, W.; Yin, G.; Qin, Y.; Yan, Y.; Hu, Y. Soybean (Glycine max) expansin gene superfamily origins: segmental and tandem duplication events followed by divergent selection among subfamilies. BMC Plant Biology 2014, 14, 93. [Google Scholar] [CrossRef] [PubMed]
- Guo, F.; Guo, J.; El-Kassaby, Y. A.; Wang, G. Genome-Wide Identification of Expansin Gene Family and Their Response under Hormone Exposure in Ginkgo biloba L. International Journal of Molecular Sciences 2023, 24, 5901. [Google Scholar] [CrossRef] [PubMed]
- Lv, L.-M.; Zuo, D.-Y.; Wang, X.-F.; Cheng, H.-L.; Zhang, Y.-P.; Wang, Q.-L.; Song, G.-L.; Ma, Z.-Y. Genome-wide identification of the expansin gene family reveals that expansin genes are involved in fibre cell growth in cotton. BMC Plant Biology 2020, 20, 223. [Google Scholar] [CrossRef] [PubMed]
- Ding, A.; Marowa, P.; Kong, Y. Genome-wide identification of the expansin gene family in tobacco (Nicotiana tabacum). Molecular Genetics and Genomics 2016, 291, 1891–1907. [Google Scholar] [CrossRef] [PubMed]
- Cannon, S. B.; Mitra, A.; Baumgarten, A.; Young, N. D.; May, G. The roles of segmental and tandem gene duplication in the evolution of large gene families in Arabidopsis thaliana. BMC plant biology 2004, 4, 1–21. [Google Scholar] [CrossRef] [PubMed]
- Zhao, J.; Zhai, Z.; Li, Y.; Geng, S.; Song, G.; Guan, J.; Jia, M.; Wang, F.; Sun, G.; Feng, N.; Kong, X.; Chen, L.; Mao, L.; Li, A. Genome-Wide Identification and Expression Profiling of the TCP Family Genes in Spike and Grain Development of Wheat (Triticum aestivum L.). Frontiers in Plant Science 2018, 9. [Google Scholar]
- Li, D.; Zhu, J.; Zhang, J.; Yang, Y.; Jia, Q.; Li, Z.; Zhu, M.; Dong, T. Combination analysis of genome-wide association and transcriptome sequencing identifies tuberous root development-related homeobox transcription factors and functional analysis of IbHB040 in sweetpotato. Scientia Horticulturae 2024, 326, 112753. [Google Scholar] [CrossRef]
- yang Han, Y.; xiu Li, A.; Li, F.; rong Zhao, M.; Wang, W. Characterization of a wheat (Triticum aestivum L.) expansin gene, TaEXPB23, involved in the abiotic stress response and phytohormone regulation. Plant Physiology and Biochemistry 2012, 54, 49–58. [Google Scholar]
- Meng, X.; Liu, S.; Dong, T.; Xu, T.; Ma, D.; Pan, S.; Li, Z.; Zhu, M. Comparative transcriptome and proteome analysis of salt-tolerant and salt-sensitive sweet potato and overexpression of IbNAC7 confers salt tolerance in Arabidopsis. Frontiers in Plant Science 2020, 11, 1342. [Google Scholar] [CrossRef] [PubMed]
- Cho, H.-T.; Cosgrove, D. J. Altered expression of expansin modulates leaf growth and pedicel abscission in Arabidopsis thaliana. Proceedings of the National Academy of Sciences 2000, 97, 9783–9788. [Google Scholar] [CrossRef]
- Chen, Y.; Zhang, B.; Li, C.; Lei, C.; Kong, C.; Yang, Y.; Gong, M. A comprehensive expression analysis of the expansin gene family in potato (Solanum tuberosum) discloses stress-responsive expansin-like B genes for drought and heat tolerances. PLOS ONE 2019, 14, e0219837. [Google Scholar] [CrossRef] [PubMed]
- Lu, Y.; Liu, L.; Wang, X.; Han, Z.; Ouyang, B.; Zhang, J.; Li, H. Genome-wide identification and expression analysis of the expansin gene family in tomato. Molecular Genetics and Genomics 2016, 291, 597–608. [Google Scholar] [CrossRef] [PubMed]
- Bordoloi, K.; Dihingia, P.; Krishnatreya, D.; Agarwala, N. Genome-wide identification, characterization and expression analysis of the expansin gene family under drought stress in tea (Camellia sinensis L.). Plant Science Today 2021, 8, 32–44. [Google Scholar] [CrossRef]
- Yin, Z.; Zhou, F.; Chen, Y.; Wu, H.; Yin, T. Genome-Wide Analysis of the Expansin Gene Family in Populus and Characterization of Expression Changes in Response to Phytohormone (Abscisic Acid) and Abiotic (Low-Temperature) Stresses. International Journal of Molecular Sciences 2023, 24, 7759. [Google Scholar] [CrossRef] [PubMed]
- Backiyarani, S.; Anuradha, C.; Thangavelu, R.; Chandrasekar, A.; Renganathan, B.; Subeshkumar, P.; Giribabu, P.; Muthusamy, M.; Uma, S. Genome-wide identification, characterization of expansin gene family of banana and their expression pattern under various stresses. 3 Biotech 2022, 12, 101. [Google Scholar] [CrossRef] [PubMed]
- Bajwa, K. S.; Shahid, A. A.; Rao, A. Q.; Bashir, A.; Aftab, A.; Husnain, T. Stable transformation and expression of GhEXPA8 fiber expansin gene to improve fiber length and micronaire value in cotton. Frontiers in Plant Science 2015, 6, 838. [Google Scholar] [CrossRef] [PubMed]
- Chen, Y.; Han, Y.; Zhang, M.; Zhou, S.; Kong, X.; Wang, W. Overexpression of the Wheat Expansin Gene TaEXPA2 Improved Seed Production and Drought Tolerance in Transgenic Tobacco Plants. PLOS ONE 2016, 11, e0153494. [Google Scholar] [CrossRef] [PubMed]
- Lynch, M.; Conery, J. S. The Evolutionary Fate and Consequences of Duplicate Genes. Science 2000, 290, 1151–1155. [Google Scholar] [CrossRef] [PubMed]
- Li, K.; Ma, B.; Shen, J.; Zhao, S.; Ma, X.; Wang, Z.; Fan, Y.; Tang, Q.; Wei, D. The evolution of the expansin gene family in Brassica species. Plant Physiology and Biochemistry 2021, 167, 630–638. [Google Scholar] [CrossRef] [PubMed]
- Paterson, A. H.; Wang, X.; Tang, H.; Lee, T. H. Synteny and Genomic Rearrangements. In Plant Genome Diversity Volume 1: Plant Genomes, their Residents, and their Evolutionary Dynamics; Wendel, J. F., Greilhuber, J., Dolezel, J., Leitch, I. J., Eds.; Springer Vienna: Vienna, 2012; pp. 195–207. [Google Scholar]
- Peng, L.; Xu, Y.; Wang, X.; Feng, X.; Zhao, Q.; Feng, S.; Zhao, Z.; Hu, B.; Li, F. Overexpression of paralogues of the wheat expansin gene TaEXPA8 improves low-temperature tolerance in Arabidopsis. Plant Biology 2019, 21, 1119–1131. [Google Scholar] [CrossRef] [PubMed]
- Zhang, X.-Q.; Wei, P.-C.; Xiong, Y.-M.; Yang, Y.; Chen, J.; Wang, X.-C. Overexpression of the Arabidopsis α-expansin gene AtEXPA1 accelerates stomatal opening by decreasing the volumetric elastic modulus. Plant Cell Reports 2011, 30, 27–36. [Google Scholar] [CrossRef] [PubMed]
- Gao, X.; Liu, K.; Lu, Y. T. Specific roles of AtEXPA1 in plant growth and stress adaptation. Russian Journal of Plant Physiology 2010, 57, 241–246. [Google Scholar] [CrossRef]
- Kwon, Y. R.; Lee, H. J.; Kim, K. H.; Hong, S.-W.; Lee, S. J.; Lee, H. Ectopic expression of Expansin3 or Expansinβ1 causes enhanced hormone and salt stress sensitivity in Arabidopsis. Biotechnology Letters 2008, 30, 1281–1288. [Google Scholar] [CrossRef] [PubMed]
- Abuqamar, S.; Ajeb, S.; Sham, A.; Enan, M. R.; Iratni, R. A mutation in the expansin-like A2 gene enhances resistance to necrotrophic fungi and hypersensitivity to abiotic stress in Arabidopsis thaliana. Molecular Plant Pathology 2013, 14, 813–827. [Google Scholar] [CrossRef] [PubMed]
- Muthusamy, M.; Kim, J. Y.; Yoon, E. K.; Kim, J. A.; Lee, S. I. BrEXLB1, a Brassica rapa Expansin-Like B1 Gene Is Associated with Root Development, Drought Stress Response, and Seed Germination. Genes 2020, 11, 404. [Google Scholar] [CrossRef] [PubMed]
- Verma, V.; Ravindran, P.; Kumar, P. P. Plant hormone-mediated regulation of stress responses. BMC plant biology 2016, 16, 1–10. [Google Scholar] [CrossRef] [PubMed]
- Introduction to Phytohormones. The Plant Cell 2010, 22, 1.
- Chen, C.; Chen, H.; Zhang, Y.; Thomas, H. R.; Frank, M. H.; He, Y.; Xia, R. TBtools: An Integrative Toolkit Developed for Interactive Analyses of Big Biological Data. Molecular Plant 2020, 13, 1194–1202. [Google Scholar] [CrossRef] [PubMed]
- Wang, Y.; Tang, H.; DeBarry, J. D.; Tan, X.; Li, J.; Wang, X.; Lee, T.-h.; Jin, H.; Marler, B.; Guo, H.; Kissinger, J. C.; Paterson, A. H. MCScanX: a toolkit for detection and evolutionary analysis of gene synteny and collinearity. Nucleic Acids Research 2012, 40, e49. [Google Scholar] [CrossRef] [PubMed]
- Krzywinski, M.; Schein, J.; Birol, I.; Connors, J.; Gascoyne, R.; Horsman, D.; Jones, S. J.; Marra, M. A. Circos: An information aesthetic for comparative genomics. Genome research 2009, 19, 1639–1645. [Google Scholar] [CrossRef]
- Zhang, J.; Hu, Z.; Yao, Q.; Guo, X.; Nguyen, V.; Li, F.; Chen, G. A tomato MADS-box protein, SlCMB1, regulates ethylene biosynthesis and carotenoid accumulation during fruit ripening. Scientific reports 2018, 8, 3413–3427. [Google Scholar] [CrossRef] [PubMed]
- Chen, L.-j.; Zou, W.-s.; Fei, C.-y.; Wu, G.; Li, X.-y.; Lin, H.-h.; Xi, D.-h. α-Expansin EXPA4 Positively Regulates Abiotic Stress Tolerance but Negatively Regulates Pathogen Resistance in Nicotiana tabacum. Plant and Cell Physiology 2018, 59, 2317–2330. [Google Scholar] [CrossRef]
- Liu, S.; Zhang, C.; Zhu, Q.; Guo, F.; Chai, R.; Wang, M.; Deng, X.; Dong, T.; Meng, X.; Zhu, M. Genome- and transcriptome-wide systematic characterization of bZIP transcription factor family identifies promising members involved in abiotic stress response in sweetpotato. Scientia Horticulturae 2022, 303, 111185. [Google Scholar] [CrossRef]
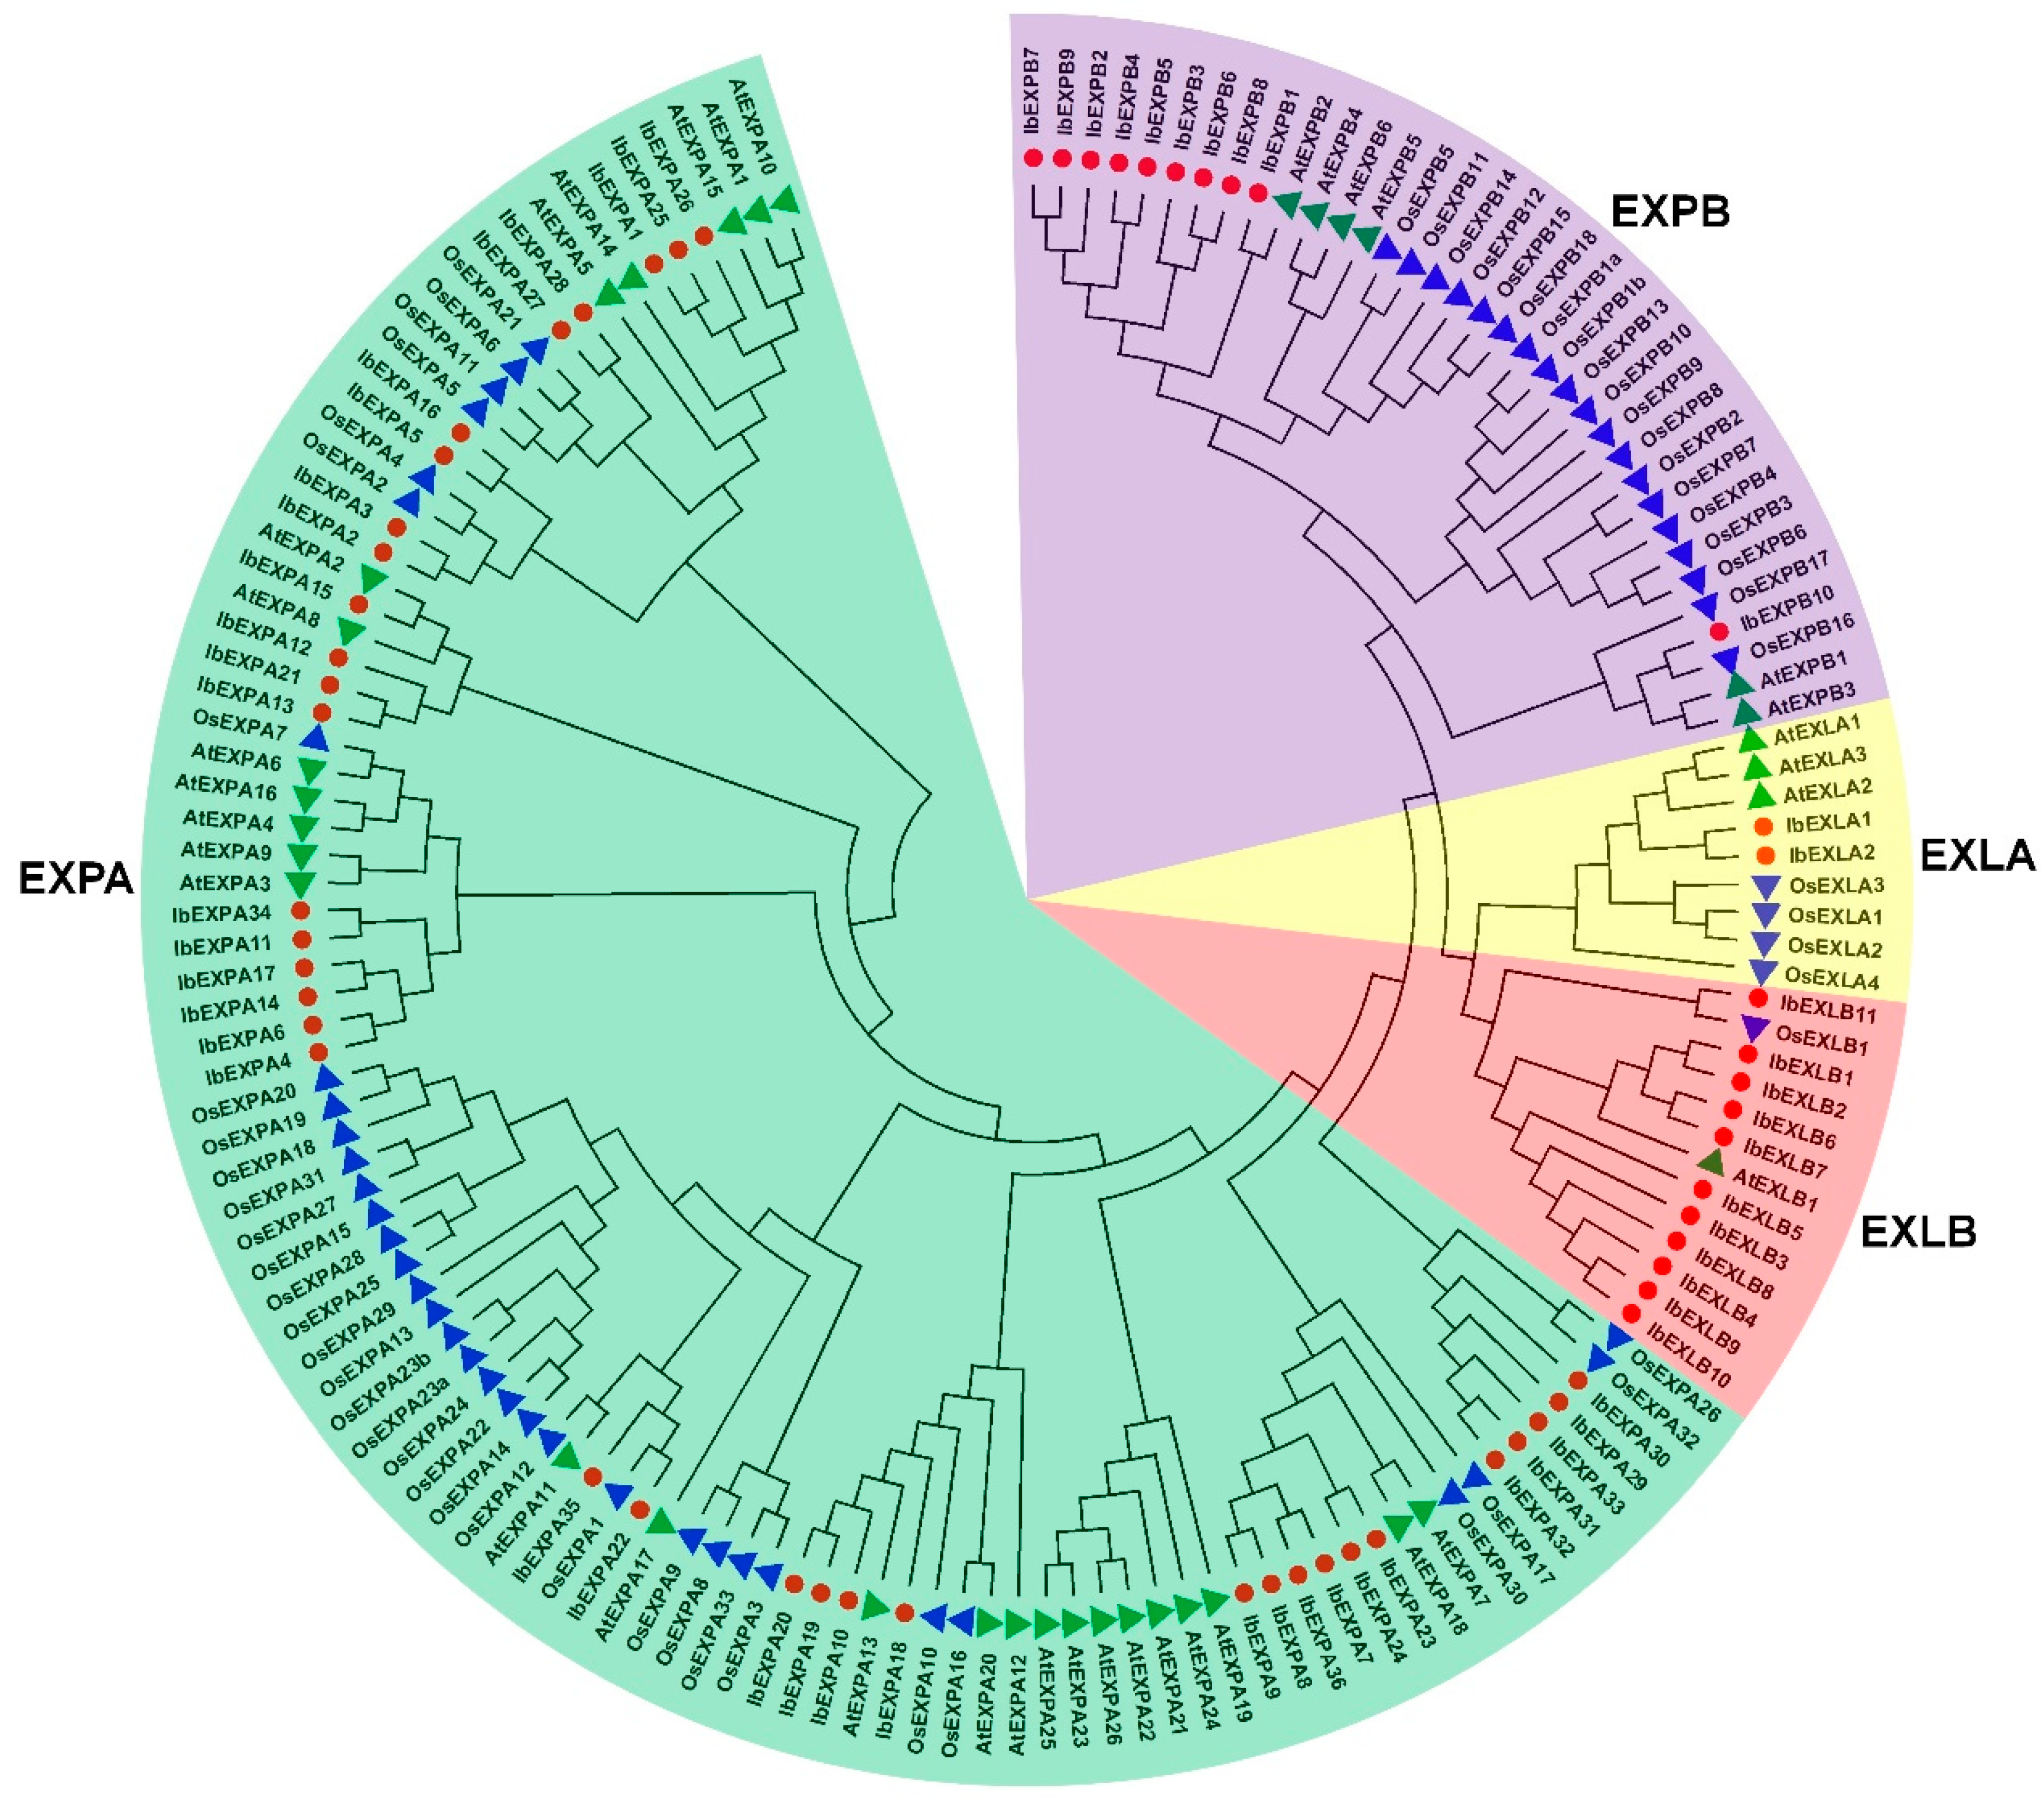


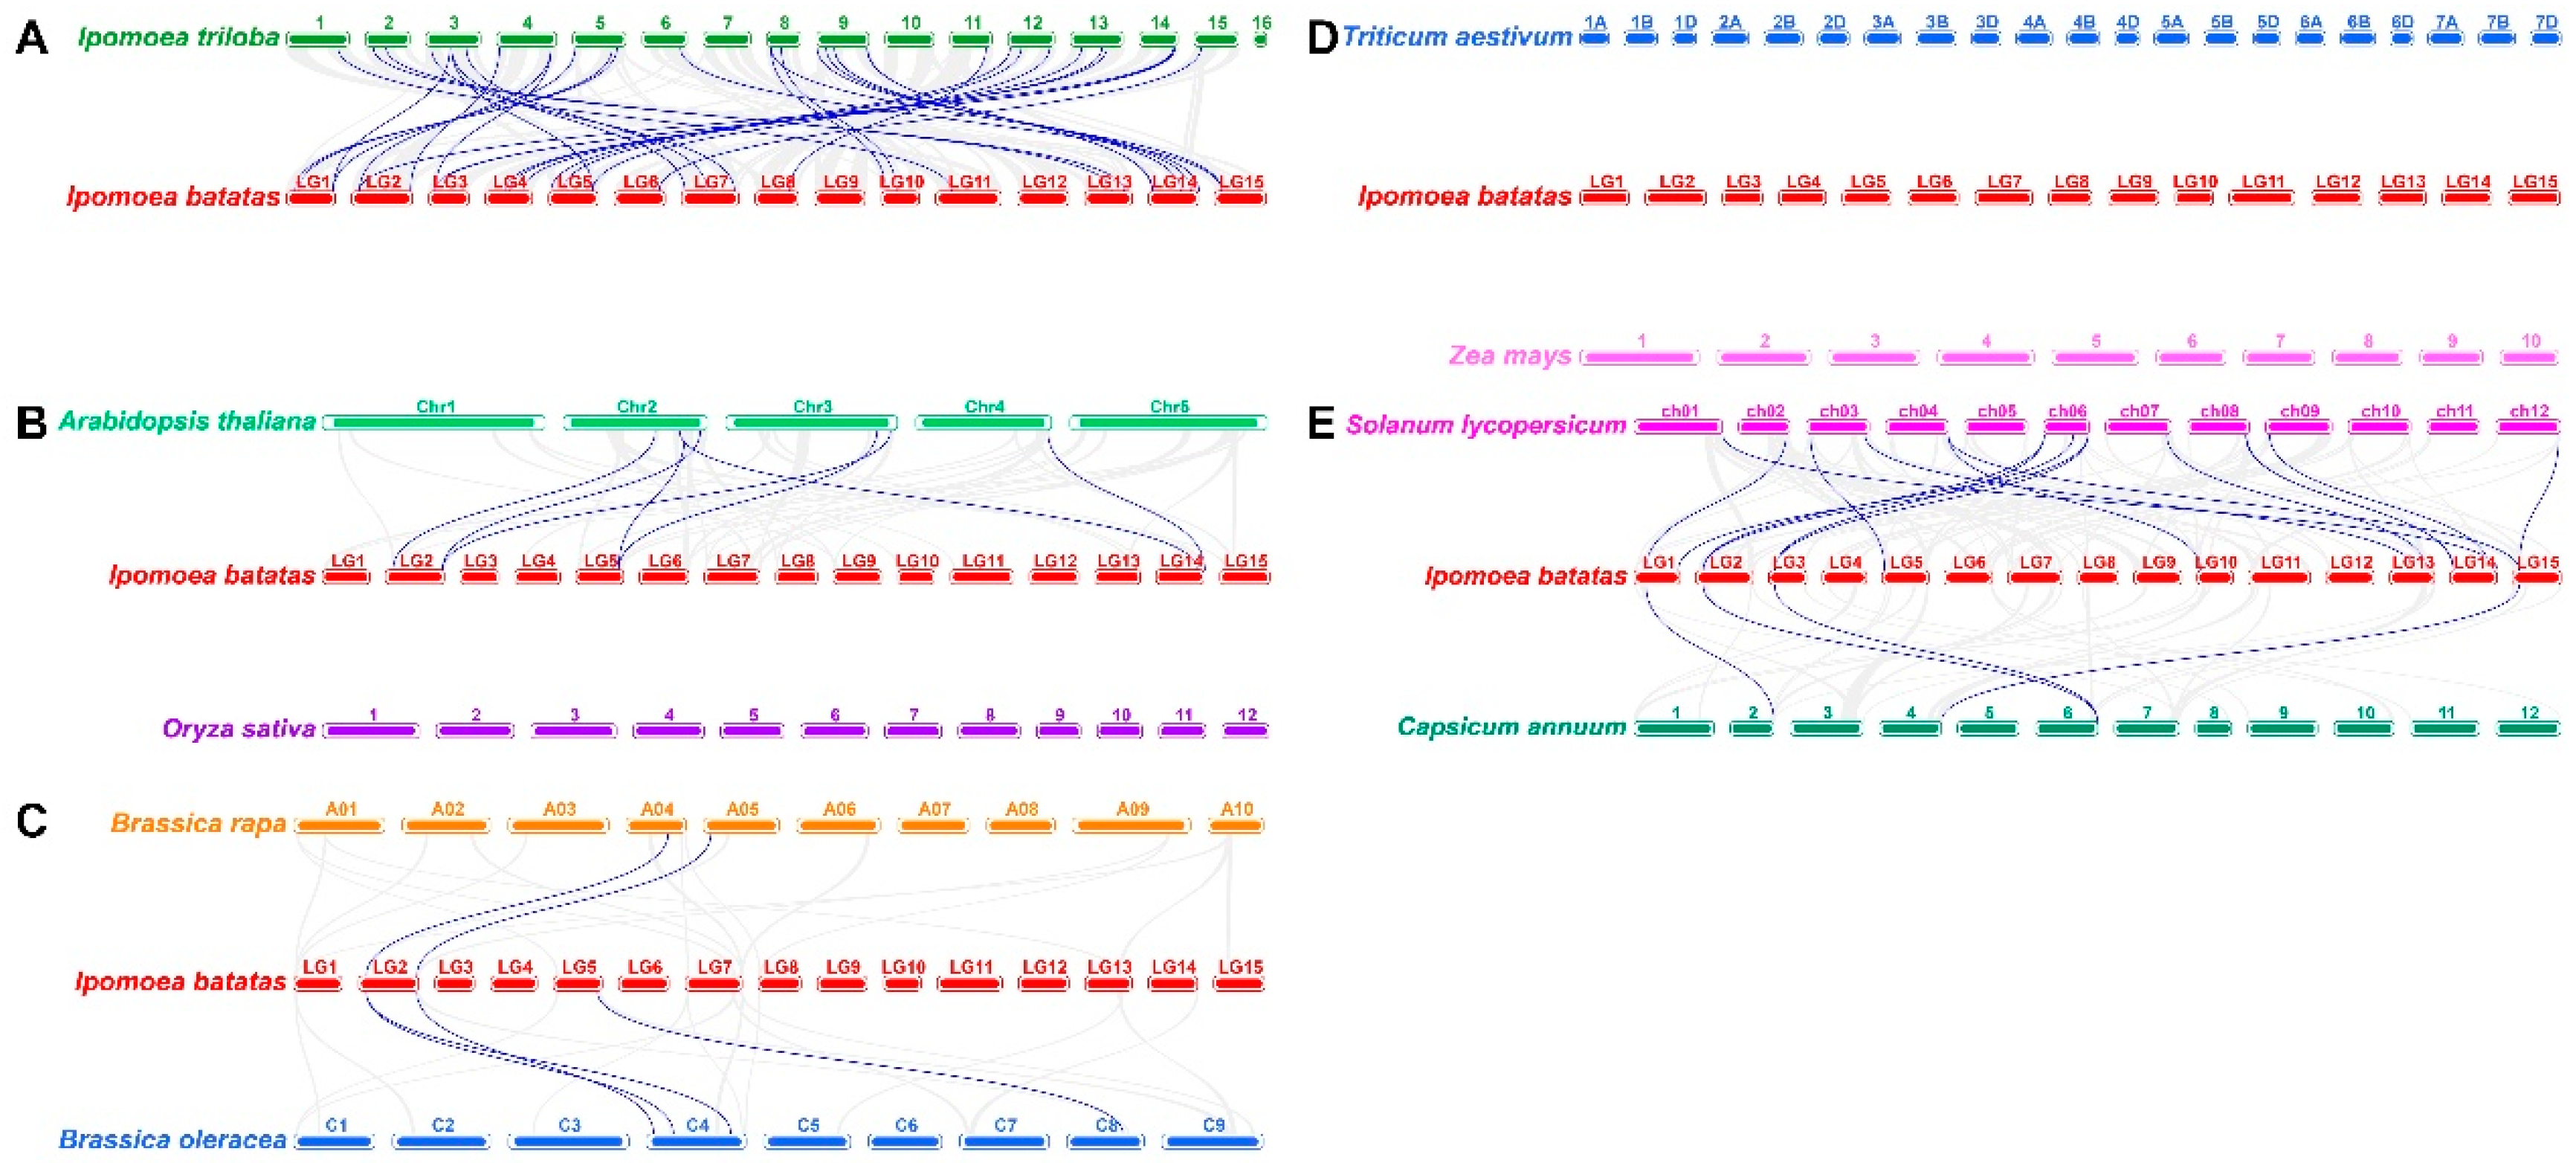
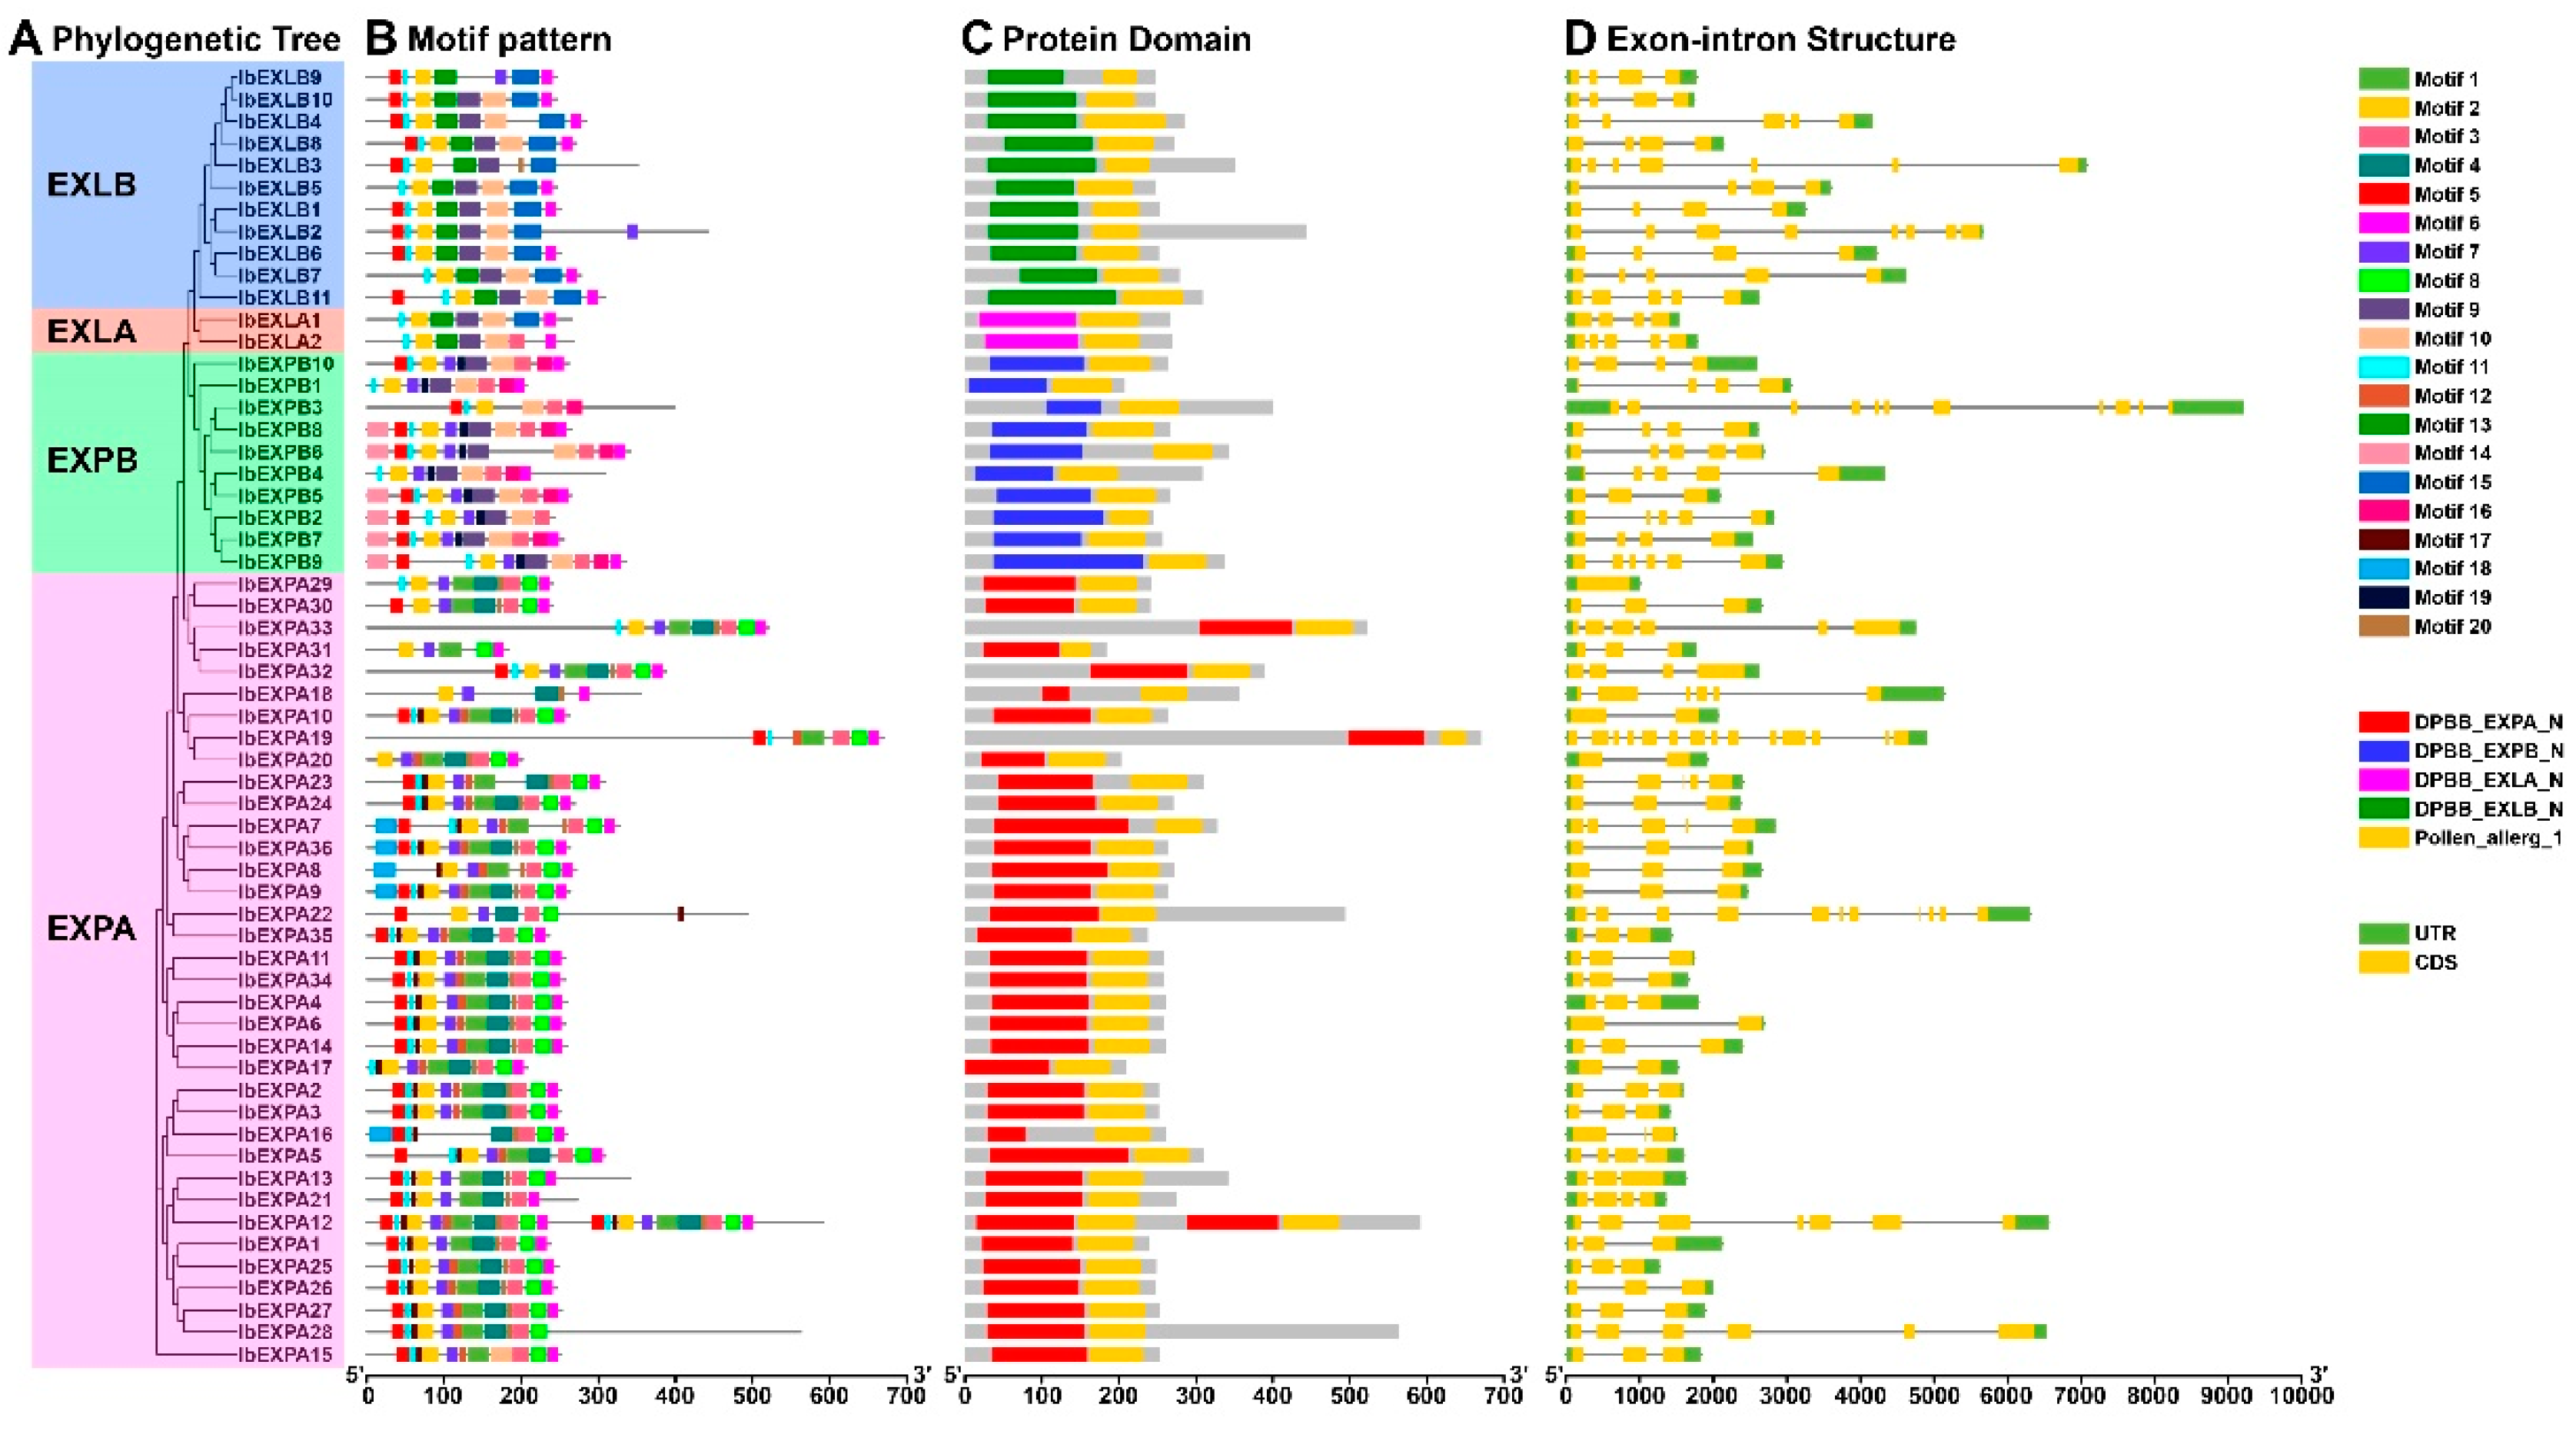
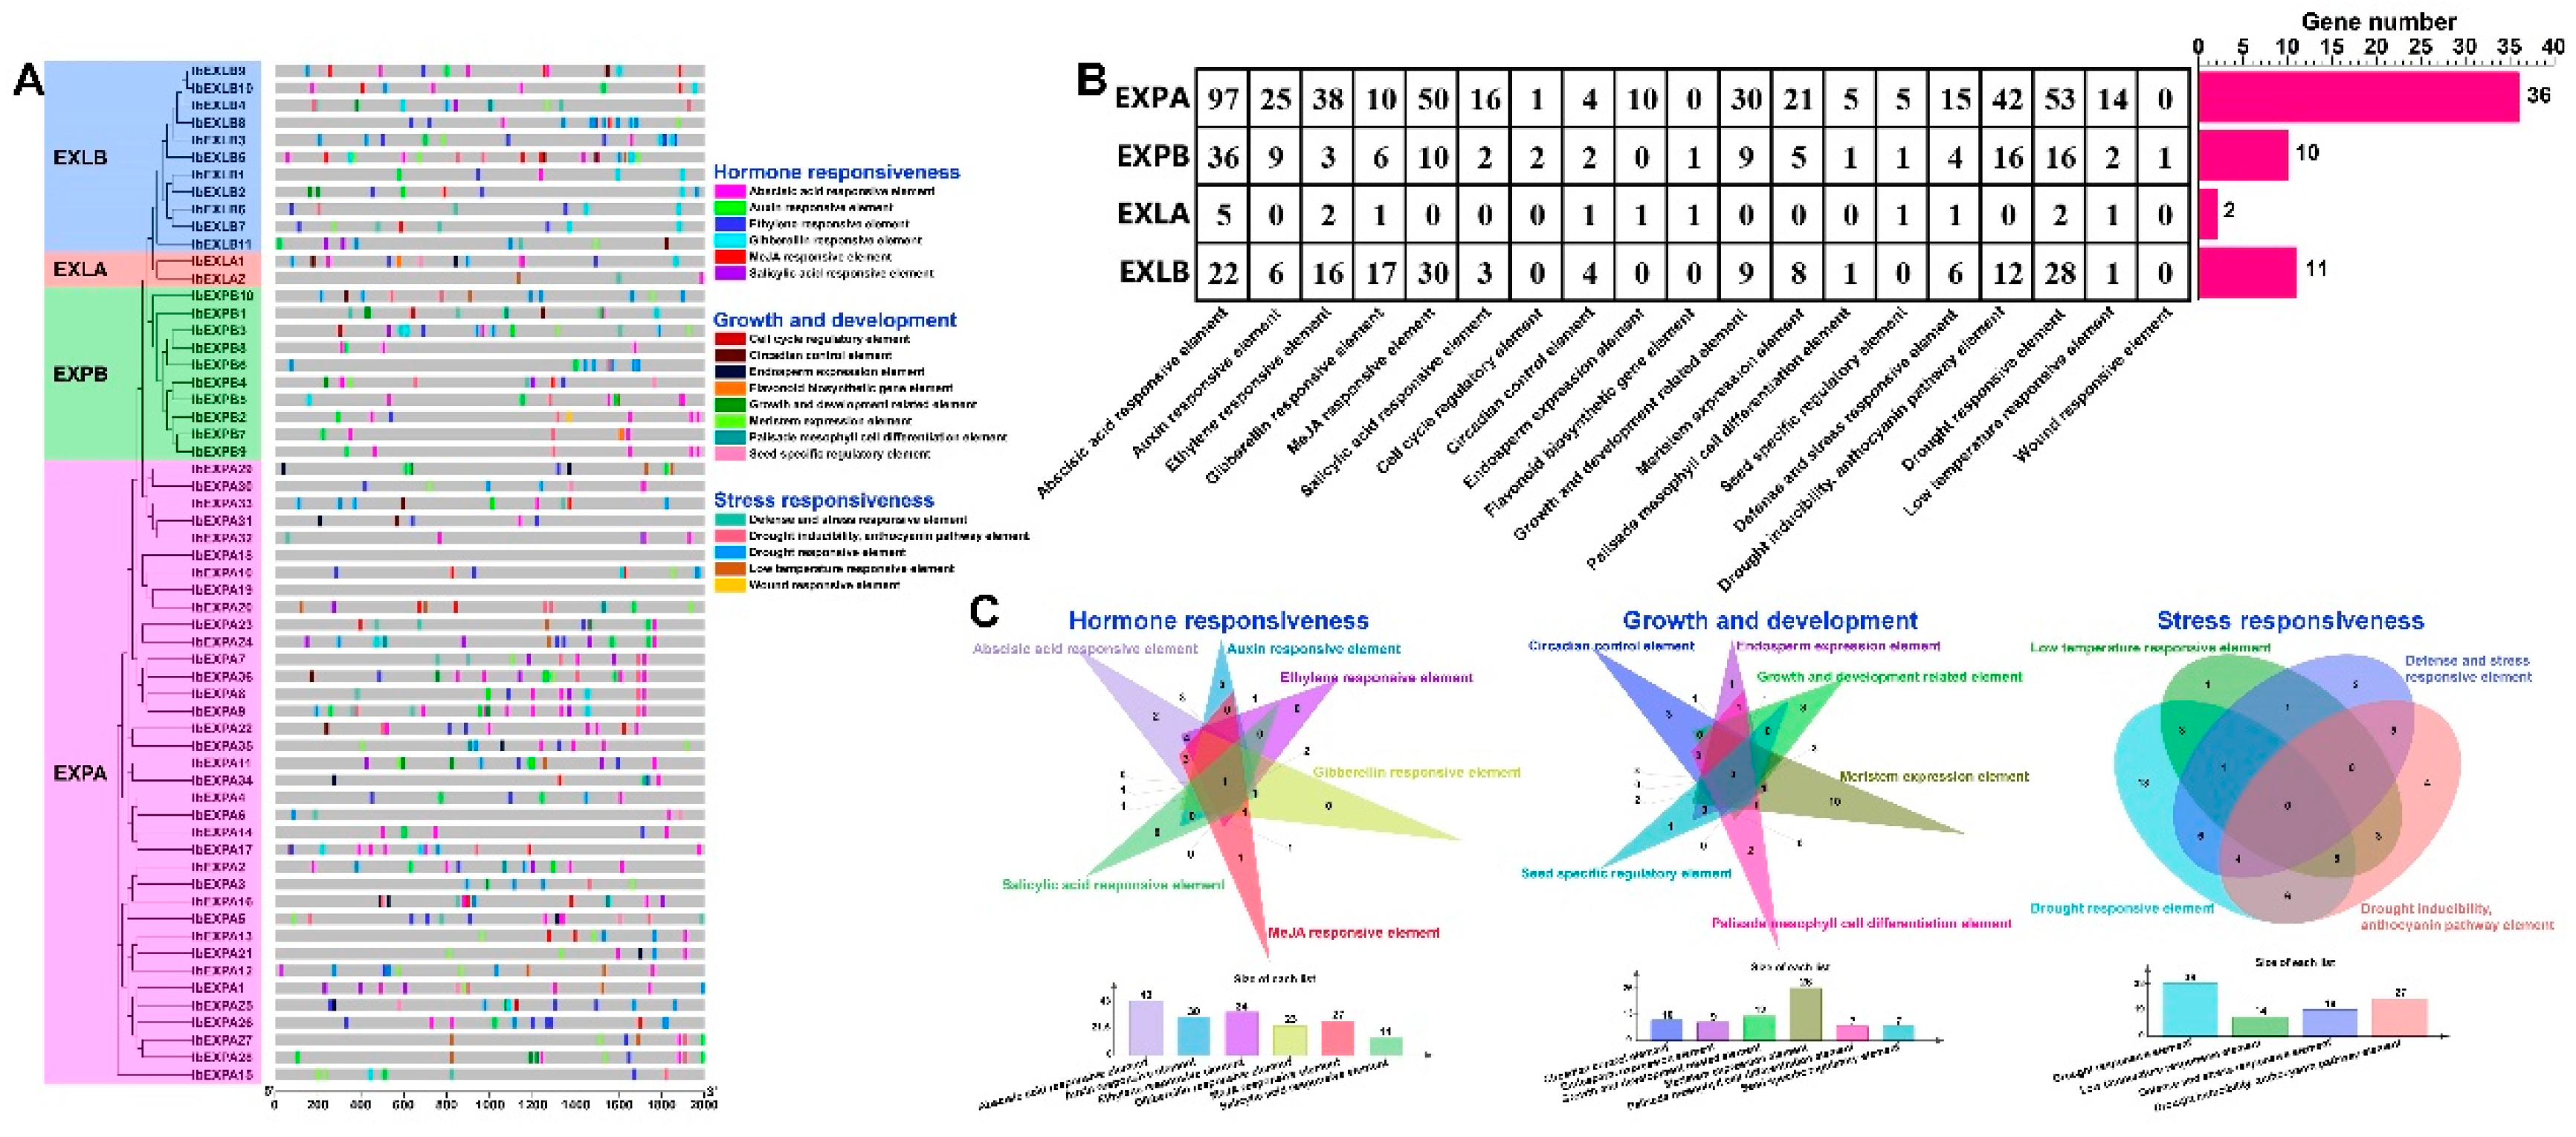
| Gene name | Gene ID | Amino acids | MW (Da) | PI | Subcellularlocation | phosphorylation cite | |||
|---|---|---|---|---|---|---|---|---|---|
| Ser site (S) | Tyr cite (Y) | Thr cite (T) | Total | ||||||
| IbEXPA1 | g1306.t1 | 238 | 25431.71 | 9.53 | Cell wall. | 20 | 3 | 8 | 31 |
| IbEXPA2 | g3925.t1 | 251 | 26960.41 | 8.07 | Cell wall. | 14 | 4 | 8 | 26 |
| IbEXPA3 | g3926.t1 | 251 | 26740.92 | 8.36 | Cell wall. | 21 | 4 | 6 | 31 |
| IbEXPA4 | g4923.t1 | 260 | 28213.08 | 9.27 | Cell wall. | 26 | 3 | 7 | 36 |
| IbEXPA5 | g9889.t1 | 310 | 33660.23 | 9.25 | Cell wall. | 26 | 5 | 20 | 51 |
| IbEXPA6 | g10004.t1 | 258 | 27595.27 | 9.3 | Cell wall. | 19 | 3 | 4 | 26 |
| IbEXPA7 | g15786.t1 | 327 | 35627.31 | 9.29 | Cell wall. | 45 | 5 | 12 | 62 |
| IbEXPA8 | g15816.t1 | 272 | 29860.26 | 9.36 | Cell wall. | 25 | 4 | 12 | 41 |
| IbEXPA9 | g15820.t1 | 264 | 28775.77 | 9.37 | Cell wall. | 29 | 4 | 9 | 42 |
| IbEXPA10 | g16869.t1 | 263 | 28645.8 | 8.56 | Cell wall. | 17 | 4 | 13 | 34 |
| IbEXPA11 | g17886.t1 | 258 | 27852.84 | 9.5 | Cell wall. | 13 | 4 | 10 | 27 |
| IbEXPA12 | g18537.t1 | 591 | 63172.9 | 7.19 | Cell wall. | 77 | 12 | 20 | 109 |
| IbEXPA13 | g18539.t1 | 341 | 35684.91 | 7.05 | Cell wall. | 57 | 6 | 10 | 73 |
| IbEXPA14 | g20283.t1 | 260 | 28086.01 | 9.4 | Cell wall. | 20 | 2 | 12 | 34 |
| IbEXPA15 | g24580.t1 | 252 | 27413.57 | 6.42 | Cell wall. | 12 | 4 | 11 | 27 |
| IbEXPA16 | g25447.t1 | 260 | 27406.89 | 9.16 | Cell wall. | 45 | 3 | 8 | 56 |
| IbEXPA17 | g25606.t1 | 209 | 22967.29 | 9.73 | Cell wall. | 13 | 3 | 8 | 24 |
| IbEXPA18 | g29706.t1 | 355 | 39001.06 | 9.64 | Cell wall. | 47 | 2 | 9 | 58 |
| IbEXPA19 | g29707.t1 | 670 | 74052.16 | 8.27 | Nucleus. | 72 | 5 | 23 | 100 |
| IbEXPA20 | g30029.t1 | 202 | 22488.71 | 9.44 | Cell wall. | 12 | 2 | 12 | 26 |
| IbEXPA21 | g33328.t1 | 273 | 28718.04 | 6.2 | Cell wall. | 30 | 5 | 7 | 42 |
| IbEXPA22 | g38554.t1 | 493 | 53544.79 | 8.24 | Cell wall, Chloroplast | 53 | 9 | 7 | 69 |
| IbEXPA23 | g39420.t1 | 309 | 33789.29 | 9.29 | Cell wall. | 29 | 4 | 20 | 53 |
| IbEXPA24 | g39467.t1 | 270 | 29209.17 | 9.1 | Cell wall. | 26 | 5 | 11 | 42 |
| IbEXPA25 | g42794.t1 | 248 | 26037.26 | 9.34 | Cell wall. | 16 | 2 | 7 | 25 |
| IbEXPA26 | g47278.t1 | 246 | 25903.09 | 8.64 | Cell wall. | 18 | 4 | 3 | 25 |
| IbEXPA27 | g53361.t1 | 253 | 27102.64 | 8.87 | Cell wall. | 22 | 3 | 6 | 31 |
| IbEXPA28 | g53365.t1 | 563 | 61262.75 | 9.32 | Cell wall. | 56 | 5 | 25 | 86 |
| IbEXPA29 | g58047.t1 | 241 | 26303.82 | 6 | Cell wall. | 23 | 3 | 13 | 39 |
| IbEXPA30 | g58048.t1 | 240 | 26373.45 | 9.21 | Cell wall. | 22 | 5 | 14 | 41 |
| IbEXPA31 | g58049.t1 | 183 | 20173.91 | 6.81 | Cell wall. | 10 | 2 | 12 | 24 |
| IbEXPA32 | g58052.t1 | 388 | 43264.45 | 9.2 | Cell wall. | 38 | 2 | 15 | 55 |
| IbEXPA33 | g58053.t1 | 521 | 58831.3 | 6.61 | Cell wall, Chloroplast | 26 | 9 | 27 | 62 |
| IbEXPA34 | g58951.t1 | 257 | 27894.88 | 9.82 | Cell wall. | 17 | 2 | 7 | 26 |
| IbEXPA35 | g60585.t1 | 237 | 25641.21 | 9.35 | Cell wall. | 20 | 2 | 9 | 31 |
| IbEXPA36 | g61698.t1 | 264 | 28887.9 | 9.39 | Cell wall. | 28 | 4 | 10 | 42 |
| IbEXPB1 | g9145.t1 | 207 | 21810.79 | 9.49 | Cell wall. | 22 | 1 | 10 | 33 |
| IbEXPB2 | g24143.t1 | 243 | 25960.18 | 5.75 | Cell wall. | 31 | 4 | 4 | 39 |
| IbEXPB3 | g24144.t1 | 400 | 44133.02 | 7.09 | Cell wall. | 56 | 7 | 21 | 84 |
| IbEXPB4 | g27129.t1 | 308 | 33145.35 | 7.52 | Cell wall. | 47 | 5 | 20 | 72 |
| IbEXPB5 | g27144.t1 | 265 | 28079.59 | 6.19 | Cell wall. | 37 | 2 | 5 | 44 |
| IbEXPB6 | g27334.t1 | 342 | 36757.24 | 5.16 | Cell wall. | 50 | 5 | 7 | 62 |
| IbEXPB7 | g27336.t1 | 256 | 27320.01 | 8.37 | Cell wall. | 31 | 5 | 3 | 39 |
| IbEXPB8 | g48839.t1 | 266 | 27877.16 | 4.89 | Cell wall. | 35 | 3 | 8 | 46 |
| IbEXPB9 | g48841.t1 | 336 | 36036.73 | 6.69 | Cell wall. | 32 | 5 | 6 | 43 |
| IbEXPB10 | g54432.t1 | 262 | 28422.34 | 8.74 | Cell wall. | 19 | 1 | 14 | 34 |
| IbEXLA1 | g904.t1 | 266 | 28622.45 | 5.29 | Cell wall. | 22 | 4 | 9 | 35 |
| IbEXLA2 | g59839.t1 | 268 | 29409.37 | 6.96 | Cell wall. | 17 | 4 | 12 | 33 |
| IbEXLB1 | g14386.t1 | 252 | 28275.14 | 5.45 | Cell wall. | 12 | 14 | 10 | 36 |
| IbEXLB2 | g14427.t1 | 443 | 49325.01 | 8.93 | Cell wall. | 37 | 15 | 21 | 73 |
| IbEXLB3 | g14812.t1 | 351 | 38060.5 | 7.91 | Cell wall. | 40 | 10 | 21 | 71 |
| IbEXLB4 | g15079.t1 | 284 | 30949.46 | 8.57 | Cell wall. | 29 | 4 | 8 | 41 |
| IbEXLB5 | g15300.t1 | 247 | 26876.61 | 8.32 | Cell wall. | 20 | 7 | 6 | 33 |
| IbEXLB6 | g33144.t1 | 251 | 28135.78 | 5.41 | Cell wall. | 17 | 15 | 10 | 42 |
| IbEXLB7 | g33212.t1 | 278 | 31034.24 | 5.52 | Cell wall. | 17 | 13 | 10 | 40 |
| IbEXLB8 | g55672.t1 | 272 | 28559.26 | 6.58 | Cell wall. | 24 | 5 | 17 | 46 |
| IbEXLB9 | g55673.t1 | 247 | 27029.36 | 9.33 | Cell wall. | 30 | 8 | 18 | 56 |
| IbEXLB10 | g55674.t1 | 246 | 26984.94 | 8.46 | Cell wall. | 16 | 14 | 13 | 43 |
| IbEXLB11 | g55709.t1 | 308 | 32778.84 | 4.63 | Cell wall. | 24 | 7 | 12 | 43 |
| Species | EXPA | EXPB | EXLA | EXLB | Total | Reference |
|---|---|---|---|---|---|---|
| Ipomoea batatas | 36 (61%) | 10 (17%) | 2 (3.4%) | 11 (18.6%) | 59 | In this study |
| Ipomoea trifida | 23 (62.2%) | 4 (10.8%) | 2 (5.4%) | 8 (21.6%) | 37 | [55] |
| sugarcane | 51 (55.4%) | 38 (41.3%) | 3 (3.3%) | 0 (0%) | 92 | [4] |
| Oryza sativa | 34 (58.6%) | 19(32.8%) | 4 (6.9%) | 1 (1.7%) | 58 | [15] |
| Triticum aestivum | 121 (50.2%) | 104 (43.2%) | 16 (6.6%) | 0 (0%) | 241 | [57] |
| maize | 36 (40.9%) | 48 (54.5%) | 4 (4.5%) | 0 (0%) | 88 | [58] |
| barley | 24 (52.2%) | 16 (34.8%) | 6 (13%) | 0 (0%) | 46 | [59] |
| Brachypodium distachyon | 30 (79%) | 4 (10.5%) | 3 (7.9%) | 1 (2.6%) | 38 | [60] |
| Arabidopsis | 26 (72.2%) | 6 (16.7%) | 3 (8.3%) | 1 (2.8%) | 36 | [15] |
| soybean | 49 (65.3%) | 9 (12%) | 2 (2.7%) | 15 (20%) | 75 | [61] |
| Ginkgo biloba | 32 (69.5%) | 4 (8.7%) | 5 (10.9%) | 5 (10.9) | 46 | [62] |
| cotton | 67 (72%) | 8 (8.6%) | 6 (6.5%) | 12 (12.9%) | 93 | [63] |
| tobacco | 36 (69.2%) | 6 (11.5%) | 3 (5.8%) | 7 (13.5%) | 52 | [64] |
| potato | 24 (66.6%) | 5 (13.9%) | 1 (2.8%) | 6 (16.7%) | 36 | [71] |
| tomato | 25 (65.8%) | 8 (21.1%) | 1 (2.6) | 4 (10.5%) | 38 | [72] |
Disclaimer/Publisher’s Note: The statements, opinions and data contained in all publications are solely those of the individual author(s) and contributor(s) and not of MDPI and/or the editor(s). MDPI and/or the editor(s) disclaim responsibility for any injury to people or property resulting from any ideas, methods, instructions or products referred to in the content. |
© 2024 by the authors. Licensee MDPI, Basel, Switzerland. This article is an open access article distributed under the terms and conditions of the Creative Commons Attribution (CC BY) license (http://creativecommons.org/licenses/by/4.0/).


