

Submitted:
30 December 2023
Posted:
03 January 2024
You are already at the latest version
Abstract
This study advances the field of solar irradiance nowcasting by introducing a discrete-level classification approach, diverging from traditional continuous measurement methods. Grounded in a need for cost-effective and modular solutions, the research employs high-resolution computer vision coupled with a deep learning framework to predict Direct Normal Irradiance (DNI). By harnessing the capabilities of a Logitech C900 1080p HD camera and an NVIDIA Jetson module, the study achieves real-time data processing, pivotal for CSP systems' operational efficiency. The core of the methodology is the ResNet-50 convolutional neural network, refined via transfer learning on a bespoke dataset, culminating in a predictive accuracy of 85.78%. This discrete classification model contrasts with conventional, costly instruments like the MS-57, offering a novel and accessible alternative for DNI estimation. Such innovation not only demonstrates high predictive accuracy but also signifies a shift towards less resource-intensive and more adaptable solar energy forecasting tools, contributing a significant leap towards optimizing renewable energy systems.
Keywords:
solar irradiance nowcasting
; deep learning in renewable energy
; modular solar forecasting systems
; computer vision for DNI estimation
; ResNet-50 for energy prediction
; cost-effective solar technology
; high-resolution image processing
; NVIDIA Jetson in solar energy
; classification-based DNI analysis
; sustainable energy optimization
1. Introduction
In the pursuit of harnessing solar energy efficiently, particularly within the realm of Concentrated Solar Power (CSP) systems, the accuracy of Direct Normal Irradiance (DNI) forecasting was identified as paramount. The field had traditionally relied on methodologies involving satellite image processing and ground-based observations. While these techniques provided valuable insights, they were encumbered by significant limitations in spatial-temporal resolution and computational demands, often resulting in suboptimal accuracy and efficiency in solar forecasting [1,2,3,4,5]. These challenges underscored a critical need for innovative forecasting methods that could provide more accurate and real-time data for CSP operations.
The literature revealed that most existing methods focused predominantly on Global Horizontal Irradiance (GHI) rather than DNI, which is more directly applicable to CSP technologies [6,7]. This gap suggested a substantial opportunity for improvement in methodologies specifically targeting DNI nowcasting. Moreover, the reliance on traditional image processing and observational techniques pointed to the potential for enhanced approaches that could leverage advancements in computational technology and machine learning.
In response to these identified gaps, our study hypothesized integrating a modular, AI-based computing platform, such as the NVIDIA Jetson, combined with high-resolution imaging using a modified Logitech C900 1080p HD camera. This approach aimed to overcome the spatial-temporal limitations of conventional methods and provide a more detailed and accurate analysis of DNI. Furthermore, adopting an advanced deep learning model, specifically the ResNet-50, represented a novel application in solar energy forecasting. Unlike traditional models that primarily output continuous variables, our approach utilized classification techniques to categorize DNI into discrete ranges, providing a more nuanced understanding of solar irradiance variability and its impact on CSP operations.
The anticipated outcome of this study was a significant improvement in the accuracy and efficiency of DNI nowcasting, facilitating better operational management and decision-making in CSP plants. This research aimed to contribute a transformative solution to the renewable energy sector by addressing the barriers identified in current forecasting practices and enhancing the capacity for sustainable and efficient solar power generation.
2. Materials and Methods
2.1. Data Collection and Instrumentation
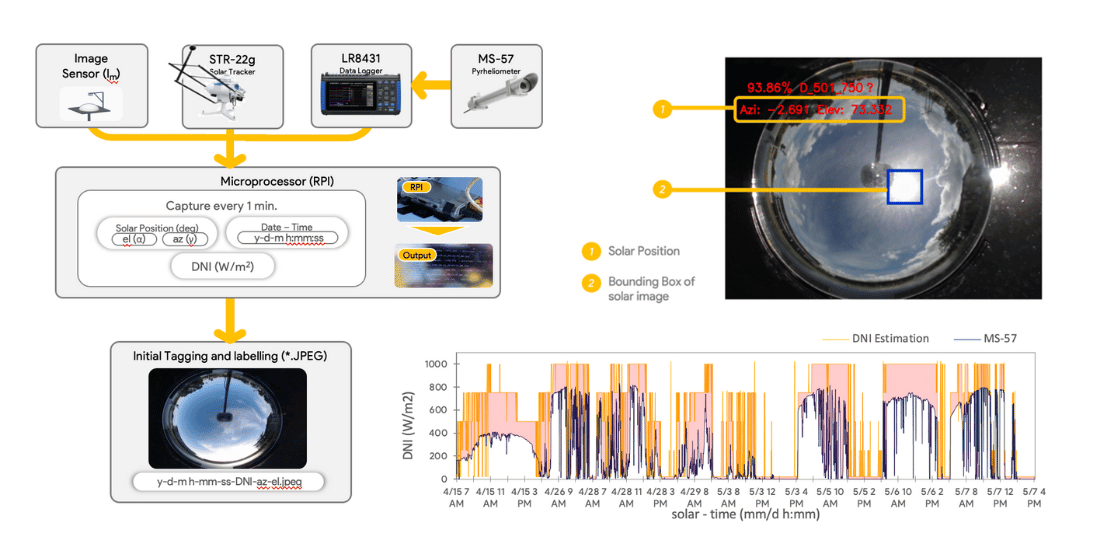
We meticulously crafted a methodology tailored to address the complexities of Direct Normal Irradiance (DNI) nowcasting in Concentrated Solar Power (CSP) systems. This phase, fundamental to the integrity of our research, involved a strategic amalgamation of advanced imaging technologies and data processing tools. The whole process, from capture to initial tagging and labeling, is shown in Figure 1.
At the forefront of our data collection strategy was deploying a Logitech C900 1080p HD camera. This device was not merely chosen for its high resolution but also for its capability to capture expansive sky images with exceptional detail. Such granularity in the imagery was vital for accurate analysis and classification of DNI levels, overcoming the resolution limitations often encountered in traditional solar irradiance measurement methods.
Concurrent with the image capture, the STR-22G Solar Tracker was employed to precisely record the sun’s positional data, including its elevation (el – α) and azimuth (azi – γ). These measurements were crucial in correlating the captured images with the sun’s position in the sky at specific times. In parallel, the MS-57 Pyrheliometer, interfaced with an LR8431 Data Logger, accurately measured the DNI values in watts per square meter. The integration of these instruments ensured a comprehensive dataset encompassing both visual and quantitative aspects of solar irradiance.
Our processing framework was anchored by a Raspberry Pi (RPI) system, programmed to collate data at one-minute intervals. This frequency of data collection was key to capturing the dynamic nature of solar irradiance. Each image captured was systematically named in a structured format: img_year_month_day_h_m_s_AM/PM, embedding essential time and DNI data. This naming convention was designed to facilitate easy retrieval and correlation of images with corresponding irradiance values. The DNI data was also calibrated using specific scaling options (ratio = 4.00E-2, offset = -4.00E+2) and archived in a CSV format, ready for subsequent analytical processing.
The culmination of the data collection phase was the organization of the images into a structured dataset, segmented into training, validation, and testing sets. This segmentation followed a categorical structure based on DNI ranges (A-E), which was instrumental in training and evaluating the ANN model employed in our study. The orderly arrangement of data into train/, val/, and test/ directories not only streamlined the machine learning process but also ensured that the model was exposed to a comprehensive range of irradiance conditions.
The Data Collection and Instrumentation phase set a robust foundation for our study, demonstrating a meticulous approach to data acquisition and management. This phase underscored our commitment to overcoming the challenges in solar energy forecasting by addressing the needs of DNI analysis for CSP systems. It highlighted the innovative aspects of our research methodology.
2.2. Data Collection and Instrumentation
The Data Classification phase of our research was a meticulously executed process, pivotal in shaping the approach to DNI nowcasting. Central to this phase was the establishment of a structured classification system, as detailed in Table 1, which played a crucial role in the accuracy and applicability of our model.
The decision to categorize DNI values into discrete levels was driven by the need to accurately capture the variability in solar irradiance concerning CSP plant operations. The ranges were carefully chosen, considering the operational irradiance thresholds of CSP technologies. We started with broader categories (as shown in the first row of Table 2), but iterative refinements led to a more granular classification.
The initial approach involved evenly distributing the DNI values across four categories (0-250, 251-500, etc.), resulting in an accuracy of 78.21%. However, we experimented with more classes and distribution strategies to enhance model performance. This experimentation was not linear but an iterative process, where each classification stage was rigorously evaluated for accuracy.
The selection of 0 to 1000 W/m^2 as the overall range for DNI classification was informed by practical considerations of the typical solar irradiance values encountered in CSP operations in Davao City, Philippines. The minimum value of 0 W/m^2 represents the absence of direct solar irradiance, typically observed during overcast conditions or at dawn/dusk. At the same time, the maximum of 1000 W/m^2 aligns with peak solar irradiance under clear sky conditions. This range encompasses the full spectrum of DNI values relevant to CSP efficiency and decision-making.
2.3. Data Labelling and Annotation
Once the dataset was organized and classified into specific DNI ranges, the next crucial step involved labeling and annotating the data to facilitate model training. The dataset, collected from scratch, was particularly tailored for retraining an existing DNN, leveraging the concept of transfer learning.
The dataset was divided into three distinct sets, each serving a specific purpose in the model training and evaluation process:
- a)
- Training Set (train/). This set was used primarily for transfer learning, allowing the pre-trained DNN model to adapt to our specific dataset. It comprised 80% of the images (3,270 photos), ensuring extensive exposure to varied solar conditions.
- b)
- Validation Set (val/). Comprising 10% of the images (408 images), this set was crucial for evaluating the classification accuracy during training, allowing for the fine-tuning of the model.
- c)
- Testing Set (test/). This set, constituting 10% of the images (408 images), was reserved for post-training evaluation, testing the model’s performance on unseen data.
The labeling process involved defining class labels for each image in accordance with the DNI categories determined earlier. These labels were meticulously documented in a label file, which included one class label per line, alphabetized to correspond with the directory structure on disk. This labeling schema was integral for the model’s inference application, guiding the classification process during training and evaluation.
Our methodology utilized PyTorch, a widely acclaimed open-source machine learning framework known for its efficacy in computer vision applications. Developed by Facebook’s AI Research lab, PyTorch is adept at handling complex image data. The framework’s capability to infer class IDs from the directory structure was instrumental in streamlining the training process, ensuring a seamless integration of our dataset with the model.
By employing transfer learning, we significantly reduced the time and resources required to train the network from scratch. This approach allowed us to build upon the pre-trained weights of the DNN, adapting it to our specific solar imagery dataset. The classification and labeling strategy was intricately designed to optimize the dataset for PyTorch training, ensuring that each image was correctly categorized and annotated for effective model training.
2.4. Re-Training
Resnet-50 Model Once the PyTorch script is initiated, it will re-train the model using the Resnet-50. Resnet-50 is a convolutional neural network that has 18 layers. An already-trained network version can be loaded from the ImageNet database (Wu et al., 2019). The pre-trained network can classify images into 1000 object categories. Additional training metrics were also set for the training, as shown in Table 4 below:

Table 2.
Metrics Applied for re-training.
| Metrics | description | setting |
|---|---|---|
| epoch | One complete training pass over the dataset | 60 |
| Batch size | The number of training examples utilized in one iteration | 8 (default) |
| workers | act as both learner and teacher | (default) |
In the final phase of our methodology, the Re-Training of the ResNet-50 model, we honed a convolutional neural network (CNN) renowned for its depth and sophistication in image classification tasks. The ResNet-50, comprising 50 layers that imbue it with the capability to discern intricate features in image data, was meticulously retrained using our carefully curated solar imagery dataset.
The process commenced with the initiation of the PyTorch script, marking the beginning of a transformative journey for the ResNet-50 model. Originally trained on the extensive ImageNet database, this model was adept at categorizing images into a thousand diverse object categories. The re-training aimed to repurpose this general classification ability to the specialized task of DNI range classification—a critical component in the predictive arsenal for CSP systems.
Upon achieving optimal re-training, the ResNet-50 model underwent a conversion to the ONNX format, a move that empowered the model with a newfound flexibility. ONNX, an open model format, bridges the gap between various ML frameworks, such as PyTorch and TensorFlow, thus simplifying the model’s transferability and application. The TensorRT, NVIDIA’s high-performance deep learning inference optimizer, then took over, loading the ONNX model for both testing (’resting’) and real-time inference.
To ensure transparency and reproducibility, the methodology included an appendix that detailed the snippet code for re-training the ResNet-50 model. This code provided insights into the specific configurations and customizations applied to the model, underlining the rigor and precision that went into its re-training.
3. Results and Discussions
The prototype was operationalized at the Ateneo de Davao University, Bangkal, Davao City, within the parameters of the concentrated solar power (CSP) research site, geographically situated at GPS coordinates 7.0606297, 125.55674. The site was selected for its suitability to evaluate the prototype’s image processing and deep learning inference capabilities, critical for the precise nowcasting of Direct Normal Irradiance (DNI).
Figure 2 illustrates the prototype with a detailed schematic, indicating the component layout and dimensions of the image-sensing apparatus. At the epicenter of the setup is an engineered convex mirror, 23 cm in diameter, affixed to a 42 x 42 cm base plate with a matte black finish to minimize non-essential light and reflections. The positioning of the image sensor, elevated at 35 cm and extended outward by 41 cm, is strategically calibrated to intersect the mirror’s center, ensuring comprehensive sky coverage within the captured frame for solar position analysis.
Prior to integrating the catadioptric camera assembly, precise orientation alignment with true north was accomplished using a calibrated digital compass application. This critical procedure ensures that the system’s geospatial alignment is in harmony with the earth’s geographic coordinates, a foundational requirement for the accuracy of solar tracking.
In the calibration phase, the prototype underwent meticulous adjustments to ensure the precision of the solar position estimations. This process could be conducted manually on-site or remotely, with provisions for secure access through SSH protocol utilizing a VNC server. The operational efficacy of the system was demonstrated as it continuously logged essential data points such as time, estimated DNI, solar position, and the corresponding confidence levels, with all data being formatted into a CSV file for ease of subsequent analysis.
The experimental phase was carefully scheduled to coincide with optimal weather conditions as predicted by AccuWeather, ensuring that data collection on April 15, 26, 28, and 29, as well as May 3 and May 5-7 of 2022, was conducted under clear skies, conducive to precise solar imaging. This stringent approach to data collection was instrumental in ensuring the reliability of the subsequent dataset classification.
Figure 3 exemplifies the output derived from the prototype, showcasing the solar position (1) and the bounding box (2) that encloses the brightest segment of the image—indicative of the highest solar radiation intensity. The internal computation of the centroid and the flexible display of the solar position on the CV-monitoring screen exemplify the prototype’s capability to offer real-time, accurate visual cues of the sun’s location. This visual representation is a critical tool for verifying the solar position against established instruments, such as the STR-22g solar tracker, which provided primary data, and the NREL-SPA, which offered additional azimuth and elevation data for comparative accuracy assessments.
Further refining our sun localization methodology, we utilized the current time to enhance the precision of DNI estimation. The developmental progress of our model is quantitatively assessed in Figure 4, which outlines the training process involving 4,086 datasets designated for training and validation purposes. Notably, the model achieved a training accuracy of 85.78%. The validation loss was recorded at approximately 8.6893, with the training loss being significantly lower, at around 1.4352. This demonstrates the model’s robustness and its capacity to generalize well on unseen data. In the test phase, the validation accuracy reached an impressive 84.47%, indicating a high level of reliability in the model’s predictive performance. These results underscore the efficacy of our approach and its potential utility in operational settings for solar power forecasting.
A confusion matrix was generated to appraise the model’s classification efficacy, correlating the predicted labels with the actual labels from the testing dataset. The matrix, illustrated in Figure 5, delineates the accuracy of predictions, with correct classifications prominently displayed along the matrix’s diagonal. This visual representation confirms the model’s proficiency in distinguishing among the defined DNI categories, evidencing an accuracy of 85.74%. Such precision in classification underpins the model’s capability to discern subtle variances in solar irradiance, thereby reinforcing the reliability of the DNI estimation process.
Building on the robust foundation established by the confusion matrix, Table 3 presents a comprehensive set of classification performance metrics. Within the test set—a collection totalling 408 images—the model achieved an accuracy of 84.47%. This figure substantiates the model’s adeptness at estimating direct solar radiation with considerable reliability. To extend the assessment of the re-trained model’s effectiveness, an array of metrics, including Accuracy, Precision, Recall, F1_Score, True Negative Rate (TNR), False Positive Rate (FPR), False Negative Rate (FNR), and Matthews Correlation Coefficient (MCC), were meticulously calculated for the test dataset. These metrics offer a granular view of the model’s performance, confirming its efficacy in precisely classifying DNI ranges.
Figure 6, Figure 7, Figure 8, Figure 9 and Figure 10 demonstrate the classification prowess during live camera operations, expanding on the model’s real-time capabilities. The images vividly depict DNI estimations across the delineated categories—ranging from A_0_20 to E_751_1000—accompanied by corresponding probabilities and solar position metrics. These categories are illustrated through images, showcasing instances of highest and lowest classification confidence.
Notably, some images portray lower confidence levels, intersecting with other classifications. This reduced certainty is predominantly observed in images featuring dense cloud cover, complicating the model’s predictive accuracy. Such observations signal potential avenues for enhancement, particularly through the strategic acquisition of image datasets during key solar events, such as the summer solstice, the solar equinox, and the winter solstice. Targeted data capture during these periods could significantly refine the model’s recognition capabilities, bolstering the accuracy of DNI estimation.
Figure 11 illustrates the correlation between the discretely classified DNI levels generated by our model and the continuous DNI measurements from the standard MS-57 instrument. The graph employs a red line to delineate the 15.53% variation, emphasizing the distinction between the categorical estimates and the continuous real-world data. This visual comparison underscores the model’s capability to approximate DNI values within a defined range, while also pinpointing opportunities to enhance the granularity of predictions to mirror the MS-57’s continuous data more accurately.
Figure 12 provides a Box and Whisker graphical illustration, contrasting the discrete DNI levels predicted by our model with the continuous measurements from the MS-57 instrument. This representation offers a clear visual summary of the distribution ranges and the central tendency of the estimated DNI against the standard reference, capturing the variability and accuracy of our model’s predictions over set intervals.
5. Discussion
The results of this study significantly advance the field of solar irradiance forecasting, particularly in the context of Direct Normal Irradiance (DNI) nowcasting for concentrated solar power (CSP) systems. The research’s core achievement lies in developing and applying a deep learning-based classification approach, utilizing the ResNet-50 model on the NVIDIA Jetson platform. This methodology represents a novel departure from traditional continuous measurement techniques, introducing a discrete-level classification system for DNI.
The model, trained on a comprehensive dataset of high-resolution sky images, achieved a training accuracy of 85.78% and a validation accuracy of 84.47%. This level of precision demonstrates the model’s effectiveness in predicting DNI ranges, which is essential for optimizing the performance of CSP systems. High-resolution imaging and advanced AI techniques enabled the accurate classification of DNI into distinct categories, ranging from A (0-20 W/m^2) to E (751-1000 W/m^2). This granularity in classification provides a more nuanced understanding of DNI variability, a critical factor in solar power management and forecasting.
However, the study also revealed areas for potential improvement. The comparison of the model’s estimates with data from the standard MS-57 instrument showed a discrepancy of 15.53%, indicating a gap that needs addressing in future model iterations. This discrepancy highlights the need for further refinement in the model’s accuracy and suggests exploring additional data sources or algorithmic improvements.
Overall, the research presents a significant step forward in applying AI for solar energy applications. It provides a cost-effective, modular, and less resource-intensive alternative to conventional solar irradiance forecasting methods. The successful implementation of this approach could lead to more accurate and efficient management of solar resources, contributing to the broader goal of enhancing the sustainability and viability of renewable energy systems.
6. Conclusions
In this pioneering study, we have ventured into uncharted territory by attempting to provide discrete-level classifications for Direct Normal Irradiance (DNI) estimation, leveraging the capabilities of the ResNet-50 model within a deep learning framework. This novel approach represents a significant shift from traditional continuous regression models, introducing a more granular perspective in solar irradiance forecasting for concentrated solar power (CSP) systems.
Our methodology’s distinctiveness lies in its focus on categorizing DNI into discrete ranges, a strategy that enhances the interpretability and applicability of the data in CSP operations. Tested at the Ateneo de Davao University, our custom-designed solar imaging setup achieved an impressive training accuracy of 85.78% and a validation accuracy of 84.47%, validating the efficacy of our model in real-time scenarios.
While our approach marked a notable achievement in achieving discrete DNI level classification, it also highlighted areas for further refinement, particularly in aligning the estimates more closely with the continuous readings from standard instruments like the MS-57. This study not only adds a novel dimension to solar energy forecasting but also paves the way for future research in employing AI and machine learning for more accurate, efficient, and sustainable energy solutions.
Supplementary Materials
The datasets and code supporting this study are publicly available on GitHub for further research and development. The repository contains high-resolution sky images captured over four months for training and validating the DNI estimation model. To access the code repository and image datasets, visit SolarIrradianceNowcasting on GitHub.
Author Contributions
Author Contributions: Conceptualization, F.M.A.L. and R.B.B.; methodology, F.M.A.L.; software, F.M.A.L.; validation, F.M.A.L. and R.B.B.; investigation, F.M.A.L.; data curation, F.M.A.L.; writing—original draft preparation, F.M.A.L.; writing—review and editing, R.B.B.; All authors have read and agreed to the published version of the manuscript.
Funding
This research was supported by The Mindanao Renewable Energy R&D Center (MREC) of the Ateneo de Davao University under the DOST NICER Scholarship and also received funding from the DOST-NSTEP for $10,000.00, which was allocated towards the fabrication and experimentation costs of the study.
Data Availability Statement
Explore a detailed collection of images from our four-month study period, offering deeper insights into our research. Access these images at Supplementary Images for DNI Study. These additional resources enhance the understanding of our methodology
Acknowledgments
The authors would like to acknowledge DOST Science for Chance (S4C) for supporting the project through the instruments used by the researcher for data gathering and Ateneo de Davao for the research site of implementation.
Conflicts of Interest
The authors declare no conflicts of interest in preparing this manuscript. The research was conducted with full academic independence. The funding sources, namely The Mindanao Renewable Energy R&D Center (MREC) of the Ateneo de Davao University and DOST-NSTEP, had no role in the design of the study; in the collection, analyses, or interpretation of data; in the writing of the manuscript; or in the decision to publish the results.
References
- Marquez, R.; Pedro, H.T.C.; Coimbra, C.F.M. Intra-hour DNI forecasting based on cloud tracking image analysis. Solar Energy 2013, 91, 327–336. [Google Scholar] [CrossRef]
- Skowronski, J. Pel recursive motion estimation and compensation in subbands. Signal Processing: Image Communication 1999, 14, 389–396. [Google Scholar] [CrossRef]
- Song, B.C.; Ra, J.B. A fast multi-resolution block matching algorithm for motion estimation. Signal Processing: Image Communication 2000, 15, 799–810. [Google Scholar]
- Chen, W.; Mied, R.P. Optical flow estimation for motion-compensated compression. Image and Vision Computing 2013, 31, 275–289. [Google Scholar] [CrossRef]
- Chauvin, R.; Nou, J.; Thil, S.; Grieu, S. Modelling the clear-sky intensity distribution using a sky imager. Solar Energy 2015, 119, 1–17. [Google Scholar] [CrossRef]
- Moreno-Tejera, S.; et al. Classification of days according to DNI profiles using clustering techniques. 2017. [Google Scholar]
- Zhu, L.; et al. A Method of Cloud Classification Based on DNI. 2016; 2016. [Google Scholar]
Figure 1.
Presented the setup flow from image capture to initial tagging and labeling.
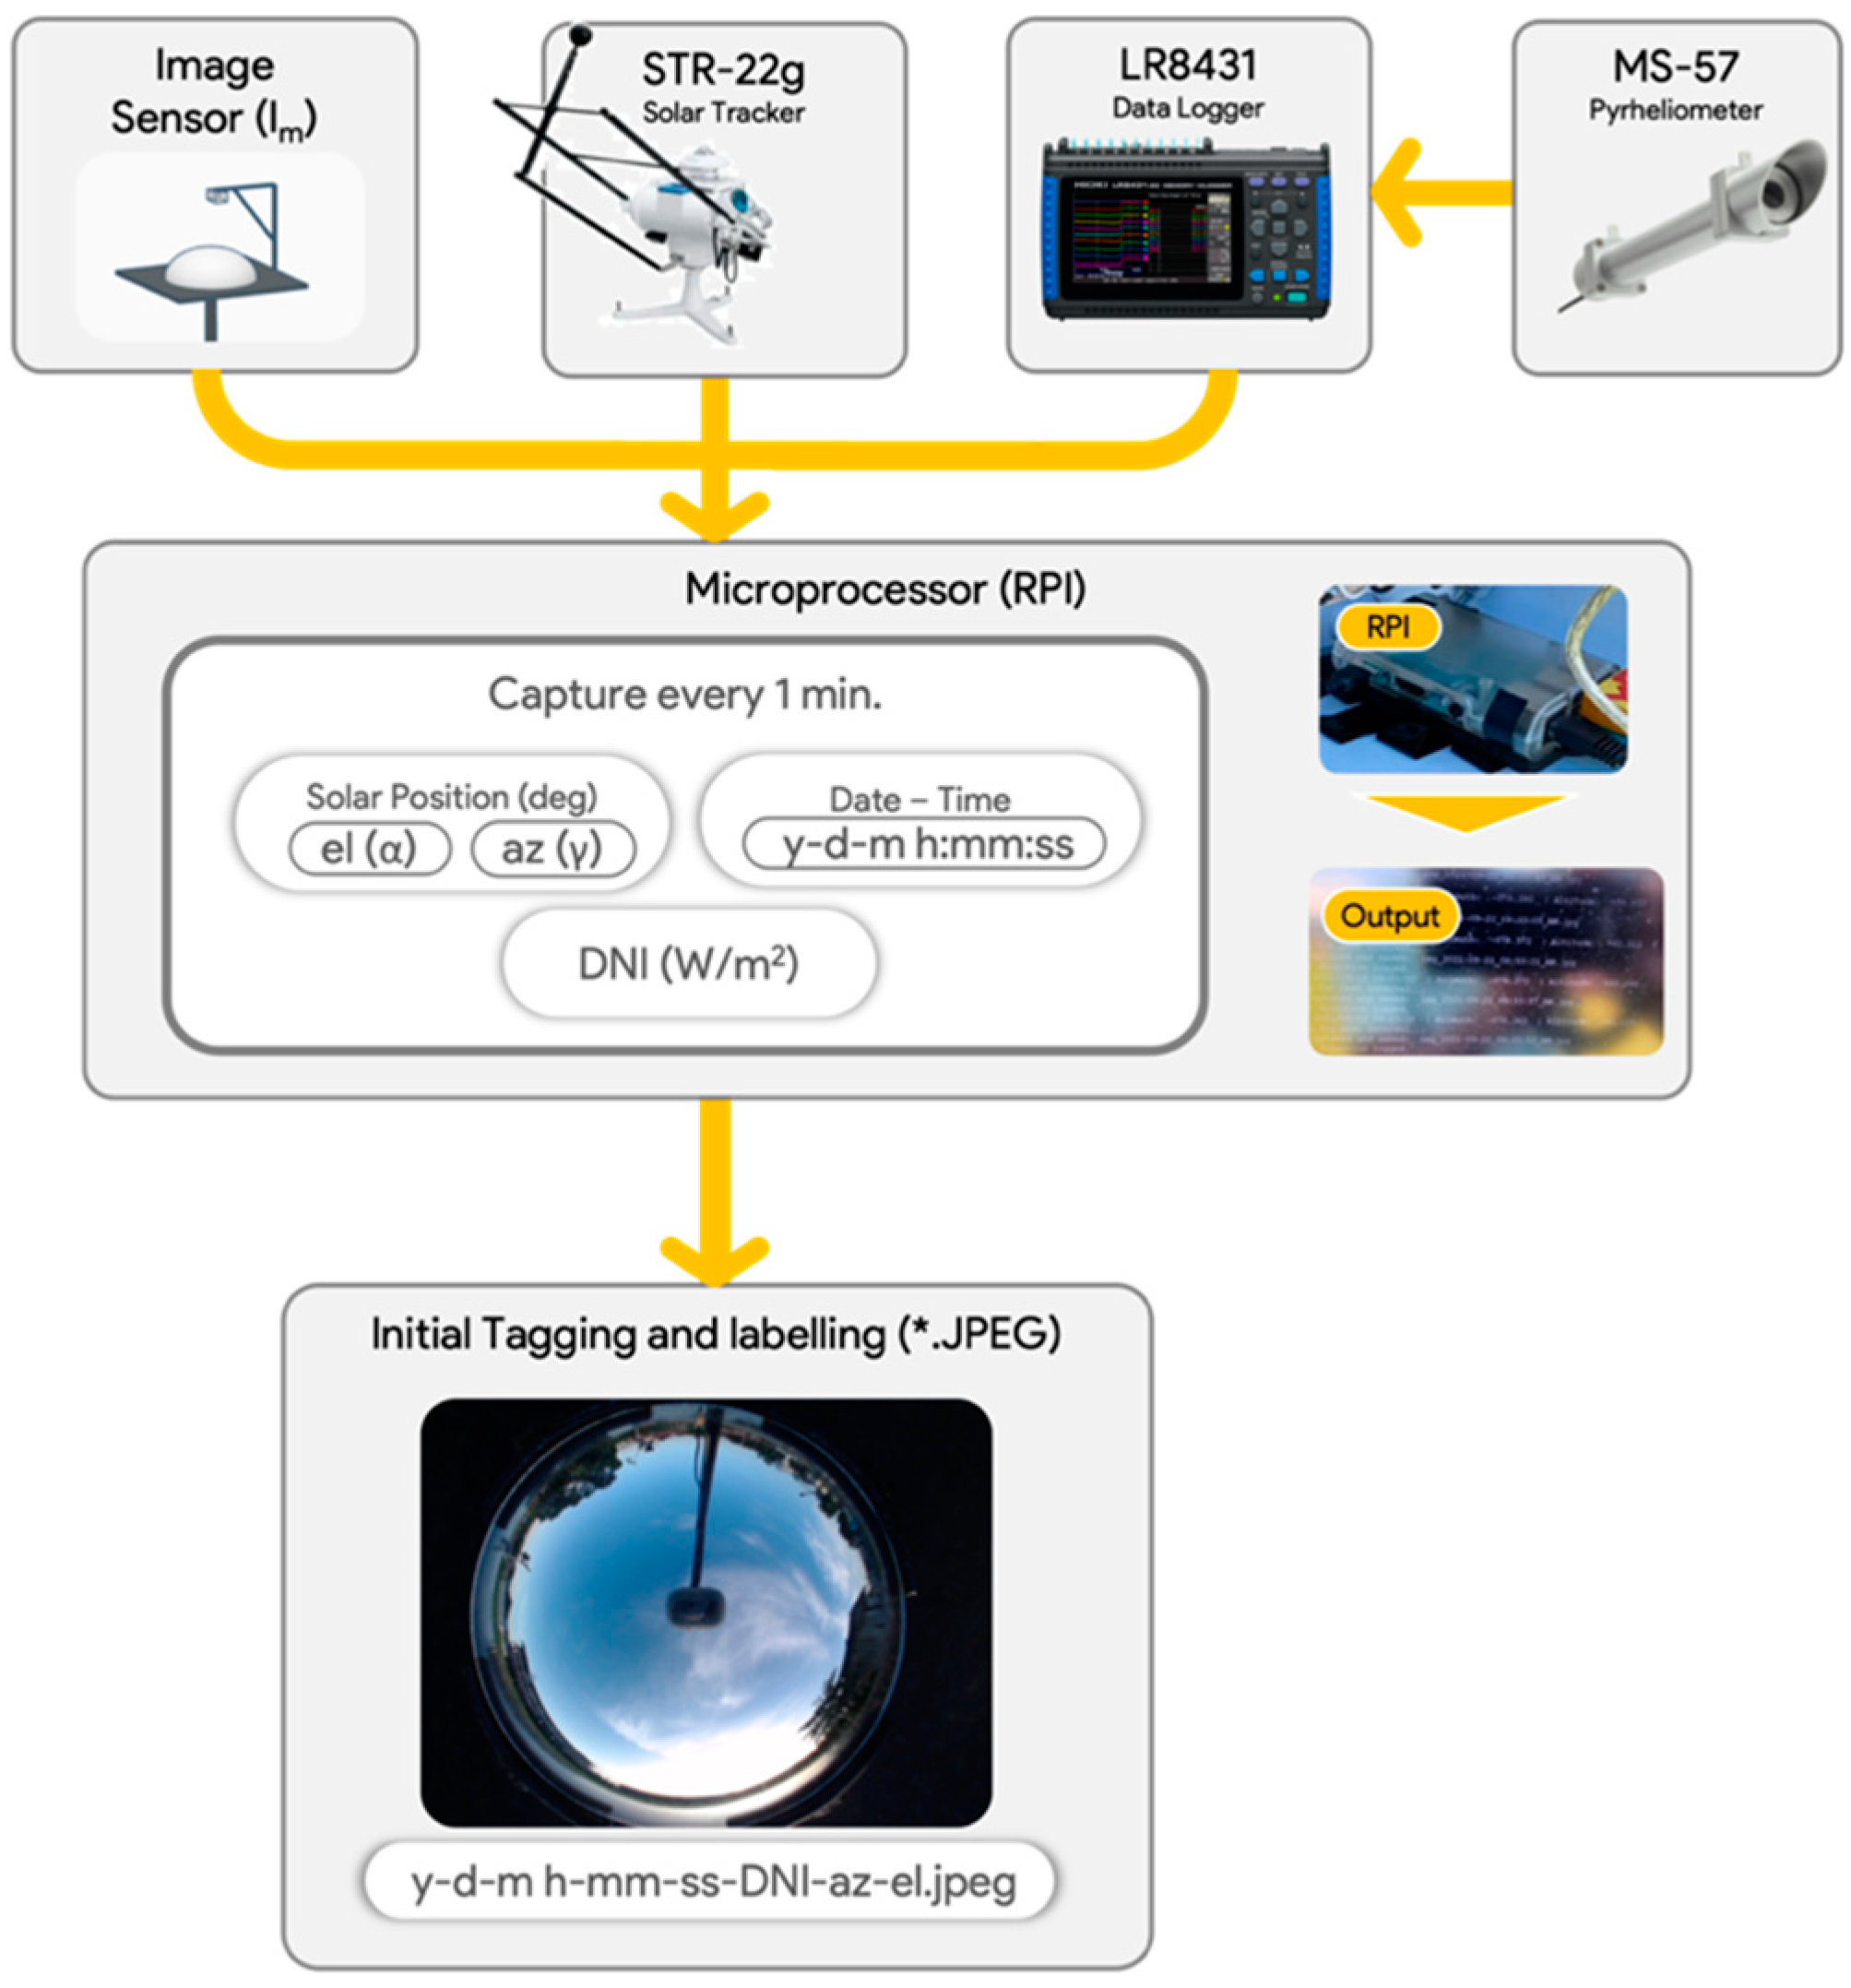
Figure 2.
Detailed View of the Custom-Designed Solar Imaging Prototype.
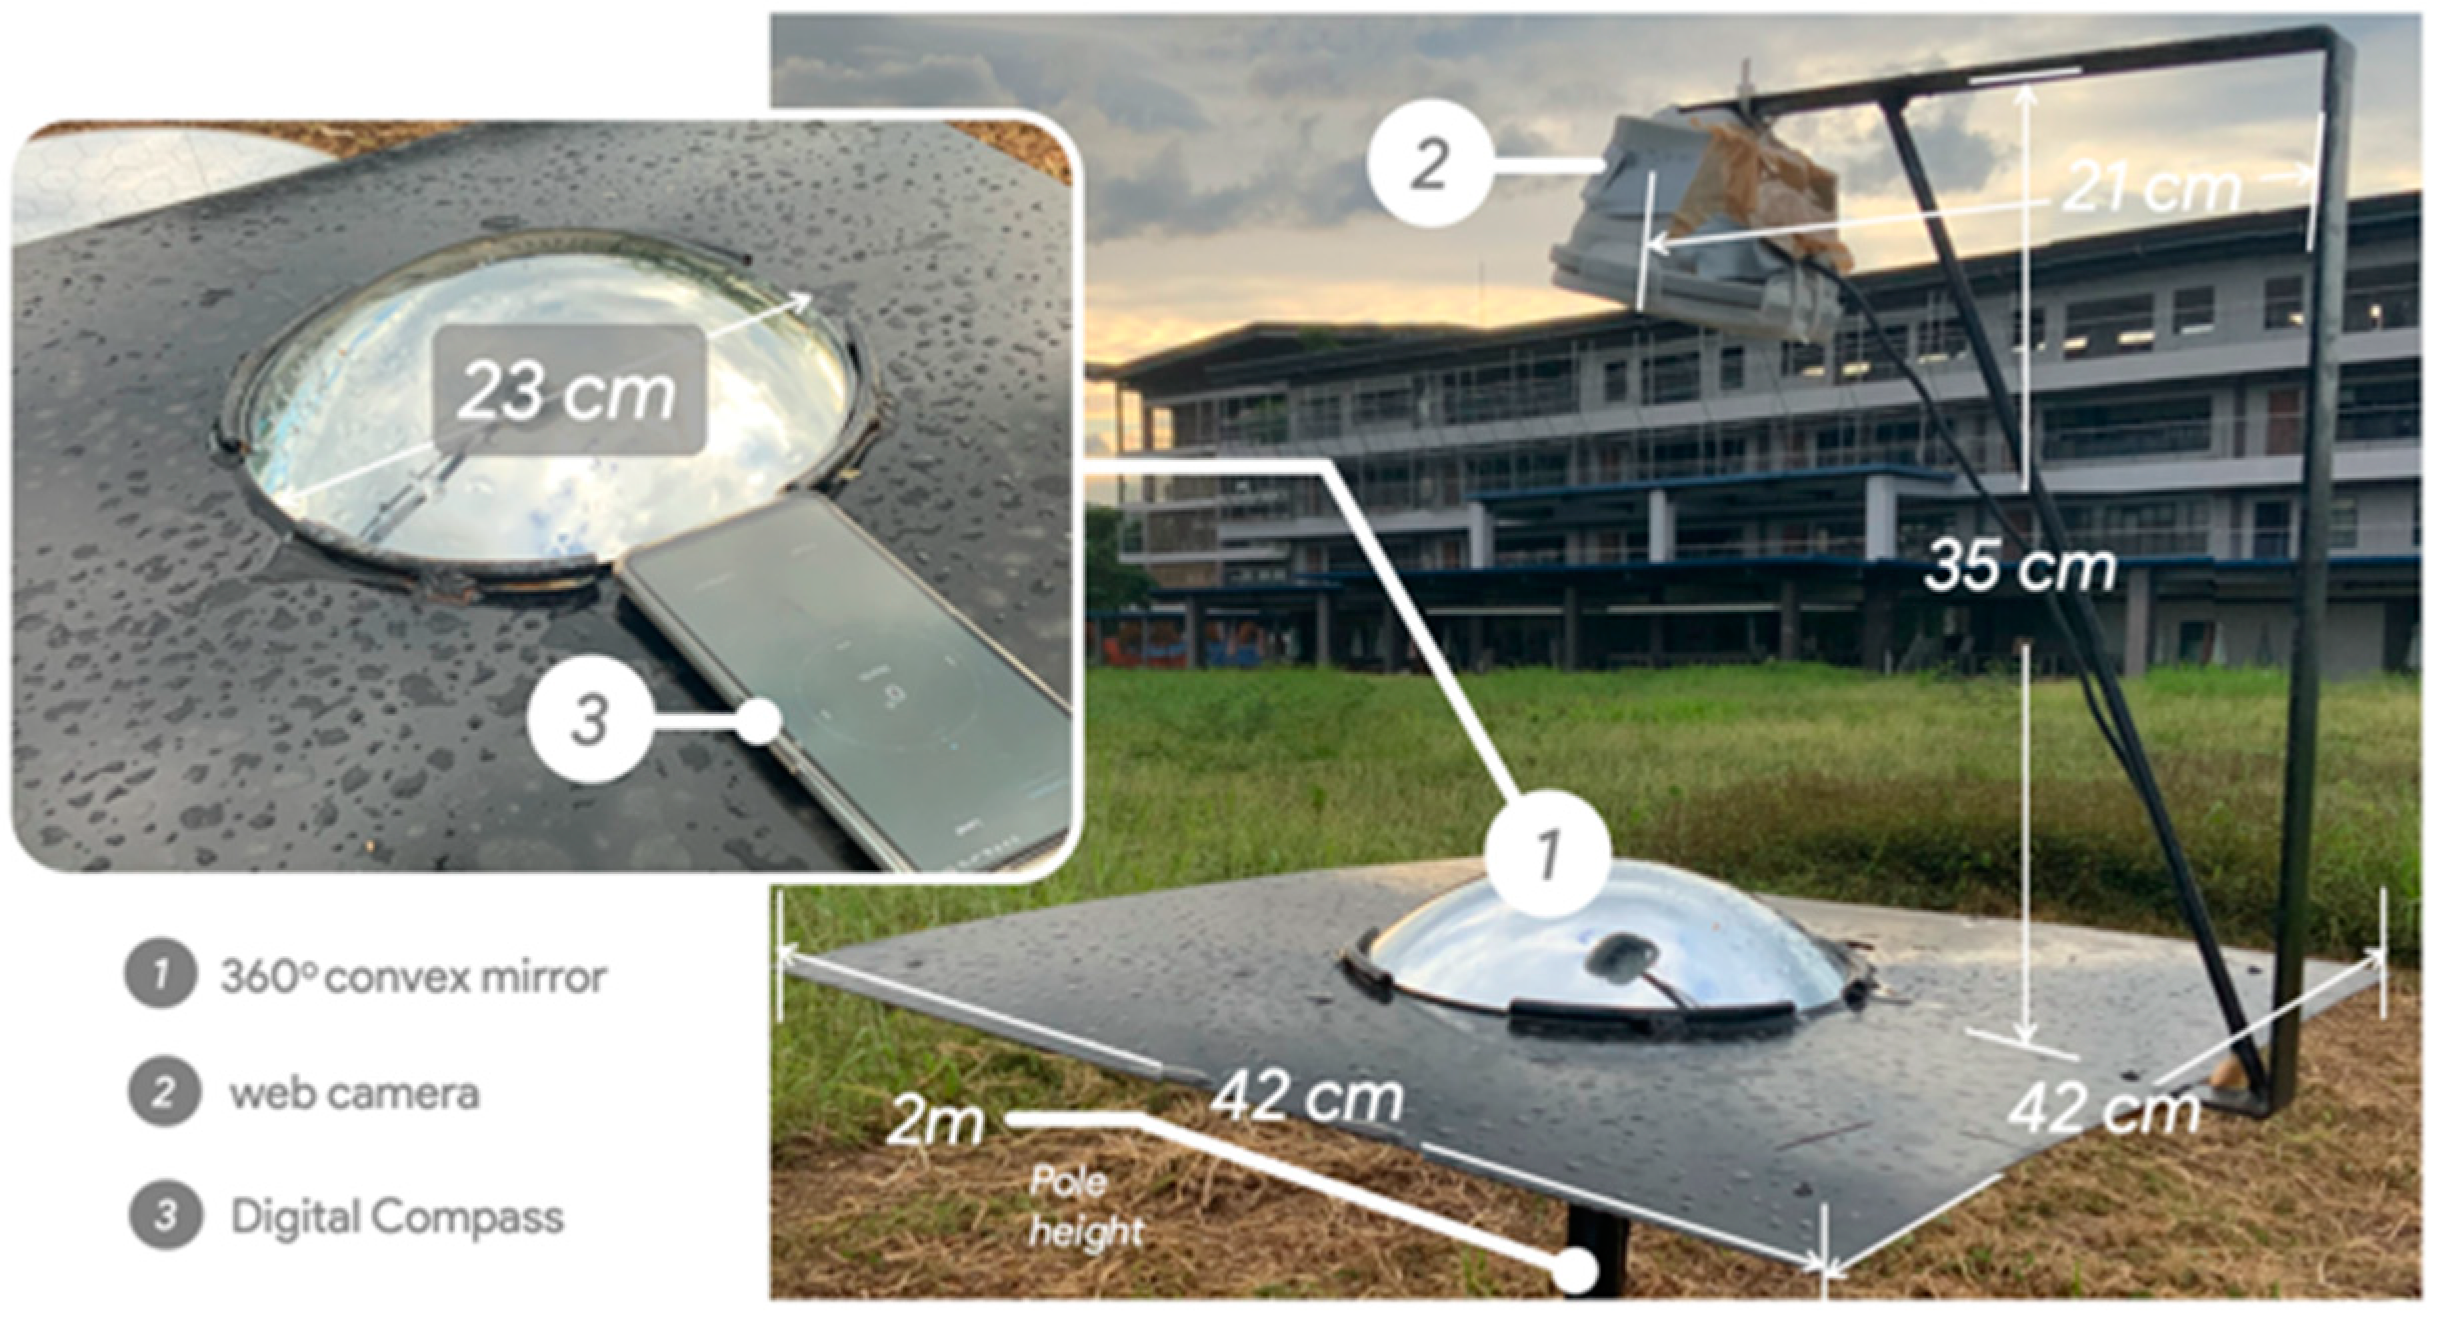
Figure 3.
Captured output illustrating the solar position (1) and the bounding box (2) of the highest radiation zone. The image depicts the precision of the system’s real-time solar tracking capabilities, with the centroid and solar coordinates dynamically displayed for optimal solar irradiance estimation.
Figure 3.
Captured output illustrating the solar position (1) and the bounding box (2) of the highest radiation zone. The image depicts the precision of the system’s real-time solar tracking capabilities, with the centroid and solar coordinates dynamically displayed for optimal solar irradiance estimation.
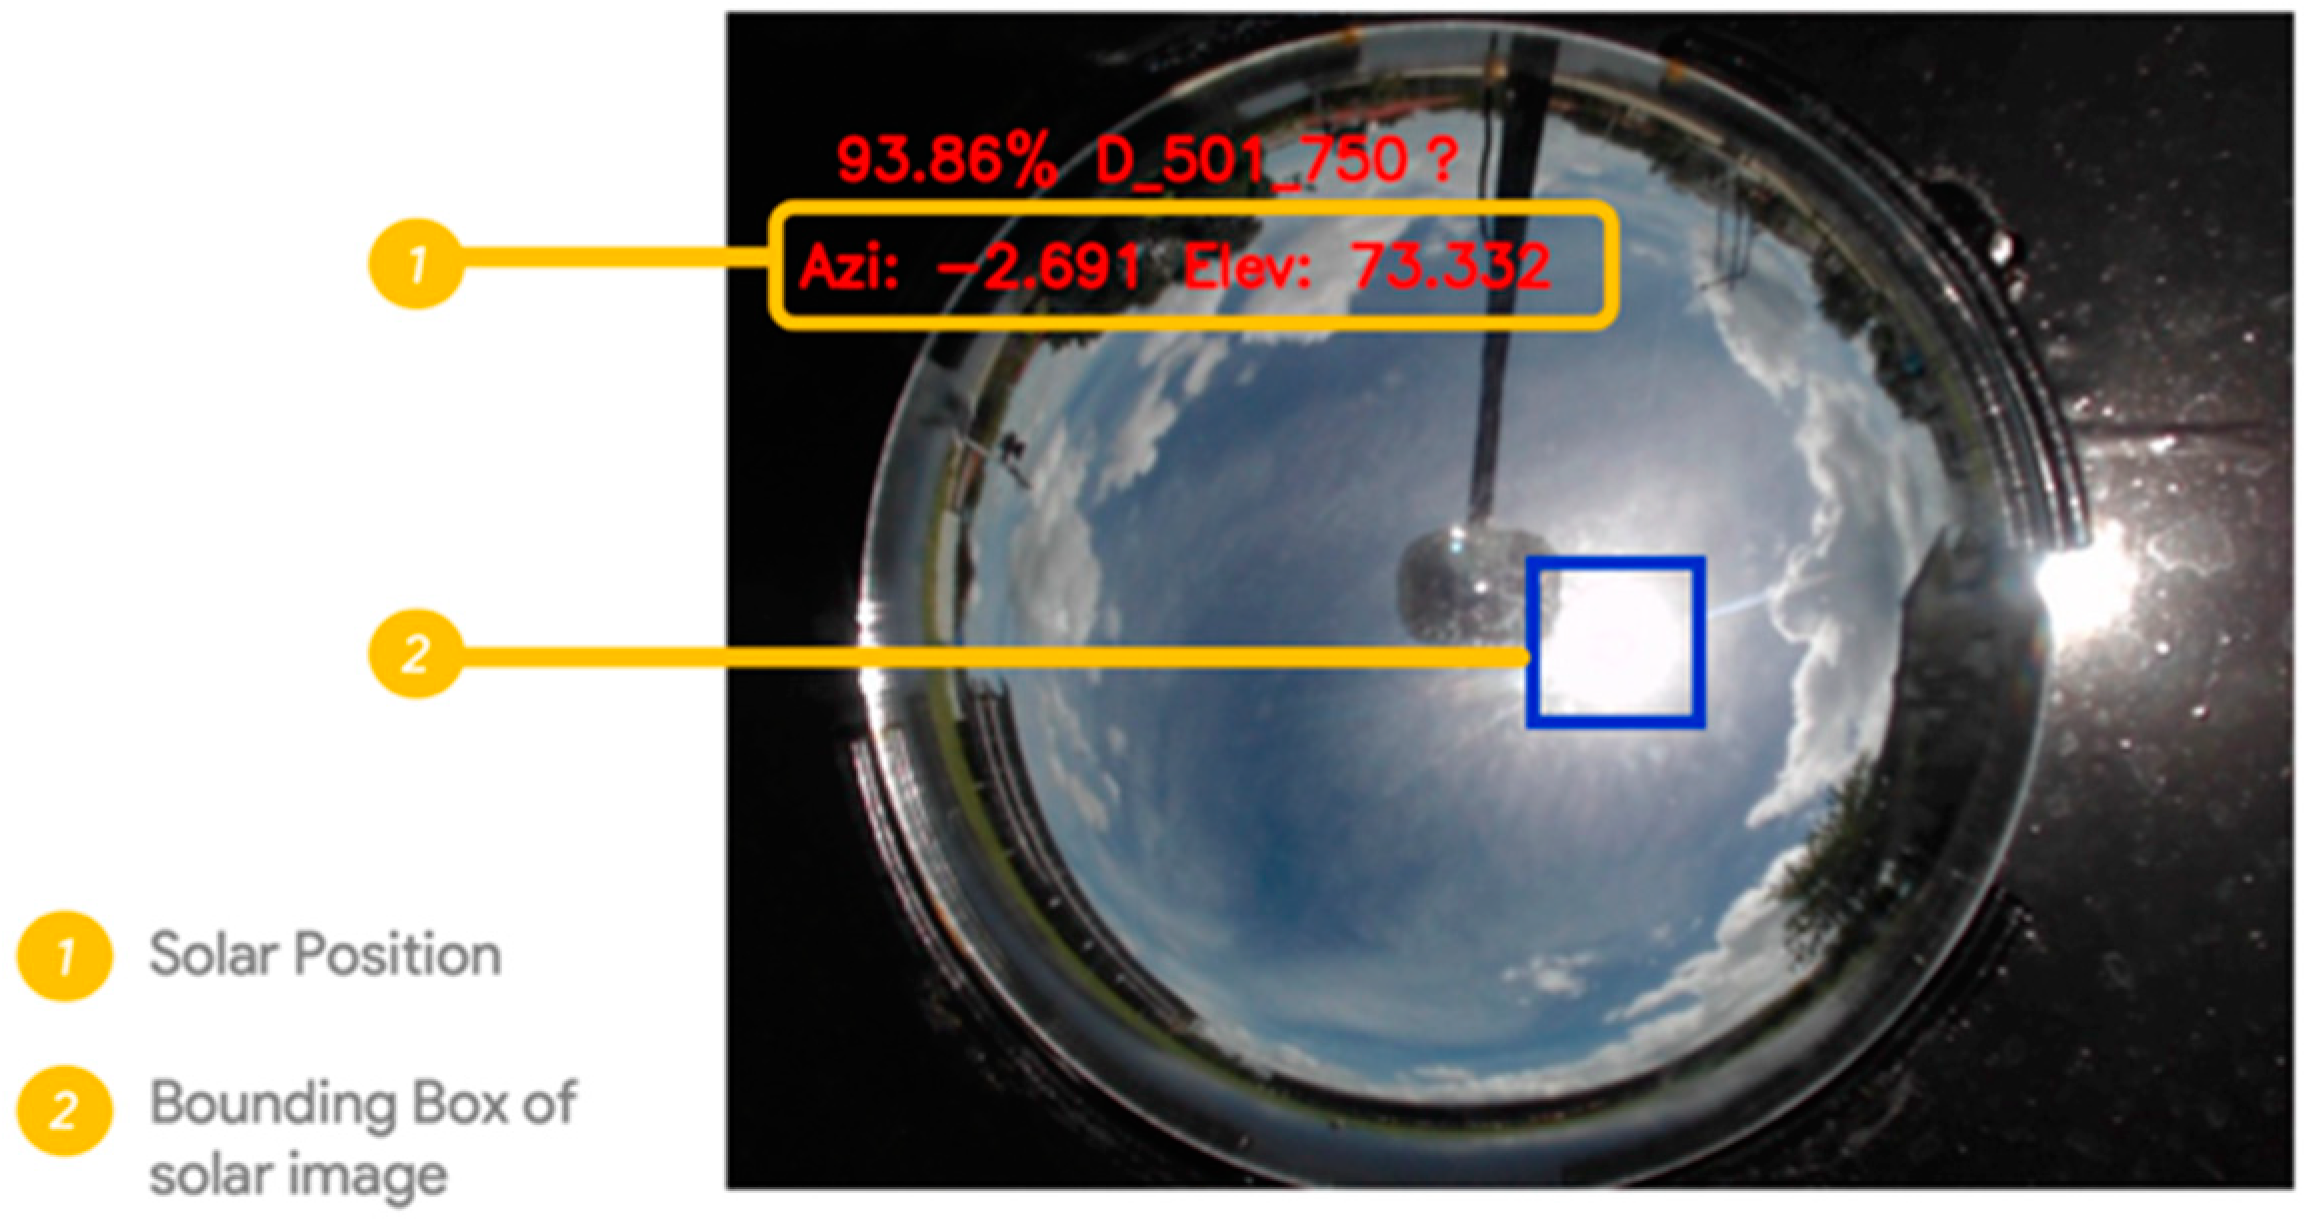
Figure 4.
Training and validation performance of the DNI estimation model over 121 epochs, showcasing training accuracy and loss alongside validation accuracy and loss.
Figure 4.
Training and validation performance of the DNI estimation model over 121 epochs, showcasing training accuracy and loss alongside validation accuracy and loss.
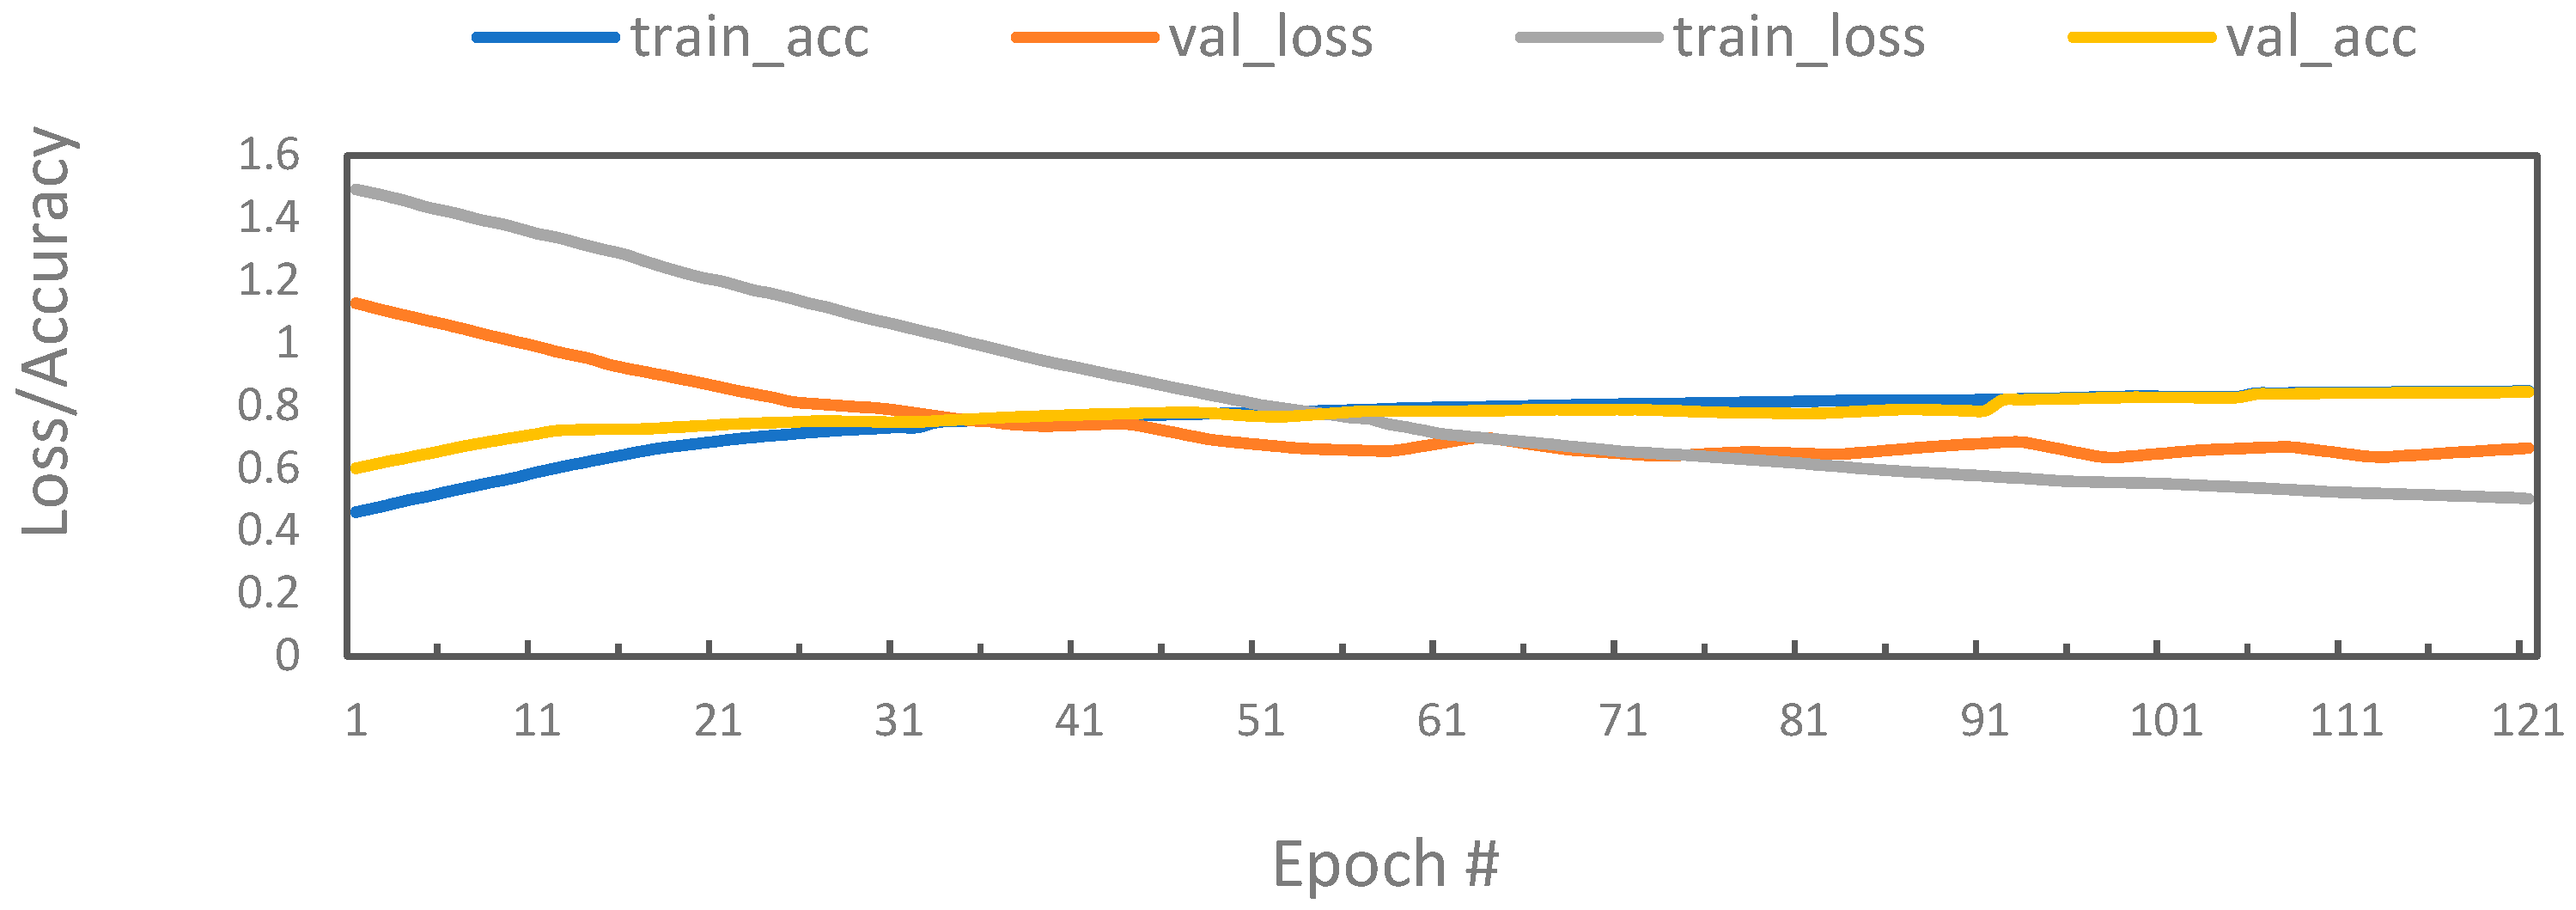
Figure 5.
Confusion Matrix with 85.74% accuracy.
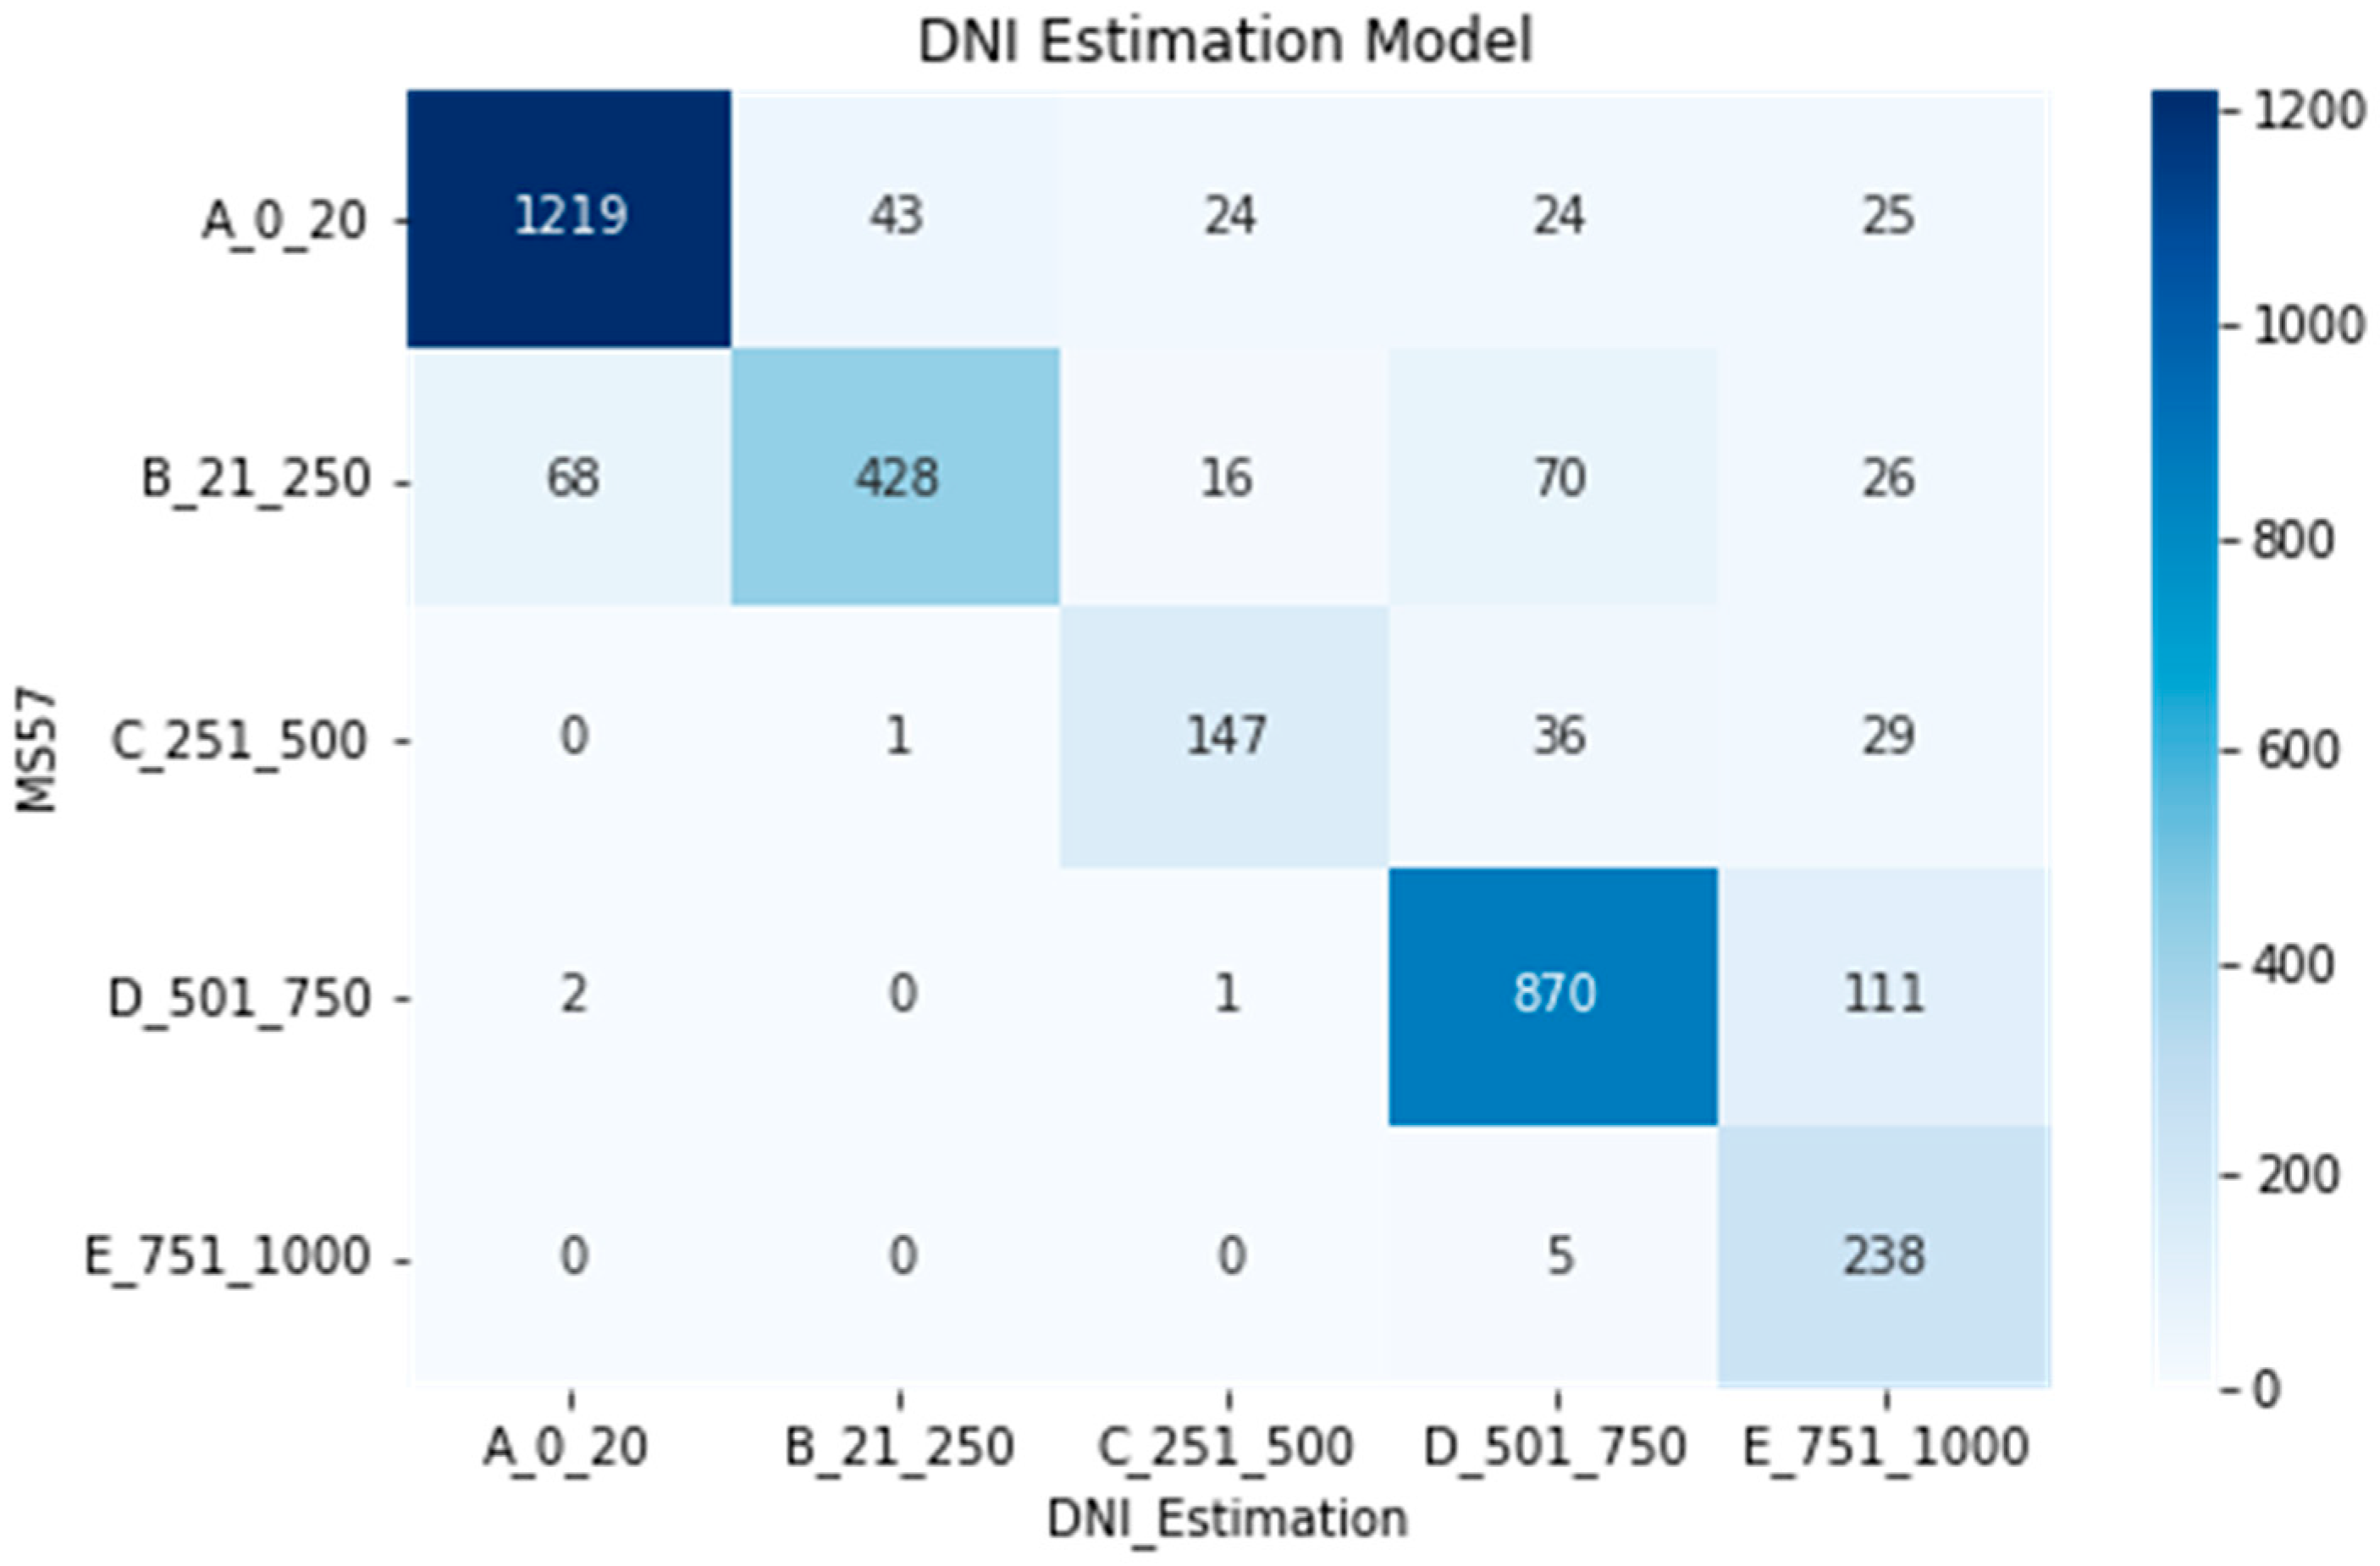
Figure 6.
Class A_0-20 (a)-(d) Most Confident, (e)-(f) Least Confident.
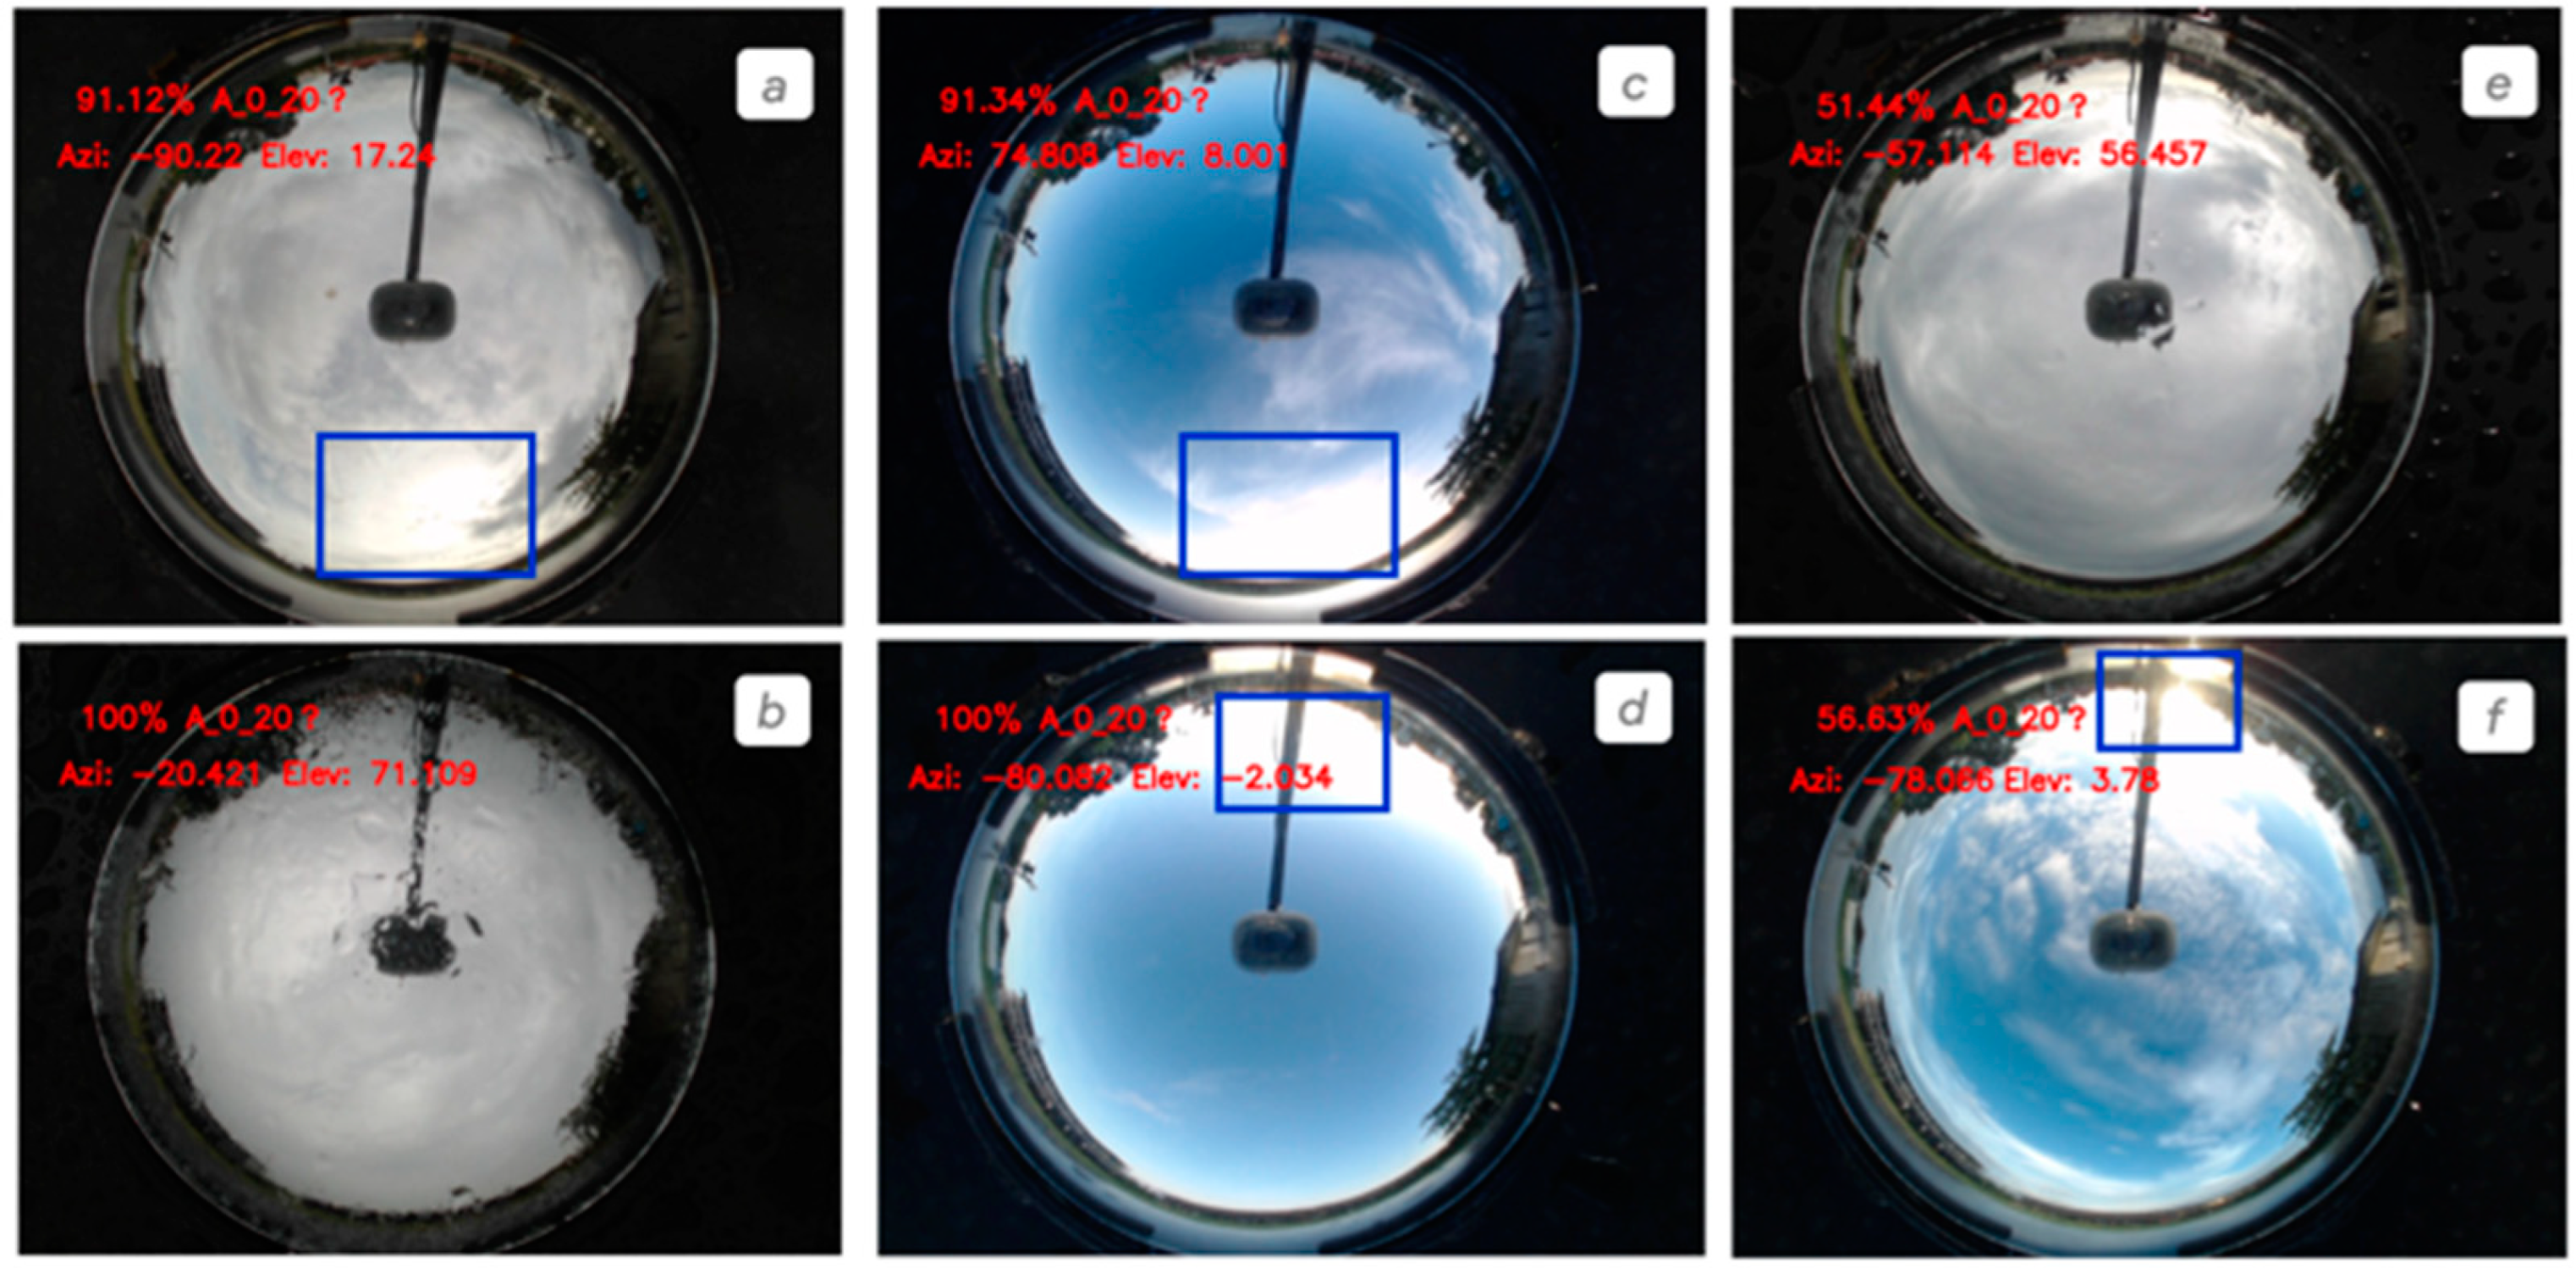
Figure 7.
Class B_21-250 (a)-(d) Most Confident, (e)-(f) Least Confident.
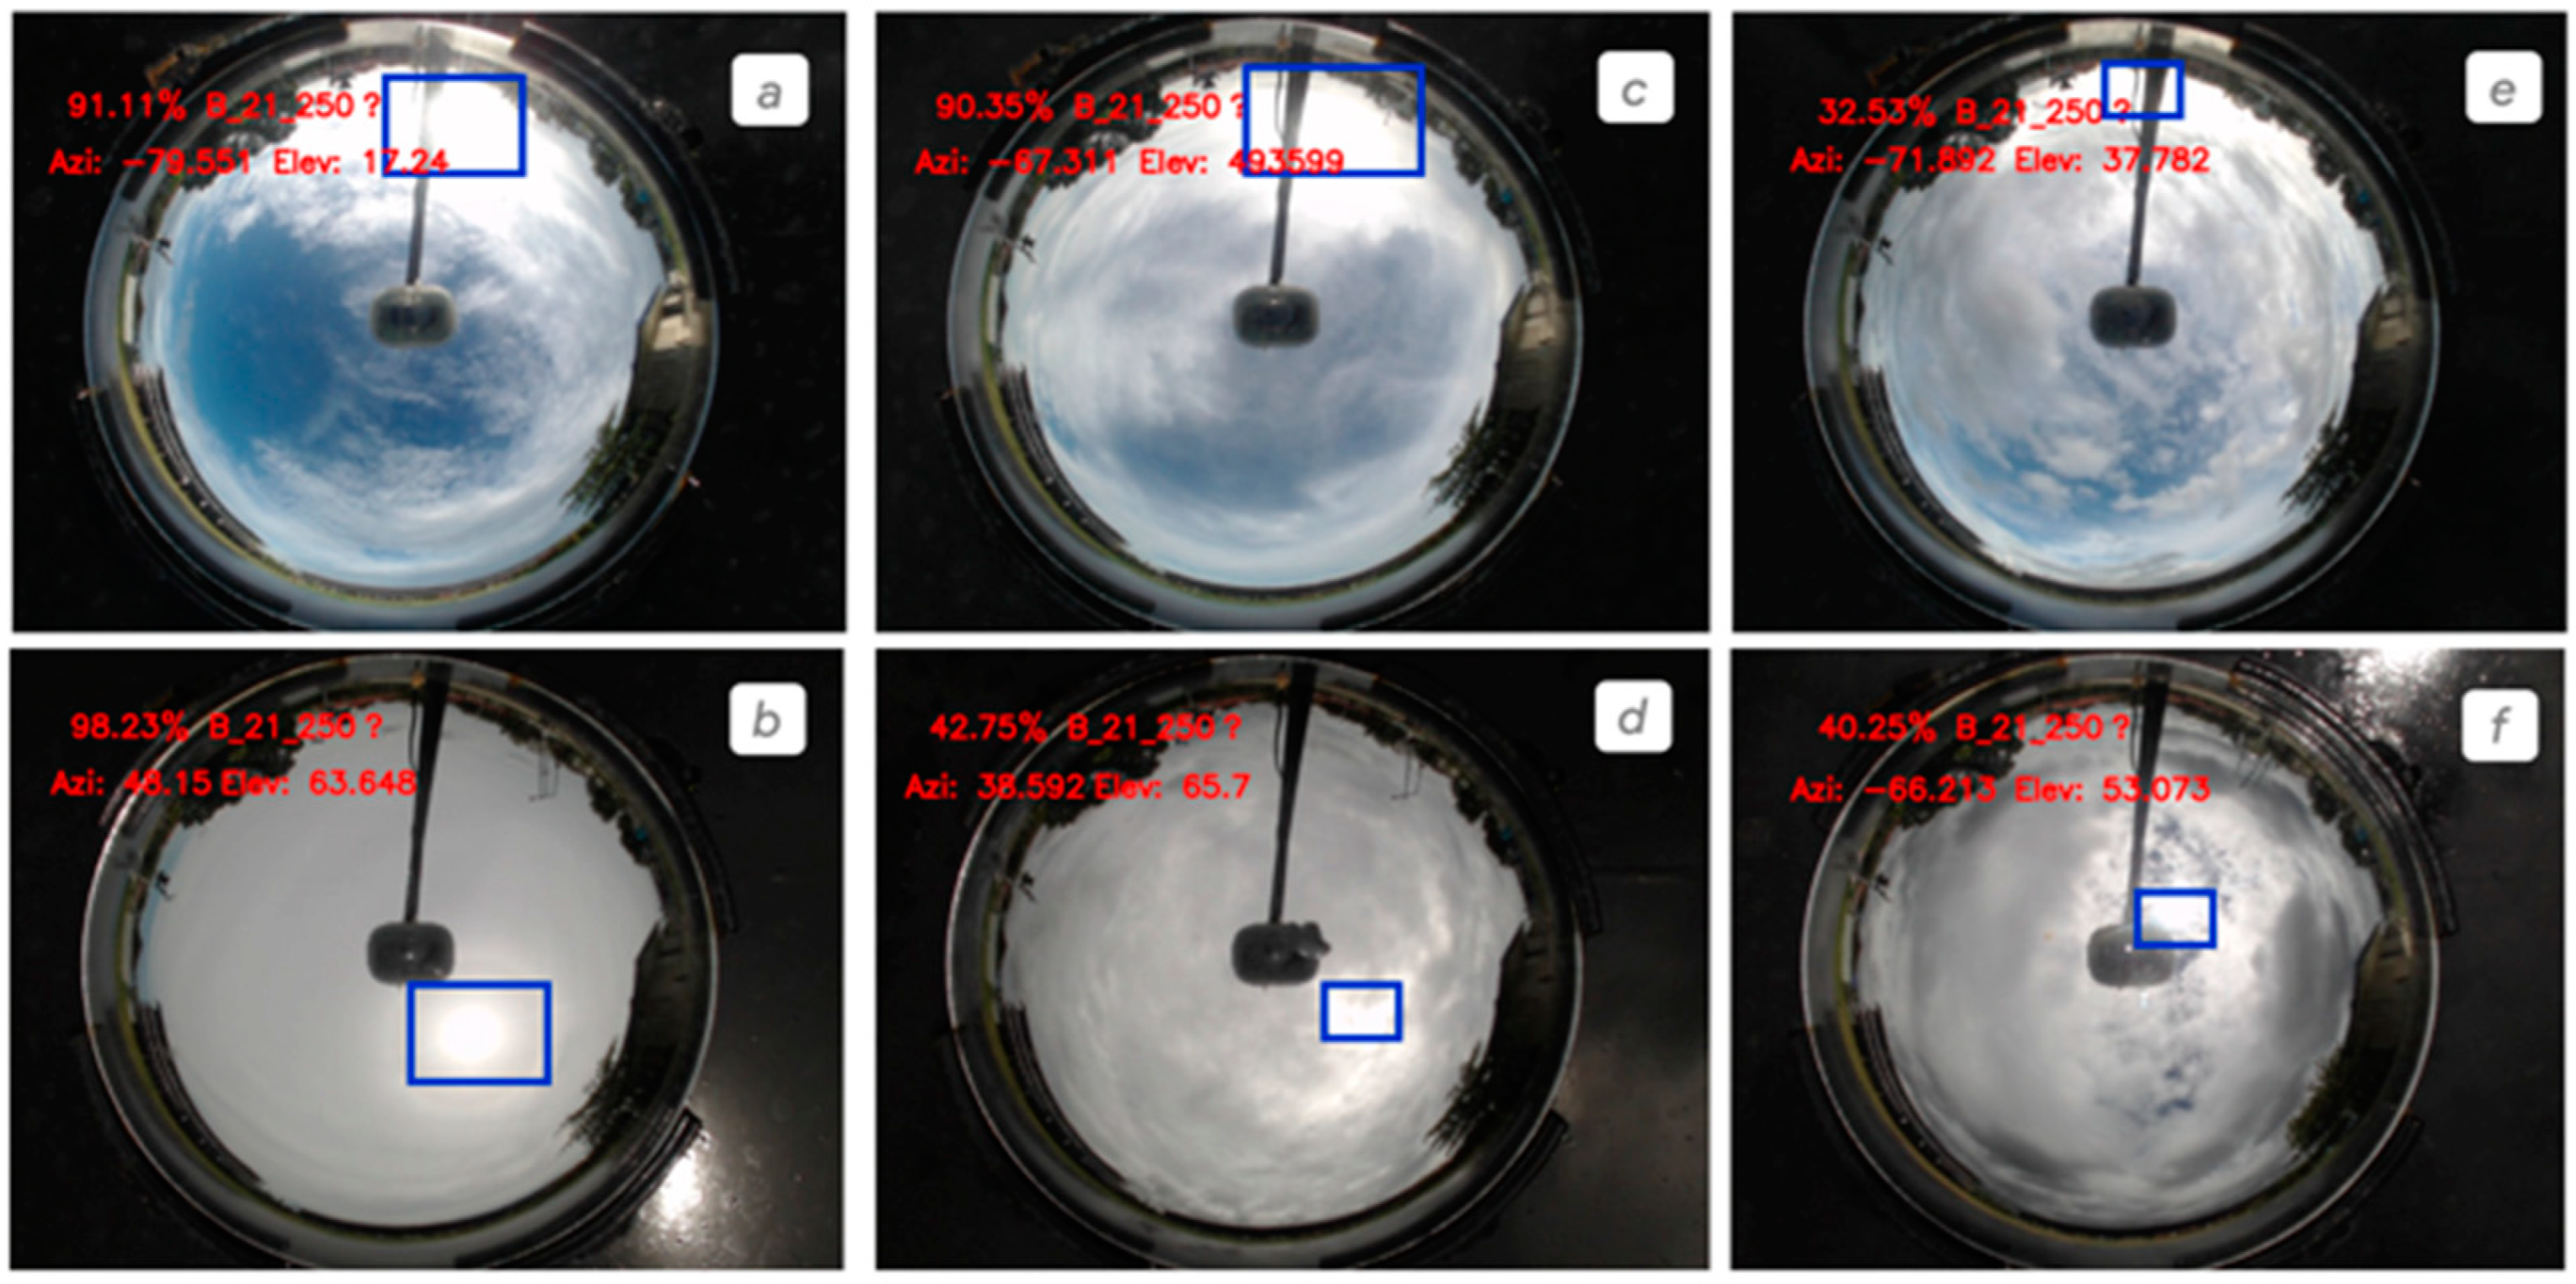
Figure 8.
Class C_251-500 The recognition results of the ReSENet-50 model after training.
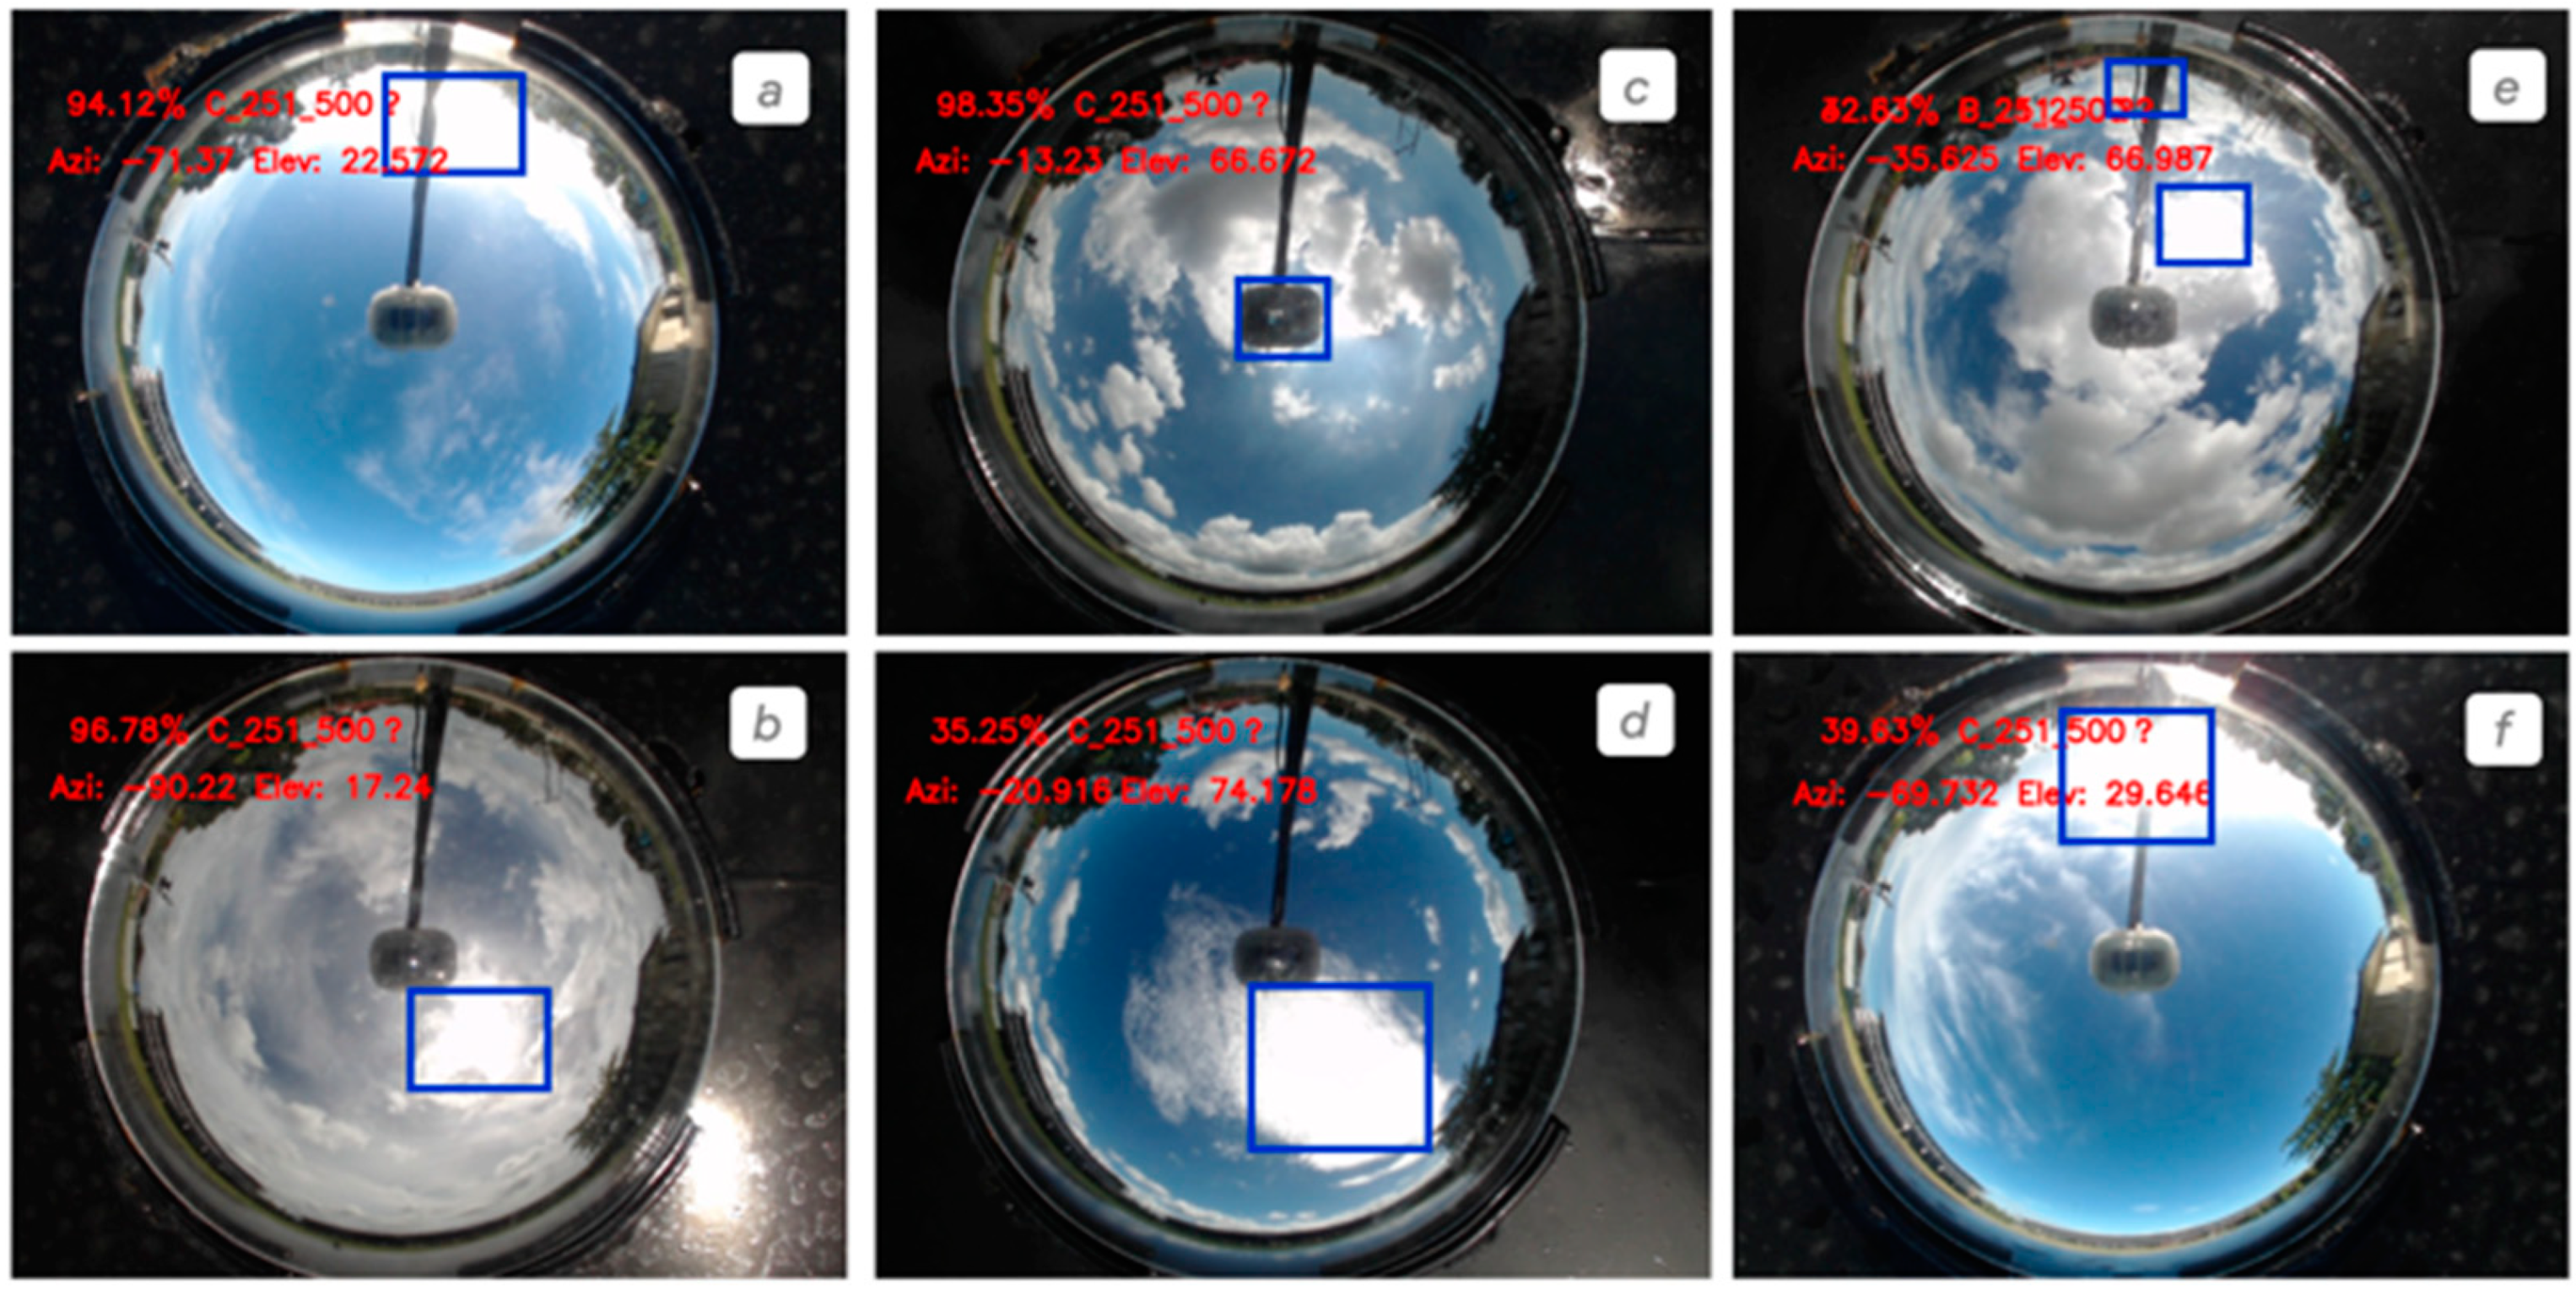
Figure 9.
Class D_501-750 The recognition results of the ReSENet-50 model after training.
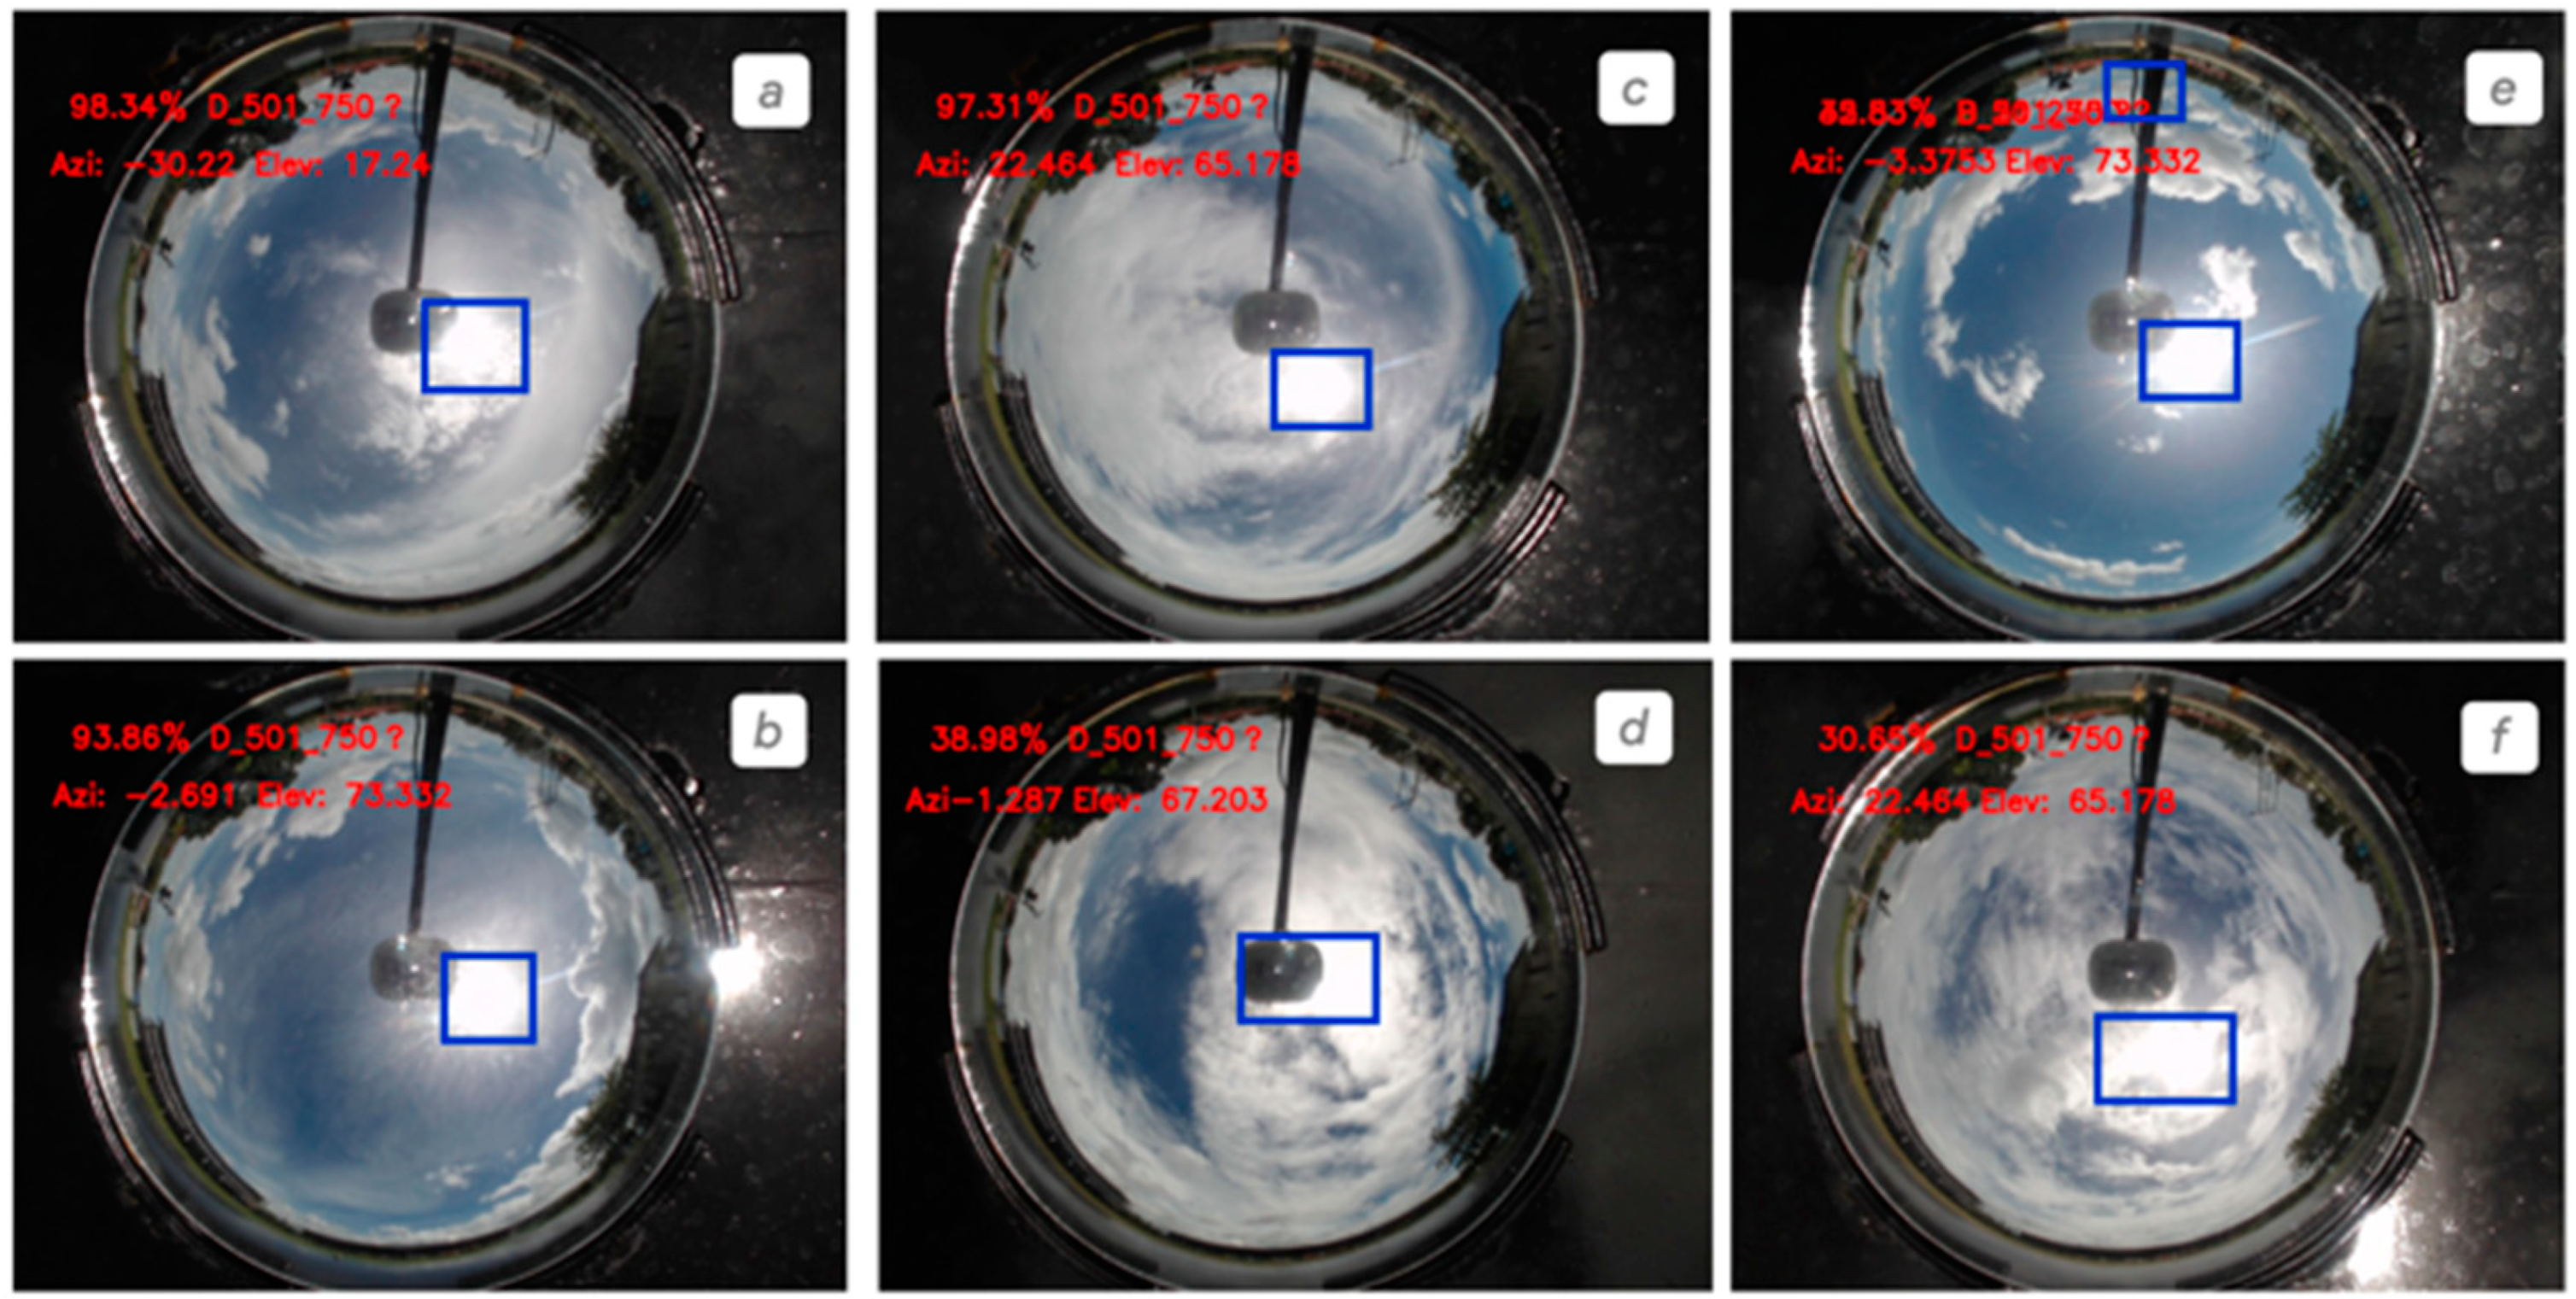
Figure 10.
Class E_751-1000 The recognition results of the ReSENet-50 model after training.
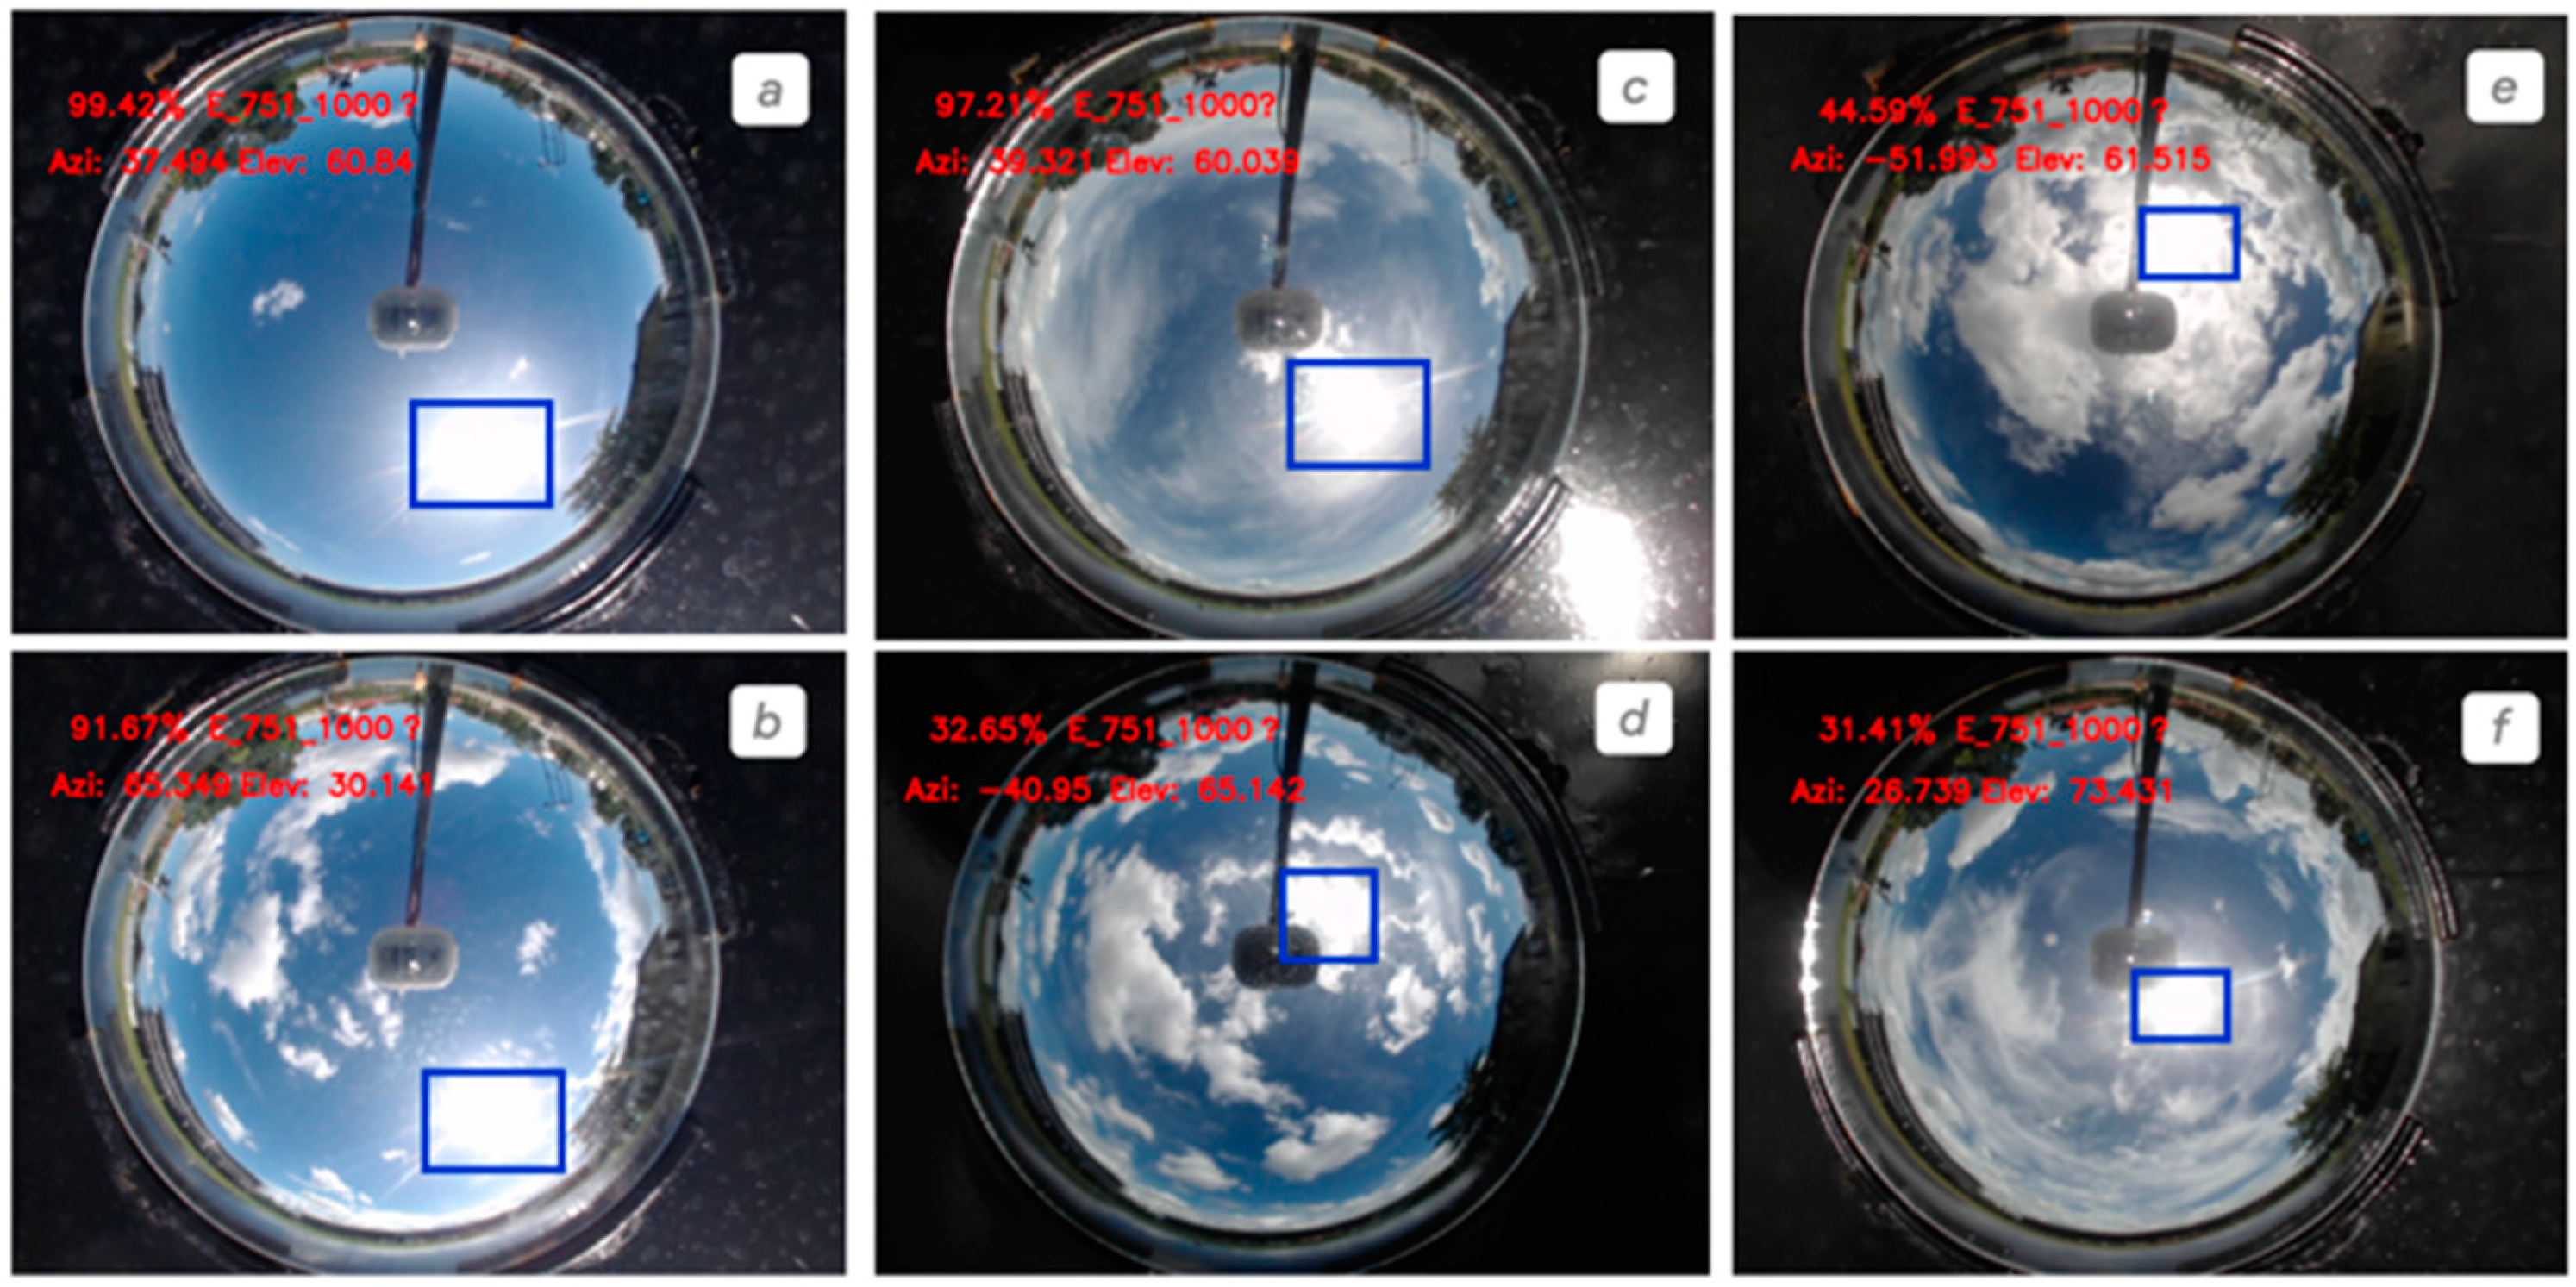
Figure 11.
Comparison of Model-Estimated DNI and MS-57 Measured DNI, highlighting a 15.53% prediction variance through a distinct red line, underscoring the scope for refining the model’s estimation accuracy to align with continuous instrument data.
Figure 11.
Comparison of Model-Estimated DNI and MS-57 Measured DNI, highlighting a 15.53% prediction variance through a distinct red line, underscoring the scope for refining the model’s estimation accuracy to align with continuous instrument data.
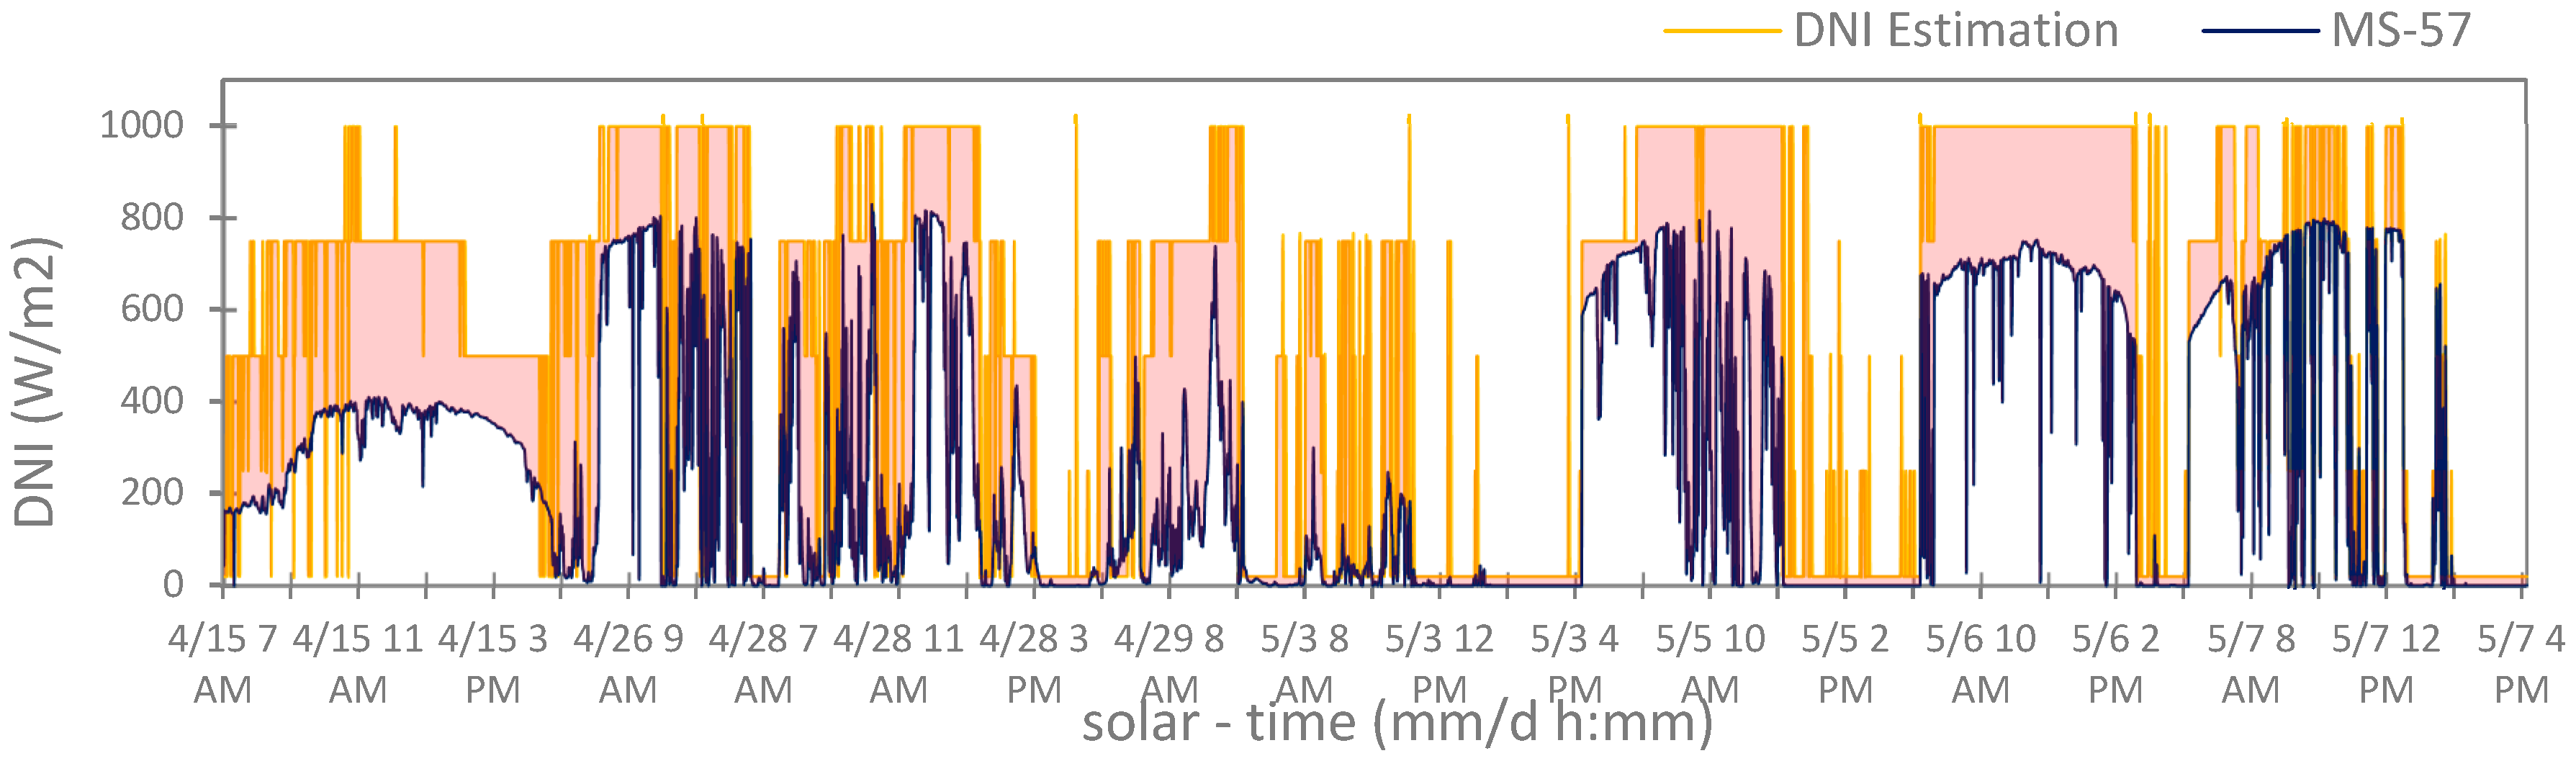
Figure 12.
Comparative Box Plot of DNI Estimates Against MS-57 Measurements.
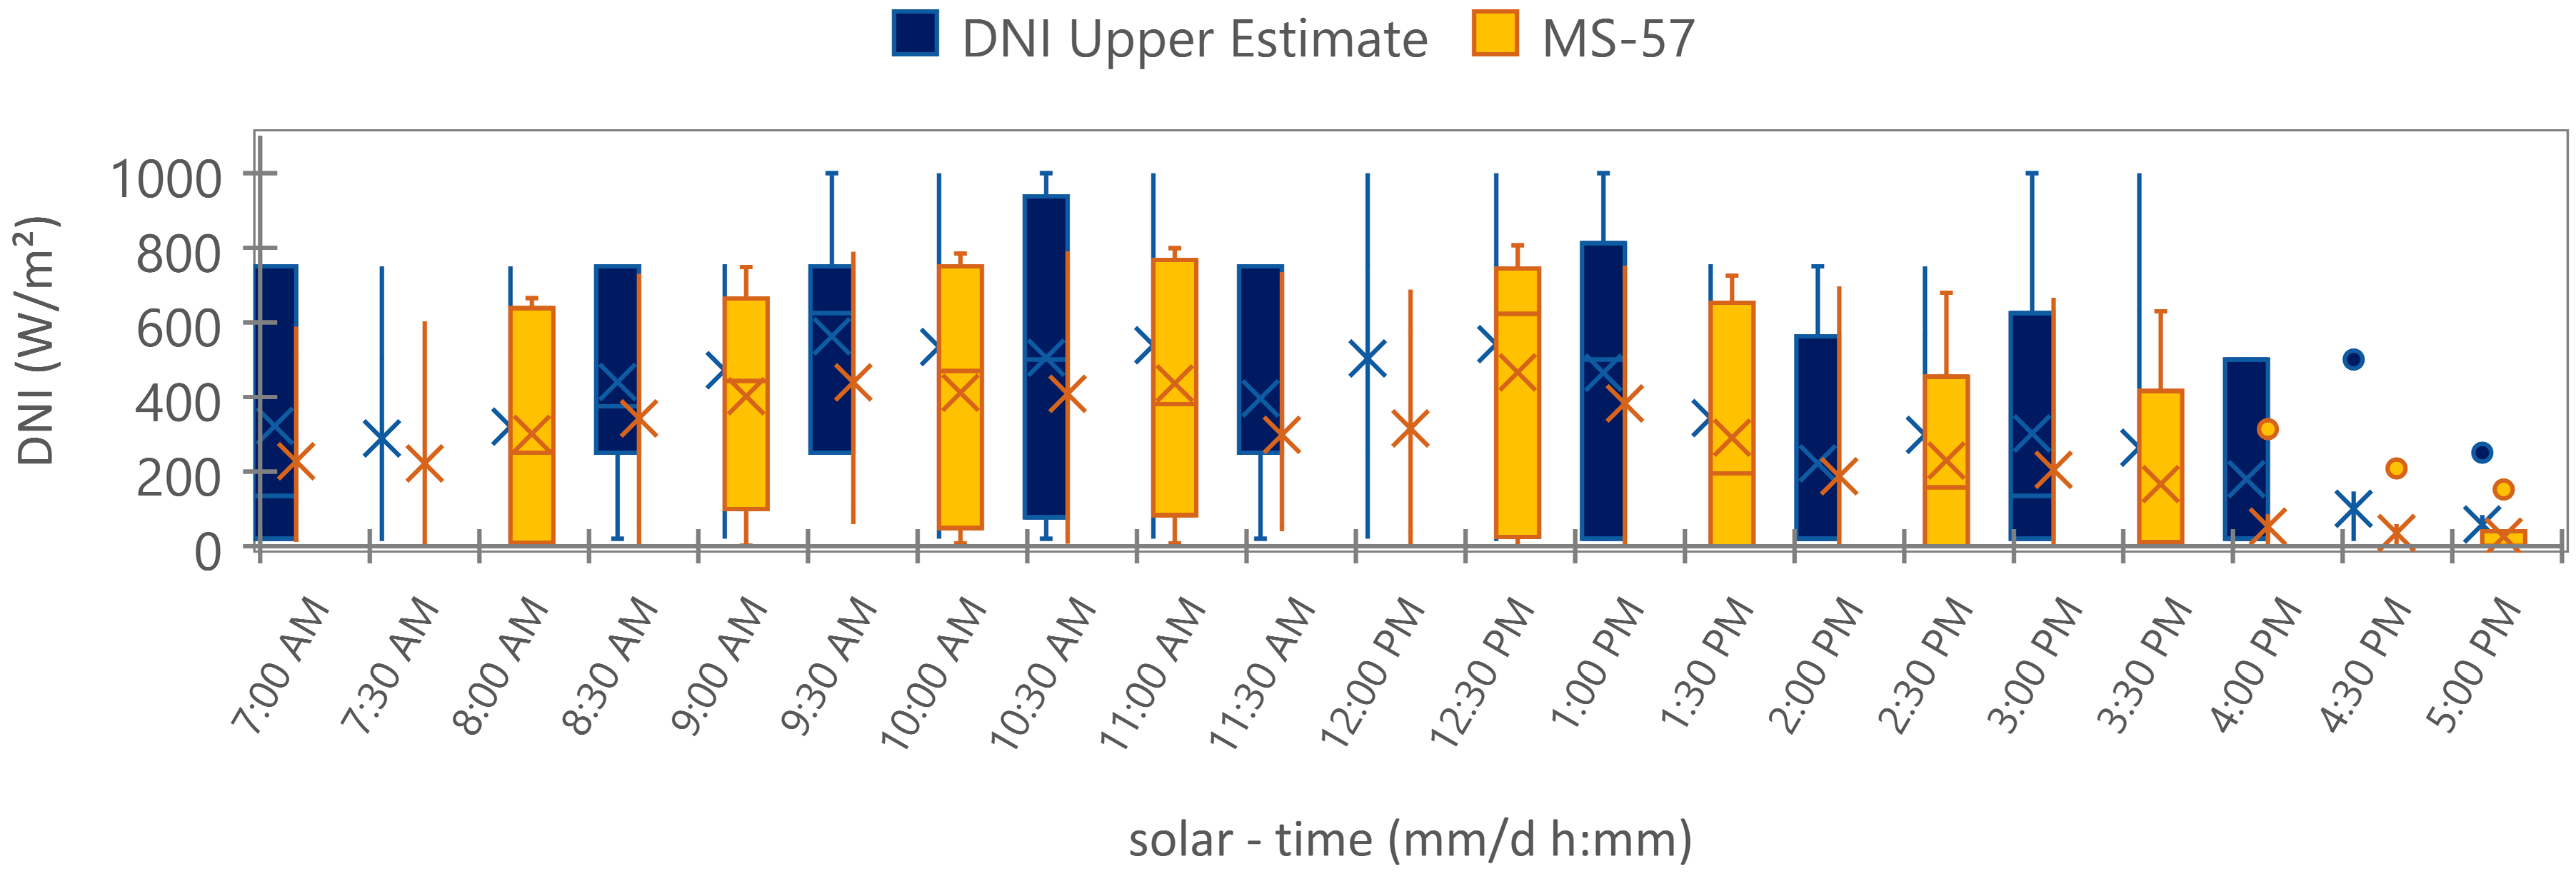
Table 1.
Classification Accuracy for Different DNI Ranges.
| No. of Classes | Distribution | DNI Categories | Accuracy (%) |
|---|---|---|---|
| 4 | Equal | A: 0-250 B: 251-500 C: 501-750 D: 751-1000 |
78.21 |
| 5 | Equal | A: 0-200 B: 201-400 C: 401-600 D: 601-800 E: 801-1000 |
82.56 |
| 5 | Not Equal | A: 0-20 B: 21-250 C: 251-500 D: 501-750 E: 751-1000 |
85.71 |
Table 3.
Performance metrics Calculation.
| precision | recall | f1-score | TNR | FPR | MCC | |
|---|---|---|---|---|---|---|
| A_0_20 | 0.913109 | 0.945694 | 0.929116 | 0.965820 | 0.034179 | 0.88459 |
| B_21_250 | 0.703947 | 0.90678 | 0.792593 | 0.984144 | 0.015855 | 0.762495 |
| C_251_500 | 0.690141 | 0.781915 | 0.733167 | 0.987066 | 0.012933 | 0.718003 |
| D_501_750 | 0.884146 | 0.865672 | 0.874811 | 0.943726 | 0.056273 | 0.822786 |
| E_751_1000 | 0.979424 | 0.554779 | 0.708333 | 0.93917 | 0.060828 | 0.712784 |
| accuracy | 0.857819 | |||||
Disclaimer/Publisher’s Note: The statements, opinions and data contained in all publications are solely those of the individual author(s) and contributor(s) and not of MDPI and/or the editor(s). MDPI and/or the editor(s) disclaim responsibility for any injury to people or property resulting from any ideas, methods, instructions or products referred to in the content. |
© 2024 by the authors. Licensee MDPI, Basel, Switzerland. This article is an open access article distributed under the terms and conditions of the Creative Commons Attribution (CC BY) license (http://creativecommons.org/licenses/by/4.0/).
Copyright: This open access article is published under a Creative Commons CC BY 4.0 license, which permit the free download, distribution, and reuse, provided that the author and preprint are cited in any reuse.


