Preprint
Article

Size Structured Method Applied to the Brown Crab Fishery Callinectes bellicosus in the Gulf of California

Altmetrics

Downloads

97

Views

48

Comments

0

A peer-reviewed article of this preprint also exists.

Submitted:

01 January 2024

Posted:

03 January 2024

You are already at the latest version

Alerts
Abstract
The crab’s fishery of the genus Callinectes is one of the most important fisheries in Mexico. Sonora and Sinaloa are the states in the eastern coast of the Gulf of California, the mainland coast. Sinaloa encompass the greatest production in Mexico of these species, in particular the Bahía Santa Maria La Reforma (BSMR), supply the most important catches. An administrative mandatory document for the fishery is the Management Plan of Crab. One of the main weaknesses found in it for Sonora and Sinaloa is the lack of fisheries assessment in both states. For this reason, a structured size method called CASA (Catch at Size Analysis) was applied in the BSMR, in the seasons 2000, 2011 and 2014 to C. bellicosus. The first catch size (CW50%) estimated for females were 97.5, 102.5 and 100 mm, while in males it was estimated at 117.5, 107.5 and 102.5 mm. In the specific case of fishing mortality (F), the algorithm allowed us to detect that in the larger sizes the greater fishing pressure is applied for both, females and males, yielding a weighted exploitation rate of 0.047 (2000), 0.119 (2011) and 0.426 (2014) for females and 0.045 (2000), 0.295 (2011) and 0.132 (2014) for males, all below 50% (E= 0.50), crab C. bellicosus in BSMR is not at risk of over exploitation.
Keywords: 
Subject: Biology and Life Sciences  -   Aquatic Science

1. Introduction

The incorporation and development of the swimming crab fishery in Mexico has grown gradually, due to its high export demand in its different forms [1], mainly generated by the collapse of the blue crab (Callinectes sapidus) fishery in the United States. In recent years, the crab fishery of the genus Callinectes (Stimpson, 1860) has become very relevant, reaching more than 28000 tons in 2008 in total for the country. Sinaloa is the main producer with more than 40% in 2013 [2]. The presence of C. toxotes (Ordway, 1863), C. arcuatus (Ordway, 1863) and C. bellicosus (Stimpson, 1859) has been observed on the Mexican Pacific coasts, however, the latter two species generate almost the total amount of commercial catches in Sonora and Sinaloa. C. bellicosus accounts for 57% of catches in Sinaloa and 95% in Sonora [3]. In Sinaloa, the main landings are recorded in the fisheries offices of La Reforma, Los Mochis and Guasave, exceeding 1000 tons in 2012. Crab is caught in the Mexican Pacific using various fishing gears, such as traps, rings, snoops, punches, and hooks [5], however, the Official Mexican Standard (Nom-039-PESC-2003) prohibits the use of gillnets, snoops and cast nets. In the case of Bahía Santa Maria La Reforma BSMR, crab is captured with a simple crab ring, and to a greater extent the modified simple ring, which consists of a roof that functions as a trap at the time of extraction [6]. One of the main failings that have been detected is the lack of fishery evaluation and biological monitoring of crab in Sinaloa and Sonora. For this reason, the use of methods structured by size is very relevant, contrarily to age-structured models, it does not require information by age group but size, in addition to not requiring long time series [7]. Then, the objective of this study was to estimate the selectivity, fishing mortality and exploitation rate of C. bellicosus in BSMR, using a method structured in sizes called CASA (Catch at Size Analysis), to evaluate the resource in terms of size and determine the state of health in which it is found.

2. Materials and Methods

The BSMR is located on the eastern coast of the Gulf of California, between parallels 24°43' and 25°15'N and meridians 107°55' and 108°23'W (Figure 1), with an axis greater than 70 km of coastline, it is located as the largest lagoon system in Sinaloa. With more than 47000 hectares [8].
For the evaluation of crab C. bellicosus in the 2000, 2011 and 2014 seasons in BSMR, the method proposed by [7] was used, which refer to the relationship between catch (Cl,t) for a size class (l) over time (t) and the number of individuals in the population in that size and time class (Nl,t) through a height-based exploitation rate (μl,t). So, the general Baranov's capture equations [9,10] in terms of t and l is shown as:
C ´ l , t = μ l , t N l , t ,
Where μl,t represents the proportion of individuals of l and t that die from fishing mortality (Fl,t). Since μl,t is dependent on Fl,t and the total mortality rate in l and t (Zl,t) the relationship is established:
μ l , t = F l , t Z l , t   ( 1 e Z l , t ) ,
According to [11] assumption, Fl,t is a function of fishing gear selectivity and fishing effort, so Fl,t is separable as the product of size-class-specific selectivity coefficients (sl) and a fishing mortality rate of fully recruited organisms over time (ft).
F l , t = s l f t ,
sl is explained as the fraction of organisms of the size class exposed to the total effect of fishing mortality, represented by a logistic function [12]:
s l = 1 1 + α s e β s l ,
The total mortality of organisms in size class over time (Zl,t) is the sum of fishing mortality plus natural mortality:
Z l , t = F l , t + M l , t ,   = s l M l , t ,
The relationship between the number of individuals at the time (Nl,t) and the number present at a later time (Nl,t') is described in terms of the number of crabs, of the same size that survived, and is reduced only by mortality:
N l , t ´ = N l , t e Z l , t ,
For growth, the growth parameters of [13] calculated by [14] were used, for BSMR separated by sex. Using a gamma distribution to represent the variation in growth for its versatility and flexibility, in terms of αΔ and βΔ [15] is:
g ( v | α , β ) = 1 β α Γ ( α ) v α 1 e v β ,
Where v represents Δl (the increase in growth, which was originally in the size class). The mean of the change in length is given by and the variance is given by which is proportional to the mean. In this expression, β ¯ l = α β σ 2 = α β 2 = β ¯ l is also the coefficient of variation which is used to incorporate the variability of the growth of individuals in the population. Given l* and βΔ, the parameters α and Δ consequently σΔ2 and are a function of the parameters L ¯ l and k of von Bertalanffy's growth model.
In a period of change, individuals in one size class may stay in the same size class or settle down to a larger size due to growth. To represent this change in growth, the following expression was used:
P l , l ´ = l 1 l ´ 2 g v α β d x ,
Any individual who enters a size class with an average height greater than the maximum cephalothorax width (CW) will remain in the same size class.
It was then calculated from [16]: N l ´ , t ´
N l ´ , t ´ = l P l , l ´ N l , t e Z l , t ,
Finally, recruitment to the fishery was incorporated into the previous equation:
N l ´ , t ´ = l P l , l ´ N l , t e Z l , t + R l ´ , t ´ ,
Recruitment to the fishery can occur over a range of size classes. Recruitment expressed in this way represents the type of recruitment observed in nature, where variation in growth, behavior, or food supply can result in individuals entering the main nucleus of the population at various sizes [17].
Recruitment was separated into a time-dependent variable (Rt) and a height-dependent variable (pl), which represents the proportion of recruits who will go to each size class:
R l , t = R t p l ,
The linear transition from the number of individuals in the size class at time (t) to the number of individuals in the posterior height class (l') at the later time (t') can also be written in a matrix notation:
N 1 , t ´ N 2 , t ´ . N l , t ´ . N n , t ´ = P 1,1 P 1,2 . P 1 , n 0 P 2,2 . P 2 , n P l , l     P n 1 , n 0   0 P n , n X S 1 , t 0           0 0 S 2 , t         S l , l       0 0   0 S n , t N 1 , t N 2 , t . N n , t + R 1 , t R 2 , t . R n , t ,
Where Sl,t represents exponential survival ( e Z l , t ). In the same way, the capture equation can be expressed in matrix form:
C 1 , t C 2 , t . C l ´ t . C n , t = μ 1 , t 0   0 0 μ 2 , t         μ l , t       0 0   0 μ n , t X N 1 , t N 2 , t . N n , t ,
The model parameters were estimated using an approximation that minimizes the square residuals of the target function:
R S S c a p t u r a = l , t ( C ´ l , t C l , t ) 2
Where C'l,t is the catch at the estimated size and Cl,t is the catch at the observed size over time (t). The observed data are the captures in number of organisms by specific size classes, taken at equal time intervals. The parameters were obtained by minimizing the squared residuals by means of Newton's direct search algorithm [7,18].

3. Results

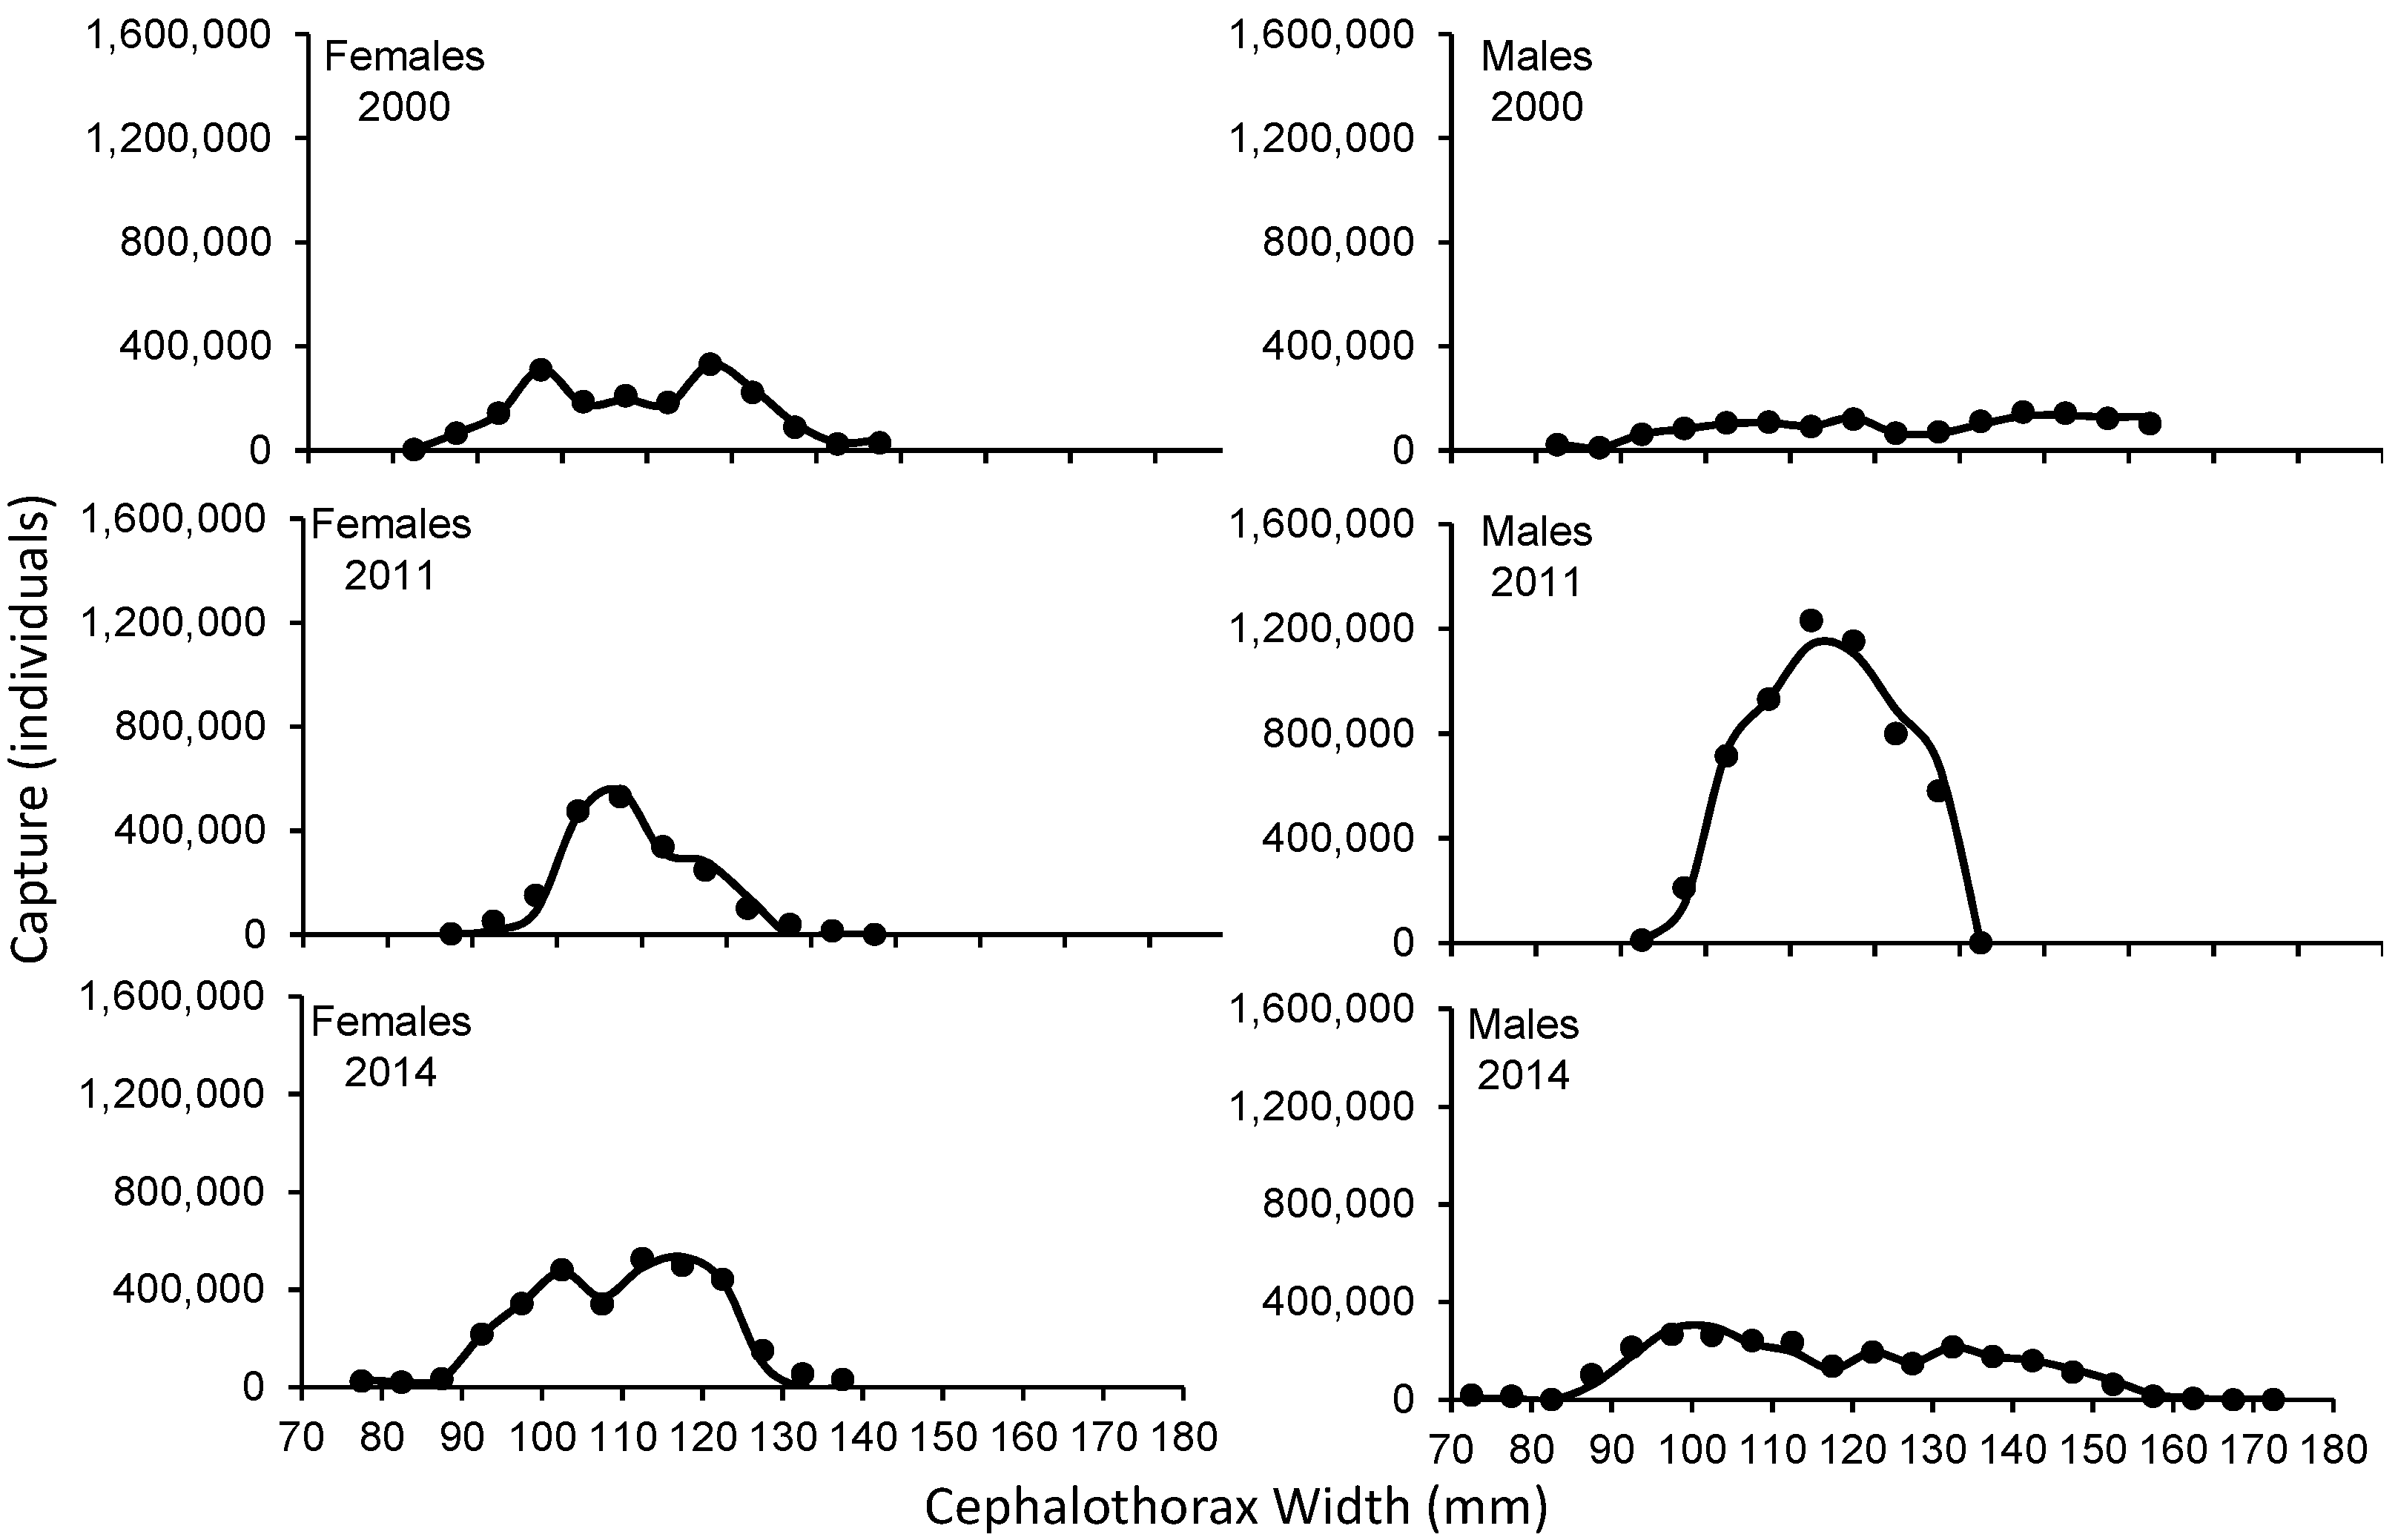
Figure 2 shows the adjustment of the size structure with the CASA model and shows the observed frequencies of catches of the artisanal fleet of BSMR, for females and males in 2000, 2011 and 2014 and the frequencies estimated with the model. For the 2000 harvesting season, more females than males were caught in the size range of 87.5 to 127.5 mm, although in sizes greater than 127.5 mm males dominated. The beta value of the growth transition matrix (βΔ) is small, showing narrow size ranges on which fishing pressure is exerted. The values of this parameter ranged from 0.47 for females to 0.38 for males. Size ranges for the 2011 capture season were wider in females than in males (between 85 and 132 mm), however, recorded catches were higher for males than for females. The βΔ parameters were higher in females than in males, ranging from 1.54 to 0.146 respectively. In the 2014 season, the size range in males was wider than in females with values between 75.5 to 172.5 mm and 77.5 to 137.5 mm respectively, however, the captures observed were higher in females than males between 99 and 125 mm. A higher βΔ was determined in females than in males, between 0.928 and 0.753 correspondingly.
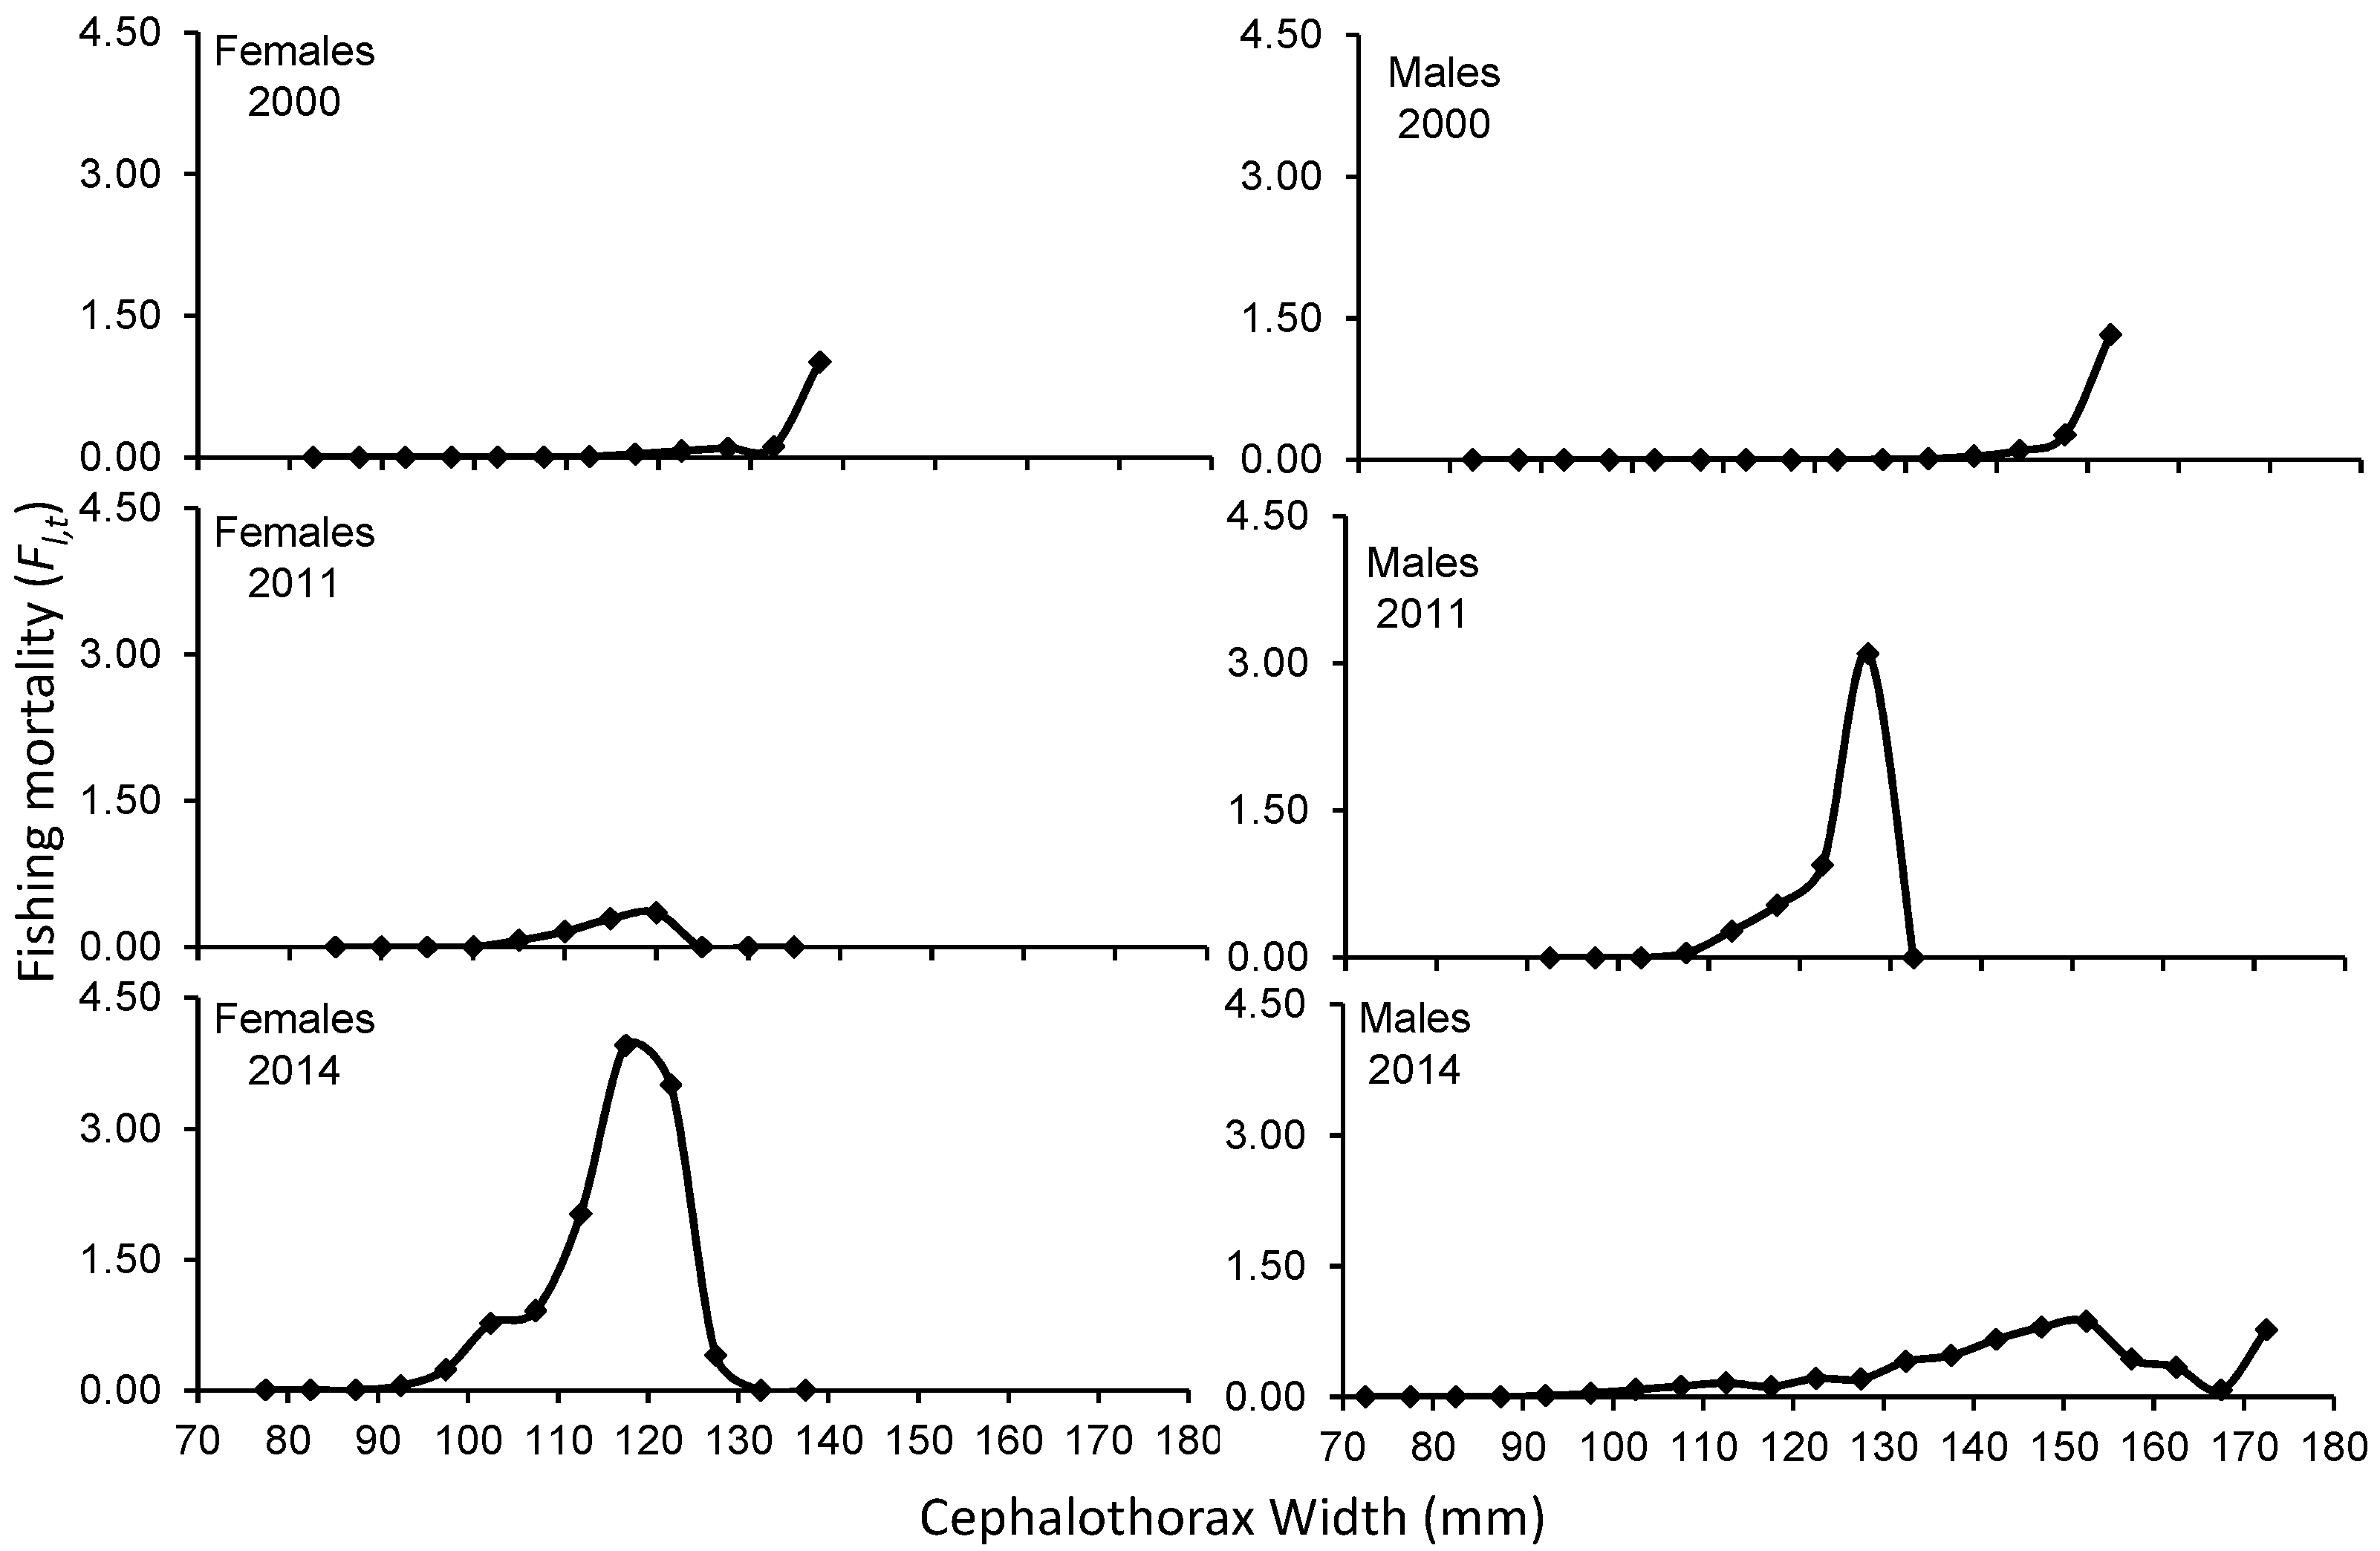
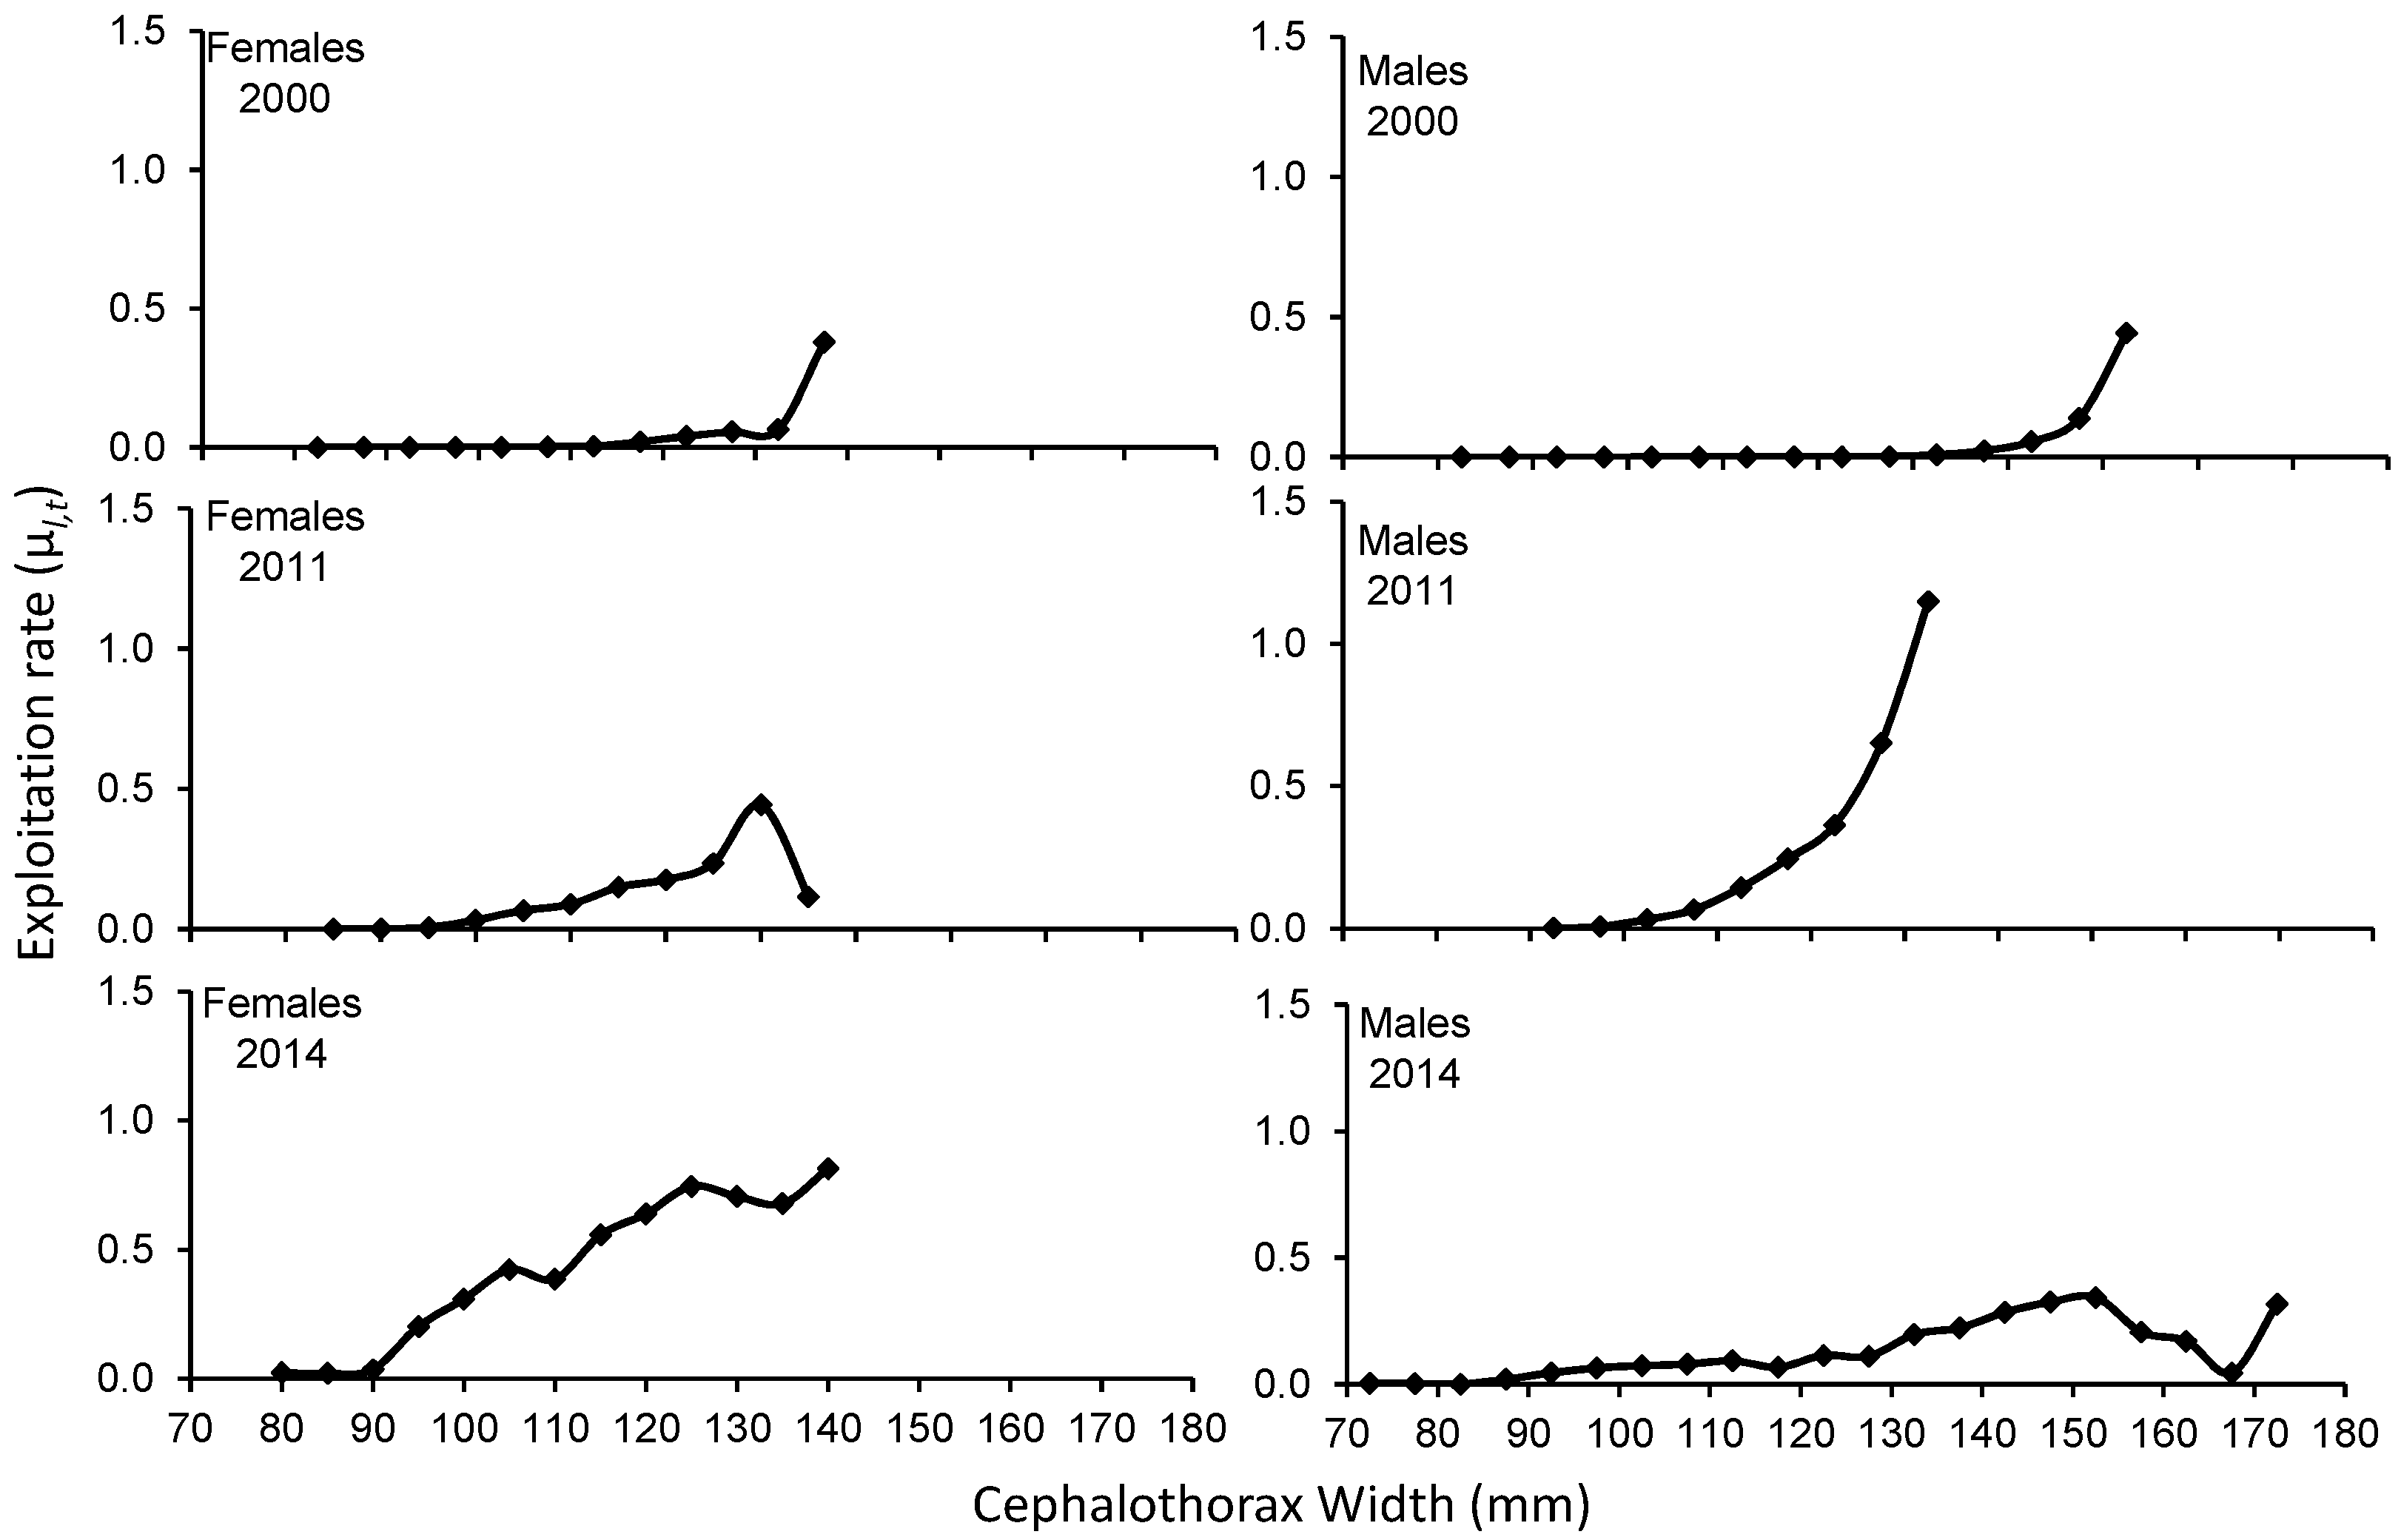
In general, μl,t increases with crab size in both sexes. However, in 2011 females and 2014 males, the exploitation rate increased with size, but then decreased at the largest sizes recorded. The Fl,t also tended to increase with the size of the crabs in both sexes, and then decrease towards the larger sizes recorded (Supplementary Table 1).
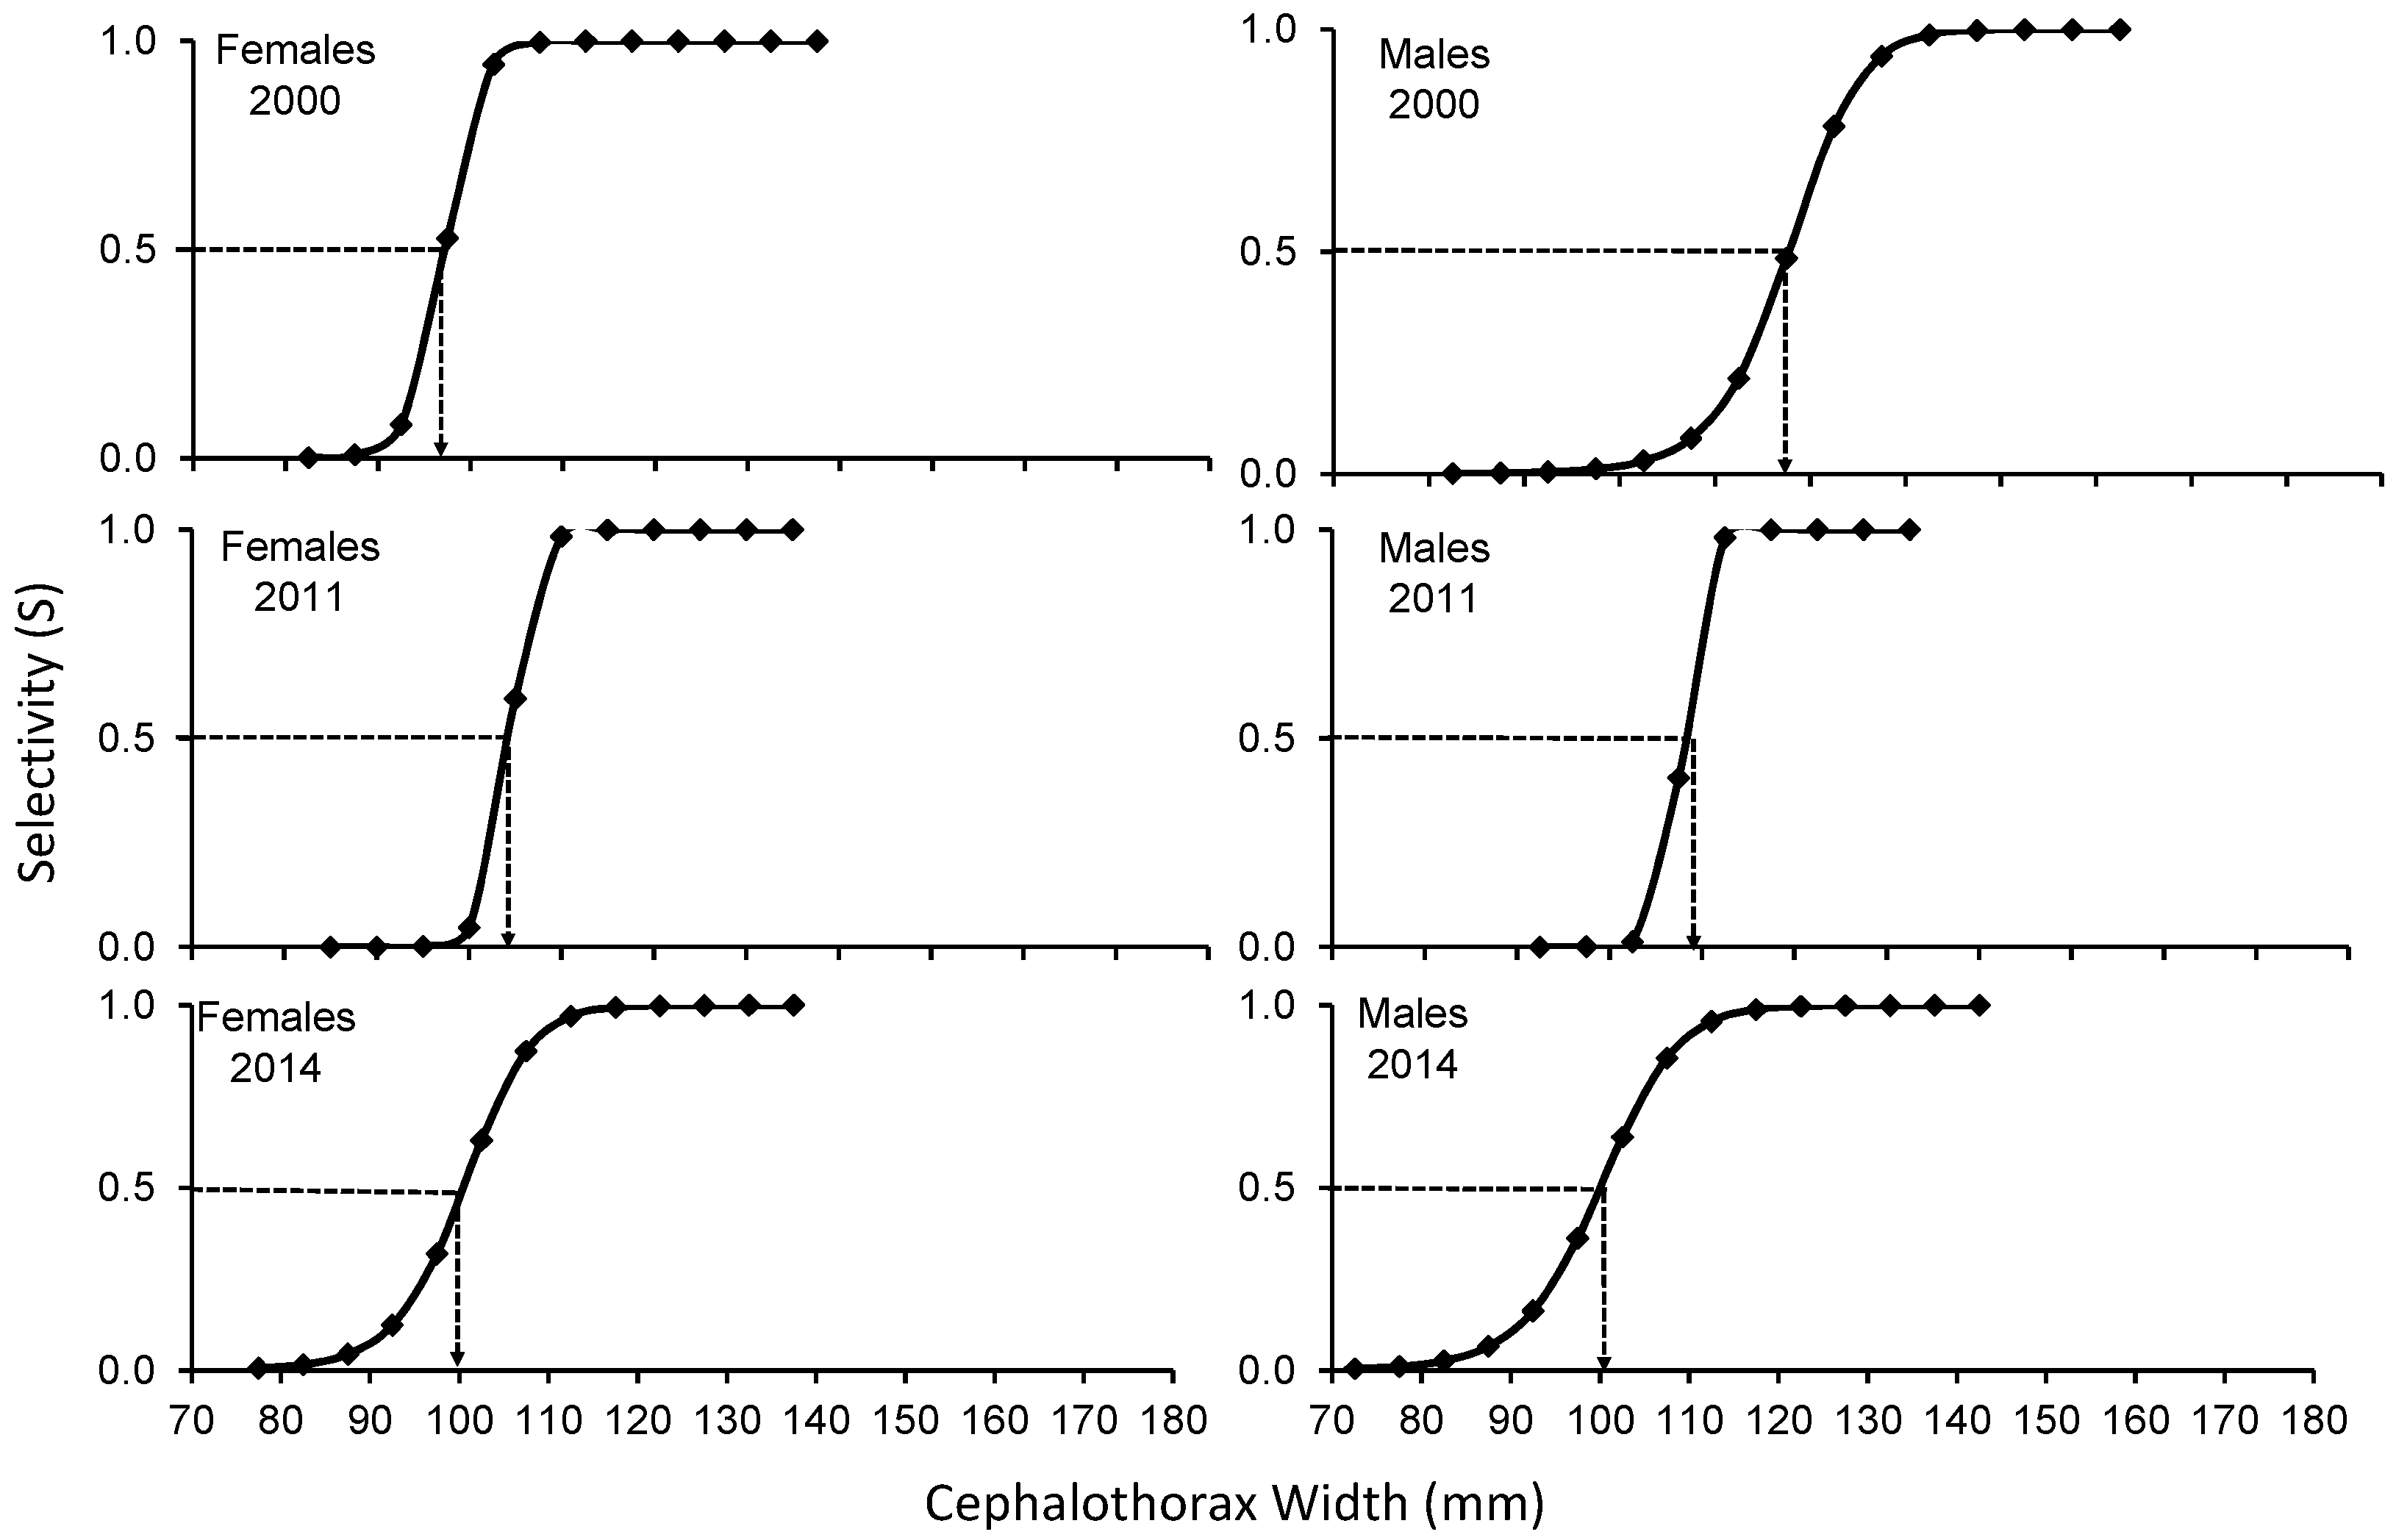
The SL of C. bellicosus in the 2000, 2011 and 2014 seasons, in which a reduction in the size of the first capture of males was observed between 2000 and 2014, while in females it increased from 2000 to 2012 and then decreased again around 2014 (Figure 3). Fishing pressure was exerted on the largest sizes, in both sexes and during the three seasons analyzed. The average fishing mortality for females in 2000 was: F= 0.112, while for males it was: F= 0.117. For the 2011 season, the average fishing mortality for females was: F= 0.257, while males were: F= 0.560. In the 2014 season, an F= 1.639 and 0.287 were determined for females and males, respectively (Figure 4).
The exploitation rate for 2000 shows that the size ranges between 117.5 to 137.5 and 137.5 to 152.5 mm (female-male) present the highest extraction, with μl,t less than 50% for females and males, however, for the 2011 season sizes between 117.5 to 137.5 and 112.5 to 132.5 mm (female-males) have a higher catch. with μl,t, greater than 50% for males between 127.5 and 132.5 mm. For the 2014 season, in the specific case of females, with size ranges between 112.5 and 135 mm, they boast higher catches and a μl,t greater than 50%. In males, sizes between 122.5 and 172.5 reveal higher catches without reaching a μl,t greater than 50% (Figure 5). The weighted exploitation rate of all size groups in each season was 0.047 (2000), 0.119 (2011) and 0.426 (2014) in females and 0.045 (2000), 0.295 (2011) and 0.132 (2014) in males.

4. Discussion

The size structure of C. bellicosus caught during the 2000, 2011 and 2014 seasons were dissimilar, causing differences in exploitation rates, fishing mortality and selectivity. In the 2000 to 2011 male capture seasons, a reduction of larger organisms was observed, apparently as a result of overfishing of growth. During the 2000, 2011 and 2014 seasons, the estimated selectivity for females in the fishing period reveals that the size of the first catch (CW50%) was determined at 97.5 mm CW, indicating that the captured organisms have not reached the size of first maturity (CW50% = 103.73 mm) in the BSMR as reported by [19], suggesting a high risk of overexploitation of growth [20]. In males, the effect of CW50% in the 2000 and 2011 seasons began after reaching the first maturity height (117.5 and 107.5 mm vs 103.73 mm) as proposed by [19], the opposite case for the 2014 season where the CW50% was determined at 102.5 mm. However, there are studies on C. bellicosus, where it has been determined that they can mature to smaller sizes between 51 and 112.4 mm on the Mexican Pacific coasts [14,19,21], which would have a greater impact on the stock of broodstock and, therefore, the resource's capacity to renew. An average fishing mortality for the 3 years was 0.67 for females (F2000= 0.112, F2011= 0.257, F2014= 1.639) and 0.32 for males (F2000= 0.117, F2011= 0.560, F2014= 0.287), which was lower than that reported by [19,22] estimated fishing mortality between 1.1-1.37, 1.92-1.13 and 1.06-1.62 respectively. However, fishing mortality by size range reaches up to 4.85 (122.5 mm) in females and 3.10 in males (127.5 mm), which are the main contributors to catches in 2011, which causes a negative effect on the length at first maturity [23], because of exploitation rates of more than 70 and 60% in each age group. The weighted exploitation rate of the 2014 season (0.426) was like that reported for the 2014 season by [19] for the same region, who calculated an exploitation rate of 0.42 in females, however, it differs from that calculated in males (0.132) with a higher exploitation rate (0.34). In the same vein, [22] in BSMR, using a predictive model (Thomson Bell), determined that female crabs (C. bellicosus) are above their maximum sustainable yield, which differs in the present work, with an exploitation rate greater than 0.5, causing a decrease in population size [24], while male crabs were below the maximum sustainable yield (E < 0.5). It is worth mentioning that the catches of Callinectes sp. during the 2003 season in BSMR were no more than 300 tons, lower than what was reported in 2014 (3978 tons). [19], in regions such as Bahía Navachiste and BSMR, using different methods, have concluded that the aforementioned areas are relatively healthy, which agrees with the present work.
In previous studies [4,19] the crab stock assessment in BSMR was done using the method propose by [25]. This method is known as Catch-MSY. A key assumption of the Catch-MSY approach is the ability to define a reasonable prior range for the parameters of the Schaefer model. In the studies of [4,19], prior values of r were between 0.6 and 1.5, which are default values suggested by [25] for highly resilient species. Although no estimates of r for C. bellicosus exist, some reported life history parameters, such as age at 50% maturity (L50%) and growth rate (k) from a von Bertalanfy Model, are consistent with those of a resilient species. FishBase classifies highly resilient fishes as those with k>0.3 year-1 and L50% < 1 year. With this [4] concluded that crab fishery in Sinaloa state is in its limit of sustainability. While [19] mentioned that the crab fishery is under risk of overexploitation. The later argument in consistent with the findings in present study that conclude similar result with different method the CASA model.
All methods devoted to management fisheries stocks have several limitations, and assessments stock biomass are expensive; however, because the sustainability of fisheries is desired and data-poor stocks are common, a simple method such as the Catch-MSY method proposed by [25] is useful for the management of crab fisheries in the Gulf of California [19]. In present study the CASA method was applied to crab fishery in BSMR, advising that the crab fishery in this coastal lagoon in Sinaloa state of Mexico is not at risk of over exploitation. After the literature research we support the use of CASA method because use of structured in sizes instead of age for a strong biomass analysis.
Reference [4,19] mentioned that management strategy for crab fishery is the catch quota. Thus, a catch quota of 5500 tons was recommended for the fishery in Sinaloa; however, because the stock biomass is below BMSY, a smaller quota was recommended until the stock get its restocked. A precautionary catch quota of 3500 tons and 1171 tons are recommended for the Sonoran stock and for BSMR, respectively. Reference [19] mentioned that if the recommended catch quota for the Sinaloa stock is divided by zones based on how catches contributed to the overall production of the state, a catch quota of 1100 tons would correspond to BSMR like that obtained in the stock assessment for BSMR separately. Once again, the present study becomes important for the crab fishery management in the region in particular and national in general.
To prevent overexploitation, the knowledge in population biology is fundamental. The contribution of the results, presented in this study, tend to support the conservation of the species under study. Is important to recall that in organisms with a short life cycle that are subject to high fishing pressure, biological process that occurs in a particular year define the stock´s abundance in the same years. Crabs of Portunidae family from the Gulf of California comprise this principle. Since 1982, the brown crab C. bellicosus has become the focus of an important commercial fishery in Mexico, especially in the eastern Gulf of California, where a small-scale fishery for these crabs has been established [19]. The most effective strategy to reduce the risks of adverse economic, and social effect in this fishery would be the continued gathering of biological studies such as the surveys presented here.

5. Conclusions

The crab fishery in Bahía Santa María La Reforma in Sinaloa state of Mexico is not at risk of over exploitation.

Supplementary Materials

The following supporting information can be downloaded at the website of this paper posted on Preprints.org.

Acknowledgments

The authors would like to thank Paloma Guadalupe Chávez-Patiño for her collaboration during the preparation of this manuscript.

Conflicts of Interest

The authors declare no conflict of interest.

References

  1. Ramos-Cruz, S. Estructura y parámetros poblacionales de Callinectes arcuatus Ordway, 1863 (Decapoda: Portunidae), en el sistema lagunar La Joya-Buenavista, Chiapas, México. Pan-Am. J. Aquat. Sci. 2008, 3, 259–268. [Google Scholar] [CrossRef]
  2. CONAPESCA. Anuario Estadístico de Acuacultura y Pesca Edición 2013; CONAPESCA: Mazatlán, Mexico, 2013; pp. 1–295. [Google Scholar]
  3. Heredia-Delgadillo, C.A.; Rodríguez-Domínguez, G.; Pérez-González, R.; Castañeda-Lomas, N.; Castillo-Vargasmachuca, S.G.; Aragón-Noriega, E.A. Analysis of crab size structure and the fishing effort applied to a crab fishery in northwest Mexico. Crustaceana 2018, 91, 225–237. [Google Scholar] [CrossRef]
  4. Cisneros-Mata, M.A.; Ramírez-Félix, E.; García-Borbón, J.A.; Castañeda-Fernández de Lara, V.; Labastida-Che, A.; Gómez-Rojo, C.; Madrid-Vera, J. Pesca de jaiba en el litoral del Pacífico mexicano; INAPESCA: Ciudad de Mexico, Mexico, 2014; pp. 1–86. [Google Scholar]
  5. Ramírez-Félix, E.; Singh-Cabanillas, J.; Gil-López, H.A.; Sarmiento-Náfate, S.; Salazar-Navarro, I.; Montemayor-López, G.; García-Borbón, J.A.; Rodríguez-Domínguez, G.; Castañeda-Lomas, N. La pesquería de jaiba (Callinectes spp.) en el Pacífico mexicano: Diagnóstico y propuesta de regulación; SAGARPA-INP: Mazatlán, Mexico, 2003; pp. 1–54. [Google Scholar]
  6. Ortega-Lizárraga, G.G.; Rodríguez-Domínguez, G. Sinaloa y su valor en jaiba. Cienc. Desarro. 2016, 285, 64–68. [Google Scholar]
  7. Sullivan, P.J.; Lai, H.L.; Gallucci, V.F. A catch-at-length analysis that incorporates a stochastic model of growth. Can. J. Fish. Aquat. Sci. 1990, 47, 184–198. [Google Scholar] [CrossRef]
  8. Álvarez-Arellano, A.D.; Gaitán-Moran, J. 1994. Lagunas costeras y el litoral mexicano. In Lagunas costeras y el litoral mexicano, 1st ed.; De la Lanza-Espino, G., Cáceres-Martínez, C., Eds.; Universidad Autónoma de Baja California Sur: La Paz, Mexico, 1994; pp. 13–74. [Google Scholar]
  9. Baranov FI. 1918. On the question of the biological basis of fisheries. Nauchnyi Issledovatelskii Ikhtiologicheskii Institut, Izvestiia 1: 81-128.
  10. Ricker, W.E. Computation and interpretation of biological statistics of fish populations. Bull. Fish. Res. Board Can. 1975, 191, 1–382. [Google Scholar]
  11. Doubleday, W.G. A least squares approach to analyzing catch at age data. ICNAF, Res. Bull. 1976, 12, 69–81. [Google Scholar]
  12. Hampton, J.; Kleiber, P.; Langley, A.; Hiramatsu, K. Stock assessment of yellowfin tuna in the western and central Pacific Ocean. WCPFC–SC1, Noumea, New Caledonia pp. 1–76.
  13. von Bertalanffy, L. A quantitative theory of organic growth (Inquiries on growth laws II). Hum. Biol. 1938, 10, 181–213. [Google Scholar]
  14. Rodríguez-Domínguez, G.; Castillo-Vargasmachuca, S.G.; Ramírez-Pérez, J.S.; Pérez-González, R.; Aragón-Noriega, E.A. Modelos múltiples para determinar el crecimiento de organismos juveniles de jaiba azul Callinectes arcuatus en cautiverio. Cienc Pesq 2014, 22, 29–35. [Google Scholar]
  15. Hogg, R.V.; Craig, A.T. Introduction to mathematical statistics; MacMillan: London, UK, 1970; pp. 1–438. [Google Scholar]
  16. Quinn, T.J.; Deriso, R.B. Quantitative fish dynamics; Oxford University Press: Oxford, 1999; pp. 1–542. [Google Scholar]
  17. Cerdenares-Ladrón De Guevara, G. Biología del pez vela Istiophorus platypterus (Shaw y Nodder, 1792) en el Golfo de Tehuantepec. Ph Thesis, Centro Interdisciplinario de Ciencias Marinas-Instituto Politécnico Nacional, La Paz, Mexico, 2011. [Google Scholar]
  18. Neter, J.; Kutner, M.H.; Nachtsheim, C.J.; Wasserman, W. Applied linear statistical models; McGraw-Hill: New York, 1996; pp. 1–1408. [Google Scholar]
  19. Rodríguez-Domínguez, G.; Castillo-Vargasmachuca, S.; Pérez-González, R.; Aragón-Noriega, E.A. Catch-maximum sustainable yield method applied to the crab fishery (Callinectes spp.) in the Gulf of California. J. Shell. Res. 2014, 33, 45–51. [Google Scholar] [CrossRef]
  20. Beverton, R.J.H.; Holt, S.J. On the Dynamics of Exploited Fish Populations, 1st ed.; Chapman and Hall: London, UK, 1957. [Google Scholar]
  21. Hernández, L.; Arreola-Lizárraga, J.A. Estructura de tallas y crecimiento de los cangrejos Callinectes arcuatus y C. bellicosus (Decapoda: Portunidae) en la laguna costera Las Guásimas, México. Rev.Biol. Trop. 2007, 55, 225–233. [Google Scholar] [CrossRef] [PubMed]
  22. Ulibarría-Valenzuela, J.J. Aplicación de un modelo predictivo a la pesquería de la jaiba café Callinectes bellicosus en la bahía Santa María de la Reforma. Bachelor Thesis, Facultad de Ciencias del Mar, Universidad Autónoma de Sinaloa, Mazatlán, Mexico, 2003. [Google Scholar]
  23. Sharpe, D.M.T.; Hendry, A.P. Life history change in commercially exploited fish stocks: an analysis of trends across studies. Evol. Appl. 2009, 2, 260–275. [Google Scholar] [CrossRef] [PubMed]
  24. Policansky, D. Fishing as a cause of evolution in fishes. In The Exploitation of Evolving Resources, 1st ed.; Stokes, T.K., McGlade, J.M., Law, R., Eds.; Springer-Verlag: Berlin, Germany, 1993; pp. 8–18. [Google Scholar] [CrossRef]
  25. Martell, S.; Froese, R. A simple method for estimating MSY from catch and Resilience. Fish. Fish. 2012, 14, 504–514. [Google Scholar] [CrossRef]
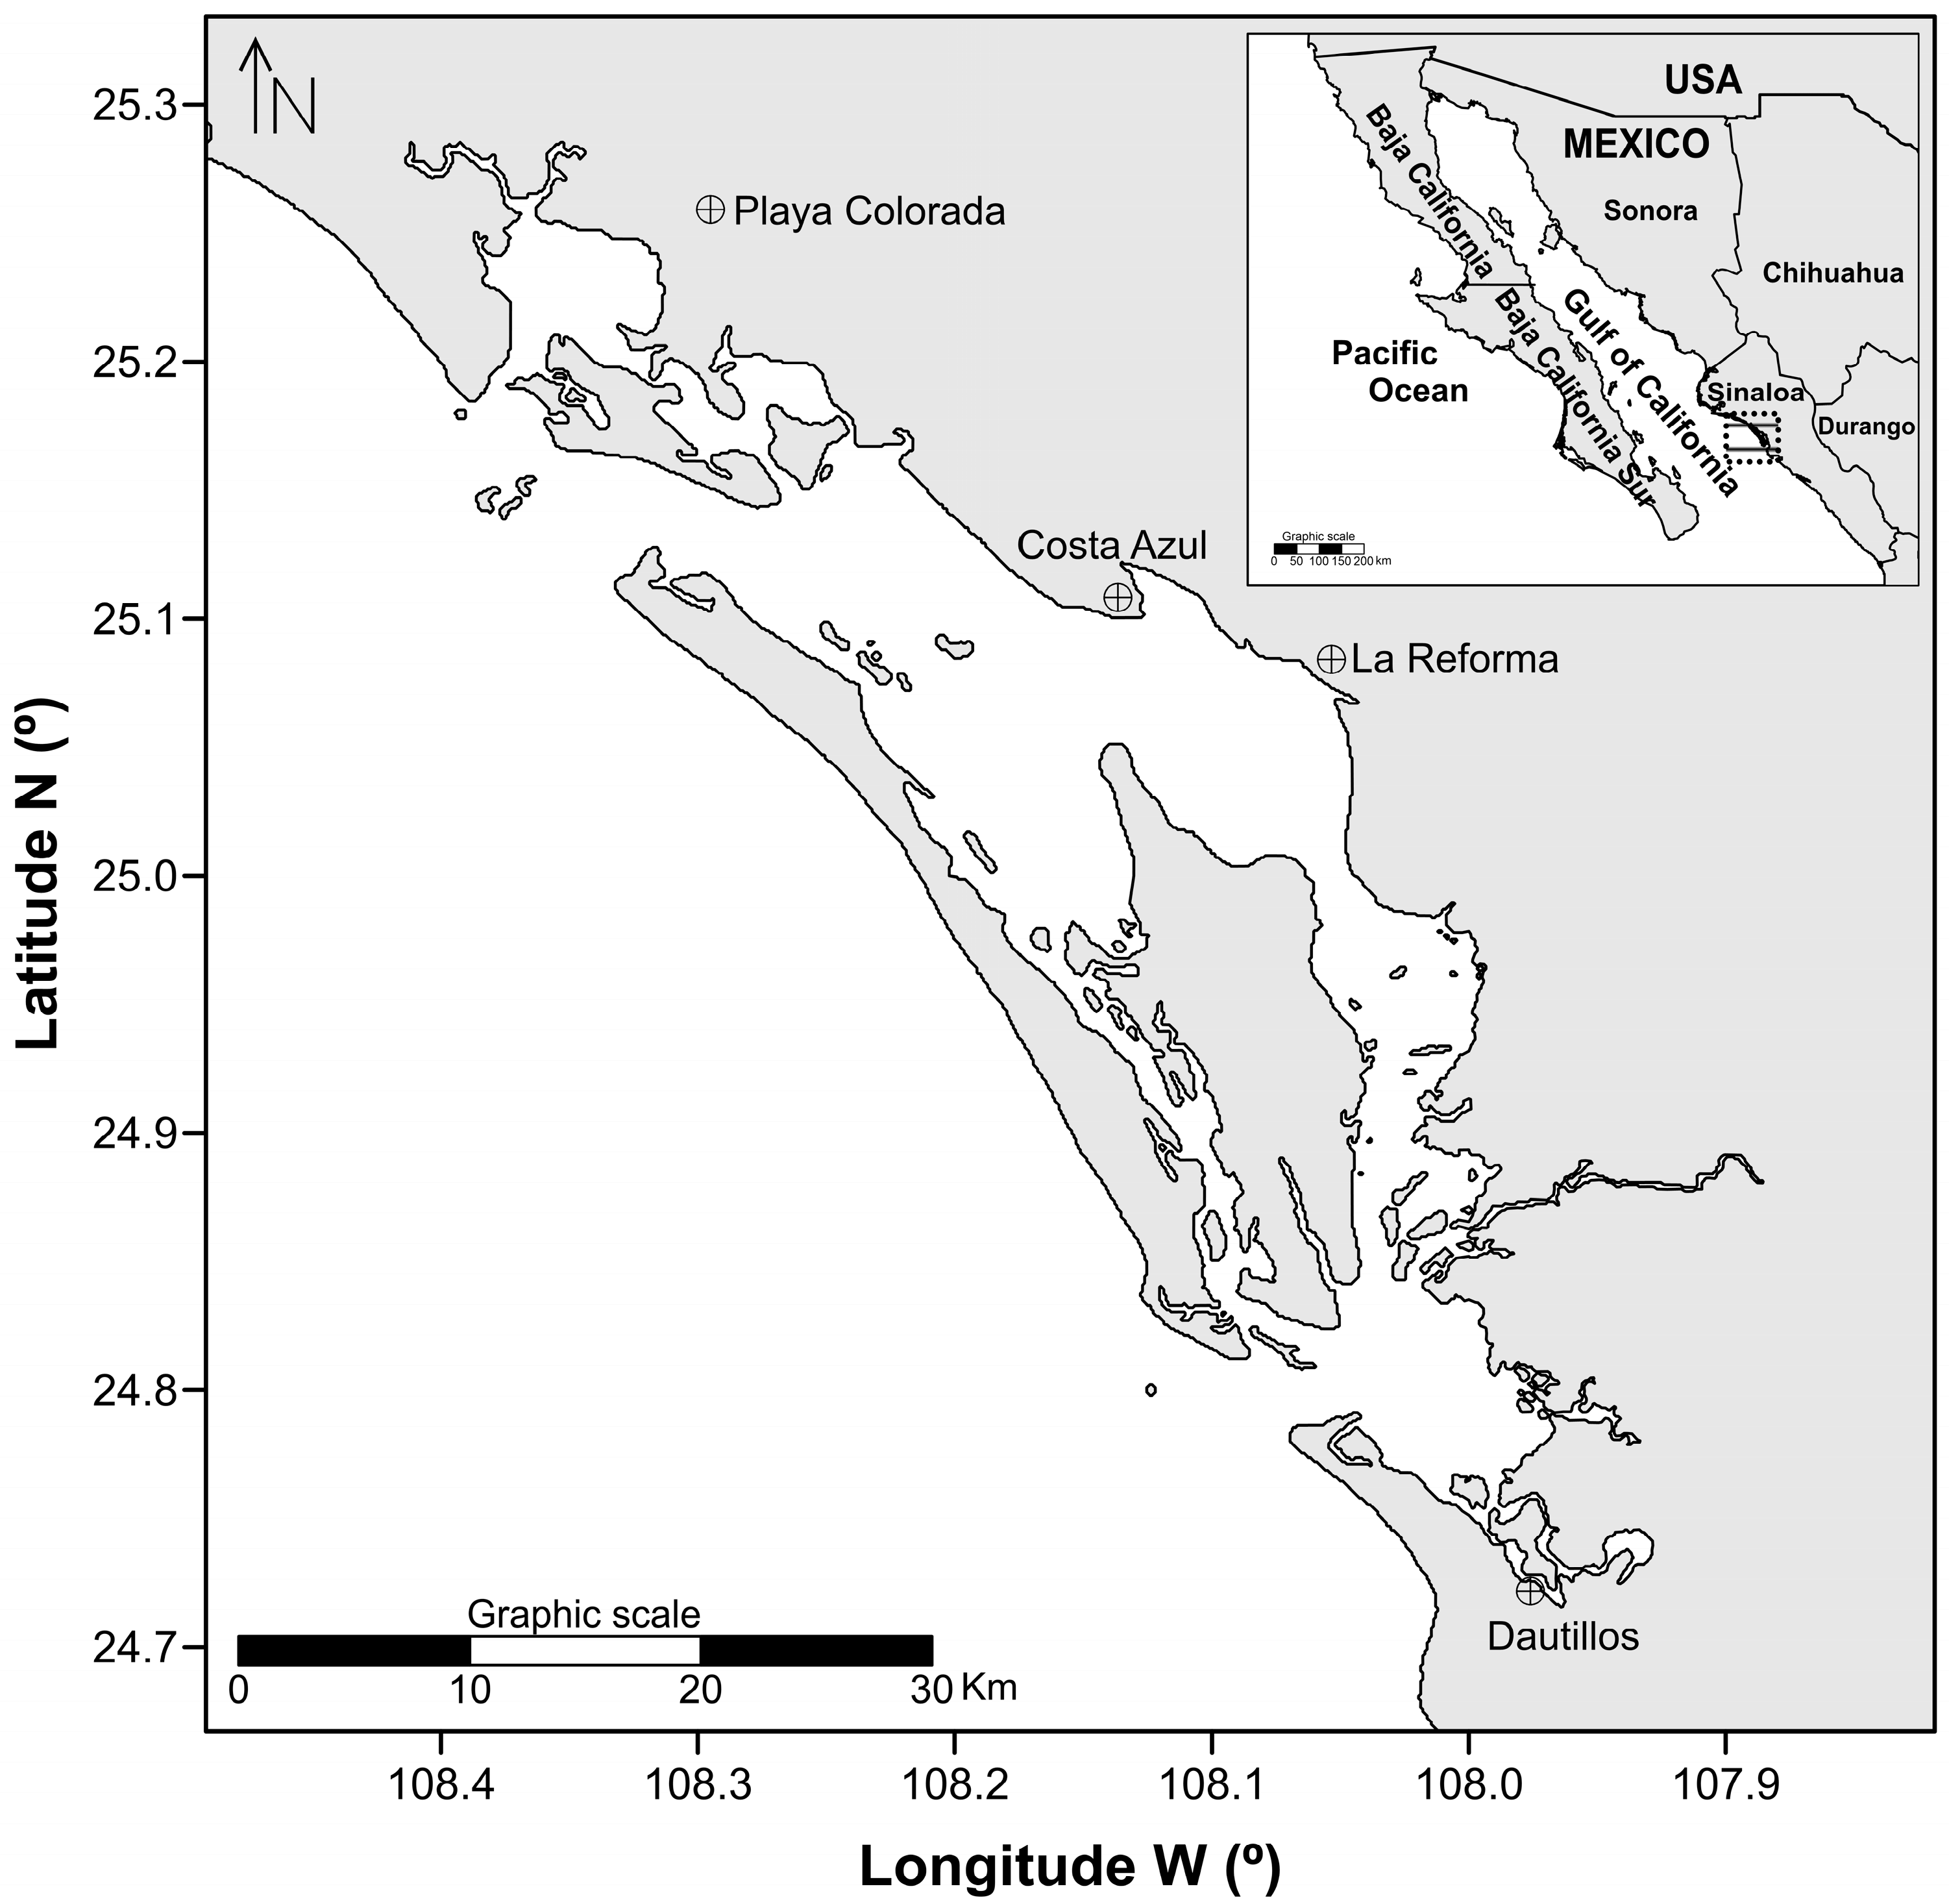
Figure 1. Study area, Bahía Santa María La Reforma, Sinaloa, Mexico.
Preprints 95129 g001
Figure 2. CASA model (line) adjusted to the observed catch data (points) of Callinectes bellicosus in the artisanal fishery of the Bahía Santa María La Reforma, Sinaloa.
Preprints 95129 g002
Figure 3. Selectivity of Callinectes bellicosus in artisanal fishing of the Bahía Santa María La Reforma, Sinaloa.
Preprints 95129 g003
Figure 4. Mortality by fishing size of Callinectes bellicosus in artisanal fisheries of the Bahía Santa María La Reforma, Sinaloa.
Preprints 95129 g004
Figure 5. Exploitation rate to the size of Callinectes bellicosus in artisanal fishing of the Bahía Santa María La Reforma, Sinaloa.
Preprints 95129 g005
Disclaimer/Publisher’s Note: The statements, opinions and data contained in all publications are solely those of the individual author(s) and contributor(s) and not of MDPI and/or the editor(s). MDPI and/or the editor(s) disclaim responsibility for any injury to people or property resulting from any ideas, methods, instructions or products referred to in the content.
Copyright: This open access article is published under a Creative Commons CC BY 4.0 license, which permit the free download, distribution, and reuse, provided that the author and preprint are cited in any reuse.
Prerpints.org logo

Preprints.org is a free preprint server supported by MDPI in Basel, Switzerland.

Subscribe

© 2024 MDPI (Basel, Switzerland) unless otherwise stated