
Submitted:
30 December 2023
Posted:
03 January 2024
You are already at the latest version
Abstract
Survival models have become popular for credit risk estimation. Most current credit risk survival models use an underlying linear model. This is beneficial in terms of interpretability but is restrictive for real-life applications since it cannot discover hidden nonlinearities and interactions within the data. This study uses discrete time survival models with embedded neural networks as estimators of time to default. This provides flexibility to express nonlinearities and interactions between variables, and hence allows for models with better overall model fit. Additionally, the neural networks are used to estimate Age-Period-Cohort (APC) models so that default risk can be decomposed into time components for loan age (maturity), origination (vintage) and environment (e.g., economic, operational and social effects). These can be built as general models, or as local APC models for specific customer segments. The local APC models reveal special conditions for different customer groups. The corresponding APC identification problem is solved by a combination of regularization and fitting the decomposed environment time risk component to macroeconomic data, since the environmental risk is expected to have a strong relationship with macroeconomic conditions. Our approach is shown to be effective when tested on a large publicly available US mortgage data set. This novel framework can be adapted by practitioners in the financial industry to improve modelling, estimation and assessment of credit risk.
Keywords:
Credit risk
; Survival model
; Neural network
; Age-Period-Cohort
1. Introduction
Credit risk is a critical problem in the financial industry and remains an active topic of academic research. Credit risk indicates the risk of a loss caused by a borrower’s default, referring to its failure to repay a loan or fulfill contractual obligations. The credit score, which is calculated based on financial data, personal (or company) details and credit history, is a quantification of this risk. It can distinguish good customers from high risk ones when making a decision on loan applications. Banks and other financial institutions are most interested in evaluating credit risk. Traditionally, banks use linear model such as discriminate analysis and logistic regression. Nowadays, they are exploring survival models and some non-linear methods; e.g., machine learning (ML), especially deep neural network (DNN). For example, Hussin Adam Khatir & Bee (2022) explored several machine learning algorithms with different data balancing methods and concluded that random forest with random oversampling works well. Jha and Cucculelli (2021) showed that an ensemble of diverse non-linear models is able to provide improved and robust performance. However, Blumenstock et al. (2022) showed that there has been limited work on ML/DNN models specifically for survival analysis in credit scoring due to the concern about the use of black-box models in the finance community and their paper is the first to apply DNN in the credit risk context. In this paper, we propose machine learning based survival models with interpretability mechanisms to enable complex interaction terms between features and representations of non-linear relationship between variables and output. We construct the neural networks at vintage level, which contains a suite of subnetworks, one for each origination period. Traditional DNN lacks the ability to provide interpretation of its predictions, which cannot convince the banks and financial companies. In our study, we want to make the neural network more explainable by visualizing and interpreting the predictions and the risk behavior from the model. To realize this, Lexis graphs is employed to record the information from the neural network. Then ridge regression is used to decompose the probability of default (PD) estimation by the neural network in the Lexis graph into three Age-Period-Cohort (APC) timelines. Our model, named as NN-DTSM, is capable of extracting different kinds of customer risk behaviors from the data sets which cannot be realized by survival analysis methods in previous studies. Meanwhile, the three time-functions decomposed by APC modelling method can be used to interpret the black box of the neural network in this credit risk application.
The remainder of this article is divided into the following sections: Section 2 introduces the background with literature review, Section 3 describes the DTSM, neural network and APC methodologies used, Section 4 describes the US mortgage data sets that are used, along with the experimental results, Section 5 presents results and discussions, and finally Section 6 provides conclusions.
2. Background & Literature Review
Over the past 50 years, much impressive research has been done to better predict the default risk. Among those studies, the first and one of the most seminal works is the Z-score model (Altman, 1968). Altman used multivariate discriminant analysis (MDA) to investigate bankruptcy prediction in companies. MDA is a linear and statistical technique which can classify observations into different groups based on predictive variables. The discriminant function of MDA is:
where are observation values of n features used in the model, and are the discriminant coefficient computed by the MDA method. For the Z-score model, typically the features used are financial ratios from company accounts. This model can then transform an individual company’s features into one dimensional discriminant score, or Z, which can be used to classify companies by risk of bankruptcy. For consumer credit, MDA and other linear models such as logistic regression have traditionally been used for credit scoring (Khemais et al., 2016; Sohn et al., 2016; Thomas et al., 2017) .
Although this kind of traditional linear method can determine whether an applicant is in a good or bad financial situation, it cannot deal with dynamic aspects of credit risk, in particular, time to default. Therefore, survival analysis has been proposed as an alternative credit risk modelling approach default time prediction. Banasik et al., (1999) pointed out that the use of survival analysis facilitates the prediction of when a borrower is likely to default, not merely a binary forecast of whether or not a default would occur in a fixed time period. This is because survival analysis models permit the inclusion of dynamic behavioral and environmental risk factors in a way that regression models cannot perform.
One of the early popular multivariate survival models is Cox Proportional Hazard (PH) model (Cox, 1972). Unlike regression models, Cox’s PH model can include variables that affect survival time. The semiparametric nature of the model means that a general non-linear effect is included. The Cox model is composed of a linear component, the parametric form, and baseline hazard part, the non-parametric form:
This function assumes the risk for a particular individual at time t is the product of a non-specified baseline hazard function of time and an exponential term of linear series of variables. The coefficients αi are estimated using maximum partial likelihood estimation without needing to specify the hazard function . Therefore, the Cox PH model is called a semiparametric model. One advantage of the Cox PH model is that it can estimate the hazard rate (the probability that the event occurs per unit of time conditioning on no prior event happened before) for each variable separately, without needing to estimate the baseline hazard function . However, for predictive models, as would typically be required in credit risk modelling, the baseline hazard will need to be estimated post-hoc.
Thomas (2000) and Thomas and Stepanova (2001) developed survival models for behavioral scoring for credit and showed how these could be used for profit estimation over a portfolio of loans. Bellotti and Crook (2009) developed a Cox PH model for credit risk for a large portfolio of credit cards and showed it provided benefits beyond a standard logistic regression model, including improved model fit and forecasting performance. They showed that credit status is influenced by the economic environment represented through time-varying covariates in the survival model. Dirick et al. (2017) provided a benchmark of various survival analysis technologies including the Cox PH model, with and without splines, Accelerated Failure Time models, and Mixture Cure models. They considered multiple evaluation measures such as area under the ROC curve (AUC) and deviation from time to default, across multiple data sets. They found that no particular variant strictly outperforms all others, although Cox PH with splines was best overall. In their notes they mentioned the challenges of choosing the correct performance measure for this problem, when using survival models for prediction. This remains an open problem.
Traditional, survival models are continuous time survival models. However, discrete-time survival models (DTSM) have received great attention in recent years. For credit risk, where data is collected at discrete time points, typically monthly or quarterly repayment periods, a discrete time approach matches the application problem better than continuous time modelling; furthermore, for prediction, using discrete time is computationally more efficient (Bellotti and Crook, 2013). Gourieroux et al. (2006) pointed out that the continuous time affine model often has a poor model fit due to a lack of flexibility. They developed a discrete-time survival affine analysis for credit risk which allows dynamic factors to be less constrained. De Leonardis and Rocci (2008) adapted the Cox PH model to predict the firm default at discrete time points. Although time is viewed as a continuous variable, company’s datasets are constructed on a monthly or yearly discrete-time basis. Companies’ survival or default is measured within a specific time interval, which means Cox PH model needs to be adapted so that the time will be grouped into discrete time intervals. The adapted model not only produces a sequence of each firm’s hazard rates at discrete time points but also provides an improvement in default prediction accuracy. Bellotti and Crook (2013) used a DTSM framework to model default on a data set of UK credit cards. They used credit card behavioral data and macroeconomic variables to improve model fit and better predict the time to default. In their paper, time is treated monthly, and the model is trained using three large data sets from UK credit card data, including over 750,000 accounts from 1999 to mid-2006. The model is more flexible than the traditional one. Bellotti and Crook (2014) followed up by building a DTSM for credit risk and showed how it can be used for stress testing. Both papers treat the credit data as a panel data set indexed by both account number and loan age (in months), with one observation being a repayment statement for the account at a particular loan age. Unlike previous studies, they used models to measure the risk, forecasting and stress testing and pointed out that including statistically explanatory behavioral variables can improve model fit and predictive performance.
Even though the Cox model is a popular approach for survival analysis, it still suffers from a number of drawbacks. Firstly, the baseline hazard function is assumed to be the same across all observations, but this may not be realistic in many applications, such as credit risk, where we may expect that different population segments may have different default behavior. Further, since the parametric component of the Cox PH model is linear, non-linear effects of variables must be included by transformations or by including explicit interaction terms. But it can be difficult to identify these by manual processes. These difficulties, however, can be handled automatically using some other non-linear methods, such as an underlying machine learning algorithm such as random survival forest (RSF), support vector machine (SVM) and different kinds of artificial neural networks (ANN), which can also potentially improve the model fit.
Random Survival Forest (Ptak-Chmielewska & Matuszyk, 2020) evolved from random forest and inherits many of its characteristics. Only three hyperparameters need to be specified in Random Survival Forest (RSF): the number of predictors which are randomly selected, the number of trees, and the splitting rules. Also, unlike the Cox PH model, RSF is essentially assumption-free, although the downside of this is that it does not (directly) provide statistical inference. However, this is a very useful property in survival modelling in the context of credit risk, where the value of a model is in prediction, rather than inference. Ptak-Chmielewska and Matuszyk (2020) showed that RSF has a lower concordance error when compared with the Cox PH model. Therefore, RSF is a promising approach to predict account default.
To further improve the model fit and the model prediction of credit risk, ANN has received increased attention in credit risk, known as a more powerful and complex non-linear method with improved performance in other areas such as computer vision (Hongtao & Qinchuan, 2016). Faraggi and Simon (1995) upgraded the Cox proportional hazards model with a neural network estimator. The linear term in Equation (2) is replaced by the output of a neural network . This neural network model incorporates all the benefits of the standard Cox PH model and retains the proportional hazard assumption, but allows for non-linearity amongst the risk factors. Ohno-Machado (1996) tackled the survival analysis problem utilizing multiple neural networks. The model is composed of a collection of subnetworks and each of them corresponds to certain discrete time point, such as month, quarter or year. Each subnetwork has a single output forecasting survival probability at its corresponding time period. The data sets are also divided into discrete subsets consisting of cases at specific time points in the same way and assigned to each subnetwork for training. The paper also describes that the learning performance of the neural network can be enhanced by combining the subnetworks, such as using outputs of some subnetworks as inputs for another subnetwork. But the issue of how to configure an optimal architecture of neural network (i.e., how to combine the neural networks) remains an open research problem. Gensheimer and Narasimhan (2019) proposed a scalable DTSM using neural networks which can deal with non-proportional hazards, trained using mini-batch gradient descent. This approach can be especially useful when there are non-proportional hazards effects on observations, for large data sets with large numbers of features. Time is divided into multiple intervals dependent on the length of the timelines. Each observation is transformed into a vector format to be used in the model, where one vector represents the survival indicator and another represents the event or default indicator, if it happened. The results shows that this discrete time survival neural network model can speed up the training time and can produce good discrimination and calibration performance.
Many studies using machine learning with survival models are in the medical domain. Ryu et al. (2020) utilized a deep learning approach to survival analysis with competing risk called DeepHit which uses a deep learning neural network in a medical setting to learn individual’s behavior and allow for dynamic risk effect of time-varying covariates. The architecture of DeepHit consists of a shared network and a group of sub-networks, and both are composed of a series of fully connected layers. The output layer uses SoftMax activation function which produces the probability of events for different discrete time points.
There are few papers studying the application of neural networks for DTSM specifically in the context of credit risk models. Practitioners and researchers in credit risk have begun to explore machine learning (ML) and deep learning (DL) in application to survival analysis, see e.g., Breeden (2021) for an overview. Blumenstock et al. (2022) explored ML/DL models for survival analysis, comparing with traditional statistical models such as Cox PH model motivated by the results in previous work on ML/DL credit risk models. They found that the performance of DL method DeepHit (Lee et al., 2018) outperforms statistical survival model and RSF. Another contribution of their paper is introducing an approach to extract feature importance scores from DeepHit which is a first step to build trust in black box models among practitioners in industry. However, this approach cannot reveal a clear picture of the mechanism and prediction behavior of DL models for analysts. As we describe later, one of our contributions is using local APC models as a means to interpret the black-box of DL model across different segments of the population. Dendramis et al. (2020) also proposed a deep learning multilayer artificial neural network method for survival analysis. The complex interactions of the neural network structures can capture the non-linear risk factors causing loan default among the behavioral variables and other institutional factors. These factors play more important roles in predicting default than the frequently used traditional fundamental variables in statistical models. They also showed that their neural network outperforms alternative logistic regression models. Their experimental results are based on a portfolio of 11,522 Greek business loans under the severe recession period, March 2014 to June 2017, with relatively high default rate.
In this article we report the results of a study using neural networks for DTSM on a large portfolio of US mortgage data over a long period, 2004 to 2013, which covers the global financial crisis and aftermath. This long period of data allows us to explore and decompose the maturation, vintage, behavioral and environmental risk factors more clearly. We show that these models are more flexible than the standard linear models and provide an improved predictive performance overall.
Studies in credit risk modelling with machine learning typically focus on predictive performance, which is indeed the primary goal in this application context. However, there is an increasing concern in the financial industry that credit risk models are not interpretable and explainable. Banks and companies do not trust the black box of the complex neural network architectures or other machine learning algorithms that are lack of transparency and interpretability (Quell et. al. 2021, Breeden 2021). To address this concern, in this paper, we use the output of the DTSM neural network as input to local linear models that can provide interpretation of risk behavior for individuals or population segments in terms of the different risk time-lines related to loan age (maturity), origination cohort (vintage) and environmental and economic effect over calendar time. These types of models are known as Age-Period-Cohort (APC) models and are well-known outside credit risk (see e.g., Fosse and Winship 2019), but their use as a method to decompose the timeline of credit risk was pioneered by Breeden (e.g., see Breeden 2016). There remains an identification problem with APC models and in this study, we address this problem using a combination of regularization and fitting the environmental timeline to known macroeconomic data. To the best of our knowledge this is the first use of APC models in the context of neural networks for credit risk modelling.
3. Materials and Methods
In this section, we describe the algorithms and approaches used in our method, including DTSM, neural network, lexis graph, APC effect and time-series linear regression model. All of these methods help predict time-to-default event and solve the APC identification problem.
3.1. Discrete Time Survival Model
Even though time-to-default events can be viewed as occurring in continuous time, credit portfolios are typically represented as panel data which record account usage and repayment in discrete time (typically monthly or quarterly records). Therefore, it is more natural to treat time as discrete point for a credit risk model (Bellotti & Crook, 2013). If we use discrete time, the data is presented as a panel data indexed on both on each account i and discrete time t. We provide the following concepts and notations and functions for a credit risk DTSM.
- The variable is used as the primary time-to-event variable and indicates the loan age of a credit account. Loan age is the span of the time since a loan account was created. It is also called loan maturity. For this study, data is provided monthly so is number of months, but the period could be different, e.g., quarterly.
- Let be the last loan age observation recorded for account i.
- The binary variable represents whether account default or not (1 denotes default, 0 denotes non-default) at a certain loan age t.
- Note that in the survival analysis context, default must be the last event in a series, hence for , and for , indicates a censored account(the account that the exactly event time(e.g., death time in medical, default time in credit risk) is unknown during the whole observation period) and indicates default.
- The variable is a vector of static application variables collected at the time when the customer applies for a loan (e.g., credit score, interest rate, debt-to-income ratio, loan-to-value).
- Let be the origination period, or vintage, of account i. Normally the period is the quarter or year when the account was originated. This is actually just one of the features in the vector . Let be the total number of vintages(the time when an individual customer open the account) in the data set.
- Meanwhile, we denote time-varying variables (e.g., behavioral, repayment history and macroeconomic data) by vector , which is collected across the lifetime of the account.
- Let be the calendar time of account i at loan age t, with the total number of calendar time periods. The measurement of calendar time is typically monthly, quarterly or annually. Notice that is actually just one of the features in the vector .
Notice that loan age, vintage and calendar time are related additively: . For example, suppose an account originated () in June 2009 and we consider repayment at loan age (t) of 10 months, then this repayment observation must then have calendar time () as April 2010.
The DTSM model’s probilitiy of default (PD) for each account at time is given as
PD at time t is dependent on the account not defaulting prior to t; i.e., the account has survived up to time . A further constraint on the model is that we do not consider further defaults after default is first observed. It is these conditions that makes such a model a survival model. The linear DTSM is built using the model structure,
where F is an appropriate link function, such as logit, and is some transformation of t. Even though this model is across observations indexed by both account i and time t, and we cannot assume independence between each time and within the same account i, by applying the chain rule for conditional probabilities, the likelihood function can be expressed as
where D refers to the panel data which records accounts behavior at consecutive time points; =1 indicates first account and is the number of accounts in the dataset. With F as the logit link function, it is the same form as logistic regression, and hence can be estimated using a maximum likelihood estimator for logistic regression. Details can be found in Allison (1982).
3.2. Vintage Model
In the financial industry, often analysis is performed and models are built at vintage level (Siarka, 2011). That is, separate models are built on accounts that originate within the same time period; e.g., in the same quarter or same year. Using the notation above, it means they all have the same value of . Vintage modelling leads to a suite of models: one for each origination period. This is a useful practice since it may be expected that different vintages will behave in different ways, and hence require separate models. The DTSM can be built as a vintage model for a fixed origination date, in which case loan age t also corresponds to calendar time, in the context of each separate vintage model.
3.1. DTSM using Neural Network (NN-DTSM) for Credit Risk
The model structure in Equation (4) is constrained as a linear model. We hypothesize that a better model can be built with a non-linear model structure since introducing non-linearity enables interaction terms between features, automated segmentation between population subgroups and representation of non-linear relationships between features and outcome variable. Equation (4) can be extended by changing the linear term into a nonlinear equation. For this, we replace Equation (4) by a neural network structure. The log of the likelihood function in Equation (5) can be taken as the objective function for the neural network and this corresponds to the usual cross-entropy loss.
The neural networks are built as vintage models, i.e., a suite of neural networks, one for each origination period, following Ohno-Machado (1996). This is to match standard industry practice for vintage models and also to make estimation of neural networks less computationally expensive. Each subnetwork of this architecture is a Multilayer Perceptron (MLP) neural network (Correa et al., 2011), which consists of a dropout layer (to moderate overfitting), an input layer, several hidden layers, and an output layer. The dropout was proposed by Dahl et al. (2013) who pointed out that the overfitting can be prevented by randomly deleting part of the neurons in hidden layers and repeating this process in different small data samples to reduce the interaction between feature detectors (neurons). Each neuron in the hidden layer receives input from the former layer, computes its corresponding value with a specific activation function, and transfers the output to next layer. The output of the neuron calculated with the activation function represents the status. In each neural subnetwork, we apply the RELU activation function to each hidden layer: and apply the sigmoid activation function to the output layer which corresponds to a logit link function:
The overall architecture of the multiple neural networks with discrete time survival analysis is shown in Figure 1.
Each neural network has a single unit in the output layer predicting estimating PD (with value 0 to1) at a certain discrete time point. In our study, we combine 40 neural networks which are constructed at vintage level based on the datasets covering the period from 2004 to 2013 (i.e., from v = 1 to v = 40) which are divided into quarterly subsets (the input of each separate model) and assigned to the subnetworks for training and testing. Each subnetwork predicts the default event at its corresponding quarter and the overall output function for the DTSM with neural network is
where is the subnetwork in each vintage j and is the logit function.
In machine learning frameworks, it is important to tune hyperparameters for optimal performance. Unsuitable selection of hyperparameters can lead to problems of underfitting or overfitting. However, the process of selecting appropriate hyperparameters is time consuming. Manually combining different hyperparameters in neural networks is tedious. Meanwhile, it is impossible to explore many multiple combinations in a limited time. As a result, grid search is a compromise between exhaustive search and manual selection. Grid search tries all possible combinations of hyperparameters from a given candidate pool and chooses the best set of parameters according to prediction performance. Typically, grid search calculates loss (e.g., mean square error or cross-entropy) for each set of possible values from the pool by using cross-validation (Huang et al., 2012). The use of cross-validation is intended to reduce overfitting and selection bias (Pang et al., 2011). In our study, we combine grid search with cross-validation with specified parameter ranges for the numbers of hidden layers, numbers of neurons in each layer and the control parameter for regularization.
3.1. Age-Period-Cohort effects and Lexis Graph
In the context of better analyzing time ordered datasets, Age-Period-Cohort (APC) analysis is proposed to estimate and interpret the contribution of three kinds of time-related changes to social phenomena (Yang & Land, 2013). APC analysis is composed of three time components: age effects, period effect and cohort effect, where each one plays a different role; see (Glenn, 2005) (Yang et al., 2008) (Kupper et al., 1985).
- Age effect reflects effects relating to the aging and developmental changes to individuals across their lifecycle.
- Period effect represents an equal environmental effect on all individuals over a specific calendar time period simultaneously, since systematic changes in social event, such as a financial crisis or Covid-19, may cause similar effects on individuals across all ages at the same time.
- Cohort effect is the influence on groups of observations that originate at the same time, depending on the context of the problem. For example, it could be people born at the same time, or cars manufactured in the same batch.
In the context of credit risk, loan performance can be decomposed by an APC model into loan age performance, period effect through calendar time of loan repayment schedule, and cohort effect through origination date (vintage) of the loan (Breeden, 2016; Breeden & Crook, 2022). In credit risk, the calendar time effect reflects macroeconomic, environmental and societal effects that impact borrowers at the same time, along with changes in legislation. Operational changes in the lender’s organization, such as changes in risk appetite, can affect vintage (cohort) or environmental (period) timelines.
The Lexis graph is a useful tool to represent and visualize APC in data. We describe it in the context of credit risk here to show default intensities in different time lines. In the Lexis graph, the x-axis represents the calendar time, and the y-axis represents the loan age effect. Each square in the graph represents a specific PD modeled by the DTSM based on the account panel data corresponding to that time point. The shade (or color) of each square thus indicates the degree of the probability of default of each account at the corresponding time point, the darker, the higher. For examples of Lexis graphs, see the figures following experimental results in section 5.2.
Although a Lexis graph can be produced for the whole loan population, it is useful to produce Lexis graphs and, consequently, APC analysis by different subpopulations or population segments. If linear survival models are used to construct the Lexis graph, this is not possible, since the time variables are not linked to other variables that could differ between segments. However, the use of NN-DTSM will enable segment-specific Lexis graphs as a natural consequence of the non-linearity in the model structure and it is one of the key contributions of this study.
3.1. Age Period Cohort Model
We consider APC models built on aggregations of accounts using the prediction output of the DTSMs as training data. These data are essentially the points given in the Lexis graph, and the APC model can be seen as a way to decompose the three time components in the Lexis graph.
Firstly, notice that calendar time c can be given as the sum of origination date v and loan age t: . Therefore the outcome of the APC model can be expressed and indexed on any two of these, and we use loan age (t) and vintage (v). For this study, the outcome variable is the average default rate predicted by the DTSM at this particular time point computed as
where is the index set of observations to include in the analysis. This may be the whole test set, or some segment that we wish to examine. To represent the APC model we use the following notation for three sets of indicator variables corresponding to each time line at time point given by :
- For all t such that , where ,
- For all v such that ,
- For all c such that ,
These represent the one-hot encoding of the time variables. Then the general APC model in discrete time is
where , and γb represent the coefficients on the timeline indicator variables and is an error term given from a known distribution, typically normal. This is a general model in discrete time since it allows the estimation of a separate coefficient for each value in each timeline. Once the data points Dvt are generated from the model using (8), the APC model (12) can be estimated using linear regression.
However, the APC identification problem needs to be solved. This is due to the linear relationship between the three timelines: i.e., . The identification problem in APC analysis cannot be automatically, perfectly and mechanically solved without making further restrictions and assumptions on the model to find a plausible combination of APC, ensuring those assumptions are validated across the whole lifecycle of analysis (Bell, 2020). The identification problem is derived as follows to show there is not a unique set of solutions to Equation (12), but different sets of solutions controlled by an arbitrary slope term :
Firstly, combining with Equation (12) for some arbitrary scalar σ:
Then, noticing from the definition of the indicator variables, that
this gives
Construct new coefficients,
to form
which is another solution to the exact same regression problem. Therefore, we have shown that Equation (11) has no unique solution, and indeed there are infinite solutions, one for each choice of . We call a slope since it alters each collection of indicator variable coefficient by a linear term scaled by . The identification problem is essentially to identify the correct value of slope .
To resolve this problem, there are several approaches which involve placing constraints on the model, such as removing some variables (essentially setting them to zero), or arbitrarily setting one set of the coefficients to a fixed value (i.e., no effect), see e.g., Fosse and Winship (2019). However, these solutions can be arbitrary. Therefore, in this study two approaches are considered: (1) regularization, (2) constraining calendar time effect in relation to observed macroeconomic effects. The first approach includes regularization penalties on the coefficients in the loss function that can be implemented in Ridge regression expressed by the loss function,
which minimizes mean squared error plus the regularization term, where is the strength of the regularization penalty. This loss function provides a unique solution in the coefficients for (12). The second approach is discussed in detail in the next section.
3.1. Linear regression & fitting macroeconomic variables
In the initial APC model, is unknown. A common and recommended solution to the identification problem is to use additional domain knowledge (Fosse and Winship 2019). In this case we suppose that the calendar-time effect will be caused by macroeconomic conditions, at least partly. Therefore by treating the APC model calendar-time coefficients as outcomes, these can be regressed from observed macroeconomic data. As part of this process, the slope can be estimated to optimize the fit. Therefore, we use the term which relates to time trend of calendar to adjust the shape of calendar time function. Once the calendar time function is fitted, the vintage function and loan age function is also determined. The time-series regression is defined as
where represents the raw coefficients of the calendar time function from the APC model regression, is the number of macroeconomic variables (MEVs), indicates the jth MEV, with a time lag and is an error term, normally distributed as usual. This can be rewritten as
and it can be seen as a linear regression with a coefficient on variable c, which can then be estimated with the intercept and other coefficients . Typical MEVs for credit risk are gross domestic product (GDP), house price index (HPI) and national unemployment rate (see e.g., Bellotti & Crook 2009). This solution, to fit estimated coefficients against economic conditions is similar to that used by Breeden (2016) who solves the identification problem by retrending the calendar-time effect to zero. However in that research the retrending is against a long series of economic data, whereas we use time series regression against a shorter span of data. This is because for shorter periods of time (less than 5 years), the calendar-time effect may have a genuine trend that can be observed in macroeconomic data over that time, but retrending over long periods would remove that.
3.1. Lagged Macroeconomic Model
Some MEVs might have lagged effect in the model. For example, the fluctuation of the house price will not have an immediate effect on people’s behavior, but people will change their consumer behavior after a few months. To find the best fit between dynamic economic variables and customer behaviors, a lagged univariate model is used for each MEV:
Formula (21) is in the form of time series regression, where indicates the customer behavioral variables, denotes the macroeconomic time series variable, is the lagged offset, and is a normally distributed error term. Univariate regression of on the MEV is repeated for different plausible values of , and the best value of is chosen based on maximizing R2. Once is selected for each MEV , Equation (20) can then be estimated.
3.1. Overall framework of the proposed method
The overall flowchart for our method is shown in Figure 2. The neural network in this study consists of multiple vintage-level sub-networks. After the model is trained, the next step is to extract and analyze different kinds of customer behaviors from the model by inputting different data segments which might show varied characteristics (e.g., low interest rate customer groups). These data segments help to construct Lexis graphs from the model which can visualize the characteristics of different data groups. To better capture and analyze the risk from the model, we use APC ridge regression to decompose the default rate modeled by the neural network in the Lexis graph into the three APC timelines: age, vintage and calendar time. These can finally be expressed as three APC graphs that can help experts to better understand and explain behavior of different loan types.
The coefficients of calendar date extracted from the neural network represent the size and direction of the relationship between the specific calendar date and loan performance. Matching these coefficients with the macroeconomic data reveals the relationship of macroeconomic effect in the model and their impact on loans. This helps to solve the APC identification problem. It is possible that the regularized APC model already provides the correct slope and a statistical test on the time-series macroeconomic model is used to test this.
4. Data and Experimental Design
4.1. Mortgage Data
We use a data set of over 1 million mortgage loan-level credit performance data originating in the USA from 2004 to 2013, publicly available from Freddie Mac1. Freddie Mac is a government-sponsored enterprise which plays an important role in the US housing finance system. It buys loans from approved lenders and sells the securitized mortgage loans to investors, which helps to improve the liquidity and stability of the US secondary mortgage market and promote access to mortgage credit, particularly among low-and moderate-income households (Frame et al., 2015). These characteristics of Freddie Mac facilitate us to gain access to a large number of publicly available data covering various kinds of accounts which are representative of the US mortgage market.
The quarterly datasets contain one file of loan origination data and one file of monthly performance data covering each loan in the origination file. The origination data file includes variables that are static and collected at the time of application from the customers, while the monthly performance data files contain dynamic variables which record customers’ monthly repayment behavior. See the General User Guide and Summary Statistics from the Freddie Mac single family loan level data set web site1 for further information about the variables available in the data set. Loan sequence number is a unique identifier assigned to each loan. These two data files contain the same sequence number for each loan which is used to join the two files together to form the training datasets. The FICO® credit score, UPB (unpaid balance), LTV (loan-to-value percentage), DTI (debt-to-income percentage) and interest rate are five core variables for the default model. A credit score is a number that represents an assessment of the creditworthiness of a customer, in other words, credit score is the likelihood that the customer will repay the money (Arya et al., 2013). UPB is the portion of a loan that has not been repaid to the lenders. LTV is the mortgage amount borrowed divided by the appraised value of the property, where applications with high LTV ratios are generally considered high risk loans. DTI is calculated by dividing monthly debt payment by monthly income. If the status of these variables is not so good, the application will be rejected, or possibly approved with a higher interest rate to cover the additional risk. Apart from these variables, there are other categorical variables which may represent risk factors and are preprocessed before being included into the model. For example, there are 5 categories in the loan purpose variable: P (Purchase), C (Refinance – Cash out), N (Refinance – No Cash out), R (Refinance – Not Define), and 9 (Not Available) which cannot be included directly in the model. Therefore, one-hot encoding is used to transform the categorical variable into numeric indicator variables.
In our experiments, we define an account status as default based on the failure event that minimum repayment was not received for three consecutive months or more. This definition is common in the industry and follows the Basel II convention (BCBS, 2006). Since we are using a survival model where default is recorded at a particular loan age, there is no need to measure default in an observation window following origination, as would be required for static credit risk models (Bellotti and Crook, 2009).
Default rates in the data set are shown in Figure 3. The default event is rare which leads to an unbalanced data set. This may affect the performance of the machine learning classification algorithm. The model will be dominated by the majority class (i.e., non-default) and may not make accurate prediction for the minority class, while in many contexts like credit risk we are more interested in discovering patterns for the rare class. To address this problem, the non-defaults in the data set are undersampled at the account level, so that only 10% of the non-default accounts are reserved by random selection. In the original dataset, the proportional of default data is only 0.1% and after under sampling, the default rate in the modified data set rises to around 1%.
4.1. Macroeconomic Data
Survival analysis provides a framework for introducing MEVs, which in turn can influence the prediction of default. (Bellotti & Crook, 2009) explored the hypothesis that macroeconomic variables such as unemployment index, house price index, production index can affect the probability of default. For instance, an increase in unemployment rate is expected to cause a higher risk since individuals who lost their job may not be able to make their repayments. Experiments are conducted to test the relationship between MEVs and PD. The results show that unemployment index, house price index and production index (proxy for GDP) have statistically significant explanation of default. Following this study, we include these variables in our experiments for APC modelling as described in Section 3.6. Real GDP is used instead of nominal GDP because the nominal GDP is calculated based on current prices, whereas the real GDP is adjusted by a GDP deflator which is a measurement of inflation since a base year. In the previous work MEVs are included directly in the DTSM (Bellotti & Crook, 2013), but in this study we do not take this approach for the following reasons:
- We devise APC to capture the whole calendar-time effect. If MEVs are included directly into the model, this most important part of the calendar-time effect will be missing.
- We do not assume MEVs represent all calendar time effects, because some effects such as legislation, environmental or social changes will also influence the calendar time function and these should also be included as part of the calendar-time effect.
- Some previous papers were looking to build explanatory models, but in this study, we are developing predictive models. MEVs in our study will be used later as a criteria to assess the accuracy of the model and directly including them into the model will reduce the reliability of this testing process.
All of the macroeconomic datasets covering the period of 2001 to 2013 show moderate changes over time. Figure 4 shows each of the MEV time series. The GDP growth dropped sharply in 2008, after which it went down to a trough (-3.99%), then quickly rose back and fluctuates slightly (range from 0.9% to 2.9%). House price index gradually rose from 247.88 in 2001 to 380.9 in 2007, before falling down to 308.79 in 2012, after which it slightly rose to 329.2 in 2013. As for the growth of unemployment rate, it rose in a very short time within 2001 (by 35.9%) and fell until 2006, after which it sharply rose by 80% in 2009, before falling again steadily over the remaining period.
4.1. Evaluation Methods
Since we model time-to-default event, this means the outcomes are binary (0 or 1), so the usual performance measures such as mean squared error and R-squared do not apply. Receiver operating characteristics curve is one of the ubiquitous methods to measure the binary classifications which can calculate the performance for each possible threshold from 0 to 1 to form a curve, and the area under this curve (AUC) to indicate the goodness of fit of the binary classifier. So, AUC can also be used in the context of survival analysis. However, it cannot fully estimate the performance of the survival model since AUC does not fully take time aspects into account (Dirick et al., 2017). Also, the dataset in our study is extremely imbalanced which limits the power of AUC. Therefore, to better measure and validate the goodness of model fit with the data, we use McFadden’s pseudo-R-squared to compare between our proposed neural network and linear DTSM:
where and indicate the likelihood of the target prediction model and baseline model (null model), respectively. Similar to R-squared used in linear regression to calculate the proportion of explained variance, pseudo-R-squared measures the degree of improvement of the model likelihood over a null model, which is a simple baseline model containing no predictor variables (Hemmert et al., 2018).
5. Results
5.1. Neural Network versus Linear DTSM
5.1.1. Experimental Setup
The mortgage data set is divided into 40 subsets corresponding to each quarter of the origination data from 2004 to 2013. We then split each of the data subsets randomly into training data and independent testing data at vintage level with ratio 3:1. Each DTSM is trained on only the training data and is labelled with its corresponding time period; e.g., model07_4 represents the model for the fourth quarter of 2007.
5.1.2. Hyperparameter selection using Grid Search
The neural network architecture is selected using grid search of different settings given in Table 1. The grid search finds values of minus log-likelihood (the target loss function) ranging from 0.07681 to 0.08257, with the best value 0.07681 when using the following hyperparameters of the neural network: no dropout, 4 hidden layer, 8 neurons in each layer and 20 epochs for training.
5.1.2. Comparison between Neural Network and Linear DTSM
The vintage level neural networks are compared against vintage level linear DTSM and aggregate linear DTSM which is built across training data from all vintages together. Pseudo-R-Square was calculated for each model in quarterly test sets from 2004 to 2013 and the results are shown in Figure 5. We use L2 regularization to stabilize the linear DTSM estimations. Figure 5 shows that neural network outperforms the vintage level linear DTSMs most of the time. The aggregate linear DTSM performs better, but on average neural network outperforms it, especially after 2009.
5.2. Lexis Graphs
Based on the predictions from the NN-DTSM, several Lexis graphs are produced for the whole population (the general case) and for different segments of the population: broadly, low risk (LTV<50% and interest rate<4%) and high risk (interest rate>7.5%). Since the neural network is non-linear we can expect it to generate Lexis graphs that are sensitive to population segment characteristics. Since the underlying DTSM models include origination variables such as credit score and LTV, it should be noted when interpreting these Lexis curves, that the vintage effect is the remaining vintage effect controlling for these measurable risk factors, or, in other words, the vintage effect shown is the “unknown” vintage effect that is not directly measurable in the given risk variables, such as underwriting rules, risk appetite, unobserved borrower characteristics, and so on. This is somewhat different to vintage effects reported by Breeden (2016), e.g., which represent the whole vintage effect (including possibly measurable risk factors). Results are shown in Figure 6, Figure 7 and Figure 8.
For the Lexis graph for the whole population, Figure 6, we can see the financial crisis emerging after 2008 with a dark cloud of defaults from 2009 to 2013. But interestingly, the Lexis graph shows that these defaults are along diagonal bands, corresponding to different account vintages, thus each band indicates the risk associated with some vintage. In particular, if we trace the dark diagonals back to the horizontal axis (loan age=0) we see that the riskiest origination periods were between 2006 and 2008. On the vertical axis, we can see that defaults are rarer within the first year of a loan.
The Lexis graphs for especially low and high risks accounts reveal two different kinds of customer behavior patterns. For high risk, high default rates emerges earlier and PD is much higher. For high risk customers, PD is as high as 0.05, whereas for low risk group, PD is only as high as 0.0035. We see that in both groups, the most vulnerable cohorts begin in 2006, but ends sharply in 2010 for high risk group, whereas a tail of further defaults are found for low risk group into 2012 although with much lower PDs).
5.3. APC Model
We use the Lexis graph and local APC linear models to interpret the black box of neural network. The relationship between the three time components: loan age, calendar time and vintage, and the PD outputs of the neural network are modeled using ridge regression. The ridge coefficient is chosen to maximize model fit on an independent hold-out data set. APC effects are decomposed using this approach, as described in Section 3.5, and different risk patterns for different customers are analyzed. Different groups of mortgage applicants are illustrated in this section.
Figure 9 shows time components for the general population. Higher values relate to higher risk of default on a PD scale. This vintage curve clearly shows that the risk reached a peak before 2008, remained at a high level for around two quarters and then dropped rapidly in 2009, indicating the time the banks became more risk adverse facing the unfolding mortgage crisis. For the loan age effect of the general case, the risk steadily increased to around 30 quarters, then maintained at a stable level, before dropped slightly at 40 quarters. For calendar time effect, the risk actually went down until 2008, which indicates that the operating environment and US economy were performing well at that time, just before the financial crisis. However, the risk increased sharply in 2009 and 2010 as the financial crisis took hold.
Figure 10 shows the results for the segment of relatively low LTV (<50%) and low interest rate (<4%), corresponding to the Lexis graph in Figure 7. All APC effects are much smaller than that of the general case, which makes sense since this is expected to be a low risk group. In particular, the vintage effect is flatter, with noise, and having one peak in risk during 2006. Also, the calendar time effect peaked much later: 2013 compared to 2011 in the general case.
Figure 11 shows the results for a segment of accounts with exceptionally high interest rates, corresponding to the Lexis graph in Figure 8. All APC effects are much larger than in the general case, the vintage effect is shaped differently with a sharper rise and peak from 2007 to 2008. Noticeably, the calendar time effect became apparent about 2 to 3 quarters before the general case (i.e., it is already quite high in 2009).
5.4. Macroeconomic data fitting
5.4.1. Choose time lag for macroeconomic data
We suppose the MEVs have a lagged effect on default risk and we use univariate linear regression models to fit the calendar time effect decomposed by the model with each MEV with different time lags of the variables to discover the best lag, using the method discussed in Section 3.6. Each linear model is trained using the macroeconomic data ranging from 2000 to 2013 and the calendar time coefficient ranging from 2004 to 2013 (we define the range of potential lag time as up to 3 years). The results are shown in Figure 12.
For every MEV, the peaks within 12 quarters which means the best fitting of time lags for those variables are all within 3 years. The highest value for GDP growth and growth of unemployment rate are still very low (around 40%) which shows that they do not fit well with the calendar time effect. So, these two variables are excluded from our experiments. Only unemployment rate and HPI are reserved for further studies.
After the MEVs used for fitting are determined, the next step is to find the time lag with the best fits (highest ) for each variable. We select different data segments representing different customer profiles and use NN-DTSM to construct APC graphs. The calendar time effect of each APC model is then fitted against each MEV to find particular time lags using the method described in Section 3.6. The results are shown in Figure 13, Figure 14 and Figure 15.
For unemployment rate, low-risk customers have the longest time lag of 5 quarters, followed by the general customer group of 4 quarters and the high-risk group of 3 quarters; while for HPI, only low-risk group have time lag of 1 quarter, which indicates that HPI affects the low-risk customer a quarter behind, but has an immediate impact on the general and high-risk customer groups.
5.4.2. Multivariate fit of MEVs with calendar time effect component
To handle the APC identification problem, we use time trend of calendar date and MEVs with the selected time lag from the previous section to fit with the APC calendar time effect, following Equation (20). The results are shown in Table 2 for the general case.
The results show that the adjusted exceeds 0.9, meaning the time trend together with the two MEVs with different best-fit time lag can fit well with the calendar time effect. Adjusted is used since sample size for this regression is low (40 observations). The coefficient on time trend is very small and p-value is large (>0.5) which indicates that time trend is not an important variable for this regression and it is reasonable to suppose the slope . The consequence is that the regularization in the APC ridge regression is sufficient to solve the APC identification problem for this particular data set and there is no need to adjust the slope post hoc.
6. Conclusion
In this paper, the vintage-level neural networks were built for DTSM, and evaluated on a large US mortgage data set over a long period of time covering the 2009 financial crisis. The results show that the neural network is competitive with the vintage level and aggregate DTSMs. Furthermore, to improve the explainability of the black-box neural networks, we introduce Lexis graphs and local APC modelling. The Lexis graph shows the PD estimate from NN-DTSM decomposed into the three timelines using APC analysis: loan age, vintage and calendar time, which allows us to visualize the change of the model behavior with the different time components. This approach helps to construct customer segment-specific APC graphs from the neural networks, which can better estimate, decompose and interpret the contribution and risk pattern of the three time-related risks on the accounts due to loan age, calendar time and vintage. Instead of just looking at the performance and estimates from NN-DTSM without understanding the mechanism and the reliability of the models, these APC graphs can help practitioners and researchers to build trust in the neural networks and better understand the story of the loan portfolio over time for specific datasets and customer segments. In contrast, the linear survival model can only provide PD estimate APC graphs for the entire population. To solve the APC identification problem due to the linear relationship between the three timelines (calendar time = loan age + vintage), we make further restrictions and assumptions on the model functions to find a reliable set of APC parameters. In this study, we use two approaches: (1) add regularization term into the loss function to control the complexity of the APC model, (2) control the parameters of APC timelines by an arbitrary slope term σ, and correlate the calendar time effect with observed macroeconomic effects to calculate a unique solution, using time-series regression. We find a strong correlation between MEVs and the environmental risk time component estimated using our methodology. In future work, we will explore using different neural networks that may be suitable for the credit risk and survival modelling problem, such as recurrent neural networks, to construct architectures for DTSM that allows feedforward of information from one vintage to another, and the inclusion of behavioural data.
Author Contributions
Conceptualization, A.B. and H.W.; methodology, A.B.; software, H.W.; validation, H.W., A.B., R.B. and R.Q.; investigation, H.W.; resources, A.B.; data curation, H.W.; writing—original draft preparation, H.W. and A.B.; writing—review and editing, H.W., A.B., R.B. and R.Q.; visualization, H.W. and A.B.; supervision, A.B., R.B. and R.Q.; project administration, A.B.; funding acquisition, A.B. and R.B. All authors have read and agreed to the published version of the manuscript.
Funding
This research was funded by Ningbo Municipal Government, grant number 2021B-008-C and Hao Wang is partly funded by Microsoft Research Scholarship 20043MSRA.
Data Availability Statement
Data is owned by Freddie Mac and is publicly downloadable for research purposes from www.freddiemac.com/research/datasets/sf-loanlevel-dataset.
Conflicts of Interest
The authors declare no conflict of interest.
References
- Allison, P.D. Discrete-time methods for the analysis of event histories. Sociological methodology 1982, 13, 61–98. [Google Scholar] [CrossRef]
- Altman, E.I. Financial Ratios, Discriminant Analysis and the Prediction of Corporate Bankruptcy. The Journal of Finance 1968, 23, 589–609. [Google Scholar] [CrossRef]
- Arya, S.; Eckel, C.; Wichman, C. Anatomy of the credit score. Journal of Economic Behavior & Organization 2013, 95, 175–185. [Google Scholar]
- Bell, S. ANPC member profile for APC. Australasian Plant Conservation: Journal of the Australian Network for Plant Conservation 2020, 29, 38–39. [Google Scholar] [CrossRef]
- Bellotti, T.; Crook, J. Credit scoring with macroeconomic variables using survival analysis. Journal of the Operational Research Society 2009, 60, 1699–1707. [Google Scholar] [CrossRef]
- Bellotti, T.; Crook, J. Forecasting and stress testing credit card default using dynamic models. International Journal of Forecasting 2013, 29, 563–574. [Google Scholar] [CrossRef]
- Bellotti, T.; Crook, J. Retail credit stress testing using a discrete hazard model with macroeconomic factors. Journal of the Operational Research Society 2014, 65, 340–350. [Google Scholar] [CrossRef]
- Blumenstock, G.; Lessmann, S.; Seow, H.-V. Deep learning for survival and competing risk modelling. Journal of the Operational Research Society 2022, 73, 26–38. [Google Scholar] [CrossRef]
- Breeden, J.L. Incorporating lifecycle and environment in loan-level forecasts and stress tests. European Journal of Operational Research 2016, 255, 649–658. [Google Scholar] [CrossRef]
- Breeden, J.L.; Crook, J. Multihorizon discrete time survival models. Journal of the Operational Research Society 2022, 73, 56–69. [Google Scholar] [CrossRef]
- Correa, A.; Gonzalez, A.; Ladino, C. Genetic algorithm optimization for selecting the best architecture of a multi-layer perceptron neural network: a credit scoring case. SAS Global Forum, 2011.
- Cox, D.R. Regression models and life-tables. Journal of the Royal Statistical Society: Series B (Methodological) 1972, 34, 187–202. [Google Scholar]
- Dahl, G.E.; Sainath, T.N.; Hinton, G.E. Improving deep neural networks for LVCSR using rectified linear units and dropout. 2013 IEEE international conference on acoustics, speech and signal processing, 2013.
- De Leonardis, D.; Rocci, R. Assessing the default risk by means of a discrete-time survival analysis approach. Applied Stochastic Models in Business and Industry 2008, 24, 291–306. [Google Scholar] [CrossRef]
- Dendramis, Y.; Tzavalis, E.; Cheimarioti, A. Measuring the Default Risk of Small Business Loans: Improved Credit Risk Prediction using Deep Learning. 2020. Available at SSRN 372 9918. [CrossRef]
- Dirick, L.; Claeskens, G.; Baesens, B. Time to default in credit scoring using survival analysis: a benchmark study. Journal of the Operational Research Society 2017, 68, 652–665. [Google Scholar] [CrossRef]
- Faraggi, D.; Simon, R. A neural network model for survival data. Statistics in Medicine 1995, 14, 73–82. [Google Scholar] [CrossRef] [PubMed]
- Frame, W.S.; Fuster, A.; Tracy, J.; Vickery, J. The rescue of Fannie Mae and Freddie Mac. Journal of Economic Perspectives 2015, 29, 25–52. [Google Scholar] [CrossRef]
- Gensheimer, M.F.; Narasimhan, B. A scalable discrete-time survival model for neural networks. PeerJ 2019, 7, e6257. [Google Scholar] [CrossRef] [PubMed]
- Glenn, N.D. Cohort Analysis (Vol. 5); Sage, 2005. [Google Scholar]
- Gourieroux, C.; Monfort, A.; Polimenis, V. Affine models for credit risk analysis. Journal of Financial Econometrics 2006, 4, 494–530. [Google Scholar] [CrossRef]
- Hemmert, G.A.; Schons, L.M.; Wieseke, J.; Schimmelpfennig, H. Log-likelihood-based pseudo-R2 in logistic regression: deriving sample-sensitive benchmarks. Sociological Methods & Research 2018, 47, 507–531. [Google Scholar]
- Hongtao, L.; Qinchuan, Z. Applications of deep convolutional neural network in computer vision. Journal of Data Acquisition and Processing 2016, 31, 1–17. [Google Scholar]
- Huang, Q.; Mao, J.; Liu, Y. An improved grid search algorithm of SVR parameters optimization. 2012 IEEE 14th International Conference on Communication Technology, 2012.
- Hussin Adam Khatir, A.A.; Bee, M. Machine Learning Models and Data-Balancing Techniques for Credit Scoring: What Is the Best Combination? Risks 2022, 10, 169. [Google Scholar] [CrossRef]
- Jha, P.N.; Cucculelli, M. A New Model Averaging Approach in Predicting Credit Risk Default. Risks 2021, 9, 114. [Google Scholar] [CrossRef]
- Khemais, Z.; Nesrine, D.; Mohamed, M. Credit scoring and default risk prediction: A comparative study between discriminant analysis & logistic regression. International Journal of Economics and Finance 2016, 8, 39. [Google Scholar]
- Kupper, L.L.; Janis, J.M.; Karmous, A.; Greenberg, B.G. Statistical age-period-cohort analysis: a review and critique. Journal of Chronic Diseases 1985, 38, 811–830. [Google Scholar] [CrossRef]
- Lee, C.; Zame, W.; Yoon, J.; van der Schaar, M. DeepHit: A Deep Learning Approach to Survival Analysis With Competing Risks. Proceedings of the AAAI Conference on Artificial Intelligence 2018, 32. [Google Scholar] [CrossRef]
- Ohno-Machado, L. Medical applications of artificial neural networks: connectionist models of survival. Ph.D. dissertation, Stanford University, 1996. [Google Scholar]
- Pang, H.-x.; Dong, W.-d.; Xu, Z.-h.; Feng, H.-j.; Li, Q.; Chen, Y.-t. Novel linear search for support vector machine parameter selection. Journal of Zhejiang University SCIENCE C 2011, 12, 885–896. [Google Scholar] [CrossRef]
- Ptak-Chmielewska, A.; Matuszyk, A. Application of the random survival forests method in the bankruptcy prediction for small and medium enterprises. Argumenta Oeconomica 2020, 1, 127–142. [Google Scholar] [CrossRef]
- Ryu, J.Y.; Lee, M.Y.; Lee, J.H.; Lee, B.H.; Oh, K.-S. DeepHIT: a deep learning framework for prediction of hERG-induced cardiotoxicity. Bioinformatics 2020, 36, 3049–3055. [Google Scholar] [CrossRef]
- Siarka, P. Vintage analysis as a basic tool for monitoring credit risk. Mathematical Economics 2011, 7, 213–228. [Google Scholar]
- Sohn, S.Y.; Kim, D.H.; Yoon, J.H. Technology credit scoring model with fuzzy logistic regression. Applied Soft Computing 2016, 43, 150–158. [Google Scholar] [CrossRef]
- Thomas, L.; Crook, J.; Edelman, D. Credit scoring and its applications. SIAM. 2017.
- Thomas, L.C. A survey of credit and behavioural scoring: forecasting financial risk of lending to consumers. International Journal of Forecasting 2000, 16, 149–172. [Google Scholar] [CrossRef]
- Yang, Y.; Schulhofer-Wohl, S.; Fu, W.J.; Land, K.C. The intrinsic estimator for age-period-cohort analysis: what it is and how to use it. American Journal of Sociology 2008, 113, 1697–1736. [Google Scholar] [CrossRef]
Figure 1.
Multiple vintage level neural networks.
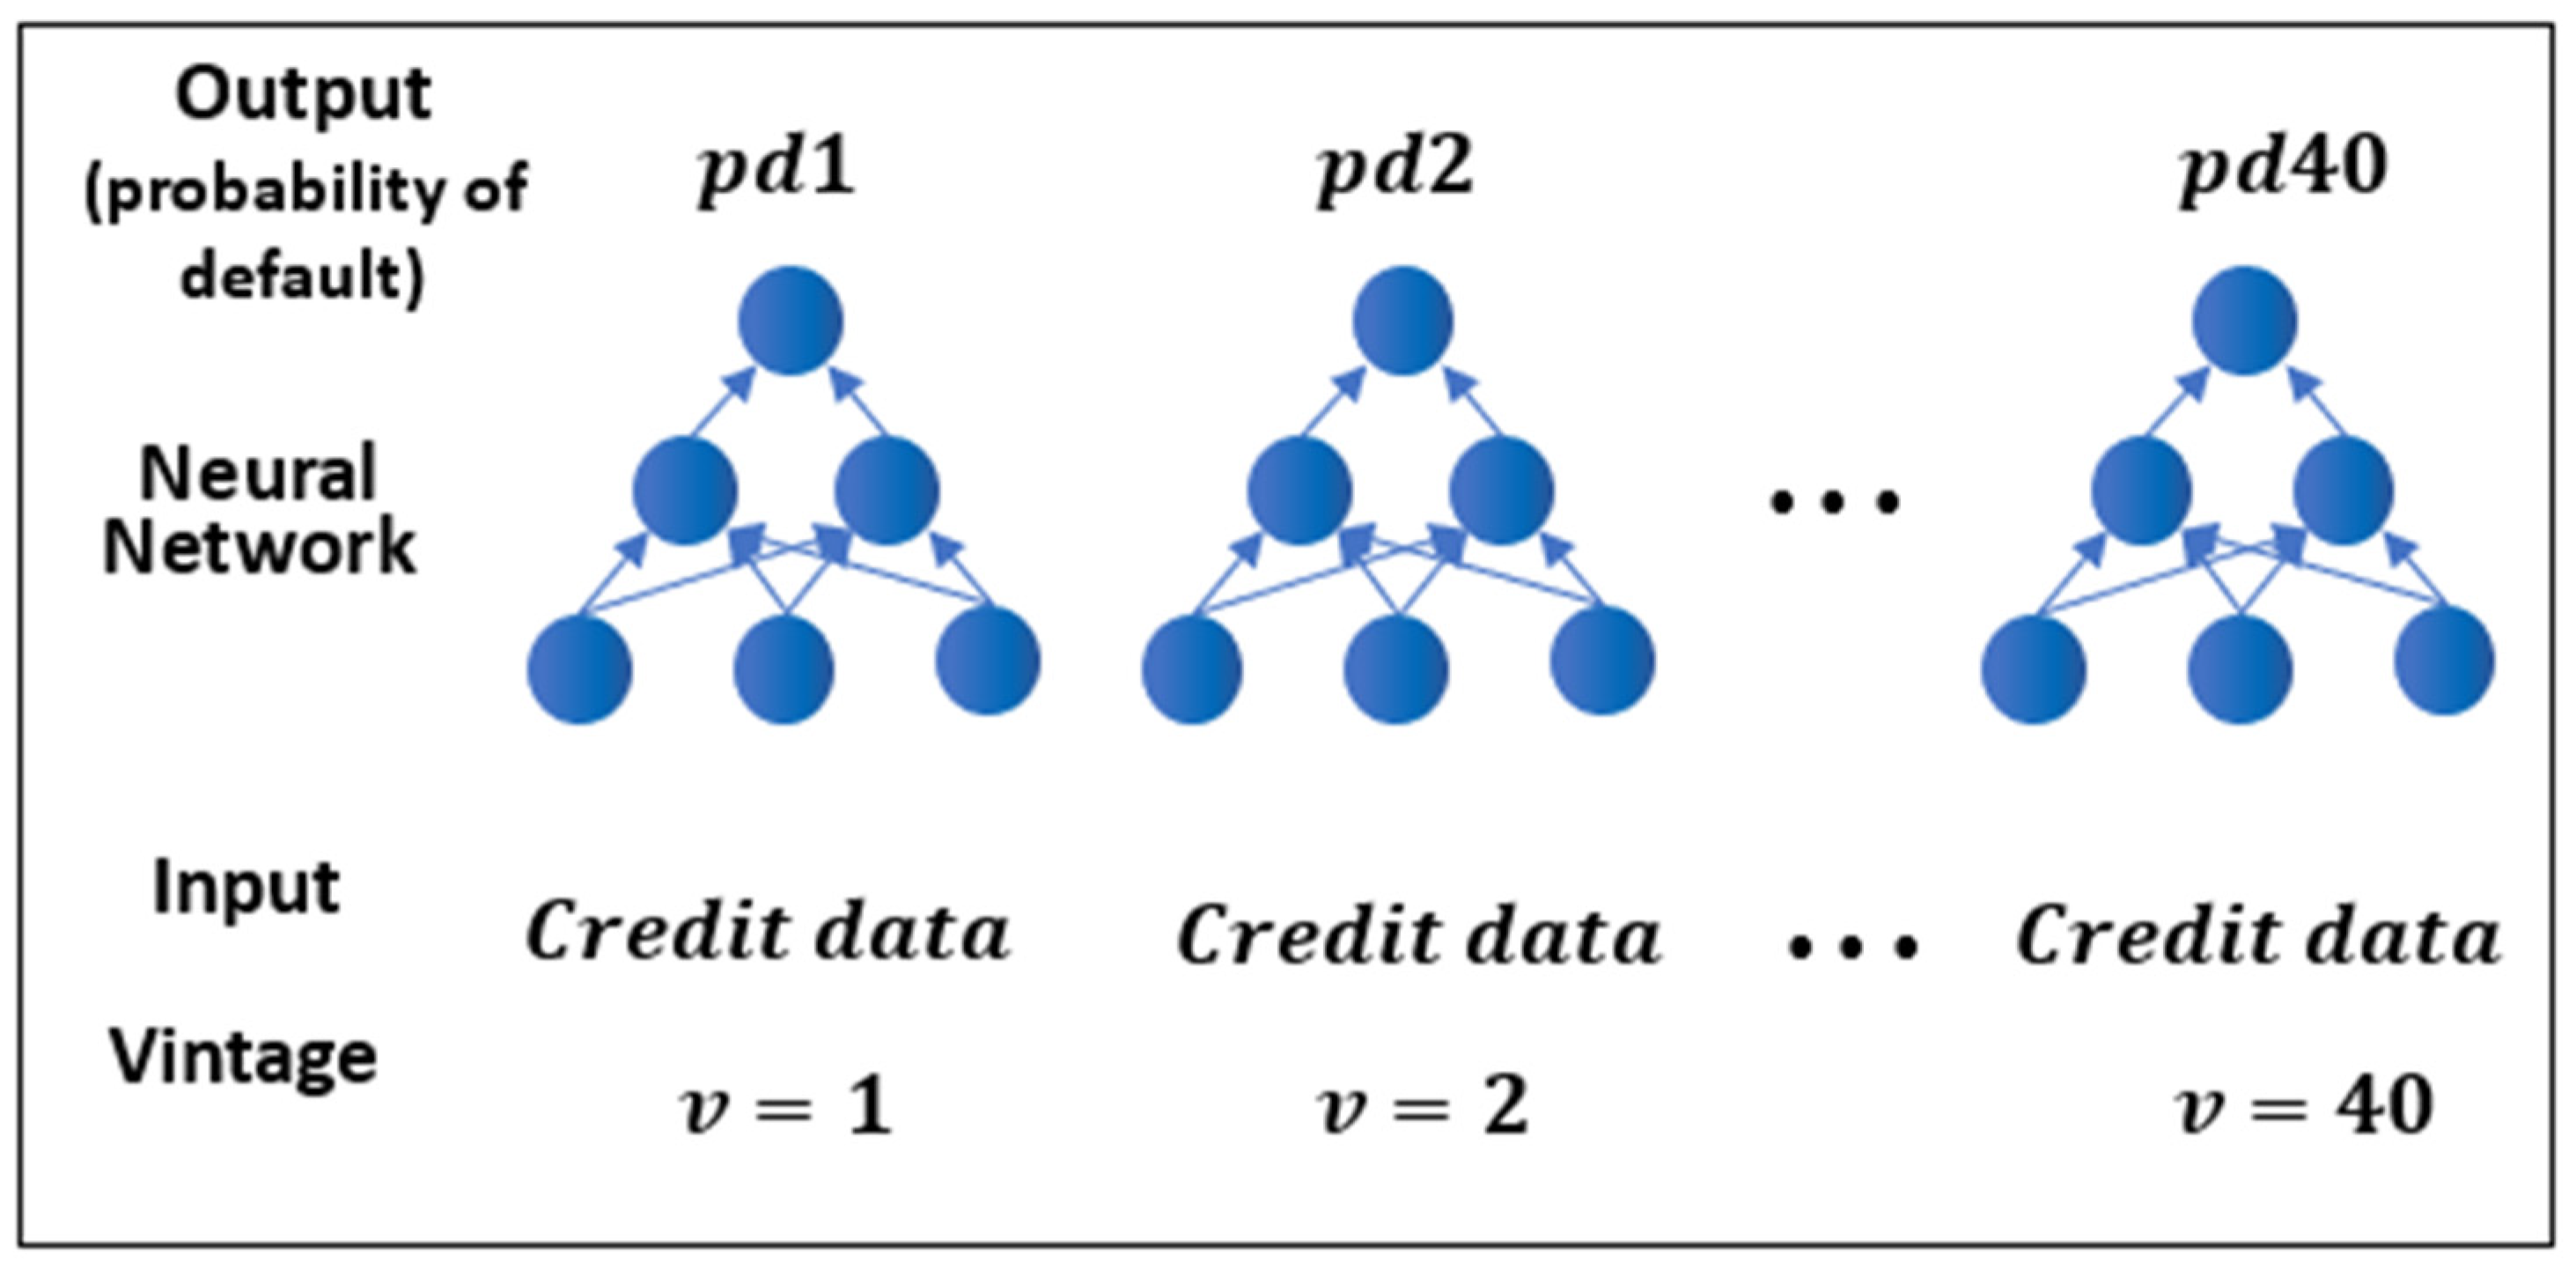
Figure 2.
Overview of neural network for DTSM with APC explanatory output methodology.
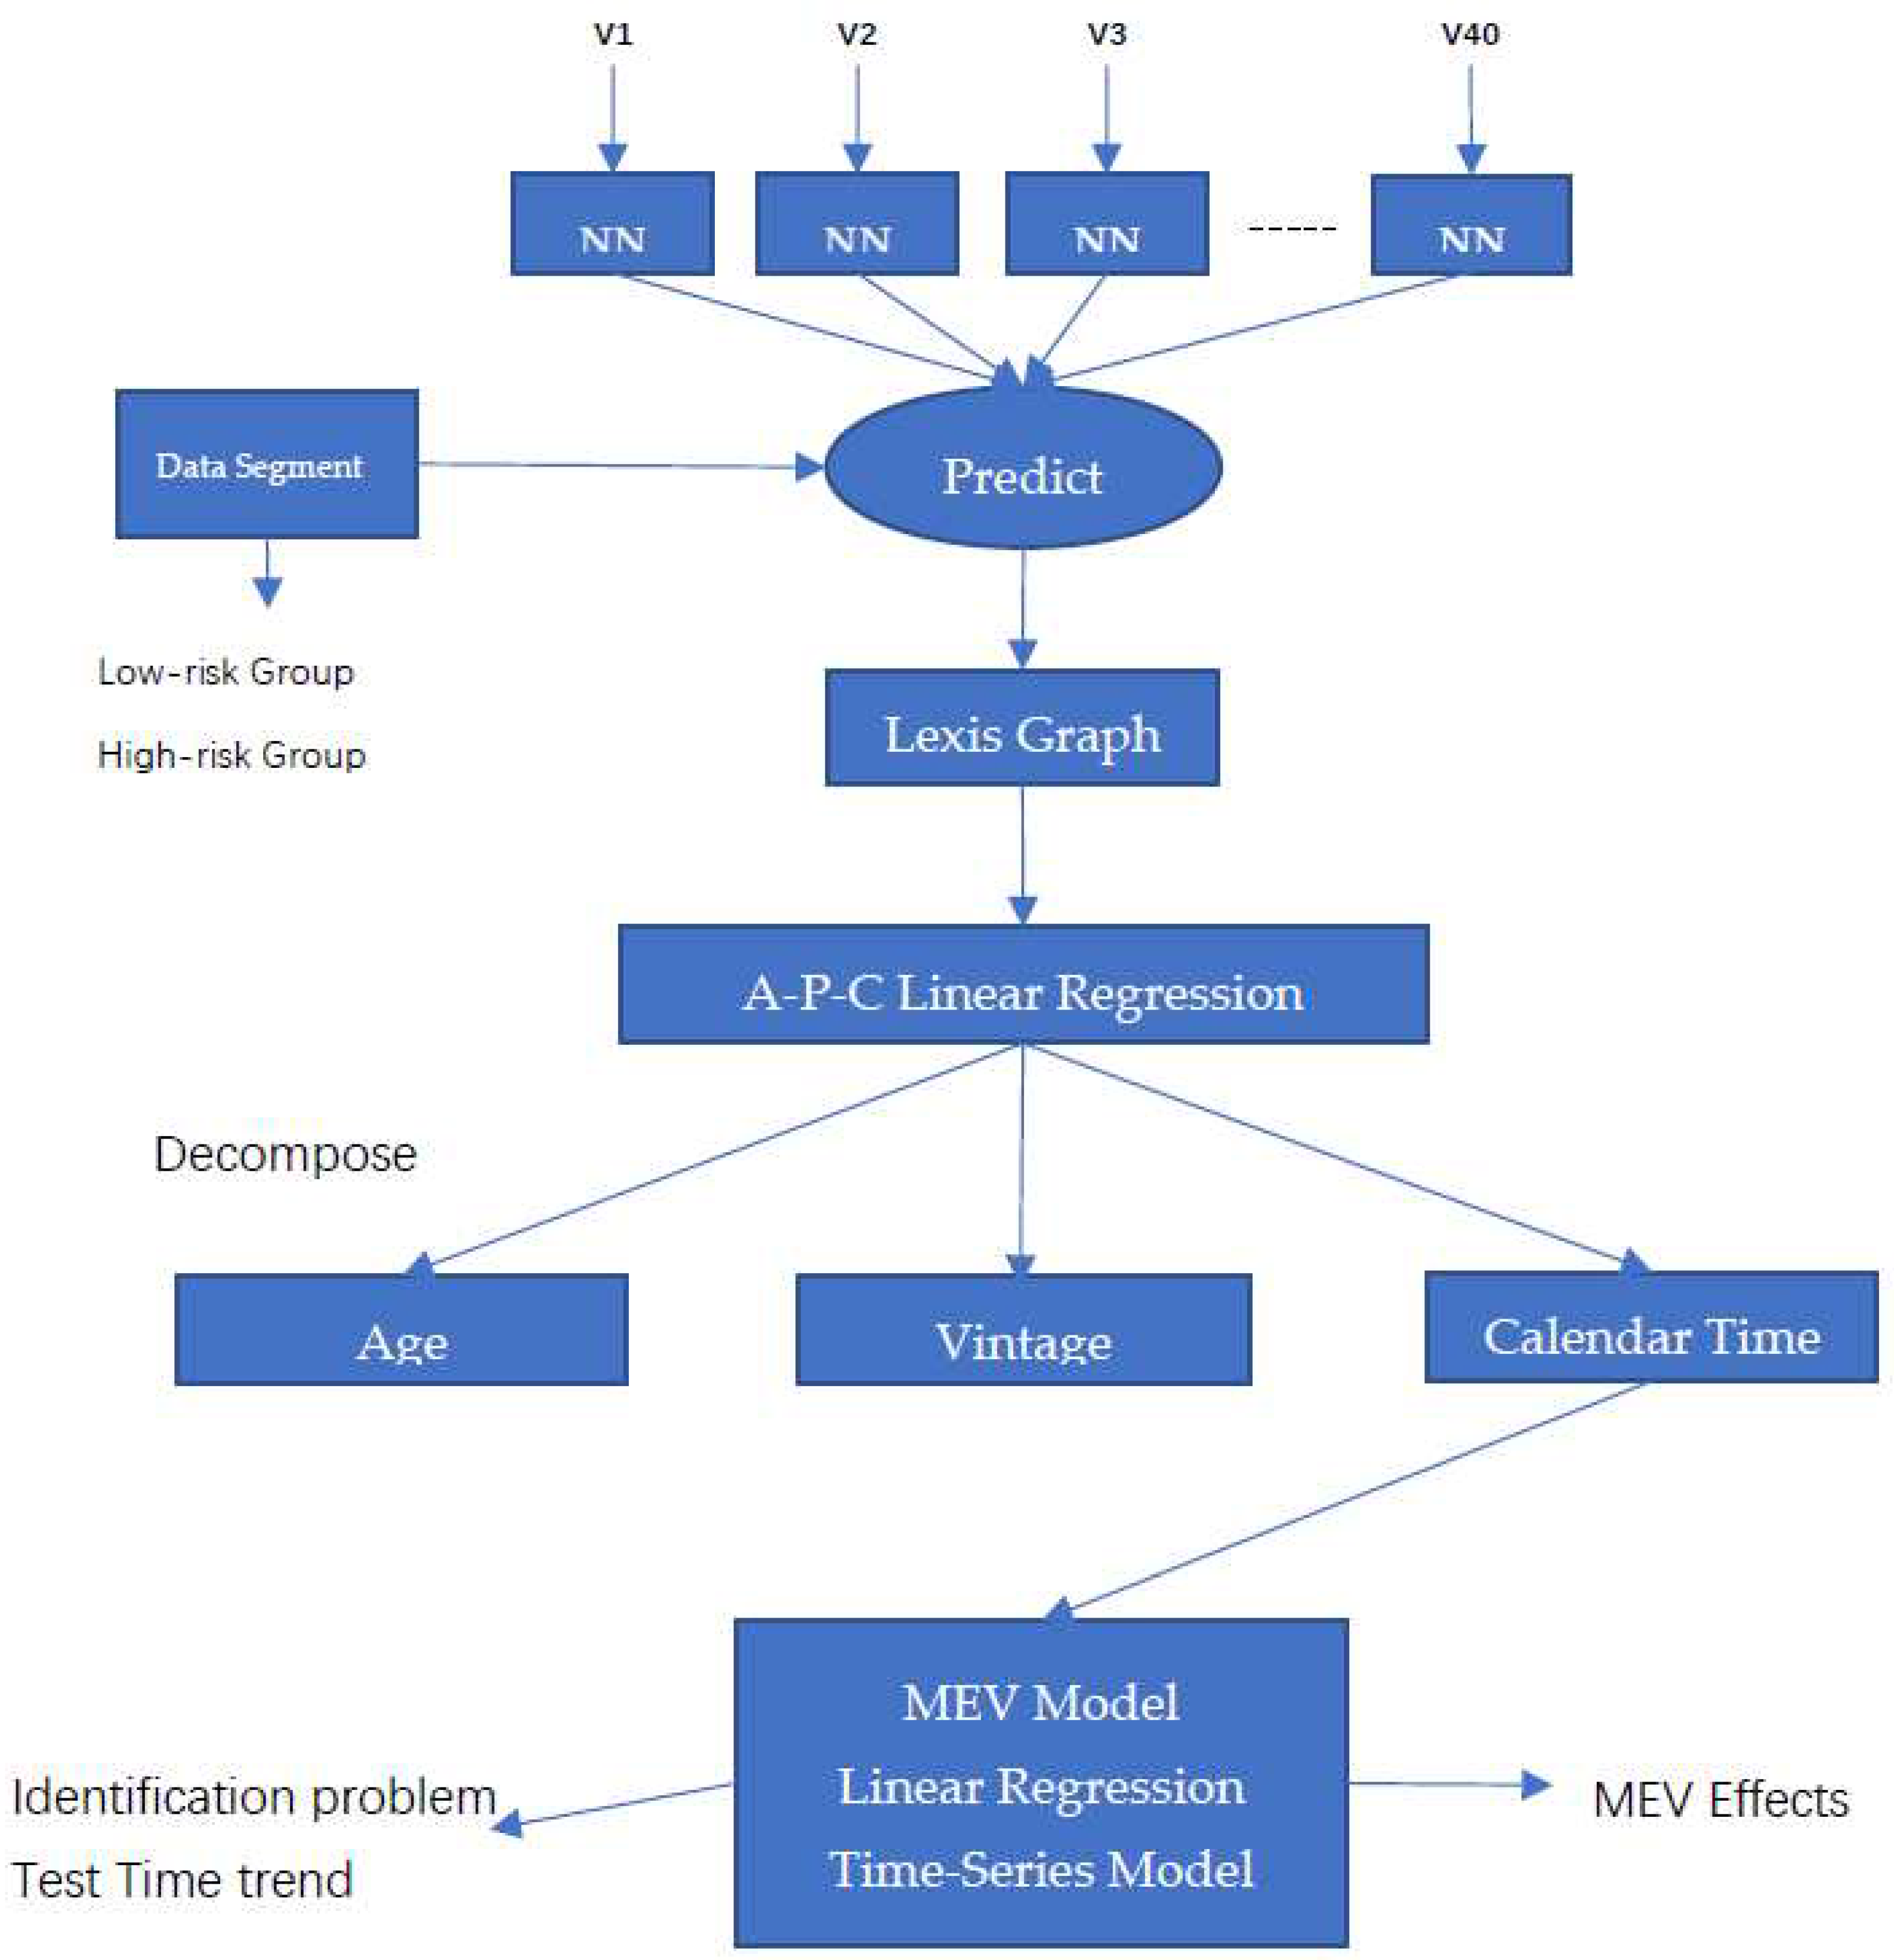
Figure 3.
Default rates by origination quarter (after under-sampling).
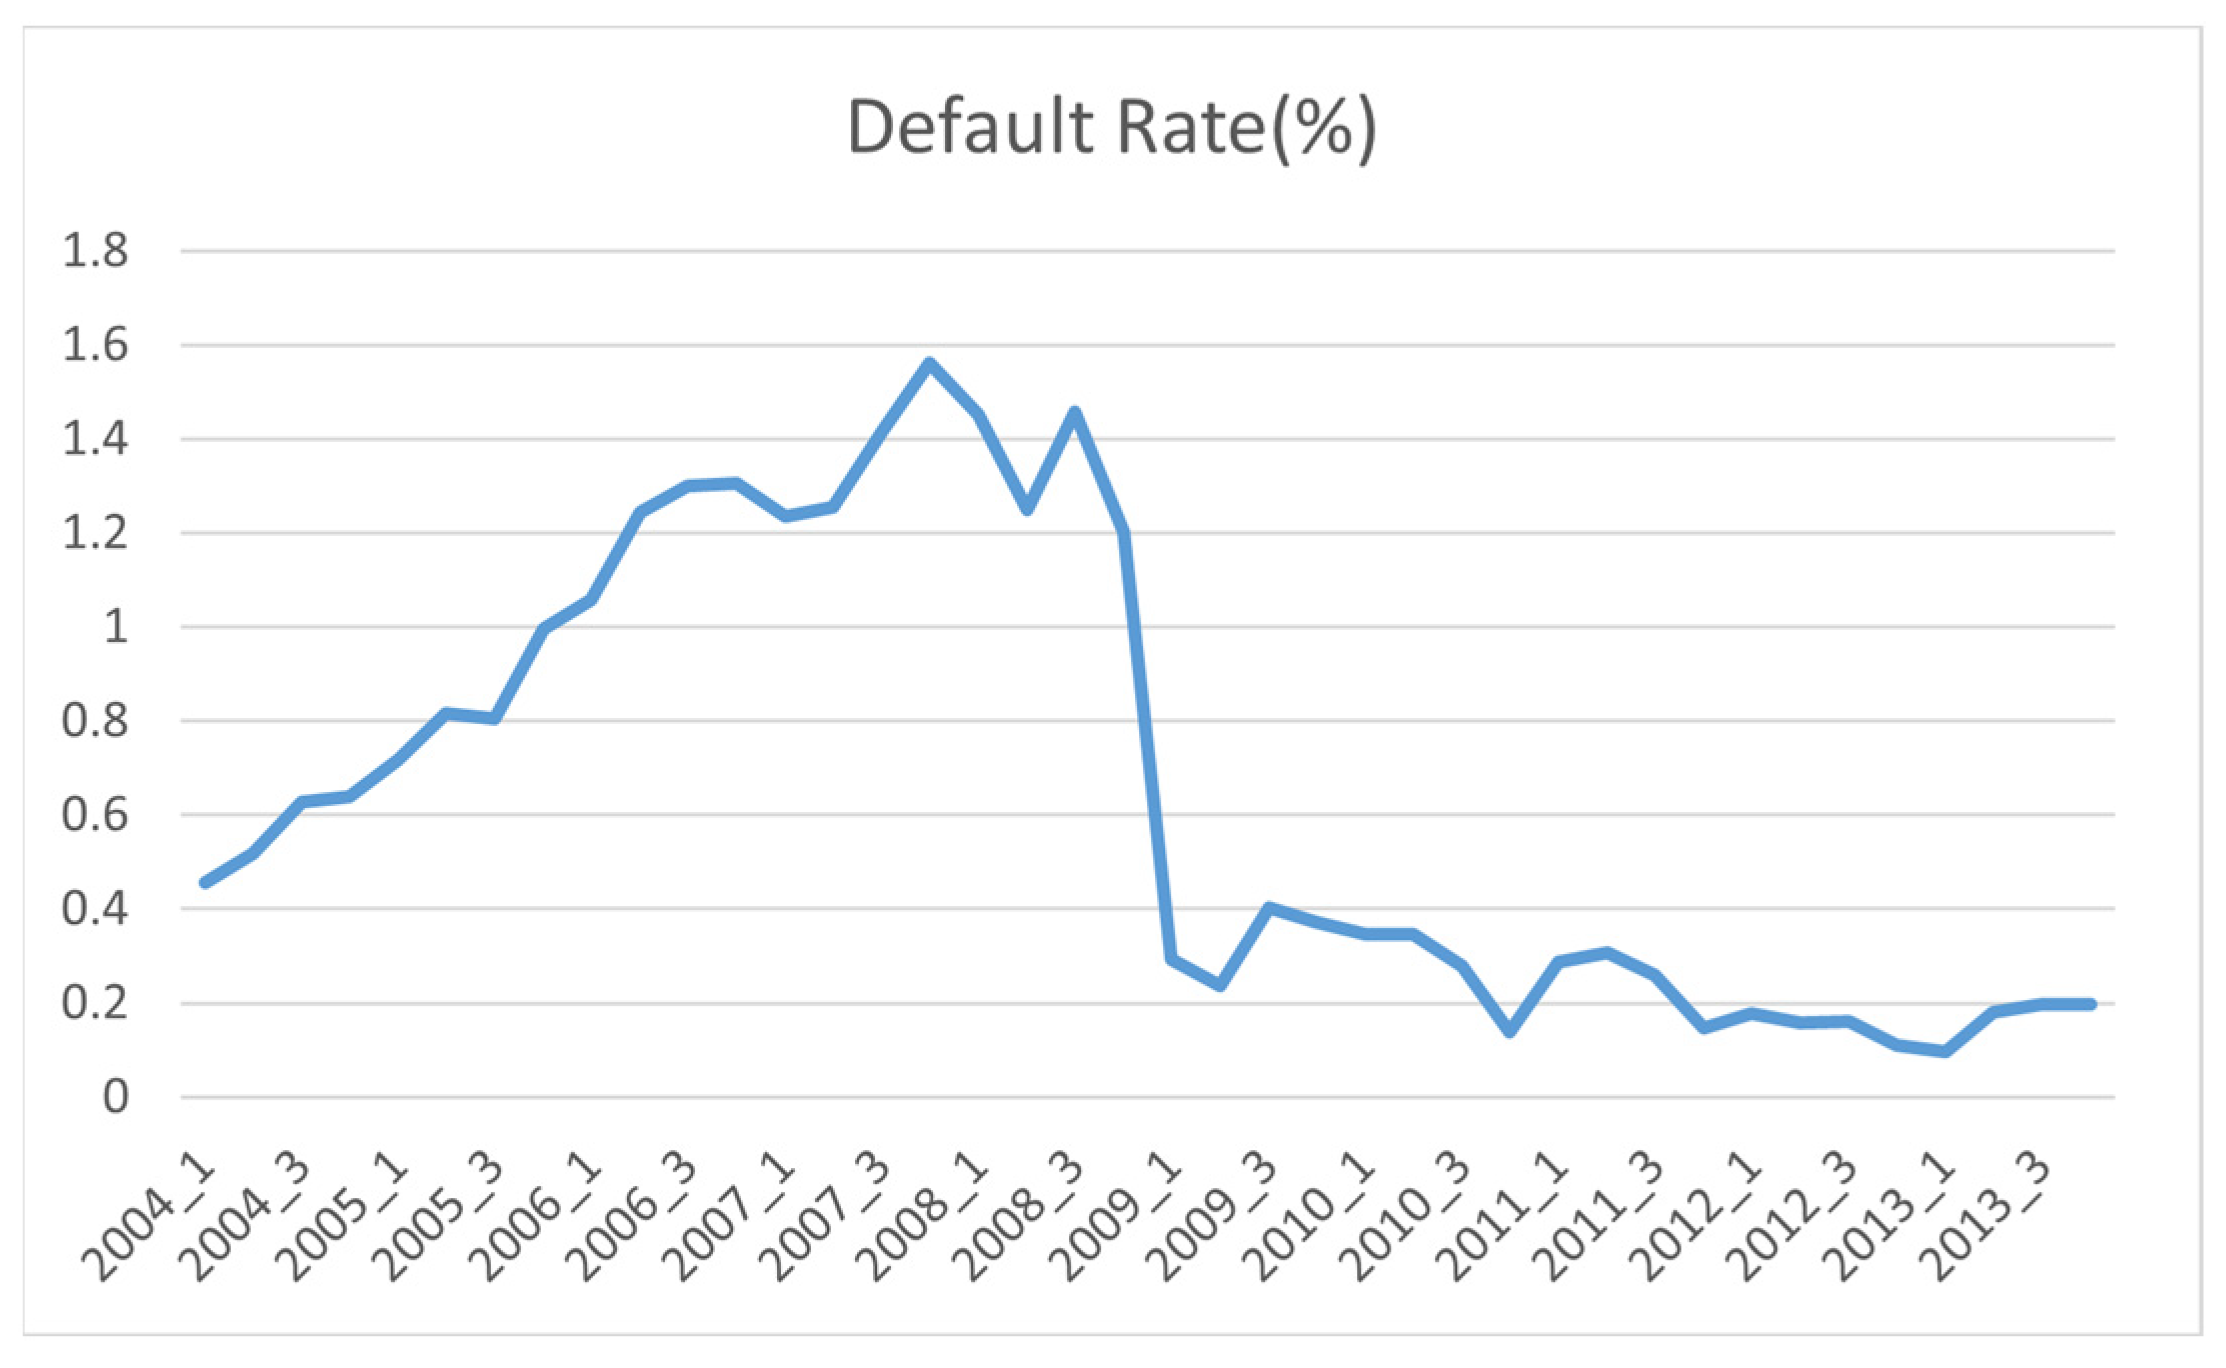
Figure 4.
Macroeconomic time series (quarters since first quarter 2001).
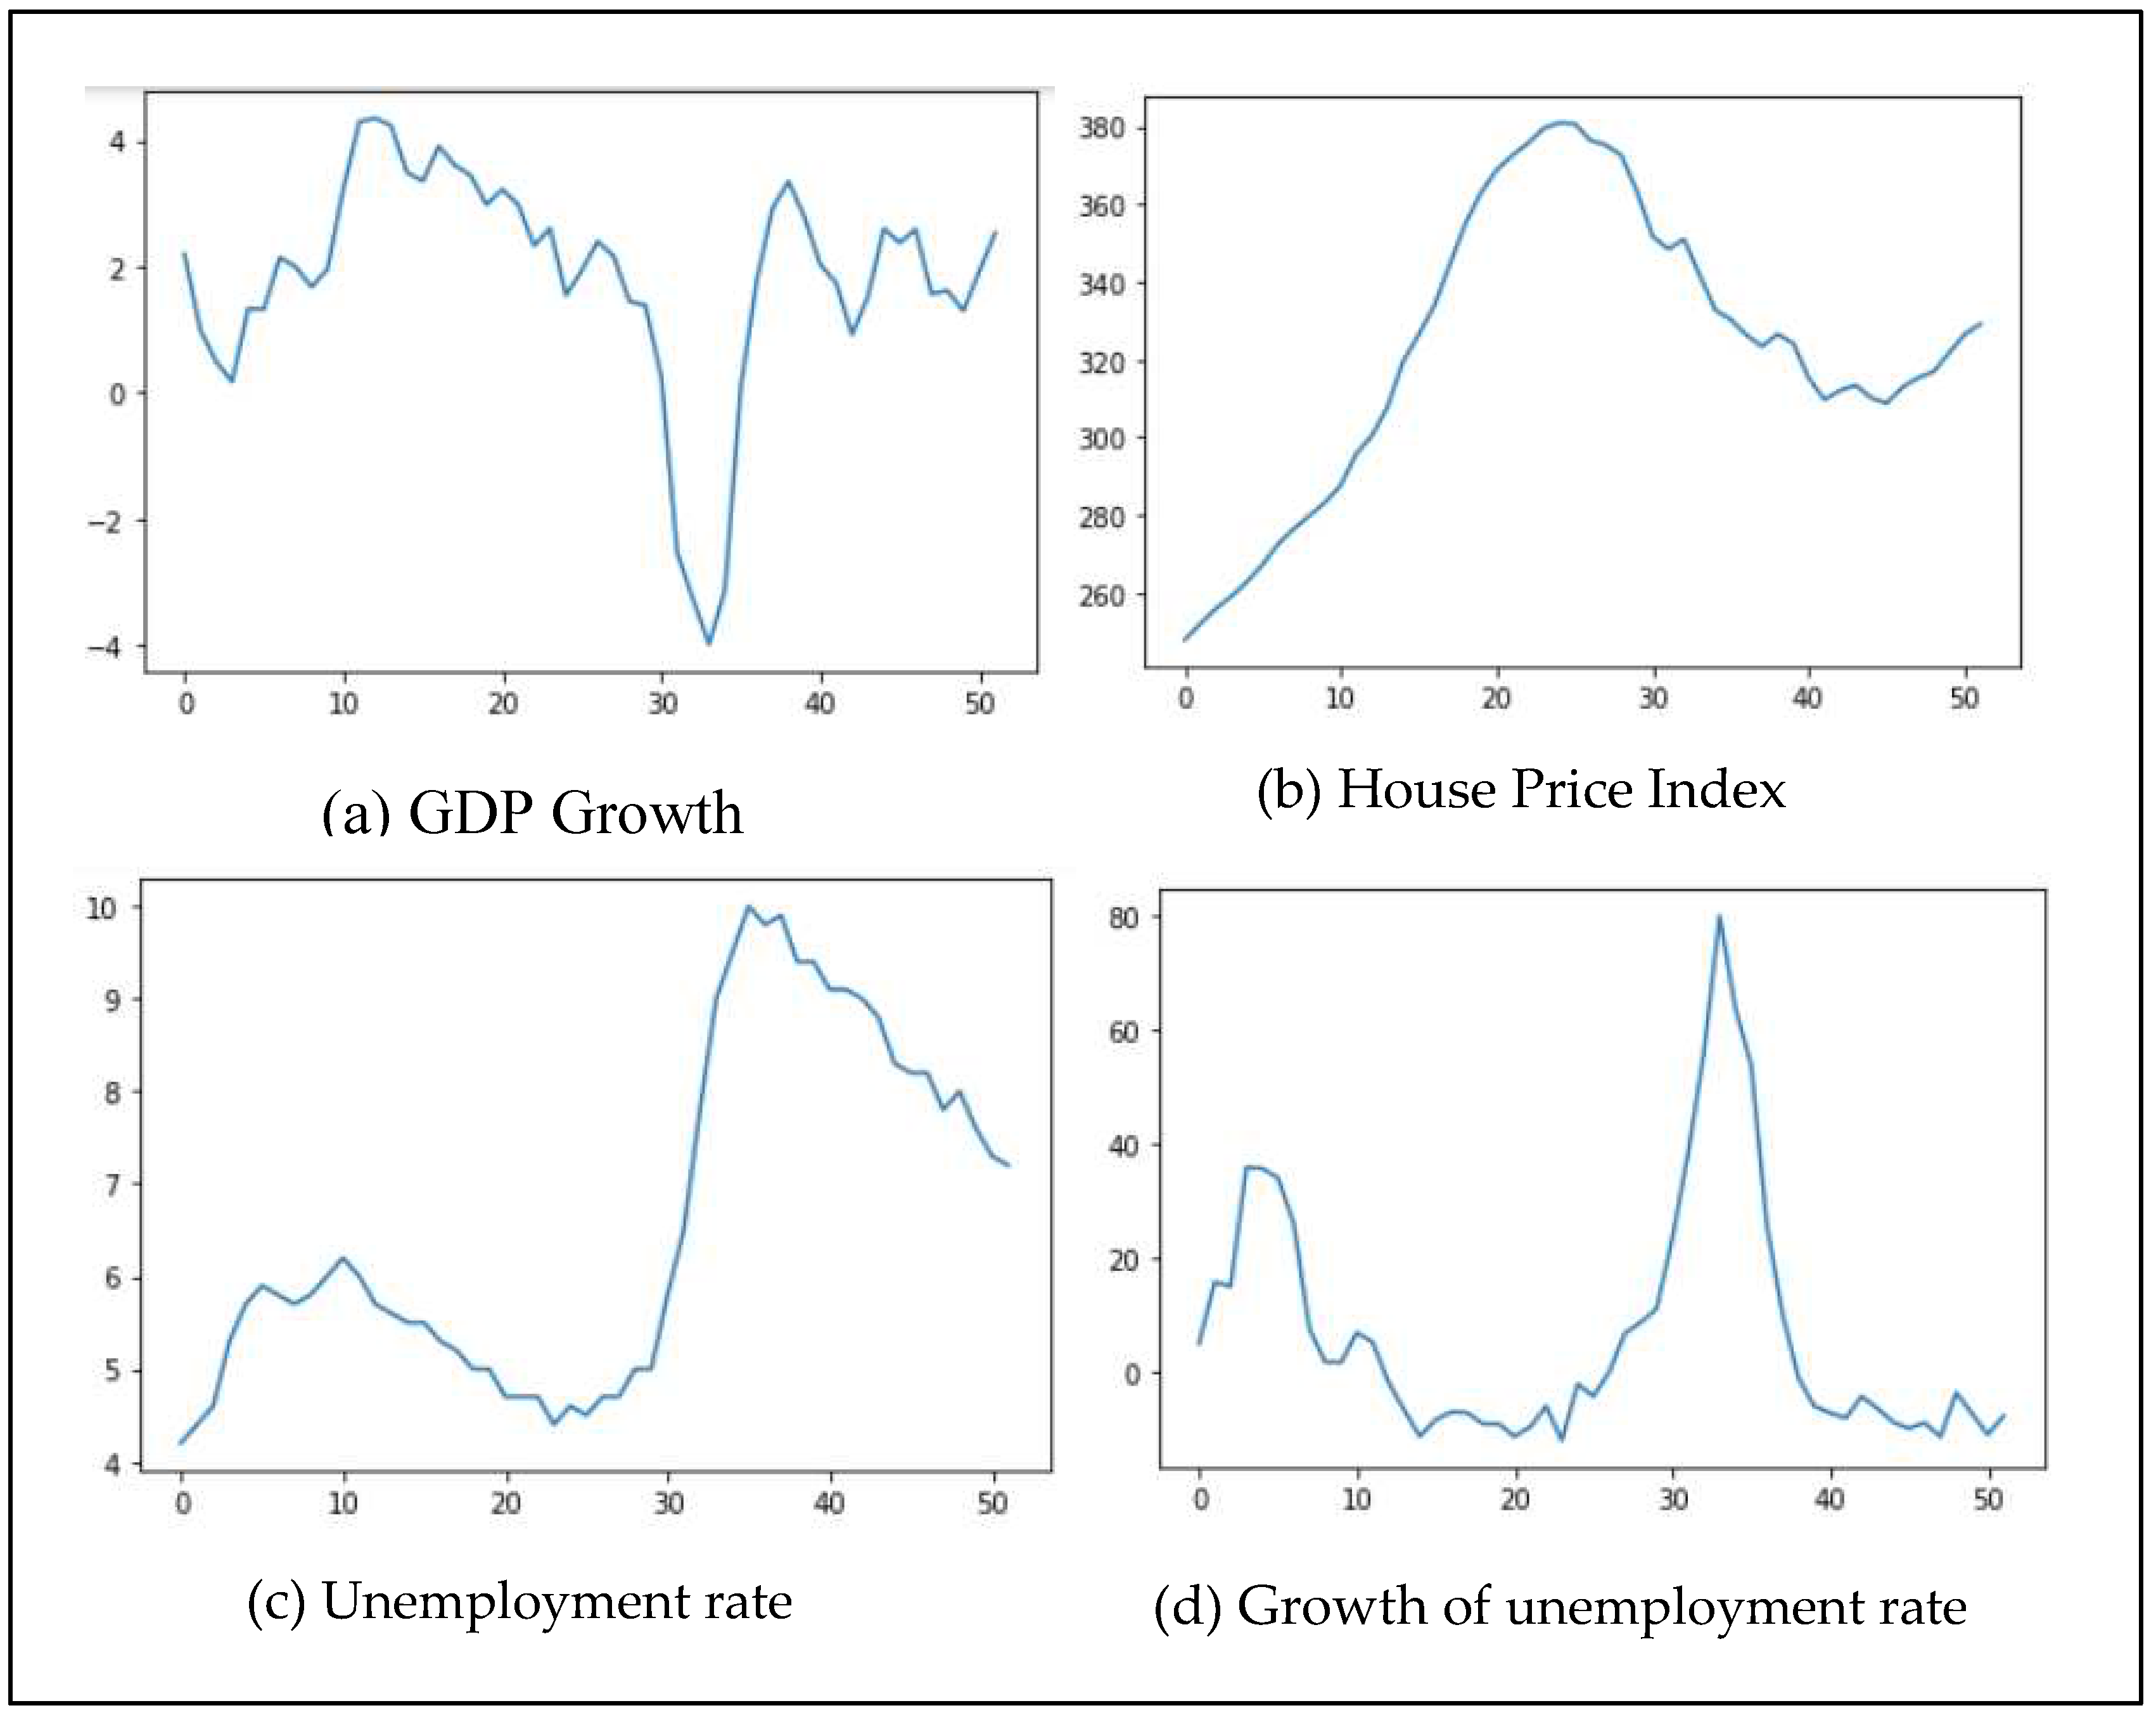
Figure 5.
Performance of different models (pseudo-R-squared).
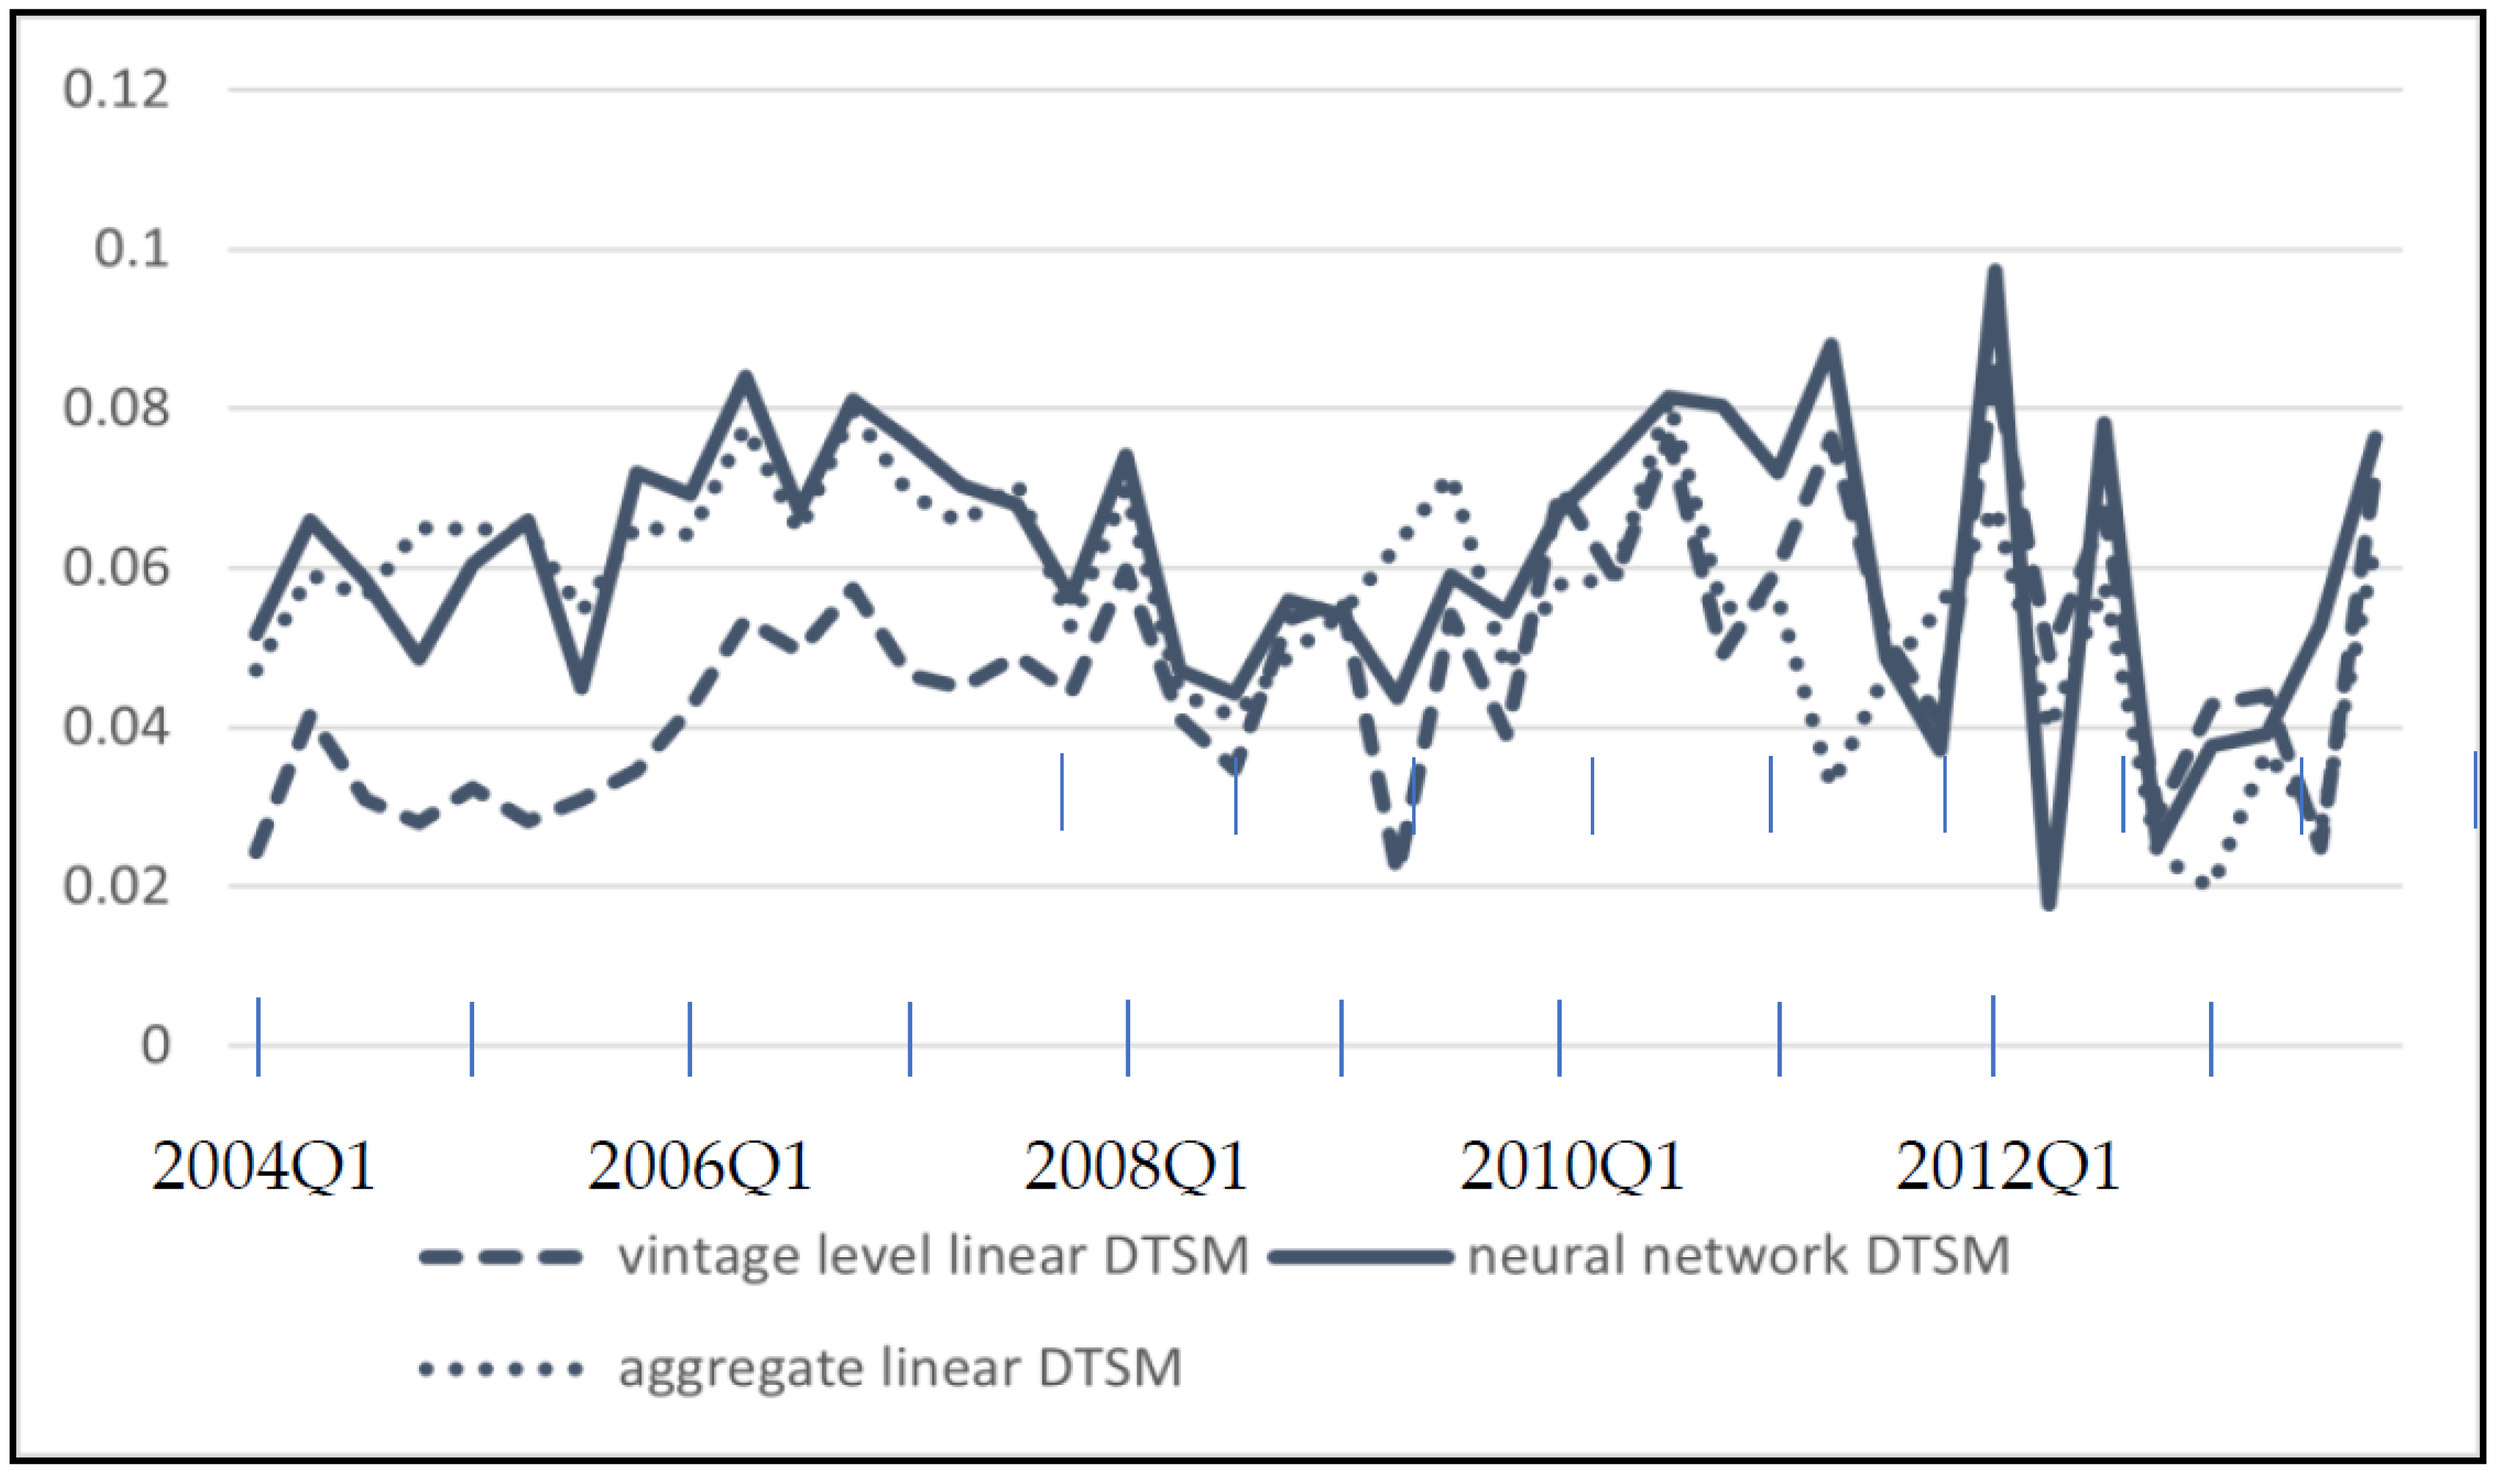
Figure 6.
Lexis graph for the whole population.
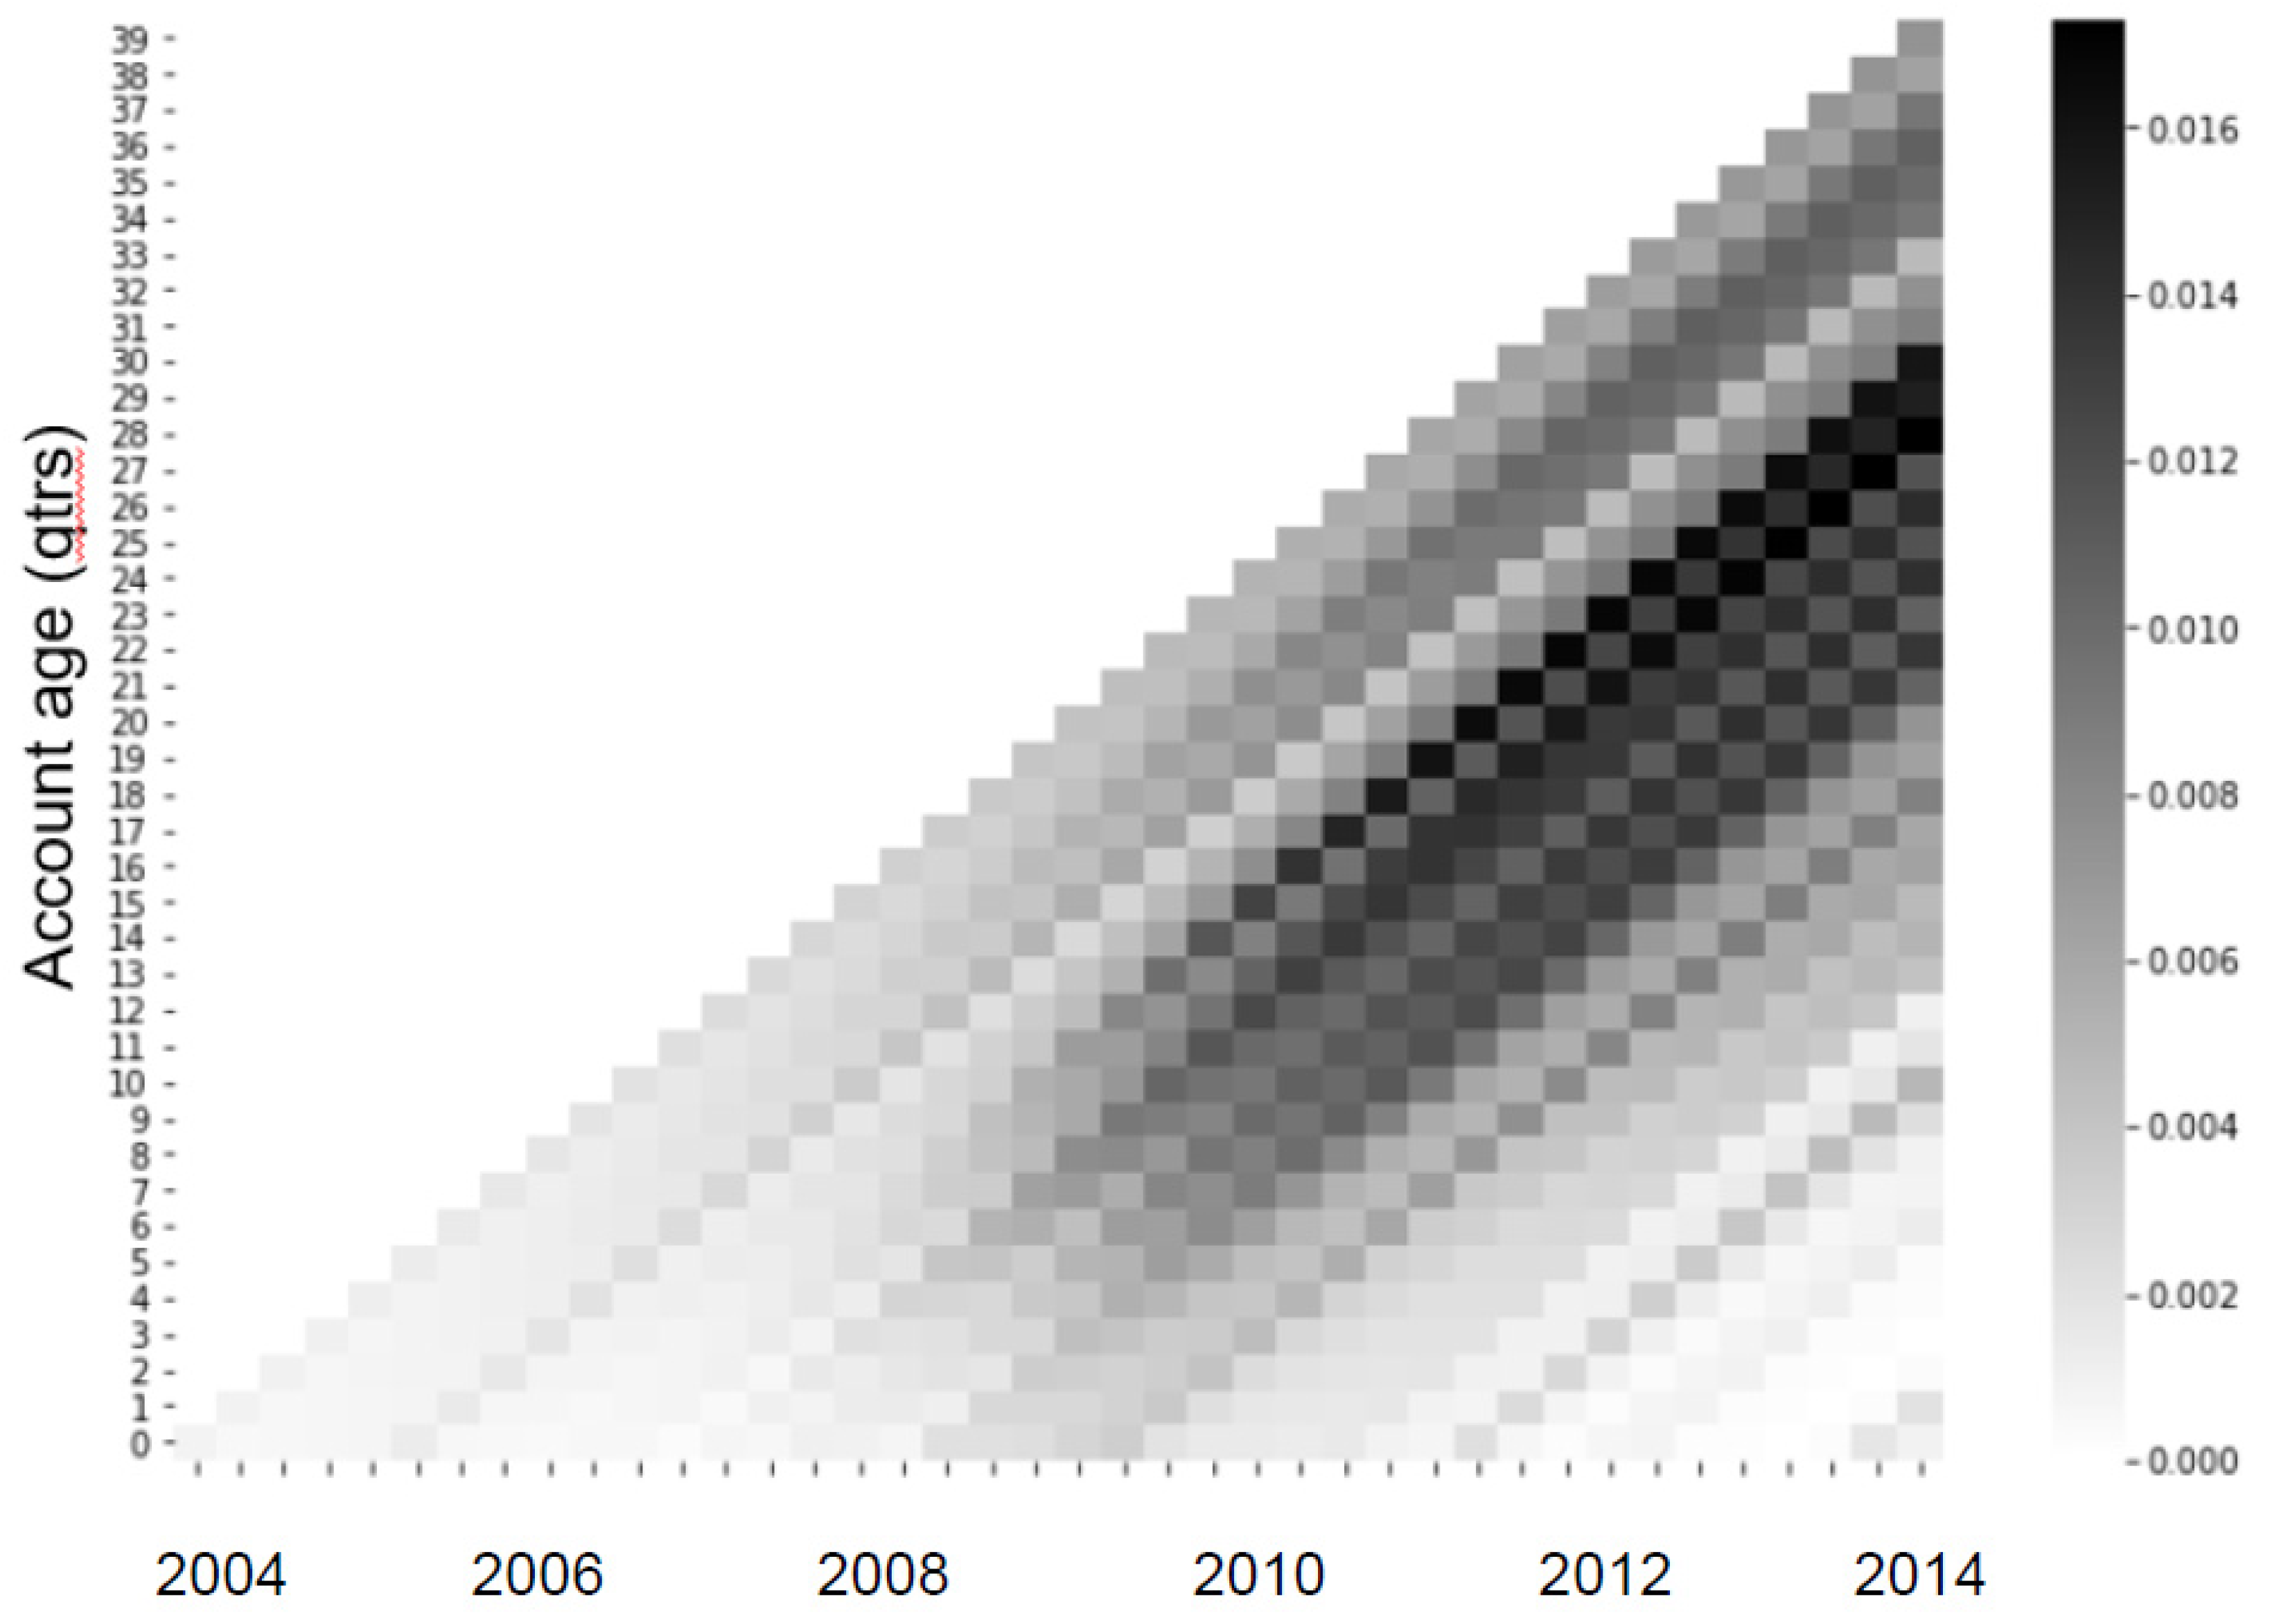
Figure 7.
Lexis graph for low risk accounts :LTV<50% and interest rate<4%.
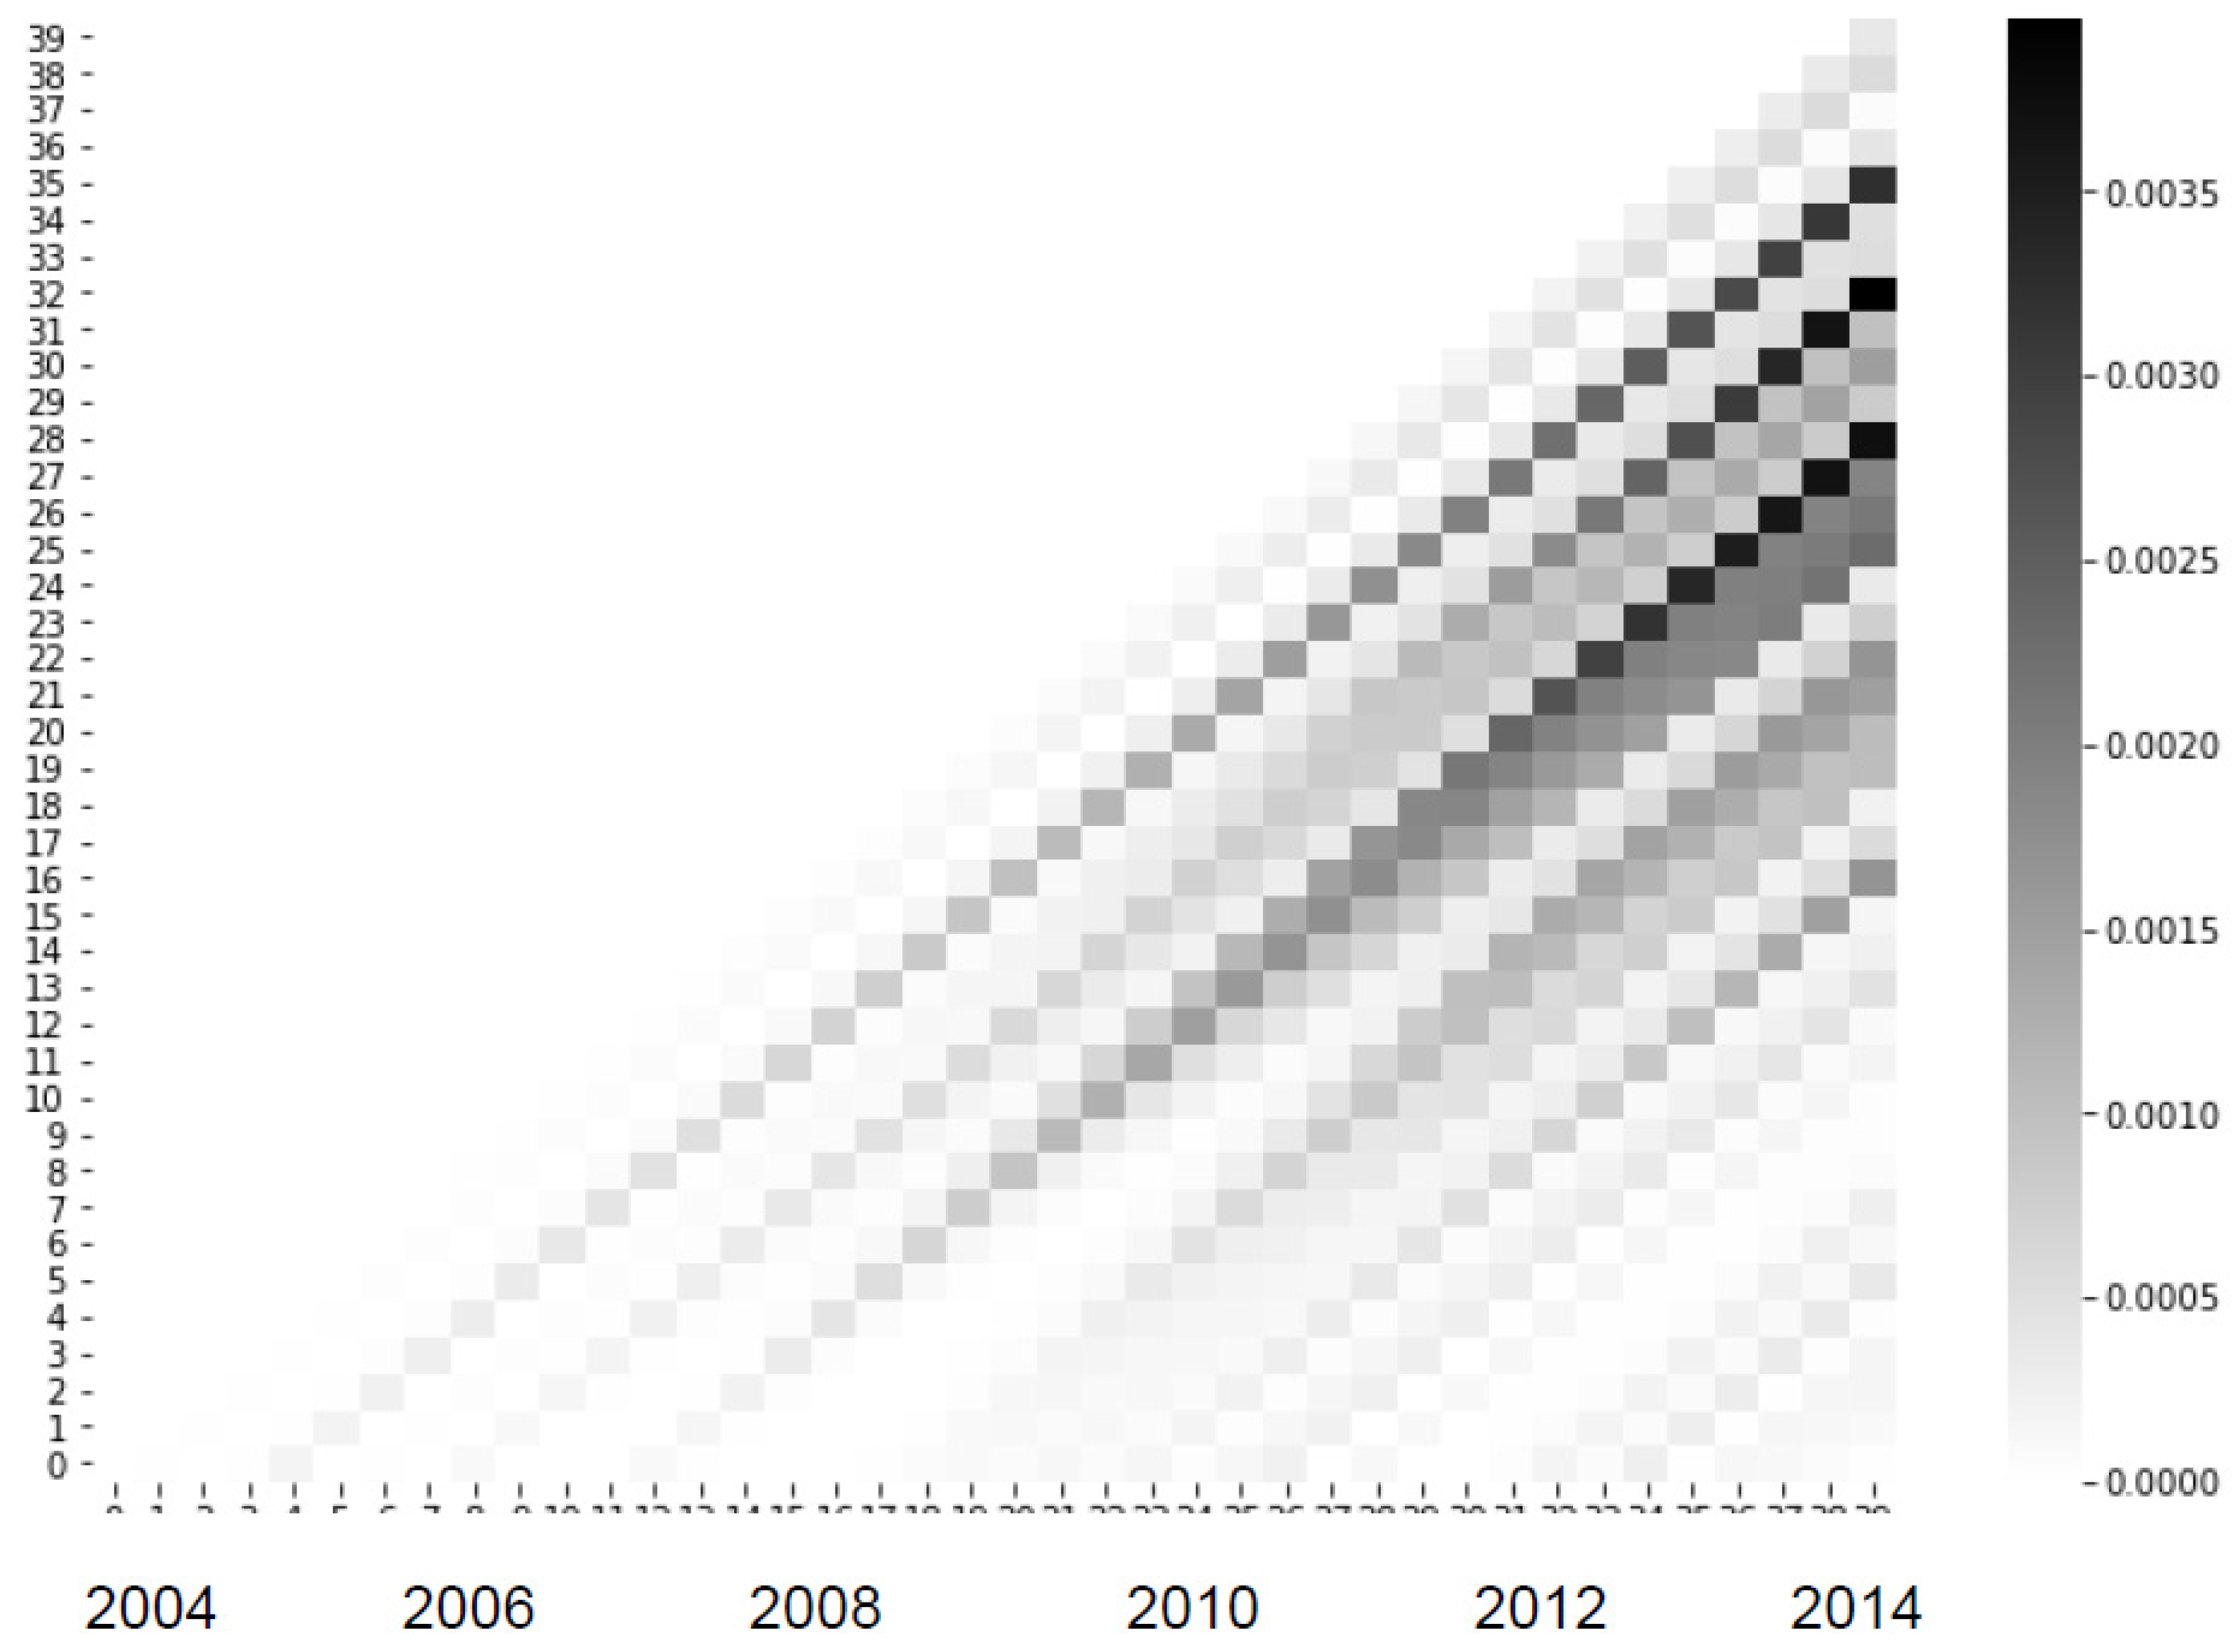
Figure 8.
Lexis graph for high risk accounts: interest rate>7.5%.
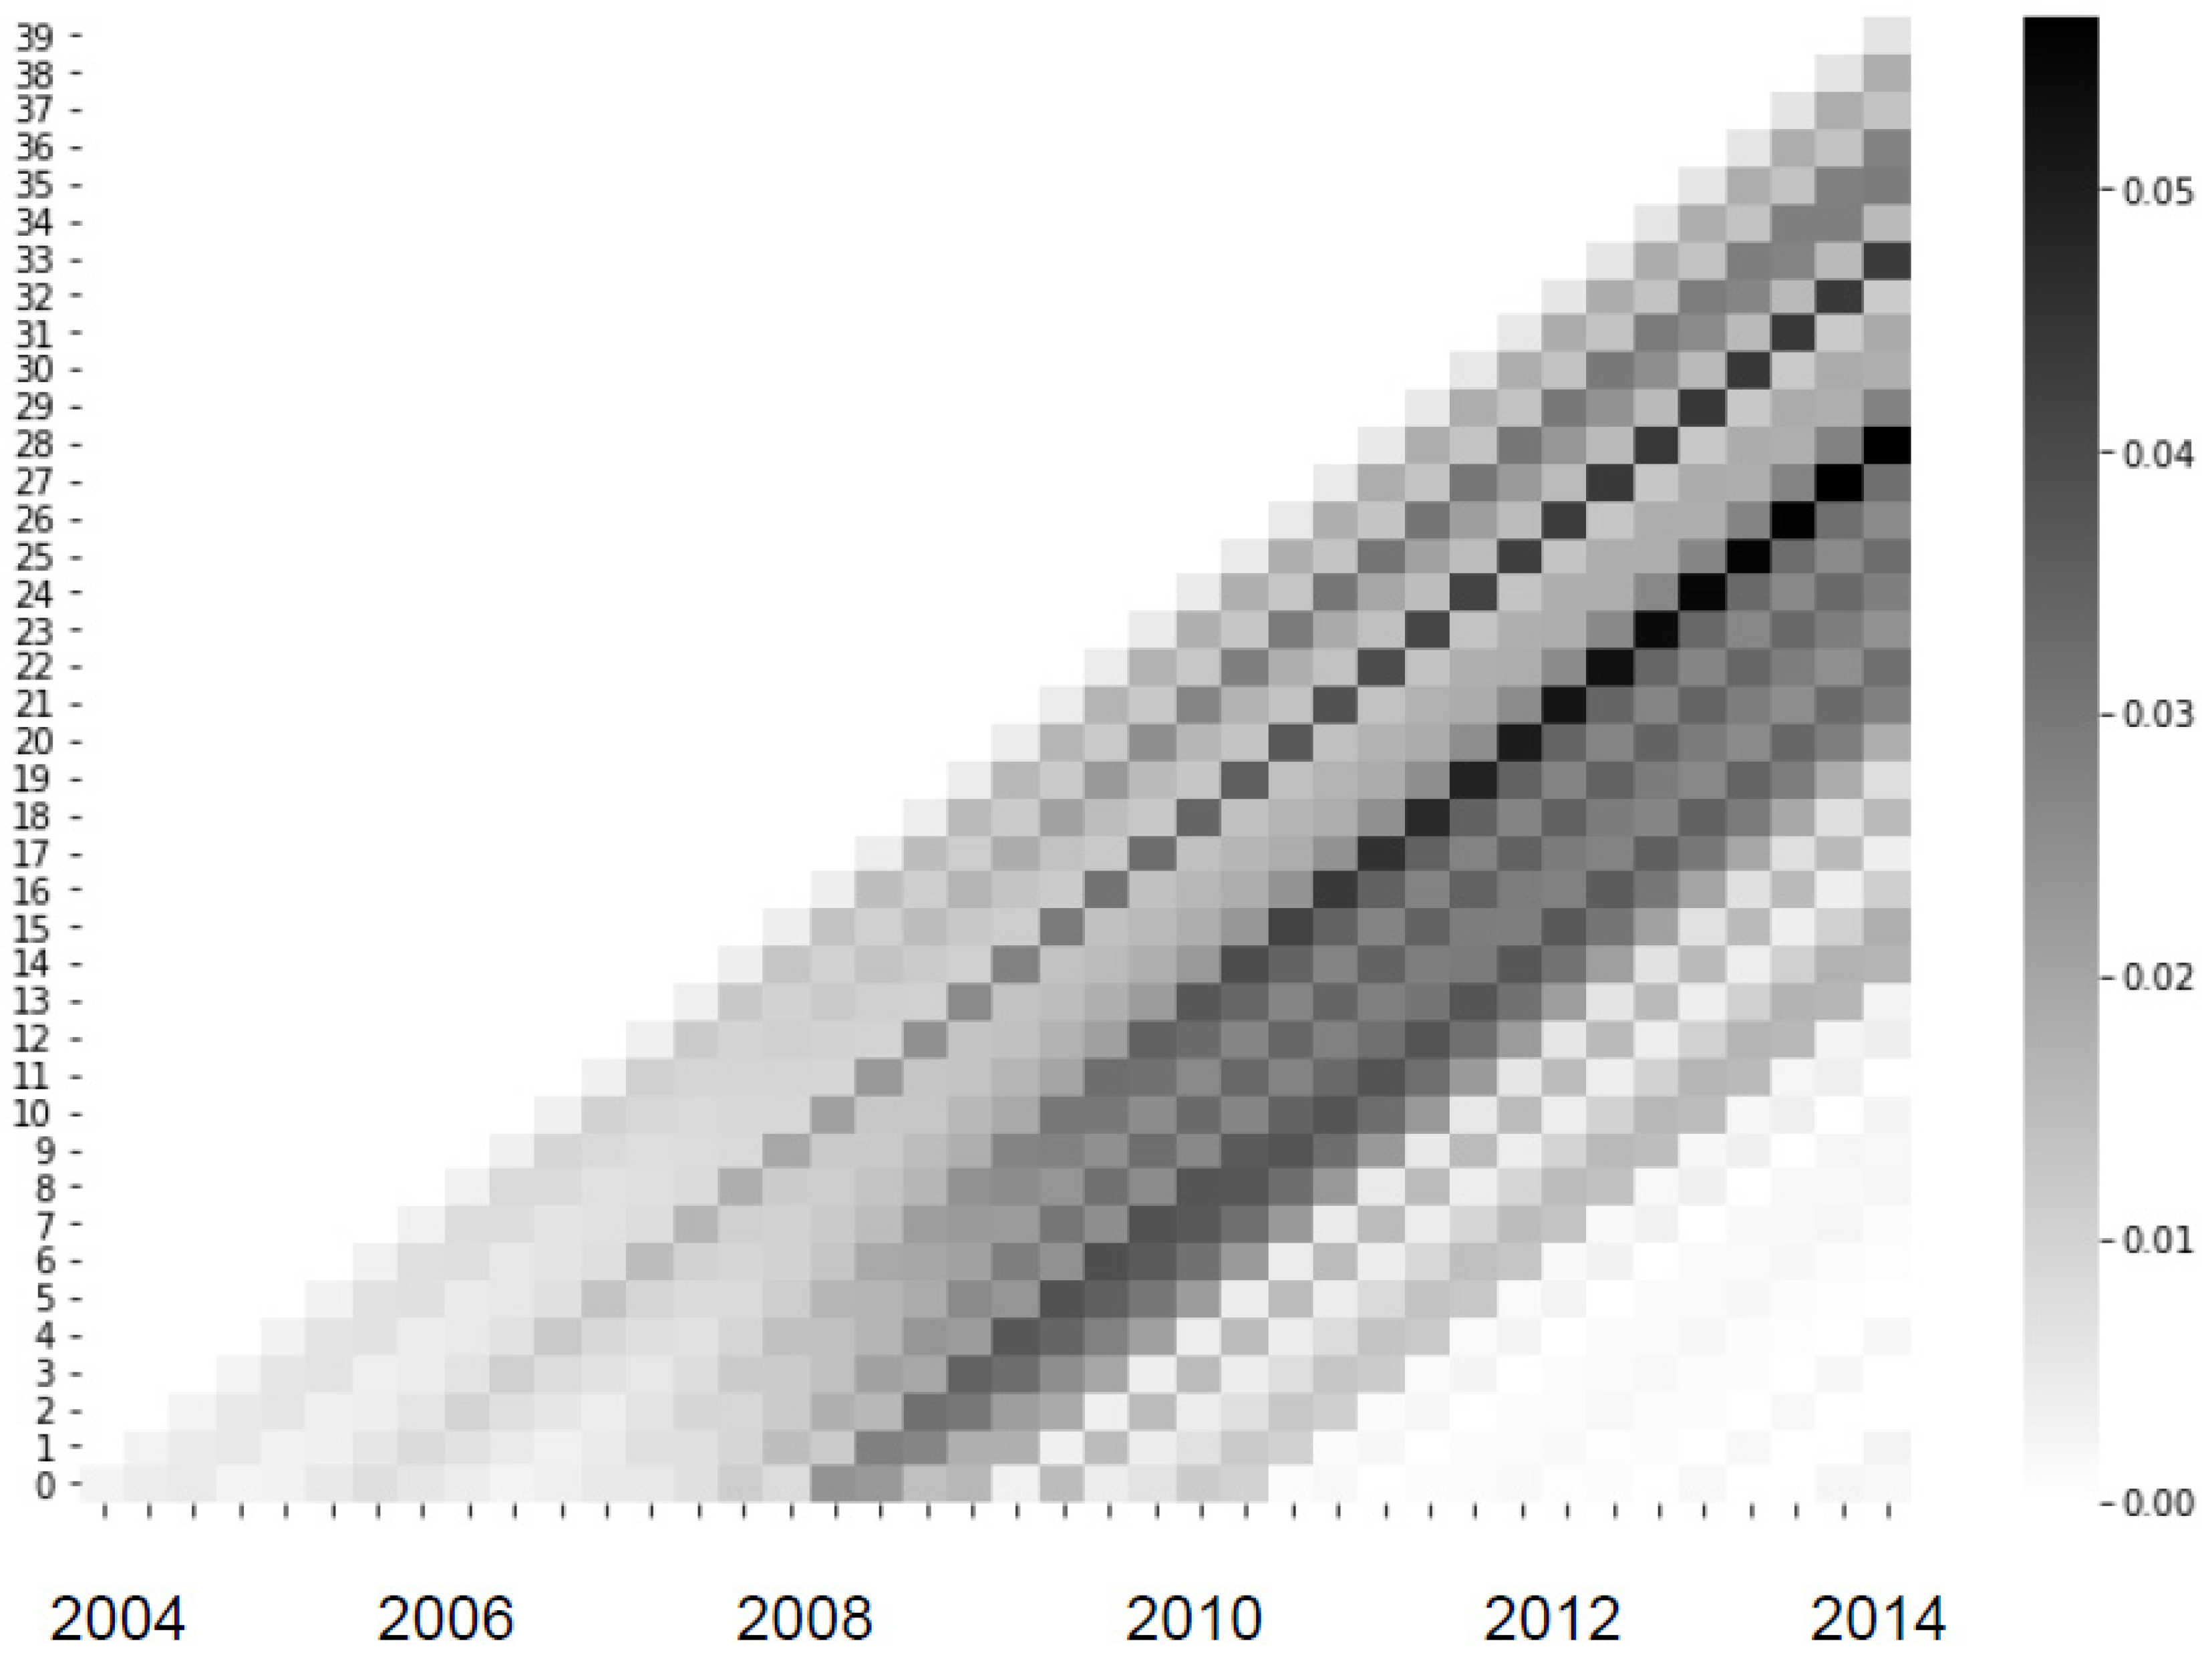
Figure 9.
APC decomposition for general case.

Figure 10.
APC decomposition for low LTV, low interest rate segment.
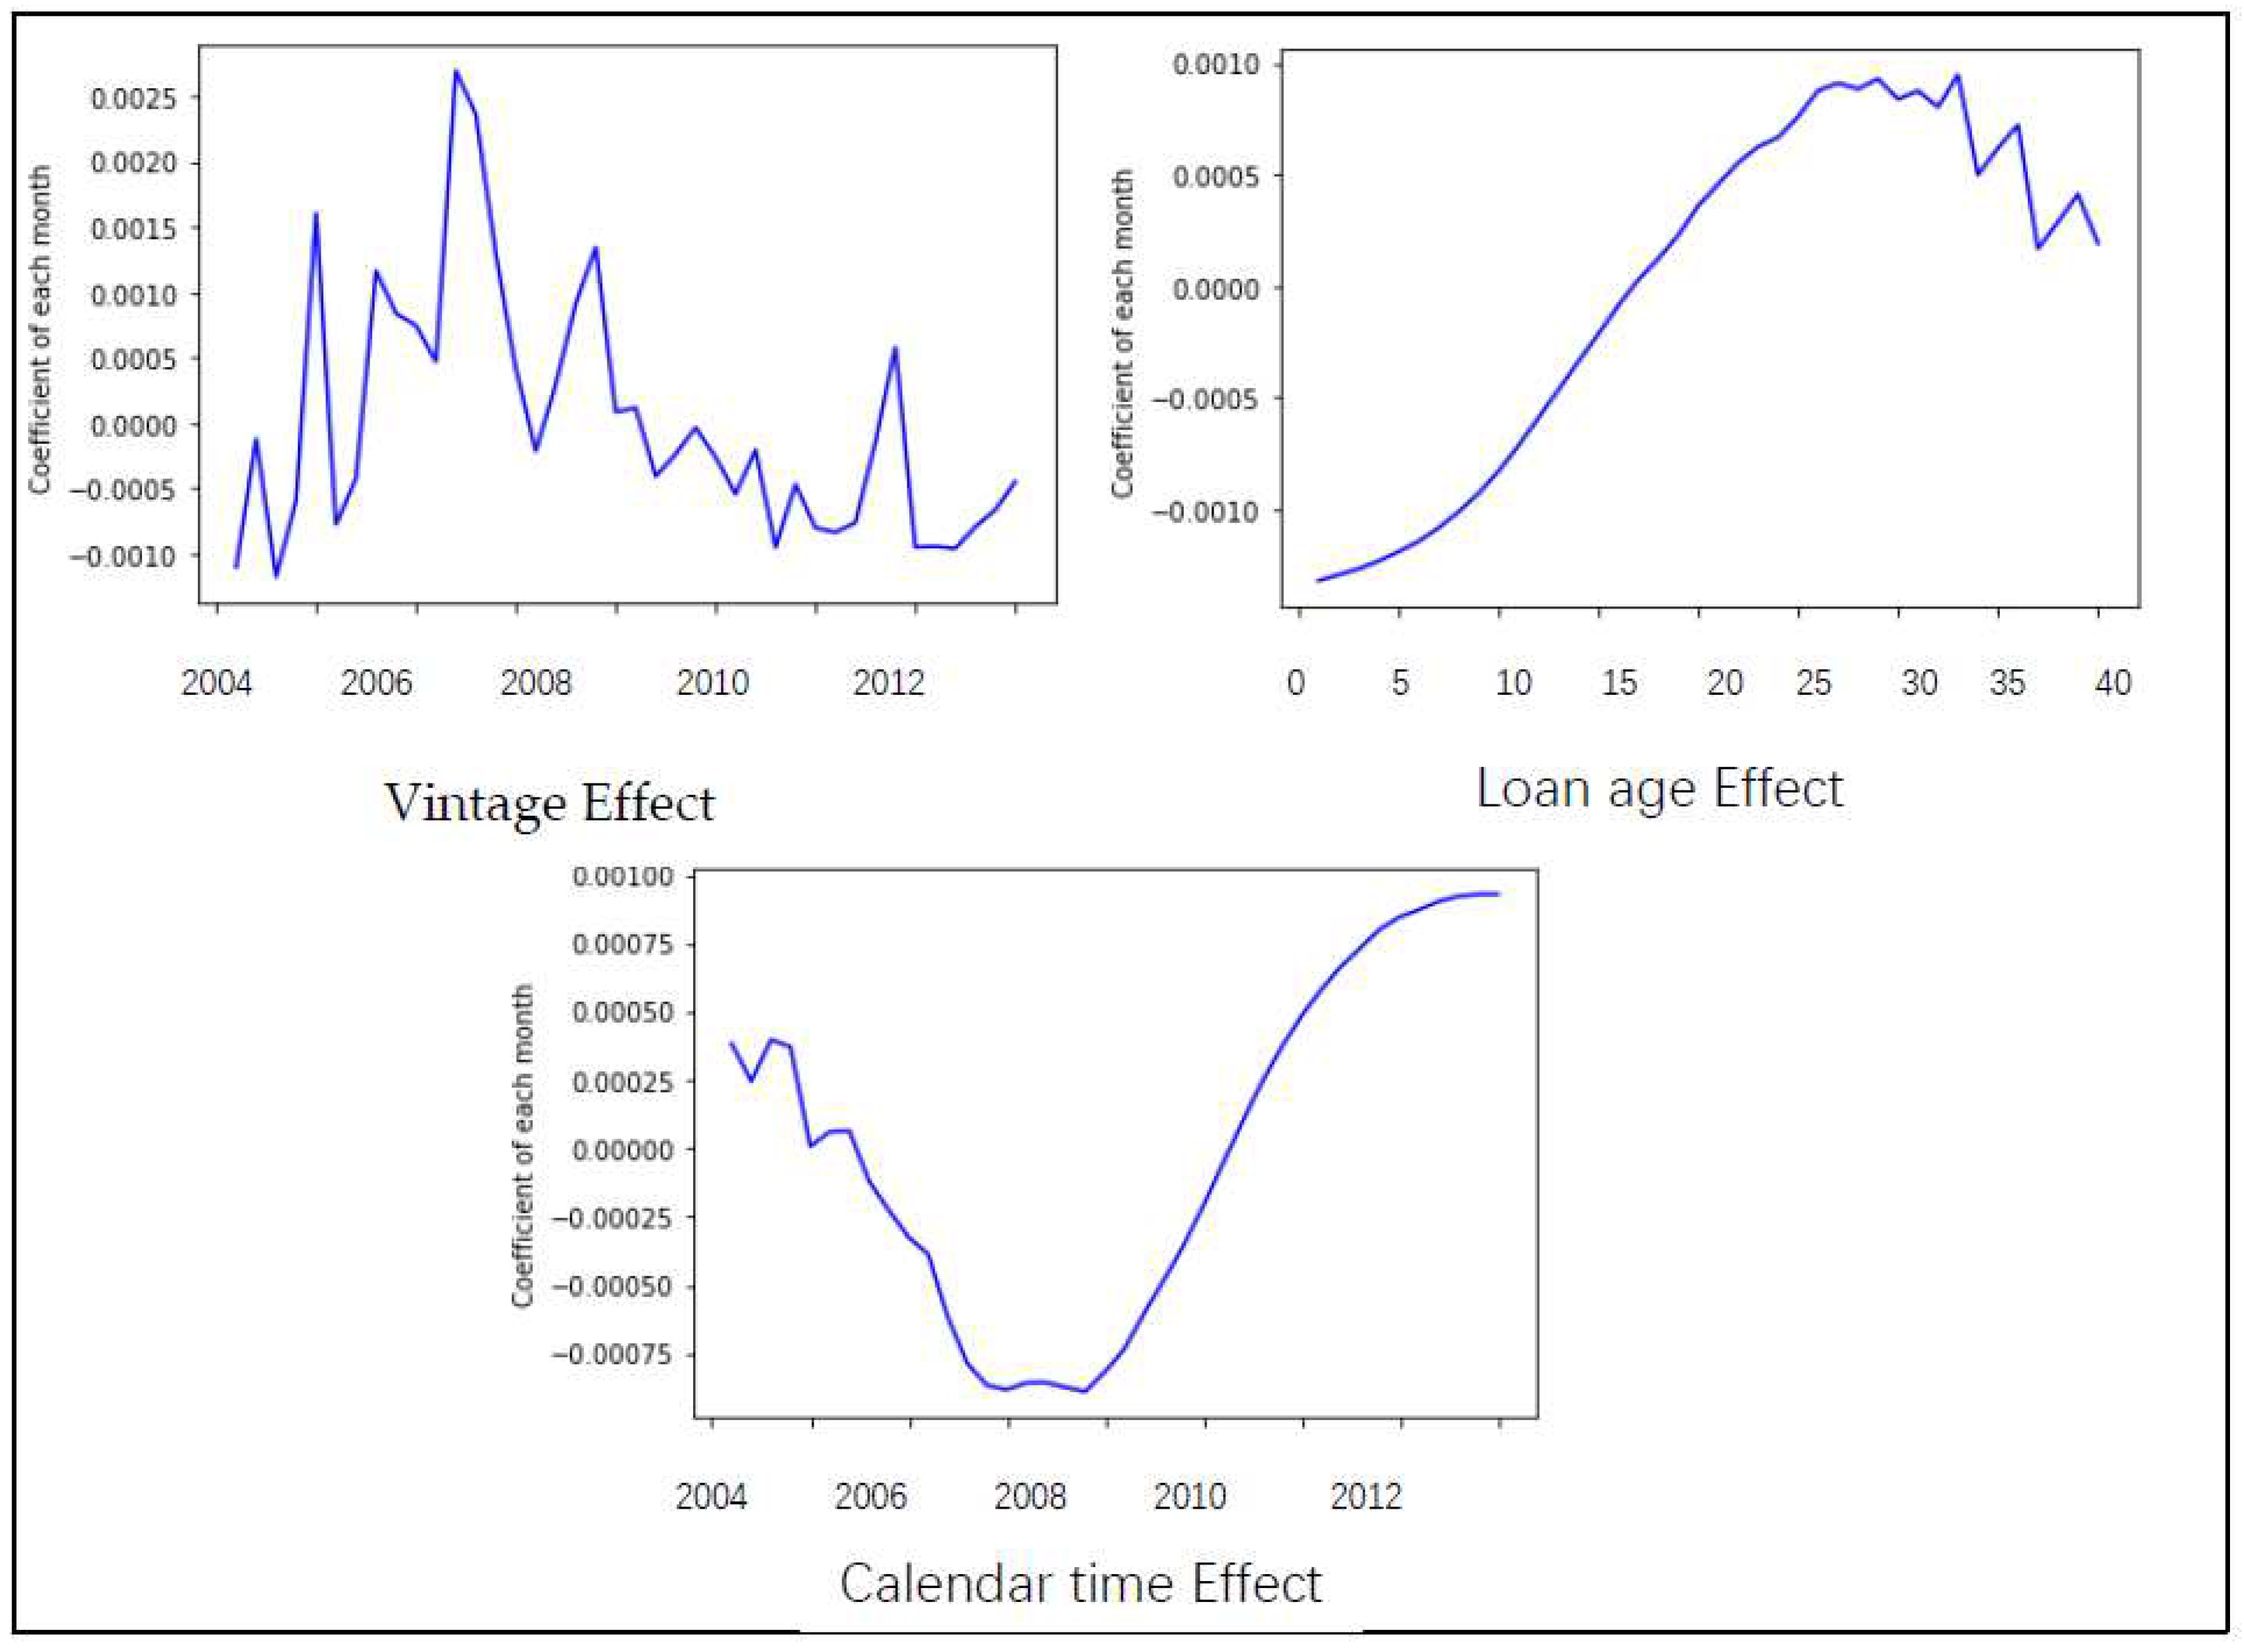
Figure 11.
APeeeeC decomposition for high interest rates segment.
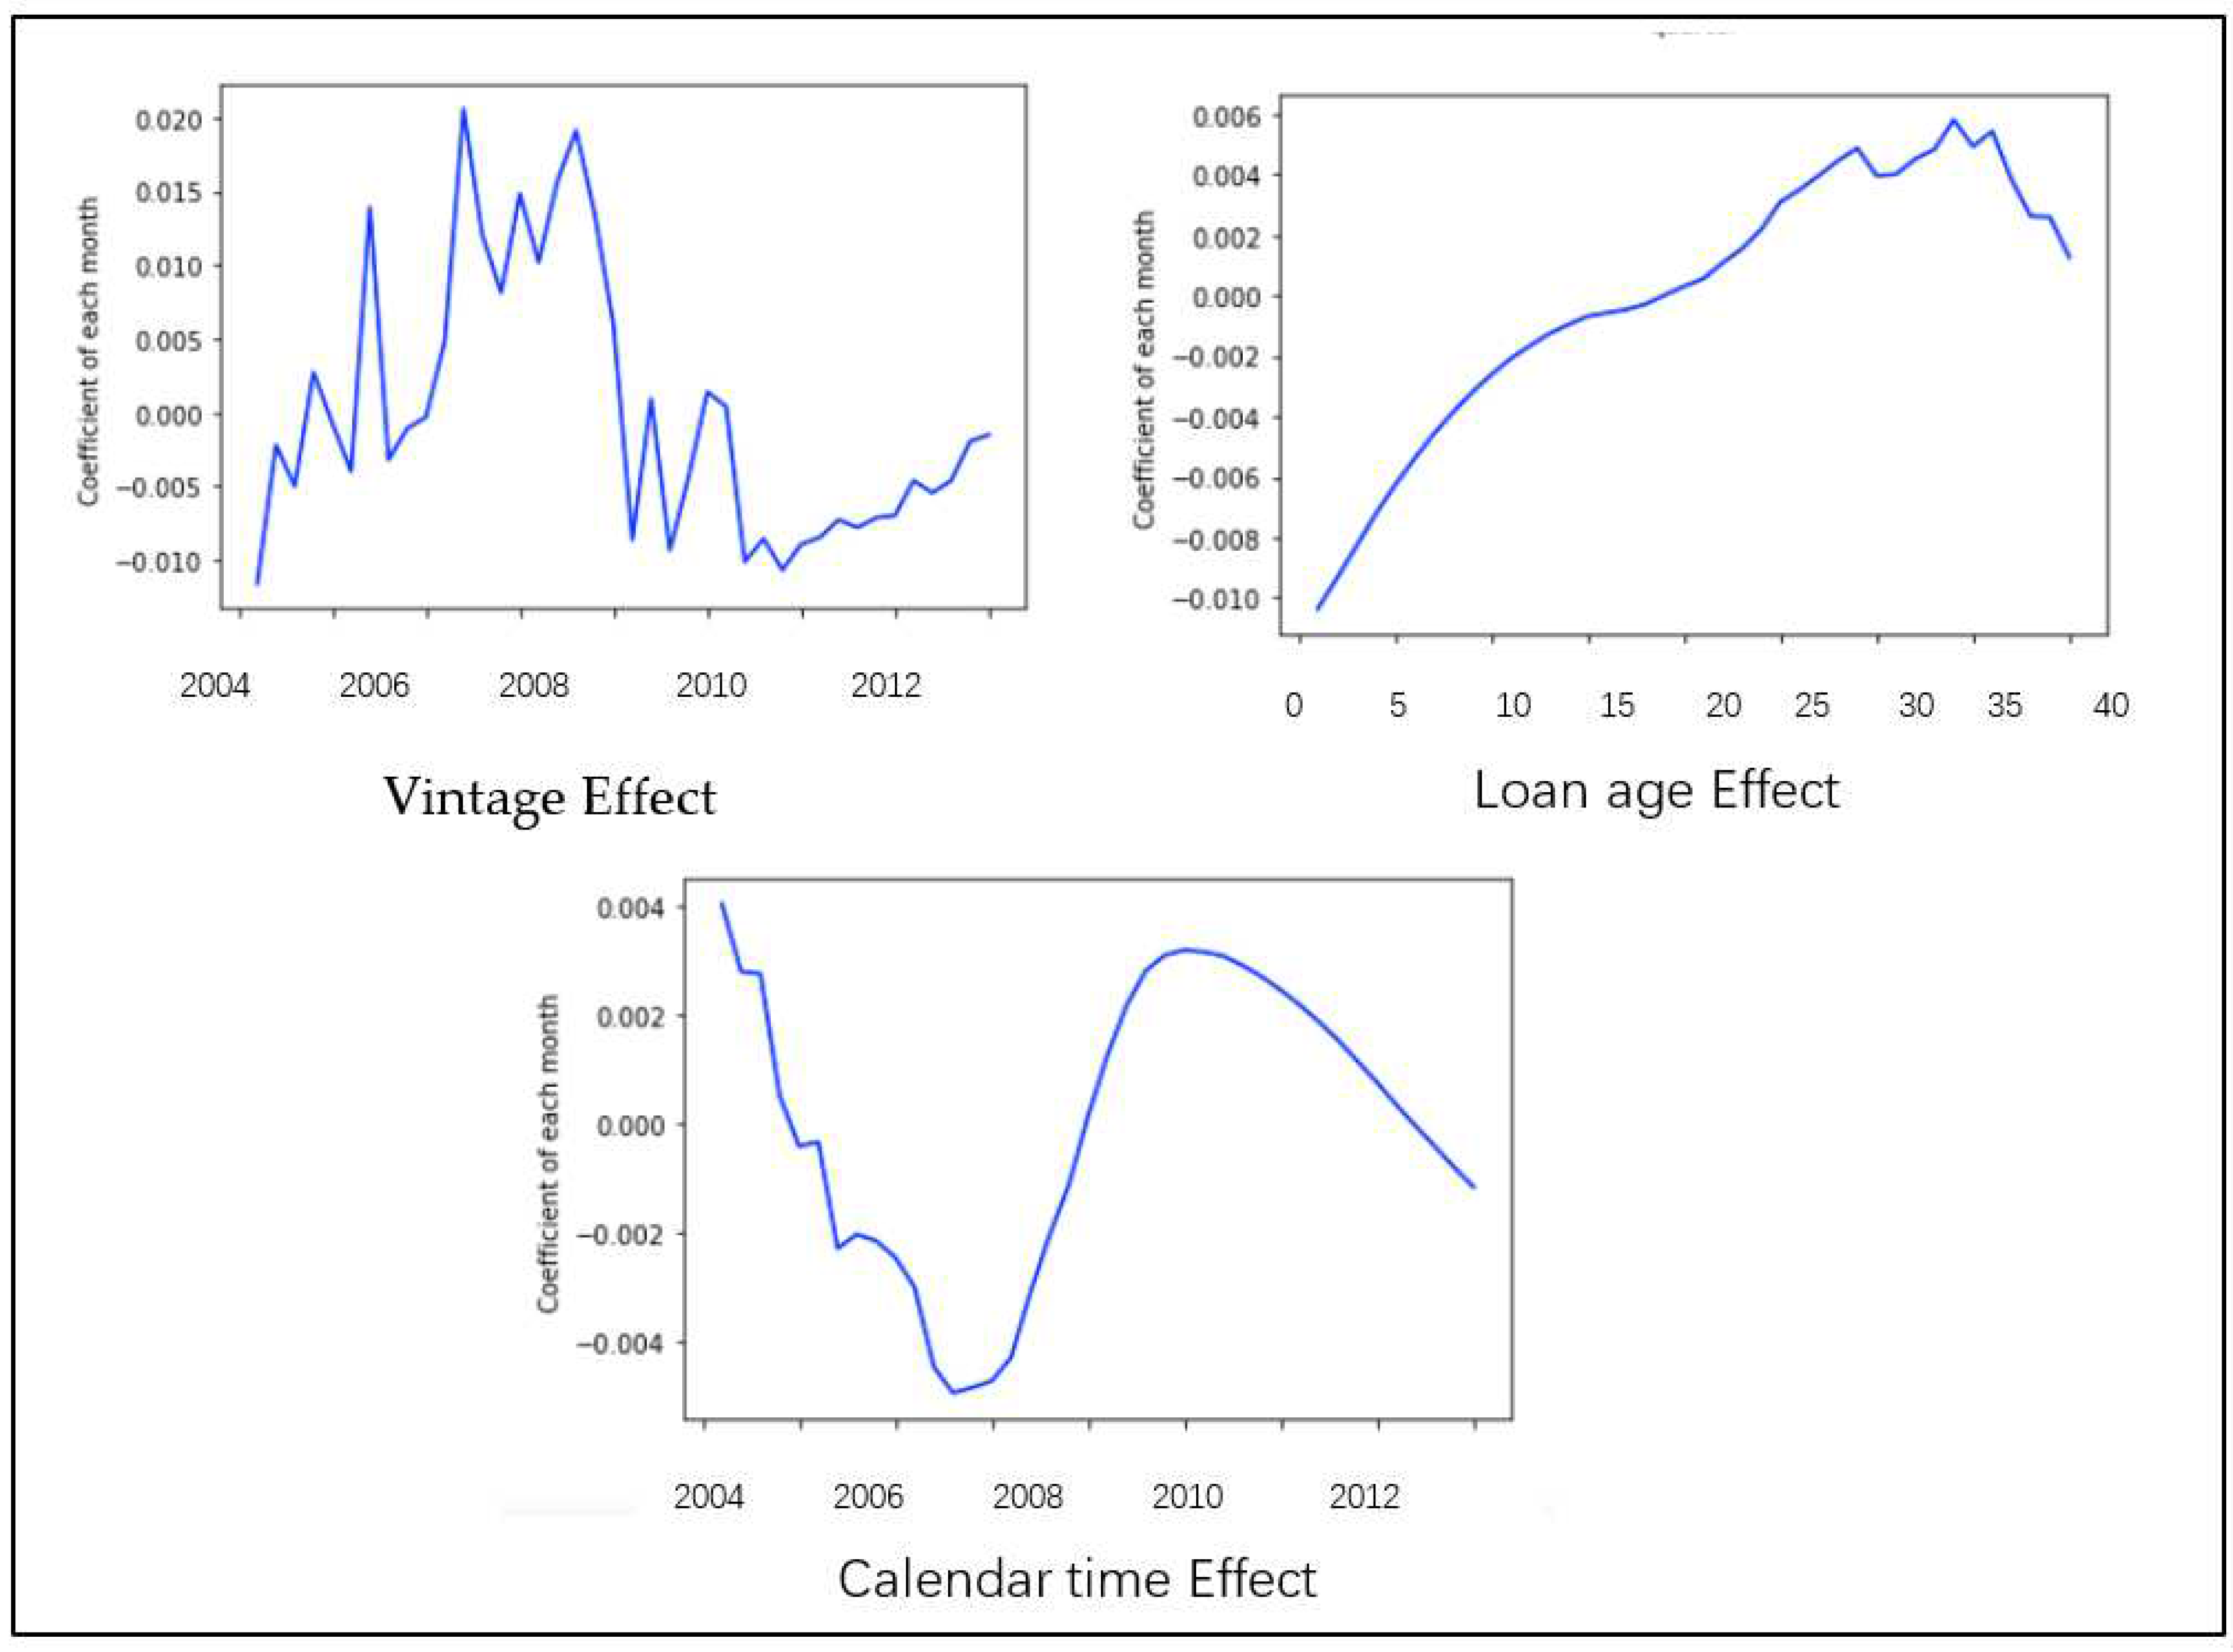
Figure 12.
Macroeconomic lag fit (quarters).
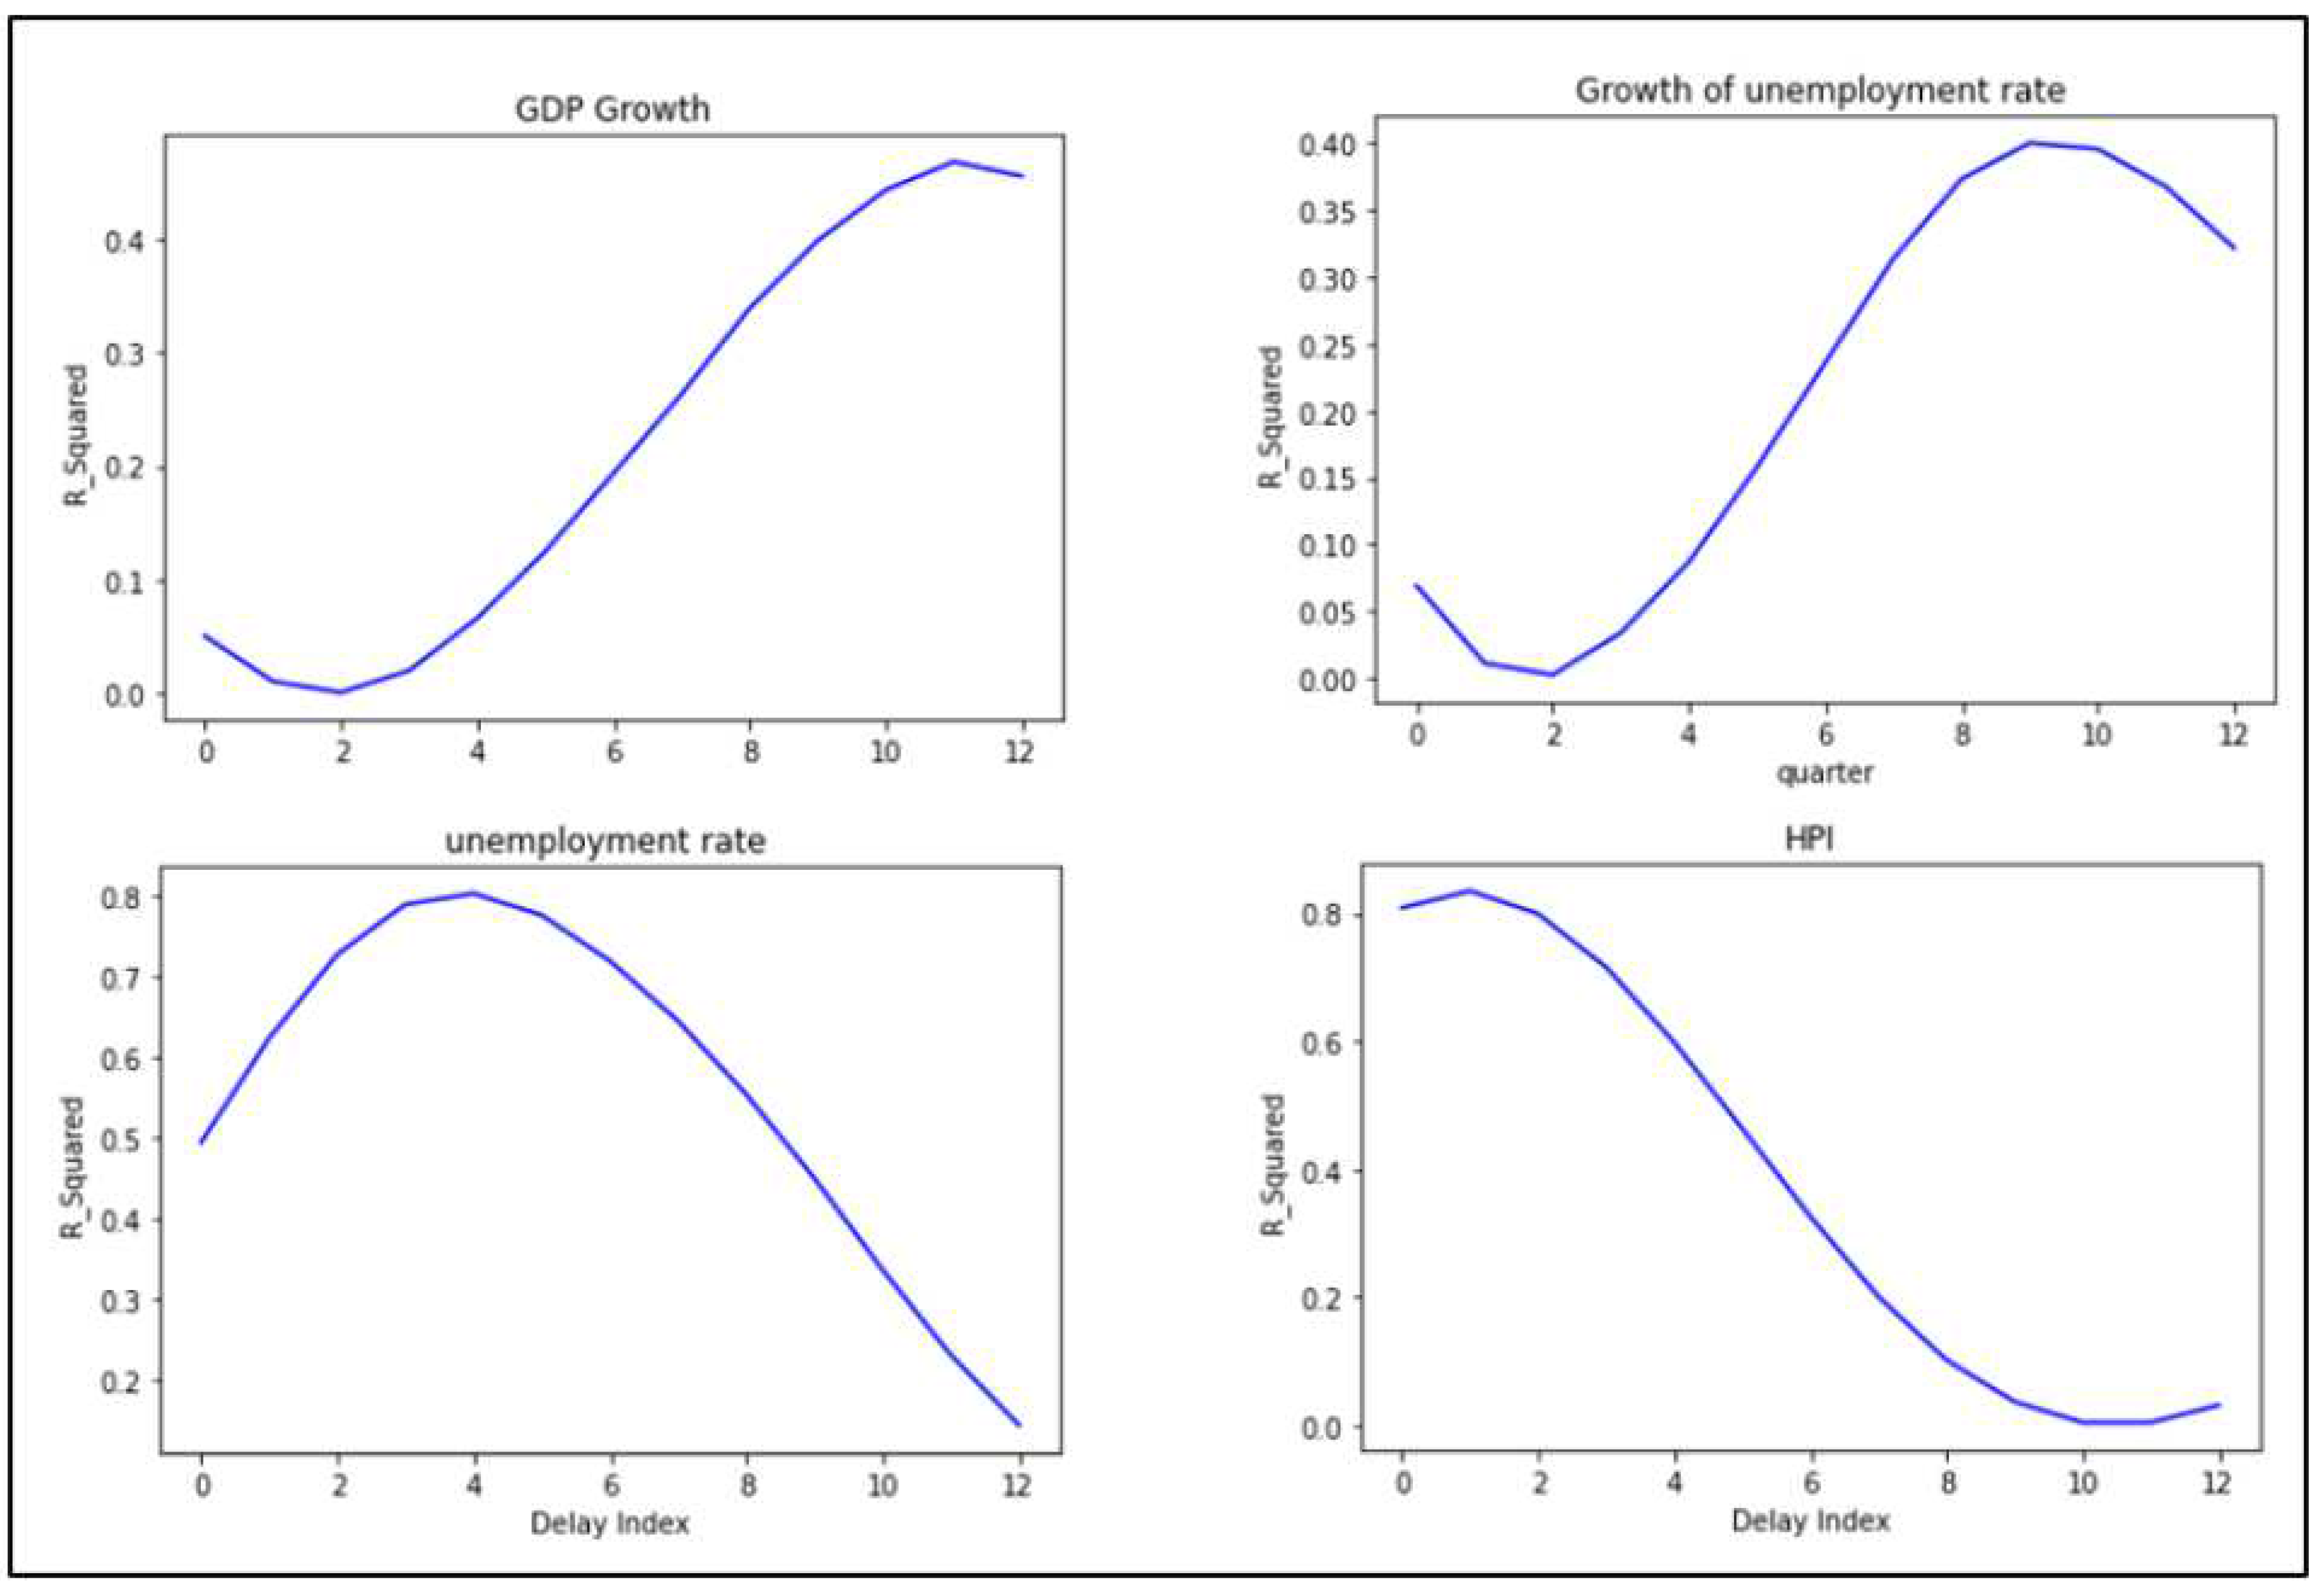
Figure 13.
Macroeconomic fitting for the general customer.
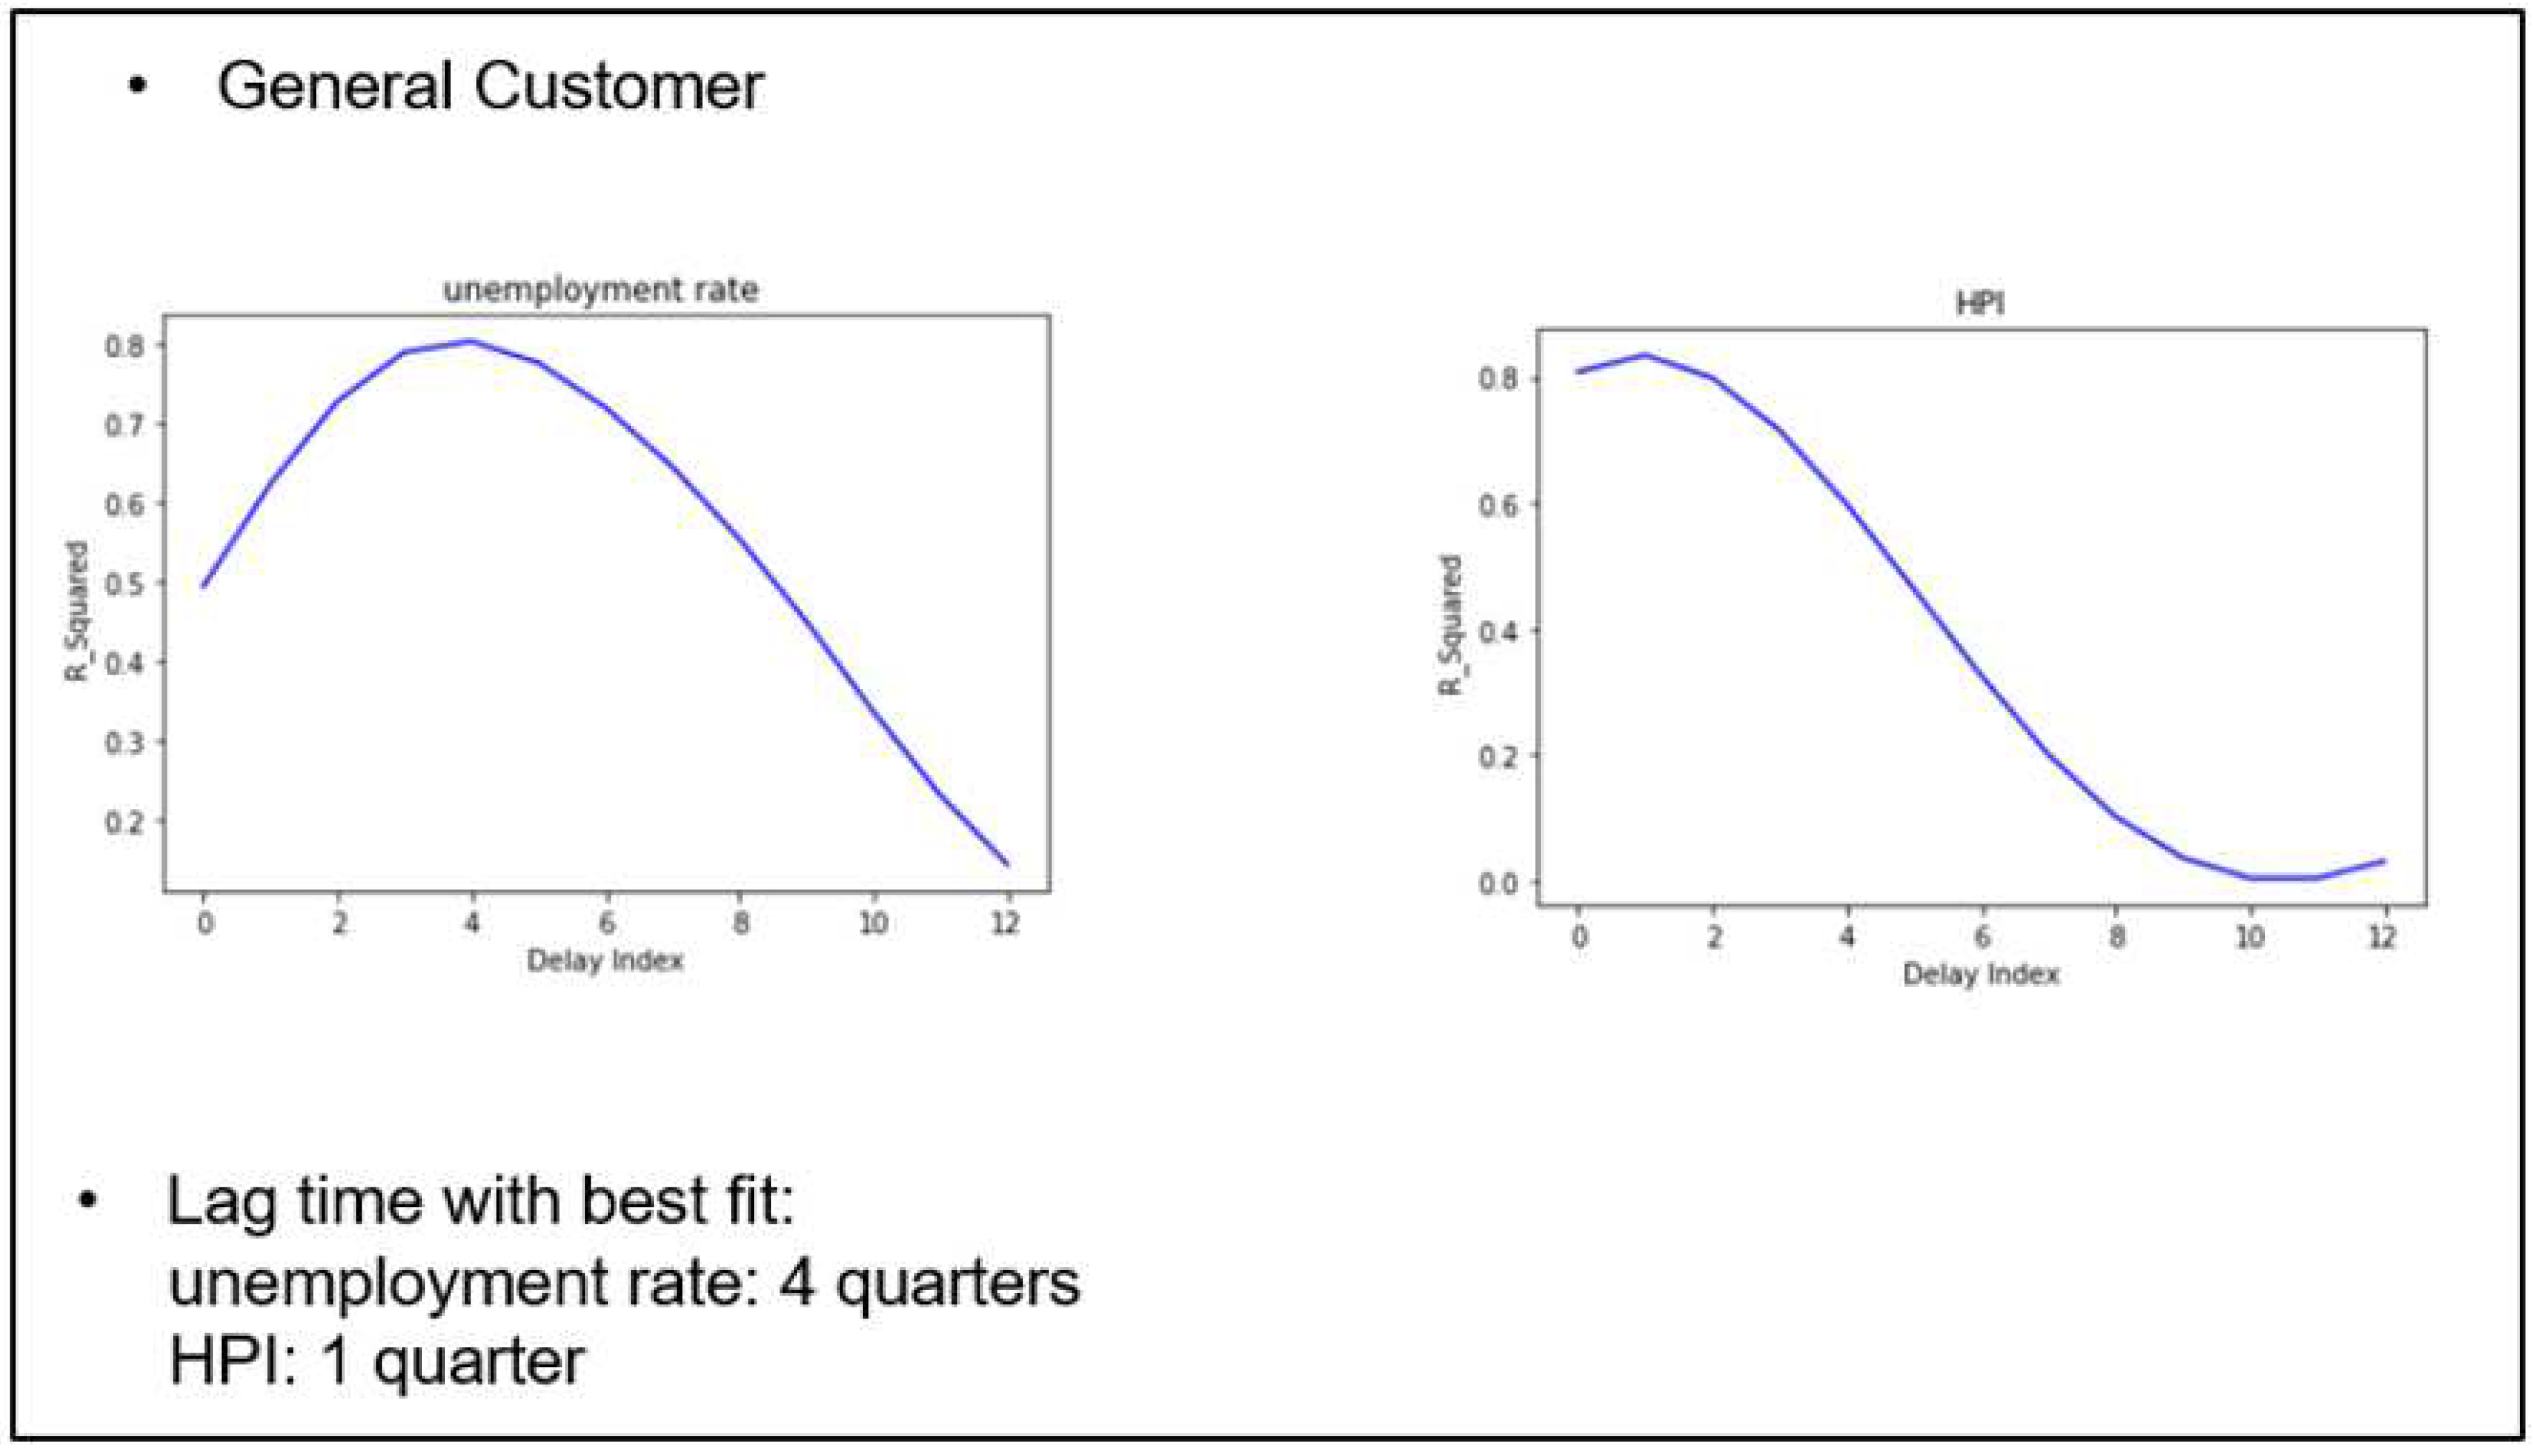
Figure 14.
Macroeconomic fitting for high risk customer.
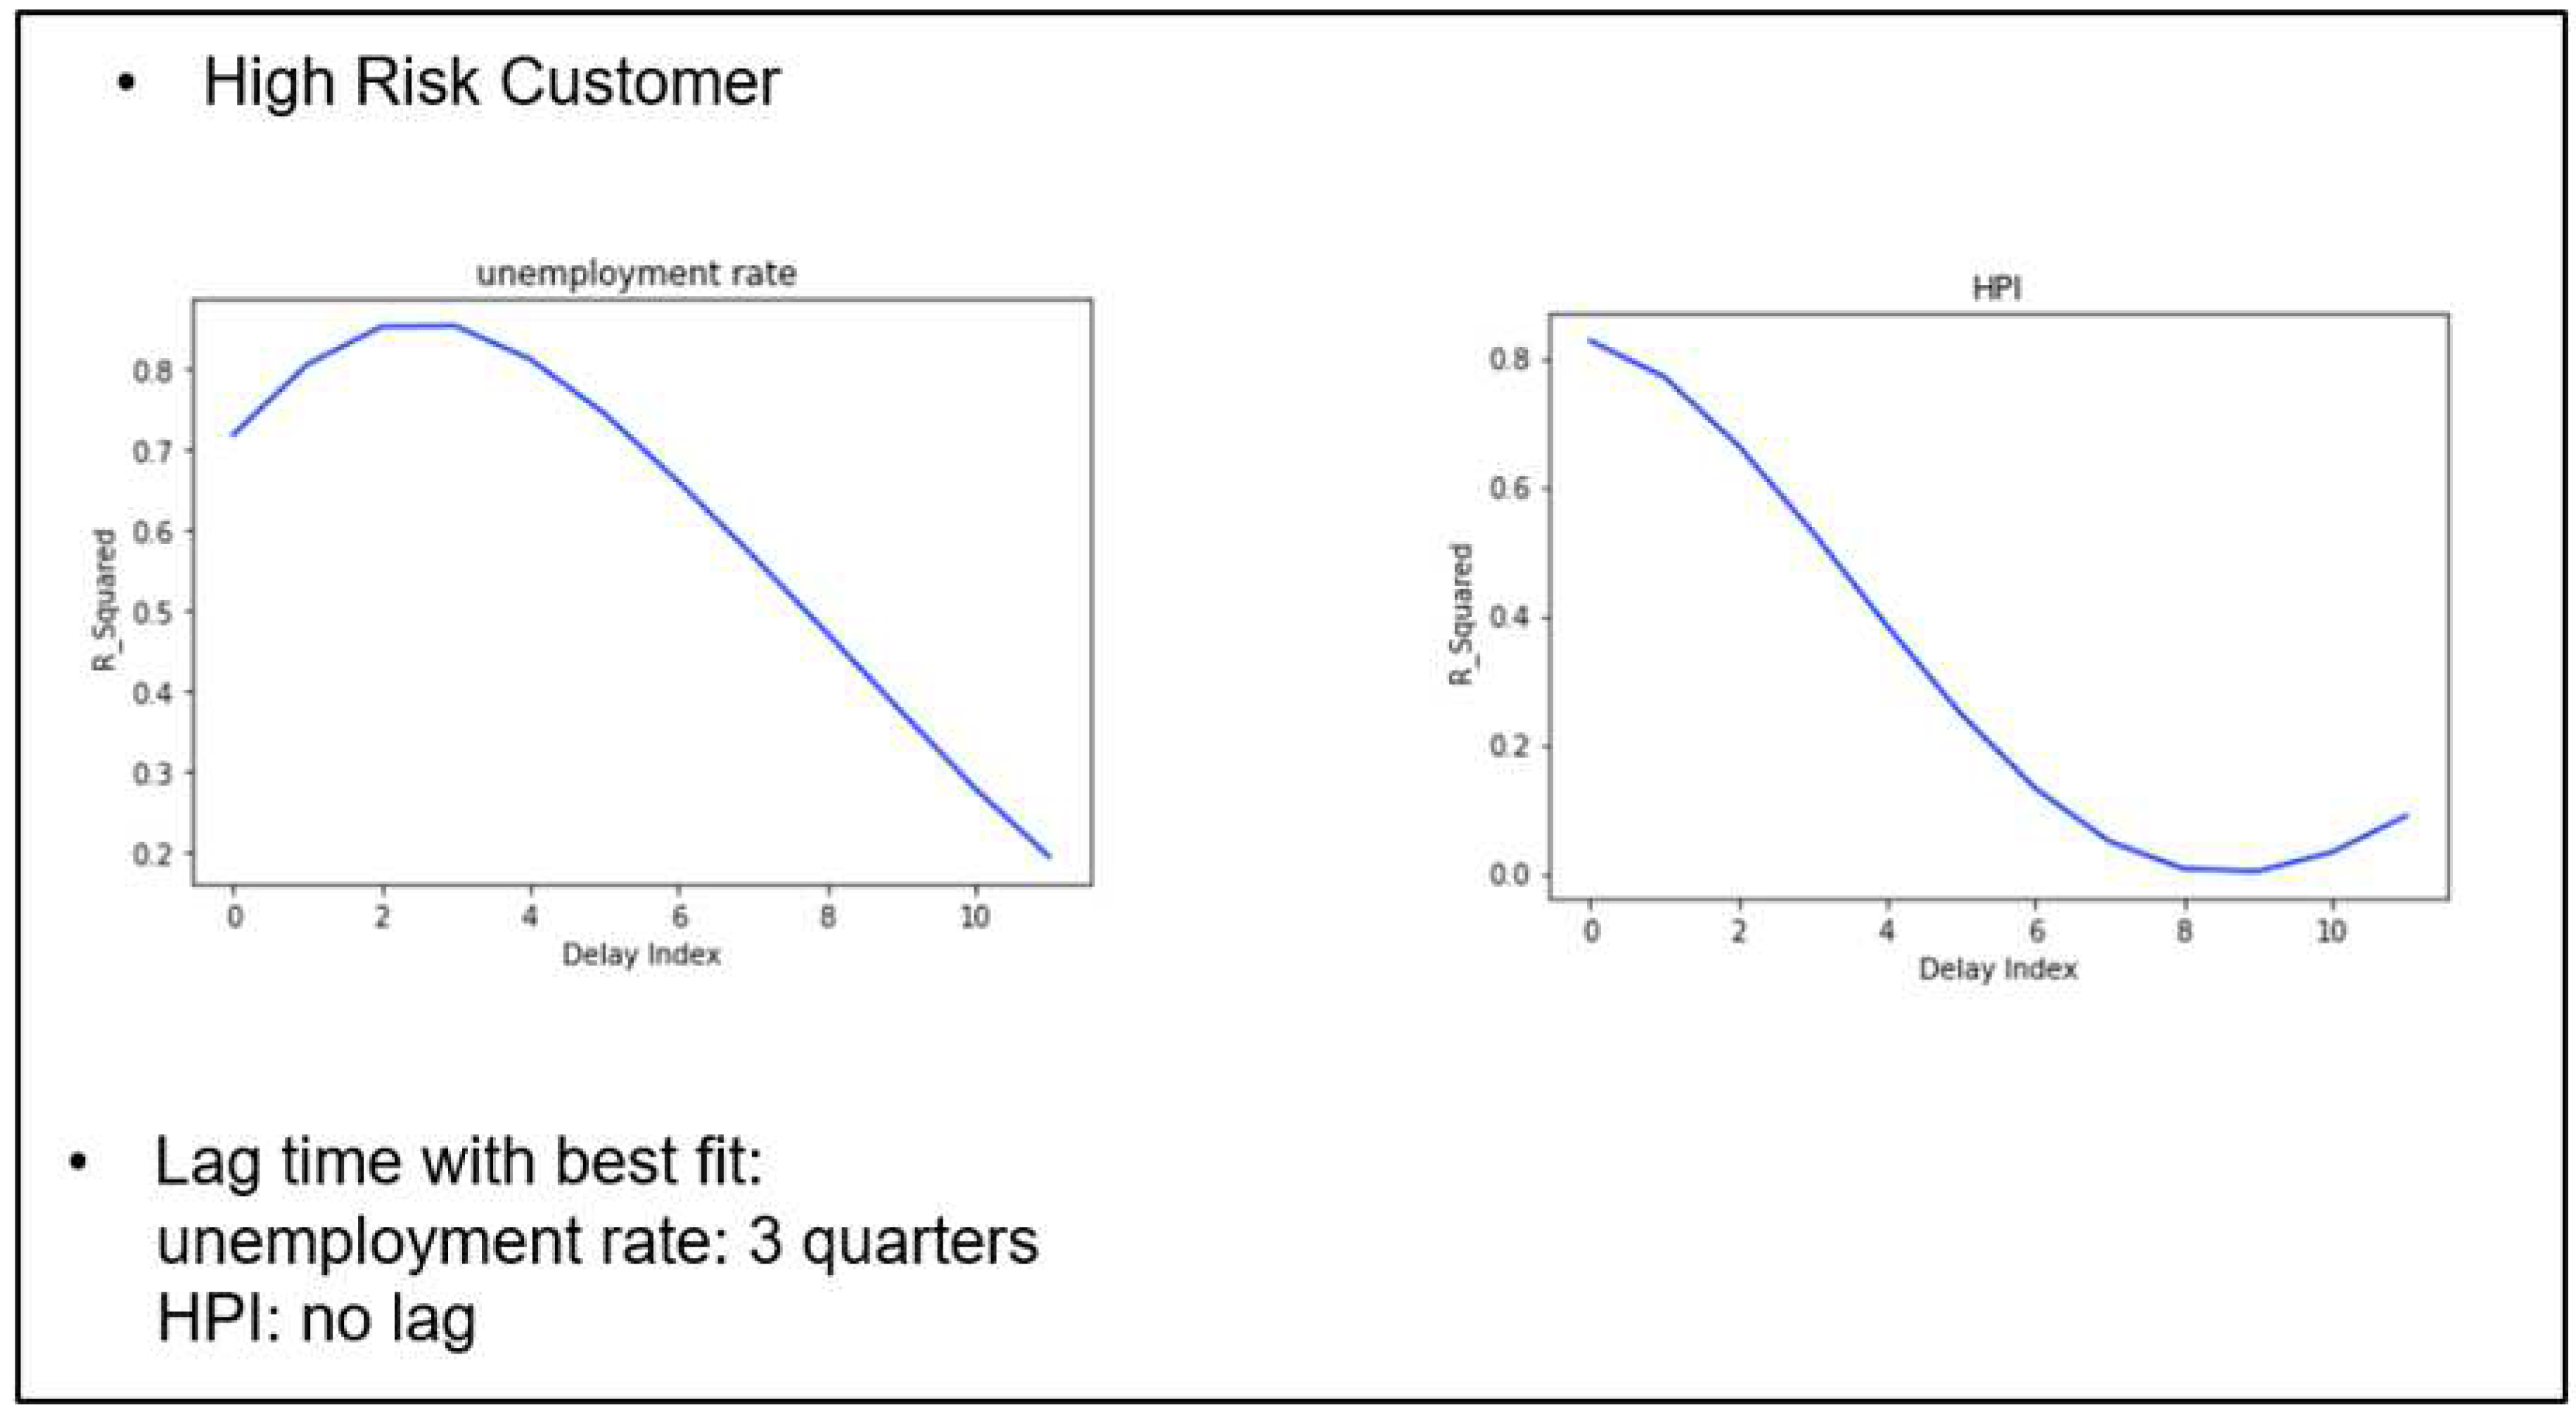
Figure 15.
Macroeconomic fitting for low risk customer.
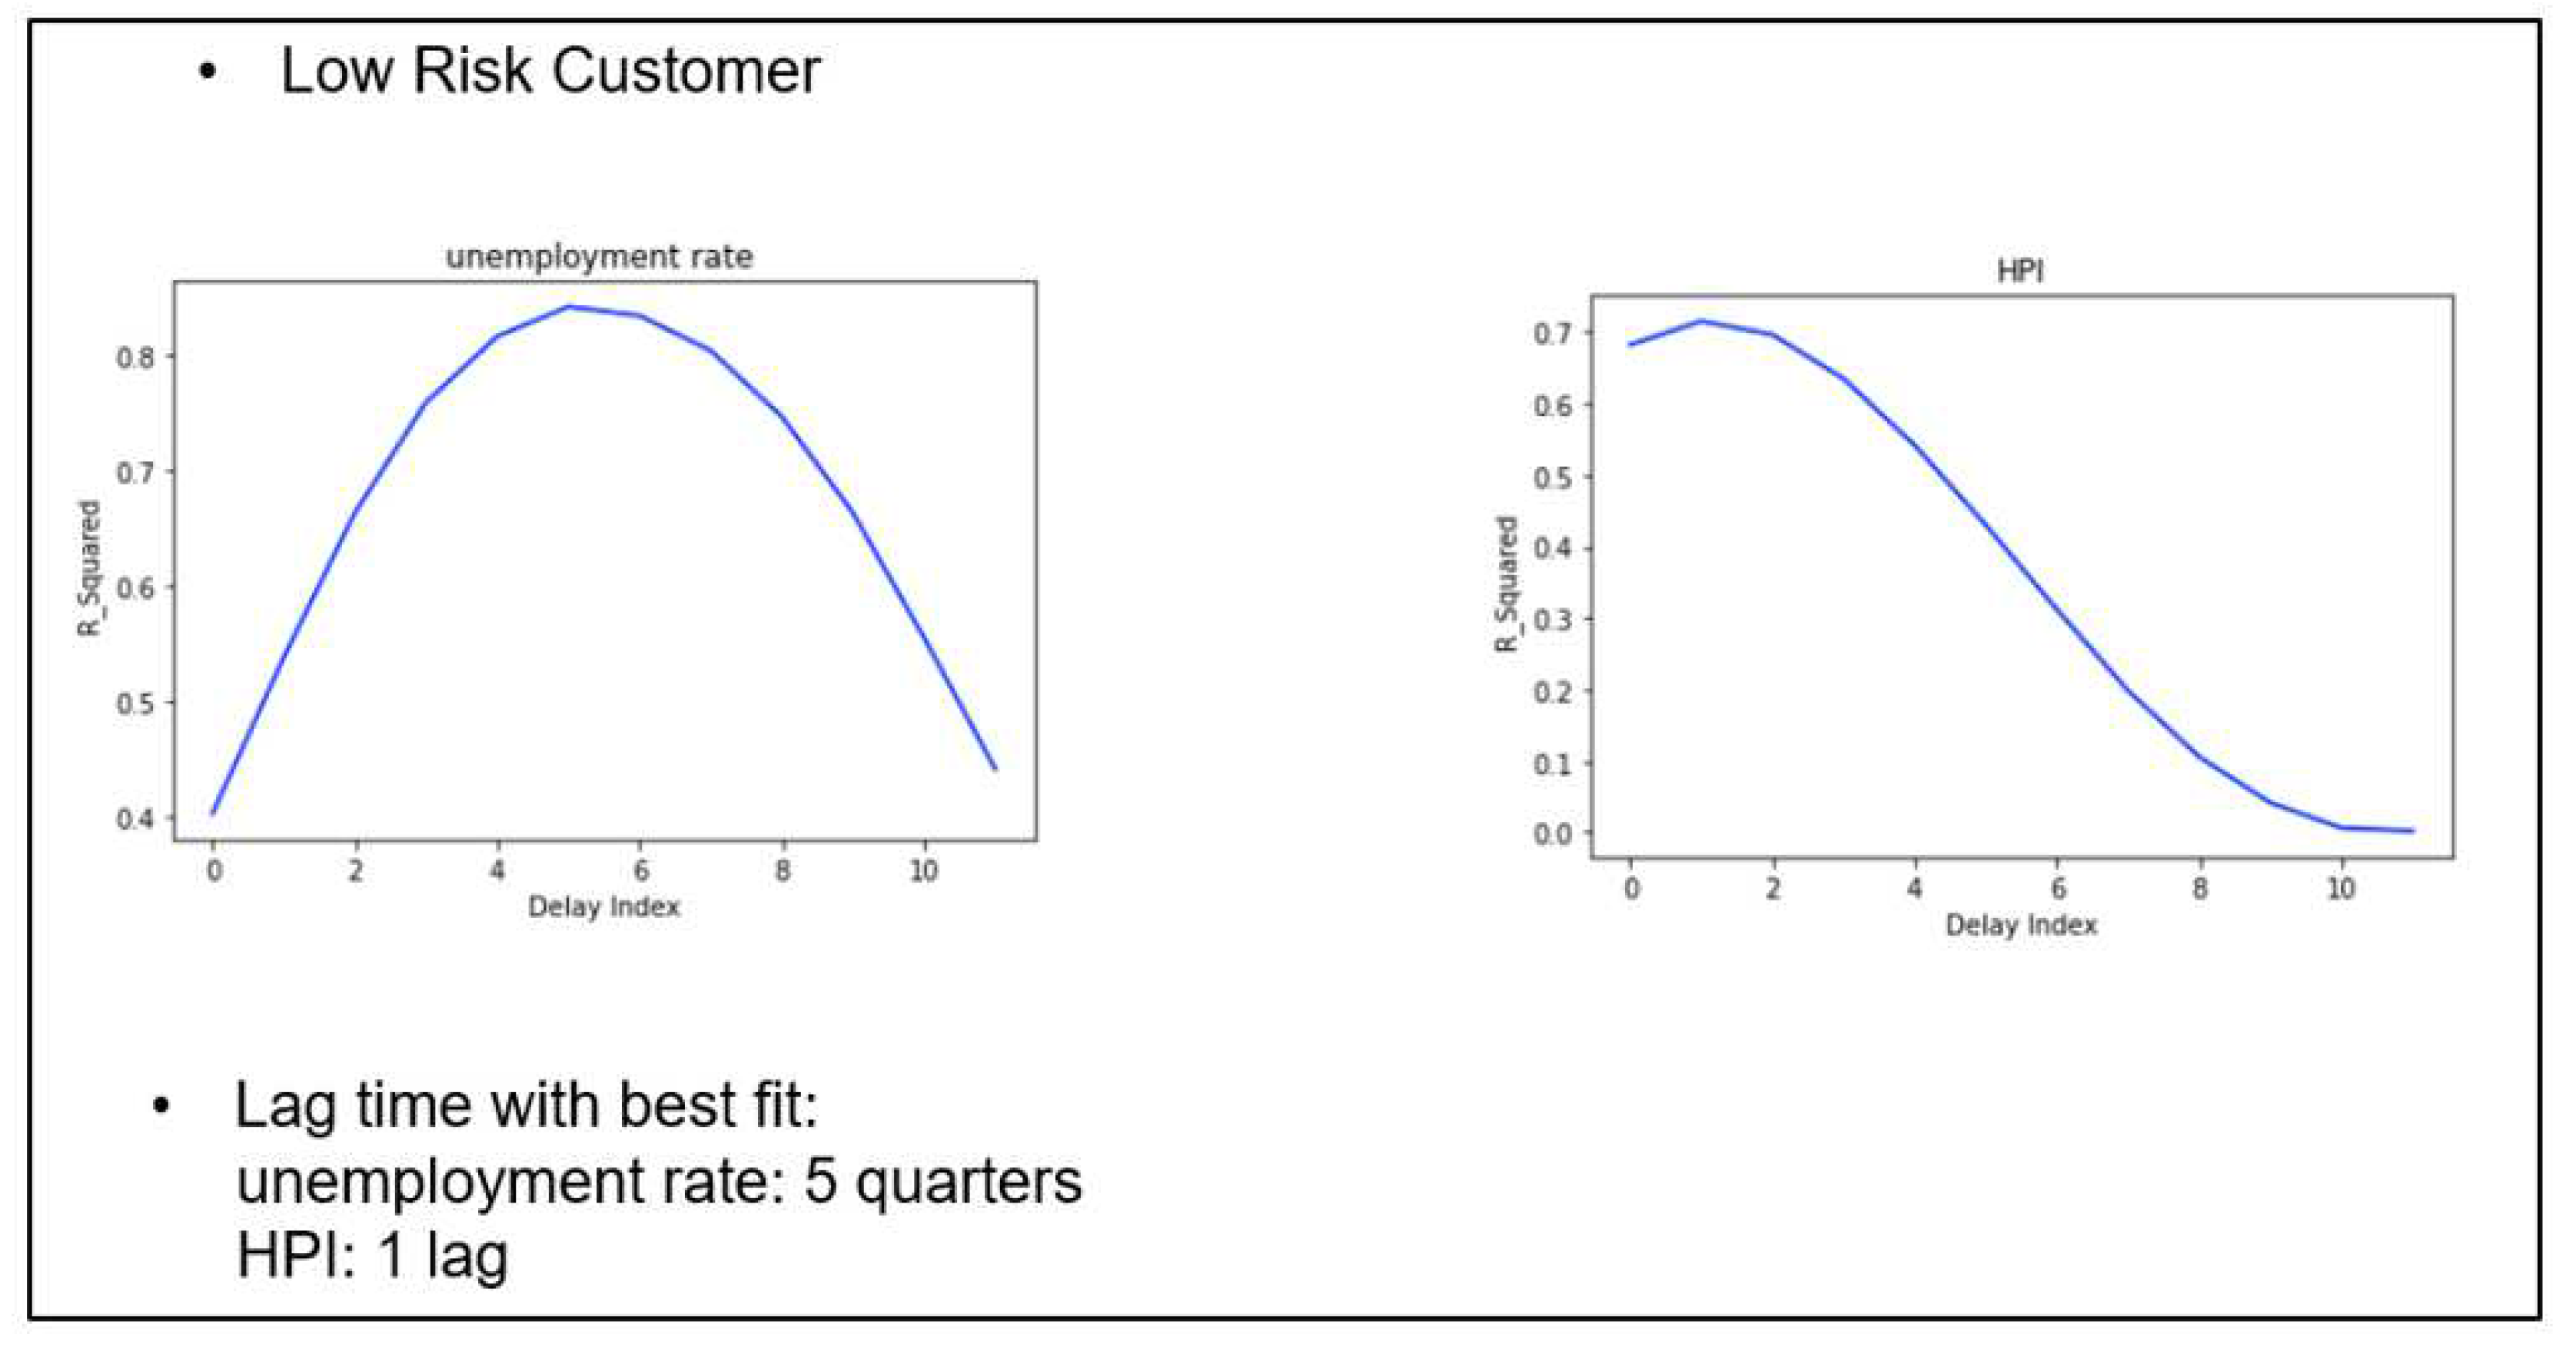

Table 1.
Possible values of the hyperparameters for grid search.
| Parameter | Values |
|---|---|
| Percentage of dropout (regularization): | 0, 0.1, 0.2, 0.3, 0.4,0 .5 |
| Numbers of hidden layers: | 2, 4, 6, 8 |
| Numbers of neurons in each layer: | 2, 4, 6, 8 |
| Training iteration for the network: | 5, 10, 15, 20, 25, 30 |
Table 2.
Result of macroeconomic time series regression (Adjusted R-squared:0.938).
| Variable | Coefficient estimate | P-value |
|---|---|---|
| X1 (coefficient of unemployment rate, lag 4 months) | +4.000 | <0.0001 |
| X2 (coefficient of HPI, lag 1 month) | -3.118 | <0.0001 |
| X3 (coefficient of the time trend) | -5.309 | 0.522 |
Disclaimer/Publisher’s Note: The statements, opinions and data contained in all publications are solely those of the individual author(s) and contributor(s) and not of MDPI and/or the editor(s). MDPI and/or the editor(s) disclaim responsibility for any injury to people or property resulting from any ideas, methods, instructions or products referred to in the content. |
© 2024 by the authors. Licensee MDPI, Basel, Switzerland. This article is an open access article distributed under the terms and conditions of the Creative Commons Attribution (CC BY) license (http://creativecommons.org/licenses/by/4.0/).
Copyright: This open access article is published under a Creative Commons CC BY 4.0 license, which permit the free download, distribution, and reuse, provided that the author and preprint are cited in any reuse.