Submitted:
30 December 2023
Posted:
03 January 2024
You are already at the latest version
Abstract
People wore clothes for warmth, survival and necessity in modern life as well but in modern era, eco-friendliness, shorten production time, design, and intelligence also matters. The seamless bonding technology strengthen the bond between fabrics in textiles, while Grey relational analysis (GRA) can be applied to fabrics to measure the relationship between data series and determine the closeness of each data series. In this study, polyurethane prepolymer, 2-Hydroxyethyl acrylate (2-HEA) as an end-capping agent, and n-octyl acrylate (ODA) as a photo-initiator were used to synthesize dual-curing polyurethane hot-melt adhesive. The Taguchi quality engineering and grey relational analysis used to discuss the influence of different mole ratio of NCO:OH, and the effect of the molar ratio of addition of octyl decyl acrylate on the mechanical strength. The Fourier transform infrared spectroscopy (FTIR) results showed the termination of prepolymer's polymerization reaction and the C=O peak intensity at 1730 cm-1 indicating the efficient bonding to main chain. The high molecular weight polymer (20,000-30,000) described by advanced polymer chromatography (APC) confirmed the polyurethane polymer bonded with octyl decyl acrylate to achieve the photo-thermosetting effect. The thermogravimetric analysis (TGA) results showed the thermal decomposition temperature of polyurethane hot melt adhesive also increased and highest pyrolysis temperature (349.89℃) for the polyhydric alcohols. The high value of shear strength (34.94 kg/cm2) as well as peel strength (1.68 kg/cm) were also observed in dual-cure photo-thermosetting polyurethane hot melt adhesive. The signal-to-noise ratio also used to generate the grey relational degree. It was observed that the best parameter ration of NCO: OH was 4:1 with 5 moles of monomer. The Taguchi quality engineering method was used to find the parameters of single quality optimization, and then the grey relation calculation was used to obtain the parameter combination of multi-quality optimization for thermosetting polyurethane hot melt adhesive. The study aims to meet the requirements of seamless bonding in textile factories and optimized experimental parameter design by setting target values can effectively increase production speed, reduce processing time and costs as well.
Keywords:
Grey relational analysis
; thermosetting polyurethane
; Taguchi quality engineering method
; polyhydric alcohols
; dual-cure photo-thermosetting polyurethane
; signal-to-noise ratio
1. Introduction
Many textile products in daily life are made with adhesives, such as protective clothing, swimwear, casual wear, sportswear, conveyor belts, and so on. Clothing and textiles have become a necessity in modern life. In the past, people wore clothes for warmth and survival. However, with the development of modern technology, people now not only demand beauty, eco-friendliness, specific functions, convenience, and intelligence, but also comfort when wearing clothing. For manufacturers, they hope to shorten production time, reduce labor demand, and have more extensive design flexibility. Traditional textile processing methods mostly use the sewing technique of needles and threads to piece together fabrics. During the processing, wrinkles, skipped stitches, uneven seams, broken threads, and other defects may occur. Even the combination of some functional clothing can be harmful. For example, if needles and threads are used to stitch together functional clothing such as diving suits, firefighting clothing, and medical protective clothing, it will damage the integrity and performance of these garments [1].
Therefore, the use of seamless bonding technology in textiles can not only strengthen the bond between fabrics but also shorten the processing time and avoid gaps. The use of adhesive technology involves using adhesive materials to quickly and tightly bond two fabrics together, which can replace the seams and fasteners commonly used in clothing. For the general consumer, it can reduce discomfort caused by friction between the seams and skin, while for designers and producers, it can offer a wider range of design options for the appearance of clothing. Therefore, in recent years, a seam-free processing technology has emerged that uses adhesives widely used in various industries. The use of adhesives is more suitable than traditional joining methods in many ways, such as fatigue resistance, design flexibility, environmental durability, and the ability to use adhesive methods. Therefore, it has been used in various fields such as aviation, electronics, automotive, sports, ships, petroleum, construction, shoe and clothing adhesion [2,3,4].
Currently, there are still some challenges in the industry regarding seamless bonding technology. This study summarizes the common defects in seamless bonding provided by textile factories into the following four points: (i) The hot melt adhesive cannot bond tightly with the substrate, resulting in insufficient adhesion and curling. (ii) During the process of melt pressing and lamination, the base material may produce visible defects. (iii) After the process of melt and pressure lamination, the fabric may shrink and have a poor appearance. (iv) The melting temperature of the hot melt adhesive is too high, resulting in severe color differences in the fabric. Based on the above issues, it is clear that the defects are all caused by the high melting temperature of the hot melt adhesive. Therefore, the softening processing temperature of the hot melt adhesive will be one of the important breakthroughs in seamless bonding technology.
Polyurethane is widely used in coatings, sealants, adhesives, insulators, footwear, rigid foam, flexible foam, textiles, medical, marine industry, piping, and many other fields [5,6,7,8]. Polyurethane is frequently used in adhesives for flooring, roofing, doors and windows, footwear, soft packaging, glass, textiles, etc. [9,10,11,12,13,14,15,16]. Polyurethane formed by the polymerization reaction contains a large number of urethane bonds. Urethane bonds are formed by the reaction between the -NCO group of isocyanates and the hydroxyl group of polyols [17,18,19,20]. The skeleton of thermoplastic polyurethane is a linear copolymer composed of alternating flexible soft chain segments and rigid hard chain segments. The soft chain segments are composed of long-chain polyols, which can be polyether such as polyethylene glycol, polypropylene glycol, polytetrahydrofuran, polyester polyols [21,22,23,24]. The hard chain segments are composed of polyisocyanates and small molecule alcohols. Due to the thermodynamic incompatibility between the two types of chain segments during polymerization, micro-phase separation structure is formed, which makes thermoplastic polyurethane have unique mechanical properties, high durability, excellent chemical resistance, and easy processing and application [25,26,27,28]. The most common method of seamless processing for textiles is the use of adhesive hot-melt film/strips. Hot-melt adhesive is a 100% solid thermoplastic material that can become sticky when heated. The process involves heating and melting the adhesive, which is then applied to the substrate to be bonded. The adhesive adheres to the substrate and the two materials are bonded together, and then it cools and solidifies to complete the bonding process. Kuo [29] found in his study that the hydroxyl group of polyurethane hot melt pressure-sensitive adhesive can form a chemical bond with the nylon fiber substrate having polar functional groups, further improving the adhesion between the adhesive and the substrate. It also exhibited strong adhesion in peel strength and shear strength.
Seamless bonding technology can effectively reduce the weaknesses in functional clothing caused by sewing areas and the discomfort caused by friction between the body and the seams when wearing tight-fitting clothing [30]. Compared with traditional hot melt adhesives, polyurethane hot melt adhesives are block or multi-block copolymers formed by alternating flexible and rigid chain segments. Its characteristic lies in its structure containing a high content of urethane and urethane ester bonds. Polyurethane hot melt adhesives have many advantages, such as being environmentally friendly, easy to use and process, effectively wetting the surface of many substrates, diffusing through porous substrates, having good toughness and water resistance, impact resistance, chemical resistance, and forming covalent bonds with substrates containing active hydrogen. [31,32,33].
In this study, it is focused on the raw materials and curing methods of polyurethane hot melt adhesives to overcome different problems. Polyurethane hot melt adhesives were synthesized by using three different types of polyols. 2-HEA and ODA form hydrogen bonding interactions through C=C groups with the functional groups on the nylon fiber, which can enhance the adhesion performance as well as the microphase separation degree which ultimately strengthen the adhesive. In addition to this, the alkyl chain group in the photoinitiator ODA is used to enhance the resistance of water towards adhesives. Different techniques i.e., FTIR, APC, TGA and moisture content have been used to analyze the results. By defining desired objectives for significant characteristics, the study intends to meet the requirements of seamless bonding in textile manufacturers. The NCO/OH ratio, three different categories of polyols, and the amount of photocurable monomer added are selected as control factors. According to the studies of Gogoi [34] and Somani [35], the NCO/OH ratio is mostly between 3:1 and 1:1. The three types of polyols used in the soft segment of this study are traditional polyester, polyether, and the newer polycarbonate. The aim is to determine which type of polyol provides excellent adhesion to nylon fabric. The use of n-Octyl Acrylate (ODA) is to achieve crosslinking through the C=C groups shared by 2-HEA and ODA under UV light stimulation. Additionally, the longer alkyl chain of ODA can increase the water resistance of the adhesive and improve its wetting properties on substrates. Lastly, the grey relational analysis method was used to perform multi-quality optimization parameter design for the dual-cure polyurethane hot-melt adhesive to optimize mechanical properties such as peel strength and shear strength of the adhesive
2. Materials and methods
2.1. Materials
Polytetramethylene Glycol (PTMG, Mitsubishi Chemicals group, Japan), Polycaprolactone (PCL Sigma-Aldrich), and Poly (Hexamethylene Carbonate) Diol (PHCD, Henan Tianfu Chemicals Co. Ltd) as the soft chain segment monomers. Diphenylmethane Diisocyanate (MDI, Hubei Pretty Chemicals Technology, Co. Ltd) was used as the rigid chain segment monomer, and 2-Hydroxyethyl Acrylate (2-HEA, Tokyo Chemical Industry Co. Ltd) as end capping agent to n-Octyl Acrylate (ODA, Osaka Organic Chemical Industry, Ltd), Di-ionized Water.
2.2. Method
In quality characteristic optimization, the NCO/OH ratio, three different categories of polyols, and the amount of photocurable monomer added are selected as control factors. The levels of each control factor are selected according to the literature.
The synthesis parameter setting ranges are shown in Table 1 and Table 2, and the Taguchi L9 orthogonal array used for experimental design is shown in Table 3. This study uses the levels of the NCO/OH ratio were set at 2:1, 3:1, and 4:1 in this study. The three types of polyols used in the soft segment of this study are traditional polyester, polyether, and the newer polycarbonate. The concentration level of n-Octyl Acrylate (ODA) are set at 0.1, 0.5, and 0.15 moles.
2.2.1. Synthesis Reaction of Polyurethane Hot Melt Adhesives
Polyurethane hot melt adhesives are synthesized by prepolymer method Figure 1, which having two steps (a, b). In Step (a) involves the reaction between diisocyanate and polyol to form a polyurethane prepolymer, a low-melting and low molecular weight adhesive substance. Step (b), the polyurethane prepolymer is further reacted with end-capping agent to produce a high-melting and high molecular weight polyurethane polymer. The polyurethane hot melt adhesive synthesized by this method has better comprehensive properties. During this preparation, three polyols i.e., Polytetramethylene Glycol (PTMG), Polycaprolactone (PCL), and Poly (Hexamethylene Carbonate) Diol (PHCD) as the soft chain segment monomers. Diphenylmethane Diisocyanate (MDI) was used as the rigid chain segment monomer, and 2-Hydroxyethyl Acrylate (2-HEA) was used end capping agent to terminate the polyurethane prepolymer. Finally, a suitable amount of n-Octyl Acrylate (ODA) was added as a photocurable monomer to synthesize a series of dual-cure polyurethane hot melt adhesives.
2.2.2. Methodology
In this study, vacuum drying was used to remove water from polytetrahydrofuran polyol, polycaprolactone diol, polycarbonate diol, isocyanate, hydroxyethyl methacrylate, and octyl decyl acrylate. The monomers were placed in a vacuum distillation apparatus and subjected to vacuum drying for 0.5 to 14 hours at 100°C. The water content was calculated, and synthesis was conducted when the water content was below 0.05%.
In the first step, the reaction flask was placed in a 75 °C oil bath and vacuum-degassed completely before filling with nitrogen gas. Then, excess molten MDI and dehydrated polyol were added to the reaction flask in sequence and mixed thoroughly using a stirring motor at a speed of 500 rpm for 30 minutes. Subsequently, ethyl acetate was added as a solvent to adjust the viscosity for 10 minutes to obtain the polyurethane prepolymer. The NCO content in the prepolymer was determined by the standard dibutylamine back-titration method. The process is shown in Figure 2 (a). The second step involves maintaining the temperature at 75℃ and introducing nitrogen to maintain an inert environment. The prepolymer and hydroxyethyl methacrylate are added and stirred continuously at 500rpm for 2 hours. Finally, an appropriate amount of photopolymerizable monomer, octyldecyl acrylate, is added and stirred for 30 minutes. Vacuum defoaming is then carried out, and the dual-curing polyurethane hot-melt adhesive is poured into a PTFE mold. After being kept at room temperature for three days, the fully cured dual-curing polyurethane hot-melt adhesive can be obtained and subjected to chemical property-related analysis. The synthesis reaction formula is shown in Figure 2 (b). The main steps of polymerization method were used in two-step core polymerization method. The chemical reaction of polymerization is given as Figure 3 (a-c).
2.3. Taguchi Method Quality Engineering
The core concept of the Taguchi engineering method is to design experiments by setting experimental parameters (control factors and their levels) using an orthogonal table, calculate the signal-to-noise ratio (S/N ratio), and use main effect analysis and variance analysis to consider the impact of both mean values and variances, properly handling noise factors, obtaining the optimal combination of control factors, and achieving the goal of saving experimental time and cost while obtaining important parameters that affect the experimental results. The Taguchi quality engineering method greatly reduces the number of experiments needed using orthogonal arrays, while also reducing the variability of the process and quality factors, resulting in stable and cost-effective testing results. The Taguchi experimental design methodology operates via orthogonal array design and parameter design. The control factors, signal factors, and noise factors are parameter design. The most common representation of the Taguchi orthogonal table is La(bc), where L is the first letter of Latin Squares, a is number of experiments required after statistical analysis; b is the number of levels of the controlled factors in the experiment, and c is the maximum number of factors that can be calculated. The basic orthogonal table of the Taguchi method and Taguchi Orthogonal Array is shown in Table 4, and Table 5. There are a number of factors i.e., control factors, signal factors, and noise factors and interference factors for Taguchi Quality Engineering technique but quality loss function is also important which includes smaller-the-better (STB), larger-the-better (LTB),), and nominal-the-best (NTB).
The STB meant quality characteristics is smaller, quality will be better, which includes hot melt adhesive, the amount of overflow. The LTB characteristics explained that when the quality characteristics is larger, better the quality, which includes shear strength and peel strength of adhesives. The quality loss function for the NTB characteristic includes softening point of adhesives and ideal target value (m). As the quality characteristic begins to deviate from the target value, the quality loss function also increases in a quadratic curve trend, as shown in equations. The STB, LTB and NTB graphs shown in Figure 4 (a-c) and represented as below
L(s) = ks2
L(s) = k(s-m)2
When the quality loss function approaches Target Value, the product's quality loss decreases.
2.3.1. Signal to Noise Ratio
The Signal to Noise Ratio (SNR) used for the target value of the quality characteristic and the variation of the quality characteristic. The optimal SNR characteristics, such as, it can reflect the variability of the quality characteristic, predict the quality characteristic even when the target value changes, measure relative quality. The SNR is measuring the quality of a product by using Taguchi Method's S/N ratio, described as
A larger χ indicates better quality. The LTB type quality characteristic and its infinite or the maximum possible value, without adjustment factor. Its formula given as
The STB is a continuous non-negative variable, and the objective is to minimize both the variance and the mean value. Therefore, the ideal situation is when the value is zero, without any adjustment factor. The type and the formula are explained in equation
The main characteristics of target value quality characteristic which is a continuous variable without negative values. The formula is shown as
where, S represents the standard deviation during the experiment, and represents the mean value during the experiment measurement.
2.3.2. Main Effects Analysis
In main effect analysis, the main effect values of each factor are calculated to determine the size of the influence of each control factor on the quality characteristics of double-cured polyurethane hot melt adhesive's peel strength and shear strength which needs to be conducted through a universal testing machine. Based on peel strength and shear strength, the signal-to-noise ratio (S/N ratio) for each set of experimental parameters is calculated to establish a factor effect response table for the S/N ratio, as shown in Table 6. If factor A has Y levels, each level with S signal-to-noise ratios, the formulas for the average response value IY and difference ΔI for each level are shown below,
where, μ is the signal-to-noise ratio of the factor at that level.
△I = IYMAX - IYMIN
2.3.3. Analysis of variance
The main purpose of ANOVA analysis is to investigate the correlation between the continuous dependent variable and independent variables. The ANOVA analysis focuses more on the contribution of each control factor to the improvement of experimental quality. Based on the F distribution, the importance of each factor can be estimated, providing a more objective way. In Taguchi quality engineering, ANOVA analysis relies on the F distribution as the basis for probability distribution. First, the sum of squares and degrees of freedom for each control factor is calculated. Then, these two values are used to calculate the variance (Var) and F value. Finally, the results are used to create an ANOVA table, as explained in Table 7.
ANOVA analysis includes sum of squares, degrees of freedom, variance, F-distribution value, contribution, and P-value. The explanations for each item were given as
The sum of squares is divided into three types: total sum of squares, factor sum of squares, and error sum of squares.
In the equation, δr represents the S/N ratio for each experiment analysis, and ¯δr represents the average value of the S/N ratio for all experiment analyses.
SS control is the variance of each control factor. Assuming a control factor has r levels, and each level has t replicates of signal-to-noise ratio, the calculation for SScontrol were
The in the equation represents the average value of the signal-to-noise ratio obtained for the control factor under the r levels.
The calculation of the error sum of squares is obtained by subtracting the sum of squares of all control factors from the total sum of squares, as shown in equation
SSe = SST – SScontrol
The degree of freedom is a measure of the amount of information obtained. In statistics, it refers to the number of unrestricted independent variables when estimating a parameter using a statistical measure of a sample. Generally, the larger the degree of freedom, the more information can be obtained. In Taguchi's method, the degrees of freedom are divided into total degrees of freedom, control factor degrees of freedom, and error degrees of freedom.
Total degrees of freedom (DOFT)
The total number of degrees of freedom is equal to the total number of experiments minus one.
Control factor degrees of freedom (DOFcontrol)
The degree of freedom for a control factor is equal to the number of levels of the factor minus one.
DOFcontrol=number of levels -1
Error degrees of freedom (DOFerror)
The value of error degrees of freedom is obtained by subtracting the degrees of freedom of control factors from the total degrees of freedom.
DOF error = DOFT − DOFcontrol
The mean square (MS), also known as variance, is the ratio of the sum of squares to degrees of freedom. Since the values in the experimental analysis are related to the sum of squares, to reduce the influence of these two values on the mean square, we divide the sum of squares by the corresponding degrees of freedom to obtain the variance, which is the mean square, as shown in Equation (3-15). Additionally, the mean square error is calculated using the following equations
F-value is a numerical value that describes the F-distribution and indicates the relationship between error variance and factor effects. It can be used to evaluate the impact of each control factor on the quality characteristics of the experiment.
The contribution in Taguchi quality engineering refers to the relative ability of a control factor to reduce variability, and it can be used to determine the proportion of total sum of squares and calculated by using the following formula
P-value is a measure of the probability used in experimental analysis.
The confidence level of the control factor can be calculated through the P-value, and the larger the confidence level, the more important the factor is to the quality characteristic. The formula for the confidence level is shown
Confidence level = (1–P) × 100%
In statistics, a confidence interval (CI) for a sample of data from a population is an estimation of an unknown population parameter using an interval, which includes information about the estimation accuracy. The confidence interval is a way to express the error associated with estimating an unknown value (e.g., the signal-to-noise ratio for each experiment in Taguchi method) as a probability that the unknown value falls within a certain range. To verify the reliability and rationality of Taguchi parameter design, experimental confirmation is required. First, the signal-to-noise ratio is predicted using the additive model under the optimal factor configuration conditions, followed by calculating the confidence interval of the optimized configuration based on the estimated signal-to-noise ratio. Finally, the experimental signal-to-noise ratio is compared with the estimated confidence interval. If the experimental signal-to-noise ratio falls outside the confidence interval or deviates significantly from it, it indicates that there may be a problem with the experimental design, and the control factors and levels need to be reelected. It is also necessary to consider whether other factors may have affected the experimental results, and further improvements to the experiment and parameters should be made until good experimental reproducibility is achieved. The formula for predicting the optimal configuration signal-to-noise ratio SN is shown in Equation
where, represents the average value signal-to-noise ratios, is the signal-to-noise ratio of significant control factors, and n is the number of significant factors. To effectively estimate the signal-to-noise ratio of each experiment, the confidence interval of the confirmation experiment for the optimal control factor pairing of the single quality optimization quality characteristic needs to be calculated. The formula for calculating the confidence interval of the confirmation experiment is shown as equation
where, Fα:1 is the F-distribution value of significant control factors, α is the confidence level, V2 is the degrees of freedom of combined error variance, Vare is the variance of combined error, r is the number of measurements in the confirmation experiment, and neff is the effective analysis value, which is calculated by the formula as follows.
Regarding the significance level α, currently in statistics and calculations, most commonly use 0.05, which means that the confidence level of the confirmation experiment can be as high as 95%. Therefore, the F distribution value for the significance level can be found in Table 8.
This table can be used to look up the F value for a 95% confidence level. For example, F (0.05; 2, 10) = 4.10 means that at a 95% confidence level, the significant factor F value is 4.10 under the condition of combined error degrees of freedom being 10. The reliability and reproducibility of the experimental design can be verified by comparing the calculated confirmation experiment S/N ratio (S/Nν) with the confidence interval obtained from the significant factor's F value. The verification formula is shown as follows
2.4. Grey relational analysis (GRA)
The present study aims to optimize the parameter design for the polymerization reaction of dual-cured polyurethane hot melt adhesive and focuses on the quality characteristics of shear strength and peel strength when applied to nylon fabric.
2.4.1. Grey relational analysis (GRA) method
The Taguchi quality method is used to configure experimental parameters for the polymerization reaction of the dual-cured polyurethane hot melt adhesive. The Taguchi engineering method's L9 orthogonal table is used to adjust the experimental parameters. GRA is able to calculate the degree of correlation between data series with a small amount of data and using the differences between factors to calculate the correlation between data series, making up for the shortcomings of traditional analysis methods. Before conducting grey relational analysis, the sequences must satisfy comparability to perform the analysis. Assuming that Xi and Xj represent two comparable grey relational degree sequences to be calculated, γ (Xi, Xj) is used to represent the grey relational degree between Xi and Xj. There are four necessary conditions for grey correlation analysis such as consistency, symmetry, comprehensiveness, closeness with their formulae as follows:
Consistency: 0 < γ (Xi, Xj) ≤ 1
When γ (Xi, Xj) = 0 in the gray correlation system, it means that there is no correlation between the two sequences Xi and Xj; when γ (Xi, Xj) = 1, it means that the two sequences have complete correlation.
Symmetry: γ (Xi, Xj) =γ (Xj, Xi)
When the gray correlation system has three or more sequences, because the selected sequences may be different, usually satisfies the formula
Comprehensiveness: γ (Xi, Xj) ≠ γ (Xj, Xi)
Closeness: The smaller the absolute value of Xi – Xj, the larger the γ (Xi, Xj). In this case, γ (Xi, Xj) can be referred to as the gray correlation coefficient between sequence Xj and sequence Xi under the conditions.
2.4.2. Calculation of Grey Relational Analysis
Grey Rational Analysis used to perform the conversion during grey correlation generation, and the corresponding calculation method adopted which was based on the different expected values of each column and values between 0 and 1. The following equations given as:
Favorable property of larger values (higher expected target values are preferred)
Favorable property of smaller values (lower expected target values are preferred)
Target Value Feature (where the expected target value is a specific value, represented by OT)
where, Xi*(k) represents generated gray correlation value, max Xi(k) represents maximum value, and min Xi(k) represents the minimum value from the original sequence and the calculation of grey relational coefficient is performed by first selecting a reference sequence X0(k), while the other sequences are considered as comparison sequences (X1(k), X2(k), ..., Xp(k)). The formula for calculating grey relational coefficient is as follows:
The term min(p)min(k)|X0(k)-Xp(k)| represents the minimum absolute difference between X0(k) as the reference sequence and Xp(k) as the comparative sequence. Similarly, the term max(p)max(k)|X0(k)-Xp(k)| represents the maximum absolute difference between X0(k) as the reference sequence and Xp(k) as the comparative sequence. Therefore, the formula can be simplified as follows:
where, Δ0i(k) is difference represented the absolute difference between the reference sequence and the comparison sequence, and Δmax and Δmin represent the maximum and minimum values among them. ζ is the discrimination coefficient, with ζ∈ [0,1], Typically, the discrimination coefficient is set to 0.5. The changing the value of discrimination coefficient affects the numerical value of the grey correlation coefficient. After obtaining the gray correlation coefficients of different sequences, the average value of the gray correlation coefficients is usually used as the gray correlation degree. The calculation formula is explained as follows,
2.4.3. Optimization quality analysis process
There are a total of nine experimental groups, with three levels of water content, isocyanate to polyol ratio, and photoinitiator additive amount. The three levels are polyether, polyester, and polycarbonate for the soft chain segment polyols, and the NCO: OH, ratio of isocyanate and polyol is 2:1, 3:1, and 4:1. The photoinitiator additive amounts are 0%, 5%, and 15%. The signal-to-noise ratio (S/N ratio) formula in the Taguchi method is used to calculate the S/N ratio of shear strength and peel strength. The main effect analysis and variance analysis are used to obtain the single quality optimization design for shear strength and peel strength. Subsequently, the grey relational analysis method is used, with the S/N ratio of shear strength and peel strength as the initial sequence, and the grey relational formula is used to generate two new sequences, Xi and Xj. The maximum value of the two sequences is selected as the reference sequence, and the rest are used as the comparison sequence. The difference sequence is calculated, and the grey relational coefficient and grey relational degree are calculated based on it. Finally, the main effect analysis is carried out on the grey relational degree, and the multiple quality optimization parameter design is obtained.
3. Results and Discussions
3.1. Chemical and Physical Analysis
3.1.1. Fourier Transform Infrared Spectrometer (FTIR)
The Fourier transform infrared spectroscopy (FTIR) instrument, model Digilab (FTS -1000), was used to perform functional group analysis on the synthesized dual-curing polyurethane hot-melt adhesive as shown in Figure 5. When the beam contacts the sample (transmission or reflection), different interference patterns are formed on the detector, which are then transformed via fourier transfer to produce an infrared absorption spectrum. This mainly observes the energy changes between the vibration and rotation levels of the substance caused by the absorption of infrared light. The measurement is commonly carried out by transmission, reflection, and attenuated total reflection (ATR) methods. Generally, the wave number range of transmission infrared spectroscopy is 4000~400cm −1, while the wave number range of attenuated total reflection infrared spectroscopy is 4000~650 cm−1. This study used attenuated total reflection (ATR) mode for functional group identification, with an infrared wavelength range of 4000 ~ 650 cm−1. The FTIR spectra of the dual-curing polyurethane was shown in Figure 5 in order for the polyols used, PTMG, PCL, and PHCD, respectively. In Figure 5 (a-c) represent the samples with an NCO: OH, ratio of 2, and it represent samples with NCO: OH, ratios of 3 and 4, respectively, with increasing ODA content from 0 to 15.
The peak at 1110 cm−1 corresponds to the C-O-C stretching vibration of the soft segment diol; the peak at 1242 cm−1 corresponds to the stretching and bending vibrations of the isocyanate group; the peak at 1535 cm−1 indicates the presence of hydrogen bonding in the polyurethane; the peak at 1600 cm-1 corresponds to the phenyl ring in the isocyanate; the peak at 1730 cm−1 corresponds to the C=O stretching vibration of the isocyanate group, which increases with increasing molar ratio of ODA; the peak at 2268 cm−1 corresponds to the NCO functional group of the isocyanate, which disappears due to complete reaction during end-capping; and the peaks at 2680 cm−1 and 2940 cm−1 correspond to the stretching vibrations of CH2 and CH3, respectively [36,37,38,39,40,41,42,43,44,45,46,47]. The detailed peak values and functional groups are shown in Table 9.
3.1.2. Advanced Polymer Chromatography (APC)
The Advanced Polymer Chromatography (APC) was used in this study to analyze the molecular weight and molecular weight distribution of polymers. The sample was dissolved in THF and injected into a chromatography column with an internal diameter of 3μ. When the sample solution flowed through the chromatography column, larger molecules were excluded from the pores and could only pass through the particle interstices, resulting in a faster rate. Smaller molecules fell into the pores and passed through at a relatively slower rate. After passing through a certain length of the chromatography column, the molecules were separated based on their relative molecular weight, with those having a larger relative molecular weight flowing out and being detected first, while those with a smaller relative molecular weight flowing out more slowly. Therefore, the molecular weight of the sample could be detected based on this principle. In this study, the sample was prepared by mixing it with THF solvent in a ratio of 2 mg: 1 mL. After the sample was completely dissolved, it was filtered using a 0.2 μmol syringe filter to avoid blockage of the pipeline. The Advanced Polymer Chromatography (APC) system automatically calculates Mn, Mw, and PDI based on the chromatographic separation of the sample.
The molecular weight distribution of dual-cure polyurethane hot melt adhesives was analyzed by APC under the same polyol and with different R values and different amounts of photopolymerizable monomers. The detailed molecular weight distribution is shown in Table 6. The sample names consist of two numbers, representing the NCO: OH, ratio value and the molar ratio of added photopolymerizable monomers. According to Table 10, for all the same soft segment polyols, the number-average molecular weight (Mn) increases steadily with the addition of photocurable monomers. Taking R4 as a standard, the Mn of PTMG soft segment increases from11888 to 33086; PCL soft segment increases from 11804 to 37801; and PHCD increases from 12011 to 36702. Moreover, the polydispersity index (PDI) of all polymers is less than 2. In this study, 2-HEA was first used to end-cap the prepolymers, and it can be seen that the polymerization degree of each sample without adding photocurable monomers is stable at around 10,000. Then, with the addition of ODA, the molecular weight can steadily increase by 10-20,000, achieving the effect of further growth after end-capping.
3.1.3. Thermogravimetric Analysis (TGA)
The Thermogravimetry Analysis (TGA, TA Instruments-DuPont Q500) was used to measure the weight loss and thermal decomposition temperature of a dual-cured polyurethane hot melt adhesive at a specific temperature. The main principle is to place the sample in a heating furnace that can be heated, cooled or maintained at a constant temperature, and to introduce a fixed gas (nitrogen or oxygen). When the temperature rises to the decomposition temperature, evaporation temperature, or oxidation temperature of a component in the sample, the sample will undergo weight loss due to decomposition, evaporation, or oxidation, allowing for the determination of the thermal stability, decomposition temperature, component ratio, sample purity, moisture content, and antioxidant properties of the material. The instrument was calibrated by placing an empty pan and zeroing the state after subtracting the weight of the empty pan. The sample weight was measured, and it should be less than 10 mg. The sample was placed in the instrument and the parameter conditions were set to room temperature to 600 °C, with a heating rate of 20 °C/min. The weight loss of the dual-cured polyurethane hot melt adhesive during heating was detected, and the test data will serve as a reference for future application in temperature stability during processing. Nitrogen was chosen as the environmental gas in this study, and the heating condition was from room temperature to 600 °C at a heating rate of 20 °C/min [48,49]. This study analyzed the thermal stability of the photocured polyurethane hot melt adhesive under a nitrogen atmosphere. Table 11 summarizes all the TGA data, with T5 and T10 indicating the temperatures at which 5% and 10% weight loss occurred, respectively. Figure 6 show the TGA curves for different NCO:OH ratios, types of polyols, and ODA addition levels.
Table 11 and Figure 6 (a-c) show that before the temperature reaches 250℃, the thermal weight loss of all dual-curing hot melt adhesives does not exceed 5%. From literature [50], it is known that the thermal decomposition of polyurethane hot melt adhesives can be divided into two stages: the first stage involves weight loss in the hard chain segment area between 200℃ to 400℃, and the second stage involves weight loss in the soft chain segment between 400℃ to 500℃. The thermal decomposition temperature of the polymer is affected by the heat resistance of the monomer used in the polymerization process. Therefore, in this study, 2-HEA and photopolymerizable monomers were used to introduce the double bond functional groups into the dual-curing polyurethane hot melt adhesives. Since ODA can not only react with the end-capping 2-HEA but also crosslink with the main chain of polyurethane to form a crosslinked structure, Table 6 shows that with the increase of ODA addition, not only the number of double bond functional groups but also the molecular weight of the polymer is increased. Taken together, these two points can effectively enhance the thermal decomposition temperature of the dual-curing polyurethane hot melt adhesive. When using the same type of polyol, it can be seen that the closer the NCO: OH, ratio is to 1, the higher the thermal resistance temperature. Furthermore, compared to the other two types of polyols, the ether-based polyol has the highest thermal decomposition temperature.
3.1.4. Polyhydric alcohol dehydration time
To avoid explosive polymerization and unstable aminoformate groups decomposition, the vacuum drying used to remove water in the polyols and were placed in a vacuum concentrator at 100℃ which retained for 0.5-14.0 hours. The water content was measured by using the following equation.
where Wdamp is the weight before drying, and Wdry is the weight after drying.
Figure 7 showed the variation curves of water removal time for the three types of soft chain segment polyols. As seen from Figure 7 (a), the water content of PTMG drops significantly in just 1.5 hours and becomes stable after 2 hours. On the other hand, Figure 7 (b), the PCL requires 4 hours to stabilize. Finally, due to its highest viscosity, PHCD requires 12 hours to become stable and no longer vary as shown in Figure 7 (c). To ensure experimental stability, in this study, an additional hour was added to the water removal time for each polyol to ensure stability before conducting experiments.
3.2. Physical Analysis
According to the ASTM D36 standard, a softening point test was performed by placing the sample on a metal ring-shaped container (diameter above 15.9mm, thickness 2.38mm, depth 6.35mm) and a steel ball weighing 3.5g was placed above the sample center. The container was then heated at a rate of 5°C per minute, and the temperature at which the steel ball dropped was recorded as the softening point. The softening point temperature is affected by the heating rate. The 180° Peel Strength test is conducted according to the ASTM D3330 standard using a universal testing machine (Tensile tester) with an Orientec RTA-1T model. The test mainly measures the different tensile properties of polymers. A polyurethane hot melt adhesive strip is cut to a size of 1cm15cm, and a nylon cloth is cut to a size of 2.54cm*18cm. The following processing conditions are used for bonding: first, after the nylon cloth and adhesive strip are fixed, they are placed under a UV machine for precise positioning and the first polymerization cross-linking. The exposure time is 2 sec. Then, it is placed on a heat press with a processing temperature of 100°C, processing time of 20 sec., and processing pressure of 1kg/cm2. After bonding, it is allowed to stand for 20 minutes to cool and stabilize, and then the peel strength is tested at a speed of 300 mm/min. According to the specification CNS 8306 L3141, shear strength test is performed using a universal tensile testing machine (Orientec RTA-1T). Polyurethane hot melt adhesive tape is cut into 1cm*15cm, and nylon fabric is cut into 2.54cm*18cm. The following processing conditions are applied: after fixing the nylon fabric and adhesive tape, place them under the UV machine for precise positioning and the first polymerization and crosslinking process, with a UV exposure time of 2 seconds. Then, place them on a hot press with a processing temperature of 100°C, processing time of 20 seconds, and processing pressure of 1kg/cm2. After bonding, let it stand for 20 minutes to cool and stabilize, and perform shear strength test at a speed of 300mm/min.
3.2.1. Peel strength and shear strength of Hot Melt Adhesives
This study analyzed the peel strength and shear strength of the hot-melt adhesive using the Taguchi method with partial factorial experiments. Different polyols, R values, and ODA contents of the dual-curing polyurethane hot-melt adhesive were tested and analyzed using nylon fiber fabric as the experimental substrate. All samples were subjected to 2 seconds of UV exposure, and the hot-press processing temperature was set at 100℃ for 1 minute under a pressure of 1 kg/cm2. The analysis results are described in Table 12. In this study, seamless bonding of the dual-curing polyurethane hot melt adhesive to the nylon substrate was carried out under the conditions of 2 seconds of UV exposure time, 100℃ of processing temperature, 1 minute of processing time, and 1kg/cm2 of processing pressure. As shown in Table 12, due to the addition of the 2-HEA end-capping agent, the molecular weight was controlled to around 10,000, resulting in lower peel and shear strength. However, after crosslinking growth by adding ODA, both peel and shear strength were improved. The soft segment also affects the mechanical strength, and among the various polyurethane hot melt adhesives, those with polycarbonate > ester > polyether in the multiple alcohols showed higher peel and shear strength. Among all the samples, when 15 moles of ODA were added, the hot melt adhesive showed the highest peel and shear strength performance. This is because when ODA is added, it not only effectively controls the increase in 10,000-20,000 molecular weights but also increases the C=O functional group on the molecular chain, which can form effective hydrogen bonding with the -NH groups of nylon, allowing the dual-curing polyurethane hot melt adhesive to tightly bond with the nylon fabric and enhance the mechanical strength.
3.2.2. Mechanical Properties of Hot Melt Adhesives
The peel strength and shear strength of the hot-melt adhesive by employing the Taguchi method with different polyols, R values, and ODA contents of the dual-curing polyurethane hot-melt adhesive were analyzed and nylon fibric is used as experimental substrate. The seamless bonding of the dual-curing polyurethane hot melt adhesive to the nylon substrate was carried out with UV exposure time of 2 sec, 100℃ processing temperature, 1 min processing time, and 1kg/cm2 processing pressure. It was observed in Table 13, the addition of 2-HEA as the peel strength and shear strength was owing controlling of molecular weight to around 10,000, while both peel and shear strength were improved by the addition of ODA as crosslinking growth agent. It is noted that the soft segment of polyurethane hot melt adhesives reacted with polycarbonate > ester > polyether in the polyol, it affects the mechanical strength by increasing peel strength and shear strength. It was observed that when 15 moles of ODA as crosslinking growth agent were added, the hot melt adhesive showed the highest peel and shear strength performance.
The addition of 15 moles of ODA not only effectively controls the increase in 10,000-20,000 molecular weights but also increases the C=O functional group on the molecular chain. These C=O functional groups bonded with group -NH groups of nylon by Wan der Waal forces (hydrogen bonds) which allowing the dual-curing polyurethane hot melt adhesive to tightly bond with the nylon fabric, ultimately used to enhance the mechanical strength.
3.2.3. Optimal Analysis of Dual-cure Polyurethane Hot-melt Adhesive Single Quality
In this study, poly-alcohol (PTMG, PCL, PHCD) as A, NCO:OH ratio (2:1, 3:1, 4:1) as B, and ODA mole ratio (0, 5, 15) as C were selected as the controlled factors for the experiment respectively. The three control factors and their levels were inputted into the Taguchi L9 orthogonal array. The quality characteristics of peel strength and shear strength were analyzed using the signal-to-noise ratio (S/N) approach. The impact of each control factor at different levels on the quality characteristics of the dual-cure polyurethane hot melt adhesive was evaluated. Finally, through confirmation experiments, a reliable optimal single quality parameter configuration was obtained.
3.2.4. Single quality optimization analysis of shear strength
The maximum desirable value of shear strength was obtained through analysis to calculate the S/N ratios. After that, the main effect analysis and ANOVA analysis were conducted. Since higher shear strength is desired, the larger-the-better S/N formula was used to calculate the S/N ratios. The results of shear strength analysis along with mean and standard deviation given in Table 14. The response values for each factor will be obtained for the nine experiments in terms of shear strength after S/N ratios calculation. The influence of each control factor at different levels on the dual-curing polyurethane hot melt adhesive is determined and ranked by creating a response table and a response graph for the main effects analysis, as shown in Table 15 and Figure 8. From this data, the optimal parameter ratio for the shear strength of the dual-curing polyurethane hot melt adhesive is determined. The ANOVA analysis results for the influence of each control factor on the double-cured polyurethane hot melt adhesive are shown in Table 15. The ANOVA analysis is needed after main effect analysis completion for further confirmation of significance and magnitude of the effect of each control factor. The ANOVA analysis showed that three important factors which affect the shear strength with F-values, accordingly, NCO: OH, ratio with an F-value 362.33, photocurable monomer with an F-value of 42.37 and polyol with an F-value of 18.11 (if F-value ˃ 5, important but if F-value ˂ 5 not important) which is consistent with the results obtained from the main effect analysis. The optimal combination is NCO: OH, ratio of 4:1, and 5 mol% of added photocurable monomer as A2, B3, and C2 are polyester polyol, respectively, for peel strength in Taguchi analysis method. For this purpose, the total average of the S/N ratio for the nine experiments needs to be calculated. The average value is:
The Table 14 showed total three significant control factors. The optimal main effect analysis values given in Table 13, and the calculated by using the following method:
To make an effective estimation S/N ratio in the confirmation experiment, the 95% confidence interval (CI) needs to be calculated by using the following method,
where, Fα;1 and v2, are F-distribution values of significant control factor, α is confidence level, V2 is error variance degrees of freedom, Vare is combined error variance, ηeff is effective number of observations, and r is number of analyses for confirmation experiment.
Table 16 showed that the F-distribution is 18.51, degrees of freedom 2, and the variance 0.09. Therefore, the CI value is 1.4962. The calculated confidence interval is 29.3338~32.3262 for the optimization analysis of the peel strength of the dual-curing polyurethane hot melt adhesive. This S/N ratio (30.62) indicated the high accuracy and good reproducibility of experiment because it falling within the 95% confidence interval. Therefore, polyester polyol, a 4:1 NCO:OH ratio, and 5 molar additions of ODA were selected for the experiment’s confirmation. The shear strength results are shown in Table 17.
3.2.5. Optimization analysis for peel strength single-factor quality
The S/N ratios were calculated for each experimental group using the obtained results of peel strength analysis through the use of LTB characteristic and presented in Table 18. The response table and response plot of the main effect analysis are shown in Table 19 and Figure 9, respectively. This analysis provides insight into the degree to which each control factor affects the double-curing polyurethane hot-melt adhesive at different levels and ranks them. The optimal parameters for peel strength optimization of the double-curing polyurethane hot-melt adhesive are identified. The response graph and response table showed that A3B3C3 have the highest factor levels to influence of each control factor on the double-curing polyurethane hot-melt adhesive. To further confirm the magnitude of the impact of each control factor, determine its significance, and ANOVA analysis as well. The variance analysis results are shown in Table 20.
The Taguchi analysis revealed that the optimal combination is A3B3C3, which composed of polycarbonate polyol, NCO: OH, ratio of 4:1, and 15 mole ratios of photopolymerization monomer, respectively for peel strength. The confirmation experiments are necessary which is conducted on the optimal parameter combination obtained. The total average of the S/N ratio for the nine experiments average value is:
The predicted optimal S/N ratio needs to be determined by using the total average and significant control factors. According to Table 21, there is only one significant control factor and the calculation method is as follows,
In order to make an effective estimation of actual S/N ratio used to calculate the 95% confidence interval (CI) value calculated as follows,
The F distribution value for the significant control factor is 18.51, and from Table 20, the combined error degree of freedom is 2 with a 1.02 variance. The confidence interval for the optimal analysis of the peel strength of the double-cured polyurethane hot melt adhesive is 3.6181 to 12.7739. Therefore, the confirmation experiment is conducted by using polycarbonate diol, a 4:1 NCO:OH ratio, and 15 mol% of ODA, which showed the high accuracy and good experimental reproducibility as shown in Table 21 for shear strength results. The obtained data was calculated the S/N ratio of the peel strength was 4.21 which falls within the 95% confidence interval showed that experiment have good accuracy and reproducibility.
3.2.6. Multi-Quality Optimization Analysis
The grey relational analysis method was used to perform multi-quality optimization parameter design for the dual-cure polyurethane hot-melt adhesive to optimize the peel strength and shear strength of the adhesive. The Table 22 shows the signal-to-noise ratios of the nine groups of analysis the dual-curing polyurethane hot-melt adhesive for the grey relational generation. As explained in Table 23, the maximum value (4.03), the minimum value (-16.62), and the difference value (20.65) of peel strength. The maximum value (30.50), the minimum value (28.75), and the difference value (1.76) of shear strength. As this study aims to maximize the values of these two quality characteristics, the maximum seeking characteristic will be used for calculation. The grey relational generation will be conducted, and the obtained grey relational sequence is shown in Table 23. After the calculation of the grey correlation generation table is completed, the next step is to calculate the difference between the reference sequence and each sequence, obtaining a sequence of differences, which is then plotted in Table 24.
After calculating the difference sequence, the gray correlation degree values used for the shear strength and peeling strength. The detailed values are shown in Table 25. After the calculation of grey relational analysis, the next step is to perform a main effect analysis on the grey relational degrees to obtain the final optimal design parameters for the multi-quality optimization. Therefore, the grey relational degree values are plotted into a main effect response Table 26 and response plot in Figure 10, respectively. From these, the optimal design parameters for the dual-cured polyurethane hot melt adhesive can be obtained. According to the response Table 26, the optimal levels for the multi-quality optimization of the dual-curing polyurethane hot melt adhesive are A3B3C2, which means selecting PHCD as the soft chain segment and using a 4:1 NCO: OH, ratio with 5 molar ratios of ODA for polymerization. As shown in Table 26, the ranking of the main effect differences is B, A, C, indicating that the ratio of R values is the most influential control factor, followed by the polyol, and finally the molar ratio of photocurable monomers. To verify the accuracy of the multi-quality optimization design obtained by the grey relational analysis method, experiments and analysis need to be conducted based on the control factors and levels of the experimental parameters designed by multi-quality optimization, and the enhancement effect of the mechanical strength obtained needs to be confirmed and experimental results are shown in Table 27 and Table 28. After experimental experimentation, the results as shown in Table 27, and Table 28 indicate that the dual-cured polyurethane hot melt adhesive has an average shear strength of 34.94 and an average peel strength of 1.68 after the multi-quality optimization parameter design using gray correlation. Both qualities are within the 95% confidence interval of the single-quality optimization (shear strength confidence interval: 29.3338~32.3262, peel strength confidence interval: 3.6181~12.7739), which confirms the accuracy and reproducibility of the optimization parameters obtained through gray correlation analysis.
3.3. Comparison with Commercial Hot Melt Adhesives
The optimal parameters for the gray correlation-based multi-quality optimization were polycarbonate polyol, NCO: OH, ratio of 4:1, and photocurable monomer mole ratio of 5. Therefore, the confirmation experiments using this experimental design were compared with the non-optimized hot melt adhesive and commercially available hot melt adhesive in terms of physical properties. The results are shown in Table 29 and Table 30. According to Table 29, the multi-quality optimized hot melt adhesive had peel strengths (1.69 kg/cm) and shear strength (35.62 kg/cm2), which were 7.64 percent and 7.25 percent and better than the unoptimized sample, respectively. The analysis demonstrated that the experimental parameters could be successfully optimized by using multi-quality optimization design. This study required the evaluation with processing temperature, duration, and pressure because seamless bonding and appeared different faults in the fiber, if the temperature is too high. The Table 30 showed that the processing temperatures of the commercial hot melt adhesive and the hot melt adhesive generated through multi-quality optimization were 100°C and 150-170°C, respectively, lowering the softening temperature by 33% to 41%. The hot-pressing pressure for the commercial hot melt adhesive and multi-quality optimization were 15 psi and 40-60 psi, respectively, which was decreased from 63% to 75%. This implies that a design with optimized experimental parameters can efficiently speed up production while decreasing labor and processing costs.
4. Conclusion
In this study, a dual-curing polyurethane hot-melt adhesive was prepared by using end-capping and UV-curing technology and applied to the seamless bonding technology of nylon fiber fabrics. The experimental parameter design was conducted using the L9 orthogonal table in the Taguchi quality engineering method, and multi-quality optimization of experimental parameter planning was sought by gray correlation analysis. The soft chain segment of polyurethane, and the hard segments used to polymerize the polyurethane prepolymer. The FTIR results showed successful termination of the prepolymer's polymerization reaction. The peak energy at 1730 cm−1, indicating that the photopolymerizable monomers effectively bond to the main chain. The APC results showed the termination of hydroxyethyl acrylate in the polymerization reaction. It was also observed that the addition of octyl decyl acrylate and exposure of UV irradiations, the molecular weight increased from 10,000 to 20,000 which indicated the conversion of secondary growth of the molecular chain from photopolymerizable monomers. The TGA results showed that after the molecular weight and main chain grew with the help of octyl decyl acrylate, the thermal decomposition temperature of polyurethane hot melt adhesive also increased due to the addition of double bond functional groups, and the thermal weight loss before 250℃ did not exceed 5%. It was observed that after adding hydroxyethyl acrylate and octyl decyl acrylate to the polyurethane hot melt adhesive, the presence of C=O and N-H functional groups in their molecules may interact with the polar groups of the nylon substrate, thereby enhancing the adhesion between the substrate and the adhesive. The experimental parameters of the polyurethane hot melt adhesive were optimized by employing the Taguchi quality engineering approach and grey relational analysis. The most suitable set of parameters comprised a polycarbonate soft segment, a 4:1 NCO: OH ratio, and a 5-mole addition of photopolymerizable monomer. The in-situ polymerization and two-step polymerization processes were utilized to generate the dual-curing polyurethane hot melt adhesive, which was subsequently utilized to connect nylon fabrics. It had an average shear strength of 34.94 kg/cm2 and a peel strength of 1.68 kg/cm. It also showed higher performance in peel and shear strength tests.
References
- Jana, P. Assembling technologies for functional garments— An overview, 2011.
- Budhe, S.; Banea, M.D.; De Barros, S.; Da Silva, L.F.M. An updated review of adhesively bonded joints in composite materials. Intern. J. Adhes. Adhes., 2017, 72, 30-42. [CrossRef]
- Akindoyo, J.O.; Beg, M.D.; Ghazali, S.; Islam, M.R.; Jeyaratnam, N.; Yuvaraj, A.R. Polyurethane types, synthesis and applications–a review. RSC Advances, 2016, 6(115), 114453-114482.
- Engels, H.W.; Pirkl, H.G.; Albers, R.; Albach, R.W.; Krause, J.; Hoffmann, A.; Dormish, J.; Polyurethane: vielseitige Materialien und nachhaltige Problemlöser für aktuelle Anforderungen. Angew. Chem., 2013, 125(36), 9596-9616. [CrossRef]
- Wongsamut, C.; Suwanpreedee, R.; Manuspiya, H.; Thermoplastic polyurethane-based polycarbonate diol hot melt adhesives: The effect of hard-soft segment ratio on adhesion properties. Intern. J. Adhes. Adhes., 2020, 102, 102677. [CrossRef]
- Costa, V.; Nohales, A.; Félix, P.; Guillem, C.; Gómez, C.M.; Enhanced polyurethanes based on different polycarbonatediols. J. Elastomers Plast., 2013, 45(3), 217-238. [CrossRef]
- Crescentini, T.M.; May, J.C.; McLean, J.A.; Hercules, D.M.; Mass spectrometry of polyurethanes. Polymer, 2019, 181, 121624. [CrossRef]
- Das, A.; Mahanwar, P.; A brief discussion on advances in polyurethane applications. Adv Ind Eng Polym Res., 2020, 3(3), 93-101. [CrossRef]
- Somarathna, H.M.C.; Raman, S.N.; Mohotti, D.; Mutalib, A.A.; Badri, K.H. The use of polyurethane for structural and infrastructural engineering applications: A state-of-the-art review. Constr. and Build. Mater., 2018, 190, 995-1014. [CrossRef]
- Ionescu, M. Chemistry and Technology of polyols for polyurethanes. I Smithers Rapra Publishing, 2005.
- Moore, M.G.; Swift, T.K.; Sanchez, E.; Rose-Glowacki, H. The Economic Benefits of the US Polyurethanes Industry, 2014.
- Chew, M.Y.L. Retention of movement capability of polyurethane sealants in the tropics. Constr. Build. Mater., 2004, 18(6), 455-459. [CrossRef]
- Haber, Z.B.; Mackie, K.R.; Zhao, L. Mechanical and environmental loading of concrete beams strengthened with epoxy and polyurethane matrix carbon fiber laminates. Constr. Build. Mater., 2012, 26(1), 604-612. [CrossRef]
- Strobech, C. Polyurethane adhesives, Constr. Build. Mater., 1990, 4(4), 214-217. [CrossRef]
- Asthana, K.K.; Lakhani, R.; Aggarwal, L.K. Expanded polystyrene composite door shutters—an alternative to wooden door shutters. Constr. Build. Mater., 1996, 10(6), 475-480. [CrossRef]
- Viljanmaa, M.; Södergård, A.; Törmälä, P. Adhesion properties of lactic acid based hot melt adhesives and their storage stability in different packaging applications. Int. J. Adhes. Adhes., 2002, 22(6), 447-457. [CrossRef]
- Engels, H.W.; Pirkl, H.G.; Albers, R.; Albach, R.W.; Krause, J.; Hoffmann, A.; Dormish, J. Polyurethane: vielseitige Materialien und nachhaltige Problemlöser für aktuelle Anforderungen. Angew. Chem., 2013, 125(36), 9596-9616. [CrossRef]
- Martin, D.J.; Osman, A.F.; Andriani, Y.; Edwards, G.A. Thermoplastic polyurethane (TPU)-based polymer nanocomposites. Adv. Polym. Technol., 2012, 321-350. [CrossRef]
- Prisacariu, C. Polyurethane elastomers: from morphology to mechanical aspects. Springer Science & Business Media. 2011. [CrossRef]
- Krol, P. Synthesis methods, chemical structures and phase structures of linear polyurethanes. Properties and applications of linear polyurethanes in polyurethane elastomers, copolymers and ionomers. Prog. Polym. Sci., 2007, 52(6), 915-1015. [CrossRef]
- Chattopadhyay, D.K.; Raju, K.V.S.N. Structural engineering of polyurethane coatings for high performance applications. Prog. Polym. Sci., 2007, 32(3), 352-418. [CrossRef]
- Akindoyo, J.O.; Beg, M.; Ghazali, S.; Islam, M.R.; Jeyaratnam, N.; Yuvaraj, A.R. Polyurethane types, synthesis and applications–a review. Rsc Advances, 2016, 6(115), 114453-114482.
- Heath, R. Isocyanate-based polymers: polyurethanes, polyureas, polyisocyanurates, and their copolymers. In Brydson's Plastics Materials, 2017, 799-835. [CrossRef]
- Somarathna, H.M.C.; Raman, S.N.; Mohotti, D.; Mutalib, A.A.; Badri, K.H. The use of polyurethane for structural and infrastructural engineering applications: A state-of-the-art review. Constr. Build. Mater., 2018, 190, 995-1014. [CrossRef]
- Frick, A.; Rochman, A.; Characterization of TPU-elastomers by thermal analysis (DSC). Polymer Testing, 2004, 23(4), 413-417. [CrossRef]
- Wongsamut, C.; Suwanpreedee, R.; and Manuspiya, H.; Thermoplastic polyurethane-based polycarbonate diol hot melt adhesives: The effect of hard-soft segment ratio on adhesion properties. Int. J. Adhes Adhes., 2020, 102, 102677. [CrossRef]
- Costa, V.; Nohales, A.; Félix, P.; Guillem, C.; Gómez, C.M. ; Enhanced polyurethanes based on different polycarbonatediols. Journal of Elastomers Plastics, 2013, 45(3), 217-238. [CrossRef]
- Crescentini, T.M.; May, J.C.; McLean, J.A.; Hercules, D.M. ; Mass spectrometry of polyurethanes. Polymer, 2019, 181, 121624. [CrossRef]
- Kuo, C.F.J.; Chen, J.B.; Lin, P.H.; and Yen, H.T. ; Hot-melt pressure-sensitive adhesive for seamless bonding of nylon fabric part I: effect of a functional monomer. Text. Res. J., 2019, 89(6), 926-935. [CrossRef]
- Yang, D. , and Chen, X. Multi-layer pattern creation for seamless front female body armor panel using angle-interlock woven fabrics. Textile Research Journal, 2017, 87(3), 381-386. [CrossRef]
- Asensio, M.; Costa, V.; Nohales, A.; Bianchi, O.; Gómez, C.M. Tunable structure and properties of segmented thermoplastic polyurethanes as a function of flexible segment. Polymers, 2019,11(12), 1910. [CrossRef]
- Somarathna, H.M.C.; Raman, S.N.; Mohotti, D.; Mutalib, A.A.; Badri, K.H. The use of polyurethane for structural and infrastructural engineering applications: A state-of-the-art review. Constr. Build. Mater., 2018, 190, 995-1014. [CrossRef]
- Naveed, A. ; Kuo, C-F.J.; Mujahid, M. Synthesis of novel CuNb2O6/g-C3N4 binary photocatalyst towards efficient visible light reduction of Cr (VI) and dyes degradation for environmental remediation, Chemosphere, 2022, 298,134153. [CrossRef]
- Gogoi, R.; Alam, M.S.; Khandal, R.K. ; Effect of increasing NCO/OH molar ratio on the physicomechanical and thermal properties of isocyanate terminated polyurethane prepolymer. IJBAS, 2014, 3(2), 118. [CrossRef]
- Somani, K.P.; Kansara, S.S.; Patel, N.K.; Rakshit, A.K. ; Castor oil based polyurethane adhesives for wood-to-wood bonding. Int. J. Adhes Adhes., 2003, 23(4), 269-275. [CrossRef]
- Asensio, M.; Costa, V.; Nohales, A.; Bianchi, O.; Gómez, C.M. ; Tunable structure and properties of segmented thermoplastic polyurethanes as a function of flexible segment. Polymers, 2019, 11(12), 1910. [CrossRef]
- Špírková, M.; Poręba, R.; Pavličević, J.; Kobera, L.; Baldrian, J.; Pekárek, M. Aliphatic polycarbonate-based polyurethane elastomers and nanocomposites. I. The influence of hard-segment content and macrodiol-constitution on bottom-up self-assembly. J. Appl. Polym. Sci., 2012, 126(3), 1016-1030. [CrossRef]
- Pavličević, J.; Špírková, M.; Jovičić, M.; Bera, O.; Poręba, R.; Budinski, S.J. ; The structure and thermal properties of novel polyurethane/organoclay nanocomposites obtained by pre-polymerization. Compos. B: Eng., 2013, 45(1), 232-238. [CrossRef]
- Kojio, K. , Furukawa, M., Motokucho, S., Shimada, M., Sakai, M. Structure− mechanical property relationships for poly (carbonate urethane) elastomers with novel soft segments. Macromolecules, 2009, 42(21), 8322-8327. [CrossRef]
- Pavličević, J.; Špírková, M.; Sinadinović, F.S.; Budinski, S.J.; Govedarica, O.; Janković, M. ; The influence of organoclays on the morphology, phase separation and thermal properties of polycarbonate-based polyurethane hybrid materials. Maced. J. Chem. Chem, 2013, 32(1), 151-161. [CrossRef]
- Eceiza, A.; Larranaga, M.; Dela, C.K.; Kortaberria, G.; Marieta, C.; Corcuera, M.A.; Mondragon, I. ; Structure–property relationships of thermoplastic polyurethane elastomers based on polycarbonate diols. Journal of Applied Polymer Science, 2008, 108(5), 3092-3103. [CrossRef]
- Kultys, A.; Rogulska, M.; Głuchowska, H. ; The effect of soft-segment structure on the properties of novel thermoplastic polyurethane elastomers based on an unconventional chain extender. Polymer International, 2011, 60(4), 652-659. [CrossRef]
- Kultys, A.; Rogulska, M.; Pikus, S.; Skrzypiec, K. ; The synthesis and characterization of new thermoplastic poly (carbonate-urethane) elastomers derived from HDI and aliphatic–aromatic chain extenders. Eur. Polym. J., 2009, 45(9), 2629-2643. [CrossRef]
- Špírková, M., Pavličević, J., Strachota, A., Poreba, R., Bera, O., Kaprálková, L., Budinski, S.J. Novel polycarbonate-based polyurethane elastomers: Composition–property relationship. Eur. Polym. J., 2011, 47(5), 959-972. [CrossRef]
- Naveed, A.; Kuo, C-F. J.; Mujahid, M.; Hussain, K, H.; Chen, K-H.; Improved photocatalytic activity of novel NiAl2O4/g-C3N4 binary composite for photodegradation of 2,4-dinitrophenol and CO2 reduction via gas phase adsorption. Mater. Today Phys.., 2023, 31,100965. [CrossRef]
- Cakić, S.M.; Špírková, M.; Ristić, I.S.; B, K.; Milena, M.; Poręba, R. ; The waterborne polyurethane dispersions based on polycarbonate diol: effect of ionic content. Mater. Chem. Phys., 2013, 138(1), 277-285. [CrossRef]
- Engels, H.W.; Pirkl, H.G.; Albers, R.; Albach, R.W.; Krause, J.; Hoffmann, A.; Dormish, J. ; Polyurethane: vielseitige Materialien und nachhaltige Problemlöser für aktuelle Anforderungen. Angewandte Chemie, 2013, 125(36), 9596-9616. [CrossRef]
- Kuo, C-F J.; Naveed, A.; Lin, S.-Y., Dewangga, G.R.S.; Dong, M-Y.; Synthesis and characteristic applications of silicon resins for the modifying agent in heat conduction. Text. Res. J., 2022, (92), 5–6. [CrossRef]
- Warga, C.M. ; C-C Huang.; Naveed, A.; Dewangga, G.R.S.; Kuo, C-F J.; Hybrid sol-gel-derived method for the synthesis of silicon rubber composites with hBN for characteristic applications in elastomeric thermal pads, Text. Res. J., 2022, 92(11–12). [CrossRef]
- Howard, G.T. Polyurethane biodegradation in Microbial Degradation of Xenobiotics, 2012, 371-394. [CrossRef]
Figure 1.
Synthesis of polyurethane hot melt adhesive (a) combination of diisocyanate and polyol (b) combination of polyurethane prepolymer end-capping agent.
Figure 1.
Synthesis of polyurethane hot melt adhesive (a) combination of diisocyanate and polyol (b) combination of polyurethane prepolymer end-capping agent.
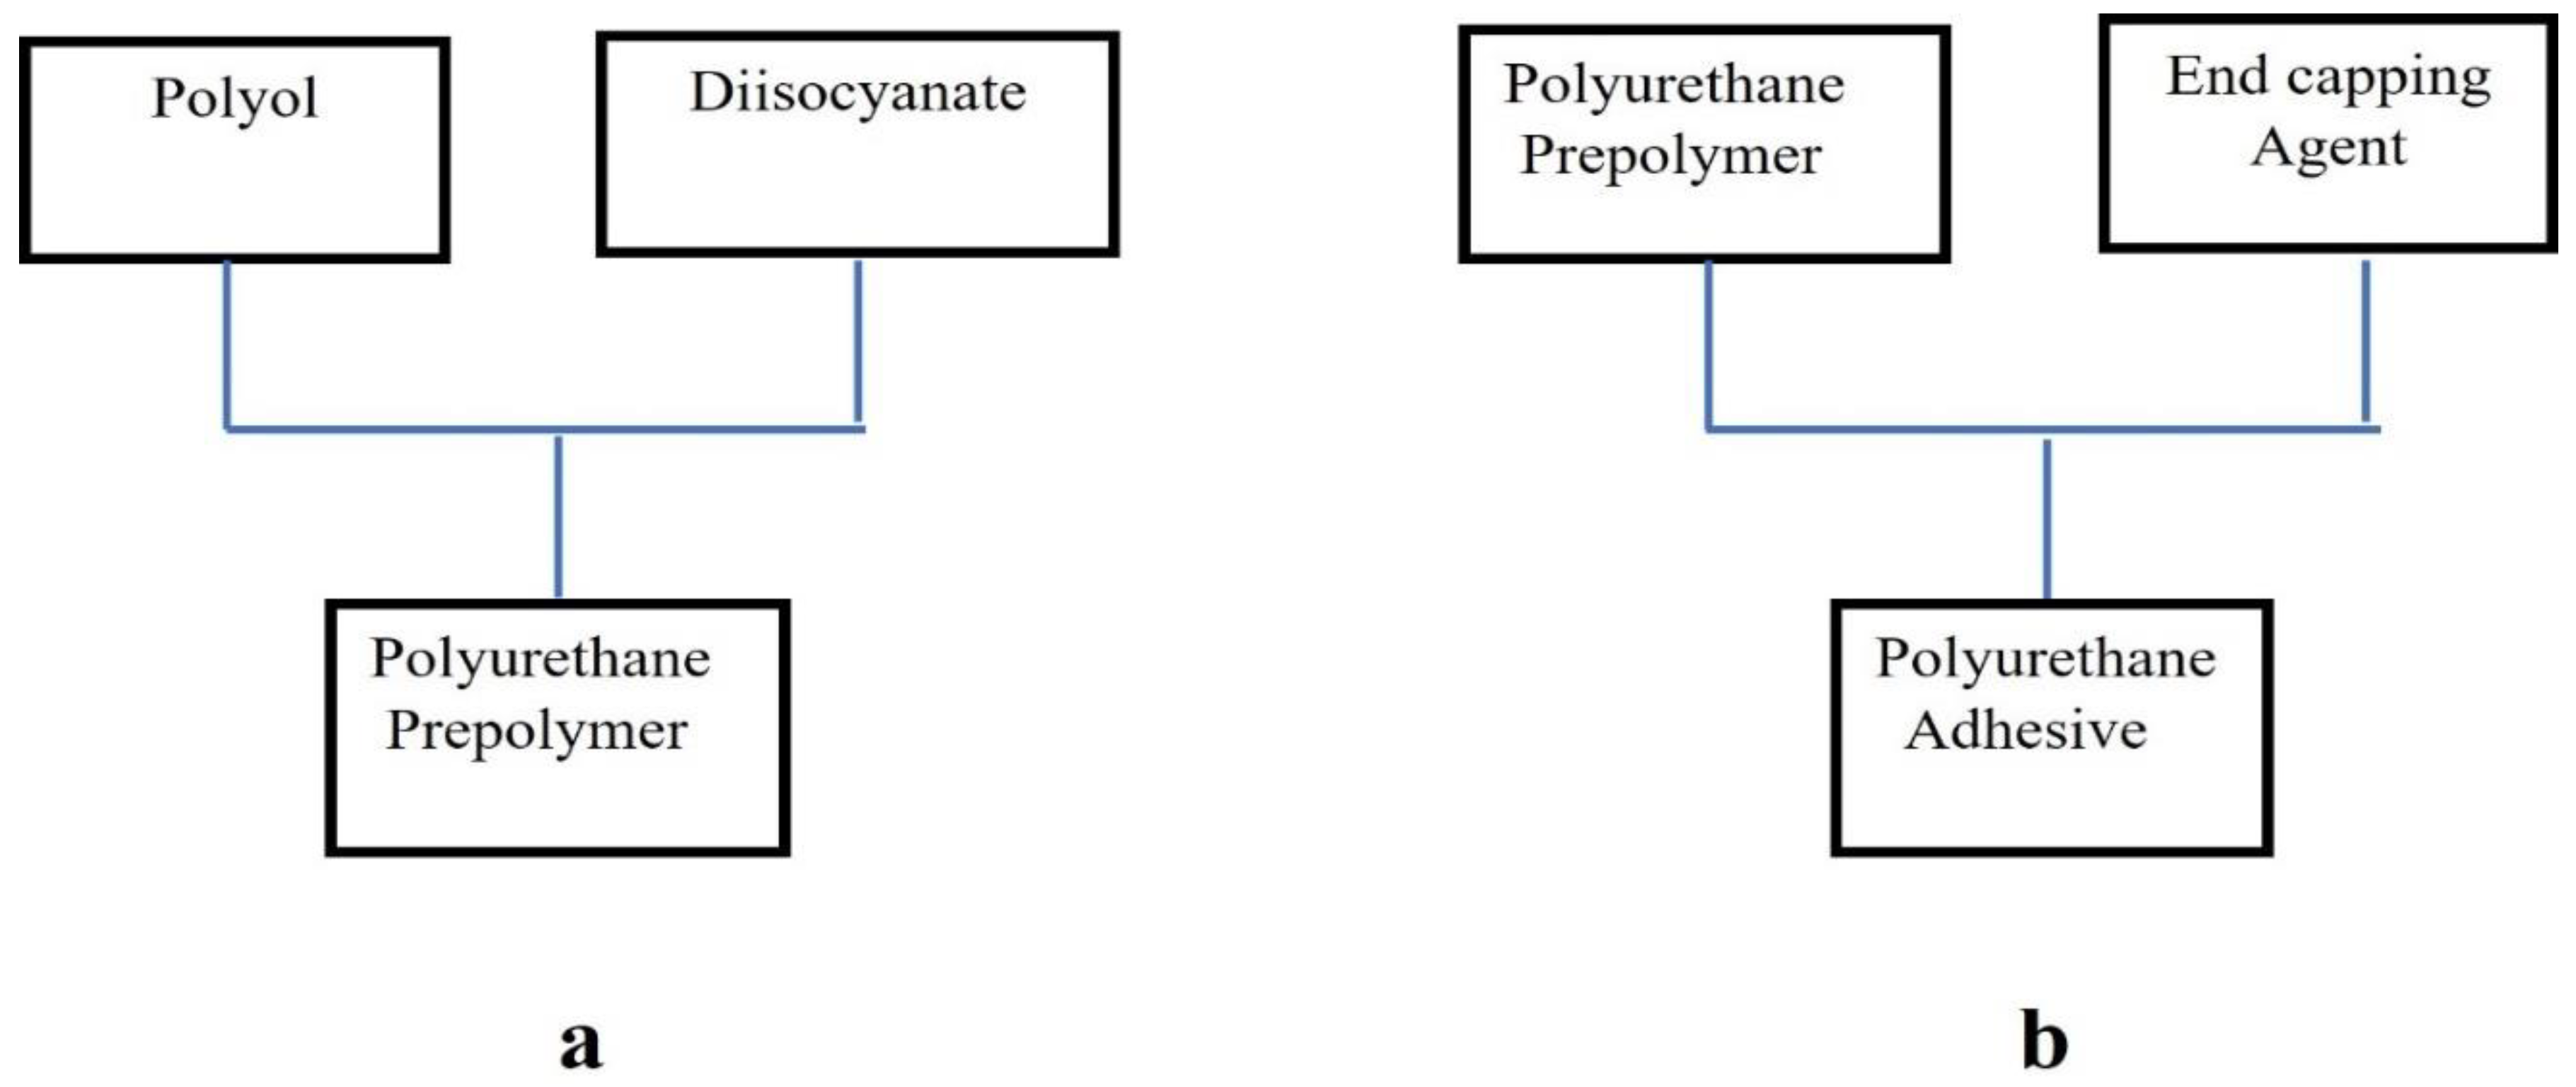
Figure 2.
Experimental flowchart of polyurethane prepolymer synthesis and cured dual-curing polyurethane hot-melt adhesive.
Figure 2.
Experimental flowchart of polyurethane prepolymer synthesis and cured dual-curing polyurethane hot-melt adhesive.
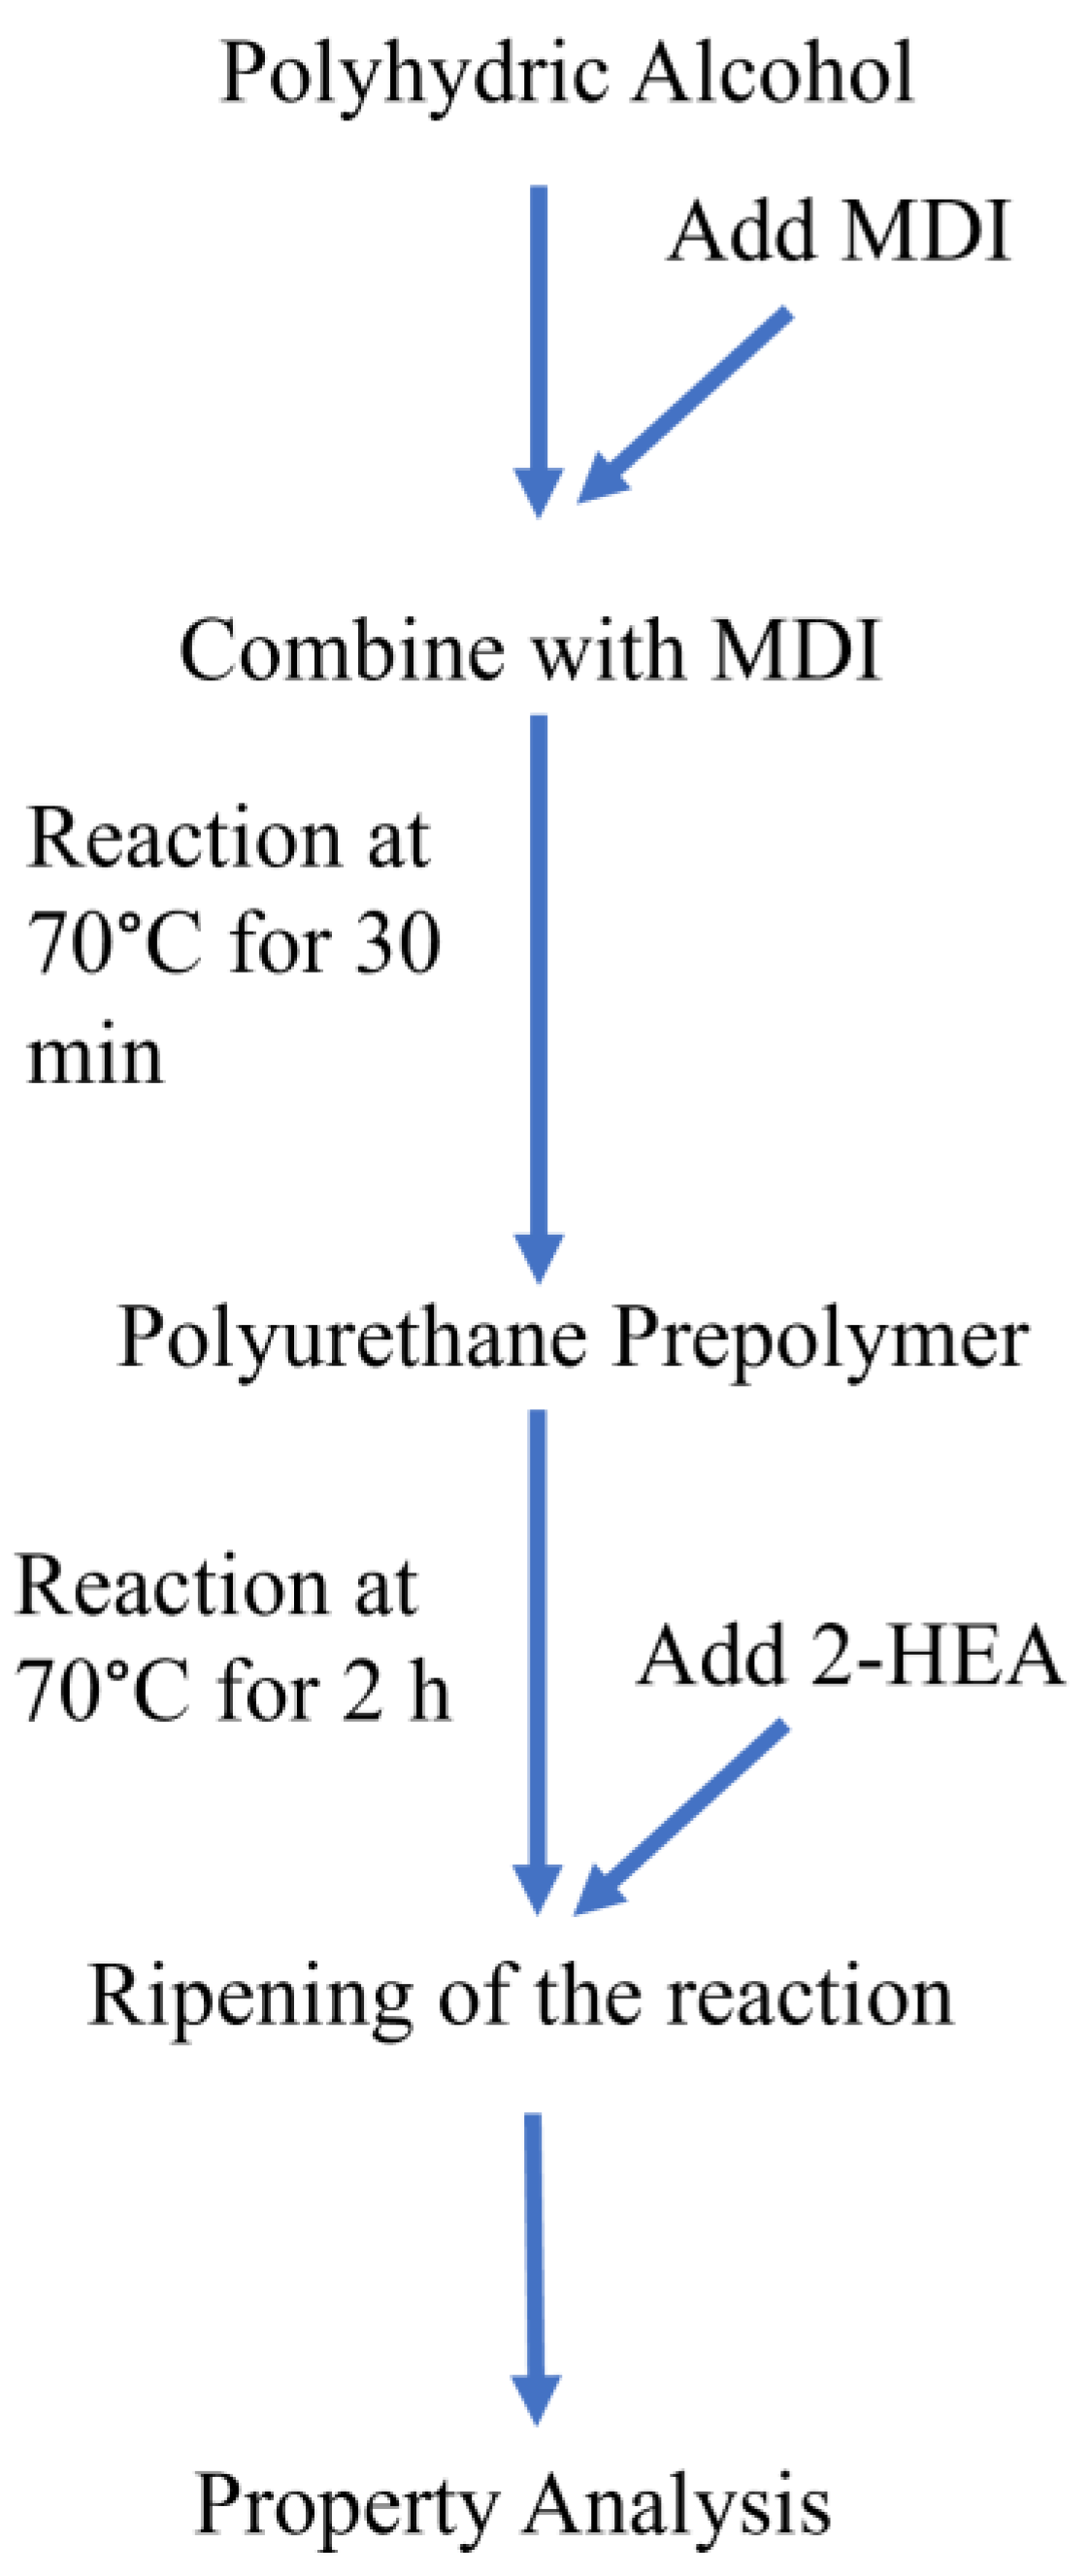
Figure 3.
Chemical reaction of synthesis of polyurethane hot-melt adhesive (a) Reaction synthesis of NCO-terminated PU prepolymer (b) Reaction synthesis of thermoplastic polyurethane hot melt adhesive (c) Reaction synthesis of dual-cure polyurethane hot melt adhesive.
Figure 3.
Chemical reaction of synthesis of polyurethane hot-melt adhesive (a) Reaction synthesis of NCO-terminated PU prepolymer (b) Reaction synthesis of thermoplastic polyurethane hot melt adhesive (c) Reaction synthesis of dual-cure polyurethane hot melt adhesive.
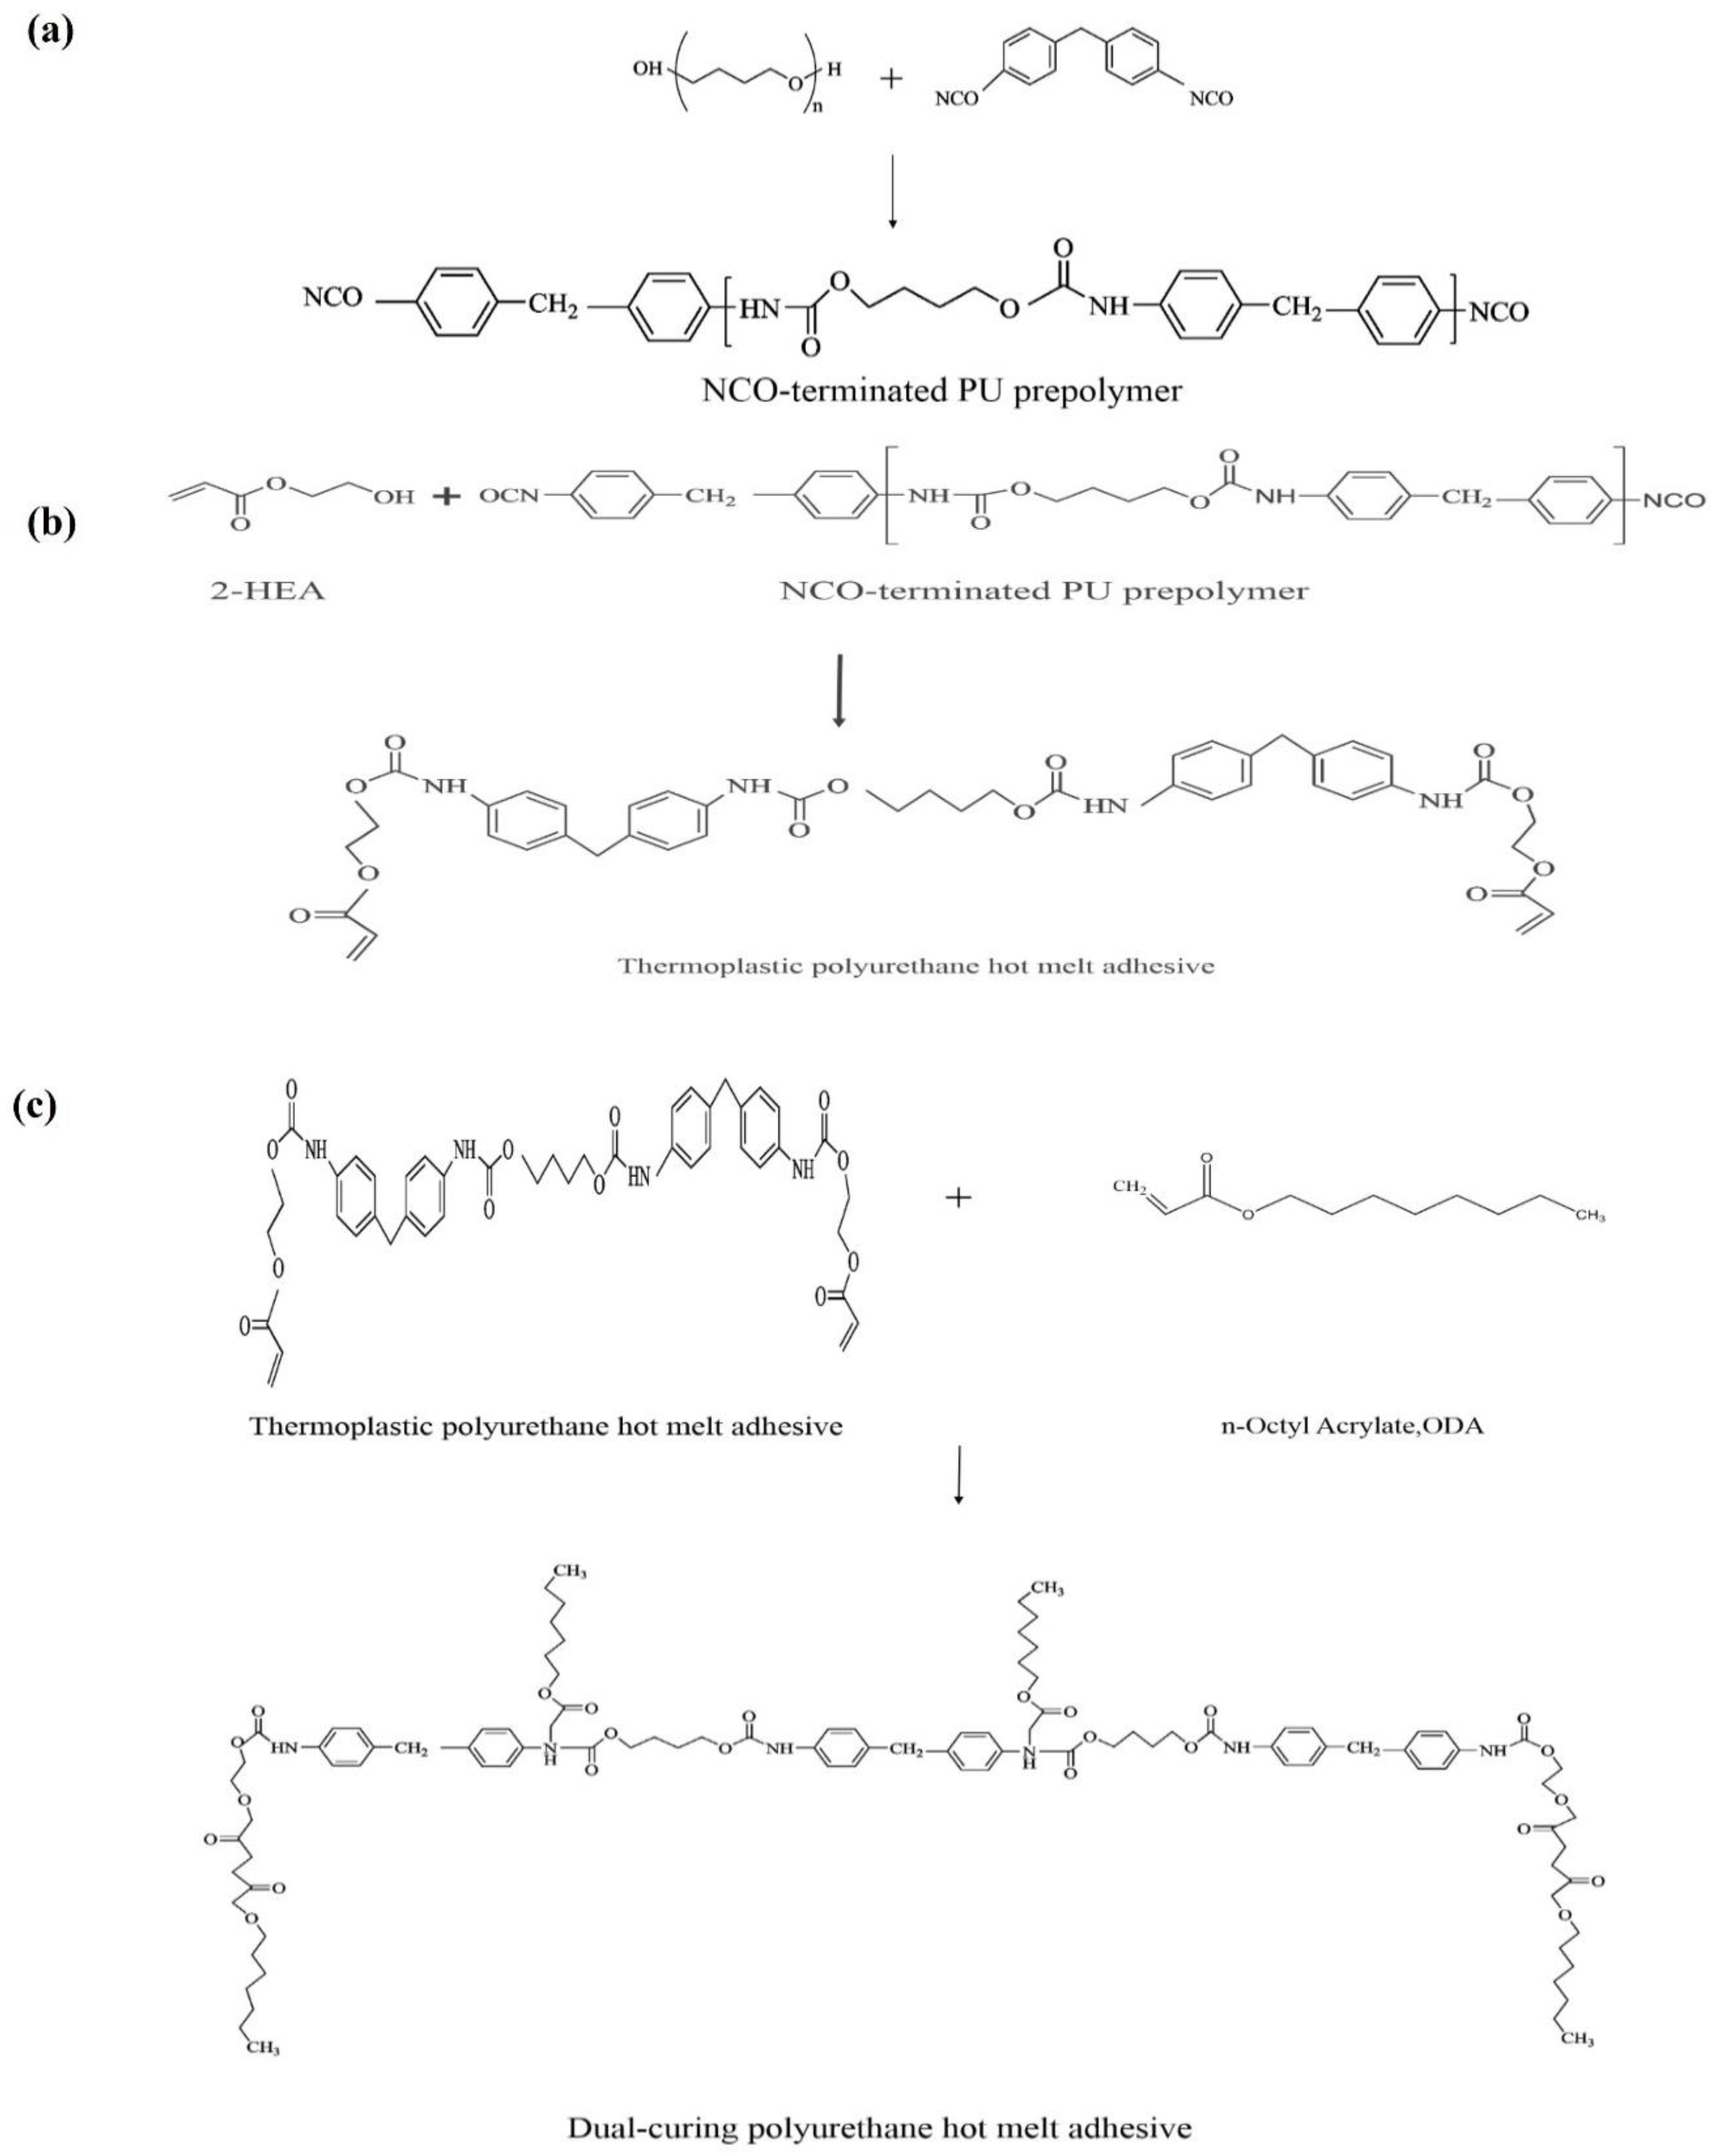
Figure 4.
Quality Loss function of STB, LTB, and NTB characteristic.
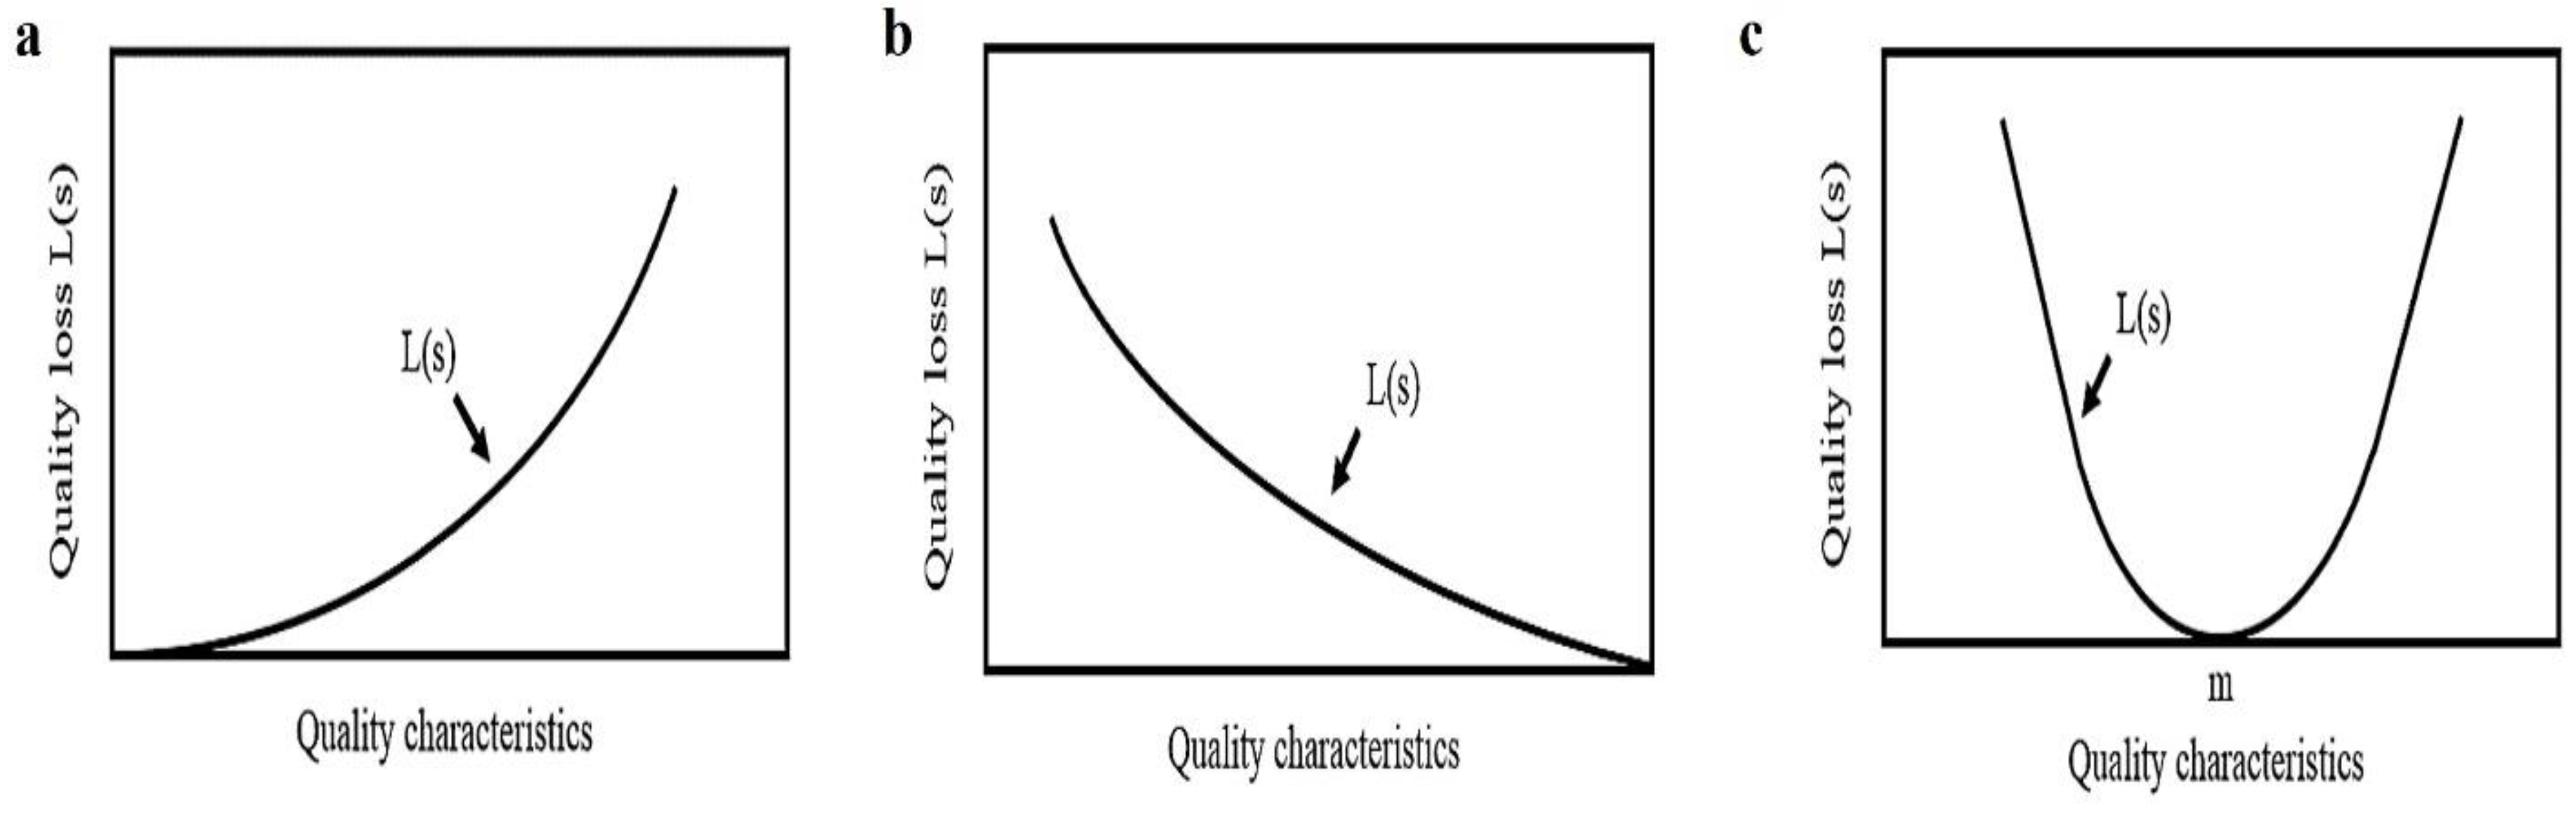
Figure 5.
shows the FTIR spectra of dual-cure polyurethane prepared using (a) PTMG polyol (b) PCL diol and (c) PHCD polyol.
Figure 5.
shows the FTIR spectra of dual-cure polyurethane prepared using (a) PTMG polyol (b) PCL diol and (c) PHCD polyol.
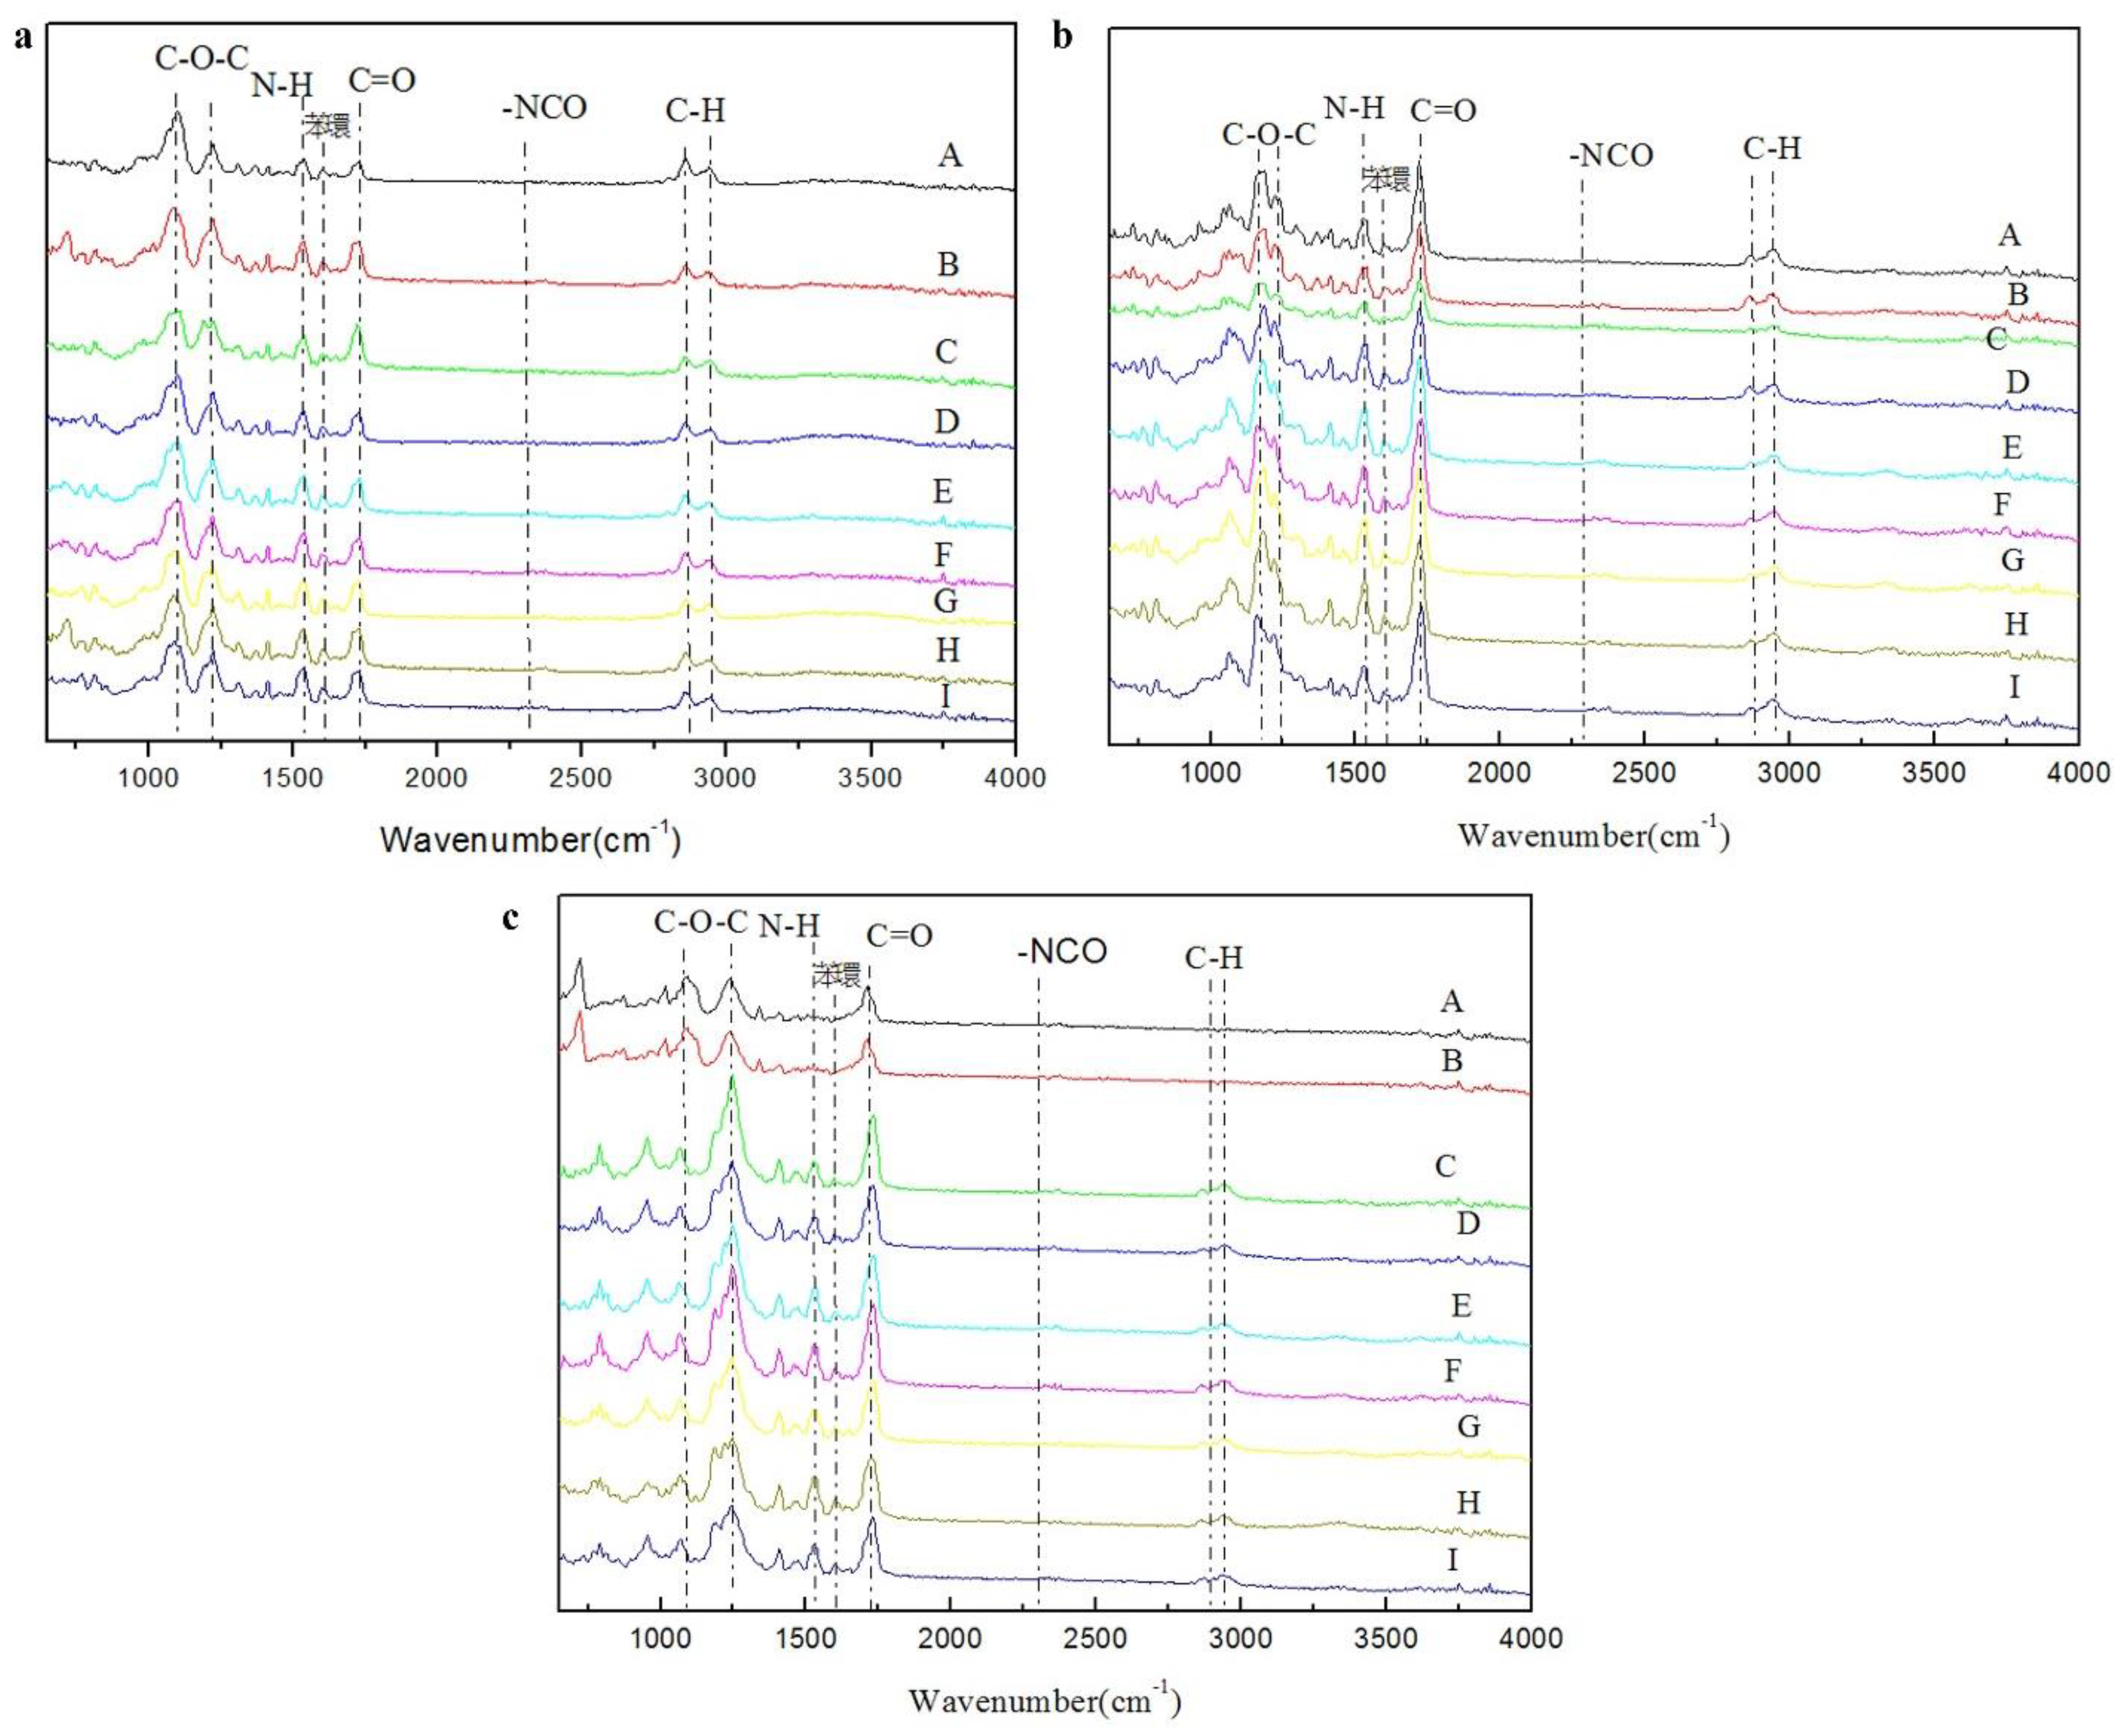
Figure 6.
TGA curves of polyurethane hot melt adhesives with the (a) same PTMG polyol and NCO:OH ratio (b) same PHCD polyol and ODA at different molar ratios and (c) same NCO:OH ratio and different ODA contents.
Figure 6.
TGA curves of polyurethane hot melt adhesives with the (a) same PTMG polyol and NCO:OH ratio (b) same PHCD polyol and ODA at different molar ratios and (c) same NCO:OH ratio and different ODA contents.
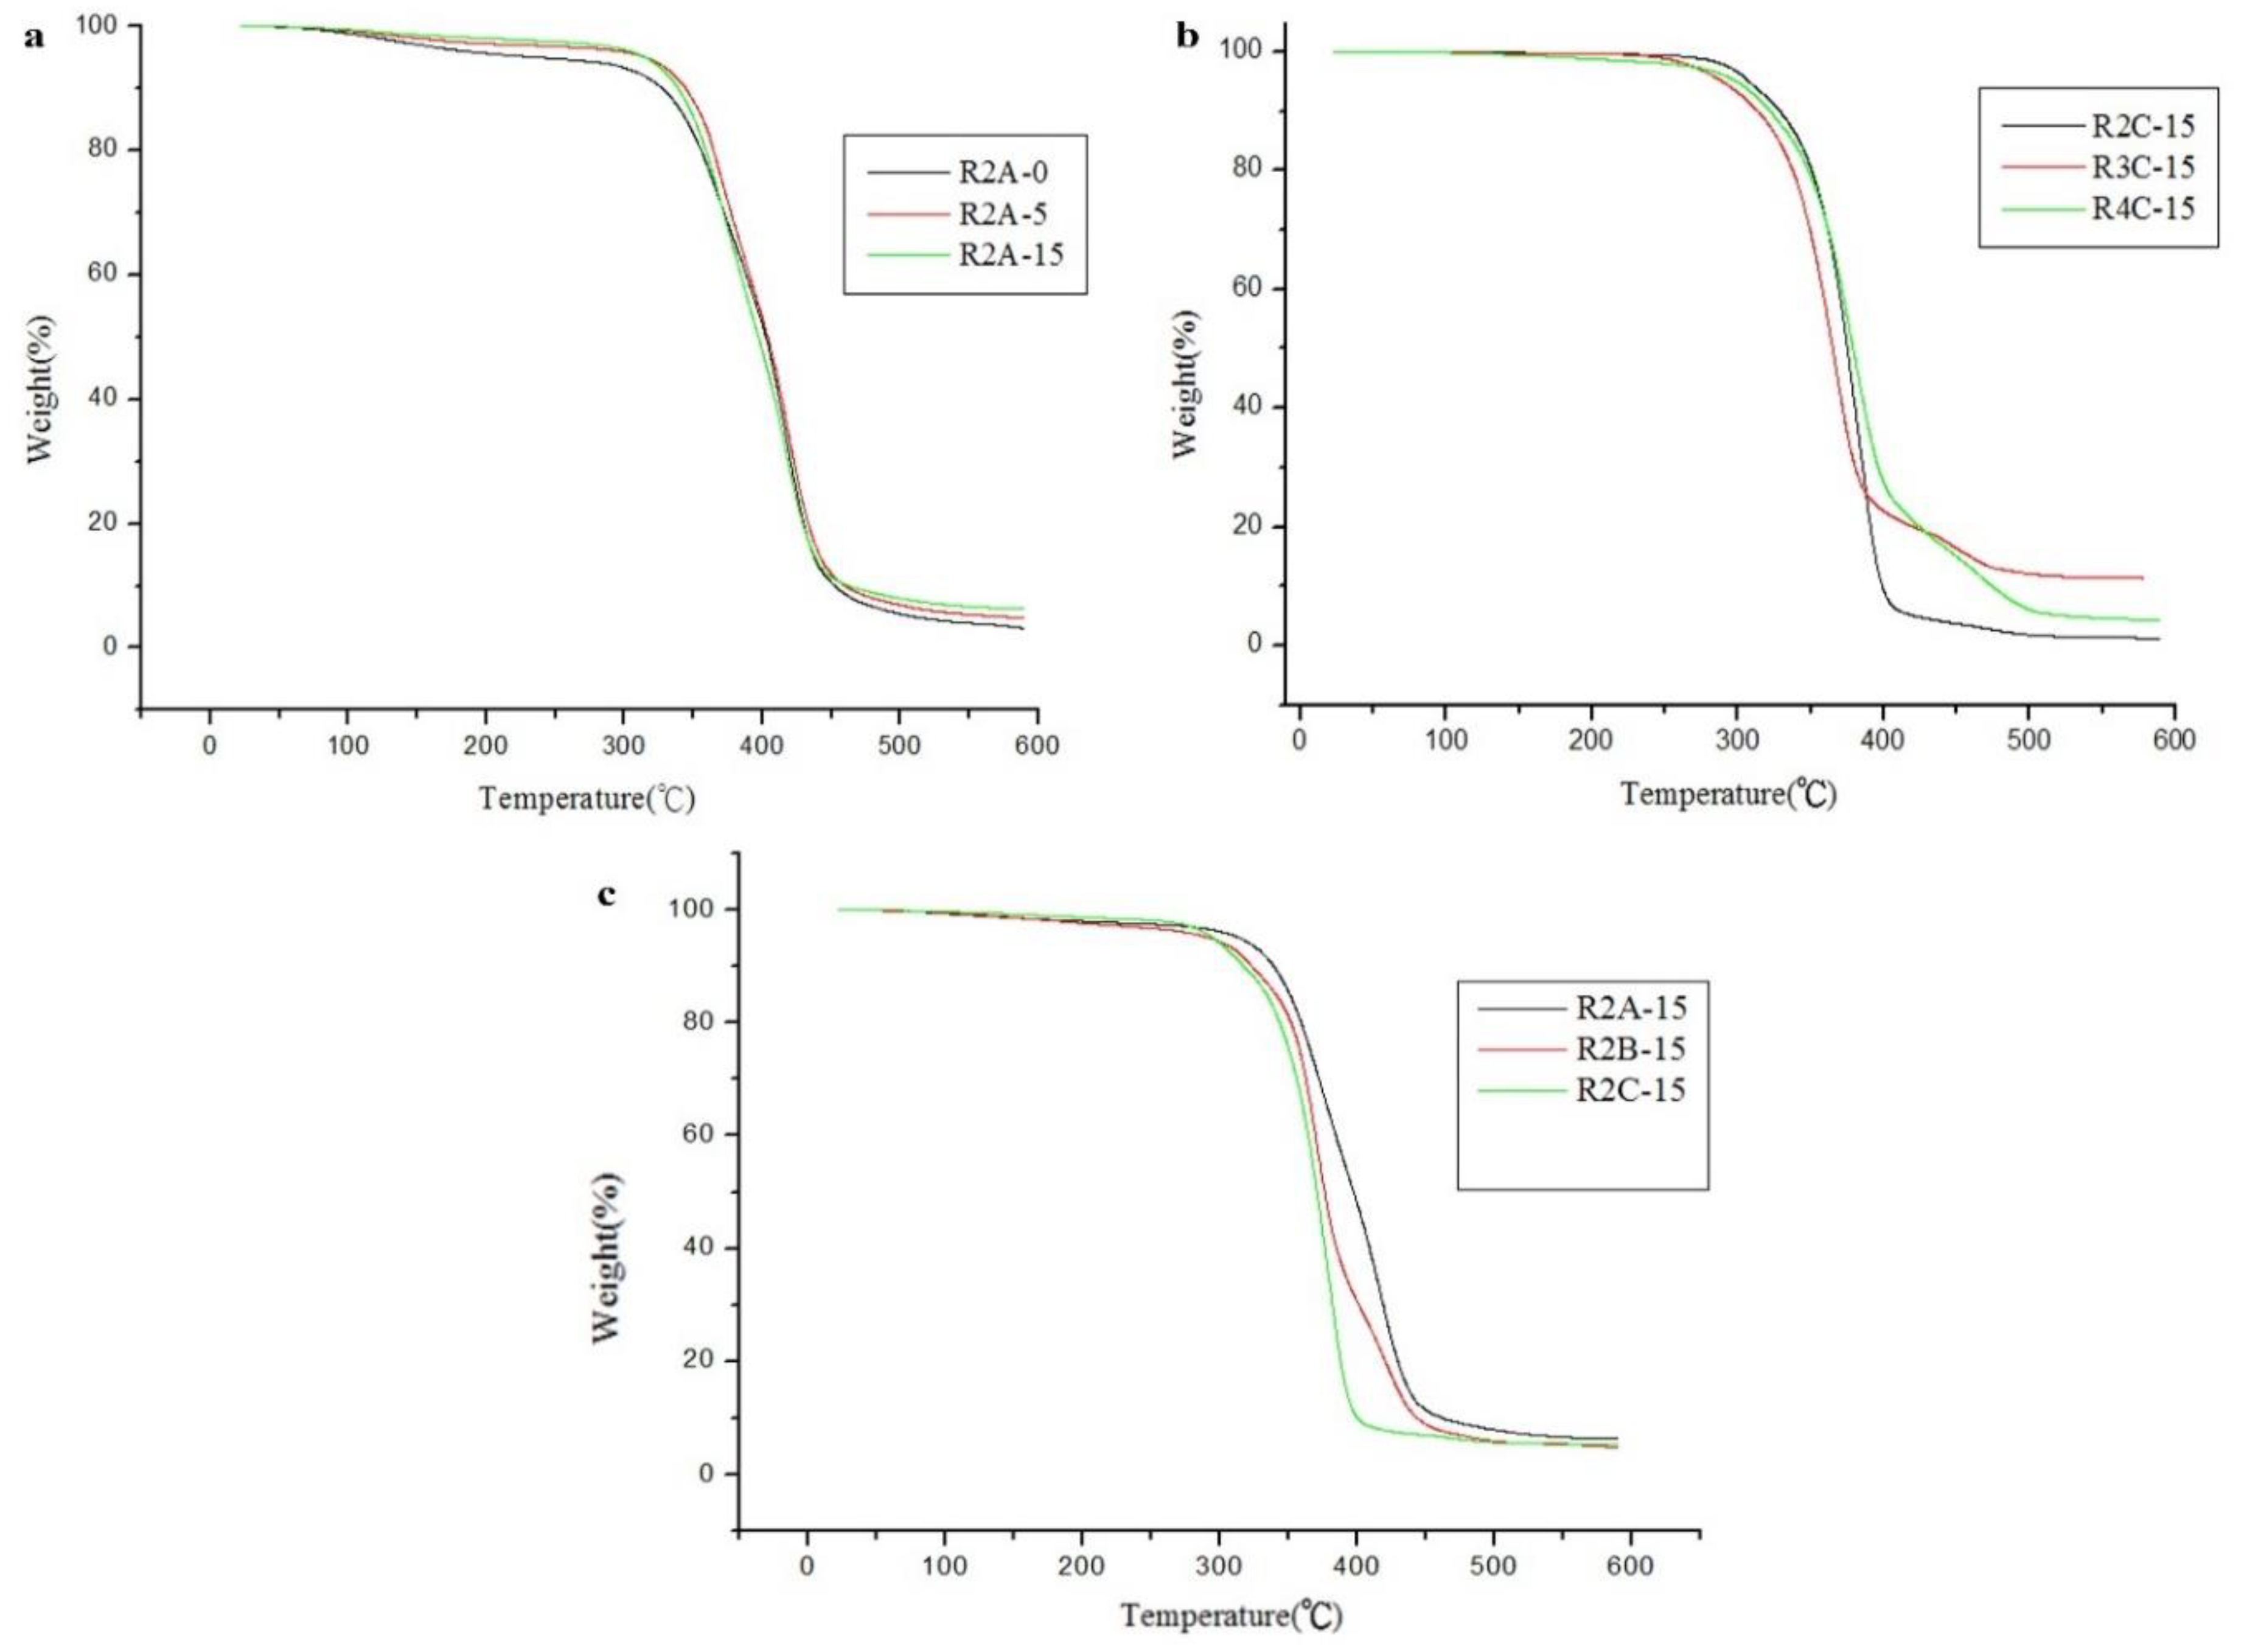
Figure 7.
Moisture content of (a) PTMG, (b) PCL and (c) PHCD at different drying times.
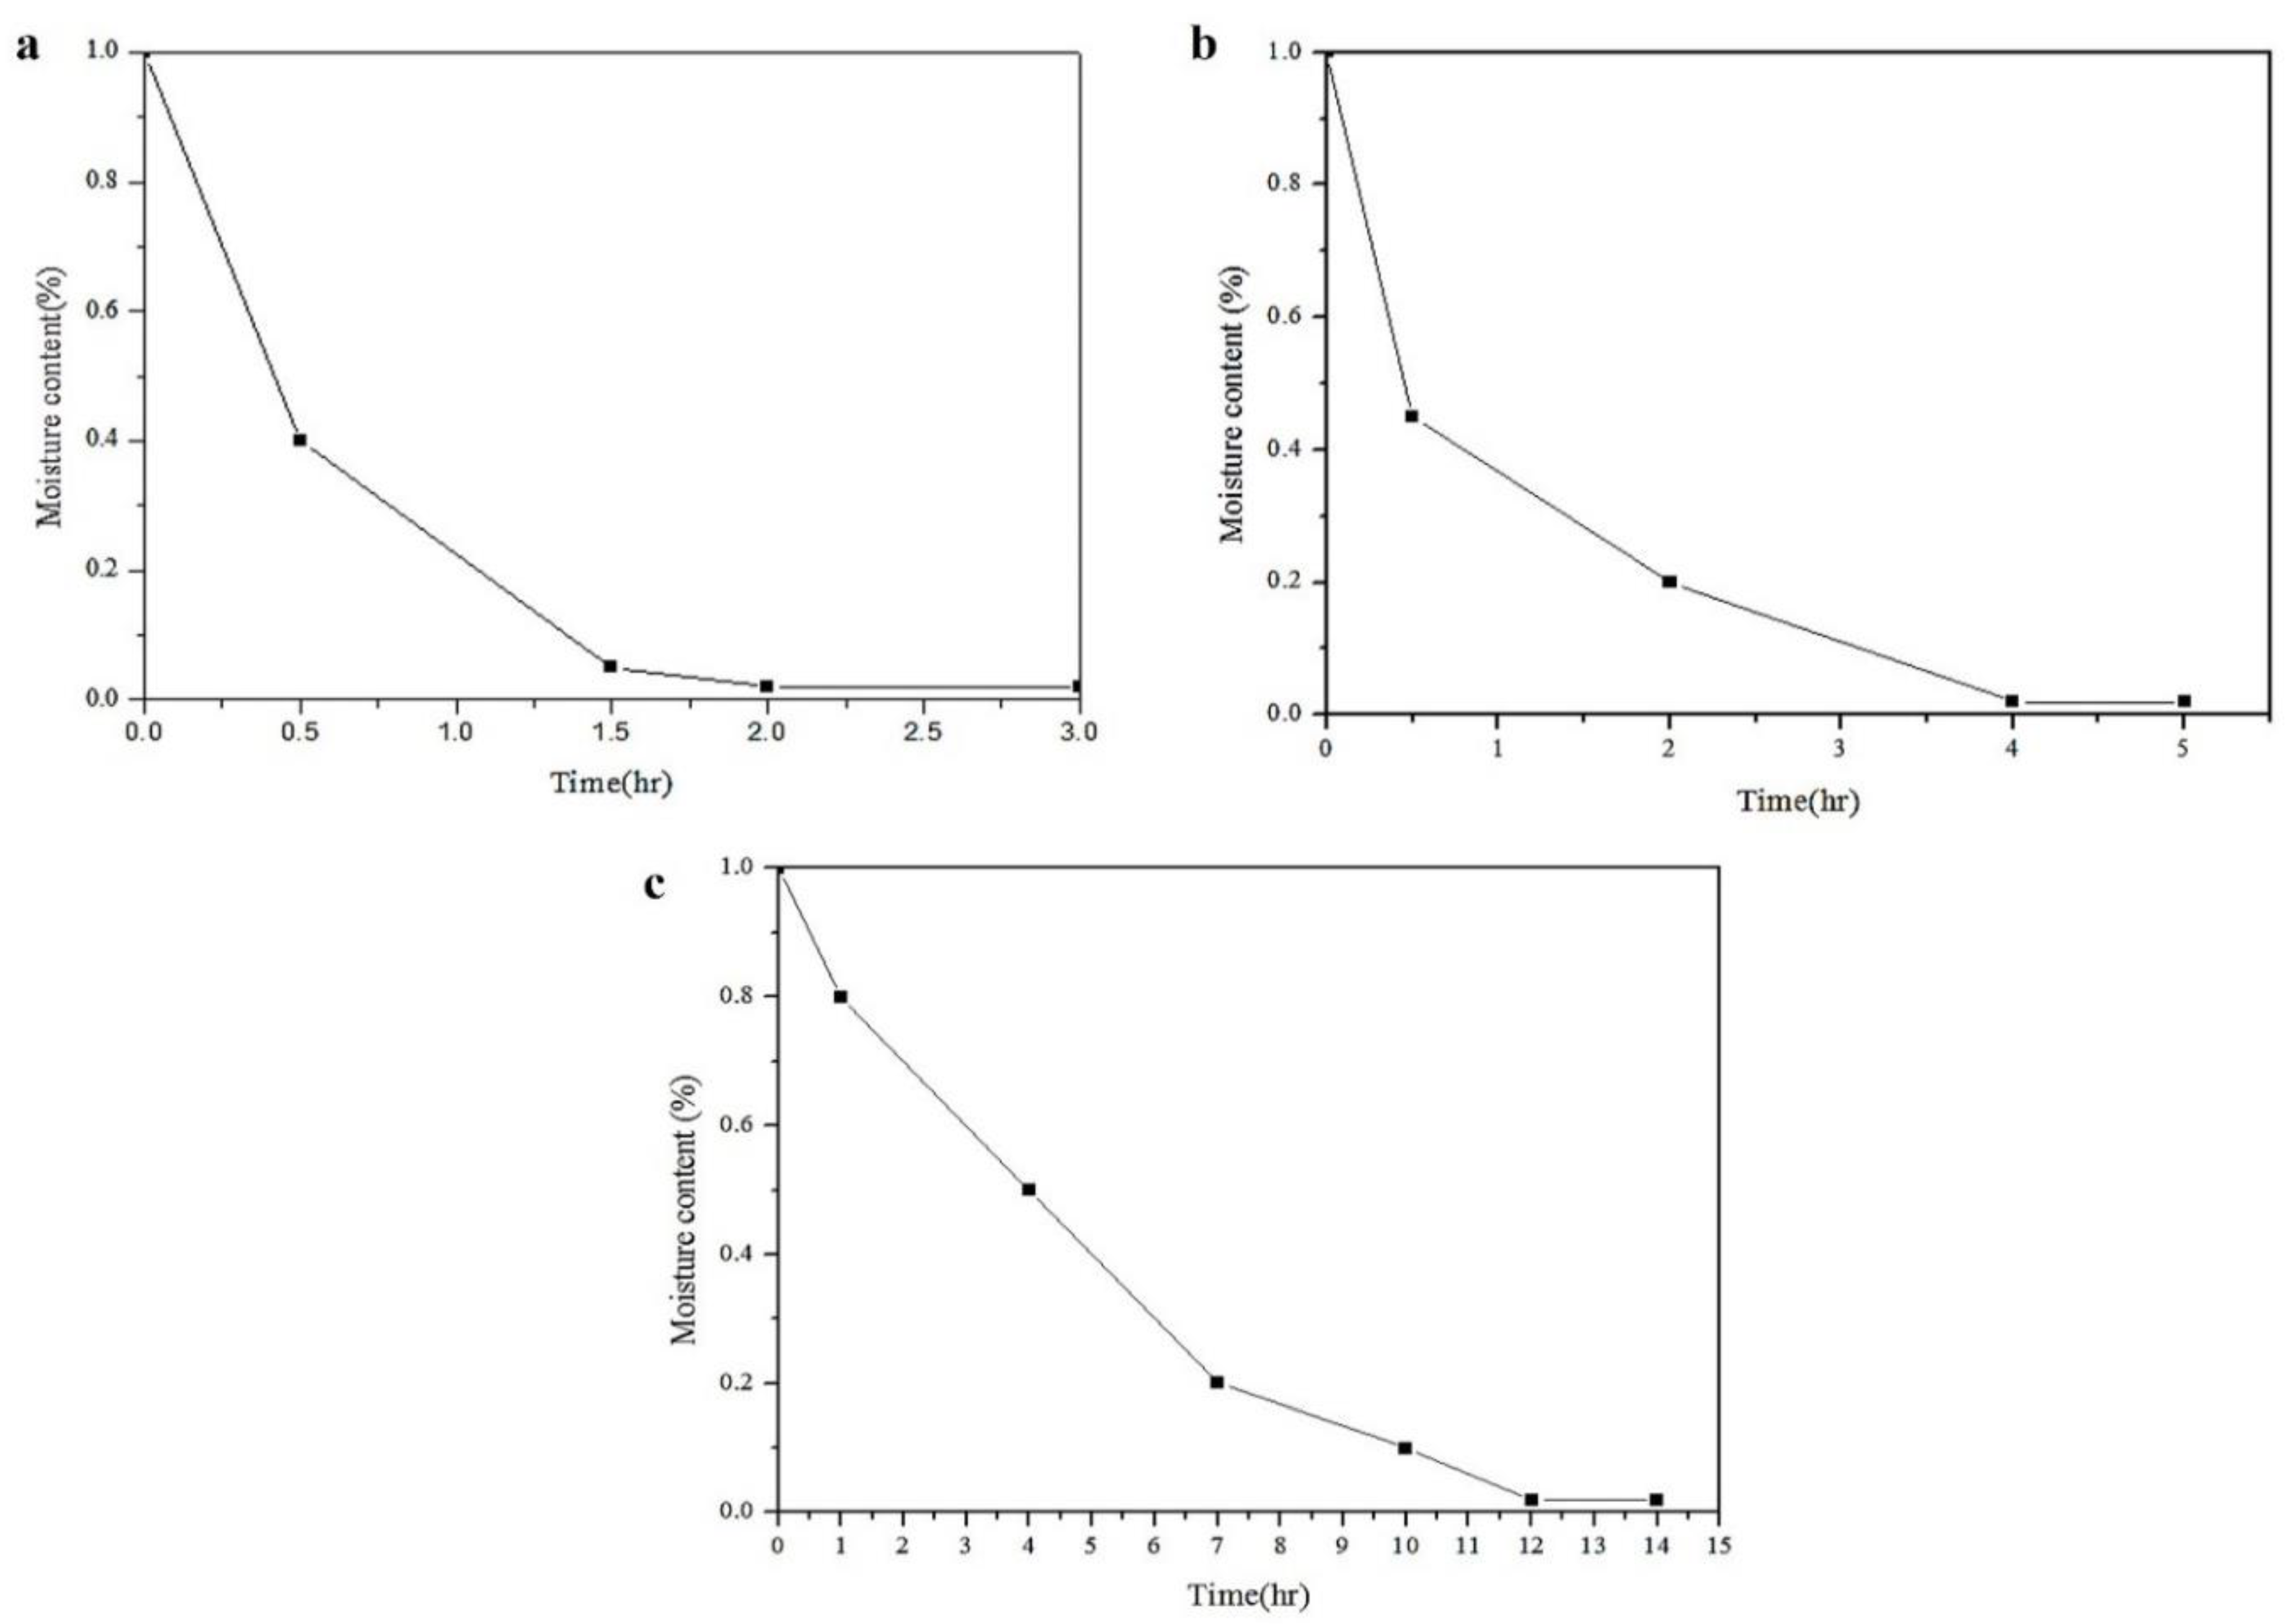
Figure 8.
Factor response graph for shear strength of dual-cure polyurethane hot melt adhesive.
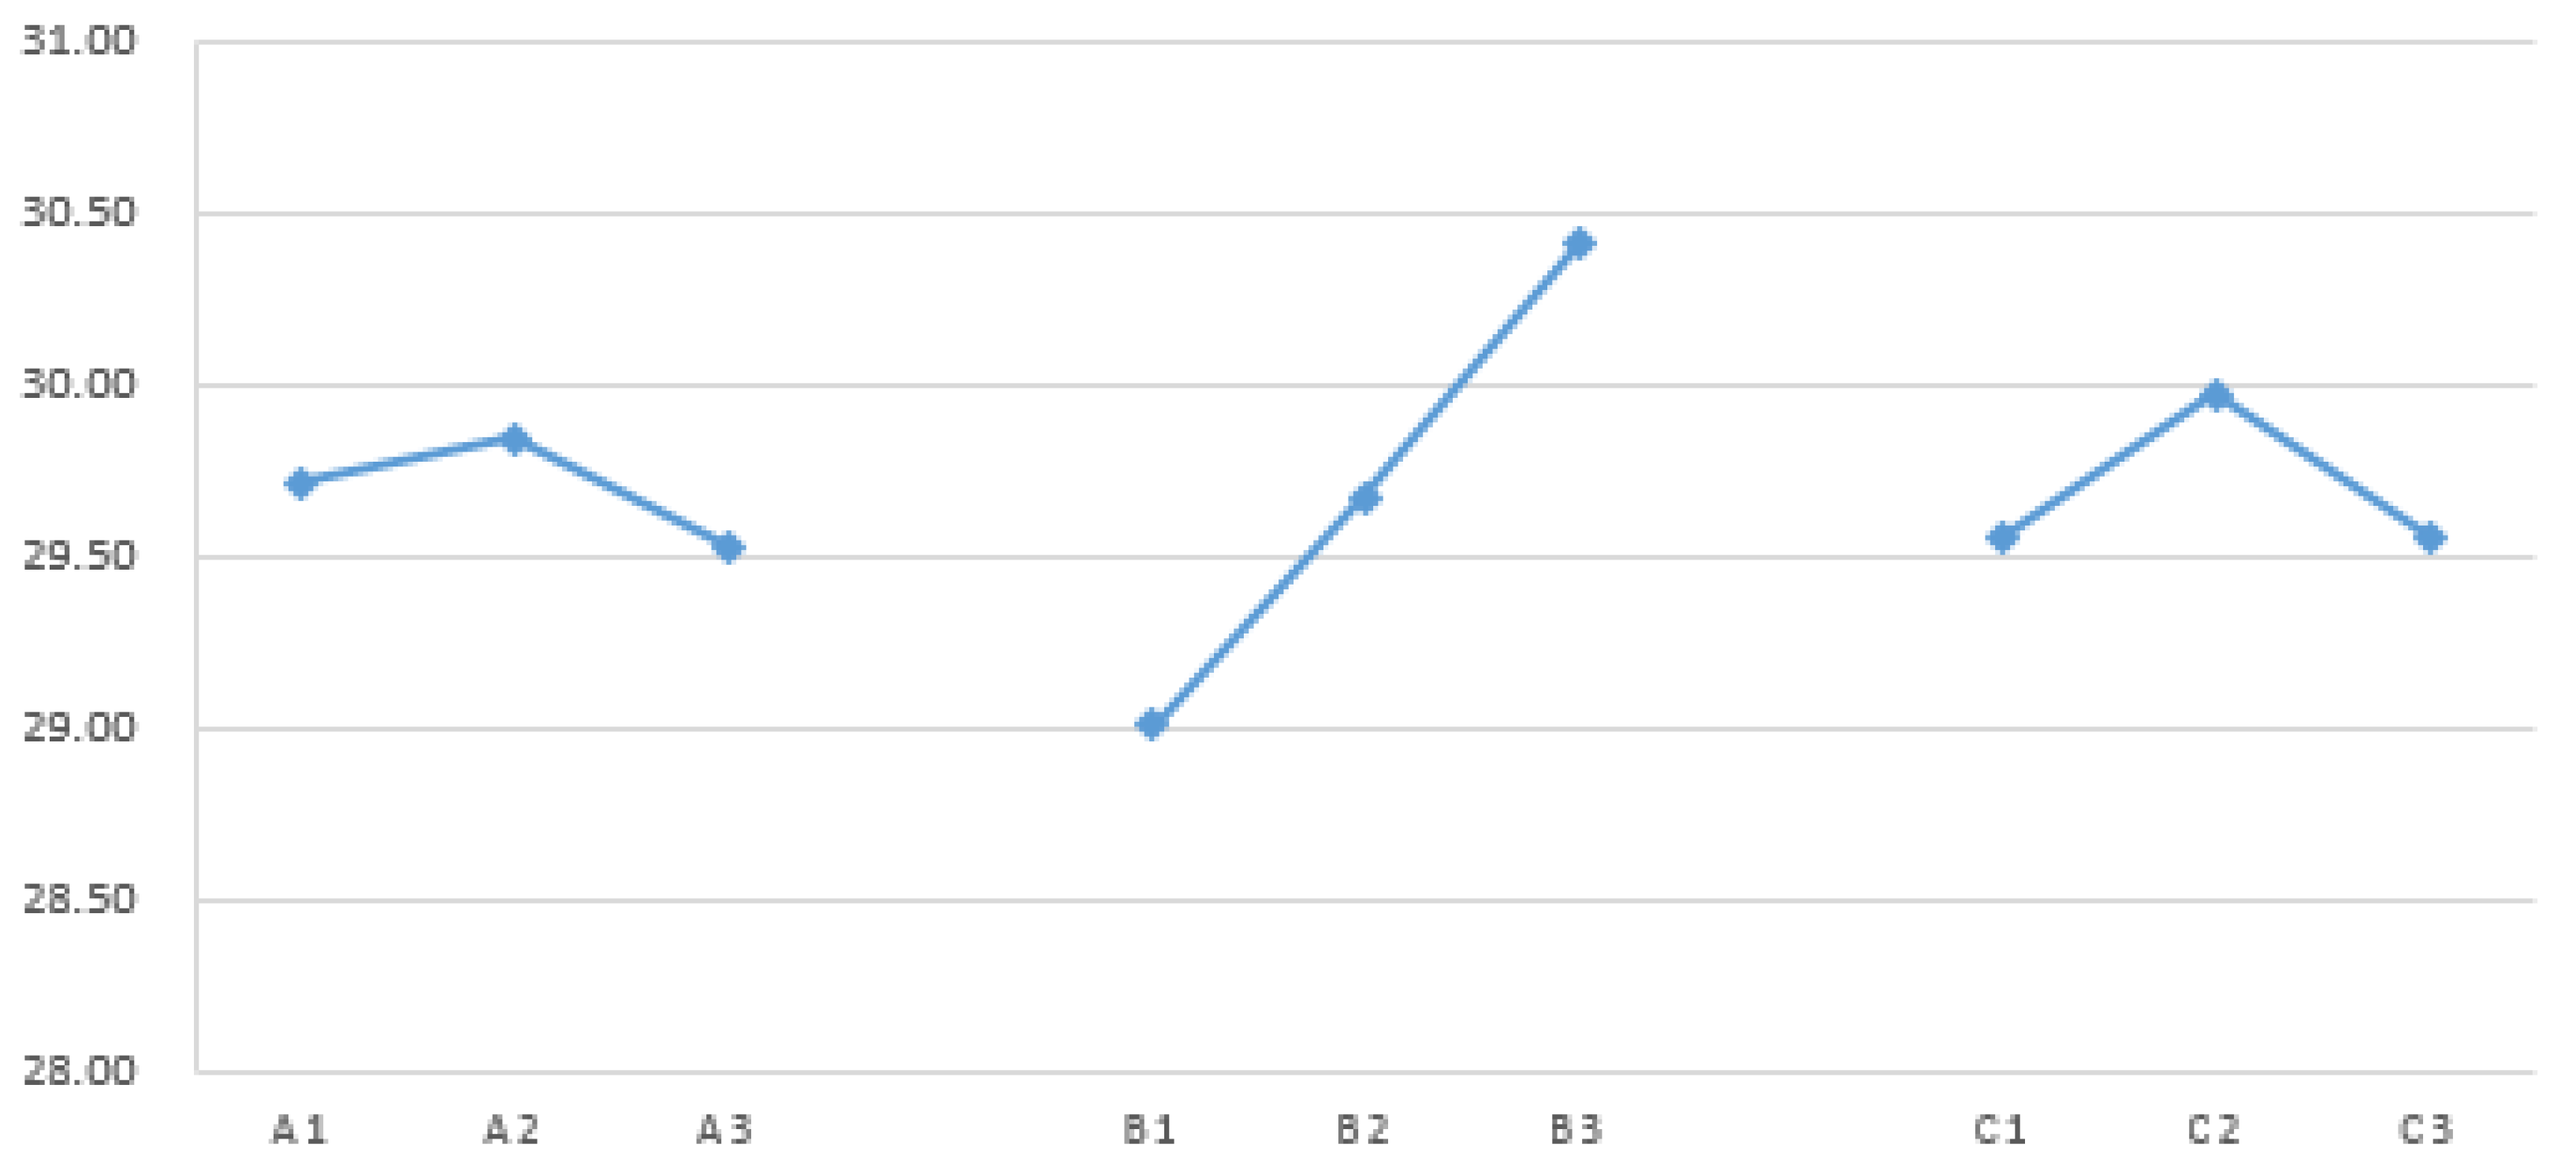
Figure 9.
Factor response chart for peel strength of dual-cured polyurethane hot-melt adhesive.
Figure 10.
The main effect response plot of the dual-cure polyurethane hot melt adhesive.

Table 1.
Polymerization Parameters of Dual-Cure Polyurethane Hot Melt Adhesive.
| Control factors | level value 1 | level value 2 | level value 3 | |
| A | Polyol | PTMG | PCL | PHCD |
| B | NCO:OH ratio | 2:1 | 3:1 | 4:1 |
| C | ODA molar ratio | 0 | 0.5 | 0.15 |
Table 2.
Detailed Formulation of Samples for Dual-Curing Polyurethane Hot-Melt Adhesive.
| Materials Names |
MDI (moles) | PTMG (moles) |
PCL (moles) |
PHCD (moles) |
2-HEA (moles) |
ODA (moles) |
| R2-0ODA | 4 | 2 | 0 | 0 | 4 | 0 |
| R2-5ODA | 4 | 2 | 0 | 0 | 4 | 5 |
| R2-15ODA | 4 | 2 | 0 | 0 | 4 | 15 |
| R3-0ODA | 6 | 0 | 2 | 0 | 8 | 0 |
| R3-5ODA | 6 | 0 | 2 | 0 | 8 | 5 |
| R3-15ODA | 6 | 0 | 2 | 0 | 8 | 15 |
| R4-0ODA | 8 | 0 | 0 | 2 | 12 | 0 |
| R4-5ODA | 8 | 0 | 0 | 2 | 12 | 5 |
| R4-15ODA | 8 | 0 | 0 | 2 | 12 | 15 |
Table 3.
Taguchi L9 Orthogonal Array.
| factors | A (Polyol category) |
B (NCO:OH ratio) |
C (ODA molar ratio) |
|
| Experiment | ||||
| 1 | 1 | 1 | 1 | |
| 2 | 1 | 2 | 2 | |
| 3 | 1 | 3 | 3 | |
| 4 | 2 | 1 | 2 | |
| 5 | 2 | 2 | 3 | |
| 6 | 2 | 3 | 1 | |
| 7 | 3 | 1 | 3 | |
| 8 | 3 | 2 | 1 | |
| 9 | 3 | 3 | 2 | |
Table 4.
Basic Orthogonal Table for Taguchi Method.
| Orthogonal table | number of columns | Maximum number of factors | Maximum number of level rows | |||
| 2 level number | 3 level number | 4 level number | 5 level number | |||
| L4 | 4 | 3 | 3 | |||
| L8 | 8 | 7 | 7 | |||
| L9 | 9 | 4 | 4 | |||
| L12 | 12 | 11 | 11 | |||
| L16 | 16 | 15 | 15 | |||
| L16 | 16 | 5 | 5 | |||
| L18 | 18 | 8 | 1 | 7 | ||
| L25 | 25 | 6 | 6 | |||
| L27 | 27 | 13 | 12 | |||
| L32 | 32 | 31 | 31 | |||
| L32 | 32 | 10 | 1 | 9 | ||
| L36 | 36 | 23 | 11 | 12 | ||
| L36 | 36 | 16 | 3 | 13 | ||
| L50 | 50 | 12 | 1 | 11 | ||
| L54 | 54 | 26 | 1 | 25 | ||
| L64 | 64 | 63 | 63 | |||
| L64 | 64 | 21 | 21 | |||
| L81 | 81 | 40 | 40 | |||
Table 5.
Taguchi L9 (34) Orthogonal Array.
| Factor | A | B | C | |
| Experiment | ||||
| 1 | 1 | 1 | 1 | |
| 2 | 1 | 2 | 2 | |
| 3 | 1 | 3 | 3 | |
| 4 | 2 | 1 | 2 | |
| 5 | 2 | 2 | 3 | |
| 6 | 2 | 3 | 1 | |
| 7 | 3 | 1 | 3 | |
| 8 | 3 | 2 | 1 | |
| 9 | 3 | 3 | 2 | |
Table 6.
Factor Effecting the response.
| I | J | K | L | M | N | |
| Level 1 | I1 | J1 | K1 | L1 | M1 | N1 |
| Level 2 | I2 | J2 | K2 | L2 | M2 | N2 |
| Level 3 | I3 | J3 | K3 | L3 | M3 | N3 |
| MAX | IMAX | JMAX | KMAX | LMAX | MMAX | NMAX |
| MIN | IMIN | JMIN | KMIN | LMIN | MMIN | NMIN |
| Difference | △I | △J | △K | △L | △M | △N |
Table 7.
Illustration of Analysis of variance Table.
| Factor | SS | DOF | Var | F | ρ | P |
| A | SSA | DOFA | VarA | FA | ρA | |
| B | SSB | DOFB | VarB | FB | ρB | |
| C | SSC | DOFC | VarC | FC | ρC | |
| …… | …… | …… | …… | …… | …… | …… |
| H | SSH | DOFH | VarH | FH | ||
| error | SSe | DOFe | Vare | |||
| total | SST | DOFT |
Table 8.
F-value Table for 95% Confidence Level.
| DOFe | 1 | 2 | 3 | 4 | 5 |
| 1 | 161.5 | 199.5 | 215.7 | 224.6 | 230.2 |
| 2 | 18.51 | 19.00 | 19.16 | 19.25 | 19.30 |
| 3 | 10.13 | 9.95 | 9.28 | 9.12 | 9.01 |
| 4 | 7.71 | 6.94 | 6.59 | 6.39 | 6.26 |
| 5 | 6.61 | 5.79 | 5.41 | 5.19 | 5.05 |
| 6 | 5.99 | 5.14 | 4.76 | 4.53 | 4.39 |
| 7 | 5.59 | 4.74 | 4.35 | 3.84 | 3.69 |
| 8 | 5.32 | 4.46 | 4.07 | 3.63 | 3.48 |
| 9 | 5.12 | 4.26 | 3.86 | 3.48 | 3.33 |
| 10 | 4.96 | 4.10 | 3.71 | 3.36 | 3.20 |
| 11 | 4.84 | 3.98 | 3.59 | 3.26 | 3.11 |
| 12 | 4.75 | 3.89 | 3.49 | 3.18 | 3.03 |
| 13 | 4.67 | 3.81 | 3.41 | 3.11 | 2.96 |
| 14 | 4.60 | 3.74 | 3.34 | 3.06 | 2.90 |
| 15 | 4.54 | 3.68 | 3.29 | 3.01 | 2.85 |
| 16 | 4.49 | 3.63 | 3.24 | 2.96 | 2.81 |
| 17 | 4.45 | 3.59 | 3.20 | 2.93 | 2.77 |
| 18 | 4.41 | 3.55 | 3.16 | 2.90 | 2.74 |
| 19 | 4.38 | 3.52 | 3.13 | 2.87 | 2.71 |
| 20 | 4.35 | 3.49 | 3.10 | 2.84 | 2.68 |
| 21 | 4.32 | 3.47 | 3.07 | 2.82 | 2.66 |
| 22 | 4.30 | 3.44 | 3.05 | 2.80 | 2.64 |
| 23 | 4.28 | 3.42 | 3.03 | 2.78 | 2.62 |
| 24 | 4.26 | 3.40 | 3.01 | 2.78 | 2.62 |
| 25 | 4.24 | 3.39 | 2.99 | 2.763 | 2.60 |
Table 9.
Corresponding functional groups and peak values in the FTIR spectra of polyurethane hot melt adhesives.
Table 9.
Corresponding functional groups and peak values in the FTIR spectra of polyurethane hot melt adhesives.
| Wavenumber (cm−1) | Functional group | Wavenumber (cm−1) | Functional group |
| C-H | 2860-2950 cm−1 | Benzene ring | 1590-1600 cm−1 |
| NCO | 2268 cm−1 | N-H | 1535 cm−1 |
| C=O | 1720-1735 cm−1 | C-O-C | 1100-1245 cm−1 |
Table 10.
Molecular weight distribution at different NCO: OH, ratios and mol ratios of photopolymerizable monomer in the same polyol analyzed by APC. The sample names are composed of two numbers representing the NCO: OH, ratio and the molar ratio of photopolymerizable monomer added.
Table 10.
Molecular weight distribution at different NCO: OH, ratios and mol ratios of photopolymerizable monomer in the same polyol analyzed by APC. The sample names are composed of two numbers representing the NCO: OH, ratio and the molar ratio of photopolymerizable monomer added.
| Sample name | Mn | Mw | PDI |
|---|---|---|---|
| PTMG soft segment | |||
| R2-0 | 11026 | 14185 | 1.29 |
| R2-5 | 28454 | 28875 | 1.01 |
| R2-15 | 35090 | 35468 | 1.01 |
| R3-0 | 11494 | 13686 | 1.19 |
| R3-5 | 26624 | 29570 | 1.11 |
| R3-15 | 33007 | 38476 | 1.17 |
| R4-0 | 11888 | 18024 | 1.52 |
| R4-5 | 28367 | 31314 | 1.10 |
| R4-15 | 33086 | 36142 | 1.09 |
| PCL soft segment | |||
| R2-0 | 14391 | 17816 | 1.24 |
| R2-5 | 25799 | 28830 | 1.12 |
| R2-15 | 33265 | 36168 | 1.09 |
| R3-0 | 12241 | 14644 | 1.20 |
| R3-5 | 22979 | 24770 | 1.08 |
| R3-15 | 37487 | 38505 | 1.03 |
| R4-0 | 11804 | 13776 | 1.17 |
| R4-5 | 27537 | 29542 | 1.07 |
| R4-15 | 37801 | 39666 | 1.05 |
| PHCD soft segment | |||
| R2-0 | 15107 | 19495 | 1.29 |
| R2-5 | 29082 | 31632 | 1.09 |
| R2-15 | 31312 | 34107 | 1.09 |
| R3-0 | 10092 | 10966 | 1.09 |
| R3-5 | 26051 | 29382 | 1.13 |
| R3-15 | 39103 | 39695 | 1.02 |
| R4-0 | 12011 | 12011 | 1.00 |
| R4-5 | 22826 | 24233 | 1.06 |
| R4-15 | 36702 | 38403 | 1.05 |
Table 11.
TGA data of dual-cure polyurethane hot melt adhesives in nitrogen atmosphere.
| Sample name | T5(℃) | T10(℃) | Sample name | T5(℃) | T10(℃) |
| PTMG soft segment | PCL soft segment | ||||
| R2-0 | 233.52 | 327.03 | R3-5 | 295.54 | 322.80 |
| R2-5 | 283.64 | 318.39 | R3-15 | 302.22 | 324.53 |
| R2-15 | 328.20 | 344.78 | R4-0 | 285.29 | 312.87 |
| R3-0 | 299.30 | 320.09 | R4-5 | 295.29 | 321.67 |
| R3-5 | 302.94 | 325.43 | R4-15 | 304.68 | 330.38 |
| R3-15 | 311.96 | 349.89 | PHCD soft segment | ||
| R4-0 | 263.84 | 313.42 | R2-0 | 279.32 | 308.23 |
| R4-5 | 293.07 | 320.89 | R2-5 | 289.97 | 314.43 |
| R4-15 | 295.29 | 321.67 | R2-15 | 306.60 | 324.10 |
| PCL soft segment | R3-0 | 292.82 | 318.23 | ||
| R2-0 | 292.43 | 322.86 | R3-5 | 293.08 | 311.31 |
| R2-5 | 295.54 | 322.80 | R3-15 | 299.66 | 323.98 |
| R2-15 | 312.71 | 334.30 | R4-0 | 291.03 | 318.32 |
| R3-0 | 291.80 | 316.41 | R4-5 | 302.78 | 322.98 |
| R3-5 | 295.54 | 322.80 | R4-15 | 304.46 | 326.62 |
Table 12.
Analysis of peel strength, shear strength, and softening point of dual-curing polyurethane hot melt adhesives.
Table 12.
Analysis of peel strength, shear strength, and softening point of dual-curing polyurethane hot melt adhesives.
| Sample name | Softening point (℃) | Peel strength (kg/cm) |
Shear strength (kg/cm2) |
| Target value | > 100 | > 0.39 | > 13 |
| PTMG | |||
| R2-0 | 75 | 0.15 | 28.50 |
| R3-5 | 75 | 0.23 | 31.77 |
| R4-15 | 80 | 0.52 | 32.46 |
| PCL | |||
| R2-5 | 65 | 0.34 | 29.67 |
| R3-15 | 65 | 0.52 | 30.43 |
| R4-0 | 55 | 0.81 | 33.11 |
| PHCD | |||
| R2-0 | 70 | 1.13 | 27.34 |
| R3-5 | 80 | 1.33 | 29.68 |
| R4-15 | 80 | 1.59 | 33.71 |
Table 13.
Analysis of peel strength, shear strength, and softening point of dual-curing polyurethane hot melt adhesives.
Table 13.
Analysis of peel strength, shear strength, and softening point of dual-curing polyurethane hot melt adhesives.
| Sample name | softening point (℃) | Peel strength (kg/cm) |
shear strength (kg/cm2) |
| Target value | > 100 | > 0.39 | > 13 |
| PTMG | |||
| R2-0 | 75 | 0.15 | 28.50 |
| R3-5 | 75 | 0.23 | 31.77 |
| R4-15 | 80 | 0.52 | 32.46 |
| PCL | |||
| R2-5 | 65 | 0.34 | 29.67 |
| R3-15 | 65 | 0.52 | 30.43 |
| R4-0 | 55 | 0.81 | 33.11 |
| PHCD | |||
| R2-0 | 70 | 1.13 | 27.34 |
| R3-5 | 80 | 1.33 | 29.68 |
| R4-15 | 80 | 1.59 | 33.71 |
Table 14.
Analysis Results of Shear Strength of Dual-cured Polyurethane Hot Melt Adhesive.
| No. | Factors | ||||||||
| A | B | C | Test 1 (MPa) |
Test 2 (MPa) |
Test 3 (MPa) |
Ave. (MPa) |
St. dev. | S/N (dB) |
|
| 1 | 1 | 1 | 1 | 28.5 | 27.06 | 27.84 | 27.80 | 0.72 | 28.87 |
| 2 | 1 | 2 | 2 | 31.77 | 31.46 | 31.69 | 31.64 | 0.16 | 30.00 |
| 3 | 1 | 3 | 3 | 32.46 | 32.64 | 32.58 | 32.56 | 0.09 | 30.25 |
| 4 | 2 | 1 | 2 | 29.67 | 29.37 | 29.48 | 29.51 | 0.15 | 29.40 |
| 5 | 2 | 2 | 3 | 30.43 | 30.67 | 30.27 | 30.46 | 0.20 | 29.67 |
| 6 | 2 | 3 | 1 | 33.11 | 33.31 | 33.48 | 33.30 | 0.19 | 30.45 |
| 7 | 3 | 1 | 3 | 27.34 | 27.02 | 27.8 | 27.39 | 0.39 | 28.75 |
| 8 | 3 | 2 | 1 | 29.68 | 29.19 | 29.03 | 29.30 | 0.34 | 29.34 |
| 9 | 3 | 3 | 2 | 33.71 | 33.21 | 33.62 | 33.51 | 0.27 | 30.50 |
Table 15.
Factor response table for shear strength of dual-cure polyurethane hot melt adhesive.
| A | B | C | |
| Level 1 | 29.71 | 29.01 | 29.55 |
| Level 2 | 29.84 | 29.67 | 29.97 |
| Level 3 | 29.53 | 30.40 | 29.56 |
| Max | 29.84 | 30.40 | 29.97 |
| Min | 29.53 | 29.01 | 29.55 |
| effect | 0.31 | 1.40 | 0.42 |
| Sort | 3 | 1 | 2 |
Table 16.
The ANOVA analysis table for shear strength of dual-curing polyurethane hot melt adhesive.
Table 16.
The ANOVA analysis table for shear strength of dual-curing polyurethane hot melt adhesive.
| Control factor | SS | DOF | Var | F | Contribution |
| A | 0.15 | 2 | 0.07 | 18.11 | 4.27% |
| B | 2.92 | 2 | 1.46 | 362.33 | 85.49% |
| C | 0.34 | 2 | 0.17 | 42.37 | 10.00% |
| Error | 0.01 | 2 | 0.00 | ||
| Combined Error | 0.01 | 2 | 0.00 | ||
| Total | 3.42 | 8 |
Table 17.
Experimentation of shear strength for Dual-Cure Polyurethane Hot Melt Adhesive.
| Major significant factor | Test 1 | Test 2 | Test 3 | Mean value | S/N ratio |
| A2, B3, C2 | 33.91 | 33.94 | 34.02 | 33.96 | 30.62 |
Table 18.
Results of Peel Strength Analysis for Dual-Cure Polyurethane Hot Melt Adhesive.
| No. | S/N (dB) |
||||||||
| A | B | C | Test 1 | Test 2 | Test 3 | Average | Std. | ||
| 1 | 1 | 1 | 1 | 0.15 | 0.13 | 0.18 | 0.15 | 0.03 | -16.62 |
| 2 | 1 | 2 | 2 | 0.23 | 0.27 | 0.24 | 0.25 | 0.02 | -12.25 |
| 3 | 1 | 3 | 3 | 0.52 | 0.54 | 0.55 | 0.54 | 0.02 | -5.42 |
| 4 | 2 | 1 | 2 | 0.34 | 0.28 | 0.32 | 0.31 | 0.03 | -10.20 |
| 5 | 2 | 2 | 3 | 0.52 | 0.61 | 0.57 | 0.57 | 0.05 | -5.02 |
| 6 | 2 | 3 | 1 | 0.81 | 0.85 | 0.88 | 0.85 | 0.04 | -1.47 |
| 7 | 3 | 1 | 3 | 1.13 | 1.17 | 1.17 | 1.16 | 0.02 | 1.26 |
| 8 | 3 | 2 | 1 | 1.33 | 1.38 | 1.36 | 1.36 | 0.03 | 2.64 |
| 9 | 3 | 3 | 2 | 1.59 | 1.57 | 1.61 | 1.59 | 0.02 | 4.03 |
Table 19.
Factor Response Table for Peel Strength of Dual-cure Polyurethane Hot-melt Adhesive.
| A | B | C | |
| Level 1 | -11.43 | -8.52 | -5.15 |
| Level 2 | -5.56 | -4.87 | -6.14 |
| Level 3 | 2.64 | -0.95 | -3.06 |
| Max | 2.64 | -0.95 | -3.06 |
| Min | -11.43 | -8.52 | -6.14 |
| effect | 14.07 | 7.57 | 3.08 |
| Ranking | 1 | 2 | 3 |
Table 20.
ANOVA Analysis Table of Peel Strength for Dual-curing Polyurethane Hot Melt Adhesive.
| Control Factor | Sum of Squares | Degrees of Freedom | Variance | F Distribution | Contribution |
| A | 299.83 | 2 | 149.91 | 55.78 | 73.84% |
| B | 85.99 | 2 | 42.99 | 16.00 | 21.18% |
| C | 14.87 | 2 | 7.44 | 2.77 | 3.66% |
| error | 5.38 | 2 | 2.69 | - | - |
| Combined Error | 5.38 | 2 | 2.69 | - | - |
| Total | 406.06 | 8 | - | - | - |
Table 21.
Confirmation Experiment for Dual-Cure Polyurethane Hot Melt Adhesive Peel Strength.
| Primary significant factor | Test1 | Test2 | Test3 | mean value | S/N ratio |
| A3B3C3 | 1.63 | 1.62 | 1.62 | 1.62 | 4.21 |
Table 22.
Signal-to-Noise Ratio Sequence Table for Peel Strength and Shear Strength.
| Peel strength S/N ratio | Shear strength S/N ratio | |
| 1 | -16.62 | 28.87 |
| 2 | -12.25 | 30.00 |
| 3 | -5.42 | 30.25 |
| 4 | -10.20 | 29.40 |
| 5 | -5.02 | 29.67 |
| 6 | -1.47 | 30.45 |
| 7 | 1.26 | 28.75 |
| 8 | 2.64 | 29.34 |
| 9 | 4.03 | 30.50 |
| Maximum value | 4.03 | 30.50 |
| Minimum value | -16.62 | 28.75 |
| Difference | 20.65 | 1.76 |
Table 23.
Grey correlation generation table for peel strength and shear strength.
| Peel strength S/N ratio | Shear strength S/N ratio | |
| X0 | 1 | 1 |
| X1 | 0.070656 | 0 |
| X2 | 0.715659 | 0.211866 |
| X3 | 0.857615 | 0.542759 |
| X4 | 0.370251 | 0.311021 |
| X5 | 0.526921 | 0.56219 |
| X6 | 0.968642 | 0.733956 |
| X7 | 0 | 0.866014 |
| X8 | 0.334678 | 0.93313 |
| X9 | 1 | 1 |
| Maximum value | 1 | 1 |
| Minimum value | 0 | 0 |
Table 24.
Difference Sequence for Peel Strength and Shear Strength.
| Peel strength S/N ratio | Shear strength S/N ratio | |
| X0 | 0 | 0 |
| X1 | 1 | 0.929344 |
| X2 | 0.788134 | 0.284341 |
| X3 | 0.457241 | 0.142385 |
| X4 | 0.688979 | 0.629749 |
| X5 | 0.43781 | 0.473079 |
| X6 | 0.266044 | 0.031358 |
| X7 | 0.133986 | 1 |
| X8 | 0.06687 | 0.665322 |
| X9 | 0 | 0 |
Table 25.
Grey correlation degree table for peel strength and shear strength.
| Peel strength S/N ratio | Shear strength S/N ratio | Average | |
| X0 | 1 | 1 | 1 |
| X1 | 0.333333 | 0.349811 | 0.341572 |
| X2 | 0.388158 | 0.637478 | 0.512818 |
| X3 | 0.522334 | 0.77835 | 0.650342 |
| X4 | 0.420529 | 0.442576 | 0.431553 |
| X5 | 0.533157 | 0.513833 | 0.523495 |
| X6 | 0.652704 | 0.940985 | 0.796844 |
| X7 | 0.78866 | 0.333333 | 0.560997 |
| X8 | 0.882037 | 0.429066 | 0.655552 |
| X9 | 1 | 1 | 1 |
Table 26.
Main Effects Response Table for Dual-Cured Polyurethane Hot Melt Adhesive.
| A | B | C | |
| Polyol | NCO:OH ratio | ODA molar ratio | |
| Level 1 | 0.62 | 0.44 | 0.60 |
| Level 2 | 0.58 | 0.56 | 0.65 |
| Level 3 | 0.74 | 0.82 | 0.58 |
| Max | 0.74 | 0.82 | 0.65 |
| Min | 0.58 | 0.44 | 0.58 |
| effect | 0.15 | 0.37 | 0.07 |
| ranking | 2 | 1 | 3 |
Table 27.
Confirmation experiment output table (peel strength) for dual-cure polyurethane hot melt adhesive.
Table 27.
Confirmation experiment output table (peel strength) for dual-cure polyurethane hot melt adhesive.
| Significant controlling factors | Test1 | Test2 | Test3 | mean value | S/N ratio |
| A3B3C2 | 1.67 | 1.69 | 1.68 | 1.68 | 4.51 |
Table 28.
Confirmation experiment output table (shear strength) for dual-cure polyurethane hot melt adhesive.
Table 28.
Confirmation experiment output table (shear strength) for dual-cure polyurethane hot melt adhesive.
| Significant controlling factors | Test1 | Test2 | Test3 | mean value | S/N ratio |
| A3B3C2 | 35.62 | 34.52 | 34.67 | 34.94 | 30.86 |
Table 29.
Comparison of properties between multi-quality experiment and commercial hot melt adhesive.
Table 29.
Comparison of properties between multi-quality experiment and commercial hot melt adhesive.
| Analysis Item | Target Value | Commercial Hot Melt Adhesive | Unoptimized Experiment | Multi-quality Optimization Experiment | Gain (%) |
| Peel strength | 0.39 kg/cm above | 0.73 | 1.57 | 1.69 | 7.64 |
| Shear strength | 13kg/cm2 above | 19.36 | 33.21 | 35.62 | 7.25 |
Table 30.
Comparison of processing conditions between optimized experiment and commercial hot melt adhesive.
Table 30.
Comparison of processing conditions between optimized experiment and commercial hot melt adhesive.
| Analysis Item | Commercial Hot Melt Adhesive | Multi-quality Optimization Experiment |
| Processing Temperature (℃) | 150-170 | 100 |
| Processing Time (s) | 20-30 | 20 |
| Hot Pressing Pressure (psi) | 40-60 | 15 |
Disclaimer/Publisher’s Note: The statements, opinions and data contained in all publications are solely those of the individual author(s) and contributor(s) and not of MDPI and/or the editor(s). MDPI and/or the editor(s) disclaim responsibility for any injury to people or property resulting from any ideas, methods, instructions or products referred to in the content. |
© 2024 by the authors. Licensee MDPI, Basel, Switzerland. This article is an open access article distributed under the terms and conditions of the Creative Commons Attribution (CC BY) license (http://creativecommons.org/licenses/by/4.0/).
Copyright: This open access article is published under a Creative Commons CC BY 4.0 license, which permit the free download, distribution, and reuse, provided that the author and preprint are cited in any reuse.


