Submitted:
30 December 2023
Posted:
30 December 2023
You are already at the latest version
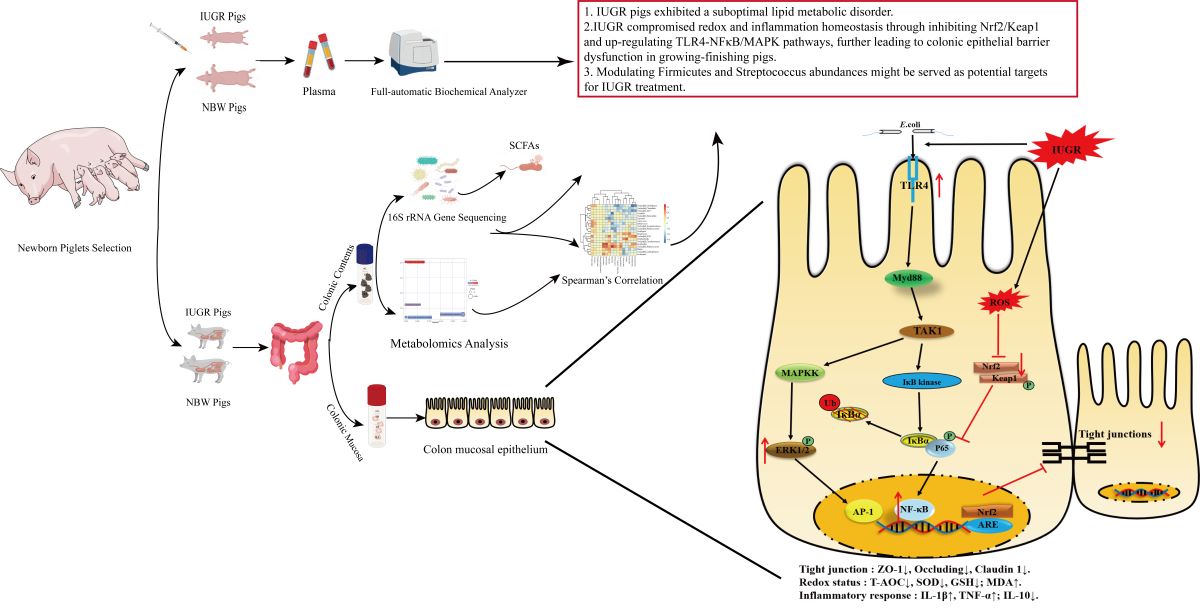
Abstract
Keywords:
1. Introduction
2. Materials and Methods
2.1. Animals, Experimental Design, and Diets
2.2. Sample Collection
2.3. Laboratory Analysis
2.3.1. Analysis of Plasma Biochemical Parameters
2.3.2. Analysis of Plasma Redox Status
2.3.3. Analysis of Colonic Inflammatory Cytokines
2.3.4. Microbial DNA Isolation and 16S rRNA Gene Sequencing
2.3.5. Colonic Metabolite Extraction and Non-targeted Metabolomics Analysis
2.3.6. Determination of SCFAs, Indole, Skatole, and Bioamines in Colonic Contents
2.3.7. Analysis of Oxidative and Inflammatory-Related Genes
2.3.8. Analysis of the Relative Protein Abundances
2.3. Statistical Analysis
3. Results
3.1. Effects of IUGR on Plasma Biochemical Parameters in Growing-Finishing Pigs
3.2. Effects of IUGR on Plasma Redox Status in Growing-Finishing Pigs
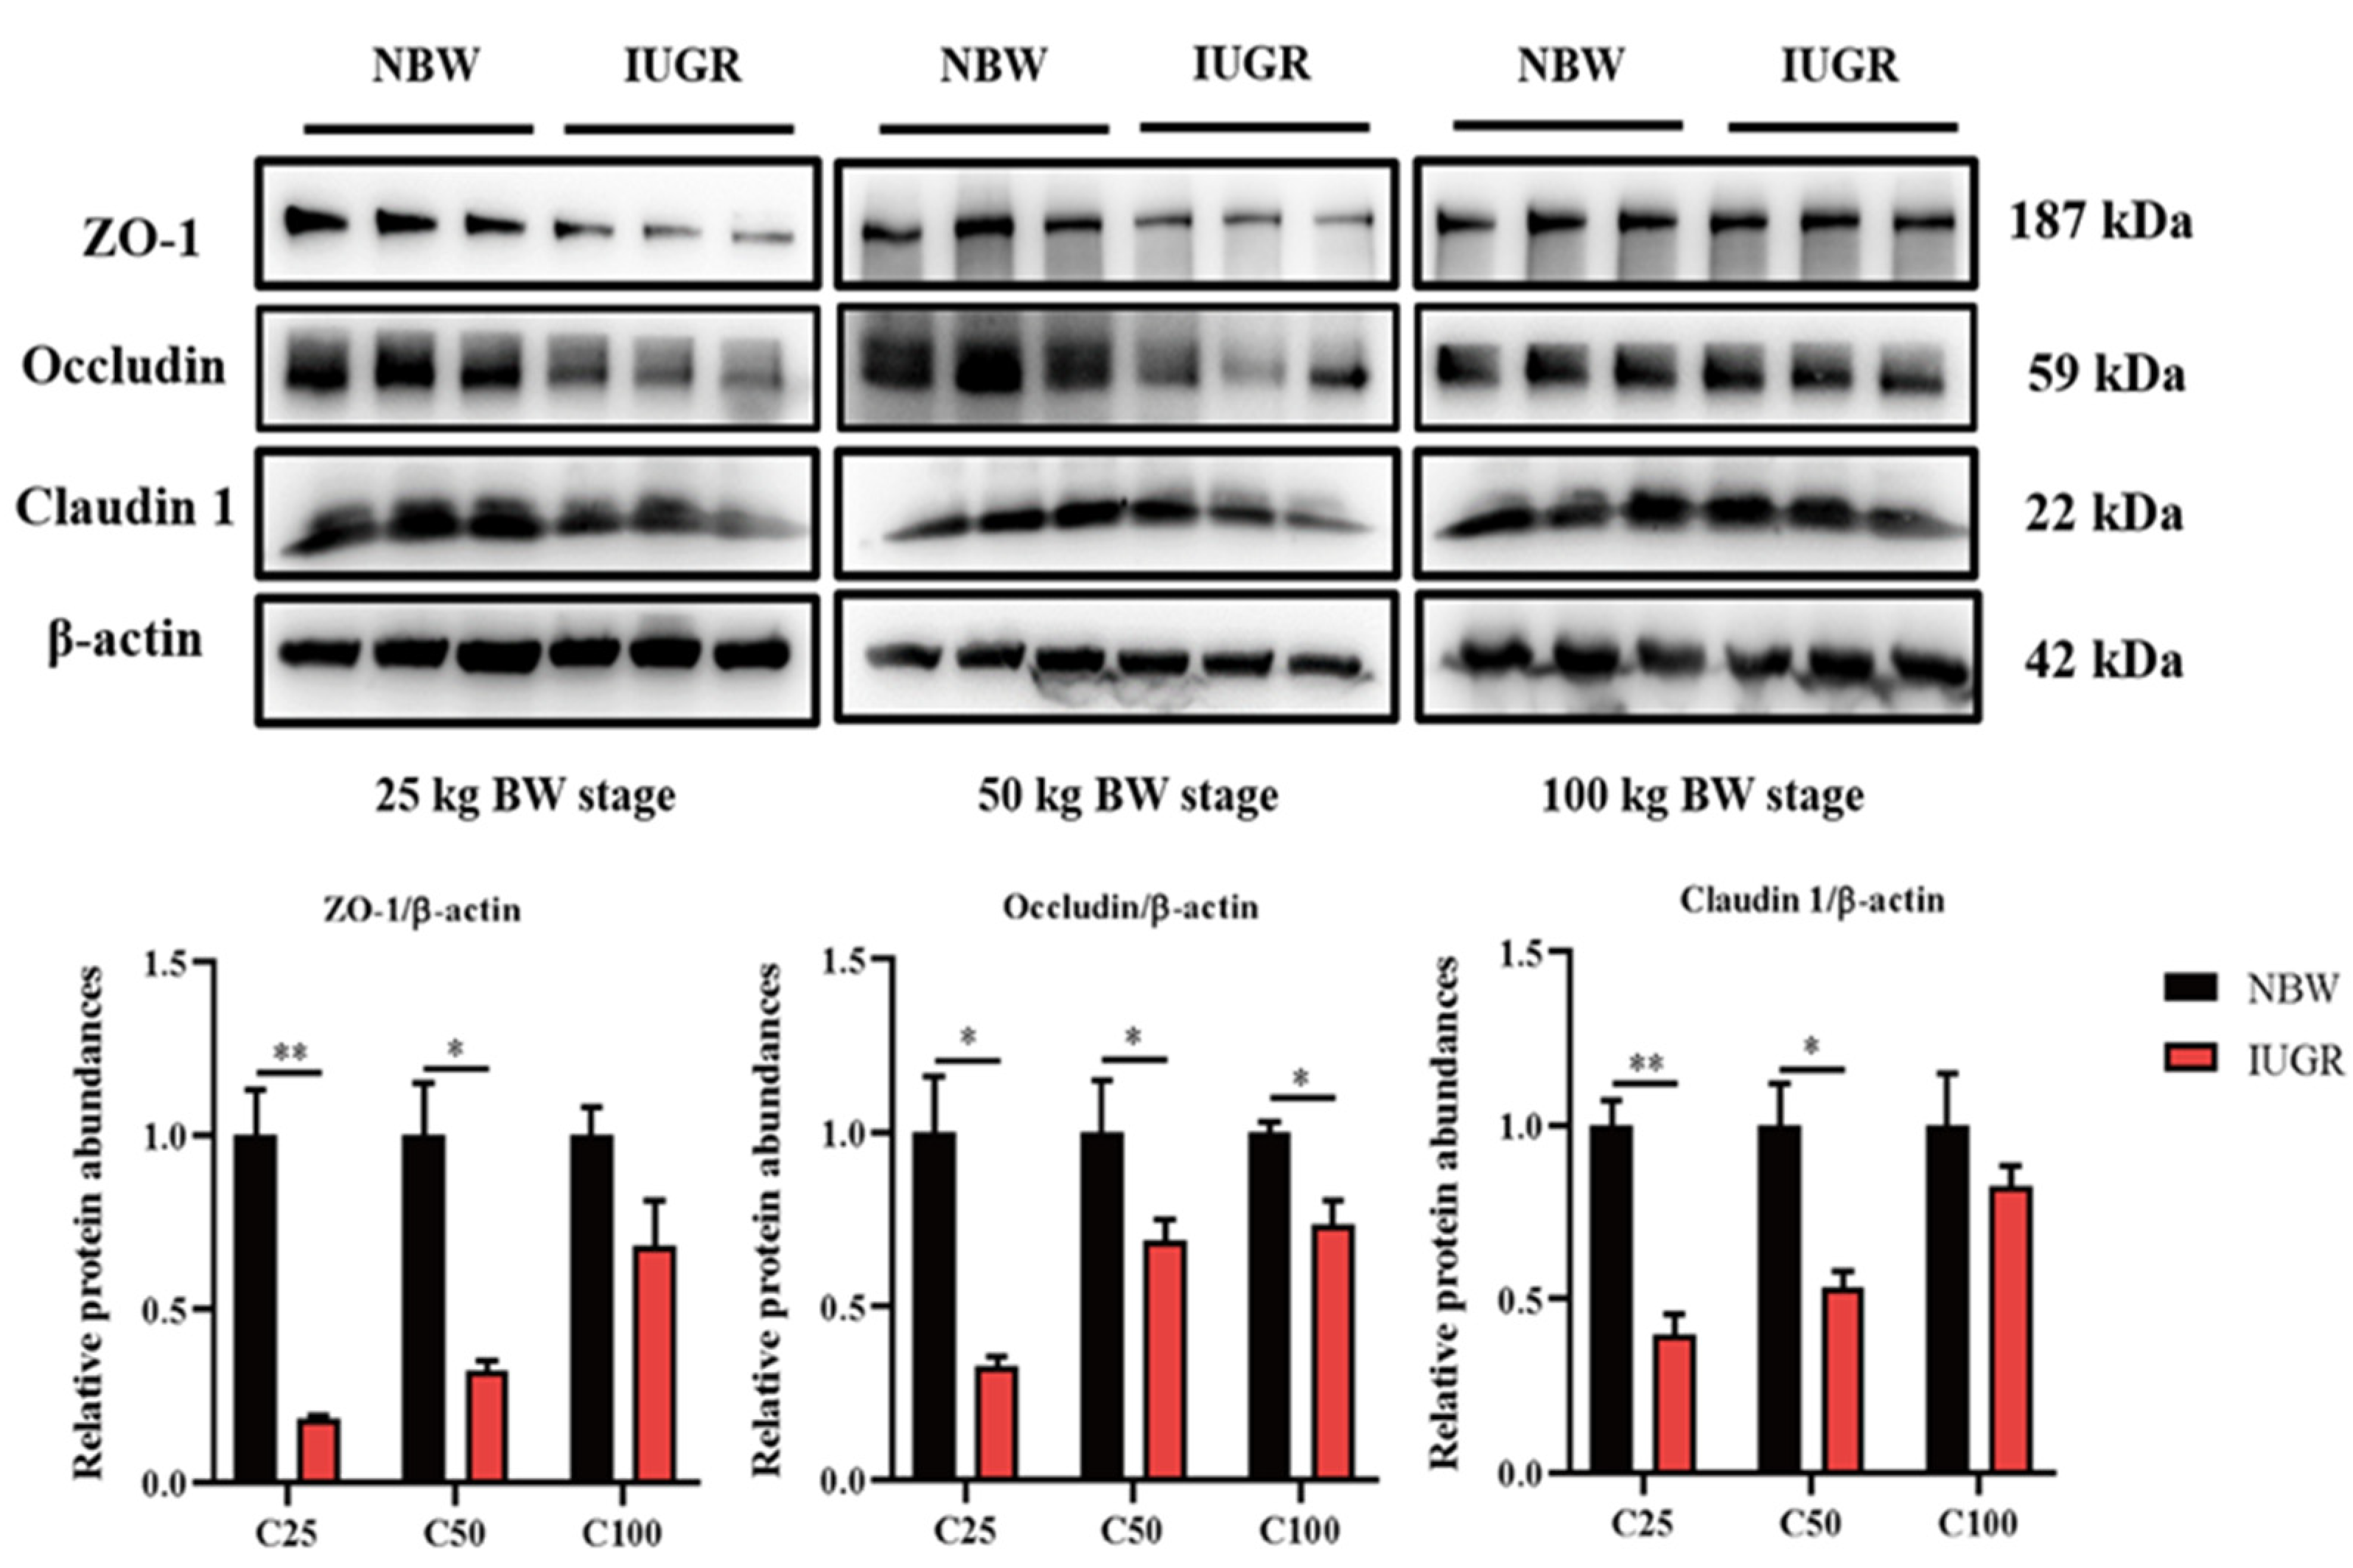
3.3. Effects of IUGR on Colonic Tight Junction Protein Abundances in Growing-Finishing Pigs
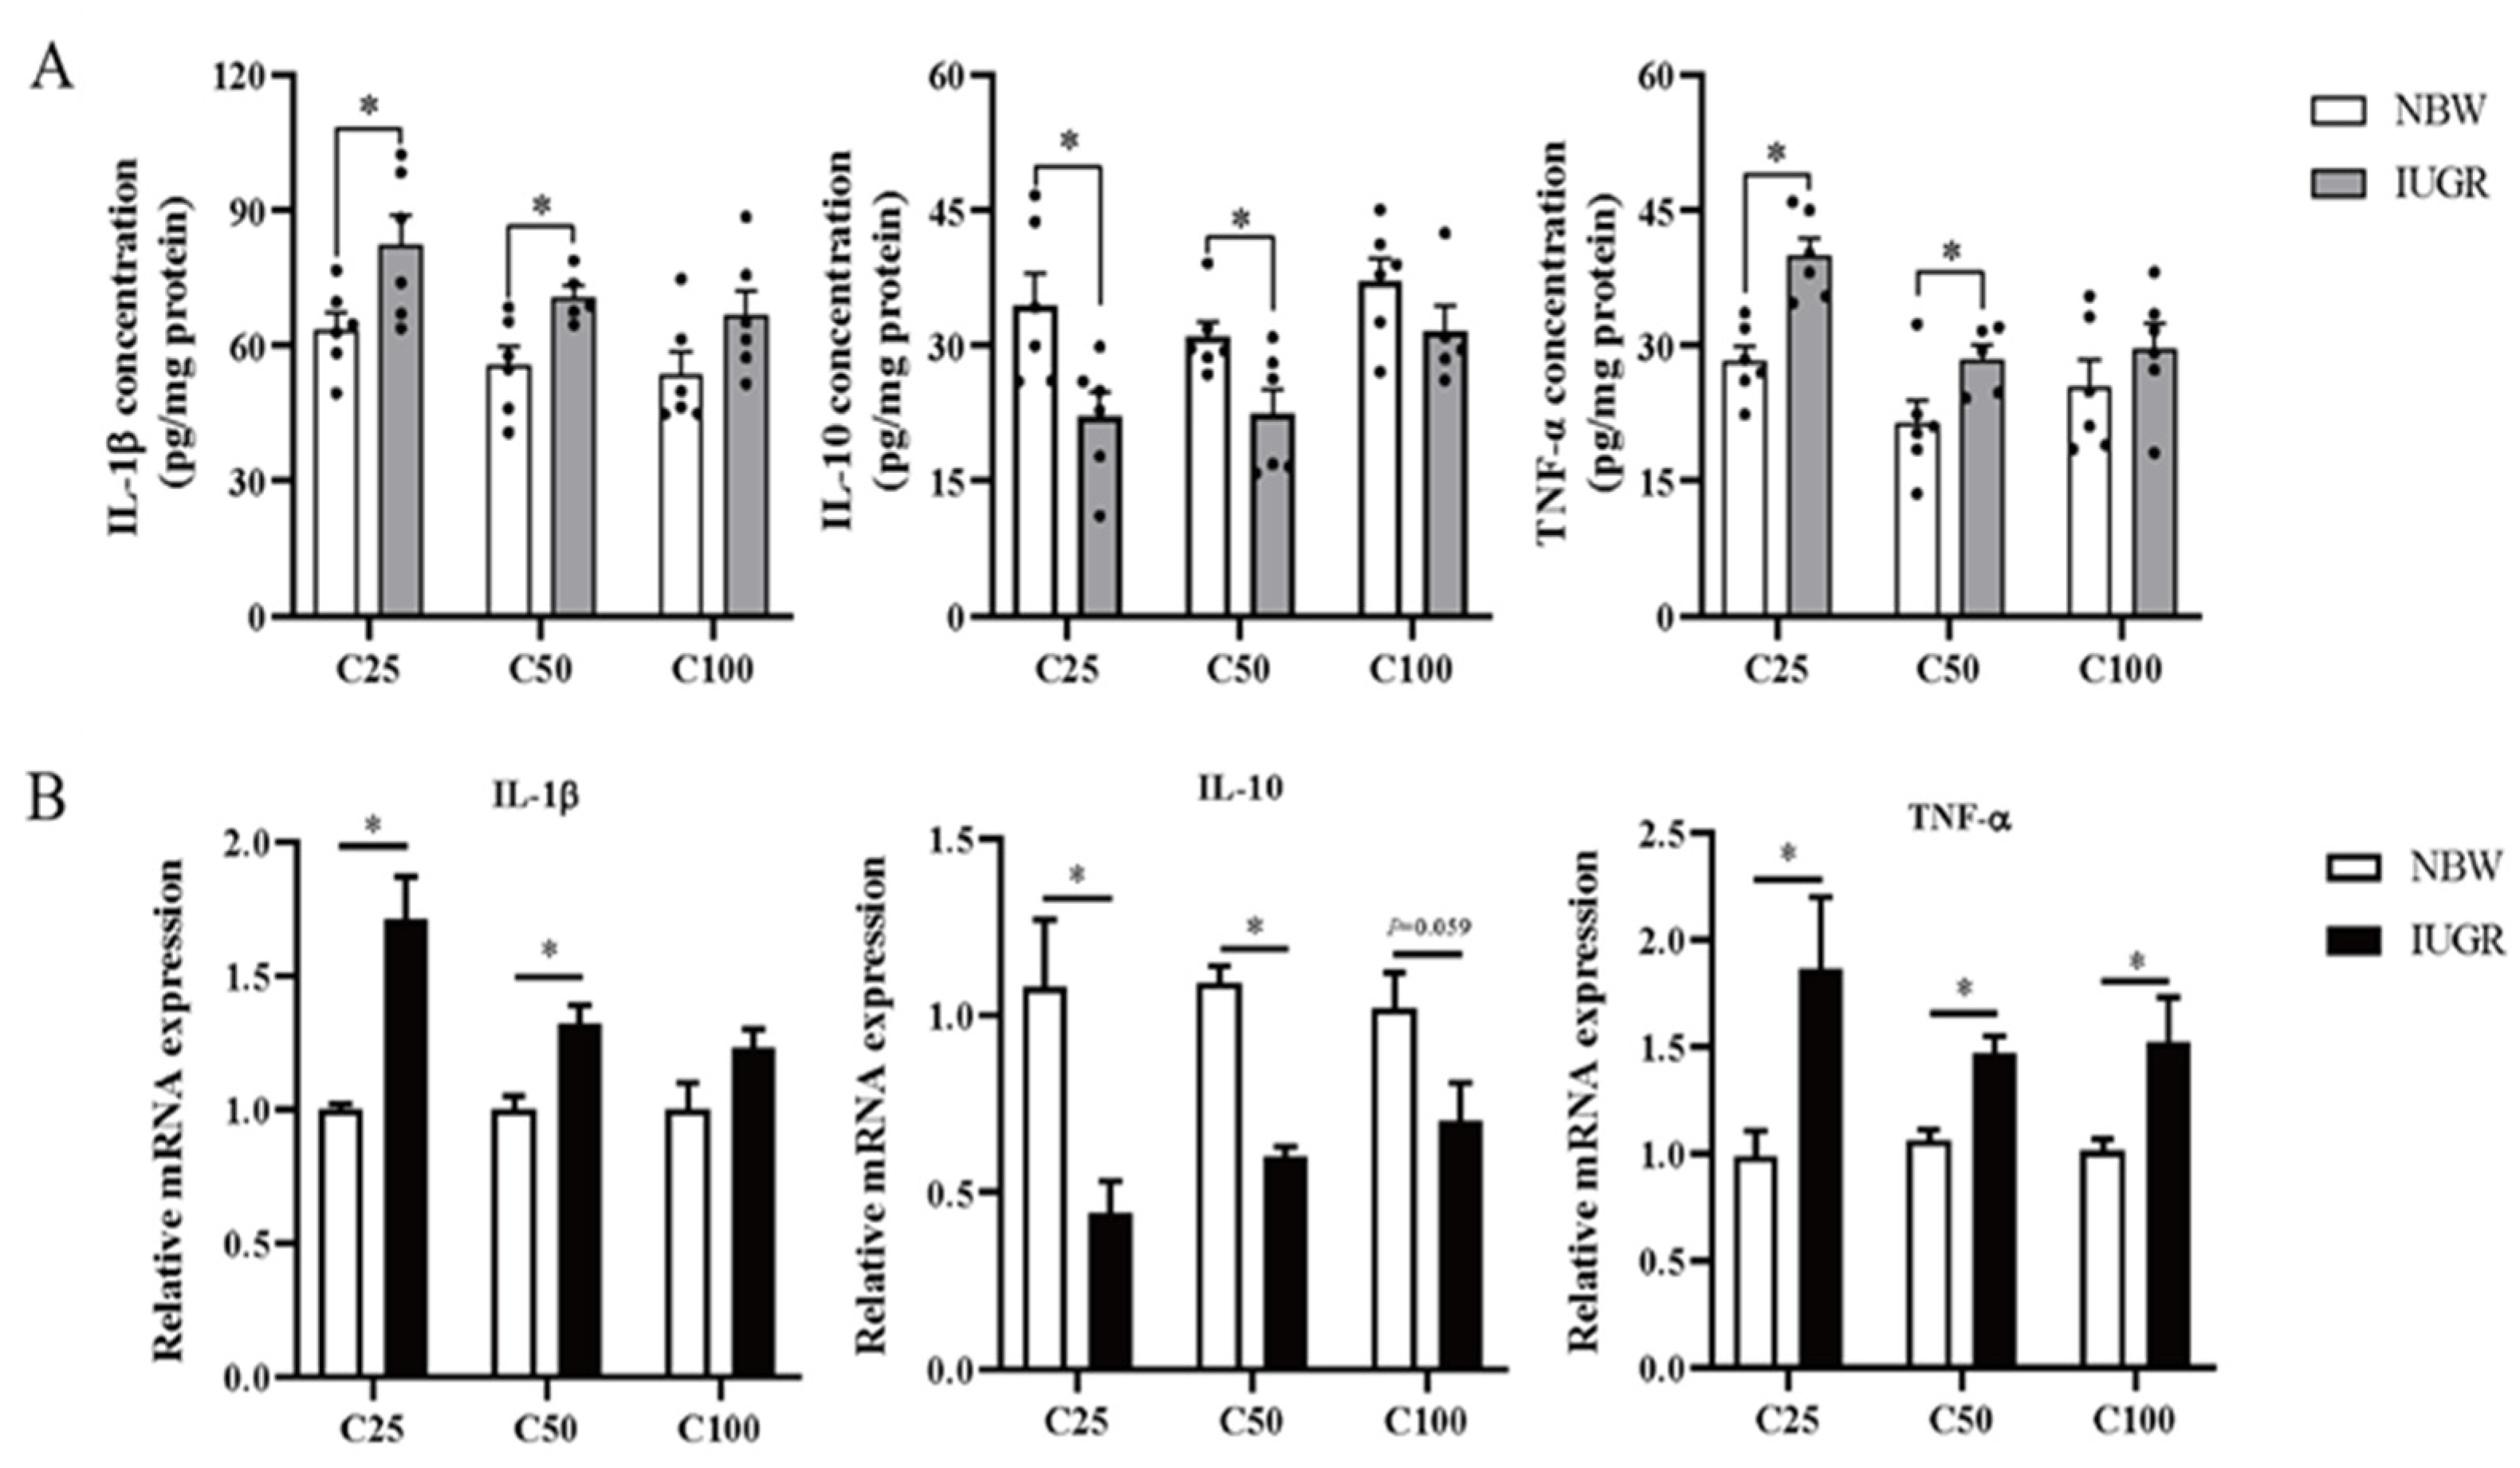
3.4. Effects of IUGR on Colonic Mucosal Redox Status and Inflammatory Cytokines in Growing-Finishing Pigs
3.5. Effects of IUGR on Colonic Mucosal Oxidative and Inflammatory-Related mRNA Expressions in Growing-Finishing Pigs
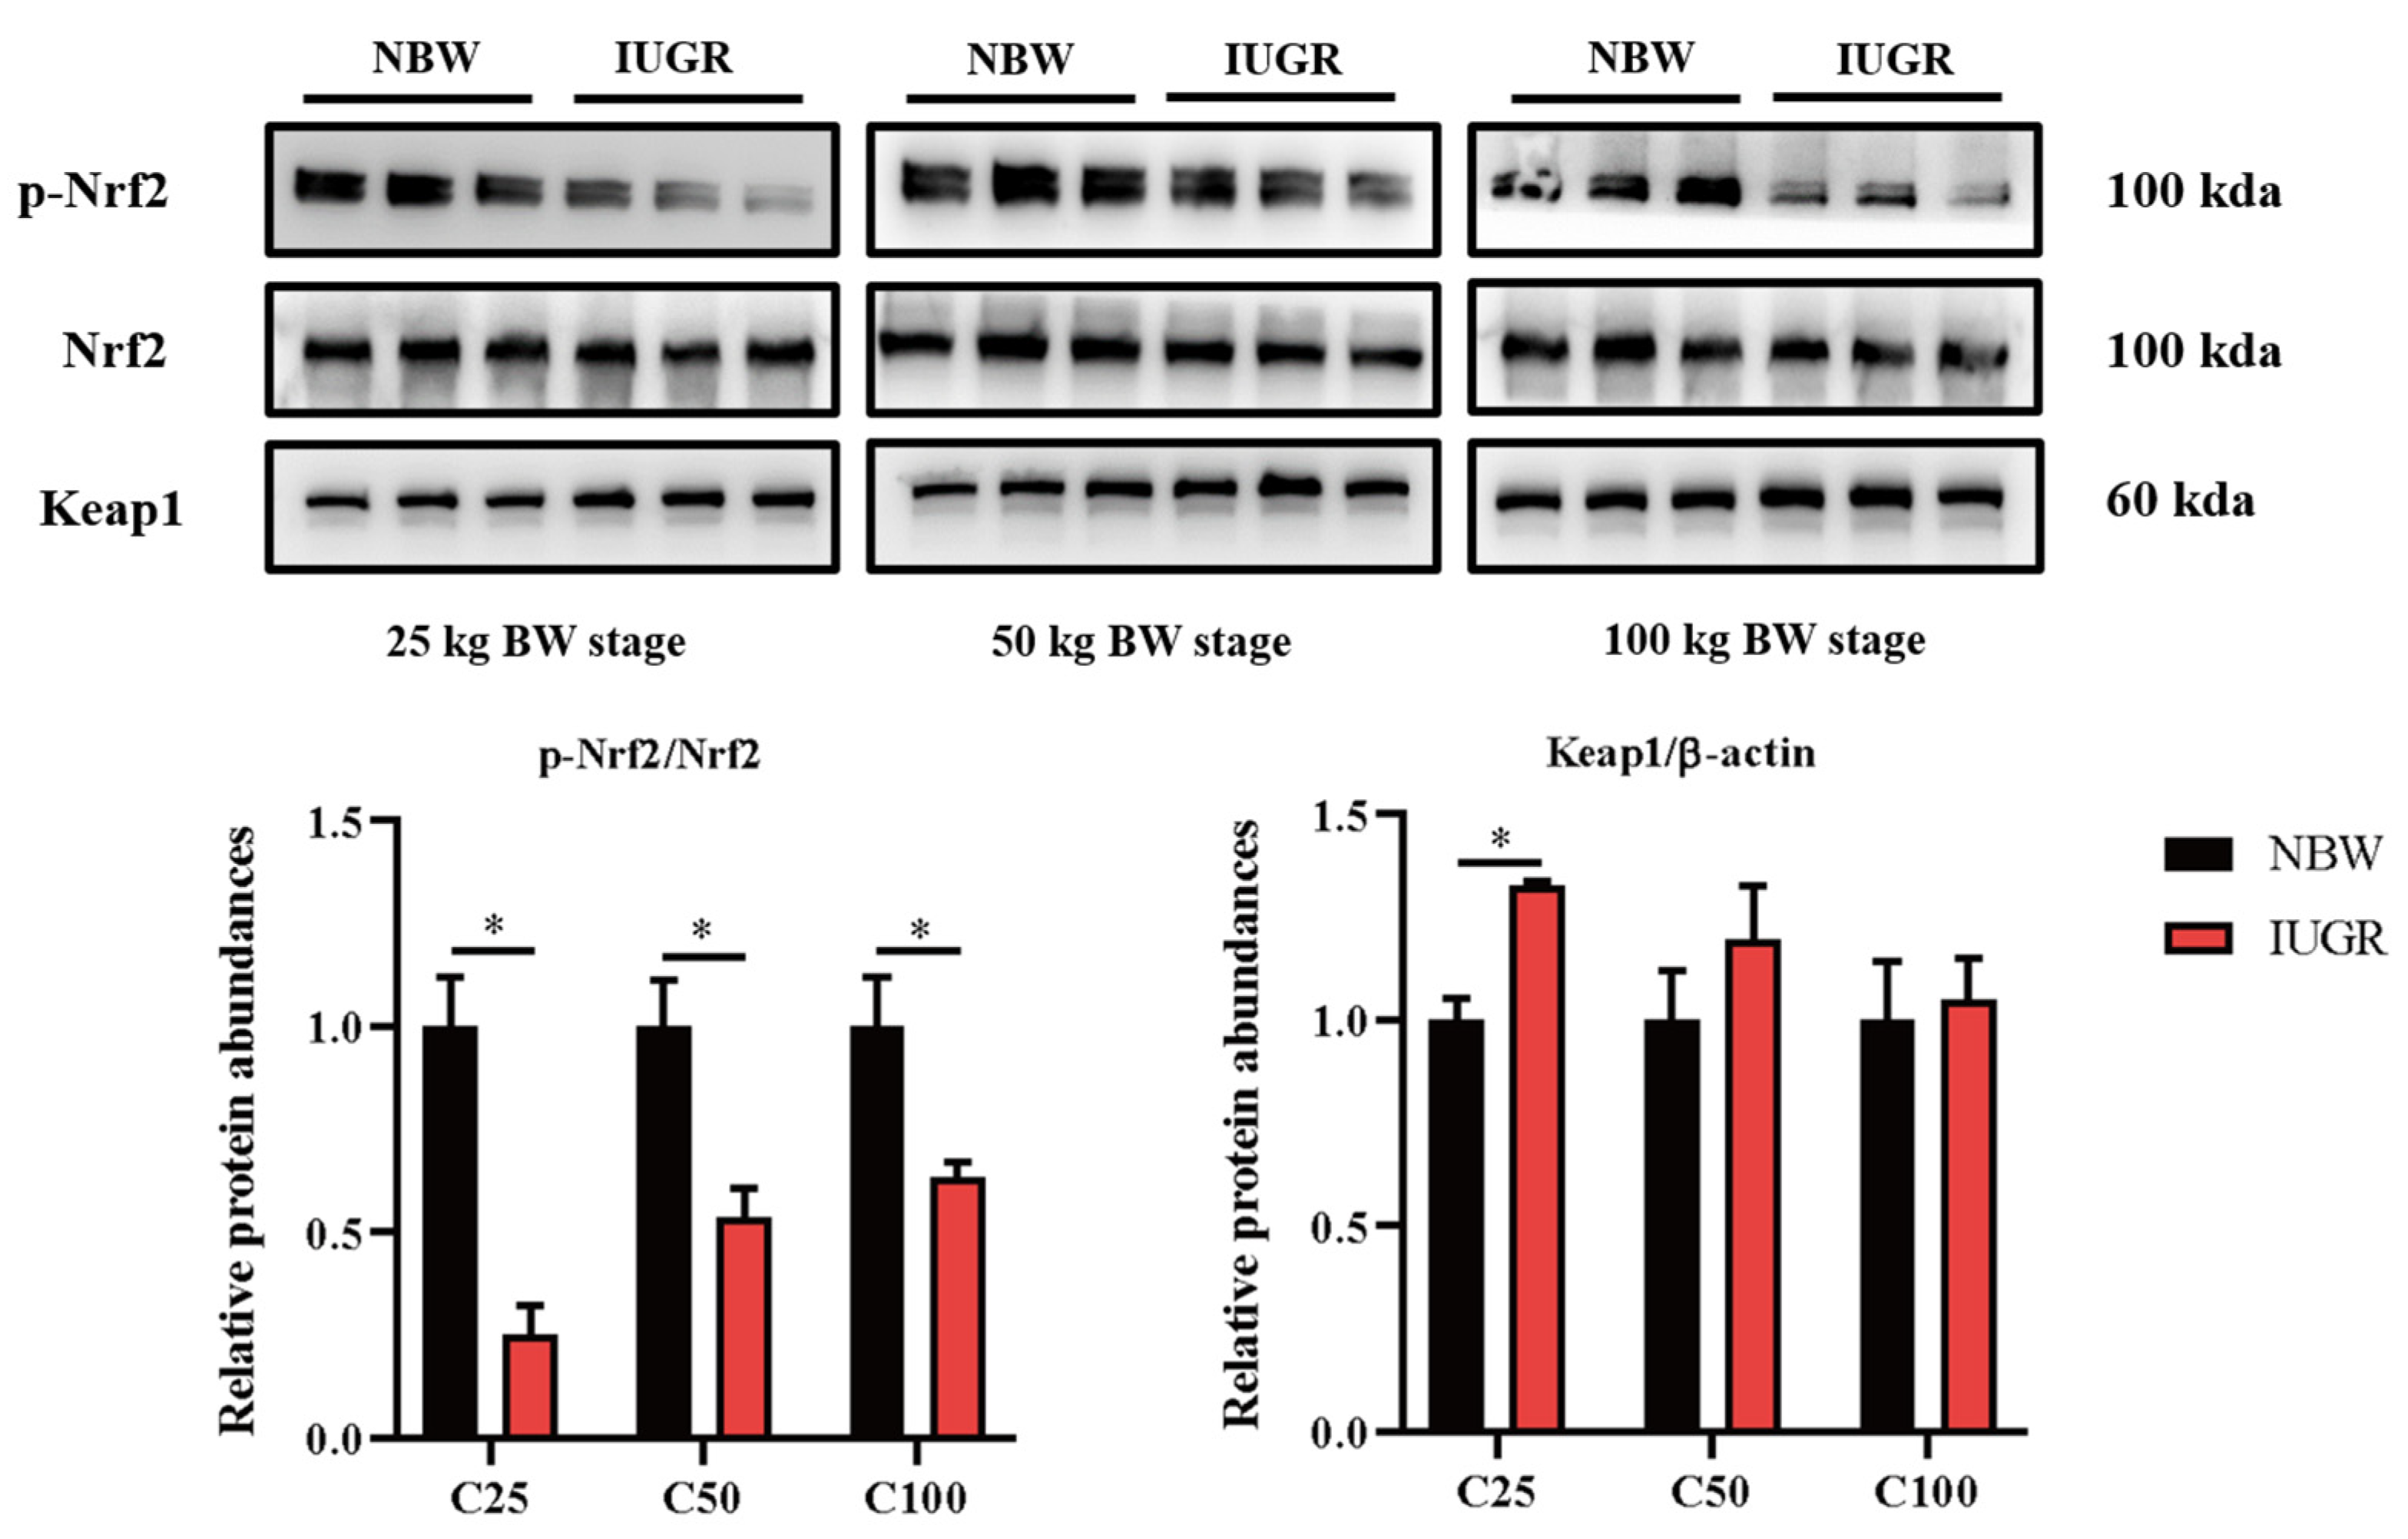
3.6. Effects of IUGR on Colonic Mucosal Nrf2/Keap1 and TLR4-NF-κB/ERK Pathways in Growing-Finishing Pigs
3.7. Effects of IUGR on Colonic Microbial Diversity in Growing-Finishing Pigs
3.8. Effects of IUGR on Colonic Microbial Composition in Growing-Finishing Pigs
3.9. Effects of IUGR on the Taxonomic Differences in Colonic Microbiota in Growing-Finishing Pigs
3.10. Effects of IUGR on Colonic Microbial Gene Functions in Growing-Finishing Pigs
3.11. Effects of IUGR on the Concentrations of SCFAs, Indole, Skatole, and Bioamines in Colonic Contents of Growing-Finishing Pigs
3.12. Correlation Between Colonic SCFAs, Indole, Skatole, and Bioamines Concentrations and Microbiota Abundances
3.13. Effects of IUGR on Colonic Metabolome Profiles in Growing-Finishing Pigs
3.14. Correlations Between Colonic Microbiota Abundance and Differential Metabolite Concentrations of NBW and IUGR pigs
4. Discussion
5. Conclusions
Supplementary Materials
Author Contributions
Funding
Institutional Review Board Statement
Informed Consent Statement
Data Availability Statement
Acknowledgments
Conflicts of Interest
References
- Wu, G.; Bazer, F.W.; Wallace, J.M.; Spencer, T.E. Board-invited review: Intrauterine growth retardation: implications for the animal sciences. J. Anim. Sci. 2006, 84, 2316–2337. [Google Scholar] [CrossRef] [PubMed]
- Su, G.; Lund, M.S.; Sorensen, D. Selection for litter size at day five to improve litter size at weaning and piglet survival rate. J. Anim. Sci. 2007, 85, 1385–1392. [Google Scholar] [CrossRef] [PubMed]
- Makki, K.; Deehan, E.C.; Walter, J.; Bäckhed, F. The impact of dietary fiber on gut microbiota in host health and disease. Cell Host Microbe 2018, 23, 705–715. [Google Scholar] [CrossRef] [PubMed]
- Li, Y.; Zhang, H.; Su, W.; Ying, Z.; Chen, Y.; Zhang, L.; Lu, Z.; Wang, T. Effects of dietary Bacillus amyloliquefaciens supplementation on growth performance, intestinal morphology, inflammatory response, and microbiota of intra-uterine growth retarded weanling piglets. J. Anim. Sci. Biotechnol. 2018, 9, 22. [Google Scholar] [CrossRef] [PubMed]
- Li, N.; Huang, S.; Jiang, L.; Wang, W.; Li, T.; Zuo, B.; Li, Z.; Wang, J. Differences in the gut microbiota establishment and metabolome characteristics between low- and normal-birth-weight piglets during early-life. Front. Microbiol. 2018, 9, 1798. [Google Scholar] [CrossRef] [PubMed]
- Blachier, F.; Beaumont, M.; Andriamihaja, M.; Davila, A.M.; Lan, A.; Grauso, M.; Armand, L.; Benamouzig, R.; Tomé, D. Changes in the luminal environment of the colonic epithelial cells and physiopathological consequences. Am. J. Pathol. 2017, 187, 476–486. [Google Scholar] [CrossRef] [PubMed]
- Fança-Berthon, P.; Hoebler, C.; Mouzet, E.; David, A.; Michel, C. Intrauterine growth restriction not only modifies the cecocolonic microbiota in neonatal rats but also affects its activity in young adult rats. J. Pediatr. Gastroenterol. Nutr. 2010, 51, 402–413. [Google Scholar] [CrossRef] [PubMed]
- Rezaie, A.; Parker, R.D.; Abdollahi, M. Oxidative stress and pathogenesis of inflammatory bowel disease: An epiphenomenon or the cause? Dig. Dis. Sci. 2007, 52, 2015–2021. [Google Scholar] [CrossRef]
- Chang, D.; Hu, Z.L.; Zhang, L.; Zhao, Y.S.; Meng, Q.H.; Guan, Q.B.; Zhou, J.; Pan, H.Z. Association of catalase genotype with oxidative stress in the predication of colorectal cancer: modification by epidemiological factors. Biomed. Environ. Sci. 2012, 25, 156–162. [Google Scholar] [CrossRef]
- de Moreno de LeBlanc, A.; LeBlanc, J.G.; Perdigón, G.; Miyoshi, A.; Langella, P.; Azevedo, V.; Sesma, F. Oral administration of a catalase-producing Lactococcus lactis can prevent a chemically induced colon cancer in mice. J. Med. Microbiol. 2008, 57, 100–105. [Google Scholar] [CrossRef]
- Glei, M.; Hofmann, T.; Küster, K.; Hollmann, J.; Lindhauer, M.G.; Pool-Zobel, B.L. Both wheat (Triticum aestivum) bran arabinoxylans and gut flora-mediated fermentation products protect human colon cells from genotoxic activities of 4-hydroxynonenal and hydrogen peroxide. J. Agric. Food Chem. 2006, 54, 2088–2095. [Google Scholar] [CrossRef] [PubMed]
- Michiels, J.; De Vos, M.; Missotten, J.; Ovyn, A.; De Smet, S.; Van Ginneken, C. Maturation of digestive function is retarded and plasma antioxidant capacity lowered in fully weaned low birth weight piglets. Br. J. Nutr. 2013, 109, 65–75. [Google Scholar] [CrossRef]
- He, Q.; Ren, P.; Kong, X.; Xu, W.; Tang, H.; Yin, Y.; Wang, Y. Intrauterine growth restriction alters the metabonome of the serum and jejunum in piglets. Mol. Biosyst. 2011, 7, 2147–2155. [Google Scholar] [CrossRef]
- Xiong, L.; You, J.; Zhang, W.; Zhu, Q.; Blachier, F.; Yin, Y.; Kong, X. Intrauterine growth restriction alters growth performance, plasma hormones, and small intestinal microbial communities in growing-finishing pigs. J. Anim. Sci. Biotechnol. 2020, 11, 86. [Google Scholar] [CrossRef]
- Tang, W.; Zhang, W.; Azad, M.A.K.; Ma, C.; Zhu, Q.; Kong, X. Metabolome, microbiome, and gene expression alterations in the colon of newborn piglets with intrauterine growth restriction. Front. Microbiol. 2022, 13, 989060. [Google Scholar] [CrossRef] [PubMed]
- Ji, Y.; Guo, Q.; Yin, Y.; Blachier, F.; Kong, X. Dietary proline supplementation alters colonic luminal microbiota and bacterial metabolite composition between days 45 and 70 of pregnancy in Huanjiang mini-pigs. J. Anim. Sci. Biotechnol. 2018, 9, 18. [Google Scholar] [CrossRef]
- Zhang, W.; Ma, C.; Xie, P.; Zhu, Q.; Wang, X.; Yin, Y.; Kong, X. Gut microbiota of newborn piglets with intrauterine growth restriction have lower diversity and different taxonomic abundances. J. Appl. Microbiol. 2019, 127, 354–369. [Google Scholar] [CrossRef] [PubMed]
- Stukelj, M.; Valencak, Z.; Krsnik, M.; Svete, A.N. The effect of the combination of acids and tannin in diet on the performance and selected biochemical, haematological and antioxidant enzyme parameters in grower pigs. Acta Vet. Scand. 2010, 52, 19. [Google Scholar] [CrossRef]
- Zhang, J.; Xu, W.; Yang, Y.; Zhang, L.; Wang, T. Leucine alters blood parameters and regulates hepatic protein synthesis via mammalian/mechanistic target of rapamycin activation in intrauterine growth-restricted piglets. J. Anim. Sci. 2022, 100. [Google Scholar] [CrossRef]
- Jiang, L.; Feng, C.; Tao, S.; Li, N.; Zuo, B.; Han, D.; Wang, J. Maternal imprinting of the neonatal microbiota colonization in intrauterine growth restricted piglets: A review. J. Anim. Sci. Biotechnol. 2019, 10, 88. [Google Scholar] [CrossRef]
- Qi, M.; Tan, B.; Wang, J.; Liao, S.; Li, J.; Liu, Y.; Yin, Y. Post-natal growth retardation associated with impaired gut hormone profiles, immune and antioxidant function in pigs. Front. Endocrinol. 2019, 10, 660. [Google Scholar] [CrossRef] [PubMed]
- D'Inca, R.; Che, L.; Thymann, T.; Sangild, P.T.; Huërou-Luron, I.L. Intrauterine growth restriction reduces intestinal structure and modifies the response to colostrum in preterm and term piglets. Livest Sci. 2010, 133, 20–22. [Google Scholar] [CrossRef]
- Li, T.; Huang, S.; Lei, L.; Tao, S.; Xiong, Y.; Wu, G.; Hu, J.; Yuan, X.; Zhao, S.; Zuo, B.; et al. Intrauterine growth restriction alters nutrient metabolism in the intestine of porcine offspring. J. Anim. Sci. Biotechnol. 2021, 12, 15. [Google Scholar] [CrossRef] [PubMed]
- Schoultz, I.; Keita Å, V. The intestinal barrier and current techniques for the assessment of gut permeability. Cells 2020, 9. [Google Scholar] [CrossRef] [PubMed]
- Huang, S.M.; Wu, Z.H.; Li, T.T.; Liu, C.; Han, D.D.; Tao, S.Y.; Pi, Y.; Li, N.; Wang, J.J. Perturbation of the lipid metabolism and intestinal inflammation in growing pigs with low birth weight is associated with the alterations of gut microbiota. Sci. Total Environ. 2020, 719, 137382. [Google Scholar] [CrossRef] [PubMed]
- Aw, T.Y. Intestinal glutathione: determinant of mucosal peroxide transport, metabolism, and oxidative susceptibility. Toxicol. Appl. Pharmacol. 2005, 204, 320–328. [Google Scholar] [CrossRef] [PubMed]
- Bellezza, I.; Giambanco, I.; Minelli, A.; Donato, R. Nrf2-Keap1 signaling in oxidative and reductive stress. Biochim. Biophys. Acta Mol. Cell Res. 2018, 1865, 721–733. [Google Scholar] [CrossRef] [PubMed]
- Chen, Y.; Zhang, H.; Chen, Y.; Jia, P.; Ji, S.; Zhang, Y.; Wang, T. Resveratrol and its derivative pterostilbene ameliorate intestine injury in intrauterine growth-retarded weanling piglets by modulating redox status and gut microbiota. J. Anim. Sci. Biotechnol. 2021, 12, 70. [Google Scholar] [CrossRef]
- Su W, Zhang H, Ying Z, Li Y, Zhou L, Wang F, et al. Effects of dietary L-methionine supplementation on intestinal integrity and oxidative status in intrauterine growth-retarded weanling piglets. Eur. J. Nutr. 2018, 57, 2735–2745. [CrossRef]
- Chen, H.; Hu, Y.; Fang, Y.; Djukic, Z.; Yamamoto, M.; Shaheen, N.J.; Orlando, R.C.; Chen, X. Nrf2 deficiency impairs the barrier function of mouse oesophageal epithelium. Gut 2014, 63, 711–719. [Google Scholar] [CrossRef]
- Jeon, Y.D.; Lee, J.H.; Lee, Y.M.; Kim, D.K. Puerarin inhibits inflammation and oxidative stress in dextran sulfate sodium-induced colitis mice model. Biomed Pharmacother. 2020, 124, 109847. [Google Scholar] [CrossRef]
- Yin, H.; Pu, N.; Chen, Q.; Zhang, J.; Zhao, G.; Xu, X.; Wang, D.; Kuang, T.; Jin, D.; Lou, W.; et al. Gut-derived lipopolysaccharide remodels tumoral microenvironment and synergizes with PD-L1 checkpoint blockade via TLR4/MyD88/AKT/NF-κB pathway in pancreatic cancer. Cell Death Dis. 2021, 12, 1033. [Google Scholar] [CrossRef] [PubMed]
- Fitzgerald KA, Kagan JC. Toll-like receptors and the control of immunity. Cell 2020, 180, 1044–1066. [CrossRef] [PubMed]
- Chen, Y.; Cui, W.; Li, X.; Yang, H. Interaction between commensal bacteria, immune response and the intestinal barrier in inflammatory bowel disease. Front. Immunol. 2021, 12, 761981. [Google Scholar] [CrossRef] [PubMed]
- Ouyang, W.; Rutz, S.; Crellin, N.K.; Valdez, P.A.; Hymowitz, S.G. Regulation and functions of the IL-10 family of cytokines in inflammation and disease. Annu. Rev. Immunol. 2011, 29, 71–109. [Google Scholar] [CrossRef]
- Lan, J.; Dou, X.; Li, J.; Yang, Y.; Xue, C.; Wang, C.; Gao, N.; Shan, A. L-Arginine ameliorates lipopolysaccharide-induced intestinal inflammation through inhibiting the TLR4/NF-κB and MAPK pathways and stimulating β-defensin expression in vivo and in vitro. J. Agr. Food Chem. 2020, 68, 2648–2663. [Google Scholar] [CrossRef]
- Tao, S.; Bai, Y.; Li, T.; Li, N.; Wang, J. Original low birth weight deteriorates the hindgut epithelial barrier function in pigs at the growing stage. FASEB J. 2019, 33, 9897–9912. [Google Scholar] [CrossRef]
- Niu, Y.; Zhao, Y.; He, J.; Yun, Y.; Shen, M.; Gan, Z.; Zhang, L.; Wang, T. Dietary dihydroartemisinin supplementation alleviates intestinal inflammatory injury through TLR4/NOD/NF-κB signaling pathway in weaned piglets with intrauterine growth retardation. Anim. Nutr. 2021, 7, 667–678. [Google Scholar] [CrossRef]
- Azad, M.A.K.; Liu, G.; Bin, P.; Ding, S.; Kong, X.; Guan, G.; Yin, Y. Sulfur-containing amino acid supplementation to gilts from late pregnancy to lactation altered offspring's intestinal microbiota and plasma metabolites. Appl. Microbiol. Biotechnol. 2020, 104, 1227–1242. [Google Scholar] [CrossRef] [PubMed]
- Li, N.; Huang, S.; Jiang, L.; Dai, Z.; Li, T.; Han, D.; Wang, J. Characterization of the early life microbiota development and predominant Lactobacillus species at distinct gut segments of low- and normal-birth-weight piglets. Front. Microbiol. 2019, 10, 797. [Google Scholar] [CrossRef] [PubMed]
- Turnbaugh, P.J.; Hamady, M.; Yatsunenko, T.; Cantarel, B.L.; Duncan, A.; Ley, R.E.; Sogin, M.L.; Jones, W.J.; Roe, B.A.; Affourtit, J.P.; et al. A core gut microbiome in obese and lean twins. Nature 2009, 457, 480–484. [Google Scholar] [CrossRef] [PubMed]
- Turnbaugh, P.J.; Ley, R.E.; Mahowald, M.A.; Magrini, V.; Mardis, E.R.; Gordon, J.I. An obesity-associated gut microbiome with increased capacity for energy harvest. Nature 2006, 444, 1027–1031. [Google Scholar] [CrossRef] [PubMed]
- Yu, M.; Mu, C.; Zhang, C.; Yang, Y.; Su, Y.; Zhu, W. Marked response in microbial community and metabolism in the ileum and cecum of suckling piglets after early antibiotics exposure. Front. Microbiol. 2018, 9, 1166. [Google Scholar] [CrossRef] [PubMed]
- Saraf, M.K.; Piccolo, B.D.; Bowlin, A.K.; Mercer, K.E.; LeRoith, T.; Chintapalli, S.V.; Shankar, K.; Badger, T.M.; Yeruva, L. Formula diet driven microbiota shifts tryptophan metabolism from serotonin to tryptamine in neonatal porcine colon. Microbiome 2017, 5, 77. [Google Scholar] [CrossRef]
- Walter, J. Ecological role of lactobacilli in the gastrointestinal tract: Implications for fundamental and biomedical research. Appl. Environ. Microbiol. 2008, 74, 4985–4996. [Google Scholar] [CrossRef]
- Mahowald, M.A.; Rey, F.E.; Seedorf, H.; Turnbaugh, P.J.; Fulton, R.S.; Wollam, A.; Shah, N.; Wang, C.; Magrini, V.; Wilson, R.K.; et al. Characterizing a model human gut microbiota composed of members of its two dominant bacterial phyla. Proc. Natl. Acad Sci. USA. 2009, 106, 5859–5864. [Google Scholar] [CrossRef]
- Ban-Tokuda, T.; Maekawa, S.; Miwa, T.; Ohkawara, S.; Matsui, H. Changes in faecal bacteria during fattening in finishing swine. Anaerobe 2017, 47, 188–193. [Google Scholar] [CrossRef]
- Teti, D.; Visalli, M.; McNair, H. Analysis of polyamines as markers of (patho)physiological conditions. J Chromatogr B Analyt Technol Biomed Life Sci. 2002, 781, 107–149. [Google Scholar] [CrossRef]
- Di Martino, M.L.; Campilongo, R.; Casalino, M.; Micheli, G.; Colonna, B.; Prosseda, G. Polyamines: Emerging players in bacteria-host interactions. Int. J. Med. Microbiol. 2013, 303, 484–491. [Google Scholar] [CrossRef]
- Dunn, W.B.; Broadhurst, D.; Begley, P.; Zelena, E.; Francis-McIntyre, S.; Anderson, N.; Brown, M.; Knowles, J.D.; Halsall, A.; Haselden, J.N.; et al. Procedures for large-scale metabolic profiling of serum and plasma using gas chromatography and liquid chromatography coupled to mass spectrometry. Nat. Protoc. 2011, 6, 1060–1083. [Google Scholar] [CrossRef]
- Luo, J.; Yang, H.; Song, B.L. Mechanisms and regulation of cholesterol homeostasis. Nat. Rev. Mol. Cell Biol. 2020, 21, 225–245. [Google Scholar] [CrossRef] [PubMed]
- van der Veen, J.N.; Kennelly, J.P.; Wan, S.; Vance, J.E.; Vance, D.E.; Jacobs, R.L. The critical role of phosphatidylcholine and phosphatidylethanolamine metabolism in health and disease. Biochim Biophys Acta Biomembr. 2017, 1859, 1558–1572. [Google Scholar] [CrossRef] [PubMed]
- Lin, G.; Liu, C.; Feng, C.; Fan, Z.; Dai, Z.; Lai, C.; Li, Z.; Wu, G.; Wang, J. Metabolomic analysis reveals differences in umbilical vein plasma metabolites between normal and growth-restricted fetal pigs during late gestation. J. Nutr. 2012, 142, 990–998. [Google Scholar] [CrossRef] [PubMed]
- Coburn, S.P.; Reynolds, R.D.; Mahuren, J.D.; Schaltenbrand, W.E.; Wang, Y.; Ericson, K.L.; Whyte, M.P.; Zubovic, Y.M.; Ziegler, P.J.; Costill, D.L.; et al. Elevated plasma 4-pyridoxic acid in renal insufficiency. Am. J. Clin. Nutr. 2002, 75, 57–64. [Google Scholar] [CrossRef]
- Bröer, S.; Fairweather, S.J. Amino acid transport across the mammalian intestine. Compr Physiol. 2018, 9, 343–373. [Google Scholar] [CrossRef]



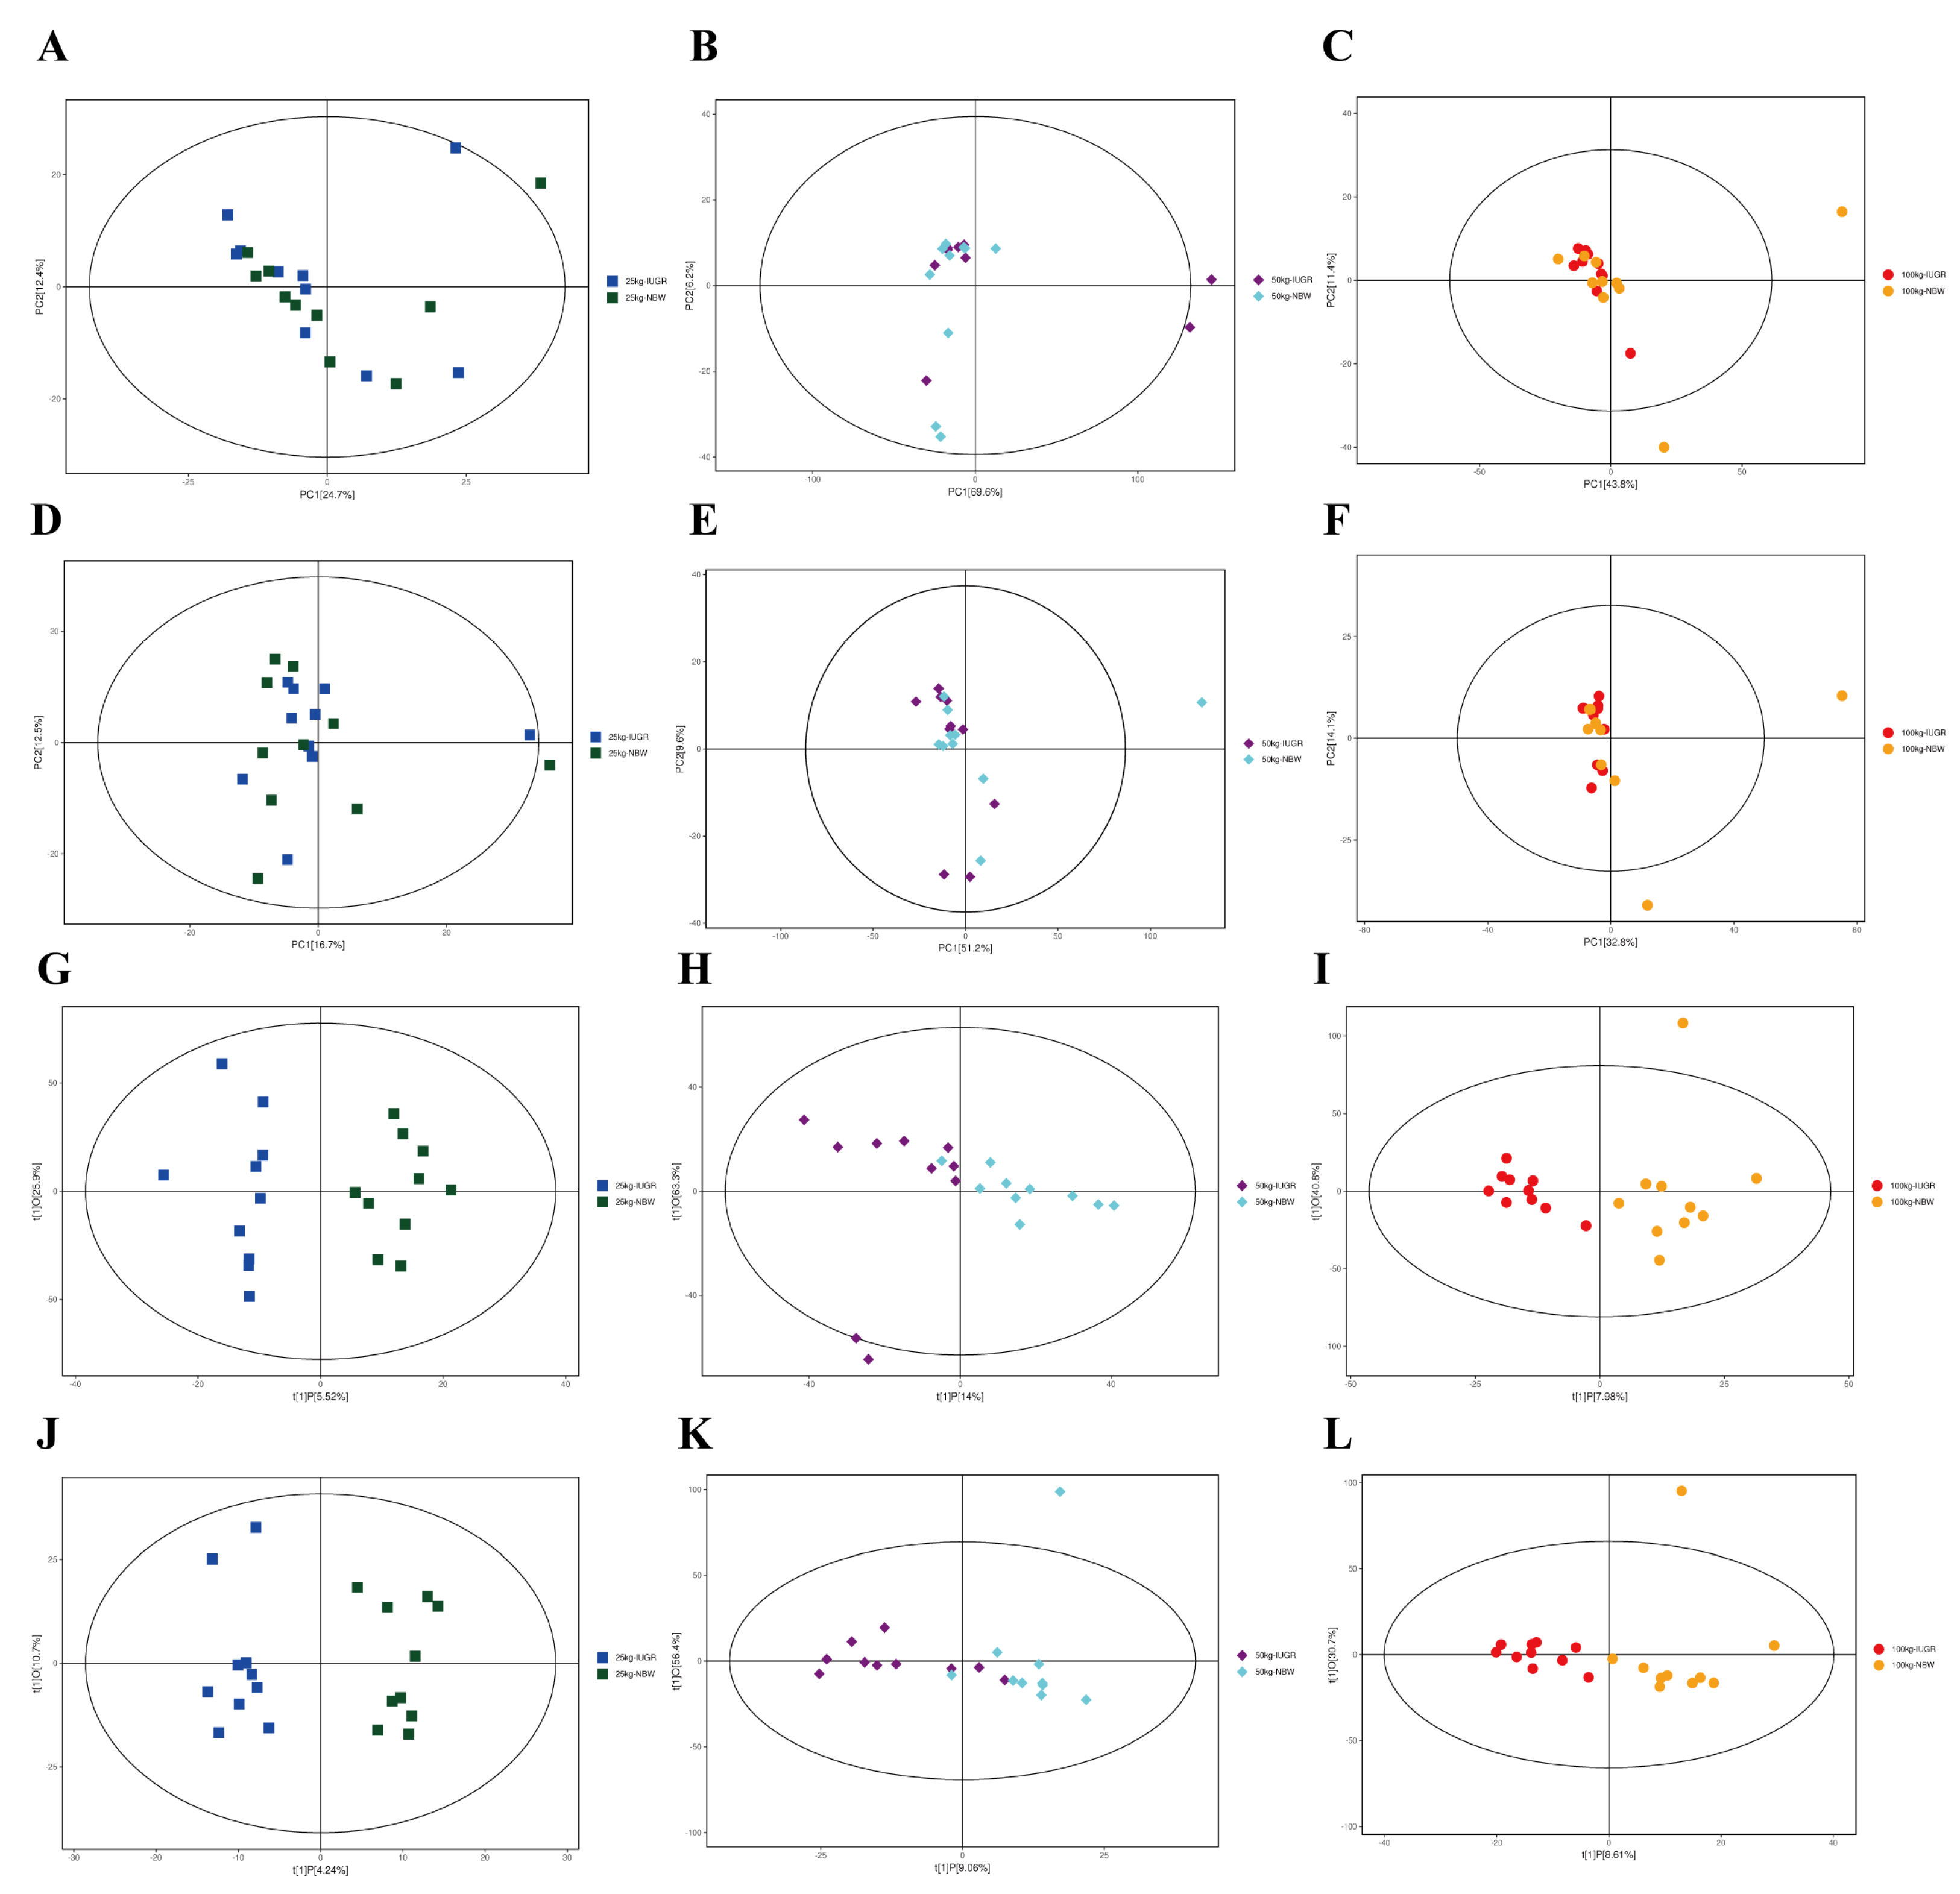
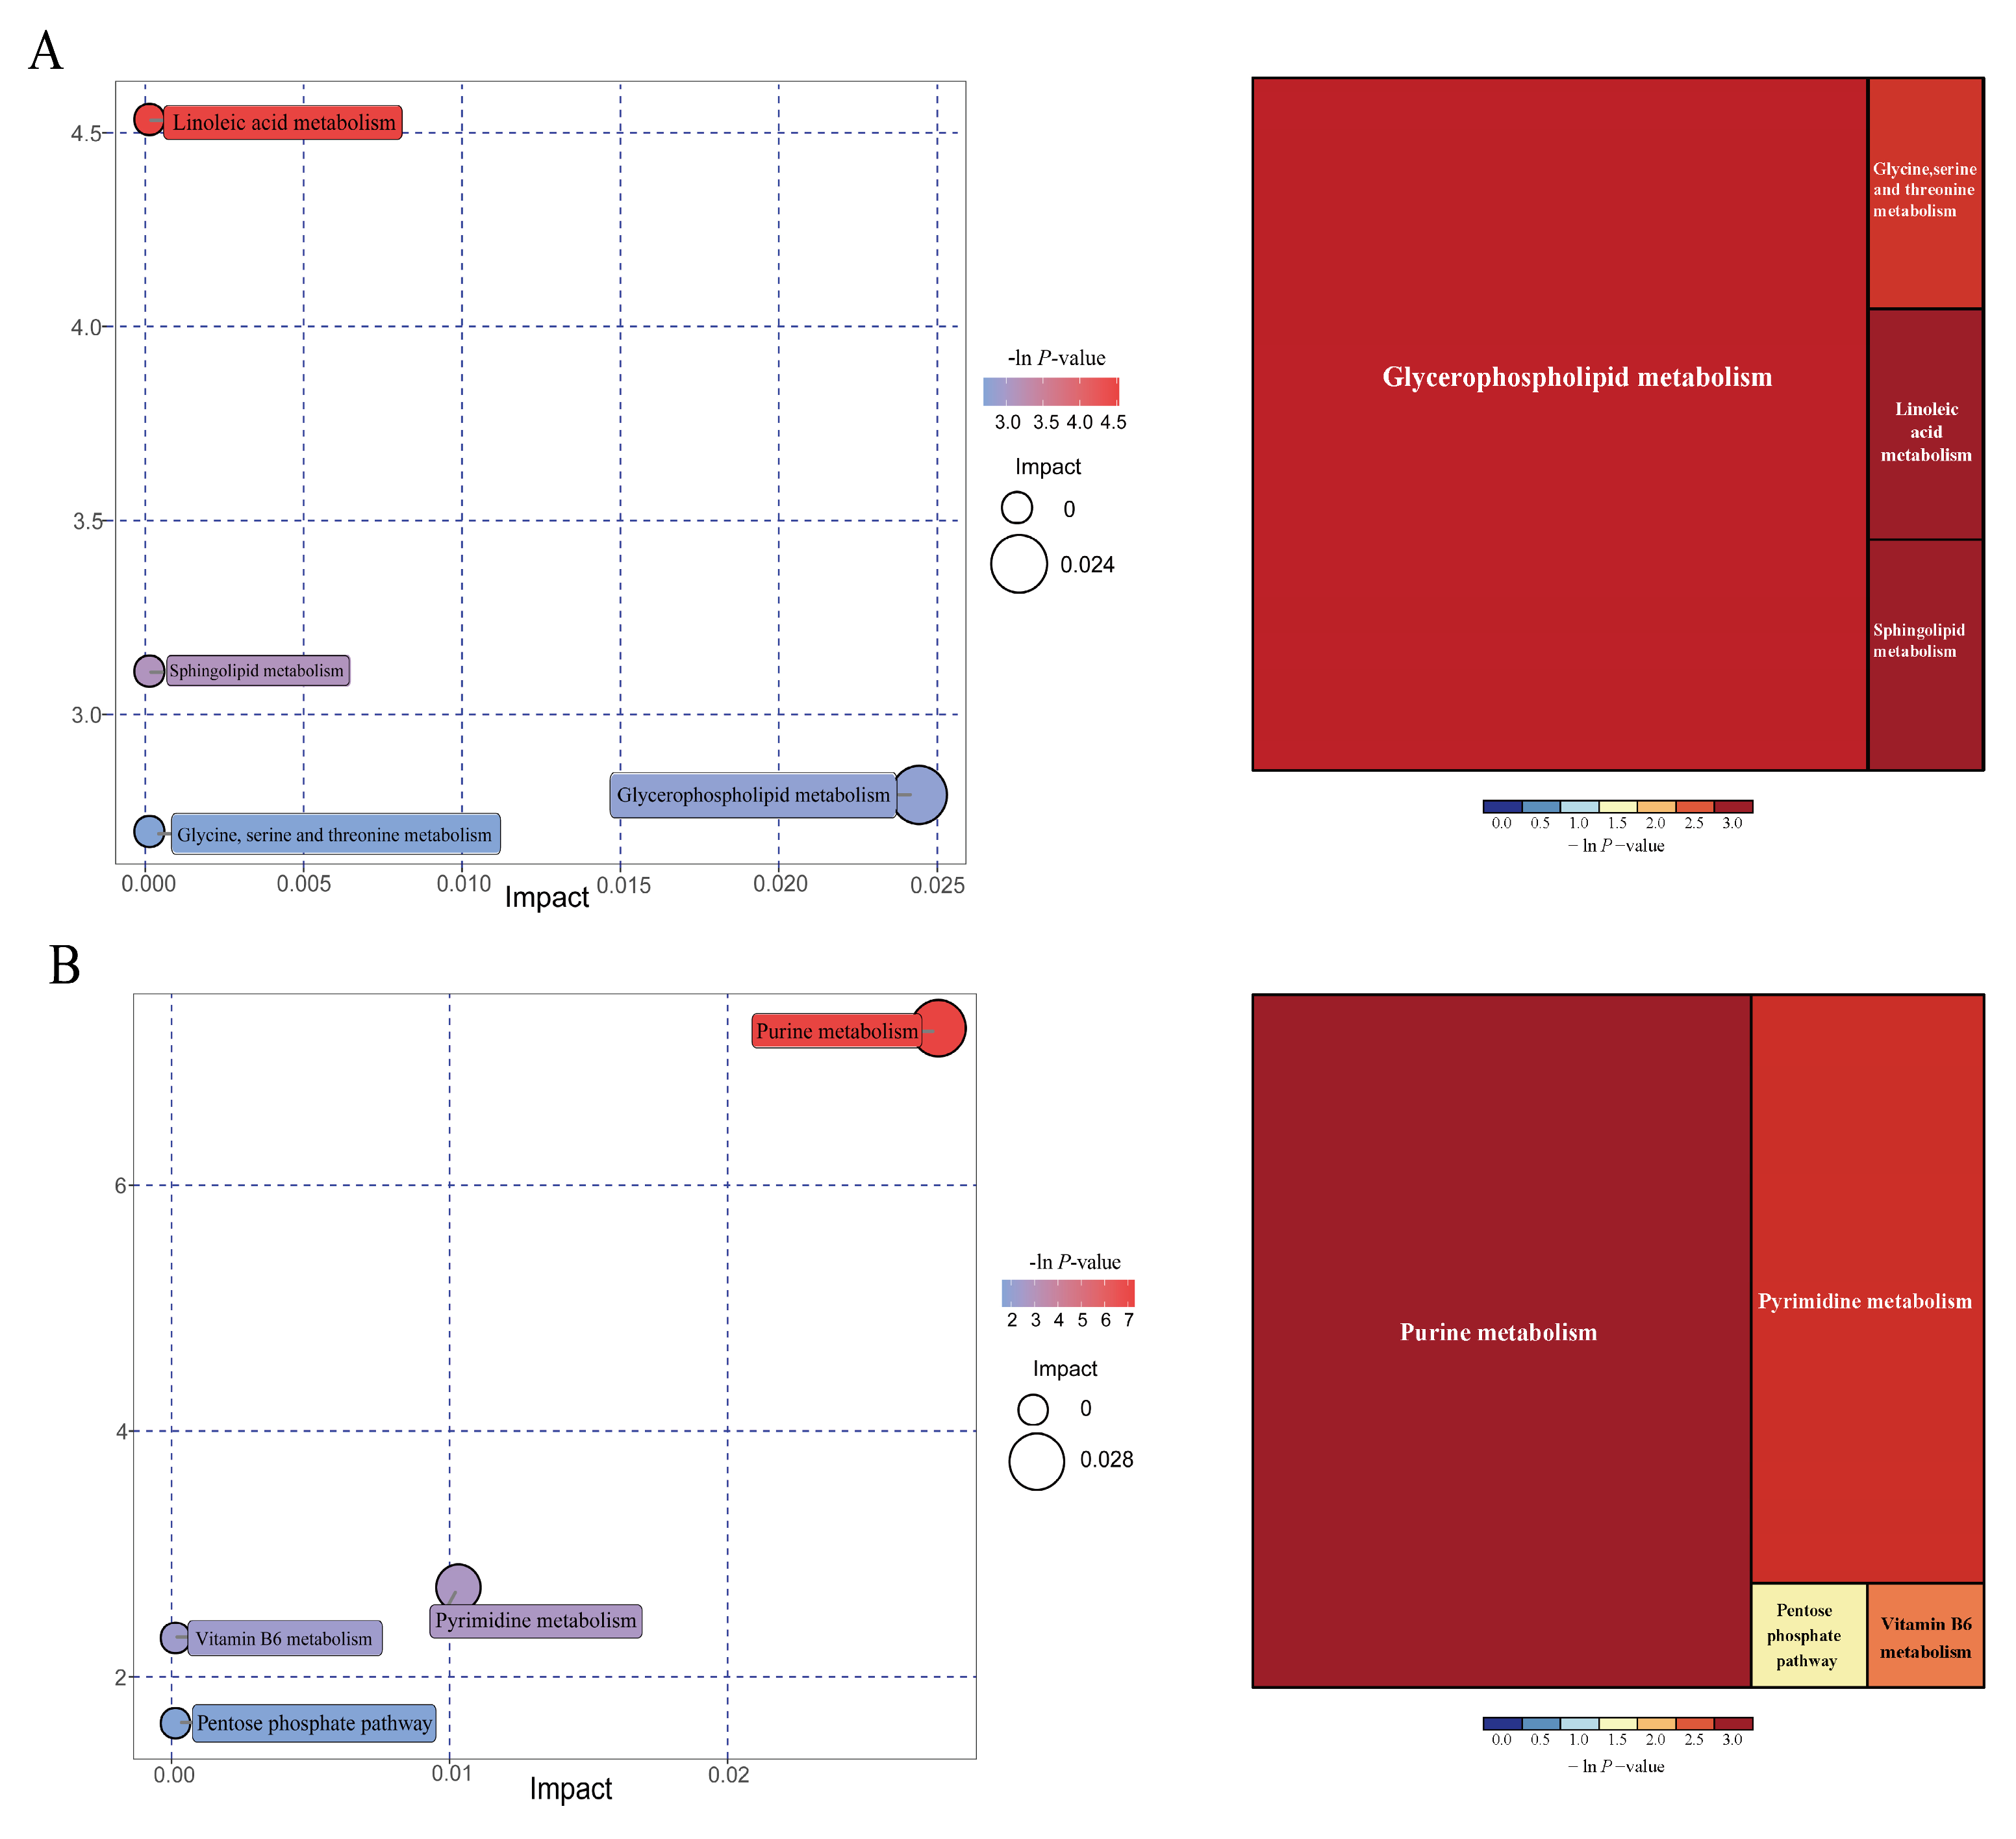
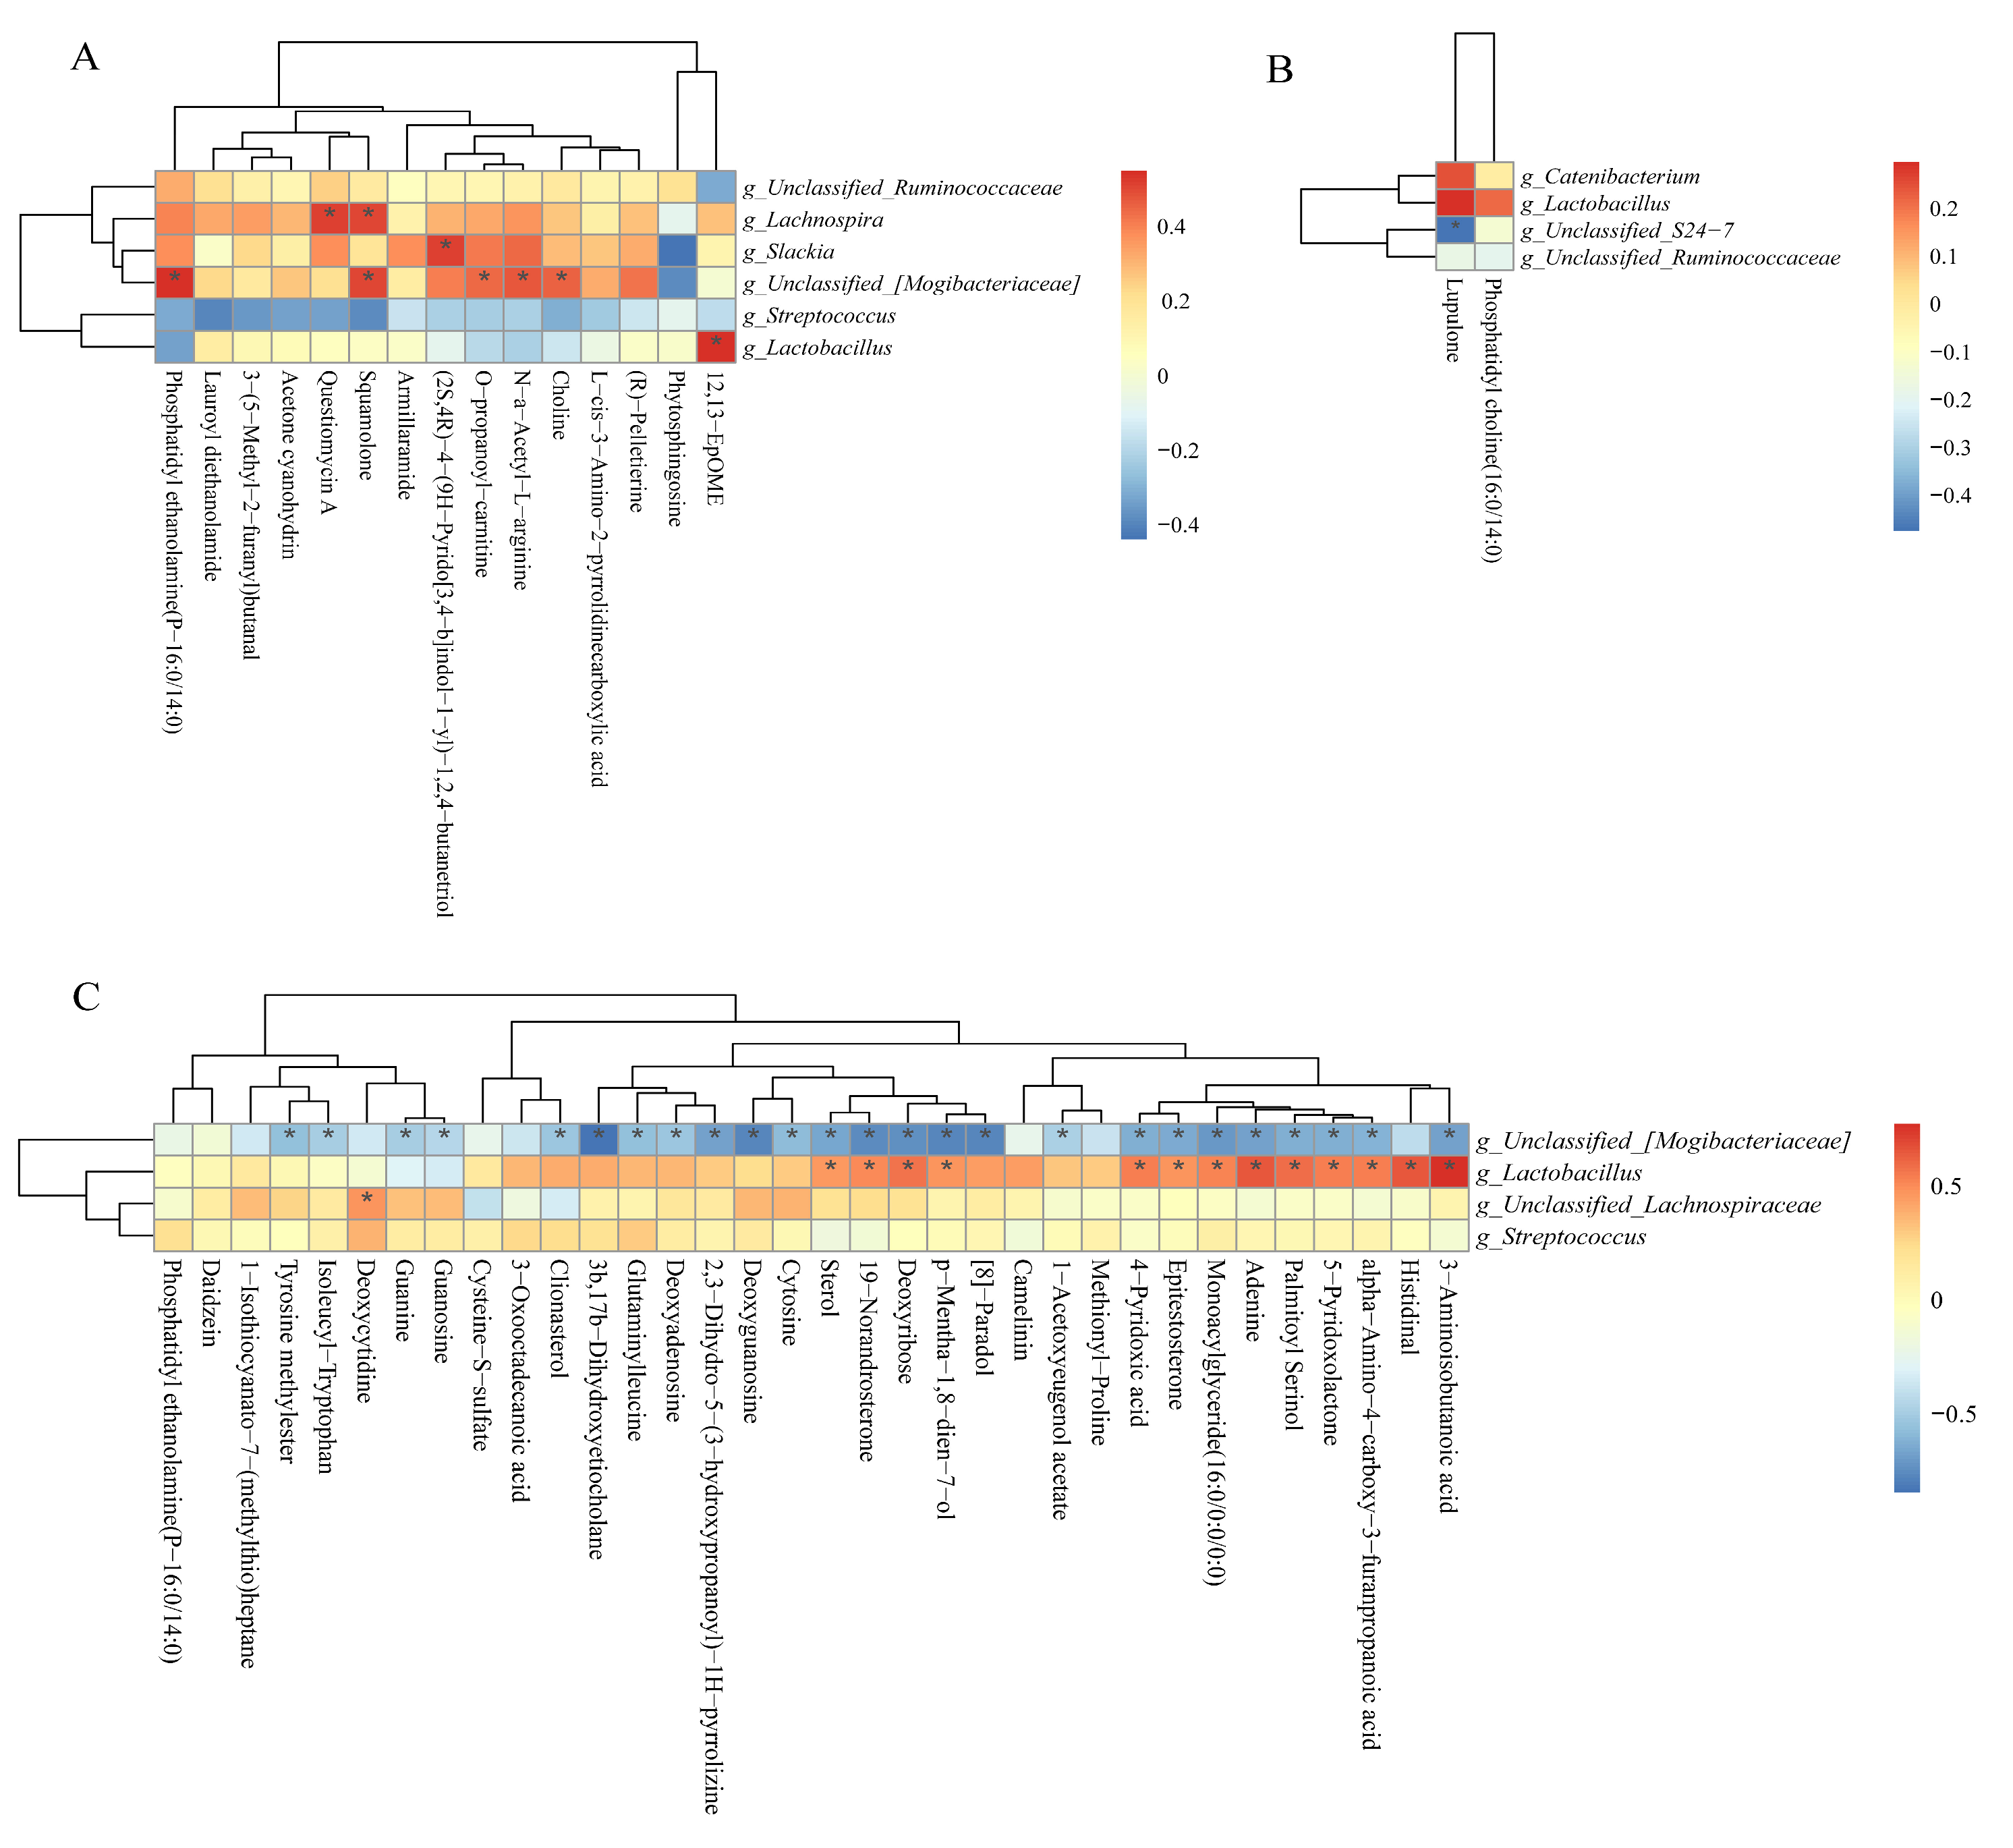
| Items | 25 kg BW stage | 50 kg BW stage | 100 kg BW stage | |||
| NBW | IUGR | NBW | IUGR | NBW | IUGR | |
| ALB (g/L) | 34.33±1.07 | 33.80±1.46 | 41.33±1.32 | 35.63±1.38* | 52.39±0.89 | 47.74±1.54* |
| AMM (mol/L) | 171.90±15.90 | 157.13±3.93 | 164.17±22.40 | 234.97±23.29* | 159.02±17.19 | 206±23.63 |
| ALT (U/L) | 41.00±1.90 | 45.66±2.05 | 31.42±1.68 | 37.66±1.48* | 41.42±2.01 | 38.77±2.05 |
| AST (U/L) | 68.29±4.09 | 80.71±5.22 | 65.50±4.63 | 73.33±5.79 | 63.92±4.94 | 75.64±13.31 |
| ALP (U/L) | 256.00±7.74 | 298.86±3.94* | 170.42±8.83 | 177.25±9.86 | 138.08±7.62 | 138.82±7.30 |
| CHO (mmol/L) | 2.60±0.02 | 2.37±0.12 | 2.26±0.06 | 2.48±0.10* | 2.48±0.07 | 2.58±0.05 |
| CHE (g/L) | 600.00±27.93 | 598.57±21.76 | 717.67±27.08 | 630.42±23.26* | 585.17±26.63 | 606.27±34.66 |
| GLB (g/L) | 21.60±1.17 | 21.91±0.95 | 26.53±1.33 | 28.46±1.96 | 26.36±2.10 | 25.26±2.03 |
| GLU (mmol/L) | 6.60±0.10 | 4.94±0.20* | 6.17±0.24 | 5.33±0.29* | 5.83±0.30 | 5.80±0.71 |
| HDL-C (mmol/L) | 0.94±0.03 | 1.05±0.05 | 0.93±0.04 | 0.98±0.04 | 1.15±0.06 | 1.07±0.05 |
| LDL-C (mmol/L) | 1.42±0.01 | 1.50±0.07 | 1.17±0.05 | 1.20±0.06 | 1.36±0.04 | 1.41±0.04 |
| TG (mmol/L) | 0.53±0.01 | 0.57±0.01 | 0.46±0.03 | 0.57±0.04* | 0.61±0.05 | 0.67±0.07 |
| TP (g/L) | 55.93±1.63 | 55.71±0.71 | 67.86±1.19 | 64.09±0.94* | 78.75±1.87 | 73.00±1.89* |
| UN (mmol/L) | 2.34±0.21 | 2.03±0.09 | 4.28±0.34 | 3.72±0.36 | 6.64±0.34 | 7.65±0.30* |
| Items, (%) | 25 kg BW stage | 50 kg BW stage | 100 kg BW stage | |||
| NBW | IUGR | NBW | IUGR | NBW | IUGR | |
| Firmicutes | 86.11±2.74 | 78.93±4.38 | 84.89±5.49 | 92.35±1.51 | 91.41±1.49 | 95.87±0.66* |
| Bacteroidetes | 9.38±2.35 | 17.47±4.21 | 13.70±0.05 | 5.22±0.61 | 4.45±1.49 | 2.89±0.62 |
| F/B | 13.58±3.53 | 6.21±1.72* | 19.14±3.14 | 40.79±6.35 | 37.57±6.58 | 35.50±5.45 |
| Lactobacillaceae | 27.25±4.28 | 64.74±8.50* | 53.39±6.48 | 55.18±7.46 | 22.63±3.86 | 27.45±4.83 |
| Streptococcus | 32.23±5.62 | 16.82±3.71* | 7.54±0.04 | 6.99±0.03 | 18.45±2.54 | 17.98±3.55 |
| Lactobacillus | 21.23±2.67 | 20.56±2.54 | 53.39±4.75 | 55.18±5.45 | 26.86±3.30 | 22.34±3.42 |
| unclassified_Lachnospiraceae | 1.60±0.25 | 2.27±0.47 | 3.62±0.08 | 6.99±0.18 | 25.21±4.35 | 16.27±3.68 |
| Items, (mg/g) | 25 kg BW stage | 50 kg BW stage | 100 kg BW stage | |||
| NBW | IUGR | NBW | IUGR | NBW | IUGR | |
| Acetate | 3.29±0.08 | 3.21±0.32 | 4.79±0.27 | 4.66±0.24 | 5.12±0.17 | 4.40±0.17* |
| Propionate | 1.49±0.03 | 1.47±0.19 | 1.81±0.08 | 1.70±0.10 | 1.81±0.16 | 1.75±0.14 |
| Isobutyrate | 0.19±0.02 | 0.14±0.01* | 0.20±0.04 | 0.23±0.03 | 0.28±0.02 | 0.19±0.02* |
| Butyrate | 1.11±0.06 | 0.90±0.07* | 1.57±0.13 | 1.19±0.11* | 1.22±0.09 | 1.20±0.14 |
| Isovalerate | 0.30±0.03 | 0.22±0.02* | 0.34±0.08 | 0.37±0.05 | 0.48±0.04 | 0.33±0.04* |
| Valerate | 0.28±0.04 | 0.25±0.03 | 0.51±0.06 | 0.29±0.03* | 0.31±0.01 | 0.28±0.04 |
| SCFAs | 6.17±0.11 | 5.84±0.52 | 8.50±0.36 | 7.99±0.39 | 8.20±0.42 | 7.79±0.41 |
| BCFAs | 0.49±0.04 | 0.36±0.02* | 0.54±0.12 | 0.61±0.08 | 0.76±0.06 | 0.52±0.06* |
| Total SCFAs | 6.62±0.12 | 6.20±0.53 | 9.04±0.46 | 8.60±0.45 | 8.96±0.39 | 8.39±0.44 |
| Items, (mg/g) | 25 kg BW stage | 50 kg BW stage | 100 kg BW stage | |||
| NBW | IUGR | NBW | IUGR | NBW | IUGR | |
| 1,7-heptyl diamine | 0.22±0.07 | 0.11±0.01 | 0.14±0.03 | 0.11±0.02 | 0.16±0.06 | 0.08±0.01 |
| Cadaverine | 3.65±0.70 | 6.65±0.53* | 2.96±0.91 | 2.44±0.84 | 1.46±0.22 | 0.72±0.18* |
| Indole | 4.58±1.31 | 6.56±2.43 | 7.18±1.52 | 2.41±0.59* | 11.15±1.28 | 7.24±0.92* |
| Phenylethylamine | 0.13±0.04 | 0.09±0.03 | 0.10±0.02 | 0.08±0.02 | 0.10±0.04 | 0.04±0.01 |
| Putrescine | 2.46±0.41 | 2.62±0.36 | 4.00±0.67 | 2.03±0.40* | 1.36±0.23 | 0.69±0.16* |
| Skatole | 13.20±3.20 | 10.97±2.3 | 18.21±2.16 | 17.63±4.55 | 18.08±3.44 | 21.29±5.81 |
| Spermidine | 3.33±0.74 | 2.29±0.27 | 2.60±0.41 | 2.34±0.35 | 1.50±0.22 | 1.24±0.15 |
| Spermine | 0.53±0.12 | 0.47±0.08 | 0.47±0.07 | 0.37±0.04 | 0.18±0.02 | 0.16±0.02 |
| Tryptamine | 1.03±0.22 | 0.37±0.12 | 0.41±0.12 | 0.24±0.06 | 0.23±0.06 | 0.16±0.05 |
| Tyramine | 1.56±0.32 | 1.54±0.31 | 0.48±0.17 | 0.58±0.19 | 1.13±0.33 | 0.74±0.19 |
| Total bioamine | 13.85±2.72 | 13.81±1.22 | 11.50±1.71 | 8.70±1.82 | 5.95±1.04 | 3.61±0.49 |
| Pathways | P-values | Impact | Matched significantly differential metabolites |
| 25 kg BW stage | |||
| Linoleic acid metabolism | 0.011 | 0 | 12,13-EpOME |
| Sphingolipid metabolism | 0.045 | 0 | Phytosphingosine |
| Glycerophospholipid metabolism | 0.061 | 0.024 | Choline |
| Glycine, serine, and threonine metabolism | 0.067 | 0 | Choline |
| 100 kg BW stage | |||
| Purine metabolism | 0.001 | 0.027 | Deoxyadenosine; guanine; Deoxyguanosine; guanosine; adenine |
| Pyrimidine metabolism | 0.065 | 0.010 | Deoxycytidine; 3-aminoisobutanoic acid |
| Vitamin B6 metabolism | 0.099 | 0 | 4-pyridoxic acid |
| Pentose phosphate pathway | 0.198 | 0 | Deoxyribose |
Disclaimer/Publisher’s Note: The statements, opinions and data contained in all publications are solely those of the individual author(s) and contributor(s) and not of MDPI and/or the editor(s). MDPI and/or the editor(s) disclaim responsibility for any injury to people or property resulting from any ideas, methods, instructions or products referred to in the content. |
© 2023 by the authors. Licensee MDPI, Basel, Switzerland. This article is an open access article distributed under the terms and conditions of the Creative Commons Attribution (CC BY) license (http://creativecommons.org/licenses/by/4.0/).


