Submitted:
28 December 2023
Posted:
29 December 2023
You are already at the latest version
Abstract
Keywords:
1. Introduction
1.1. Introduction to Port Challenges in Trois-Rivières: A Response to Industrial Growth
1.2. A Comprehensive Literature Perspective on Ports as Complex Operational Hubs
1.3. In-Depth Analysis of Strategies and Simulation Insights for Mitigating Landside Congestion
1.4. Truck-Based Appointment Systems in Congestion Management: A Closer Look
1.5. Assessment of Port Performance Metrics in Addressing Landside Congestion
1.6. Our Comprehensive and Informed Approach to Addressing Landside Access Congestion
- The adoption of a nuanced simulation parameter configuration that considers spatial and temporal factors. The port is segmented into areas with distinct traffic and service level characteristics, allowing for a more dynamic representation of inter-arrival times based on access time. This methodology enables the detection of peak times and access-waiting times, addressing the shortcomings in previous studies where the temporal aspect of truck arrival and departure failed to reflect real-world variability.
- A scenario design approach is utilized, encompassing both partner engagement and a logical process to derive advised recommendations. This involves developing and analyzing various scenarios, from reference and exploration to improvement and robustness, each informed by the previous level's insights. This hierarchical approach ensures that each scenario is rooted in realistic port constraints, making our recommendations more practical and feasible for implementation.
- A key novelty of this paper lies in our approach to detailing port access data, which has enabled a comprehensive exploratory analysis, particularly focusing on the chronological aspects of access operations. This study stands out by differentiating between four types of vehicles, considering factors like inter-arrival times, access times at entry and exit, and turnaround times at the port. By incorporating realistic time variability, our approach marks a significant advancement over existing literature, offering enhanced relevance and accuracy. This distinct methodology is not only a contribution of this paper but also finds its practical demonstration in a real case study. The detailed exploration of these aspects, especially in the latter part of the analysis, sets the stage for a more informed and effective approach to port access management. Additionally, the approach, incorporating varied analytical techniques, offers a comprehensive understanding of managing port access during terminal construction. This research thereby fills critical gaps in the existing literature and contributes significantly to the field of port access management.
2. Materials and Methods
2.1. Data Collection and Processing
2.1.1. Data Collection
2.1.2. Data Processing
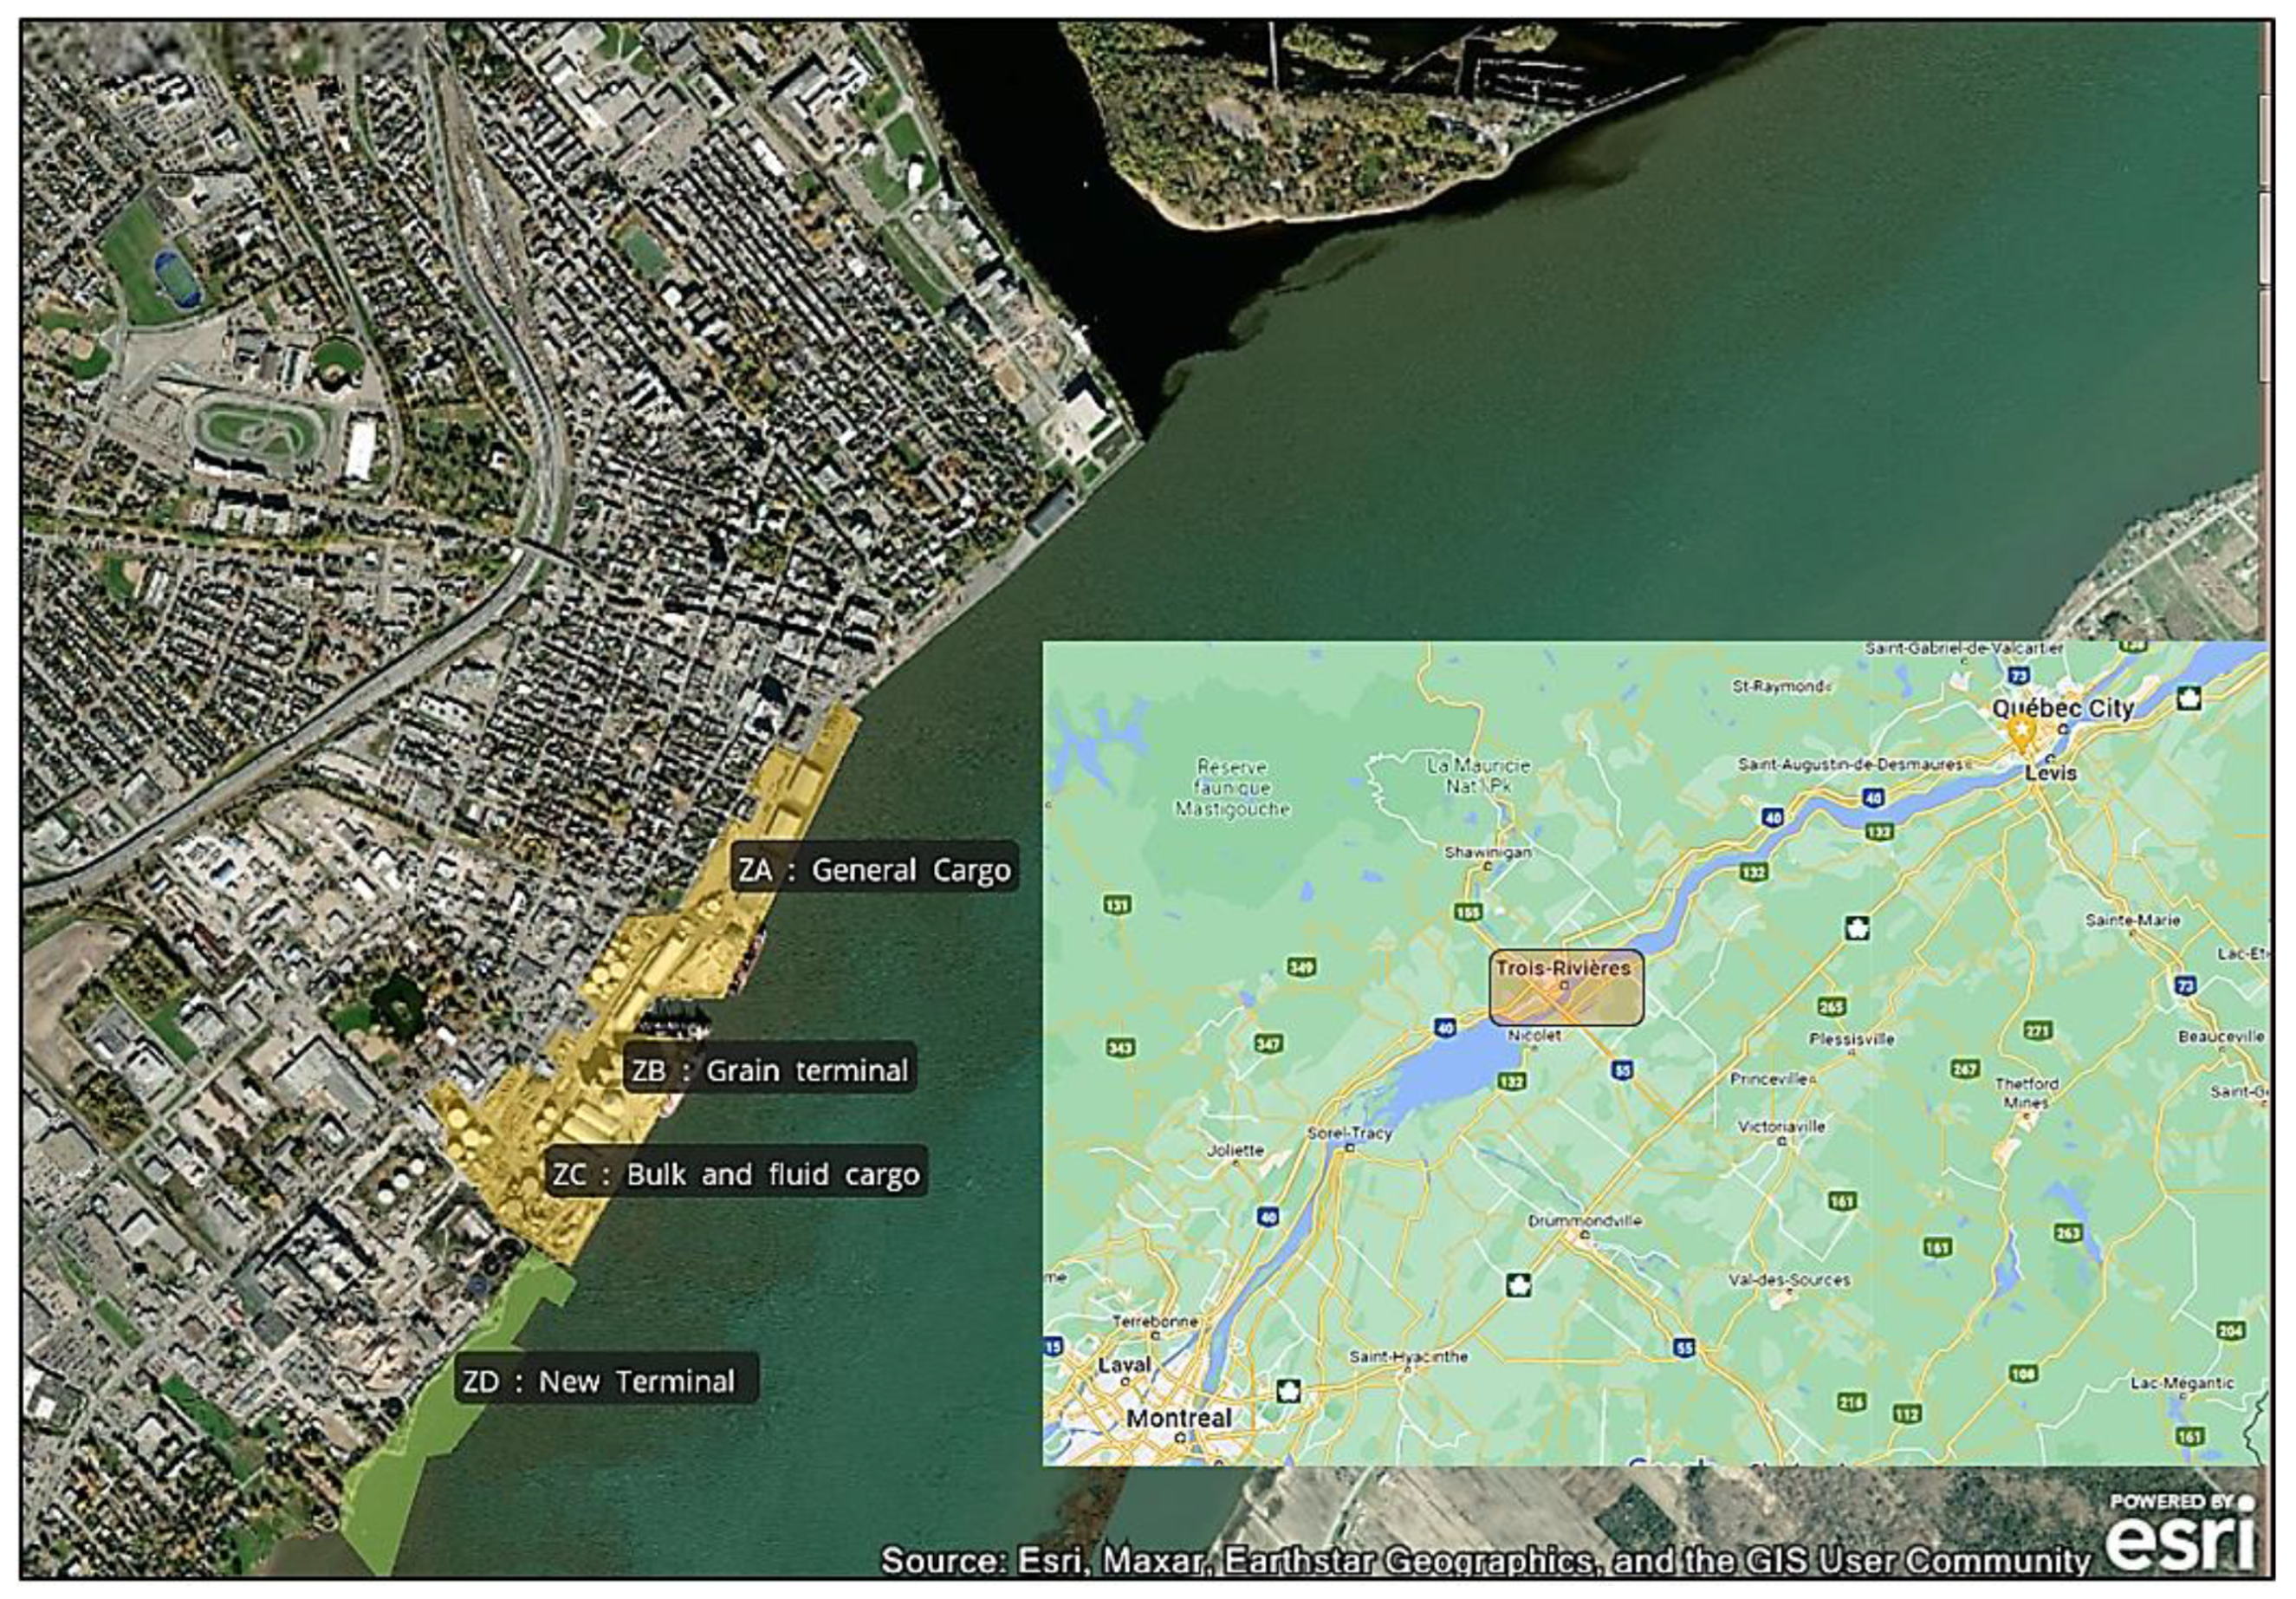
- Segmentation of the Port Into Four Areas
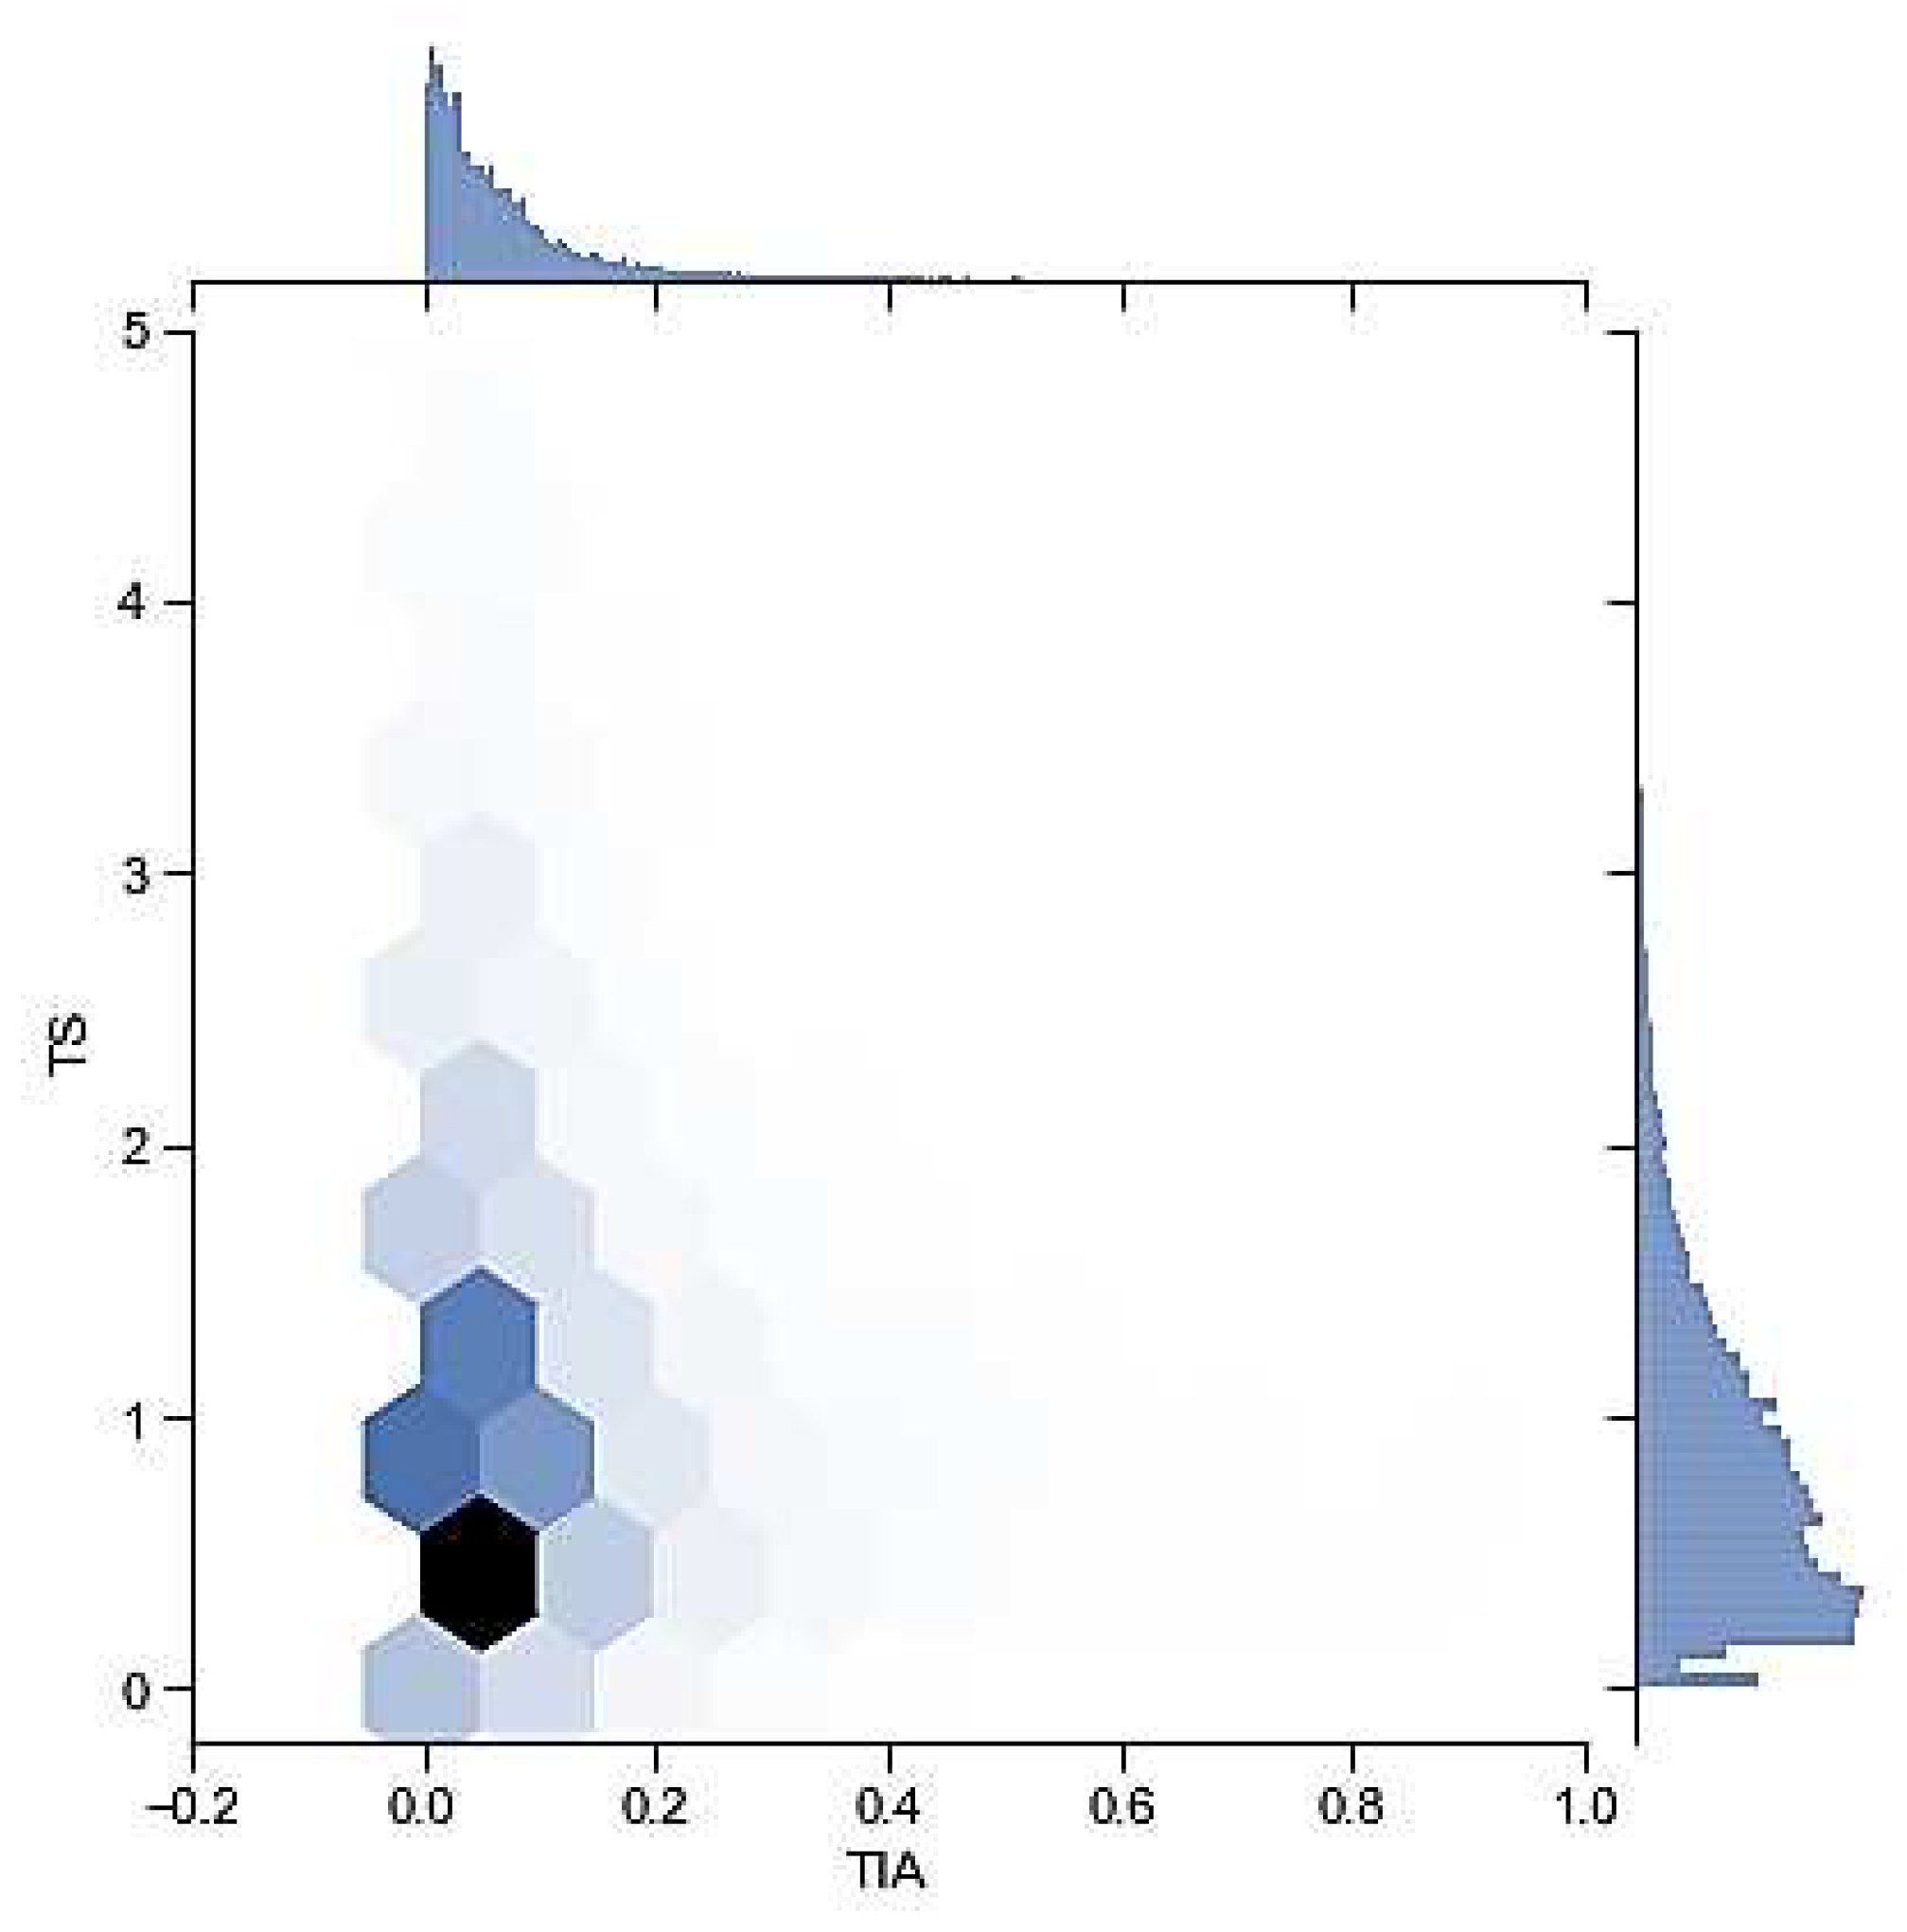
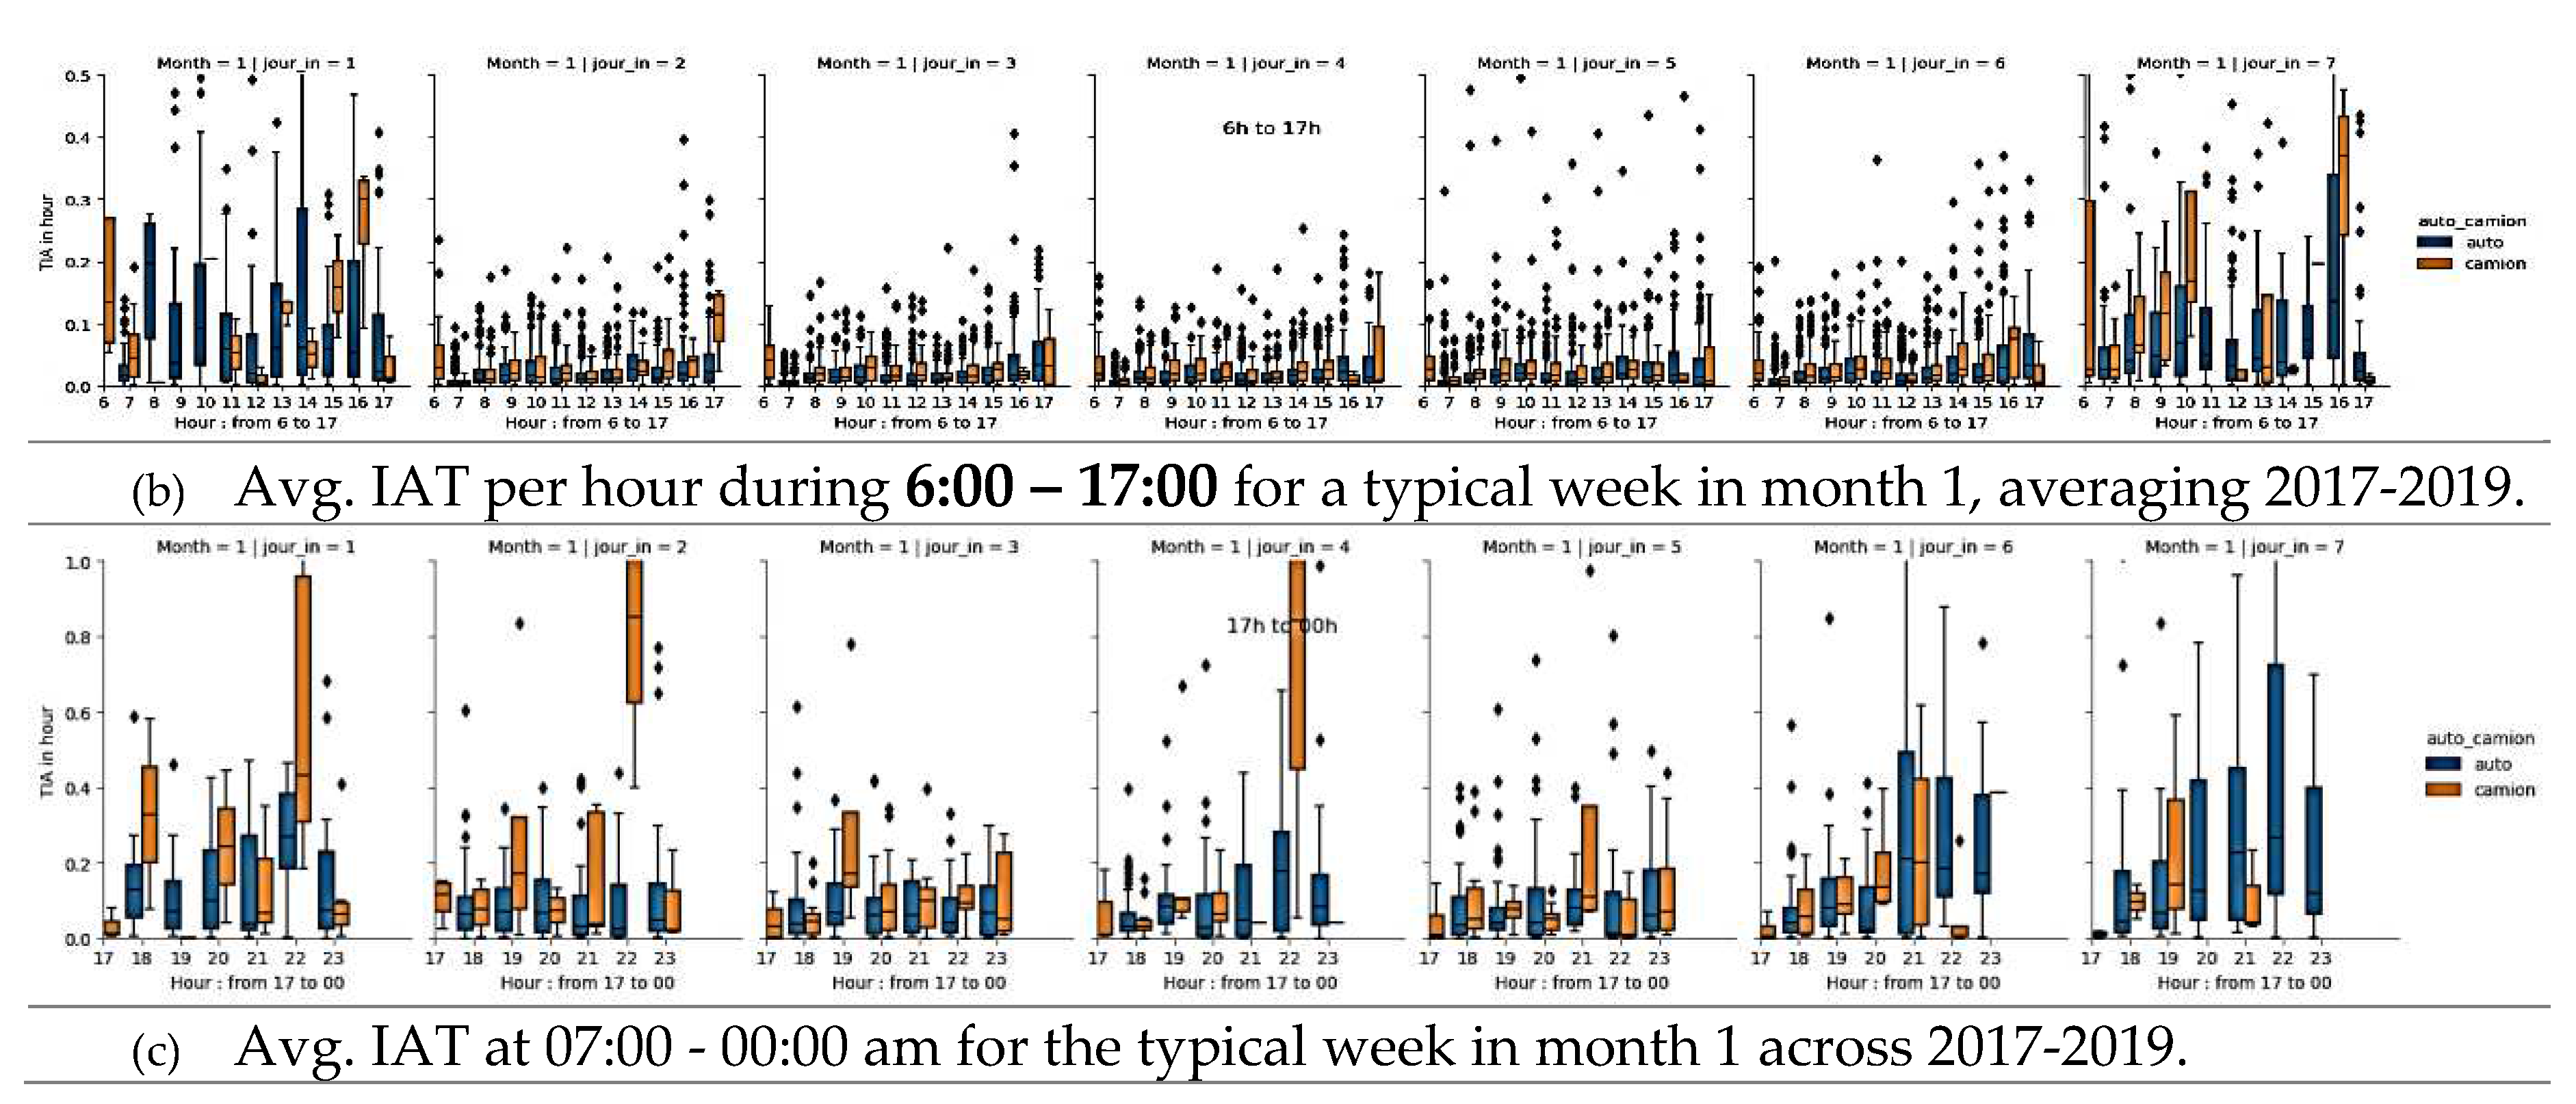
- Inter-arrival time
- Access Registration Time
- Parameters related to area D (new terminal)
2.1.3. Simulation Model Design and Validation.
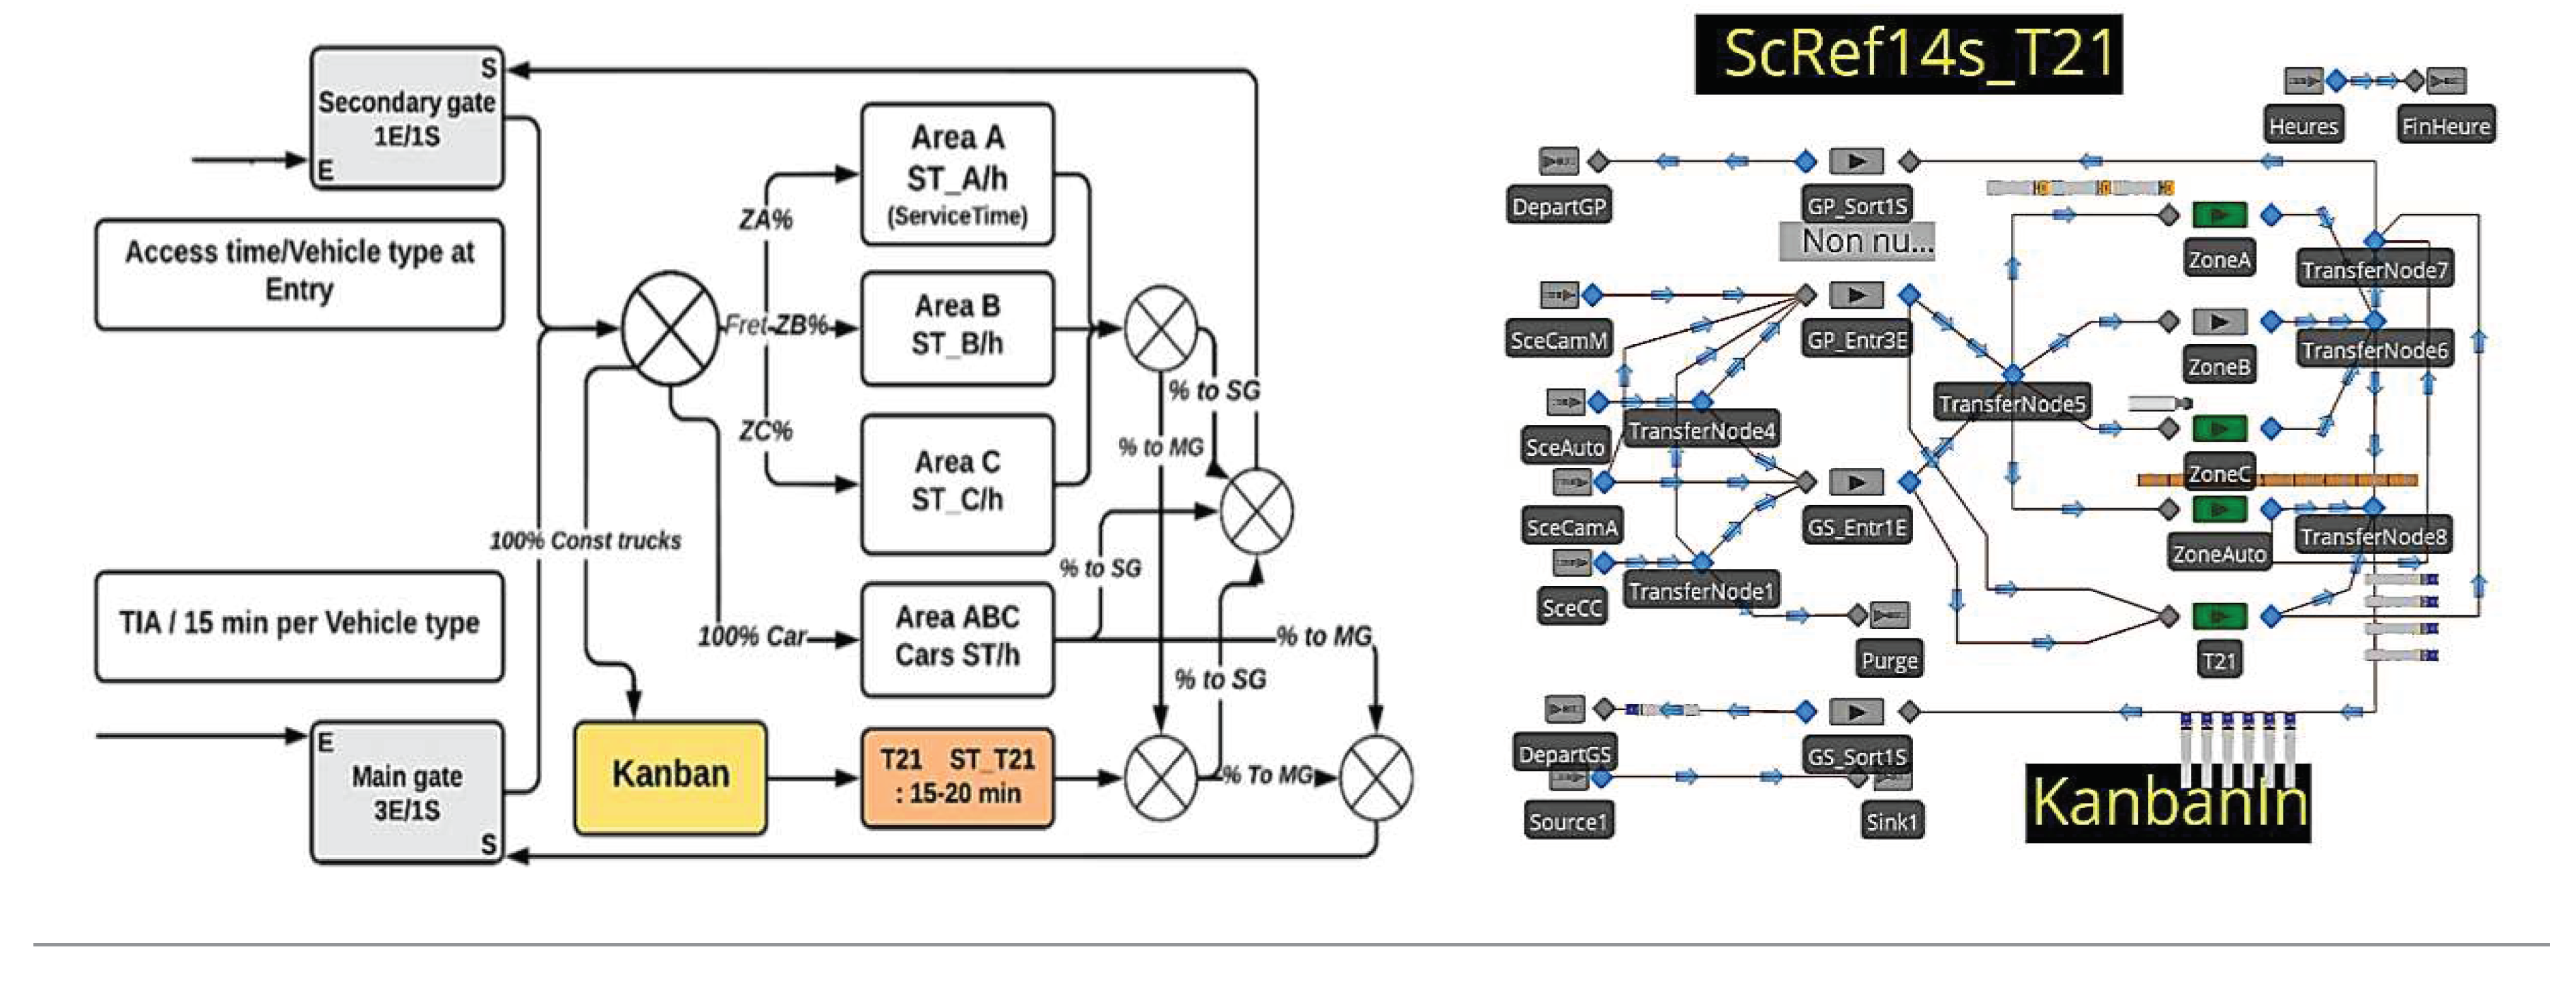
- Four flow sources for various vehicles (entities) types (manual access trucks, automatic access trucks, construction trucks, and cars) connected to current and potential access gates;
- A rate table is utilized to generate a flow of entities every 15 minutes, based on historical flow data. This table allows for the simulation model to capture the variability of IAT accurately, ensuring that the flow of entities aligns with historical trends;
- Stochastic entry and exit registration service times specific to each vehicle type;
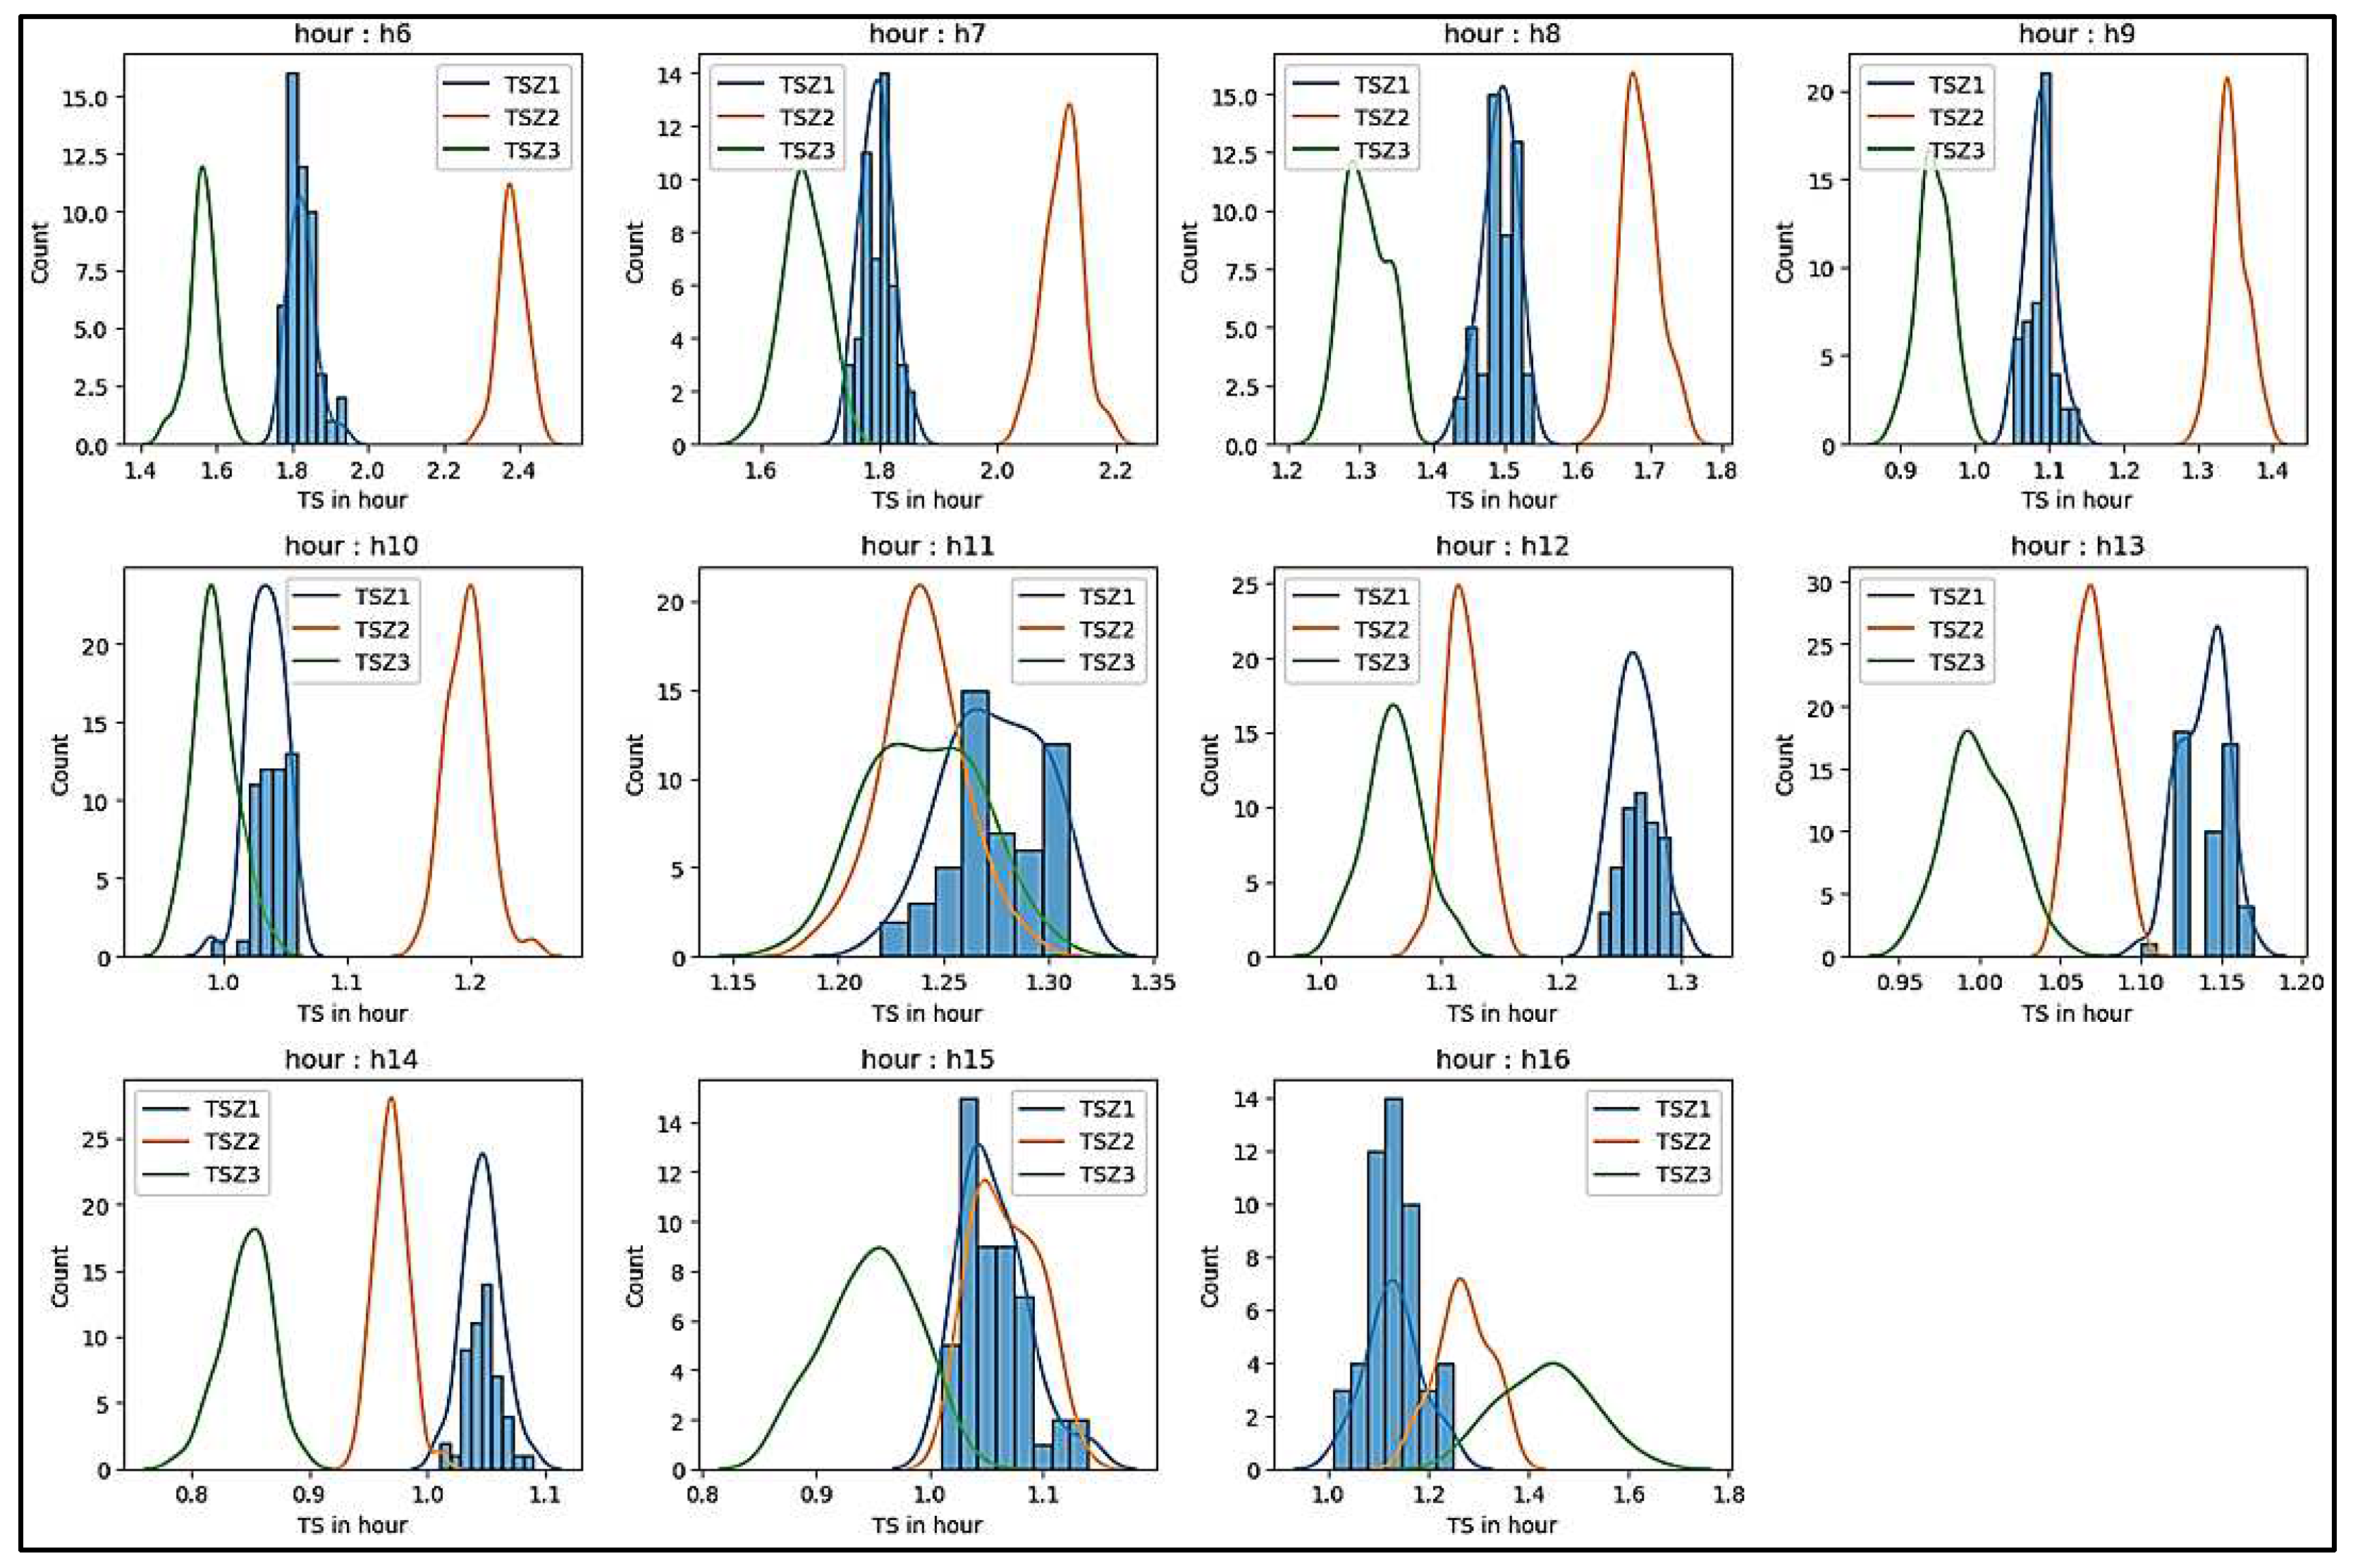
- Allocation of each vehicle to a destination area based on a stochastic flow and a specific stochastic TS;
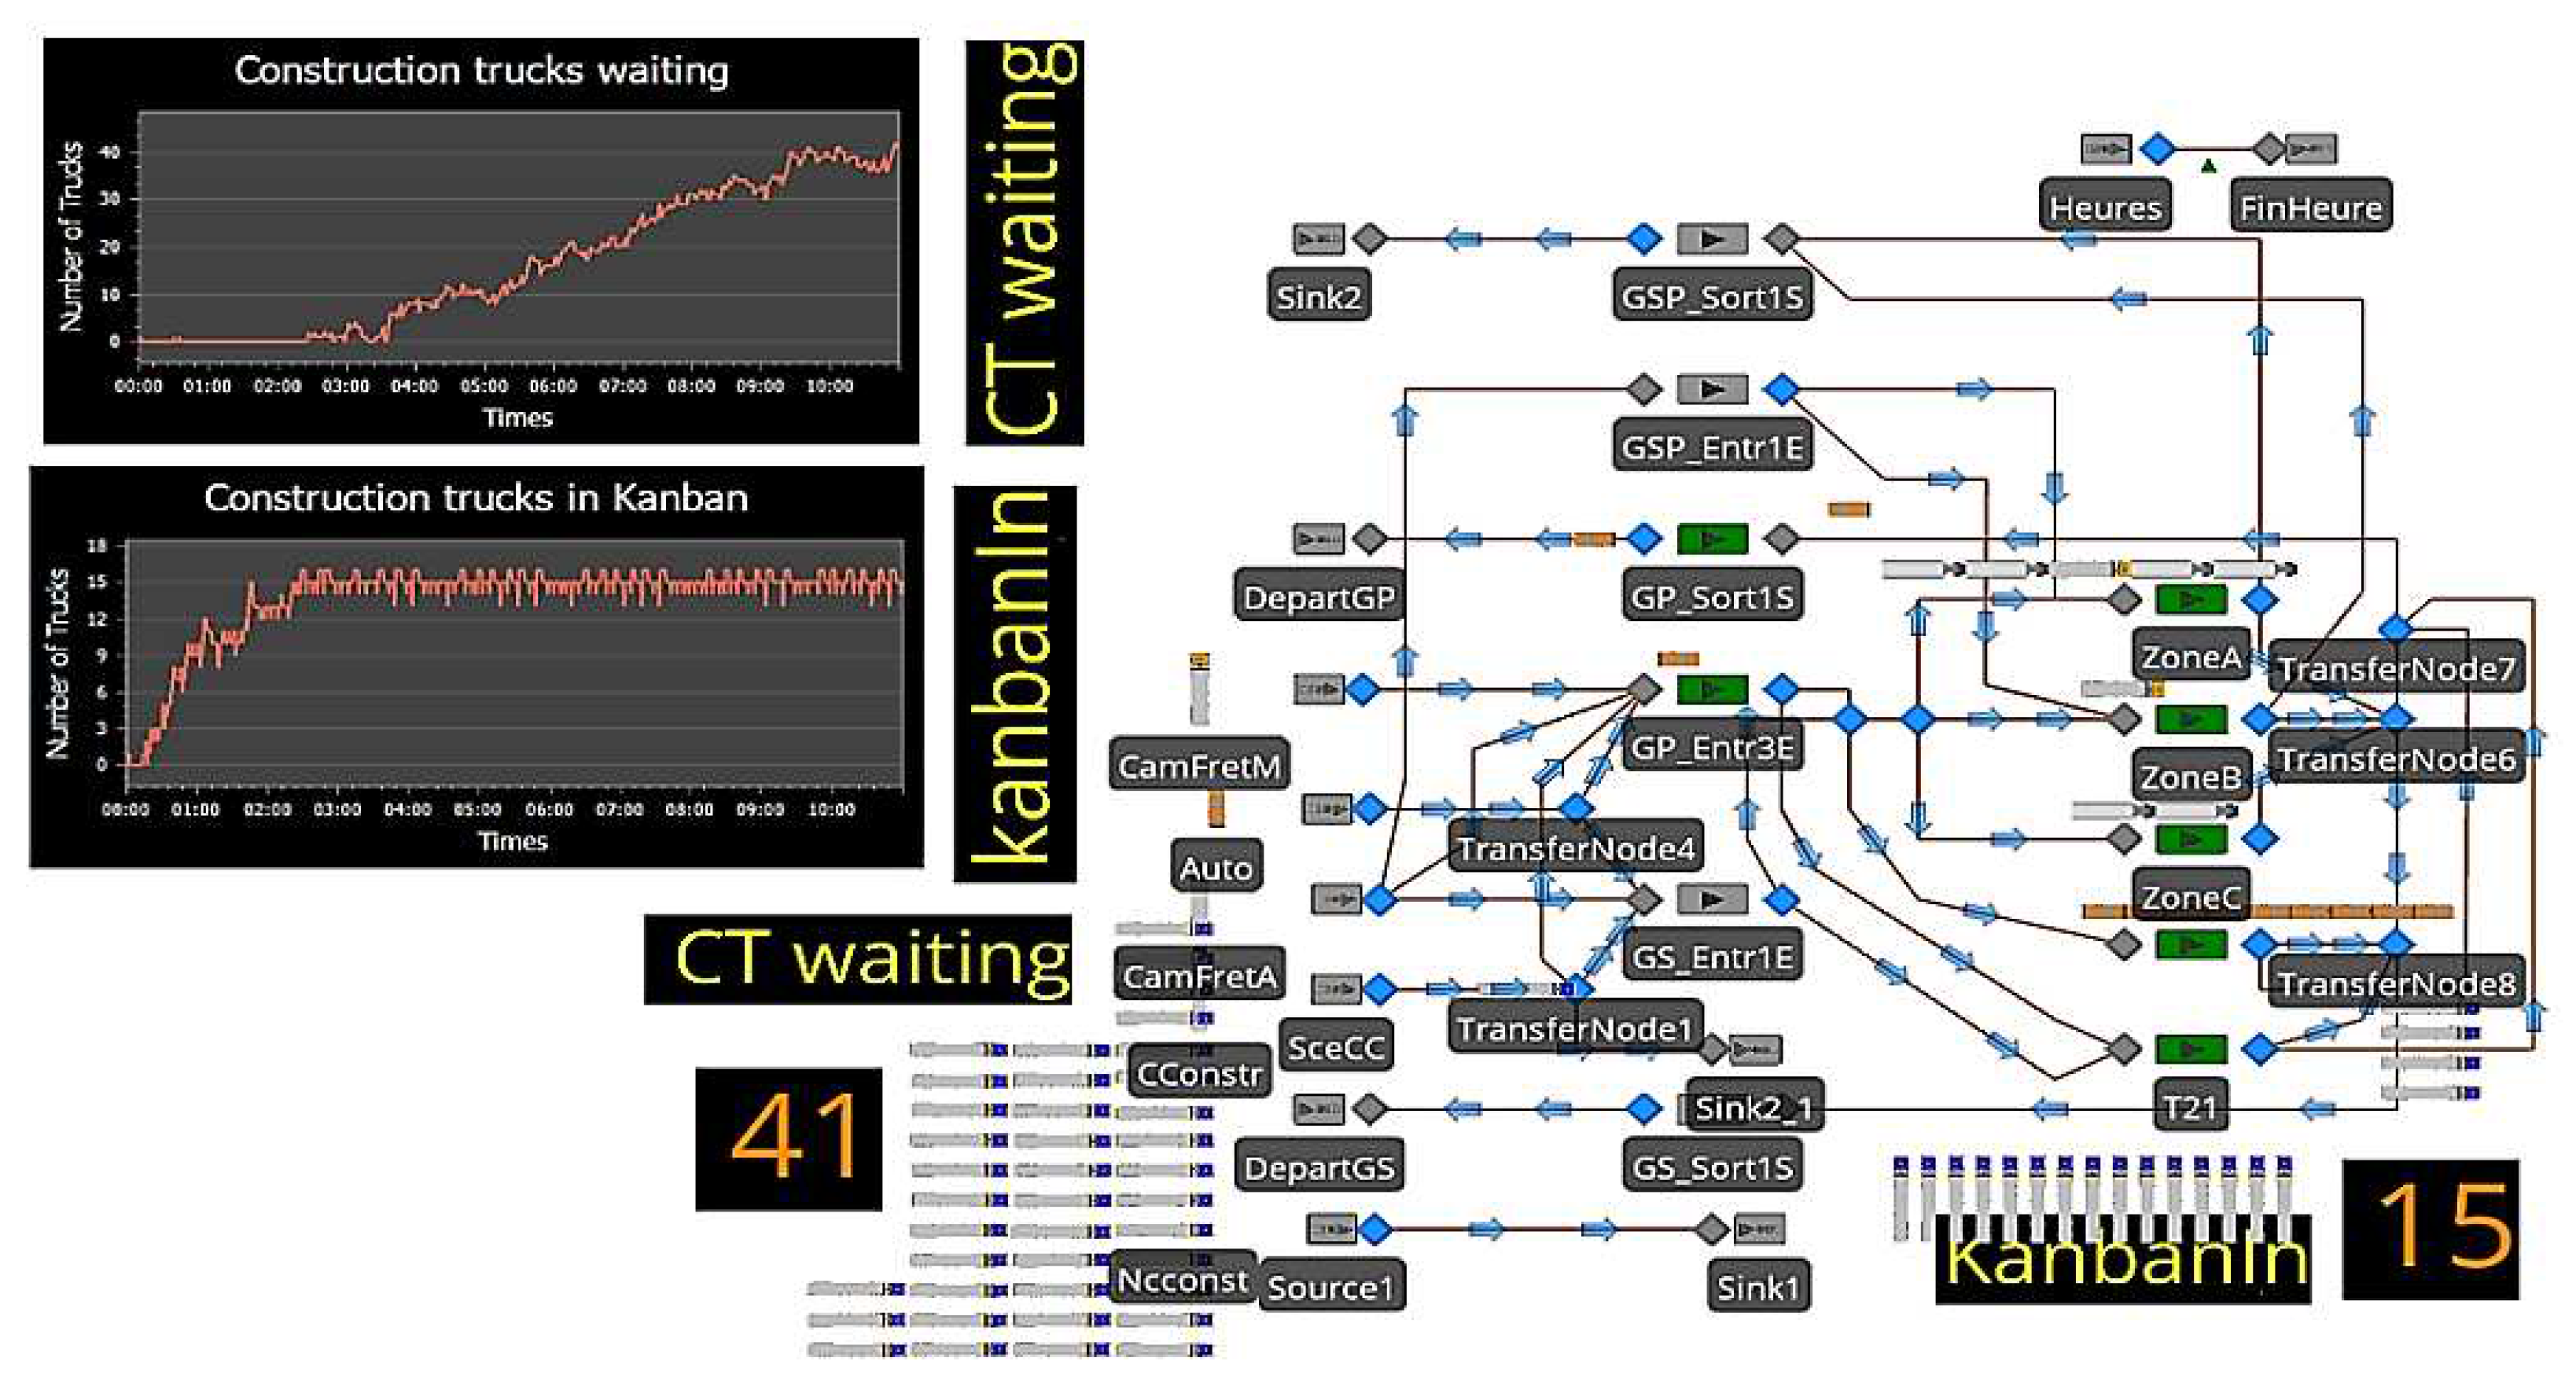
- A Kanban zone capable of accommodating up to 15 trucks waiting for unloading;
- Upon completion of their stay, vehicles depart from the port through a specifically designated exit gate;
- The simulated period is from 6:00 am to 5:00 pm daily, with a replication of 44 days to achieve a state of convergence for stochastic parameters;
- Construction trucks that exceed operational capacity are purged from the system and recorded for analysis.
2.2. Performance Indicators
2.3. Scenario-Based Analysis Approach
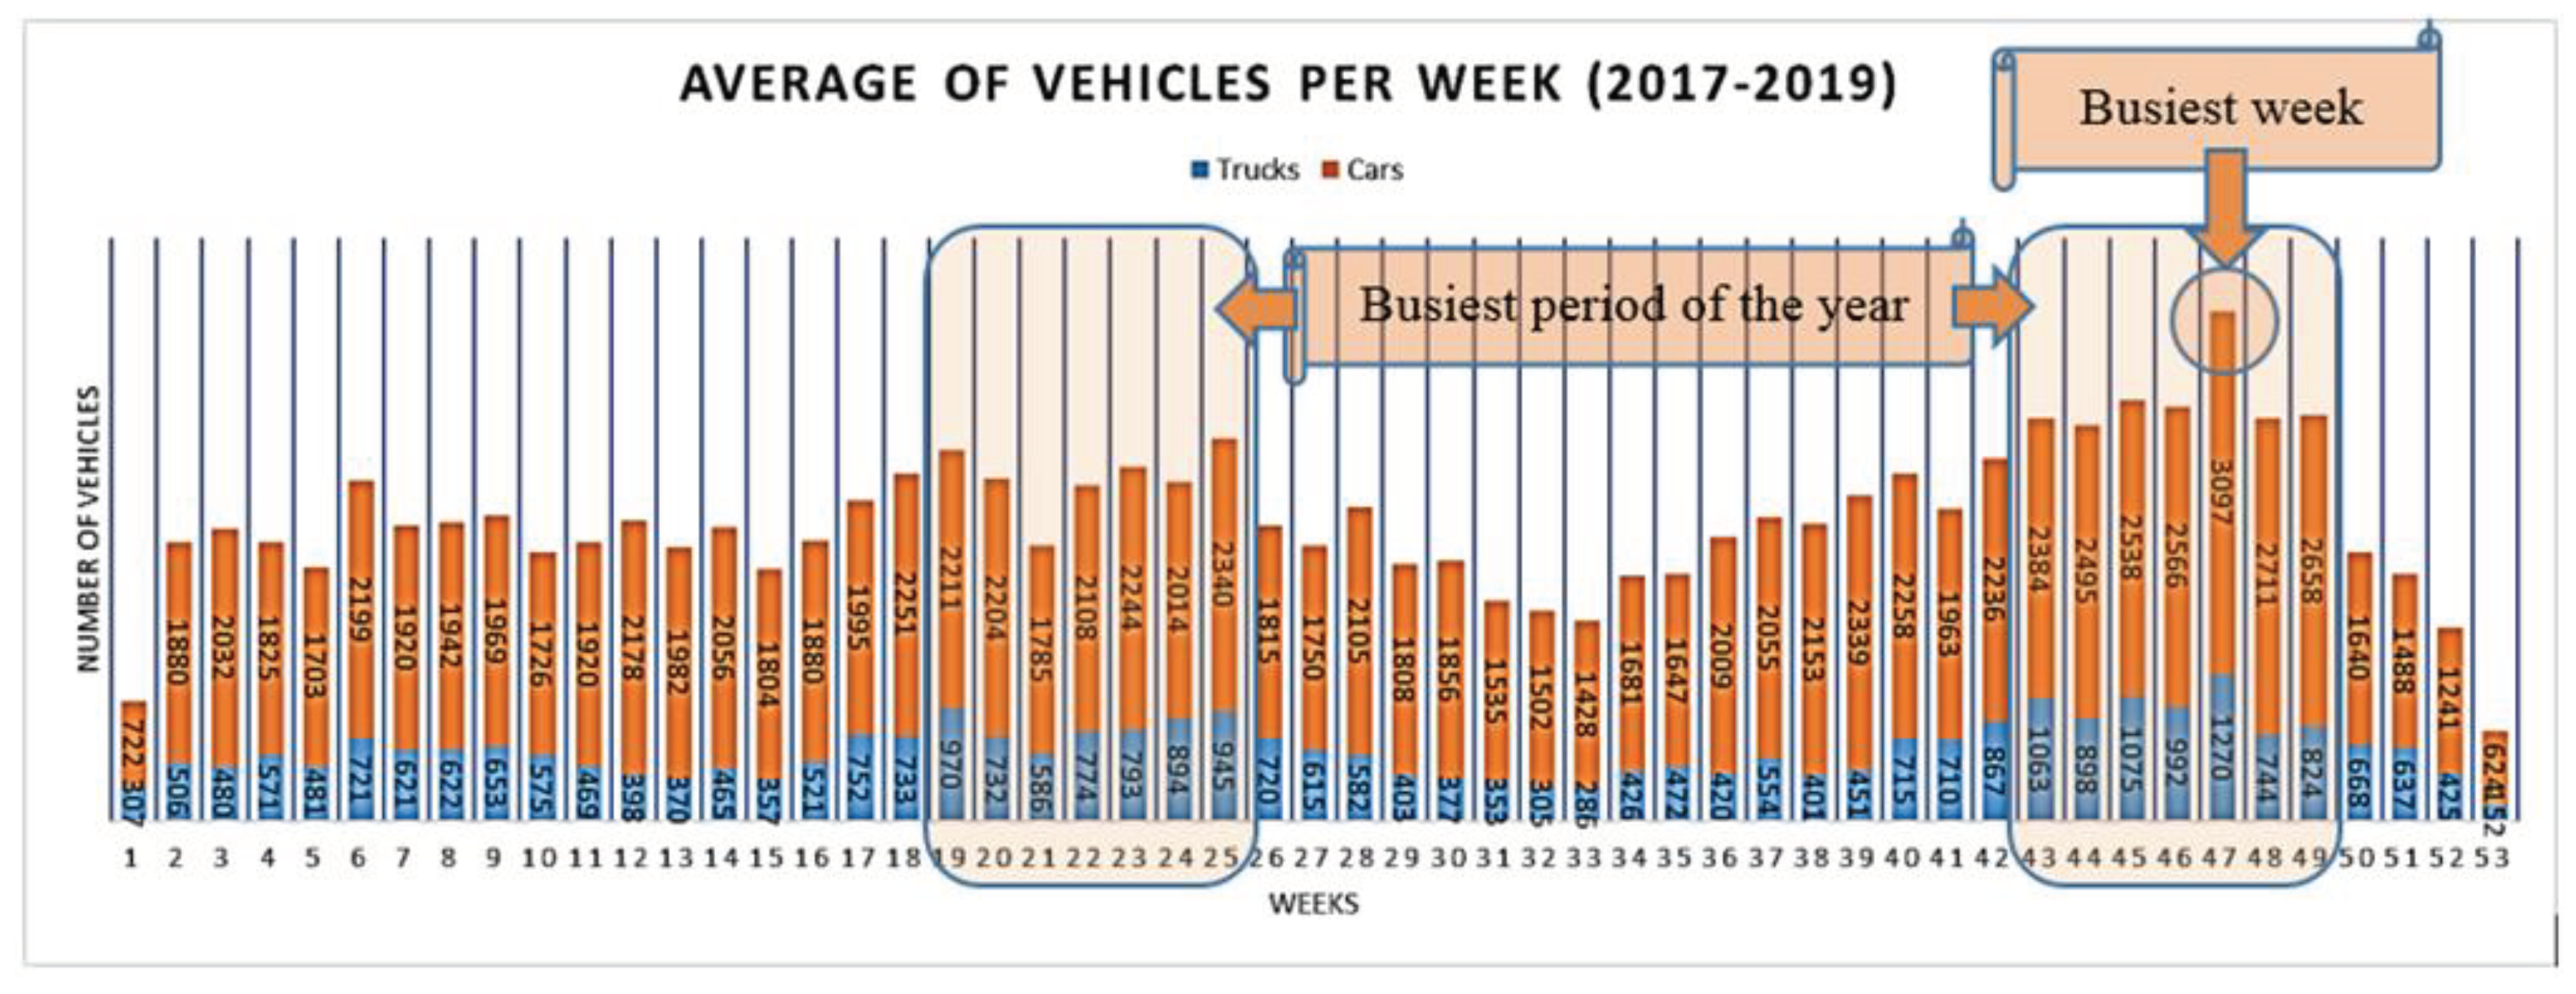
2.3.1. Reference Scenarios
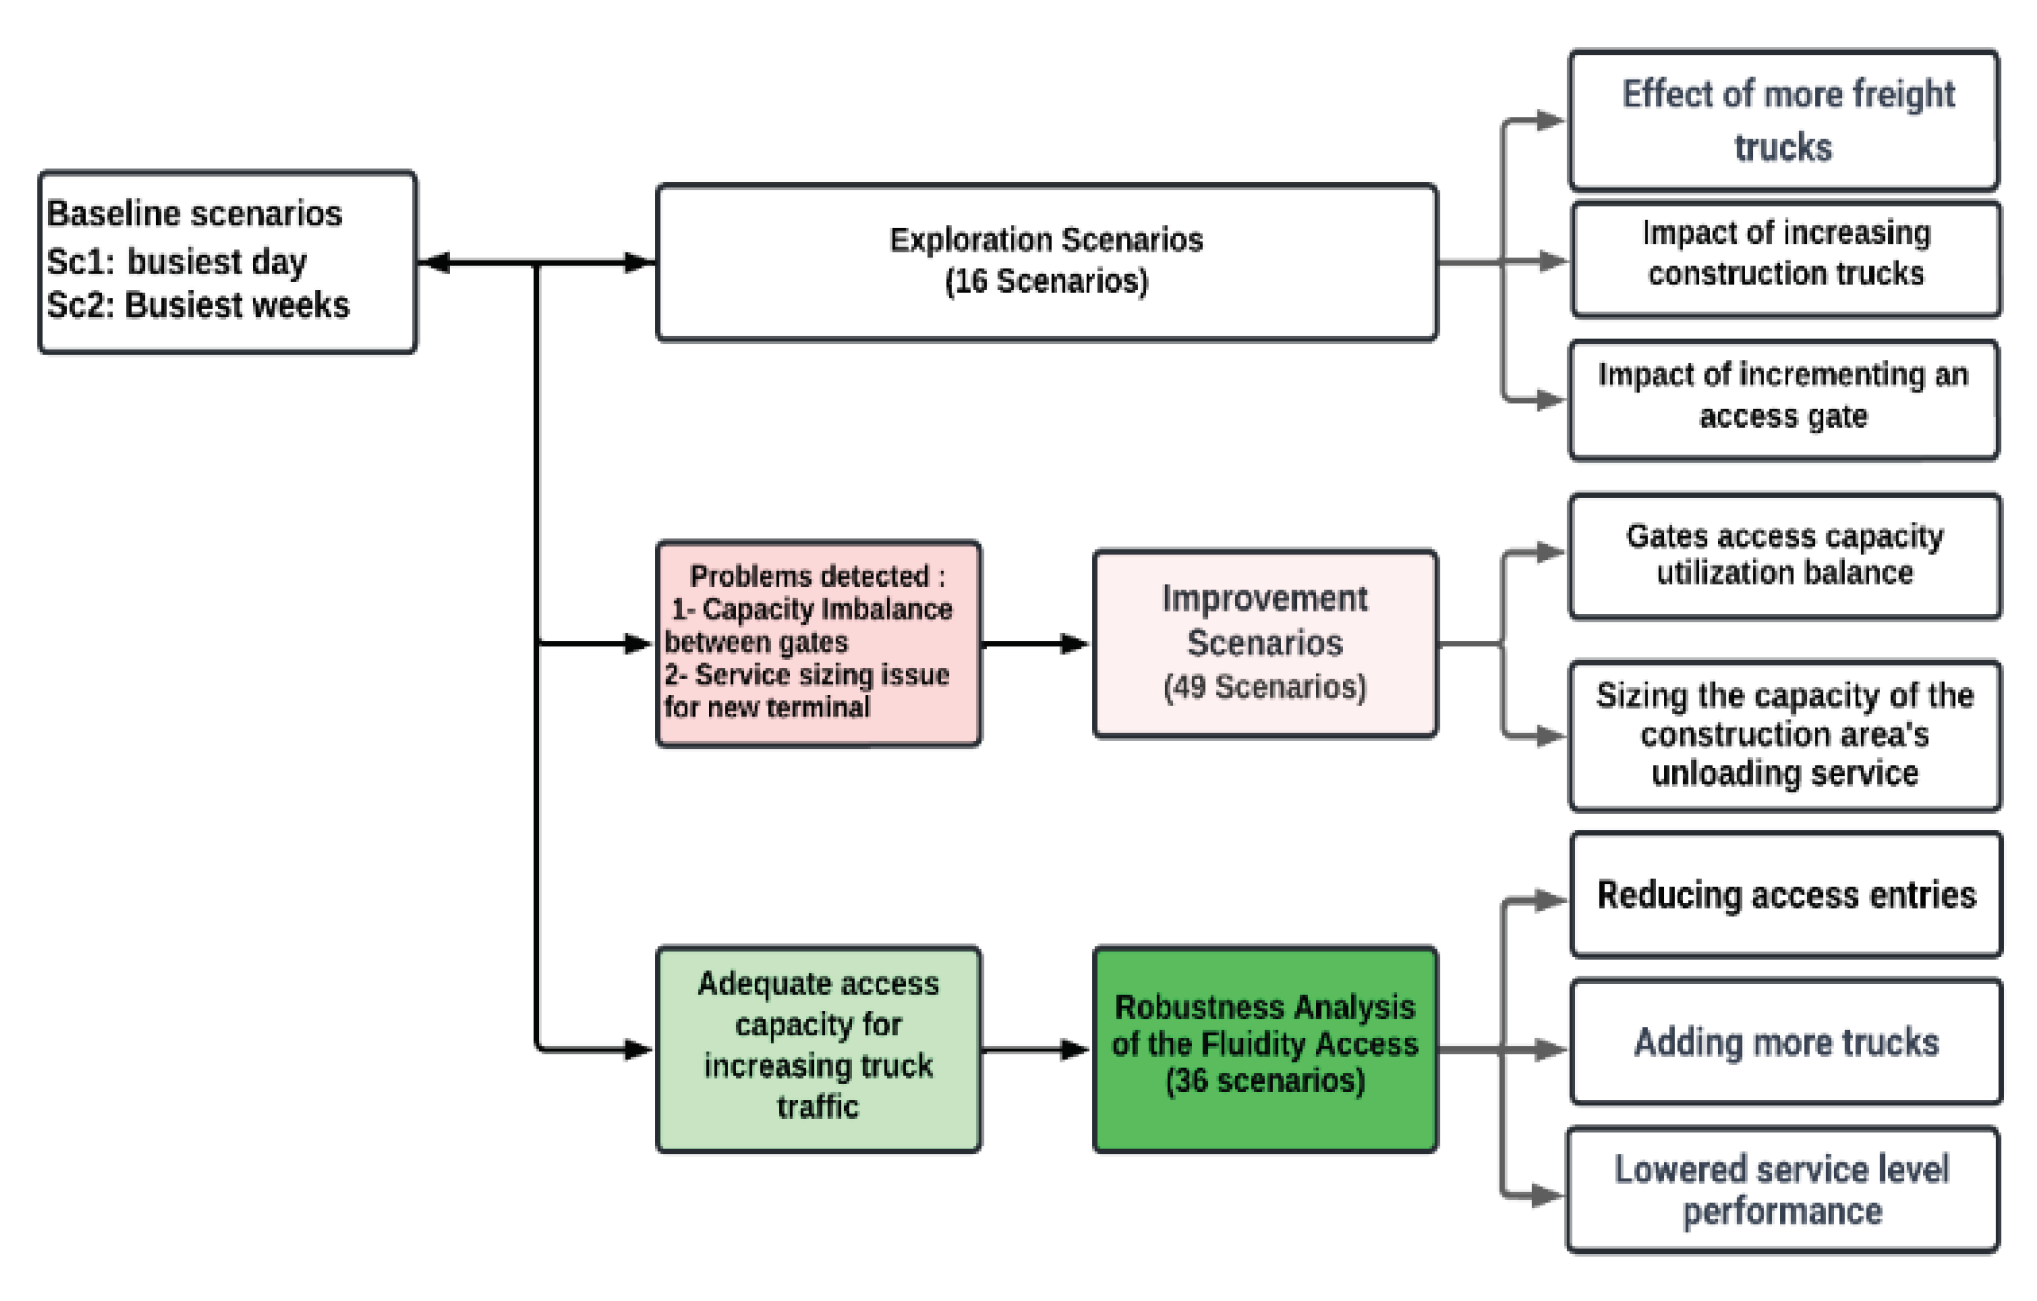
- Exploration and Improvement Scenarios
- Robustness Analysis of the Main Gate Access Fluidity
3. Results and Interpretations
3.1. Reference Scenario Analysis Results
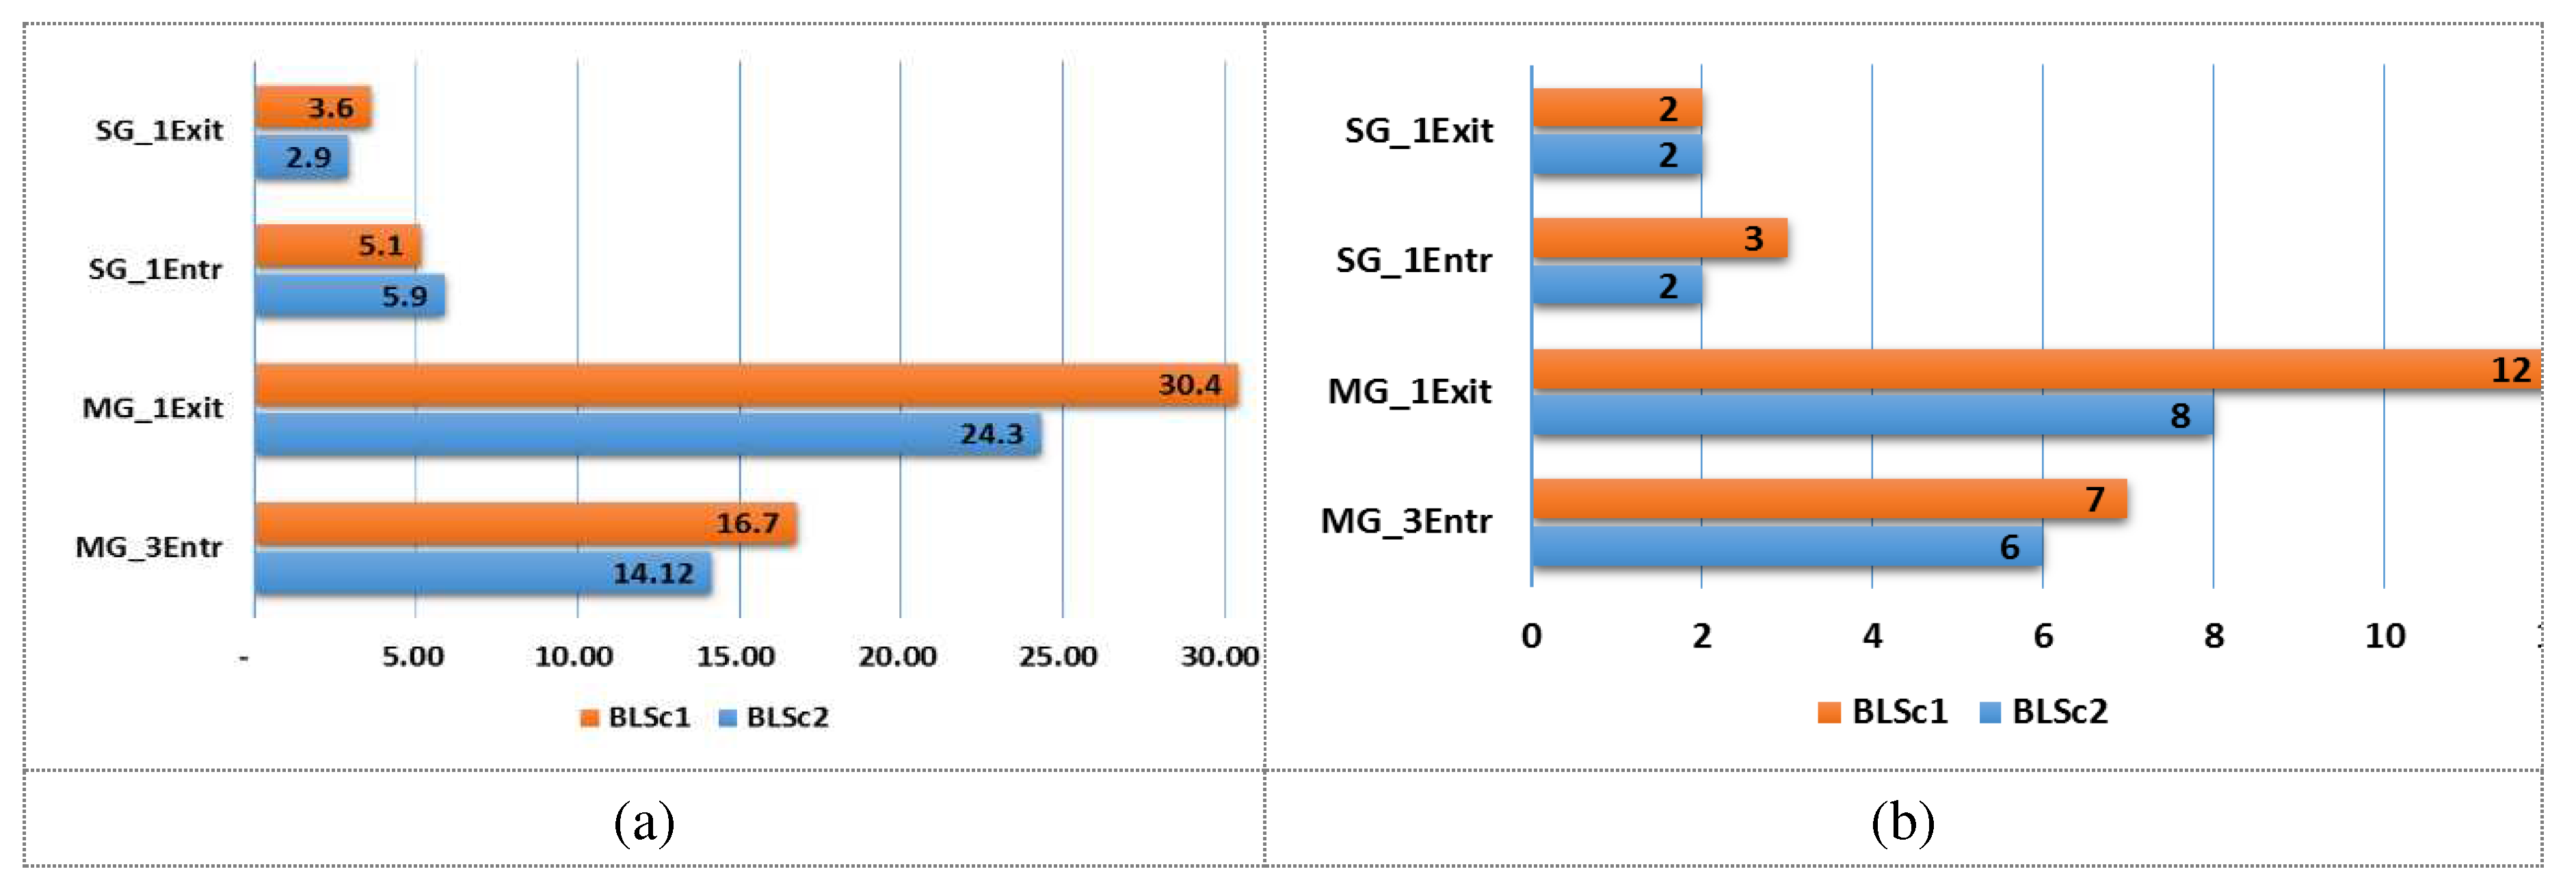
- The access capacity is largely underutilized, especially in the case of SG where the entry/exit used capacity does not exceed 4% to 6%. The crowding observed in practice is primarily attributable to inadequate planning of truck arrivals;
- Imbalance of used capacity between MG and SG gates. The Figure 8 a depicts the utilization capacity of the two access gates;
- The historical capacity shows that the port can accommodate more than 300 cars and 76 trucks at the same time;
- The time system is 1.23 h on average and 2.87 h as a maximum for freight trucks while the TS is 3.38 h on average for cars;
- Regarding MG, queues at the entrance can reach up to 6 to 7 vehicles, while the maximum number of vehicles at the exit is 8 to 12 for scenarios 1 and 2, respectively. As for SG, the maximum number of vehicles waiting to access cannot exceed three, as illustrated in Figure 8b.
1.1. Results of Exploratory Scenario Analysis for Two Access Gates
1.2. Three Gates Exploratory Scenario Analysis Results
1.3. Improvement Scenarios Analysis Results
1.4. Robustness Tests for the Fluidity of the Main Gate Access
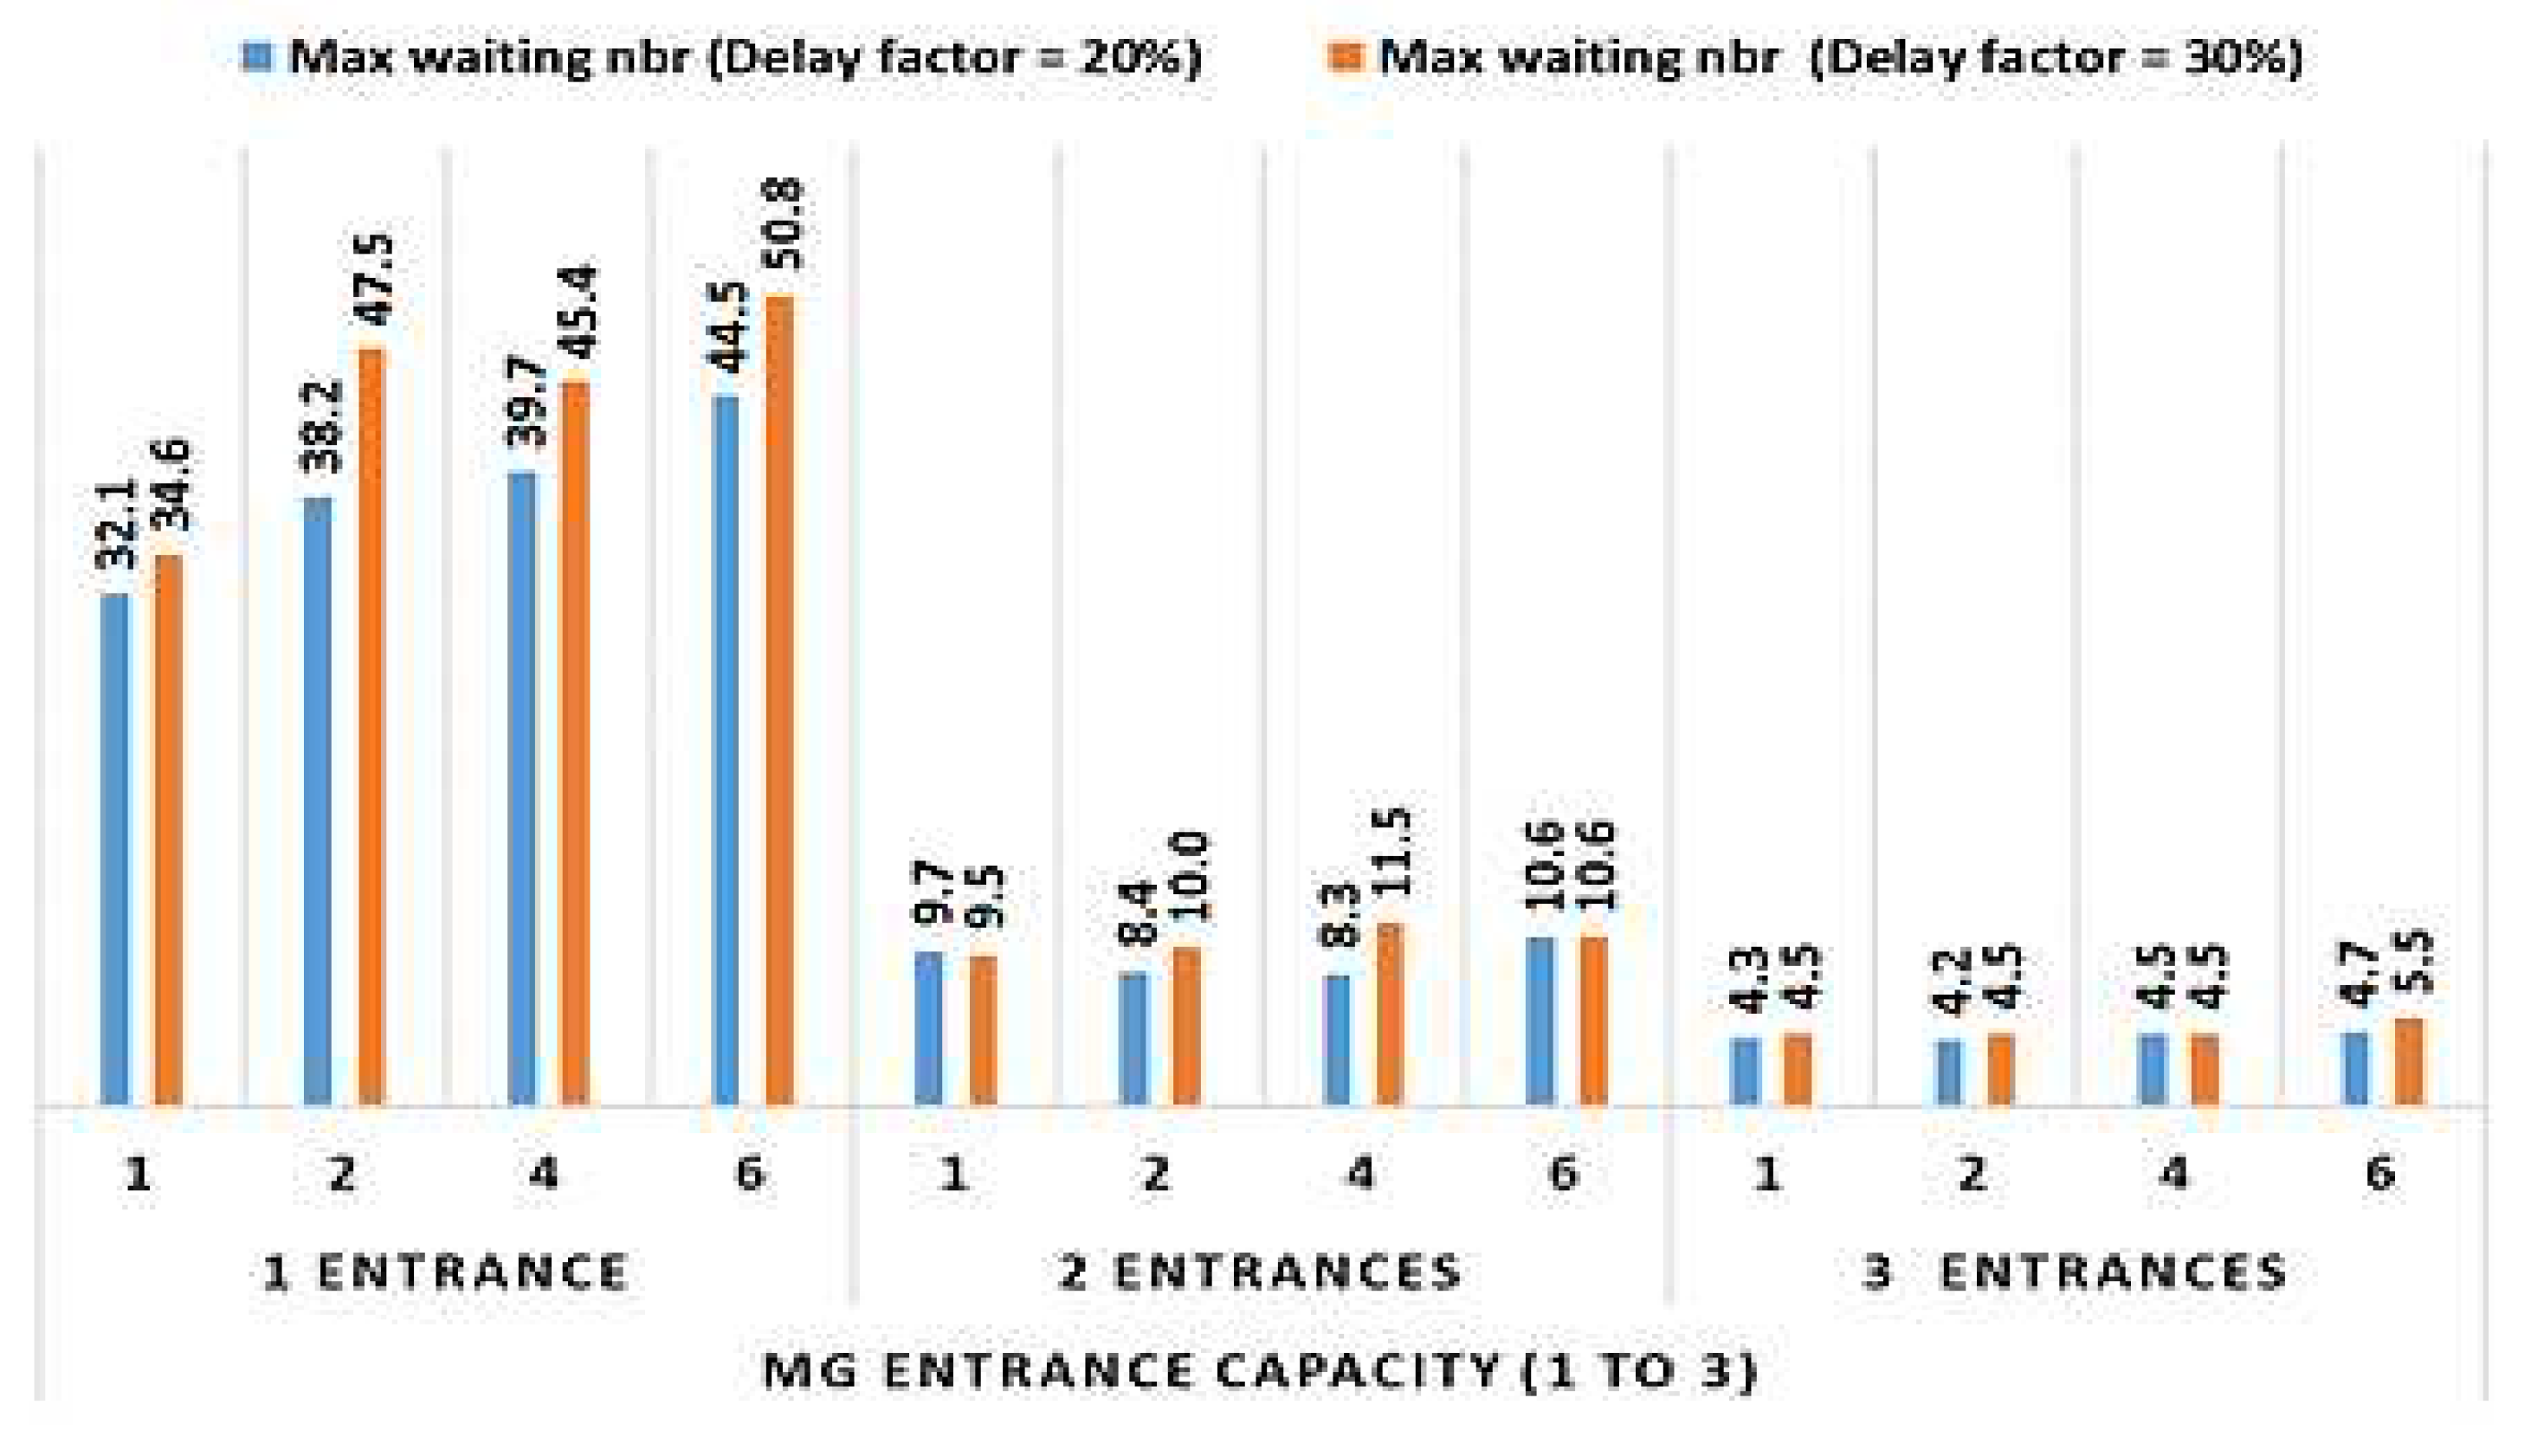
- The objective of the first set of scenarios (24 scenarios) was to examine the effects of access service degradation, which can result from factors such as adverse weather conditions, delays, registrar training, or computer and electrical failures, on access fluidity. By exploring the impact of slowdowns ranging from low to high across varying entrance configurations (from 1 to 3 entrances), the study aimed to provide insights into how different degrees of slowdown, frequencies, and simultaneous entrance availability affect the overall access experience.
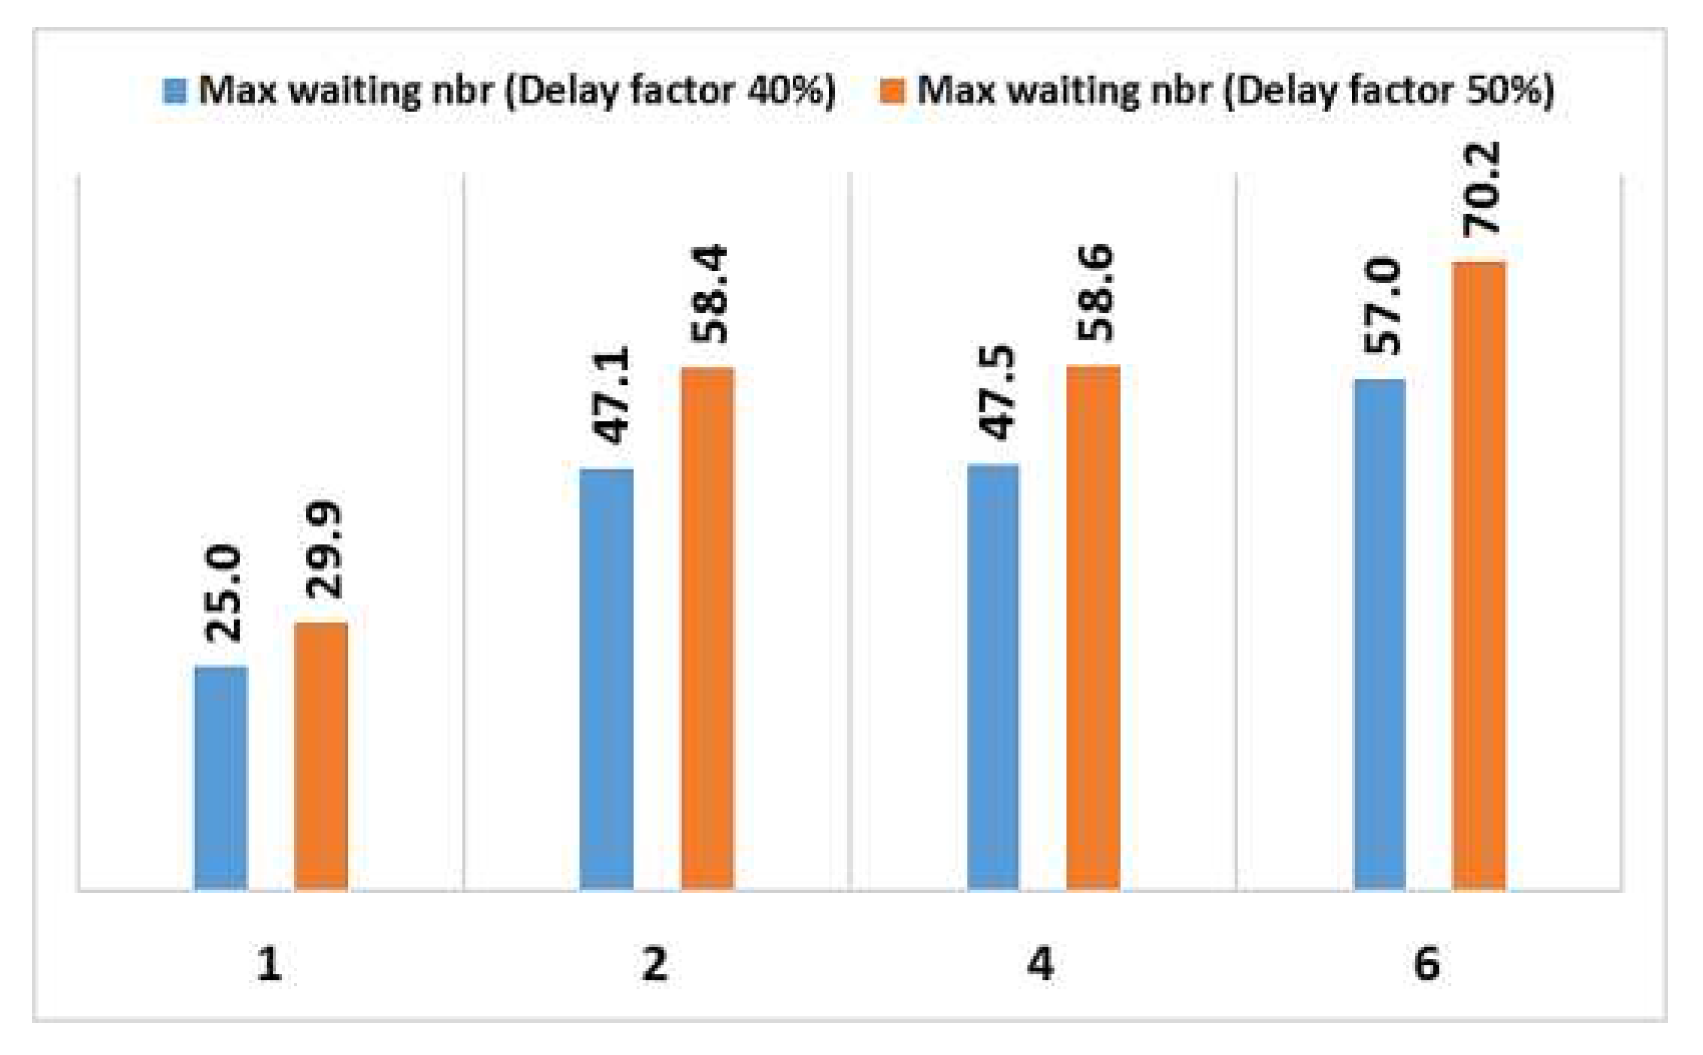
- The second batch (8 scenarios) assumed an extreme access conditions. Only one entrance available and a slowdown factor of 40% and 50% for frequency of slowdowns ranging from 1, 2, 4 and 6 per hour. The objective of this batch is to experiment the impact of the extreme conditions of the number of entrances (just one entrance) under different slowdown rates and slowdown frequency degrees.
- In the final set of scenarios, the goal is to assess the impact of a plausible increase in the number of trucks, ranging from 20% to 50%, while operating with three entrances under continuous significant service degradation (40%) over time. This consideration of truck number increase is driven by the unpredictable nature of the construction context, where the volume of trucks can fluctuate based on the subcontractor responsible for the new terminal's construction. Although the exploratory scenarios use an average truck number, it is crucial to account for the potential variability in construction and freight truck numbers and its effect on port fluidity. As such, these scenarios aim to accommodate possible changes in truck volumes and their implications for port operations and efficiency.
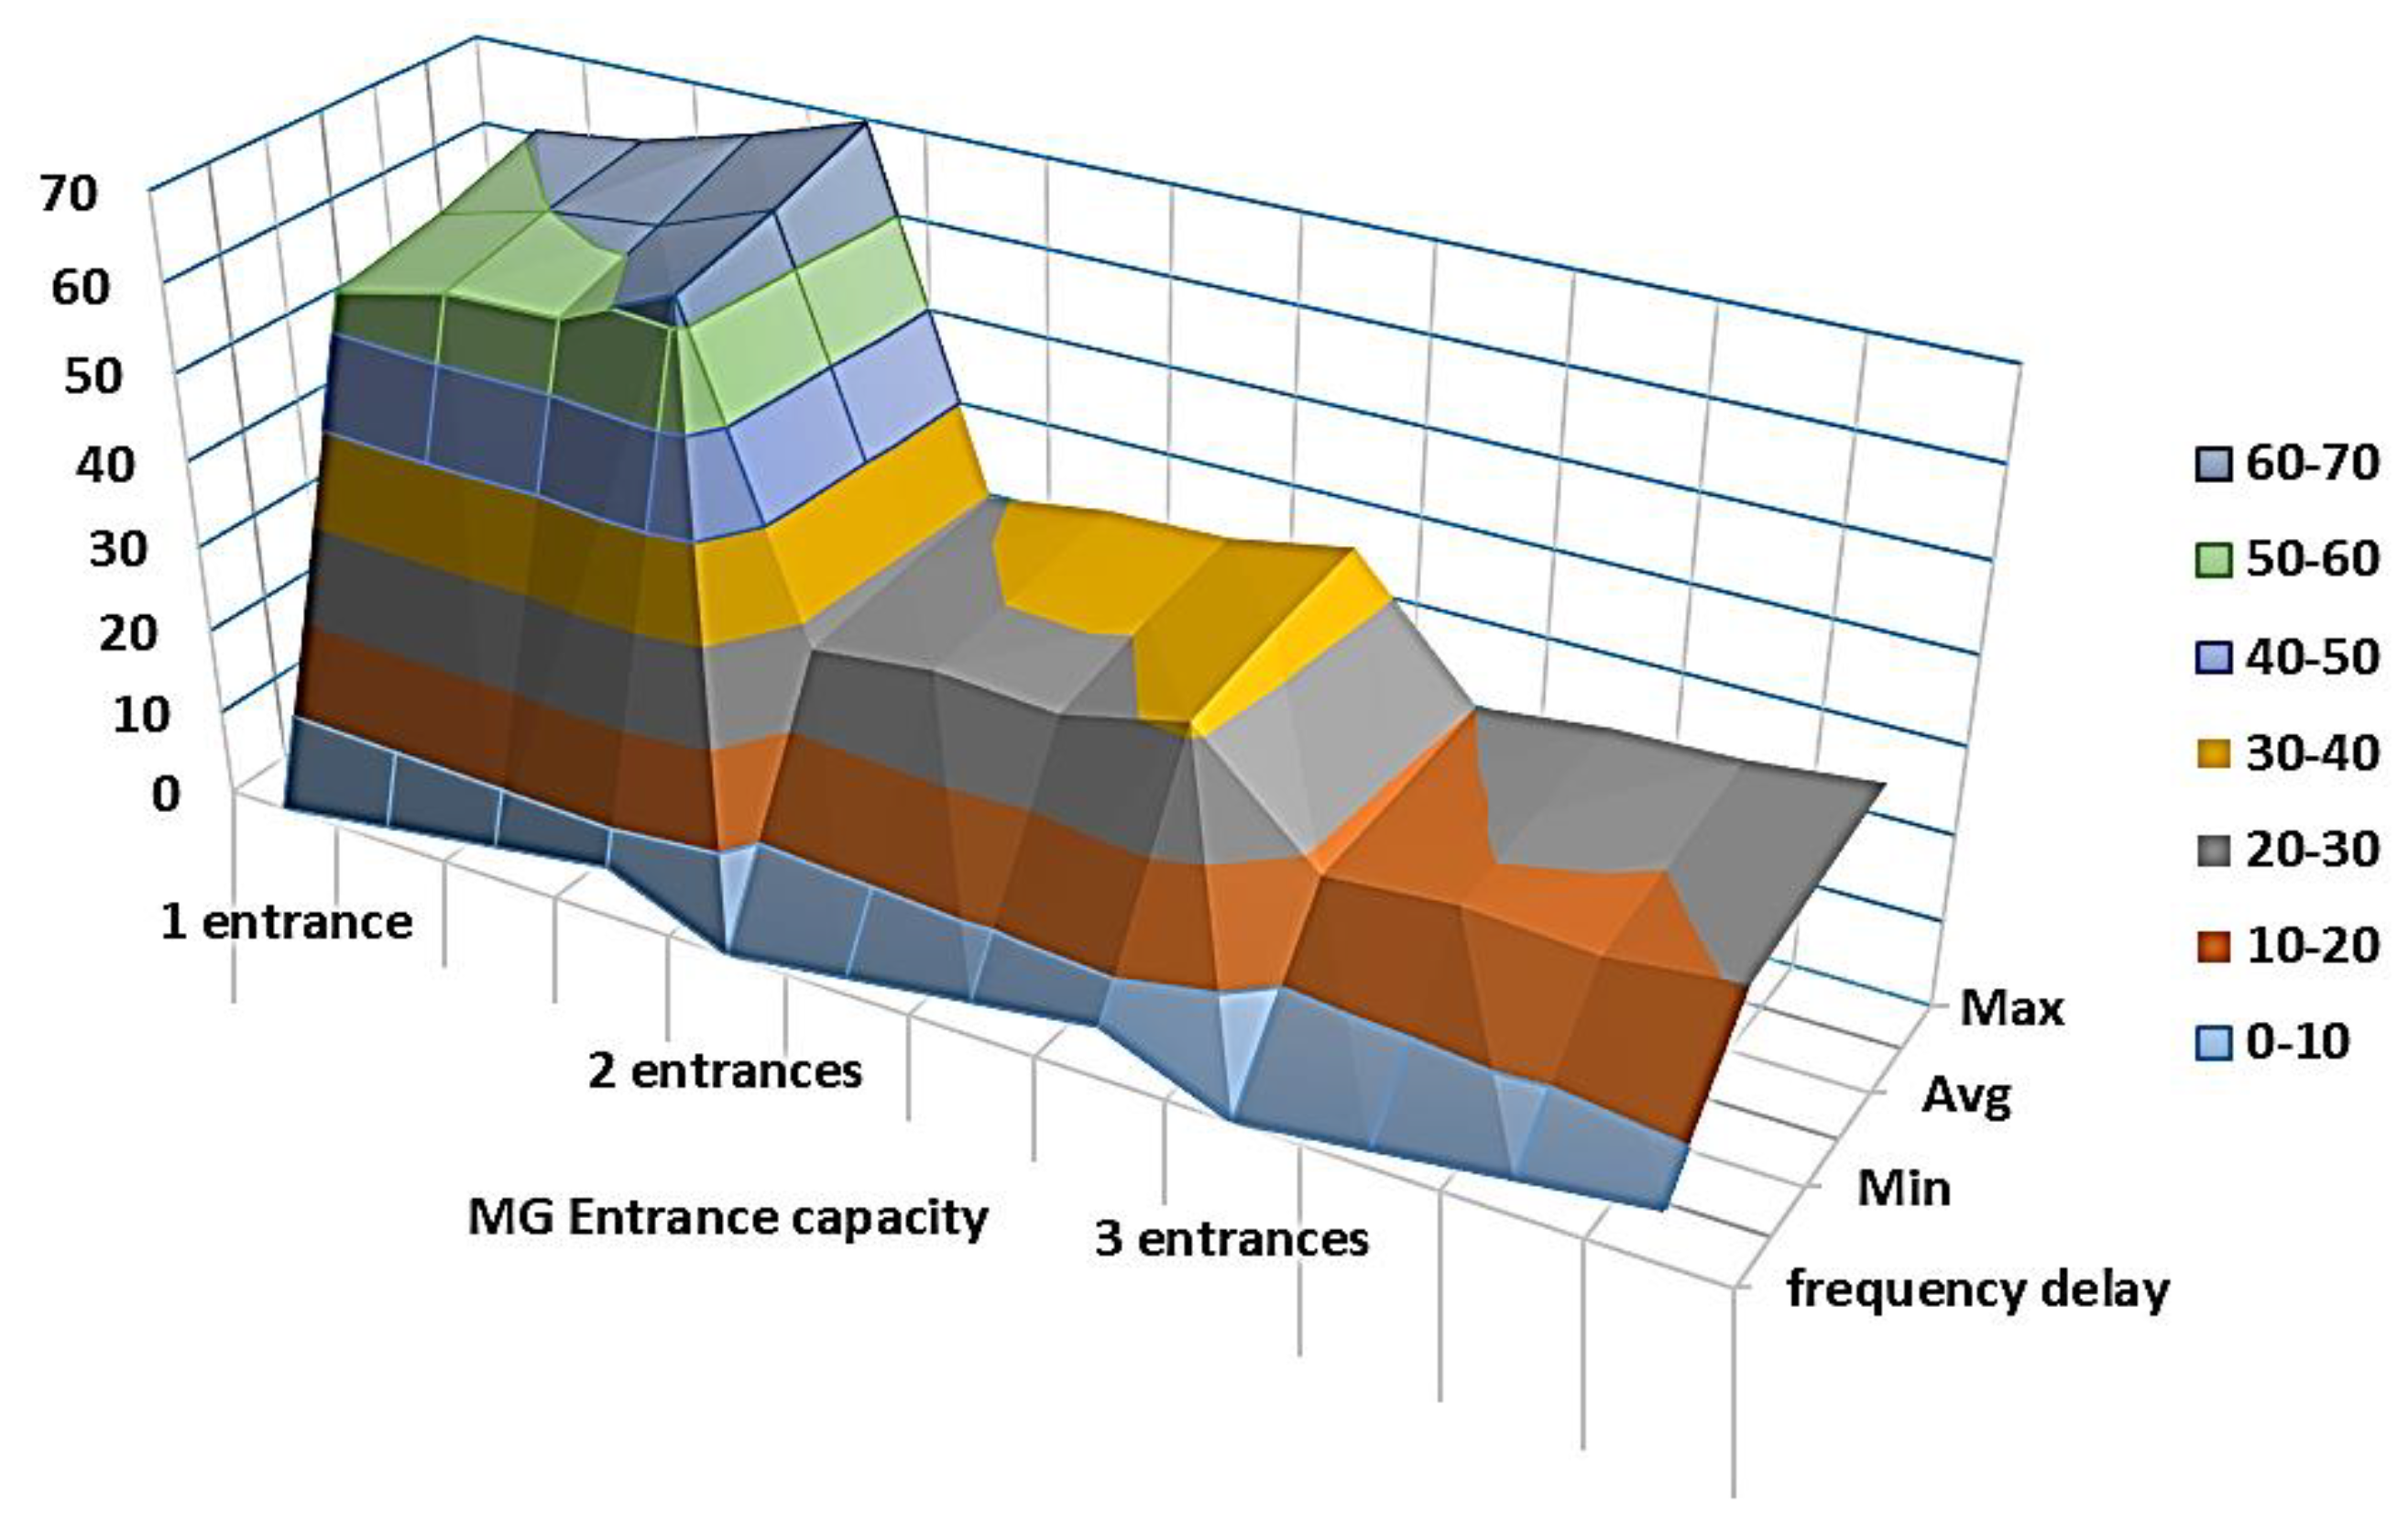
- Decreasing the number of entrances from 3 to 2 leads to a 50% increase in capacity utilization, and further reducing it to one entrance triples the used capacity. This significantly affects system fluidity during peak hours. Both the slowdown factor and the frequency of slowdowns contribute to increased capacity utilization. A 5% increase in capacity utilization is observed when the slowdown factor rises from 20% to 30% over time. Figure 16 illustrates these results for a 20% delay factor;
- Changing the number of entrances from 2 to 1 has a critical impact and can adversely affect access fluidity. As shown in Figure 17, the maximum number of waiting vehicles is five times greater when comparing one entrance to two entrances. In contrast, the number of waiting vehicles doubles when reducing the number of entrances from 3 to 2. The service slowdown also significantly affects the system.
- As illustrated in Figure 18, in the case of a single entrance with significant slowdown factors of 40% and 50%, the maximum number of waiting vehicles is considerably high. When the slowdown factor increases from 40% to 50%, there is a substantial effect on the maximum number of waiting vehicles, with an additional 13 vehicles if the slowdown occurs frequently;
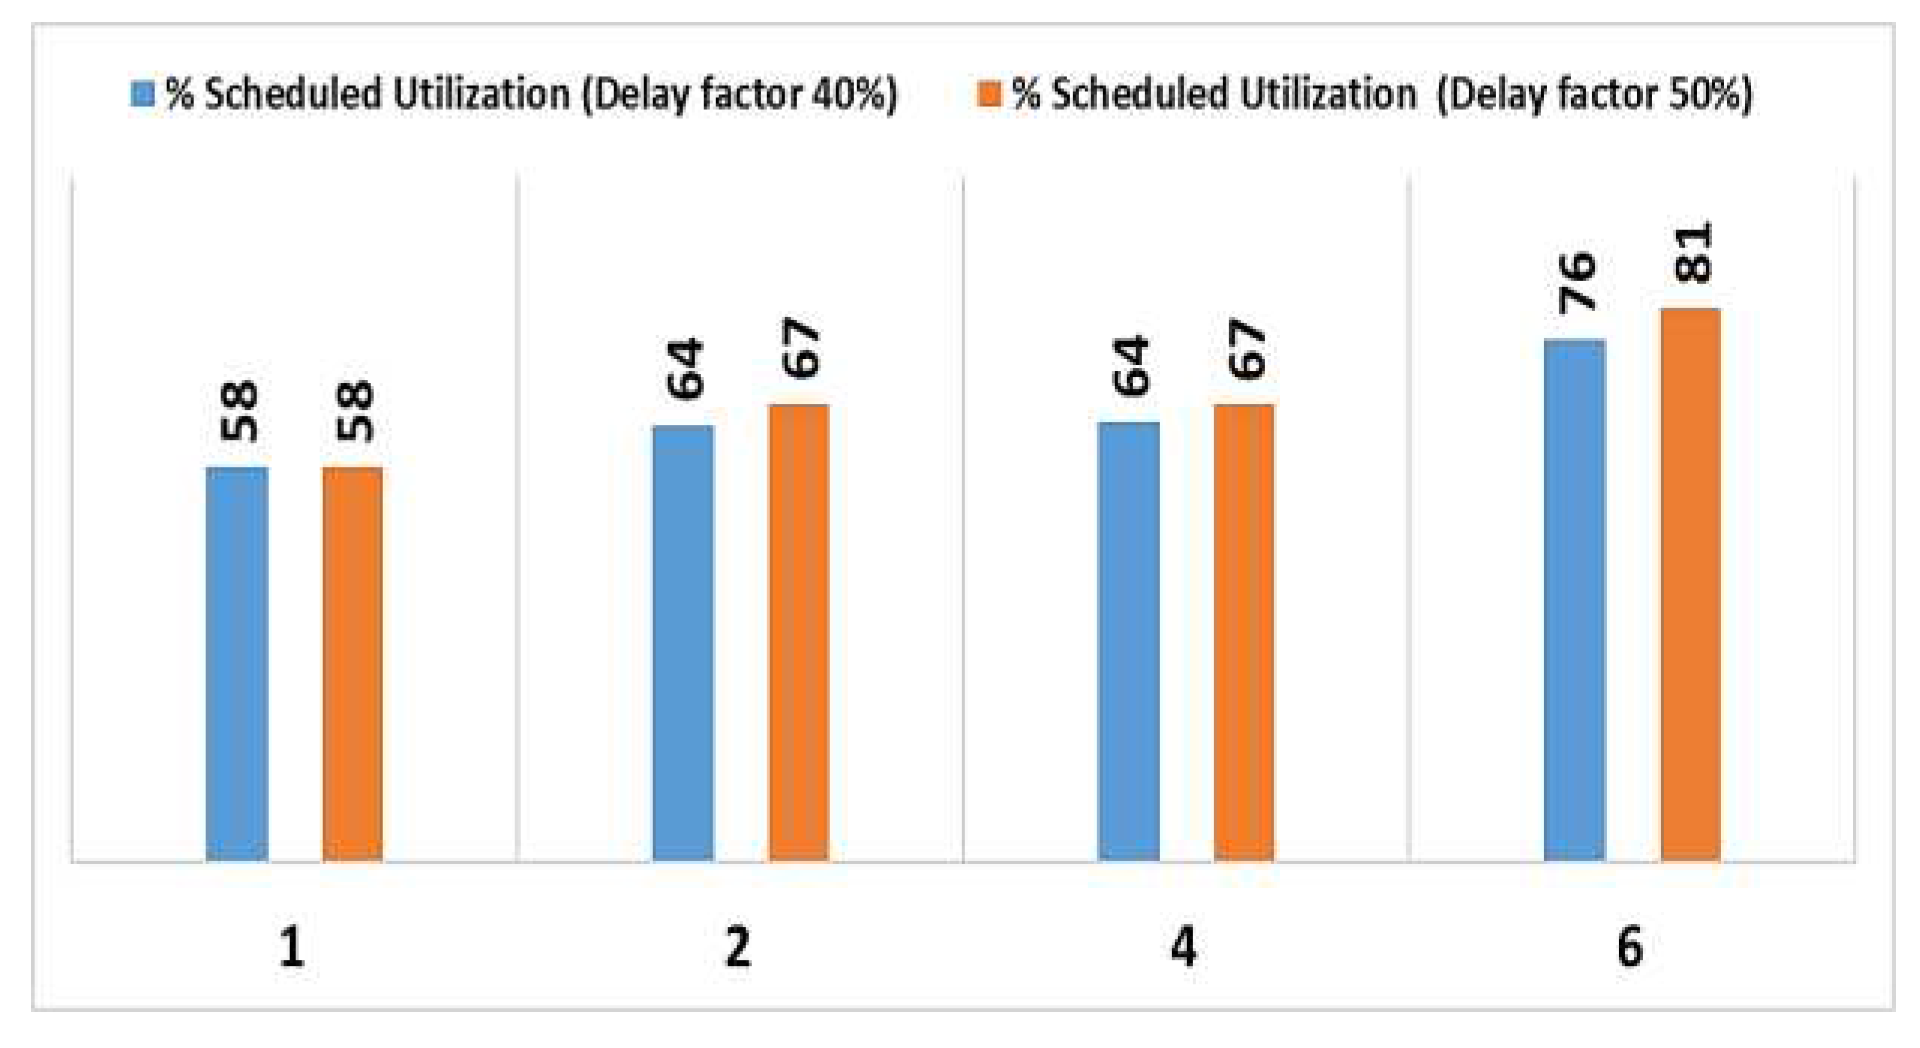
- None of the utilization capacities are sufficient for these scenarios. With a 58% utilization rate, the gate is prone to congestion for the majority of the operating period. It's important to note that the maximum number of waiting vehicles is 25 when there is a 40% slowdown occurring once an hour for a duration of 10 minutes. Figure 19 provides a summary of the main gate utilization percentage.
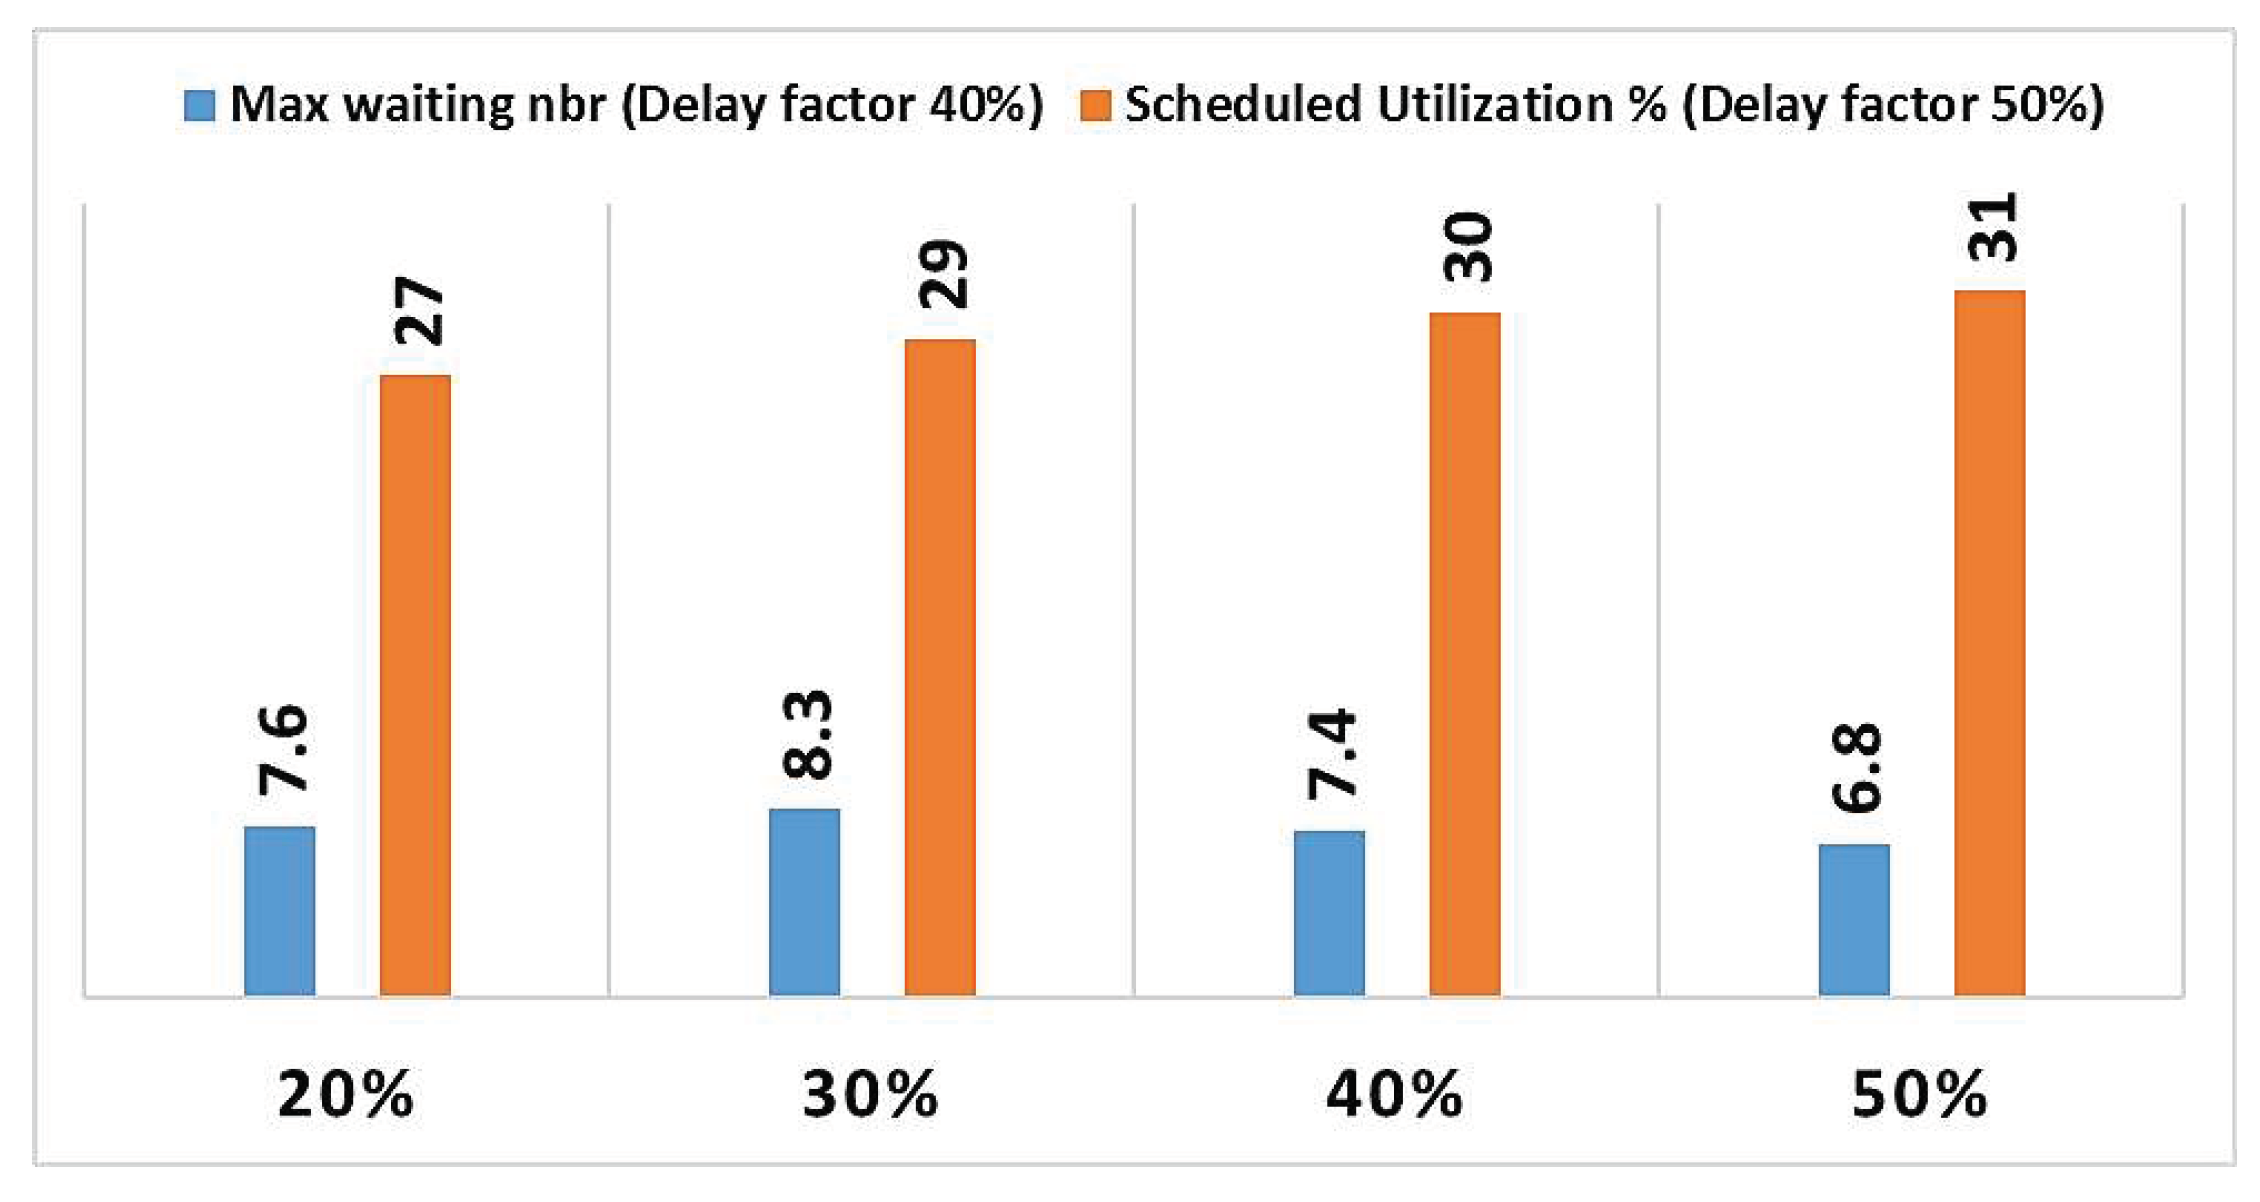
1.5. Concluding Remarks
4. Conclusion
Acknowledgments
References
- Fleming, M.; Huynh, N.; Xie, Y. Agent-Based Simulation Tool for Evaluating Pooled Queue Performance at Marine Container Terminals. Transp. Res. Rec. J. Transp. Res. Board 2013, 2330, 103–112. [Google Scholar] [CrossRef]
- Guan, C.Q.; Liu, R. (. Modeling Gate Congestion of Marine Container Terminals, Truck Waiting Cost, and Optimization. Transp. Res. Rec. J. Transp. Res. Board 2009, 2100, 58–67. [Google Scholar] [CrossRef]
- Kulkarni, K. Kulkarni, K., Tran, K.T., Wang, H., Lau, H.C., 2017. Efficient gate system operations for a multipurpose port using simulation-optimization, in: 2017 Winter Simulation Conference (WSC). Presented at the 2017 Winter Simulation Conference (WSC), pp. 3090–3101. [CrossRef]
- Mohammad, O.S. Application of Agent-Based Approaches to Enhance Container Terminal Operations. Theses and Dissertations, 2013. [Google Scholar]
- Dragović, B.; Tzannatos, E.; Park, N.K. Simulation modelling in ports and container terminals: literature overview and analysis by research field, application area and tool. Flex. Serv. Manuf. J. 2016, 29, 4–34. [Google Scholar] [CrossRef]
- Neagoe, M.; Hvolby, H.-H.; Taskhiri, M.S.; Turner, P. Using discrete-event simulation to compare congestion management initiatives at a port terminal. Simul. Model. Pr. Theory 2021, 112, 102362. [Google Scholar] [CrossRef]
- Cortés, P.; Muñuzuri, J.; Ibáñez, J.N.; Guadix, J. Simulation of freight traffic in the Seville inland port. Simul. Model. Pr. Theory 2007, 15, 256–271. [Google Scholar] [CrossRef]
- Chen, G.; Govindan, K.; Yang, Z.-Z.; Choi, T.-M.; Jiang, L. Terminal appointment system design by non-stationary M(t)/Ek/c(t) queueing model and genetic algorithm. Int. J. Prod. Econ. 2013, 146, 694–703. [Google Scholar] [CrossRef]
- Huynh, N., Walton, C.M., 2011. Improving Efficiency of Drayage Operations at Seaport Container Terminals Through the Use of an Appointment System, in: Böse, J.W. (Ed.), Handbook of Terminal Planning, Operations Research/Computer Science Interfaces Series. Springer, New York, NY, pp. 323–344. [CrossRef]
- Kourounioti, I.; Polydoropoulou, A. Application of aggregate container terminal data for the development of time-of-day models predicting truck arrivals. Eur. J. Transp. Infrastruct. Res. 2018, 18. [Google Scholar] [CrossRef]
- Lange, A.-K., Schwientek, A.K., Jahn, C., 2017. Reducing truck congestion at ports - classification and trends, in: Digitalization in Maritime and Sustainable Logistics: City Logistics, Port Logistics and Sustainable Supply Chain Management in the Digital Age. Proceedings of the Hamburg International Conference of Logistics (HICL), Vol. 24. Berlin: epubli GmbH, pp. 37–58. [CrossRef]
- Vadlamudi, J.C. How a Discrete event simulation model can relieve congestion at a RORO terminal gate system : Case study: RORO port terminal in the Port of Karlshamn. 2016. [Google Scholar]
- Torkjazi, M. New Models for Truck Appointment Problem and Extensions. Theses and Dissertations, 2020. [Google Scholar]
- Ramírez-Nafarrate, A.; González-Ramírez, R.G.; Smith, N.R.; Guerra-Olivares, R.; Voß, S. Impact on yard efficiency of a truck appointment system for a port terminal. Ann. Oper. Res. 2016, 258, 195–216. [Google Scholar] [CrossRef]
- Goudreau, É. Analyses des impacts de l’implantation d’un système de rendez-vous sur le trafic routier dans un port manutentionnant des produits non conteneurisés. masters thesis, Université du Québec à Trois-Rivières, Trois-Rivières, 2018. [Google Scholar]
- Potgieter, L. Risk profile of port congestion : Cape Town container terminal case study. Doctoral dissertation, Stellenbosch University, Stellenbosch, 2016. [Google Scholar]
- Abu Aisha, T.; Ouhimmou, M.; Paquet, M. Optimization of Container Terminal Layouts in the Seaport—Case of Port of Montreal. Sustainability 2020, 12, 1165. [Google Scholar] [CrossRef]
- Guo, X.; Huang, S.Y.; Hsu, W.J.; Low, M.Y.H. Dynamic yard crane dispatching in container terminals with predicted vehicle arrival information. Adv. Eng. Informatics 2011, 25, 472–484. [Google Scholar] [CrossRef]
- Kim, K.H.; Lee, K.M.; Hwang, H. Sequencing delivery and receiving operations for yard cranes in port container terminals. Int. J. Prod. Econ. 2003, 84, 283–292. [Google Scholar] [CrossRef]
- Yi, S.; Scholz-Reiter, B.; Kim, T.; Kim, K.H. Scheduling appointments for container truck arrivals considering their effects on congestion. Flex. Serv. Manuf. J. 2019, 31, 730–762. [Google Scholar] [CrossRef]
- Brooks, M.R.; Schellinck, T. Measuring Port Effectiveness. Transp. Res. Rec. J. Transp. Res. Board 2015, 2479, 42–48. [Google Scholar] [CrossRef]
- Brooks, M.R.; Schellinck, T. Measuring port effectiveness in user service delivery: What really determines users' evaluations of port service delivery? Res. Transp. Bus. Manag. 2013, 8, 87–96. [Google Scholar] [CrossRef]

| Data Type | Observations and Attributes | Period |
|---|---|---|
| Vehicles access data | 796,000-records with entry/exit time, vehicle type, destination, freight, subcontractors. | 2015-2020 (Selected period for analysis: 2017-2019) |
| Summarized activity data by area | Tables with areas, load/unload quantities, truck count, and types of freight | |
| Access gates surveillance videos | 96 hours of streaming video from which obtain vehicle service time at a gate | Four days of July 2019 |
| Projected construction parameters | Civil engineering pre-feasibility study with forecast demand in number of construction trucks, unloading duration and number of unloading stations | Construction period |
| Area | 2017 | 2018 | 2019 | Total | % |
|---|---|---|---|---|---|
| A | 13 511 | 13 493 | 14 918 | 41 922 | 32% |
| B | 13 600 | 17 506 | 15 126 | 46 232 | 36% |
| C | 14 845 | 15 366 | 11 202 | 41 413 | 32% |
| Total trucks | 41 956 | 46 365 | 41 246 | 129 567 | 100% |
| Total cars | 100 219 | 117 963 | 105 488 | Avg : 107 890 | - |
| Vehicle and entry modes | Access registration times distributions | Avg times (seconds) |
|---|---|---|
| Automated truck entry | JohnsonSB(0.16, 0.70, 12.00, 59.27) | 33.65 |
| Manual truck entry | JohnsonSB(1.19, 0.59, 69.20, 390.37) | 133.29 |
| Automated truck exit | Norm(17.444, 5.0472) | 17.42 |
| Manual truck exit | JohnsonSB(1.79, 0.57, 27.76, 243.13) | 50.26 |
| Car entry | JohnsonSB(7.70, 0.94, 4.90, 28610.99) | 18.59 |
| Car exit | JohnsonSB(7.96, 1.21, 4.52, 4975.24) | 14.3 |
| Baseline Scenarios | Nber of Gates | Data | Truck flow MG | Truck flow SG | Reference |
|---|---|---|---|---|---|
| BLSc1_bd | 2 | 2017-2019 | 78% | 22% | Busiest day |
| BLSc2_14bw | 2 | 2017-2019 | 67% | 33% | 14 busiest weeks |
| Exploratory scenarios | Nber of gates | Unloading time for CT | Reference flow | Impact to be evaluated |
|---|---|---|---|---|
| ExpSc1 | 2 | - | BSc2 | Increase in FT |
| ExpSc2 | - | BSc1 | ||
| ExpSc3 | 15 | BSc2 | Increase in FT and CT | |
| ExpSc4 | 20 | |||
| ExpSc5 | 15 | BSc1 | ||
| ExpSc6 | 20 |
| Exploratory scenarios | Nber of gates | Unloading time for construction truck | New gate (truck destination) | Reference flow |
|---|---|---|---|---|
| ExpSc7 | 3 | 15 | Area B | BLSc1_14bw |
| ExpSc8 | 3 | 20 | ||
| ExpSc9 | 3 | 15 | BLSc1_bd | |
| ExpSc10 | 3 | 20 | ||
| ExpSc11 | 3 | 15 | Area B & 20% Area A | BLSc1_14bw |
| ExpSc12 | 3 | 20 | ||
| ExpSc13 | 3 | 15 | BLSc1_bd | |
| ExpSc14 | 3 | 20 |
| Scenarios | Nbr. gates | Nbr CT unload. simultaneously | Unloading time | New Gate flow |
MG flow |
SG flow |
Nber. Sc |
|---|---|---|---|---|---|---|---|
| ImpSc1 | 2 | 4 | - | - | 0.1-0.9 | 0.9-0.1 | 9 |
| ImpSc2 | 15 | - | |||||
| ImpSc3 | 3 | ZB | |||||
| ImpSc4 | ZB + 20%ZA | ||||||
| ImpSc5 | 2 | 4/5/6 | - | 0.67 | 0.33 | 3 | |
| ImpSc6 | 4/5/6/7/8 | 20 | - | 5 | |||
| ImpSc7 | 5/6/7/8/9 | 25 | - | 5 |
| Batch Sc | Slowdown duration | Slowdown factor | Slowdown freq | Entrance Nber | Outlook Nber of trucks | Nber of scenarios |
| 1 | 10 min | 20% and 30% | 1, 2, 4, 6 | 1 – 2 - 3 | construction period | 24 |
| 2 | 10 min | 40% and 50% | 1, 2, 4, 6 | 1 | construction period | 24 |
| 3 | 10 min | 40% | 6 | 3 | construction period + 20 to 50% | 24 |
| Sc | MG capacity |
Delay factor | Delay frequency (h) |
Avg vehicles waiting | Max vehicles waiting | Avg waiting time (min) | Max waiting time (min) | Scheduled utilization (%) | Processing time (%) |
|---|---|---|---|---|---|---|---|---|---|
| Sc1 | 1 | 0.2 | 1 | 1.82 | 32.1 | 1.80 | 15.8 | 57 | 57 |
| Sc2 | 2 | 2.56 | 38.2 | 2.56 | 19.4 | 60 | 60 | ||
| Sc3 | 4 | 2.82 | 39.7 | 2.76 | 23.7 | 61 | 61 | ||
| Sc4 | 6 | 3.40 | 44.5 | 3.35 | 26.8 | 66 | 66 | ||
| Sc5 | 2 | 1 | 0.10 | 9.7 | 0.09 | 3.3 | 29 | 43 | |
| Sc6 | 2 | 0.12 | 8.4 | 0.11 | 3.6 | 30 | 45 | ||
| Sc7 | 4 | 0.11 | 8.3 | 0.11 | 4.3 | 30 | 45 | ||
| Sc8 | 6 | 0.16 | 10.6 | 0.16 | 4.5 | 33 | 48 | ||
| Sc9 | 3 | 1 | 0.01 | 4.3 | 0.01 | 1.1 | 19 | 42 | |
| Sc10 | 2 | 0.01 | 4.2 | 0.01 | 1.2 | 21 | 45 | ||
| Sc11 | 4 | 0.01 | 4.5 | 0.01 | 1.3 | 20 | 44 | ||
| Sc12 | 6 | 0.02 | 4.7 | 0.02 | 1.5 | 22 | 47 | ||
| Sc13 | 1 | 0.3 | 1 | 1.96 | 34.6 | 1.93 | 17.4 | 57 | 57 |
| Sc14 | 2 | 3.44 | 47.5 | 3.39 | 27.9 | 62 | 62 | ||
| Sc15 | 4 | 3.46 | 45.4 | 3.41 | 27.2 | 63 | 63 | ||
| Sc16 | 6 | 4.88 | 50.8 | 4.80 | 30.1 | 71 | 71 | ||
| Sc17 | 2 | 1 | 0.10 | 9.5 | 0.10 | 3.1 | 29 | 43 | |
| Sc18 | 2 | 0.15 | 10.0 | 0.15 | 4.1 | 31 | 45 | ||
| Sc19 | 4 | 0.17 | 11.5 | 0.16 | 5.3 | 32 | 46 | ||
| Sc20 | 6 | 0.18 | 10.6 | 0.18 | 4.9 | 36 | 51 | ||
| Sc21 | 3 | 1 | 0.01 | 4.5 | 0.01 | 1.3 | 19 | 42 | |
| Sc22 | 2 | 0.01 | 4.5 | 0.01 | 1.3 | 21 | 45 | ||
| Sc23 | 4 | 0.02 | 4.5 | 0.02 | 1.4 | 21 | 44 | ||
| Sc24 | 6 | 0.03 | 5.5 | 0.03 | 2.0 | 24 | 49 | ||
| Sc25 | 1 | 0.4 | 1 | 1.61 | 25.0 | 1.59 | 13.4 | 58 | 58 |
| Sc26 | 2 | 4.15 | 47.1 | 4.10 | 32.6 | 64 | 64 | ||
| Sc27 | 4 | 4.38 | 47.5 | 4.36 | 32.7 | 64 | 64 | ||
| Sc28 | 6 | 7.99 | 57.0 | 7.83 | 41.7 | 76 | 76 | ||
| Sc29 | 3 (*) | 0.4 | 6 | 0.05 | 7.6 | 0.04 | 2.3 | 27 | 54 |
| Sc30 | 6 | 0.07 | 8.3 | 0.06 | 3.0 | 29 | 56 | ||
| Sc31 | 6 | 0.06 | 7.4 | 0.05 | 2.8 | 30 | 58 | ||
| Sc32 | 6 | 0.06 | 6.8 | 0.05 | 2.7 | 31 | 59 | ||
| Sc33 | 1 | 0.5 | 1 | 1.82 | 29.9 | 1.80 | 16.6 | 58 | 58 |
| Sc34 | 2 | 6.26 | 58.4 | 6.08 | 45.2 | 67 | 67 | ||
| Sc35 | 4 | 6.34 | 58.6 | 6.26 | 47.0 | 67 | 67 | ||
| Sc36 | 6 | 11.53 | 70.2 | 11.42 | 51.1 | 81 | 81 | ||
| (*) | Increase in the number of trucks by 20%, 30%, 40% and 50% successively for scenarios 29 to 32 | ||||||||
Disclaimer/Publisher’s Note: The statements, opinions and data contained in all publications are solely those of the individual author(s) and contributor(s) and not of MDPI and/or the editor(s). MDPI and/or the editor(s) disclaim responsibility for any injury to people or property resulting from any ideas, methods, instructions or products referred to in the content. |
© 2023 by the authors. Licensee MDPI, Basel, Switzerland. This article is an open access article distributed under the terms and conditions of the Creative Commons Attribution (CC BY) license (http://creativecommons.org/licenses/by/4.0/).


