Submitted:
27 December 2023
Posted:
27 December 2023
You are already at the latest version
Abstract
Ecological stoichiometry is an important index to reflect ecological interaction and the balance of various elements in ecological processes. At present, the stoichiometric spatial distribution of soil carbon (C), nitrogen (N), phosphorus (P) and potassium (K) in farmland and grassland of Inner Mongolia and its influencing factors are still unclear. In this study, the spatial distribution of soil nutrient content and stoichiometry and the effects of environmental factors on soil C:N:P:K stoichiometry were analyzed under different land use patterns in four agro-pastoral areas. The results showed that there was a geographical gradient in the ecological stoichiometric relationship between farmland and grassland. RCN, RCP, RCK, RNP and RNK showed an "N" distribution from west to east, while RPK showed a "V" distribution. The difference in spatial distribution was more significant than the difference in land use pattern. The ecological stoichiometric relationship of grassland was mainly affected by the content of C and N, and was related to the similarity of soil properties. The field ecological stoichiometry was mainly affected by the content of nitrogen and phosphorus, and had a great relationship with fertilization. The effects of MAT and MAP on soil ecological stoichiometry were related to the inter-regional environmental heterogeneity. The influence of MAP on farmland and MAT on grassland was more significant. It was of great significance for field management according to local conditions, rational utilization of land resources and sustainable development of agriculture to clarify the ecological stoichiometric characteristics of farmland and grassland in agro-pastoral ecotone.
Keywords:
C:N:P:K stoichiometry
; spatial variation
; land use patterns
; agro-pastoral ecotone
; environmental factors
1. Introduction
Ecological stoichiometry (ES) is a hot topic in the current biogeochemical cycle research [1], which combines the basic principles of chemistry, physics and biology to study the proportional relationship and the fluxes of various chemical elements in ecological processes. By analyzing the driving force and mechanism of element balance on ecological interaction, the research theories on elements and biosphere at different levels are organically unified [2]. Soil eco-stoichiometry is an important predictive index to reflect the composition of organic matter, biogeochemical cycle and soil quality, and also an important index to judge the mineralization and fixation of C, N, P, K elements [3]. Soil C:N ratio (RCN) is a sensitive index reflecting the change of soil environment or soil quality. It can be used as an index to measure the mineralization ability of soil C and N, the decomposition rate of organic matter and the status of nutrient balance. Generally speaking, soil RCN is inversely proportional to the decomposition rate of organic matter. Soil C:P ratio (RCP) is a characterization parameter of phosphorus availability. The smaller the soil RCP, the higher the phosphorus availability in the soil. The N:P (RNP) in soil is used as an indicator of nutrient-constrained productivity and general biogeochemical status. As a necessary element for plant growth, potassium (k) plays a very important role in the material chemical cycle of the earth, and it has gradually attracted the attention of ecological researchers [1]. C, N, and P chemometrics play an active role in ecosystem interactions and is an important way to understand the nutrient regulation factors of plant-litter-soil interaction [4,5,6]. The analysis of the spatial differentiation pattern of regional soil eco-stoichiometric characteristics is helpful to the comprehensive management and utilization of soil nutrients. However, the spatial and temporal variation pattern of soil C:N:P is not completely clear [7].
Land use change is a local environmental issue of global importance [8], Human beings have changed biogeochemical cycles at different scales through farmland reclamation, and the differences in the stoichiometric ratios of C, N and P in space and time have different impacts on biota [9,10,11]. Located between semi-humid and semi-dry areas, the agro-pastoral ecotone in Internal Mongolian is a transitional belt for farmland and grassland ecosystems and is the most sensitive and unstable area associated with the surrounding environment. From 1947 to 2021, the cultivated land area in the Inner Mongolia Autonomous Region increased from 3967,000 hm2 to 11567,000 hm2 (Statistics Bureau of Inner Mongolia Autonomous Region, 2023), and the change of cultivated land is mainly transformed from woodland and grassland [12]. At present, the research on the eco-stoichiometry of soil in the agro-pastoral ecotone of Inner Mongolia is mainly focused on the county level (such as Dalate Banner [13], Yijinhuoluo Banner [14], Duolun County [15], Wengniute Banner [16], etc.) or land types (such as wetlands [17], sandy land [18,19], grassland [20]), but there are few studies on large-scale in space. However, due to the large longitude span of the agro-pastoral ecotone in Inner Mongolia, there are differences in topography, soil characteristics and agricultural planting structure among the agro-pastoral areas.
This study innovatively compared the stoichiometry of soil C:N:P:K between farmland and grassland at different scales in the agro-pastoral ecotone of Inner Mongolia, aim to clarify the spatial distribution of eco-stoichiometry of soil C:N:P:K of different land use types, analyze soil nutrient deficiency in different regions, and the influence of environmental factors on stoichiometry. This provides a theoretical basis for revealing the interaction and balance between C, N, P and K elements, and has important practical significance for understanding the impact of human activities on ecosystem processes and services, and exploring agricultural production strategies according to local conditions.
2. Materials and Methods
2.1. Study Site
This study area is located in the agro-pastoral ecotone from Hulunbuir to Bayannur in Inner Mongolia, China (105°53'–115°31' E, 40°51'–53°20' N). According to the Land and Spatial Planning of Inner Mongolia Autonomous region (2021-2035), the agro-pastoral areas along the Yellow River mainstream plain (I), the foothills of Yinshan Mountain (II), the West Liaohe River Basin (III) and the foothills of Daxing'an Mountains (IV) are respectively from west to east.
The mean annual precipitation in I area is 150-380 mm, and the mean annual temperature is 3.7-7.6℃. The topography of this area is dominated by plateaus, mountains, hills and plains, with an elevation of 986-2280 m. Irrigation and silt soil, saline-alkali soil, chestnut soil and meadow soil are the main soil types, and the main crops are wheat, sunflower and corn [21,22]. The mean annual precipitation in II area is 150-500 mm, and the mean annual temperature is 0-6.7℃. The topography of this area is dominated by plateaus, mountains and hills, with an elevation of 1150-2350 m. Cinnamon soil and chestnut soil are the main soil types, and the main crops are wheat, rape, sunflower, potato and miscellaneous grain [23,24]. The mean annual precipitation in III area is 305-485 mm, and the mean annual temperature is 0-7℃. The topography of this area is dominated by plateaus, mountains, hills and plains, with an elevation of 300-2000 m. Soil types include brown soil, black soil, irrigation and silt soil, meadow soil, aeolian sandy soil and alkaline soil, and the main crops are corn, sunflower, potato, miscellaneous grains and beans [25,26]. The mean annual precipitation in IV area is 270-467 mm, and the mean annual temperature is -2-6℃. The topography of this area is dominated by plateaus, hills and plains, with an elevation of 150-1800 m. Black soil is the main soil type, and the main crops are corn, soybean, wheat and rape [27].
2.2. Data Collection and Sample Analysis
In the flourishing period of plant growth, soil samples were taken from typical farmland and nearby grassland in the agro-pastoral areas of Inner Mongolia. The sampling time of wheat samples in area I was June, and that of other samples were from August to September. The samples of Hangjinhou Banner, Linhe District, Wulatezhong Banner, Wuchuan County, Wengniute Banner, Keerqin District, Zhalantun City, Yakeshi City and Labudalin farm ranch were sampled in 2019, the samples of Wuyuan County, Dalate Banner, Tumotezuo Banner, Kalaqin Banner, Naiman Banner, zhalaite Banner and Sanhe Hui Township were sampled in 2020, and the samples of Taipusi Banner and Chahaeryouyiqian Banner were sampled in 2021. There were 36 farmland sampling sites and 14 grassland sampling sites (Figure 1). In each plot, 4 points with similar terrain and environmental conditions were selected by diagonal sampling method, and soil samples were collected at 0~20 cm and 20~40 cm soil depths. A total of 288 farmland samples and 112 grassland samples were obtained. Air-dried and carefully selected soil samples to remove organic matter and fine roots for soil property analysis. Each mixed soil sample was divided into four parts according to the quartering method, and one part was selected to pass the 80-mesh sieve to determine the soil pH value and electric conductivity (EC), and the other part was selected to pass the 100-mesh sieve to determine the contents of soil organic carbon (SOC), total nitrogen (TN), total phosphorus (TP) and total potassium (TK). The determination of soil properties follows all standard schemes [28]. Meteorological factors were obtained from the records of 18 national weather stations near each sampling site, and annual mean temperature (MAT), annual mean precipitation (MAP), annual mean relative humidity (MARH), annual mean sunshine duration (MASD) (1981-2021) were regarded as climate factors. And the data of longitude and latitude for each sampling site were determined using Global Positioning system (GPS).
2.3. Data Analysis
The ratio of C, N, P and K (RCN, RCP, RCK, RNP, RNK, RPK) were calculated on a molar mass ratio [29]. The data were tested by Shapiro-Wilk normal test with SPSS (version 26, IBMSPSS, Somers, NY, USA ), and the differences were analyzed by nonparametric test. The box chart was drawn by origin (version 2023) to show the data of nutrient contents and stoichiometric ratios, and then all the indexes were plotted by Spearman correlation analysis.
3. Results
3.1. Comparison of C, N, P and K Contents between Farmland and Grassland
Soil nutrients in farmland and grassland were significantly different among agro-pastoral areas (P < 0.05) (Figure 2). On the whole, the contents of SOC and TN in farmland were lower than those in grassland, while the contents of TP and TK were higher than those in grassland, and the difference of TP content in 0-20 cm soil layer in I area was significant (P < 0.01). Compared with the grassland, SOC, TN and TK contents in farmland were significantly lower in I area than in other areas, and TP contents were significantly higher than in other areas (P < 0.05). SOC, TN and TP contents in III area were significantly lower than those in other areas, while TN and TK contents in IV area were significantly higher than those in other areas (P < 0.05).
3.2. Eco-Stoichiometric Characteristics of Soil C:N:P:K in Farmland and Grassland
The differences in the eco-stoichiometric ratios of farmland and grassland (except RCN) among agro-pastoral areas were significantly (P < 0.05) (Figure 3). The change trend of farmland and grassland were the same among areas, except RPK, other indexes showed “N” changes from west to east. On the whole, RCN, RCP, RNP and RNK of farmland were lower than those of grassland, and RPK of farmland was higher than that of grassland. RCK of I area and III area were higher than that of grassland, and the opposite was true of II area and IV area. Compared with grassland, the RCP, RCK and RNK of farmland in I area were significantly lower than those in other areas, RPK was significantly higher than that in other areas (P < 0.05), RCP, RCK and RPK of farmland in II area were significantly higher than those in other areas, RNP and RNK of farmland in III area were significantly lower than those in other areas, and RCN in IV area was significantly higher than that in other areas (P < 0.05).
3.3. Comparison of Nutrient Content and Stoichiometry in the Study Area with Other Scales
Overall scale of agro-pastoral ecotone in Inner Mongolia, the levels of SOC and TN of farmland ware lower than that of grassland, but the level of TP was higher, the nutrient of farmland was in the middle level, and the level of grassland was in the upper-middle level. The level of TP in farmland in I, II and III areas was higher than that in grassland, while the levels of SOC and TN in II area and III area were lower than those in grassland. The nutrient level of III area was in the middle and lower level, and the nutrient level in IV area was the highest (Figure 4).
Compared with the global soil C:N:P, the RCN of overall area and four regions in this study was higher, except the farmland in III area, and the RCP and RNP of the farmland in I area and III area and the grassland in all regions were lower. In the whole area of this study, compared with the northwest agro-pastoral ecotone, the C:N:P of farmland was higher, and the grassland was on the contrary, compared with the yellow soil area of western Shanxi, the RCN of farmland was lower and the others were higher, compared with Hebei Province, the RCN of grassland was lower and the others were higher, compared with Qinghai Province, the RCP and RNP of farmland were higher and the others were lower. Compared with the study in the same region, the RCN in II area was lower, and the RCP and RNP were higher. Compared with the research in the same region, RCN in III area was higher, RCP and RNP were lower, RCN and RNP in farmland were lower than those in northern wind-sandy area, conversely, RCP in farmland and grassland was higher (Figure 5).
3.4. Relationships between Soil C:N:P:K Stoichiometric and environmental Factors
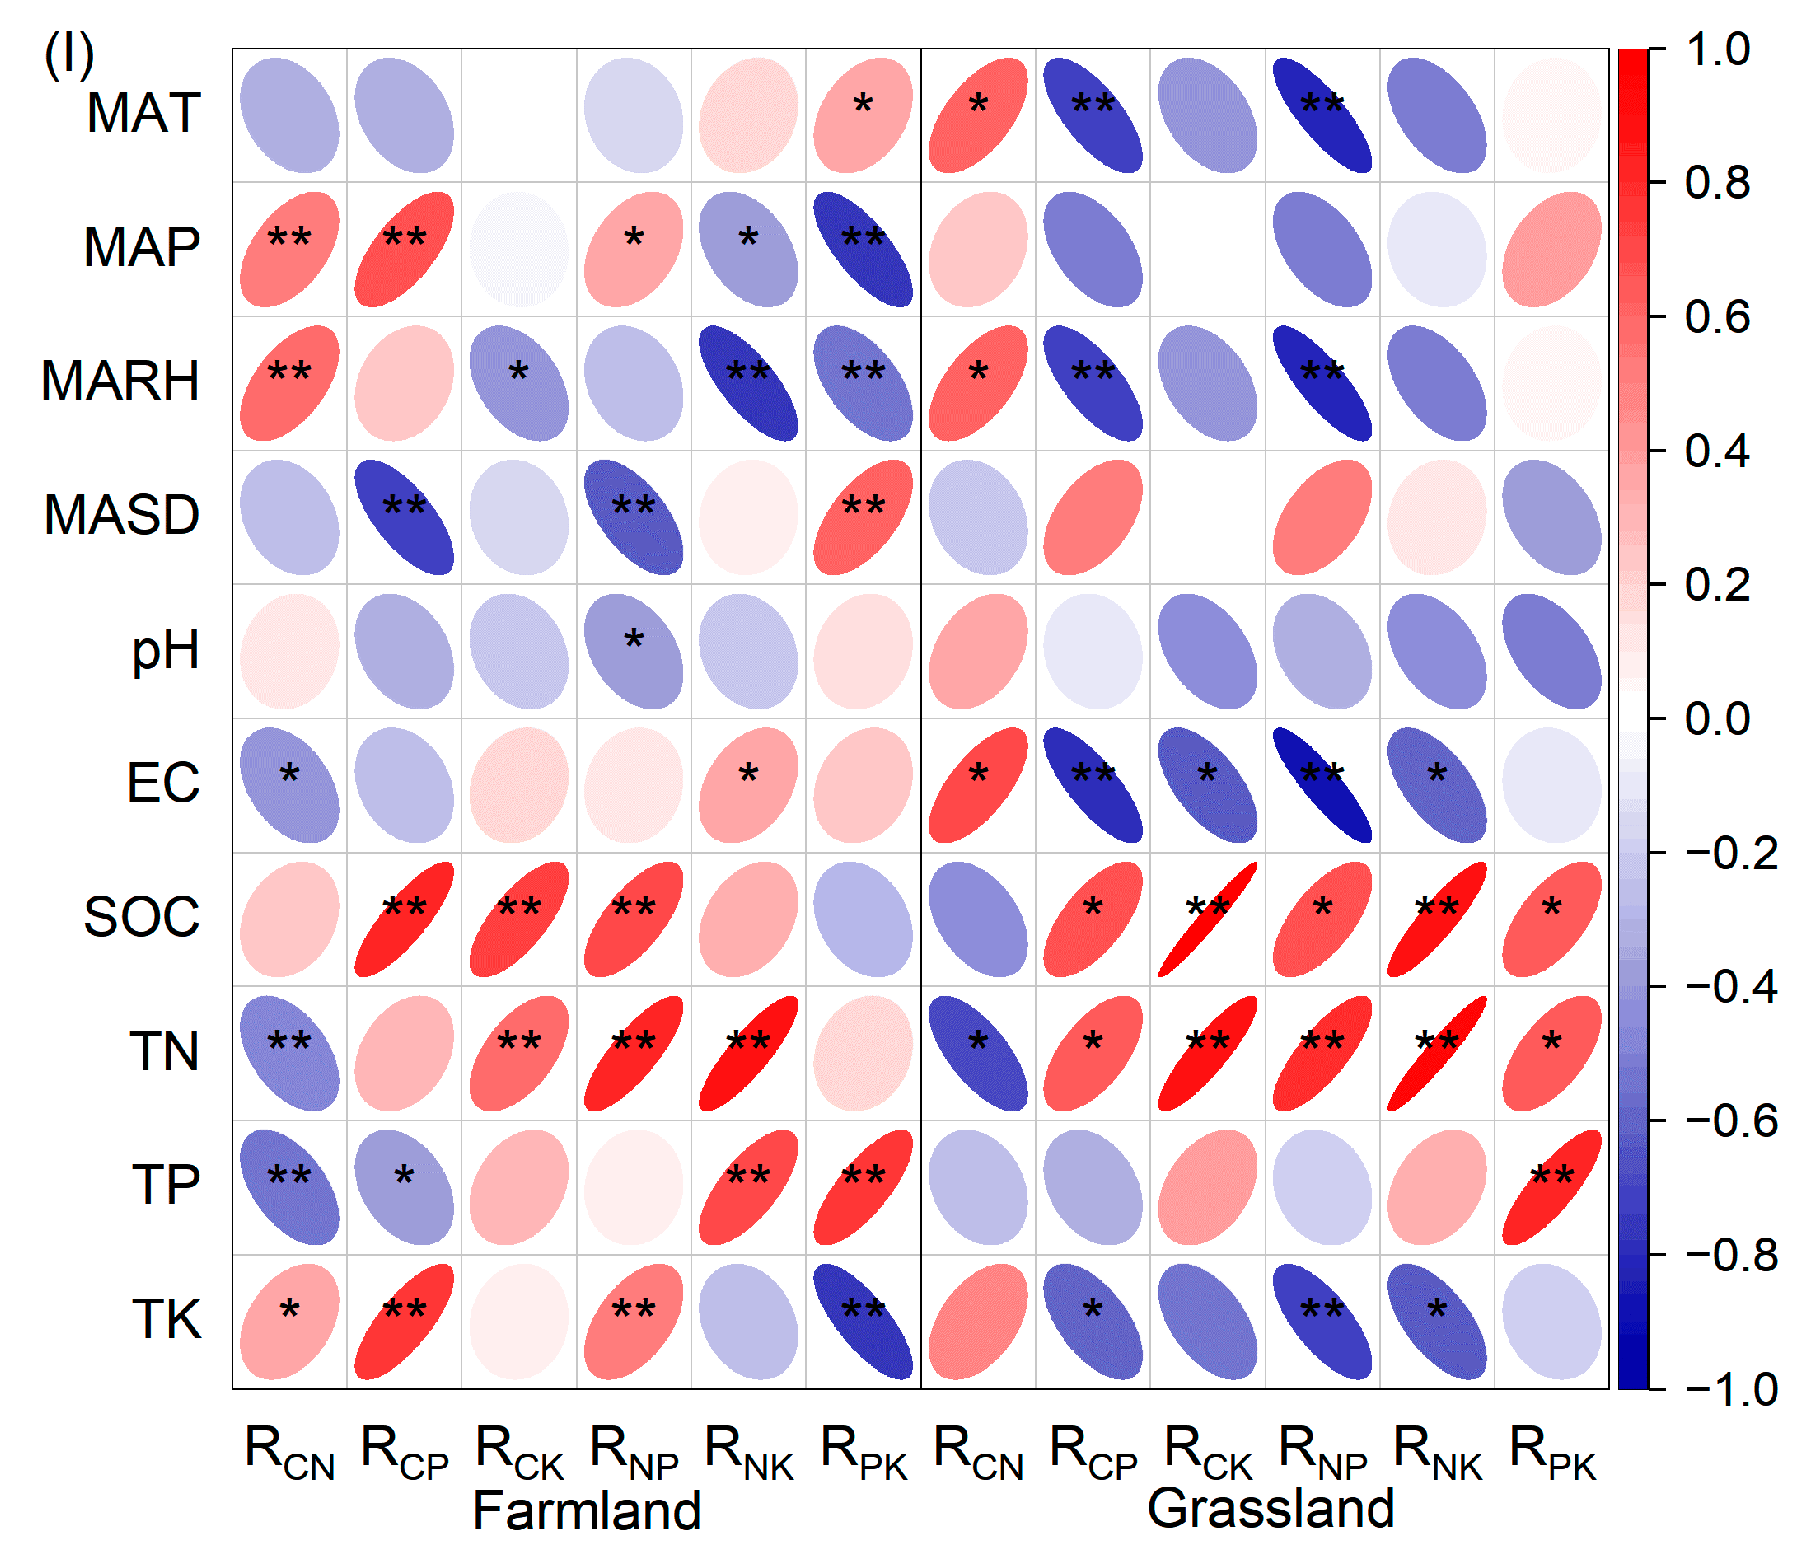
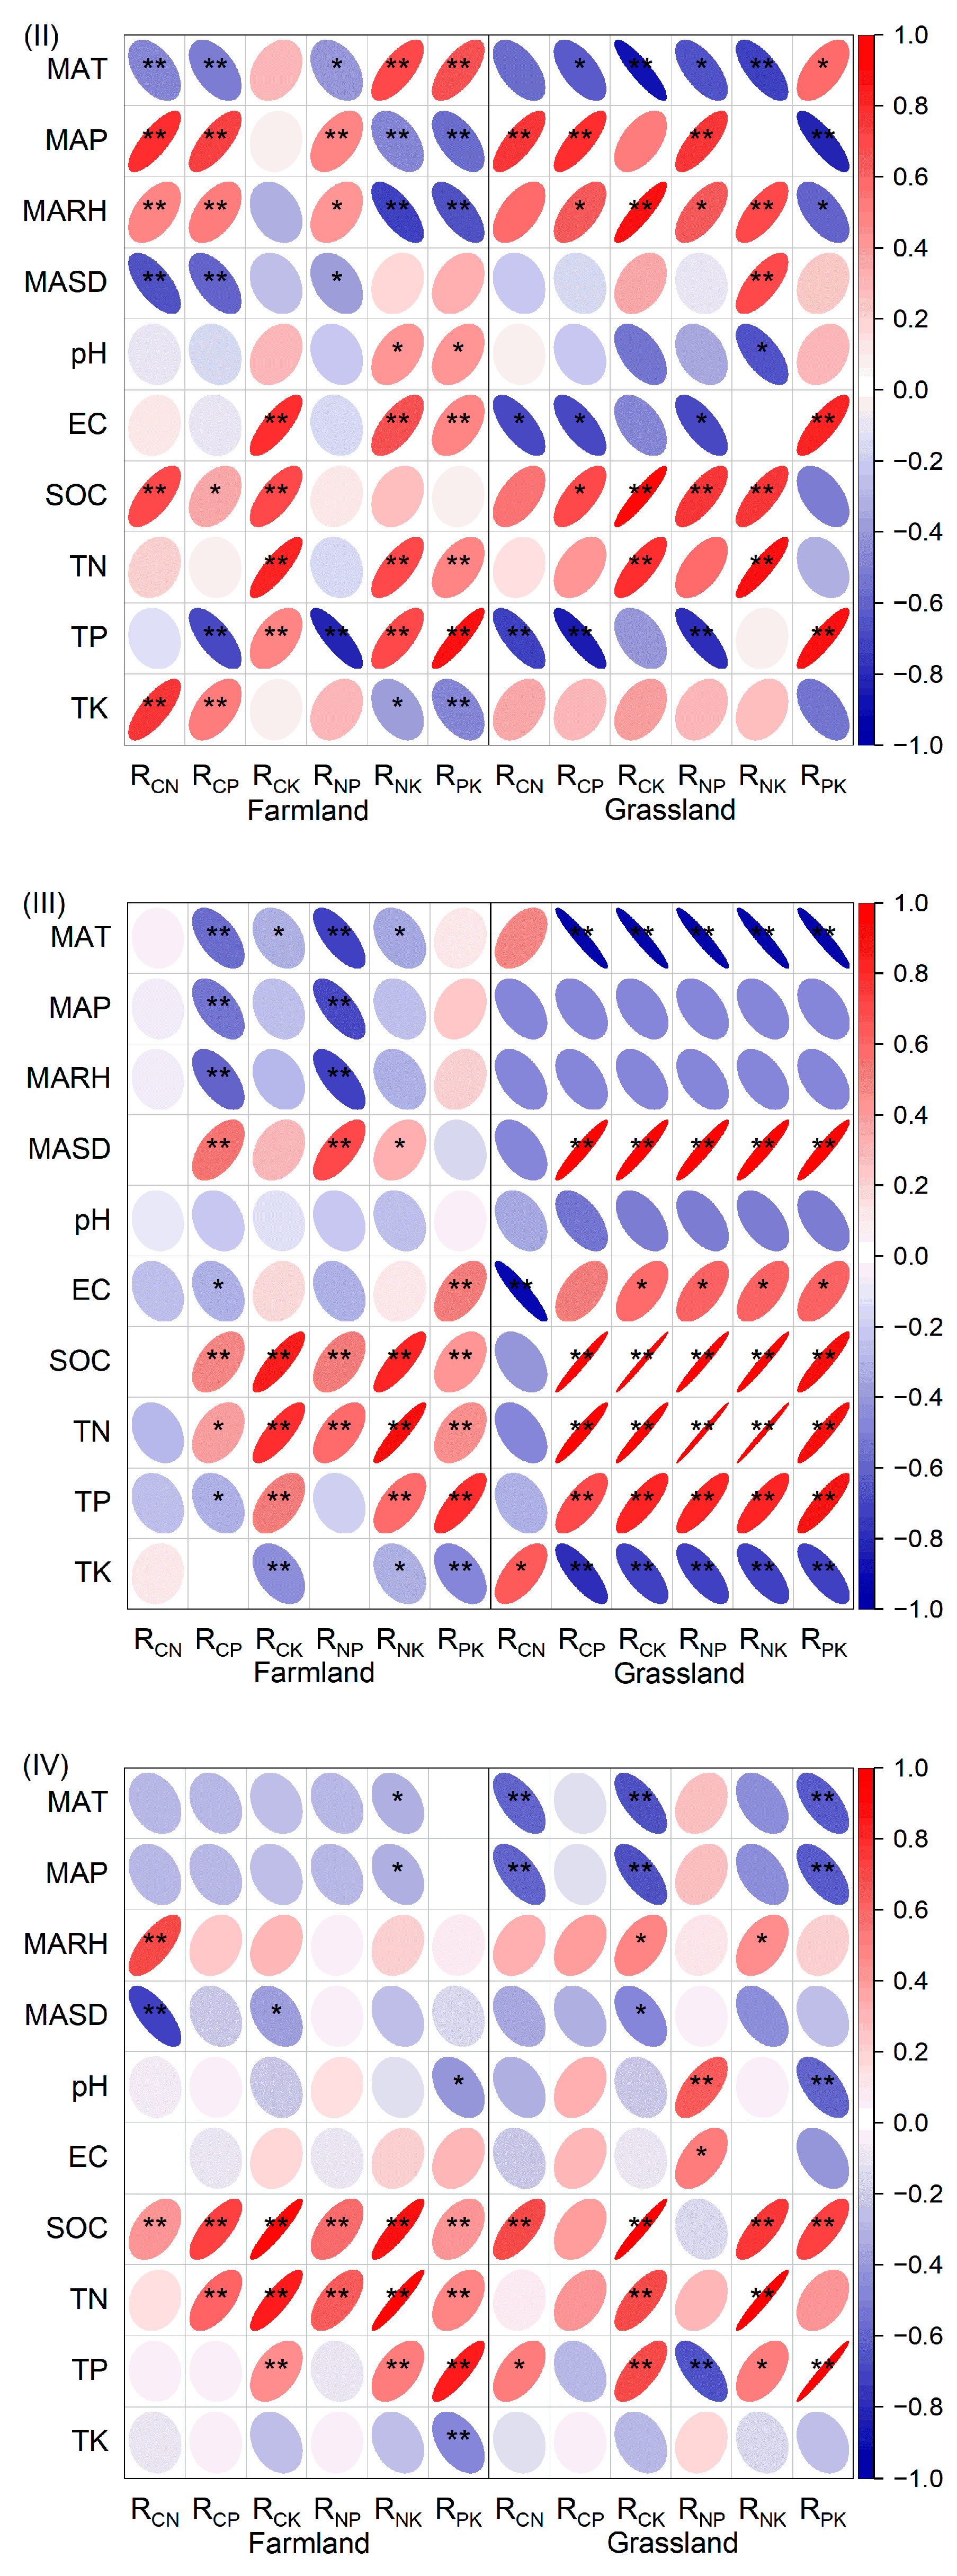
In the spearman correlation between soil stoichiometry and climate factors (Figure 6), farmland stoichiometry in I area was significantly correlated with MAP, MARH and MASD (P < 0.05), while C:N:P of grassland was significantly correlated with MAT and MARH (P < 0.05). Farmland stoichiometry except RCK in II area was significantly correlated with climate factors (P < 0.05), and the stoichiometry of grassland was significantly correlated with MAT, MAP and MARH (P < 0.05), and MAT was consistent with MASD, and MAP was consistent with MARH. RCP and RNP of farmland in III area were significantly correlated with climate factors (P < 0.01), and stoichiometry of grassland was significantly correlated with MAT and MASD except RCN (P < 0.01), and MASD was opposite to other climate factors in this region. In IV area, RCN of farmland was significantly correlated with MARH and MASD (P < 0.01), RCK was significantly correlated with MASD (P < 0.05), RNK was significantly correlated with MAT and MAP (P < 0.05), and RCN, RCK, RNK and RPK of grassland were significantly correlated with climate factors (P < 0.05), and MARH was opposite to other climate factors in this region. In areas I, II and III, the correlation between stoichiometry and soil electric conductivity was more significant than pH. The correlations between the contents of C, N, P, K and soil stoichiometry of farmland in I area and II area and grassland in III area were significant (P < 0.05).
4. Discussion
4.1. The Spatial Difference of C:N:P:K Soichiometry Was More Significant than That of Land Use Patterns
On the whole region scale of the agro-pastoral ecotone, SOC, TN, RCN, RCP and RNP of grassland were higher than that of farmland, while TP, TK and RPK were on the contrary, indicating that grassland had stronger nutrient accumulation capacity than farmland. This was similar to the research results of other scholars in the agro-pastoral eczones [15,18,36,37,38]. However, it was inconsistent with previous results in the windy and sandy areas of northern China and the yellow soil area of western Shanxi(Figure 4 and Figure 5), which may be due to the single soil type and low nutrient contents in the study areas. Soil microorganisms in farmland need nutrients to supply their own propagation, and soil available nitrogen content was lower, so RCN was higher than that in grassland.
Li et al. showed that soil C and N were more sensitive to grassland transformation than P, through meta analysis of 92 studies [39]. It was believed that crop harvest leads to the reduction of soil C in farmland ecosystem, tillage destroys soil structure, accelerates N loss, and fertilization leads to higher P and K content in farmland. Historically, soils have lost 40-90 Pg C through tillage and disturbance in the global [40]. Studies in agro-pastoral ecotone of northern China [41], northeast China [42,43] and Castelluccio di Norcia (centralItaly) [44] areas have also shown that the conversion of grassland to farmland will result in the loss of SOC and the decrease of soil chemical characteristics and basic soil fertility. But in our study, land use types only had significant effects on TP content, RCP and RPK (P < 0.05), while spatial environmental heterogeneity in the agro-pastoral ecotone of Inner Mongolia had more significant effects on soil nutrient contents and eco-stoichiometric ratios (Figure 2 and Figure 3).This is because soil eco-stoichiometry is jointly regulated by land use patterns, soil properties, human disturbance, climate and topography factors [45]. The spatial variation coefficient of SOC and TN content in farmland and grassland soil was higher (Table A2), while the variation coefficient of TP and TK was lower, because the accumulation of C and N elements were related to the decomposition of organic matter and self-reproduction ability of soil microorganisms, so it was greatly influenced by environmental factors. P and K elements were mainly affected by fertilization and soil parent materials, so the variability was small [46].
4.2. Stoichiometric Characteristics Indicated the Constraints on Agricultural Production in Each Region
The 0-40 cm soil C:N:P:K values of farmland and grassland on the whole scale in the agro-pastoral ecotone of Inner Mongolia were 44:3:1:25 and 82:6:1:36, respectively. The C:N:P of farmland is lower than that of Chinese soil (60:5:1), while that of grassland was the opposite [47]. The RCN ratio between 12 and 16 indicated that organic matter was well decomposed. At the same time, the study of forest soil showed that RCN < 25 indicated high risk of nitrate leaching. The RCP < 200 indicated net mineralization, and RNP < 10 represented N limitation [48,49]. The ranges of RCN, RCP and RNP in this study area were 12.2-15.44, 24.49-145.09 and 2-9.99, respectively, indicated that soil organic matter in farmland and grassland in this study area could be decomposed well on a global scale, and the phosphate mineralization rate was high, but nitrogen was limited.
The C:N:P:K values of farmland and grassland in I area were 23:2:1:15 and 37:3:1:24 respectively, which were lower than the C:N:P of the national soils, but the RCN was higher than the global level, and the RCP and RNP were lower , which was similar to the results of Dalat Banner [13]. This indicated that compared with other research areas, the decomposition rate of soil organic matter in farmland of I area was slower, and the availability of nitrogen was lower, but the availability of phosphorus was higher [50]. In addition, compared with grassland, the TP content of farmland was 2 grades higher, and the contents of C, N, and K were at a lower than medium level. This may be due to the loss of nitrogen caused by flood irrigation and soil leaching in the Yellow River, and the increase of phosphorus caused by over-fertilization, resulting in soil N limitation and P saturation. Therefore, the rational application of phosphorus fertilizer and the management measures to improve the efficient use of soil nitrogen are more conducive to the effective use of agricultural resources in this area, so as to achieve soil element balance.
The soil C:N:P:K of farmland and grassland in II area were 62:5:1:26 and 100:8:1:36, respectively. The C:N:P values were higher than the national soils, the RCN were higher than the global level, and the RCP and RNP of grassland were lower than the global level. The soil nutrient contents of farmland were at a medium level, C and N were one grade lower than that of grassland, and P was one grade higher. The results indicated that the soil mineralization rate was higher, but it was still limited by a lesser degree of nitrogen. The study at the northern foot of Yinshan showed that grassland reclamation changed soil physical structure and increased microbial activity, thereby increasing soil respiration, accelerating mineralization and decomposition of organic matter, and accelerating nitrogen loss rate [33]. However, compared with our study, the RCN was lower and the RNP was higher. This may be because our study included the southern and northern foothills of Yinshan Mountain. The wind erosion intensity of soil in the southern foothills was weaker than that in the northern foothills, and the soil available nitrogen content was generally higher than that in the northern foothills. Therefore, cultivation measures to improve soil carbon sequestration capacity and available nitrogen are more beneficial to the stoichiometric balance of the region.
The soil C:N:P:K of farmland and grassland in III area were 39:3:1:40 and 87:6:1:81 respectively. The C:N:P of farmland was lower than that of the whole country, while that of grassland was higher. The RCN of grassland was higher than the global level, RCP and RNP were lower, the RCN, RCP and RNP of farmland were lower than the global level. The nutrient content of farmland was in the lower level, and the TP content was 1 grade higher than that of grassland. The results showed that the decomposition rate of soil organic matter in this area was fast, which was not conducive to the accumulation of organic carbon, and the net mineralization rate of phosphorus was fast, but there was still a strong nitrogen limitation, and the degree of nutrient deficiency was N > C > P. But the results were at odds with other studies on sandy land, which may be because our research scope was the whole West Liaohe River basin, included Horqin sandy land and Yanshan hilly area, while the water and fertilizer retention of soil in Yanshan hilly area were better than that of sandy land, so the content of soil organic carbon and phosphorus was higher. Therefore, reasonable fertilization combined with cultivation measures to improve the ability of soil water and fertilizer retention are more beneficial to the material circulation of farmland ecosystem in this region.
In the agro-pastoral area along the foothills of Daxing'anling Mountains, the RCN of farmland in 0-20 cm soil layer was higher than that of grassland, which may be due to the low average temperature in this area, little difference in microbial activity between grassland and farmland, and little change in organic carbon [42]. At the same time, due to the short frost-free period, less fertilizer application in farmland, and the cultivation measures such as fallow rotation, stubble and organic fertilizer application adopted by farms, the organic carbon retention capacity of farmland soil is strong. The RCN, RCP and RNP of farmland in 0-40 cm soil layer were higher than the global level, while the RCN and RCP of grassland soil were higher than that of global level, and the RNP was lower. It showed that the decomposition and mineralization rate of organic matter in natural soil in this area was slow, which was beneficial to the accumulation of organic carbon, but the availability of phosphorus is low.
The soil C:N:P:K of farmland and grassland in IV area were 102:7:1:28 and 141:10:1:29, respectively. The C:N:P was higher than the national soil, and the grassland C:N:P (134:9:1) was higher than the national 0-10 cm soil layer. The RCN, RCP and RNP of farmland soil layer were higher than the global level, and the RCN and RCP of grassland soil were higher, but the RNP was lower. The contents of C, N and K in farmland and grassland soil were at an upper level, and the contents of P were at a medium level. The results indicated that there was no nutrient deficiency in this area, but the net phosphorus mineralization rate was relatively lower. The RCN of 0-20 cm soil layer in farmland was higher than that in grassland, which may be due to the low average temperature in the region and the slow decomposition of organic carbon [42,47], and combined with measures such as crop rotation, fallow and residue, the surface soil has a strong ability to retain organic carbon.
Early research in Brigelo, Queensland found that continuous tillage and planting can maintain the availability of soil nitrogen better than continuous grazing [51]. Recent studies in Hokkaido, Japan [52] and Bavaria, Germany showed that the short-term conversion of grassland to cultivated land increased the diversity of soil bacterial community structure, and combined with the nitrogen fixation of leguminous plants, the soil organic carbon increased. Therefore, the dry farming areas in the agro-pastoral ecotone of Inner Mongolia should advocate grain-grass rotation, increase the application of organic fertilizer and straw returning to the field, and rationally allocate fertilizer according to the vegetation types and the actual situation in the growth stage, which will help to balance the soil eco-stoichiometry.
4.3. Effects of Environmental Factors on Eco-stoichiometry of Farmland and Grassland
Through Spearman correlation analysis, we found that the effects of C, N, P and K contents on soil ecostoichiometry in this study area followed the law of geographical correlation [53] (Figure 4). N and K contents in grassland I and III had significant effects on elemental ecological cycles (p < 0.05), and K was negatively correlated with RCP and RNP, while P contents in III and IV areas had significant effects on C, N, K cycles (p < 0.05). It may be because I area was adjacent to II area, III area was adjacent to IV area, and I area and III area were river basins, so the soil properties between regions were similar. Too little or too much elements in farmland had no significant effect on the ecological cycle of other elements. C content in III area and IV area significantly affected N, P, K cycle. K content significantly affected C, N, P cycle only in I area and II area. However, N and P content significantly affected element ecological cycle in the whole region, and RCN decreased with the increase of P content, it was not conducive to the accumulation of organic matter. Therefore, the ecological chemical cycle of elements in grassland soil was mainly controlled by C and N, while farmland was mainly controlled by N and P, RCN, RCP and RNP were the limiting indexes of soil nutrient content. Similar results had been obtained of Yellow River Wetland in Baotou [13], Horqin Sandy Land [18] and Chongqing Mountain [54]. In this study, soil pH was only significantly correlated with RNP, RNK and RPK, which was inconsistent with the research results of paddy fields [55] and in the alpine region of the Loess Plateau [56], but fertilization caused soil stoichiometry in farmland to be greatly affected by soil pH [57]. This may be related to the land type, geographical environment and research scale in the study area, so the conclusions drawn have regional limitations.
The effects of MAT and MAP on soil eco-stoichiometry also had geographical gradients. Soil eco-stoichiometry in I and II areas was affected by MAT and MAP on the contrary, while MAT and MAP in III and IV areas had the same effects on soil eco-stoichiometry. It may be because I and II were along the Yinshan Mountains in the east-west direction, while III and IV were along the Daxing'anling Mountains in the north-south direction , so the climate and environment of I and II areas and III and IV areas were similar. At the same time, temperature and precipitation were significantly correlated with soil stoichiometry in farmland and grassland, this was inconsistent with the findings of the Northeast black land study [58], compared with the mean value of a single year, the average temperature and precipitation in the long-term series of this study can better reflect the long-term climate pattern. Moreover, the influence of temperature and precipitation change on soil stoichiometry in different ecosystems is inconsistent, which is inconsistent with the studies on forest and grassland [59]. This may be because farmland is a semi-natural ecosystem, which is different from the natural ecosystem due to human factors.
5. Conclusions
There is no single Redfield-like ratio [60] in farmland and grassland soils across Inner Mongolia agro-pastoral ecotone , and the RCN, RCP and RNP of farmland are lower than those of natural grassland. Land use pattern has a significant impact on the cycle of P elements. The stoichiometric relationship between farmland and grassland follows the geographical gradient in the agro-pastoral ecotone, and the trend is consistent. The difference of stoichiometric spatial distribution is more significant than that of land use pattern.
The deficiency degree of soil nutrients in farmland is C > N, but P is saturated in the agro-pastoral area along the Yellow River mainstream plain, and N > C > P in the agro-pastoral area along the foot of Yinshan Mountain and the West Liaohe River Basin. The effect of agricultural production on the accumulation of C, N, P and K in soil was not obvious in the agro-pastoral area along the foothills of Daxing'anling Mountains.
The effect of grassland nutrient content on stoichiometry is related to the similarity of soil properties, while the man-made input of chemical elements destroys the stoichiometric balance of farmland soil, so the stoichiometric relationship of farmland soil is greatly affected by element content. The effect of MAT and MAP on soil stoichiometry is related to the environmental heterogeneity between regions. Farmland is more significantly affected by MAP, while grassland is more significantly affected by MAT.
Author Contributions
Conceptualization, Y.Z. and L.L.; methodology, Y.Z. and M.L.; software, Y.Z.; validation, Y.Z., L.L. and M.L.; formal analysis, Y.Z., L.H. and J.Q.; investigation, Y.Z., L.H., J.Y., X.Z., Y.B., D.Y., G.H.; resources, L.L.; data curation, Y.Z.; writing—original draft preparation, Y.Z. and J.Q.; writing—review and editing, Y.Z., M.L. and L.L.; visualization, Y.Z. and M.L.; supervision, L.L.; project administration, L.H. and J.Y.; funding acquisition, L.L. All authors have read and agreed to the published version of the manuscript.
Funding
This This research was funded by National Key Research and Development Program of China “Research and Demonstration of Water-heat Matching and productivity Improvement Technology” (2022YFD1500904-3), Inner Mongolia Autonomous Region science and Technology major special project “Research and Demonstration on Breeding of New Oat Varieties, Green Cultivation Technology and Nutritive Function Products” (2021ZD0002) and Ordos Major Science and Technology Project “Research and Demonstration of Saline-Alkali Land Biological Improvement Technology and Efficient Utilization Model” (2022EEDSKJZDZX011).
Acknowledgments
We would like to thank the Oat research Team for providing experimental equipment, and are grateful to anonymous reviewers all gave very helpful editorial comments.
Conflicts of Interest
The authors declare no conflicts of interest.
Appendix A

Table A1.
Nutrient classification system of the second nationwide condition census soil survey.
| Index | Unit | Nutrient classifications | |||||
|---|---|---|---|---|---|---|---|
| 1 | 2 | 3 | 4 | 5 | 6 | ||
| SOC | g/kg | >23.2 | 17.4-23.2 | 11.6-17.4 | 5.8-11.6 | 3.48-5.8 | <3.48 |
| TN | g/kg | >2 | 1.5-2 | 1-1.5 | 0.75-1.00 | 0.5-0.75 | <0.5 |
| TP | g/kg | >1.0 | 0.8-10 | 0.6-0.8 | 0.4-0.6 | 0.2-0.4 | <0.2 |
| TK | g/kg | >25 | 20-25 | 15-20 | 10-15 | 5-10 | <5 |
Table A2.
Descriptive Statistics.
| Variables | Farmland (N=144) | Grassland (N=56) | ||||||||
|---|---|---|---|---|---|---|---|---|---|---|
| Min | Max | Mean | SD | CV(%) | Min | Max | Mean | SD | CV(%) | |
| MAT(℃) | -1.85 | 8.69 | 4.61 | 3.36 | 72.98 | -1.85 | 7.71 | 3.96 | 3.48 | 87.77 |
| MAP(mm) | 135.97 | 532.33 | 340.15 | 97.04 | 28.53 | 210.79 | 532.33 | 376.39 | 71.72 | 19.06 |
| MARH(%) | 46.39 | 68.46 | 53.46 | 6.58 | 12.31 | 46.39 | 68.46 | 55.41 | 6.35 | 11.45 |
| MASD(h) | 2491.63 | 3222.56 | 2902.34 | 185.65 | 6.40 | 2491.63 | 3098.61 | 2840.74 | 168.35 | 5.93 |
| pH | 5.97 | 8.65 | 7.70 | 0.59 | 7.62 | 6.15 | 8.55 | 7.42 | 0.73 | 9.79 |
| EC(μS cm-1) | 45.15 | 989.00 | 156.53 | 144.10 | 92.06 | 34.35 | 217.50 | 90.09 | 41.94 | 46.55 |
| SOC(g kg-1) | 2.49 | 43.77 | 14.24 | 9.60 | 67.45 | 2.01 | 58.47 | 21.66 | 14.79 | 68.25 |
| TN(g kg-1) | 0.27 | 3.39 | 1.24 | 0.70 | 56.45 | 0.14 | 4.10 | 1.80 | 1.10 | 61.15 |
| TP(g kg-1) | 0.18 | 1.18 | 0.65 | 0.21 | 31.82 | 0.14 | 1.00 | 0.52 | 0.22 | 41.91 |
| TK(g kg-1) | 12.05 | 27.48 | 20.56 | 3.65 | 17.73 | 14.05 | 25.86 | 20.82 | 3.14 | 15.09 |
| RCN | 8.06 | 21.93 | 13.07 | 2.42 | 18.52 | 8.76 | 24.85 | 14.41 | 3.48 | 24.17 |
| RCP | 12.37 | 144.82 | 59.77 | 35.57 | 59.51 | 17.73 | 231.23 | 105.90 | 55.01 | 51.95 |
| RCK | 0.35 | 5.96 | 2.22 | 1.31 | 58.91 | 0.26 | 7.88 | 3.32 | 2.06 | 62.04 |
| RNP | 0.86 | 10.17 | 4.46 | 2.22 | 49.70 | 1.30 | 15.49 | 7.63 | 3.80 | 49.81 |
| RNK | 0.03 | 0.39 | 0.17 | 0.08 | 48.81 | 0.01 | 0.48 | 0.24 | 0.13 | 54.69 |
| RPK | 0.01 | 0.11 | 0.04 | 0.02 | 46.70 | 0.01 | 0.06 | 0.03 | 0.01 | 42.33 |
References
- Sardans, J.; Janssens, I.A.; Ciais, P.; Obersteiner, M.; Peñuelas, J. Recent advances and future research in ecological stoichiometry. Perspectives in Plant Ecology, Evolution and Systematics 2021, 50, 125611–125634. [Google Scholar] [CrossRef]
- Elser, J.; Sterner, R.; Gorokhova, E.A.; Fagan, W.; Markow, T.; Cotner, J.; Harrison, J.; Hobbie, S.; Odell, G.; Weider, L. Biological stoichiometry from genes to ecosystems. Ecology letters 2000, 3, 540–550. [Google Scholar] [CrossRef]
- Graham, H. Ecological Stoichiometry: Biology of elements from molecules to the biosphere. J Plankton Res. 2003, 25, 1183. [Google Scholar] [CrossRef]
- Downing, J.A. Marine nitrogen: phosphorus stoichiometry and the global N: P cycle. Biogeochemistry 1997, 37, 237–252. [Google Scholar] [CrossRef]
- Zhang, L.X.; Bai, Y.F.; Han, X.G. Application of N: P stoichiometry to ecology studies. Journal of Integrative Plant Biology 2003, 45, 1009–1018. [Google Scholar]
- Aitkenhead, J.A.; Mcdowell, W.H. Soil C: N ratio as a predictor of annual riverine DOC flux at local and global scales. Global biogeochemical cycles 2000, 14, 127–138. [Google Scholar] [CrossRef]
- Feng, D.F.; Bao, W.K. Review of the temporal and spatial patterns of soil C:N:P stoichiometry and its driving factors. Chinese Journal of Appplied Environmental Biology 2017, 23, 400–408. [Google Scholar] [CrossRef]
- Liu, C.; Xu, Y.Q.; Sun, P.L.; Huang, A.; Zheng, W.R. Land use change and its driving forces toward mutual conversion in Zhangjiakou City, a farming-pastoral ecotone in Northern China. Environmental Monitoring and Assessment 2017, 189, 1–20. [Google Scholar] [CrossRef] [PubMed]
- Ptacnik, R.; Jenerette, G.D.; Verschoor, A.M.; Huberty, A.F.; Solimini, A.G.; Brookes, J.D. Applications of ecological stoichiometry for sustainable acquisition of ecosystem services. Oikos 2005, 109, 52–62. [Google Scholar] [CrossRef]
- Li, C.; Zhao, L.; Sun, P.; Zhao, F.; Kang, D.; Yang, G.; Han, X.; Feng, Y.; Ren, G. Deep soil C, N, and P Stocks and stoichiometry in response to land use patterns in the loess hilly region of China. PLoS One 2016, 11, 0159075–159089. [Google Scholar] [CrossRef] [PubMed]
- Kim, D.-G.; Kirschbaum, M.U.F.; Eichler Löbermann, B.; Gifford, R.M.; Liáng, L.L. The effect of land-use change on soil C, N, P, and their stoichiometries: A global synthesis. Agriculture, Ecosystems and Environment 2023, 348, 108402–108416. [Google Scholar] [CrossRef]
- Tao, Z.P.; Wang, S.Q.; Sun, P.L.; Li, K.D.; Tian, W.; Han, X.X. Spatio-temporal differentiation and driving factors of cropland in the agro-pastoral ecotone of Northern China. Arid Land Geography 2022, 45, 153–163. [Google Scholar] [CrossRef]
- Wang, H.; Guo, Y.F.; Yao, Y.F.; Qi, W.; Qin, F.C.; Wang, J.K. Ecological stoichiometry of soil carbon,nitrogen and phosphorus under different land use patterns. Southwest China Journal of Agricultural Sciences 2020, 33, 995–1000. [Google Scholar] [CrossRef]
- Ma, Y.F.; Wang, W.M.; Jia, B.Q. Spatial variability analysis on soil nutrients in semi-arid agro-pastoral transition area—A case study in EjinHolo Banner, Inner Mongolia. Journal of arid land resources and environment 2007, 21, 123–130. [Google Scholar]
- Liu, Q.Y.; Tong, Y.P. Effects of land use type on soil nutrient distribution in northern agro-pastoral ecotone. Chinese Journal of applied ecology 2005, 16, 1849–1852. [Google Scholar]
- Xie, H.L.; Li, B.; Liu, L.M.; Zhang, X.S. Study on spatial feature of soil nutrients based on integration of spatial statistical analysis and GIS in farming-pastoral zone—A case study in Wengniute County,Inner Mongolia. Journal of soil and water conservation 2006, 20, 73–76. [Google Scholar] [CrossRef]
- Yang, R.; Sai, N.; Su, L.; Shang, H.J.; Liu, Y.H.; Guo, Y.S. Soil C, N and P contents and ecological stoichiometric characteristics in Baotou Yellow River wetland, Inner Mongolia. Acta ecologica sinica 2020, 40, 2205–2214. [Google Scholar] [CrossRef]
- Cao, W.J. Stoichiometric characteristics and their spatial distribution patterns in surface soils across the Horqin Sandy Land of China. Master, Lanzhou Jiaotong University, Lanzhou, 2021. [Google Scholar] [CrossRef]
- Sun, X.D.; Ning, Z.Y.; Yang, H.L.; Zhang, Z.Q.; Li, Y.L. The Stoichiometry of carbon, nitrogen and phosphorus in soil in typical desertified regions, North China. Journal of desert research 2018, 38, 1209–1218. [Google Scholar] [CrossRef]
- Chen, L.L.; Wang, K.X.; Baoyin, T. Effects of grazing and mowing on vertical distribution of soil nutrients and their stoichiometry (C: N: P) in a semi-arid grassland of North China. Catena 2021, 206, 105507–105514. [Google Scholar] [CrossRef]
- Qu, J.H.; Li, L.J.; Zhao, P.Y.; Han, D.Y.; Zhao, X.Y.; Zhang, Y.L.; Han, L.; Wang, Y. Impact of phosphorous fertilization on rape and common vetch intercropped fodder and soil phosphorus dynamics in North China. Agriculture Week 2022, 12, 1949–1961. [Google Scholar] [CrossRef]
- Li, X.B.; Li, L.J.; Ma, N.J. Effects of mixed planting of oat and rape on forage yield and quality and soil enzyme activities. Chinese journal of soil science 2020, 51, 897–904. [Google Scholar] [CrossRef]
- Qu, J.H.; Li, L.J.; Bai, J.H.; Chen, G.M.; Zhang, Y.L.; Chang, Q. Influence of different proportion intercropping on oat and common vetch yields and nutritional composition at different growth stages. Agronomy 2022, 12, 1908–1921. [Google Scholar] [CrossRef]
- Han, D.Y.; Li, L.J.; Zhao,X.Y.; Qu, J.H.; Yang,J.H.; Wang, Q.J.; Luo, S.J.; Han,L. Effects of nitrogen application on yield, quality, water and nitrogen use efficiency of intercropping oat and common vetch. Journal of Northwest A&F University (Natural Science Edition) 2023, 51, 40–51. [CrossRef]
- Yang, J.H.; Li, L.J.; Zhang, Y.L.; Han, D.Y.; Han, L.; Zhao, X.Y.; Luo, S.J.; Zhang, H.J. Effects of oat and common vetch intercropping and fertilization on forage yield and quality in Horqin Sandy Land. Agricultural research in the arid areas 2023, 41, 179–189. [Google Scholar]
- Zhang, P.; Sun, J.Y.; Li, L.J.; Wang, X.X.; Li, X.T.; Qu, J.H. Effect of soybean and maize rotation on soil microbial community structure. Agronomy 2019, 9, 42–52. [Google Scholar] [CrossRef]
- Wu, P.B.; Li, L.J.; Zhang, Y.L.; Li, X.T.; Yang, F. Effects of rotation and fertilization on soil organic carbon and its fractions and soil nutrients. Chinese journal of soil science 2020, 51, 416–422. [Google Scholar] [CrossRef]
- Bao, S.D. Agrochemical analysis of soil, 3rd ed.; China Agriculture Press: Beijing, China, 2000; pp. 30-33,42-48,76-78,101-102. [Google Scholar]
- Cleveland, C.C.; Liptzin, D. C:N:P stoichiometry in soil: is there a “Redfield ratio” for the microbial biomass? Biogeochemistry 2007, 85, 235–252. [Google Scholar] [CrossRef]
- National Soil Census Office. Chinese soil, 1rd ed.; China Agriculture Press: Beijing, China, 1998; pp. 878,904,922. [Google Scholar]
- Xu, X.F.; Thornton, P.E.; Post, W.M. A global analysis of soil microbial biomass carbon, nitrogen and phosphorus in terrestrial ecosystems. Global Ecology and Biogeography 2013, 22, 737–749. [Google Scholar] [CrossRef]
- Liu, X.; Ma, J.; Ma, Z.W.; Li, L.H. Soil nutrient contents and stoichiometry as affected by land-use in an agro-pastoral region of northwest China. Catena 2017, 150, 146–153. [Google Scholar] [CrossRef]
- Gao, J.L.; Luo, F.M.; Gao, Y.; Dang, X.H.; Meng, Z.J.; Chen, X.N.; Duan, N. Ecological soil C,N,and P stoichiometry of different land use patterns in the agriculture-pasture ecotone of Northern China. Acta ecologica sinica 2019, 39, 5594–5602. [Google Scholar] [CrossRef]
- Cao, X.H.; Long, H.Y.; Zhou, J.G.; Zhu, A.X.; Liu, H.B.; Lei, Q.L.; Qiu, W.W. Spatial variation of ecological stoichiometry characteristics of topsoil carbon, nitrogen and phosphorus in Hebei Province, China. Acta ecologica sinica 2017, 37, 6053–6063. [Google Scholar] [CrossRef]
- Hu, Y.W.; Sun, R.X.; Shen, M.S.; Shi, Z.L.; Liu, C.; Xu, Q.T.; Liu, J.T.; Zhang, J.J. Effects of land use types on the stoichiometric characteristics of soil C:N:P and the physical and chemical properties of soil in western Shanxi loess region. Arid zone research 2021, 38, 990–999. [Google Scholar] [CrossRef]
- Zhao, W.; Huang, L.M. Stoichiometric characteristics and influencing factors of soil nutrients under different land use types in an alpine mountain region. Acta ecologica sinica 2022, 42, 4415–4427. [Google Scholar] [CrossRef]
- Shi, C.Y.; Ma, L. Effect of different land use on soil nutrient in Northern agriculture-pasturage eco-zone—A case in saibei management area of Zhangjiakou City. Journal of Hebei Normal University (Natural Science Edition) 2009, 33, 815–819. [Google Scholar]
- Wang, F.-P.; Wang, X.-C.; Yao, B.-Q.; Zhang, Z.-H.; Shi, G.-X.; Ma, Z.; Chen, Z.; Zhou, H.-K. Effects of land-use types on soil organic carbon stocks: a case study across an altitudinal gradient within a farm-pastoral area on the eastern Qinghai-Tibetan Plateau, China. Journal of Mountain Science 2018, 15, 2693–2702. [Google Scholar] [CrossRef]
- Li, S.C.; Xu, J.H.; Tang, S.M.; Zhan, Q.W.; Gao, Q.H.; Ren, L.T.; Shao, Q.Q.; Chen, L.; Du, J.; Hao, B. A meta-analysis of carbon, nitrogen and phosphorus change in response to conversion of grassland to agricultural land. Geoderma 2020, 363, 114149–114156. [Google Scholar] [CrossRef]
- Smith, P. Land use change and soil organic carbon dynamics. Nutrient Cycling in Agroecosystems 2007, 81, 169–178. [Google Scholar] [CrossRef]
- Rong, Y.P.; Ma, L.; Johnson, D.A.; Yuan, F. Soil respiration patterns for four major land-use types of the agro-pastoral region of northern China. Agriculture, Ecosystems & Environmental 2015, 213, 142–150. [Google Scholar] [CrossRef]
- Ding, F.; Hu, Y.L.; Li, L.J.; Li, A.; Shi, S.W.; Lian, P.Y.; Zeng, D.H. Changes in soil organic carbon and total nitrogen stocks after conversion of meadow to cropland in Northeast China. Plant and Soil 2013, 373, 659–672. [Google Scholar] [CrossRef]
- Qi, Y.C.; Dong, Y.S.; Peng, Q.; Xiao, S.S.; He, Y.T.; Liu, X.C.; Sun, L.G.; Jia, J.Q.; Yang, Z.J. Effects of a conversion from grassland to cropland on the different soil organic carbon fractions in Inner Mongolia, China. Journal of Geographical Sciences 2012, 22, 315–328. [Google Scholar] [CrossRef]
- Francioni, M.; D’ottavio, P.; Lai, R.; Trozzo, L.; Budimir, K.; Foresi, L.; Kishimoto-Mo, A.W.; Baldoni, N.; Allegrezza, M.; Tesei, G. Seasonal soil respiration dynamics and carbon-stock variations in mountain permanent grasslands compared to arable lands. Agriculture Week 2019, 9, 165–176. [Google Scholar] [CrossRef]
- Chapin III, F.S.; Matson, P.A.; Mooney, H.A.; Vitousek, P.M. Principles of terrestrial ecosystem ecology. 2002; 1–16. [Google Scholar] [CrossRef]
- Wang, S.Q.; Yu, G.R. Ecological stoichiometry characteristics of ecosystem carbon, nitrogen and phosphorus elements. Acta ecologica sinica 2008, 28, 3937–3947. [Google Scholar]
- Tian, H.Q.; Chen, G.S.; Zhang, C.; Melillo, J.M.; Hall, C.A. Pattern and variation of C: N: P ratios in China’s soils: a synthesis of observational data. Biogeochemistry 2010, 98, 139–151. [Google Scholar] [CrossRef]
- Bui, E.N.; Henderson, B.L. C: N: P stoichiometry in Australian soils with respect to vegetation and environmental factors. Plant and Soil 2013, 373, 553–568. [Google Scholar] [CrossRef]
- Gundersen, P.; Callesen, I.; De Vries, W. Nitrate leaching in forest ecosystems is related to forest floor CN ratios. Environmental pollution 1998, 102, 403–407. [Google Scholar] [CrossRef]
- Zhang, H.; Ouyang, Z.C.; Zhao, X.M. Effects of different land use types on ecological stoichiometry characteristics of carbon, nitrogen and phosphorus in farmland soils in Jiangxi Province, China. Acta scientiae circumstantiae 2019, 39, 939–951. [Google Scholar] [CrossRef]
- Robertson, F.A.; Myers, R.J.K.; Saffigna, P.G. Carbon and nitrogen mineralization in cultivated and grassland soils in subtropical Queensland. Soil Research 1993, 31, 611–619. [Google Scholar] [CrossRef]
- Mukumbuta, I.; Shimizu, M.; Hatano, R. Short-term land-use change from grassland to cornfield increases soil organic carbon and reduces total soil respiration. Soil and Tillage Research 2019, 186, 1–10. [Google Scholar] [CrossRef]
- Miller, H.J. Tobler's first law and spatial analysis. Annals of the association of American geographers 2004, 94, 284–289. [Google Scholar] [CrossRef]
- Zhang, L. Response of C, N, P Eco-stoichiometry of typical mountain soils to changes in land use patterns: A case study of Tianfu Town, Beibei District, Chongqing. Master, Southwest University, Chongqing, 2021. [CrossRef]
- Dai, Y.T.; Zhou, P.; Guo, X.B.; Luo, P.; Chen, X.B.; Wu, J.S. Role of environmental factors on concentrations and ratios of subsoil C–N–P in subtropical paddy fields. Journal of Soils and Sediments 2023, 23, 1999–2010. [Google Scholar] [CrossRef]
- Liu, R.S.; Wang, D.M. Soil C, N, P and K stoichiometry affected by vegetation restoration patterns in the alpine region of the Loess Plateau, Northwest China. Plos one 2020, 15, 241859–241865. [Google Scholar] [CrossRef]
- Sun, L.Q. The study of farmland soil C:N:P stoichiometry characteristics in China. Master, China University of Geosciences, Beijing, 2018.
- Chen, Q.Q.; Shi, Z.; Chen, S.C.; Gou, Y.X.; Zhuo, Z.Q. Role of Environment Variables in Spatial Distribution of Soil C, N, P Ecological Stoichiometry in the Typical Black Soil Region of Northeast China. Sustainability 2022, 14, 2636–2648. [Google Scholar] [CrossRef]
- Sun, Y.; Wang, C.T.; Chen, H.Y.H.; Luo, X.S.; Qiu, N.W.; Ruan, H.H. Asymmetric responses of terrestrial C: N: P stoichiometry to precipitation change. Global Ecology and Biogeography 2021, 30, 1724–1735. [Google Scholar] [CrossRef]
- Redfield, A.C. The biological control of chemical factors in the environment. American scientist 1958, 46, 230A,205–221. [Google Scholar]
Figure 1.
The location map of samples.
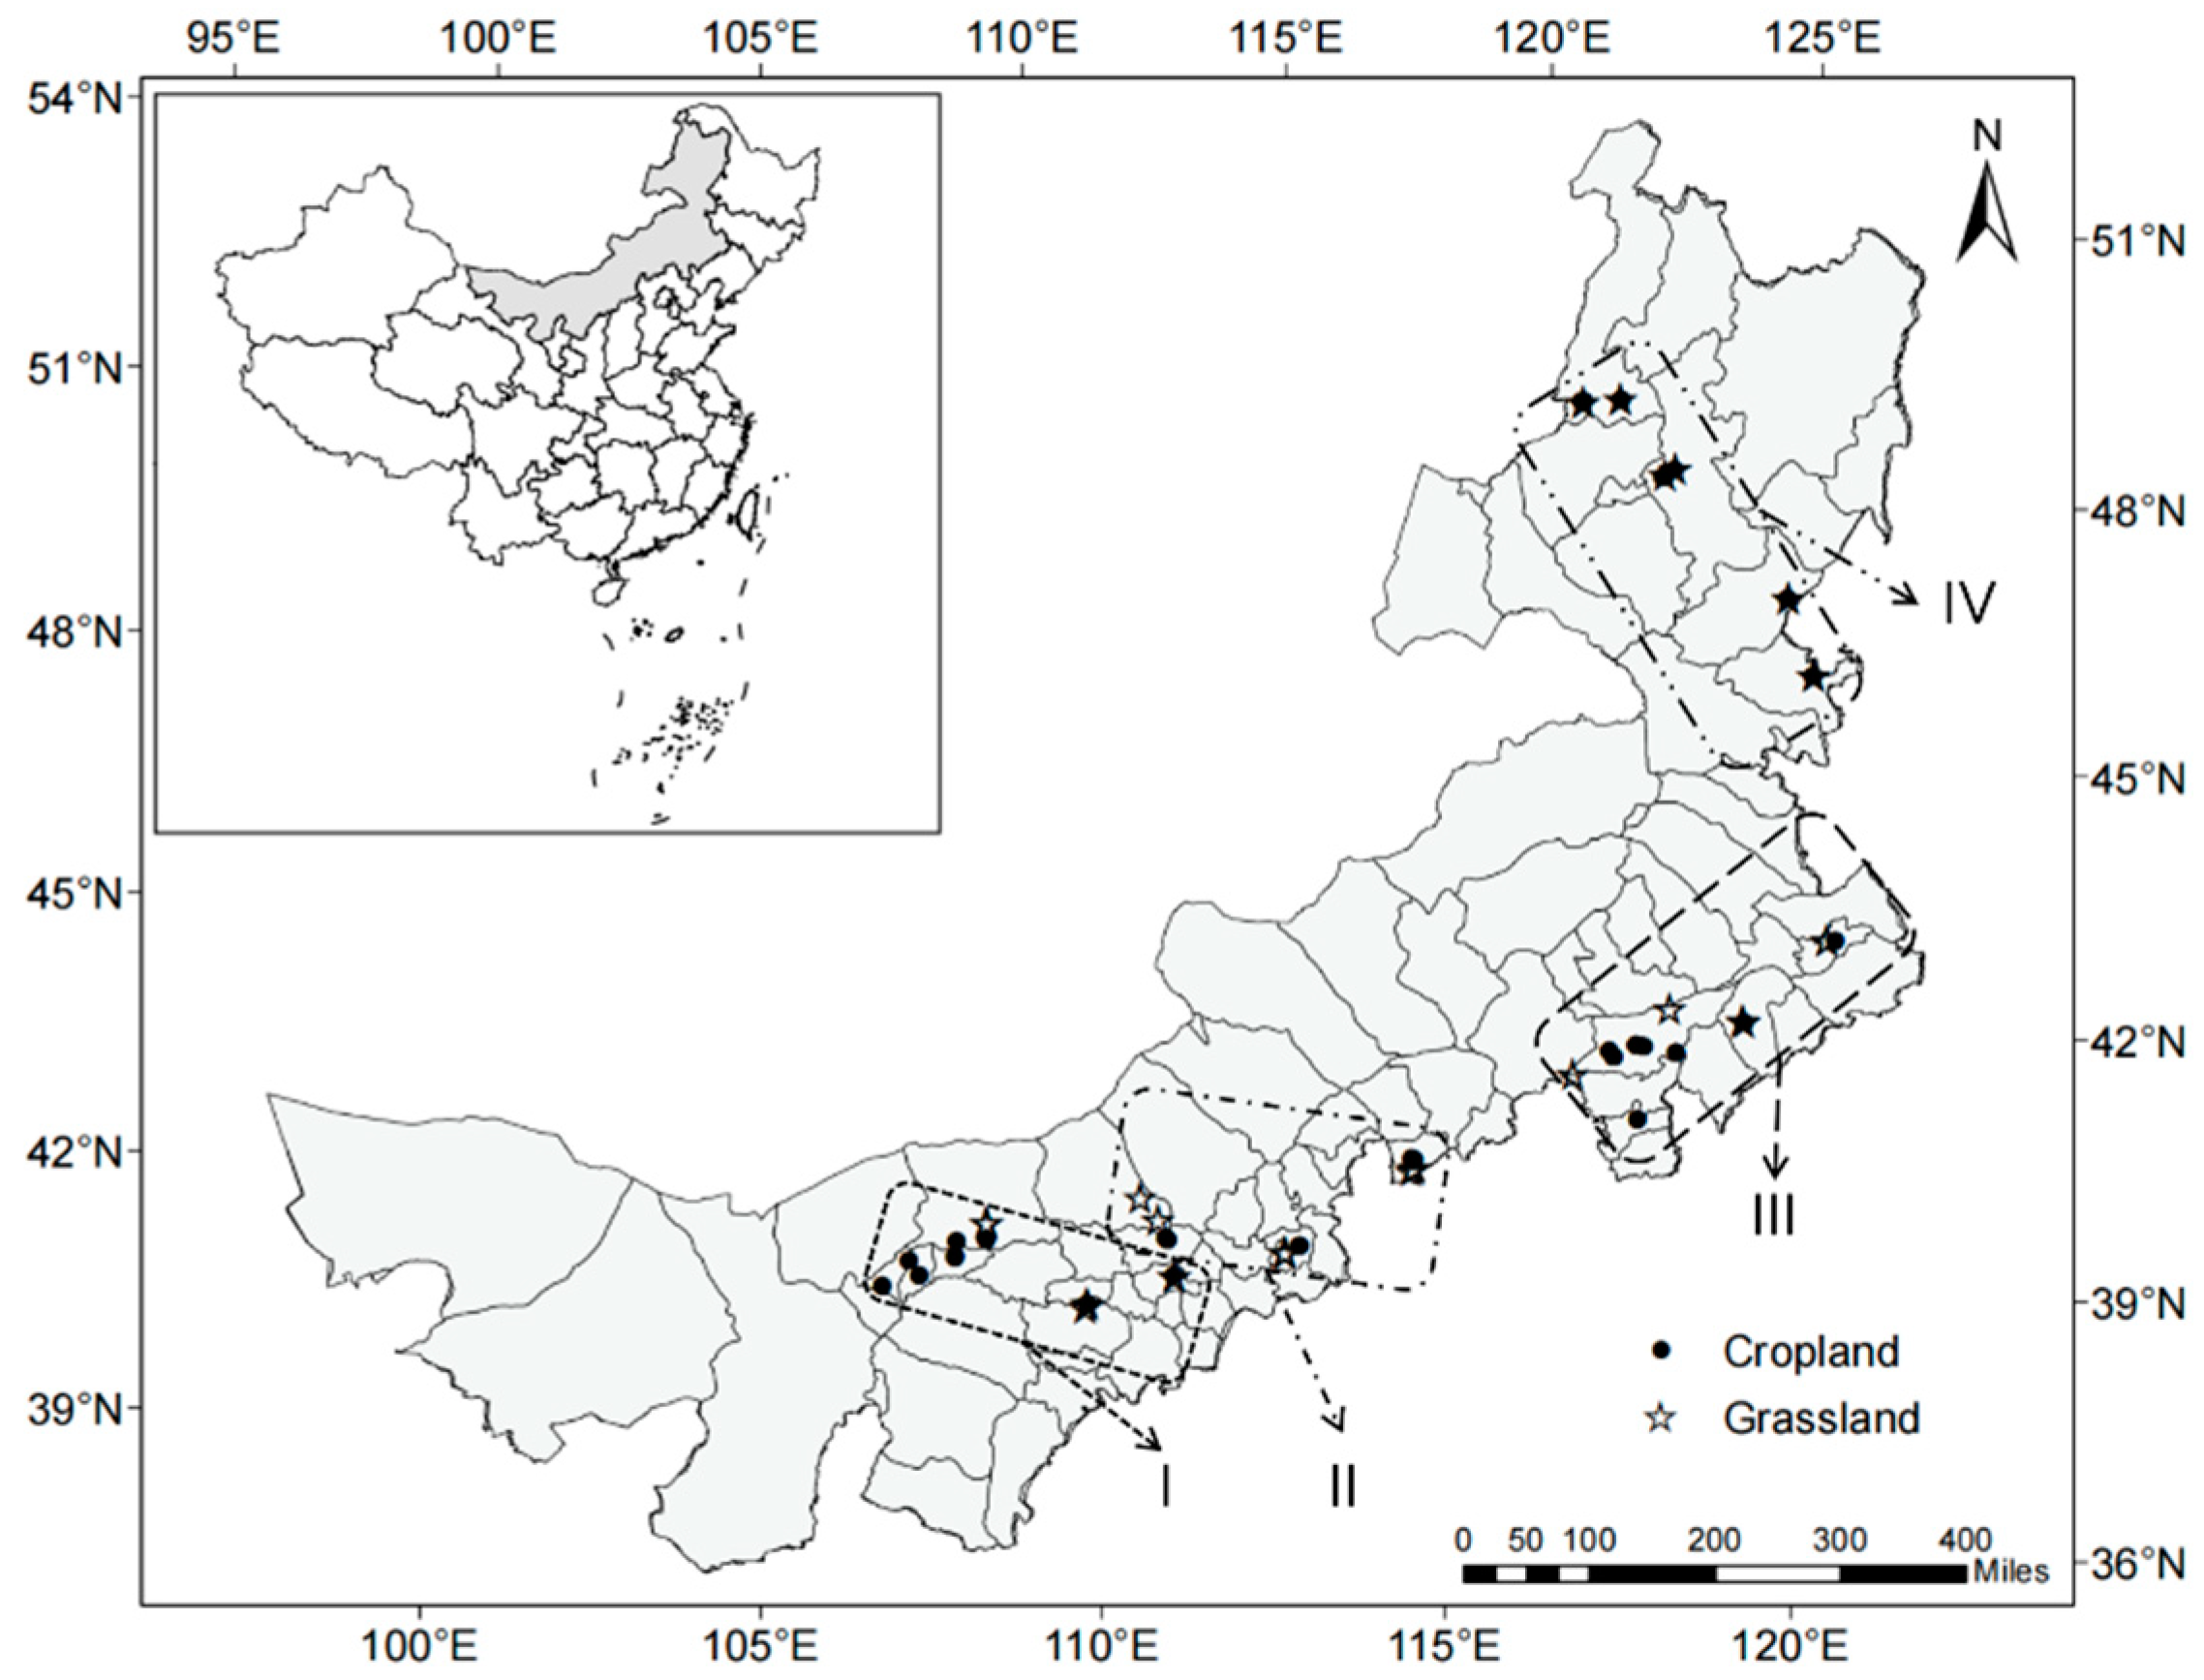
Figure 2.
Box plots of soil organic carbon (SOC), total nitrogen (TN), total phosphorus (TP) and total potassium (TK) contents in the 0-20 cm and 20-40 cm soil layers in four agro-pastoral areas.Thin lines represent comparisons between farmland in different regions, while thick lines indicate the comparisons between grasslands in different regions or between farmland and grassland in the same region. The difference between treatments was analyzed by Kruskal-Wallis test, * represents the significant at P < 0.05, and ** represents the significant at P < 0.01.
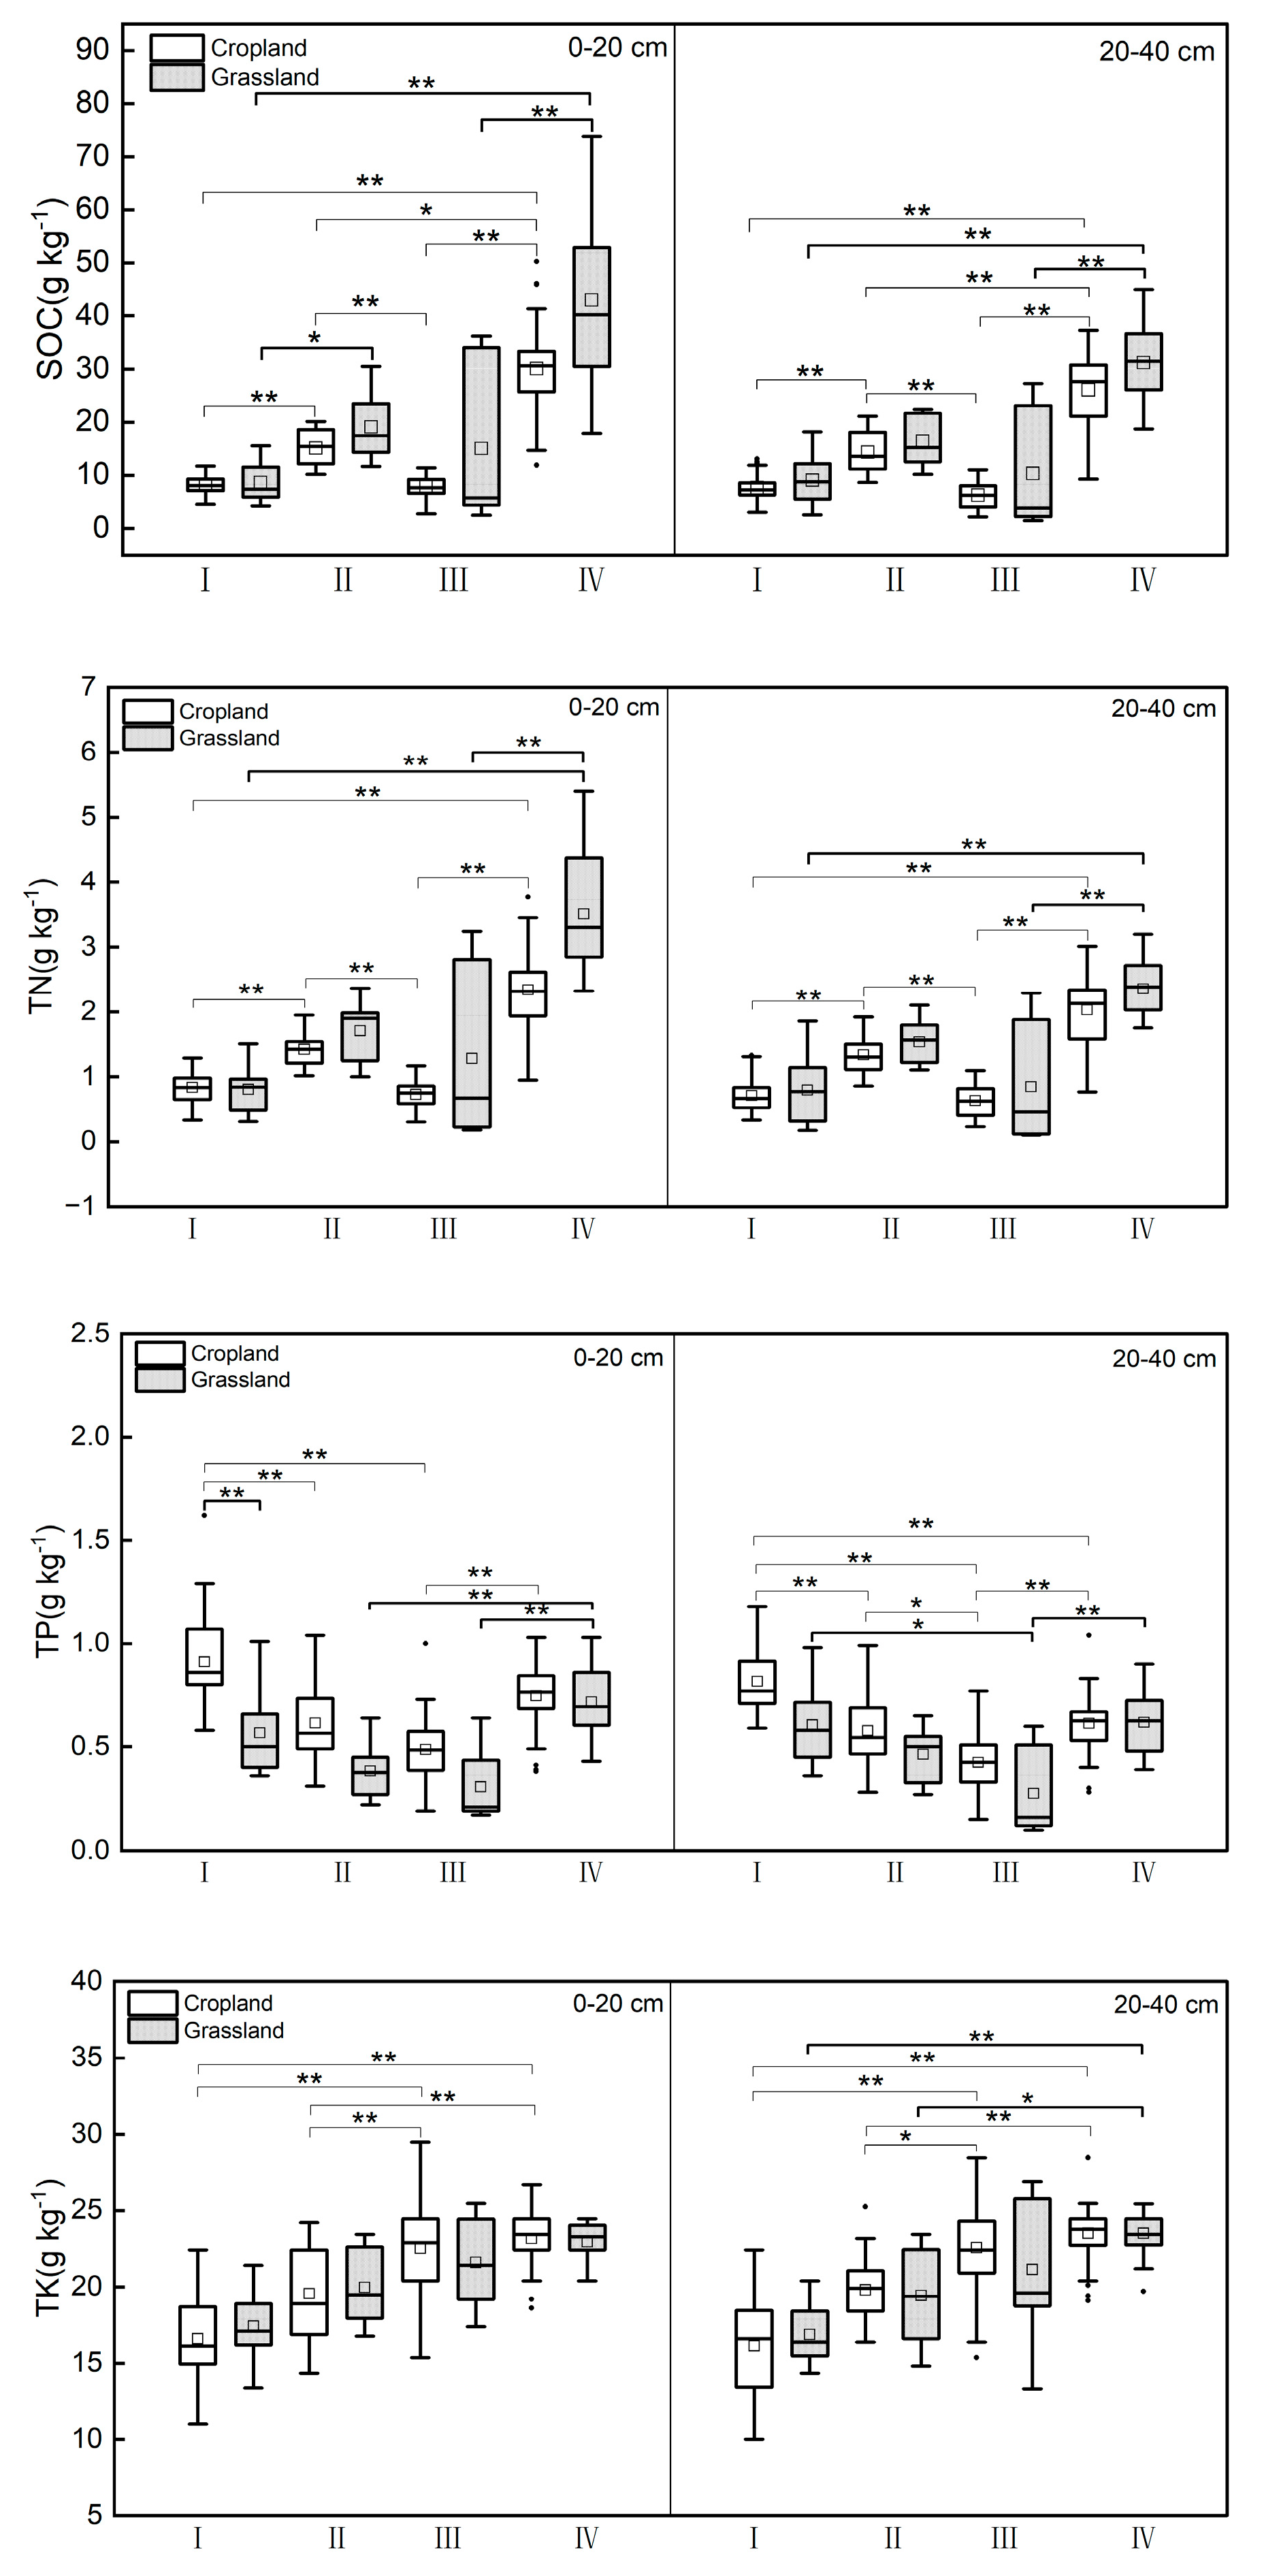
Figure 3.
Box map of eco-stoichiometric ratio of soil C, N, P and K in 0-20 cm and 20-40 cm soil layers in four agro-pastoral areas. Thin lines represent the comparison of farmland in different regions, and thick lines indicate the comparison between grassland in different areas or between farmland and grassland in the same area. The difference between treatments was analyzed by Kruskal-Wallis test, * represents the significant at P < 0.05, and ** represents the significant at P < 0.01.
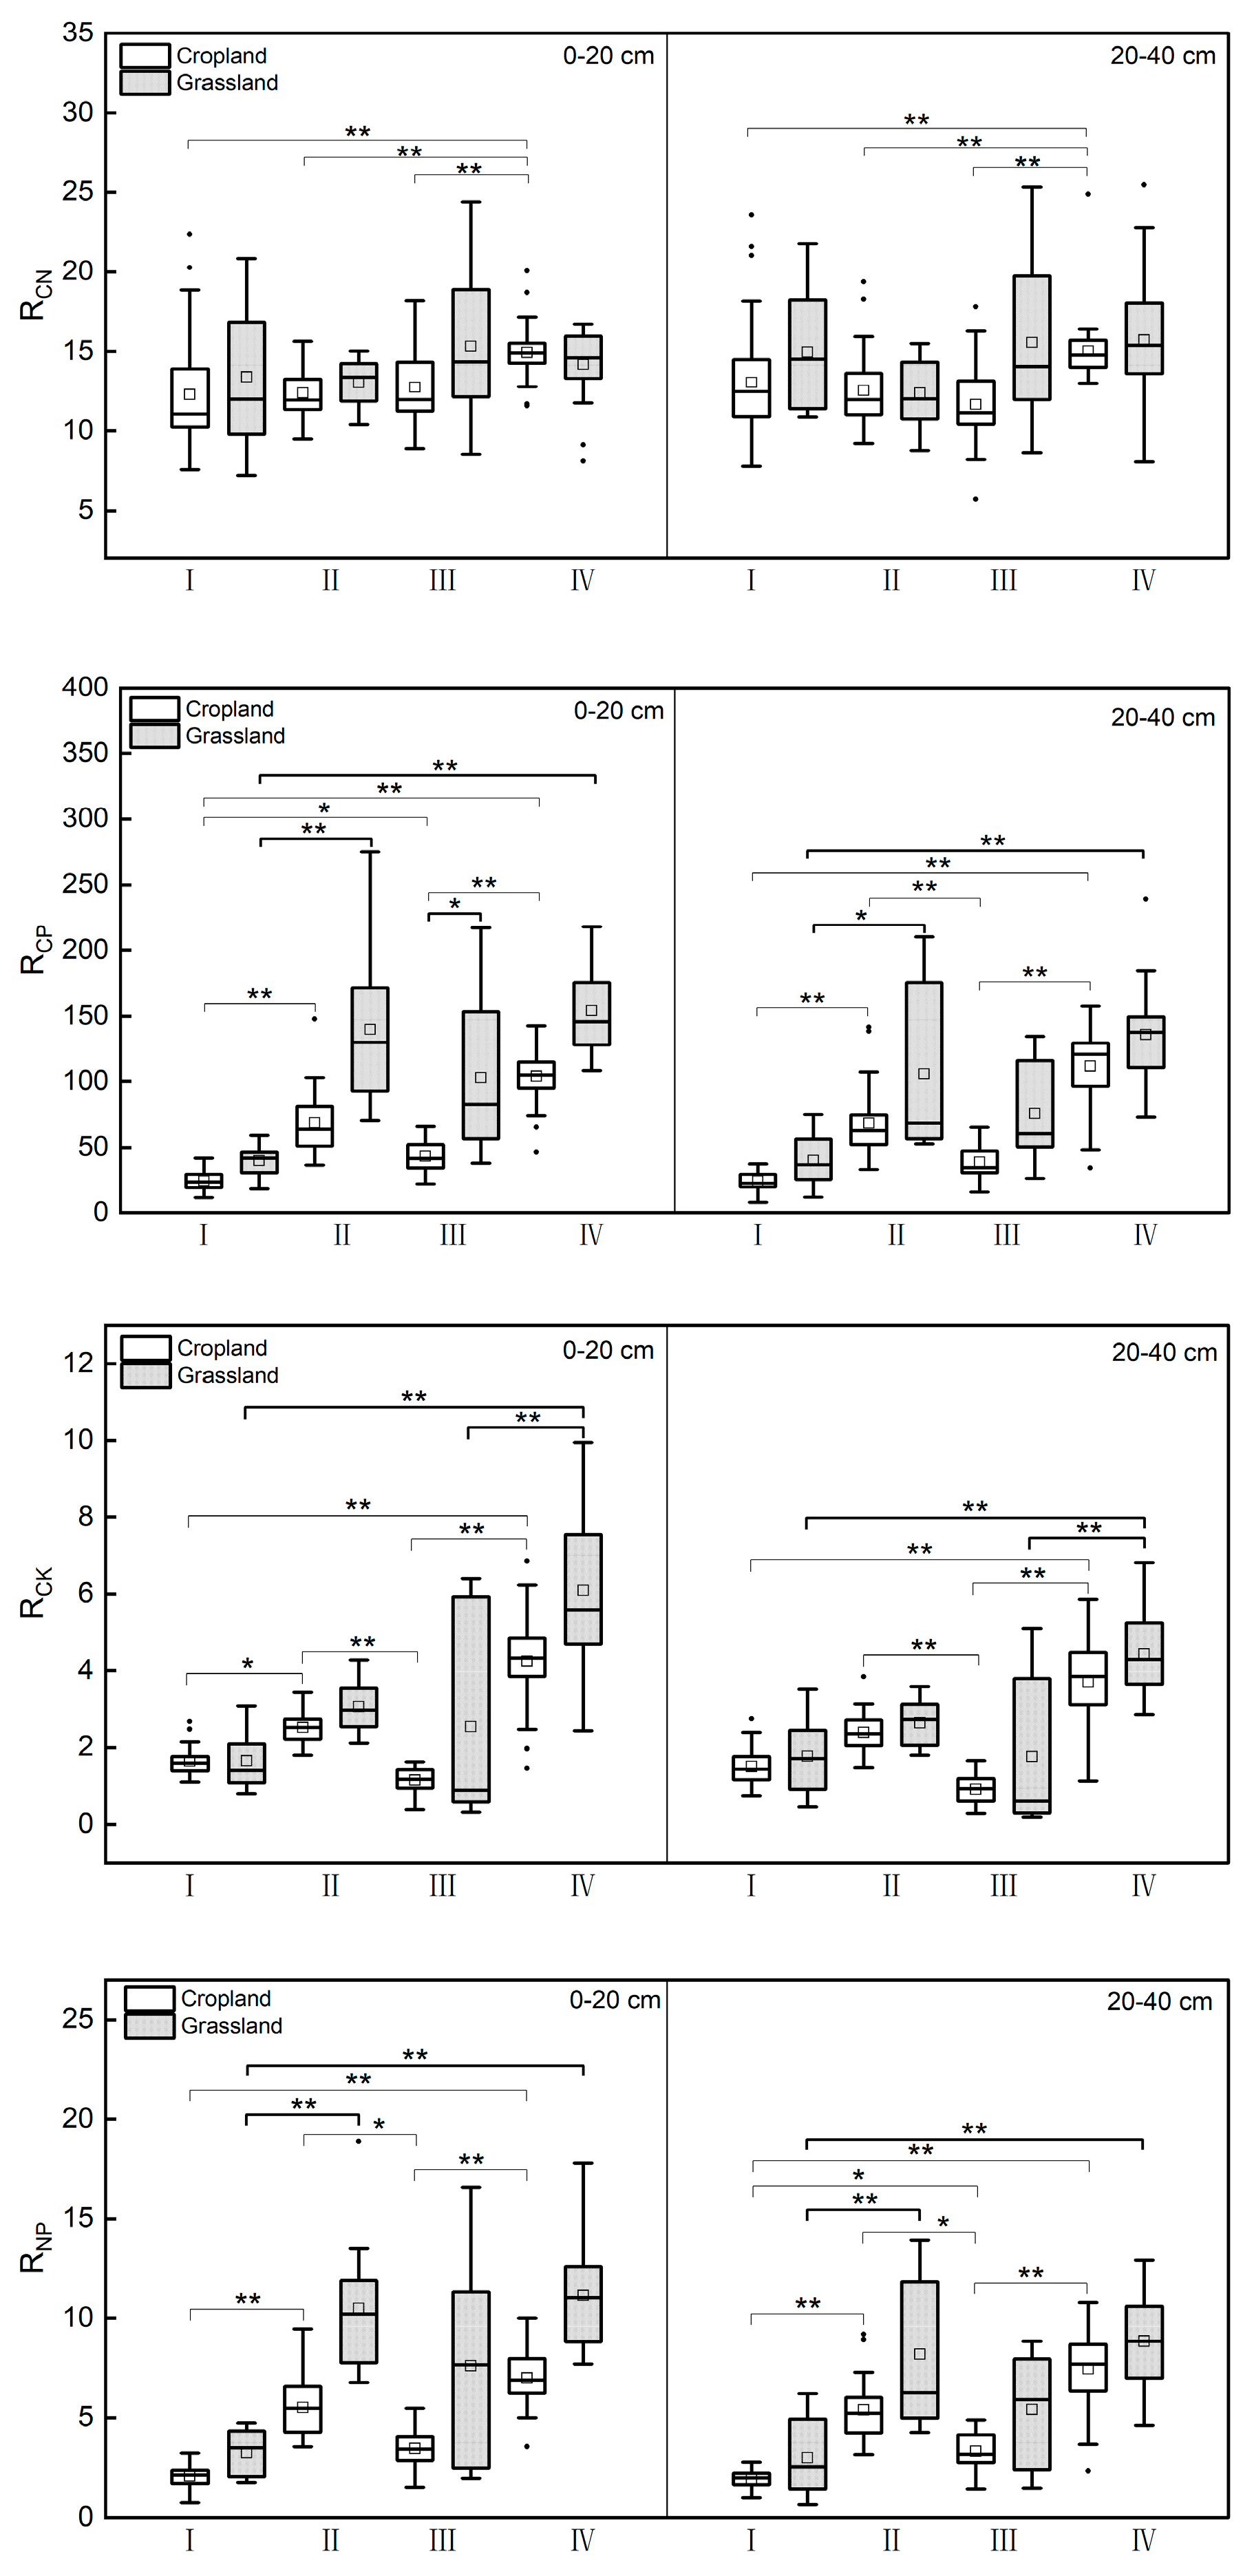
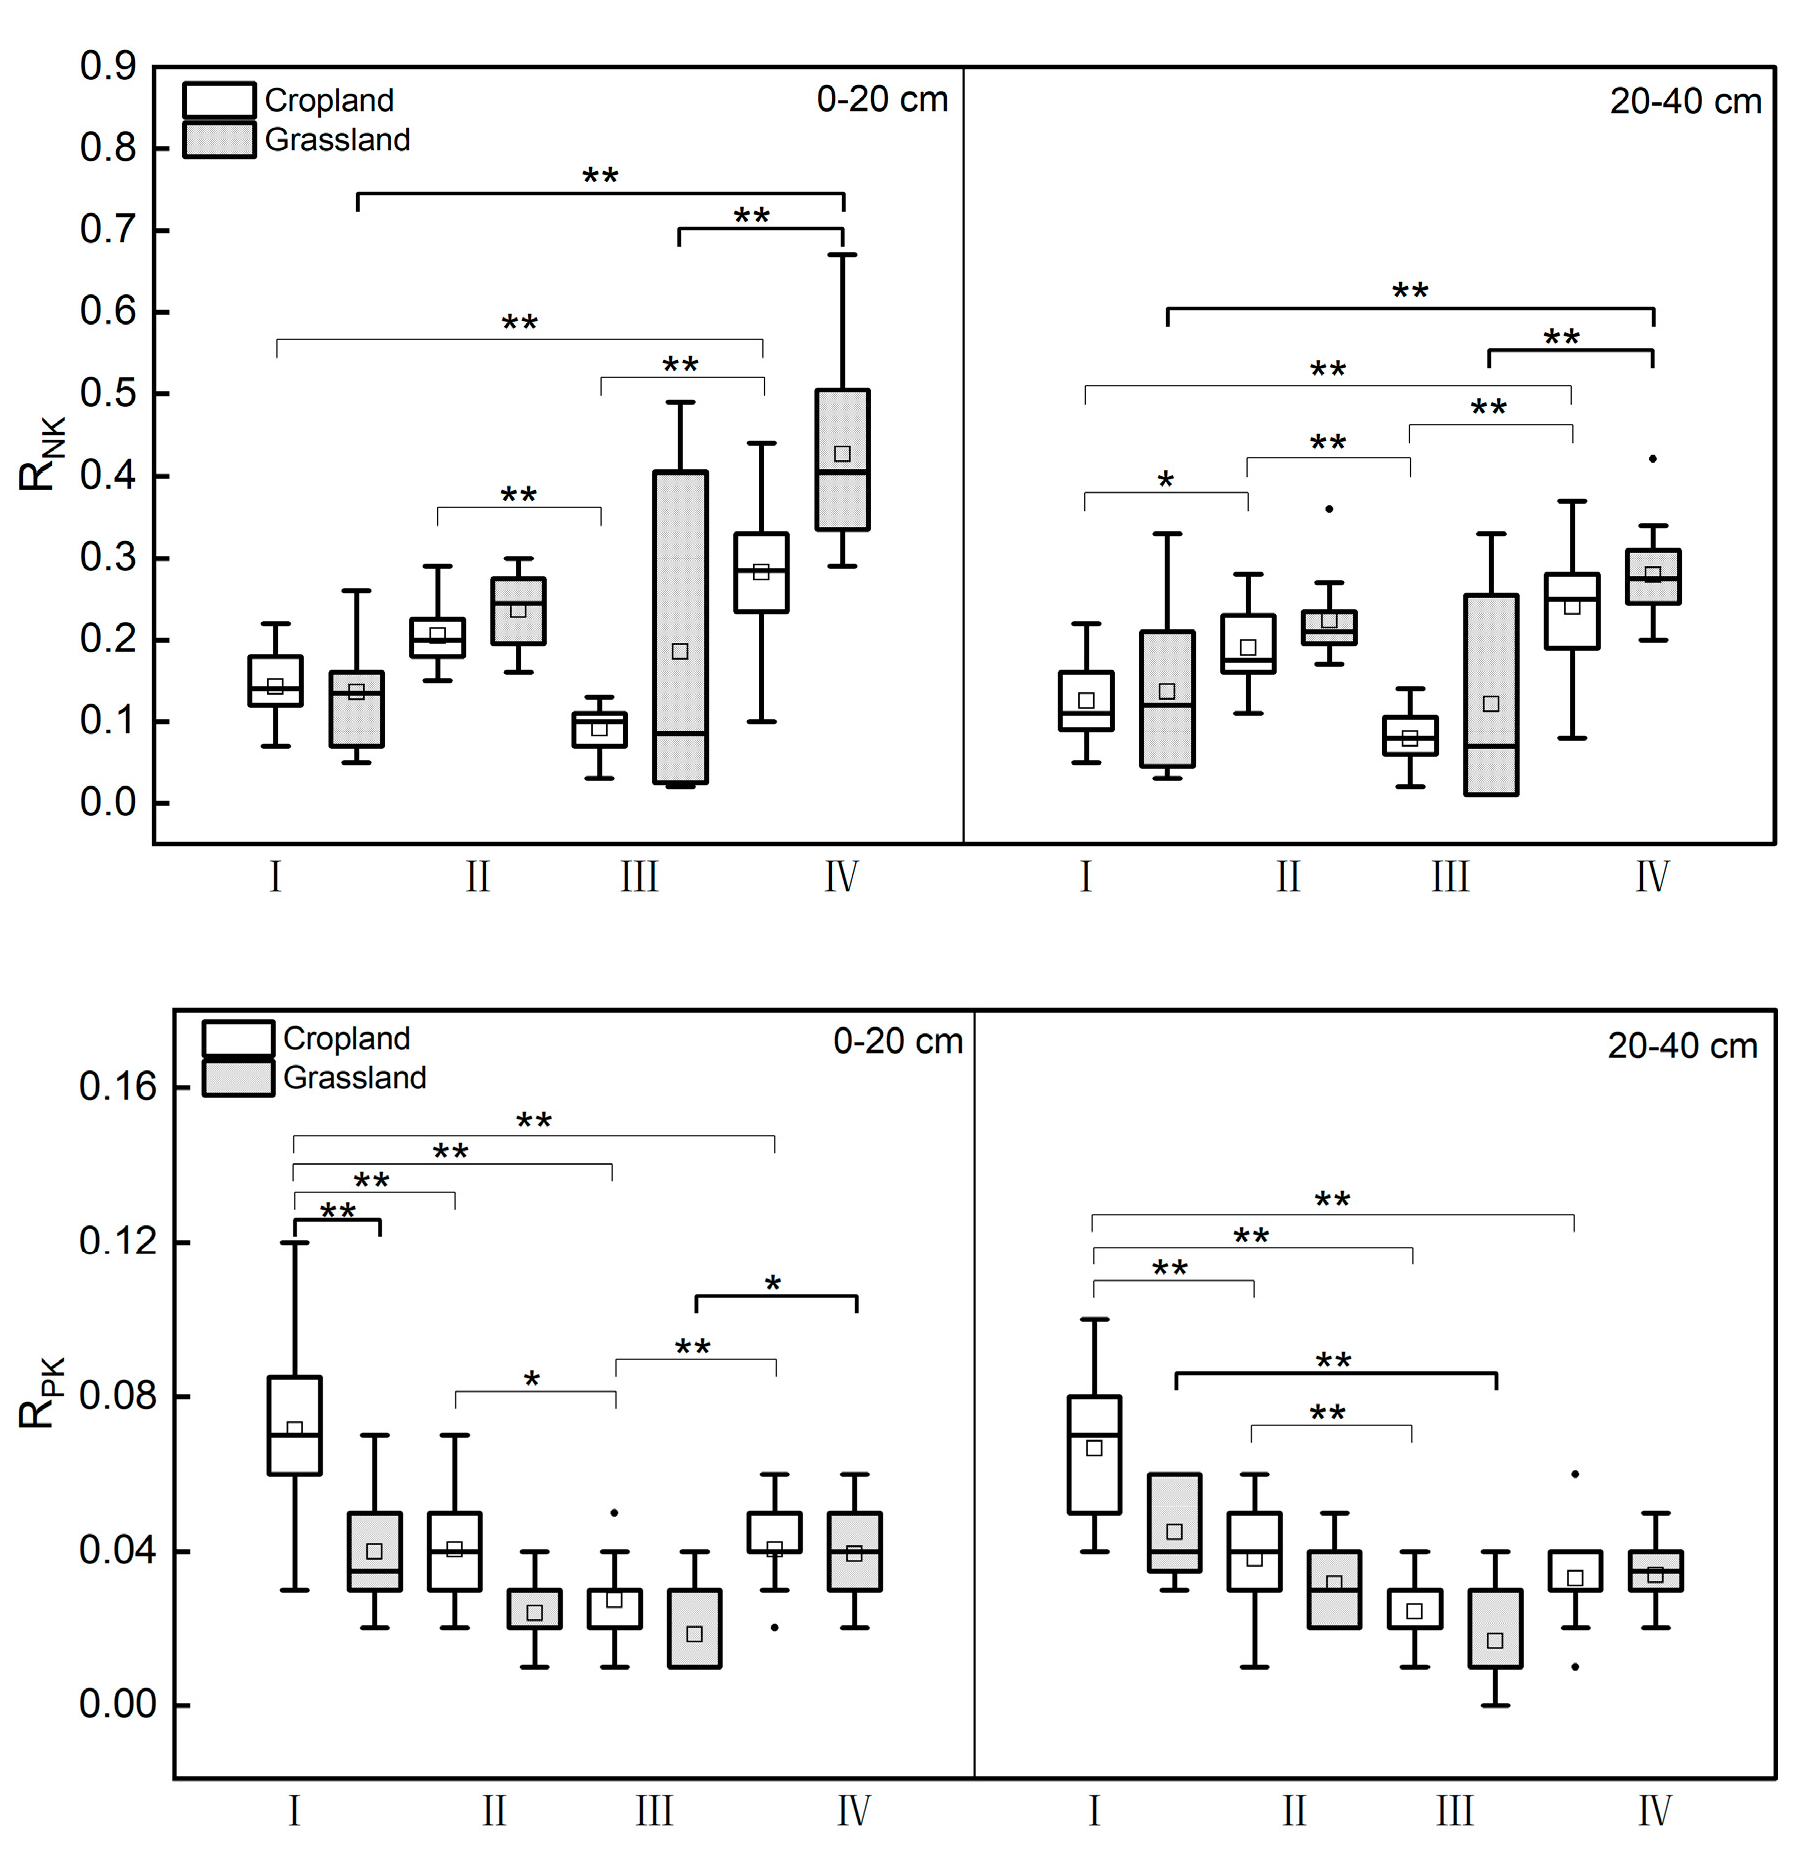
Figure 4.
The nutrients of each area are classified according to the grading system of the second nationwide condition census soil survey [30] (Table A1).
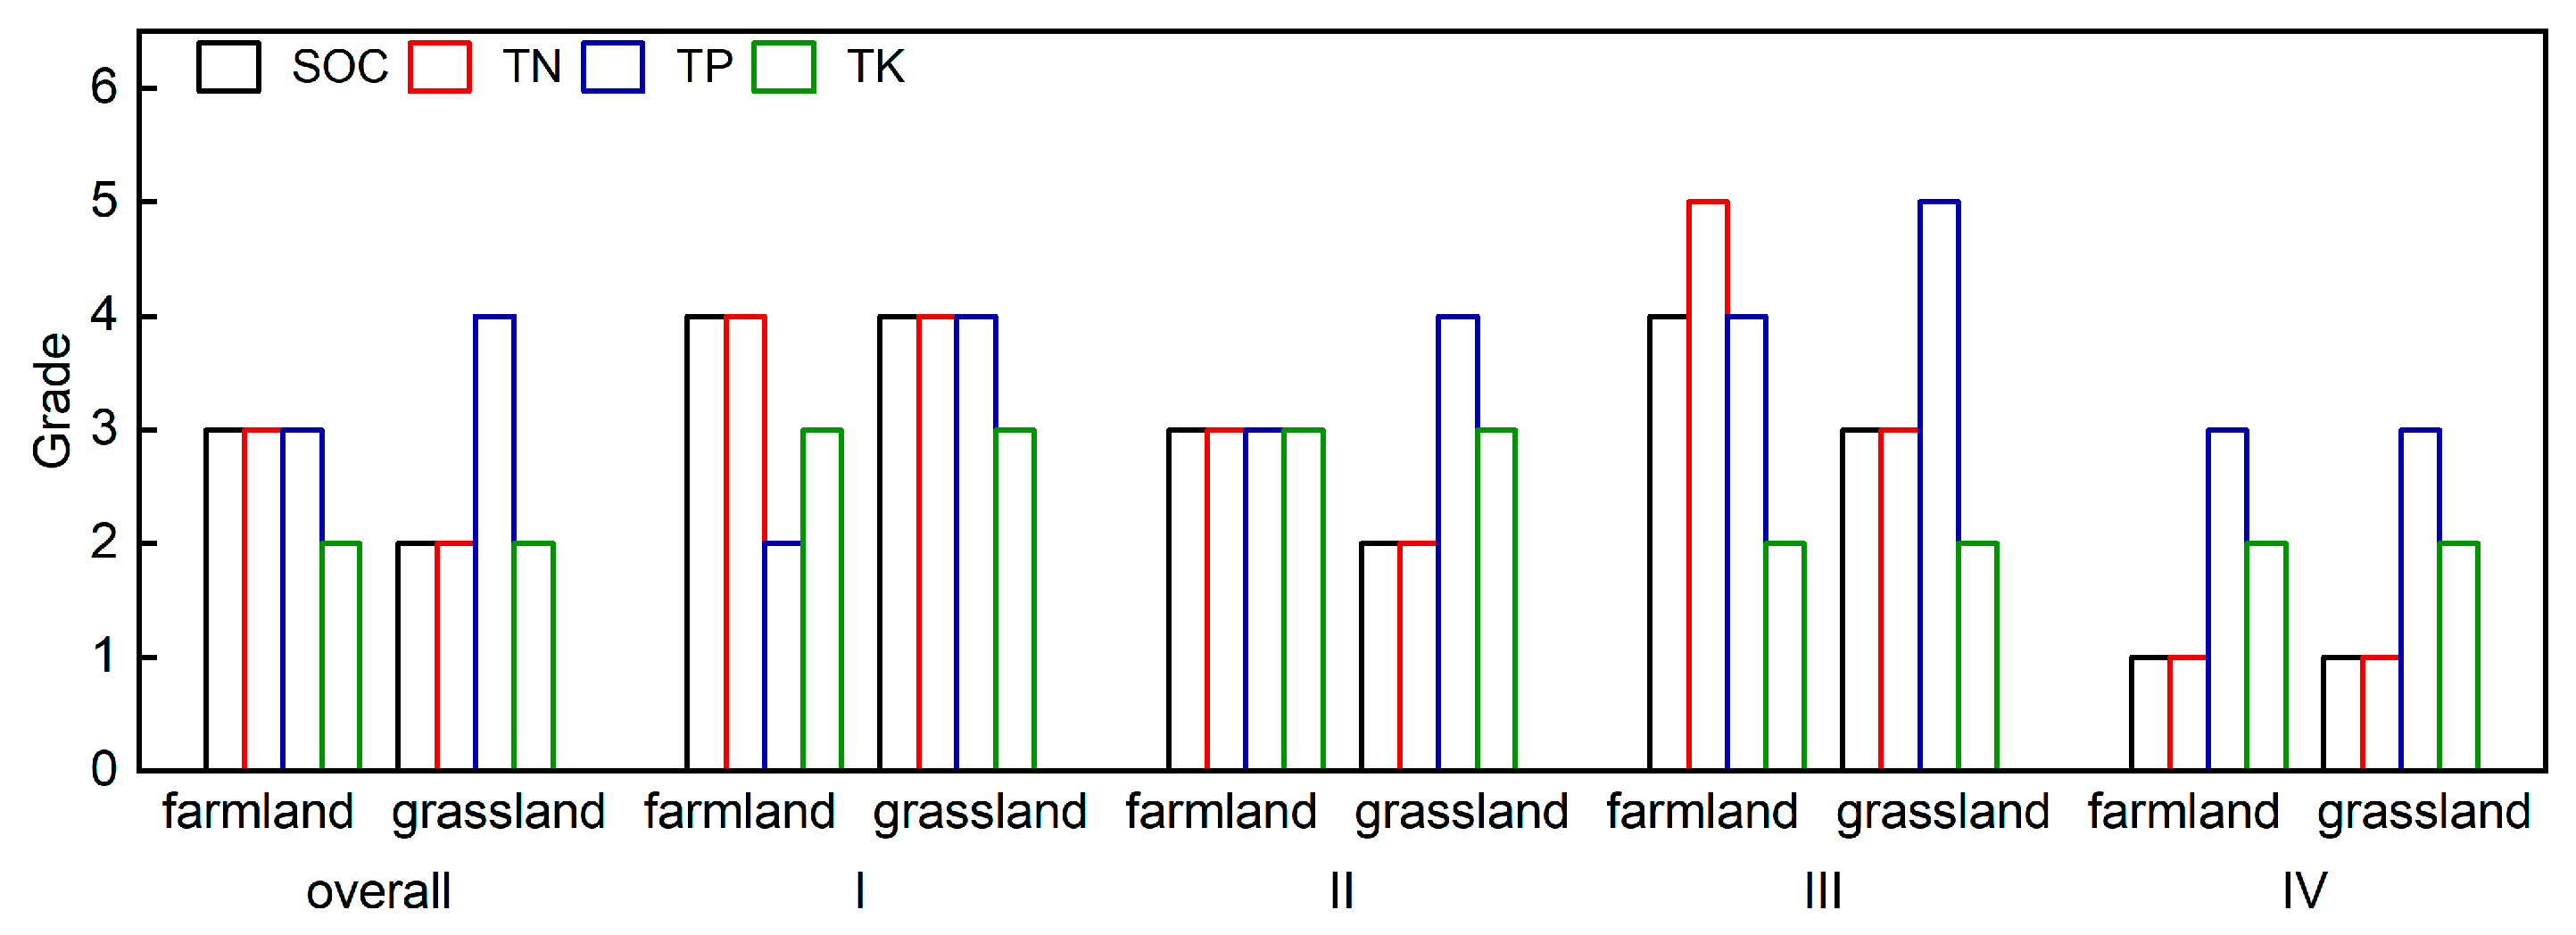
Figure 5.
Comparison of soil C:N:P in this research and other study regions. “f” and “g” means farmland and grassland soil, respectively. “G”, “N”, “W”, “Y”, “S”, “H”, “J”, “Q” and “O” refers to global level [31], northwest agro-pastoral ecotone [32], windy and sandy areas of northern China [19], agro-pastoral area at the northern foot of Yinshan Mountain [33], Horqin sandy land [18], Hebei province [34], yellow soil area of western Shanxi [35], eastern Qinghai Province [36] and overall scale of this study, respectively. “I”, “II”, “III”and “IV” means the four areas in this study.
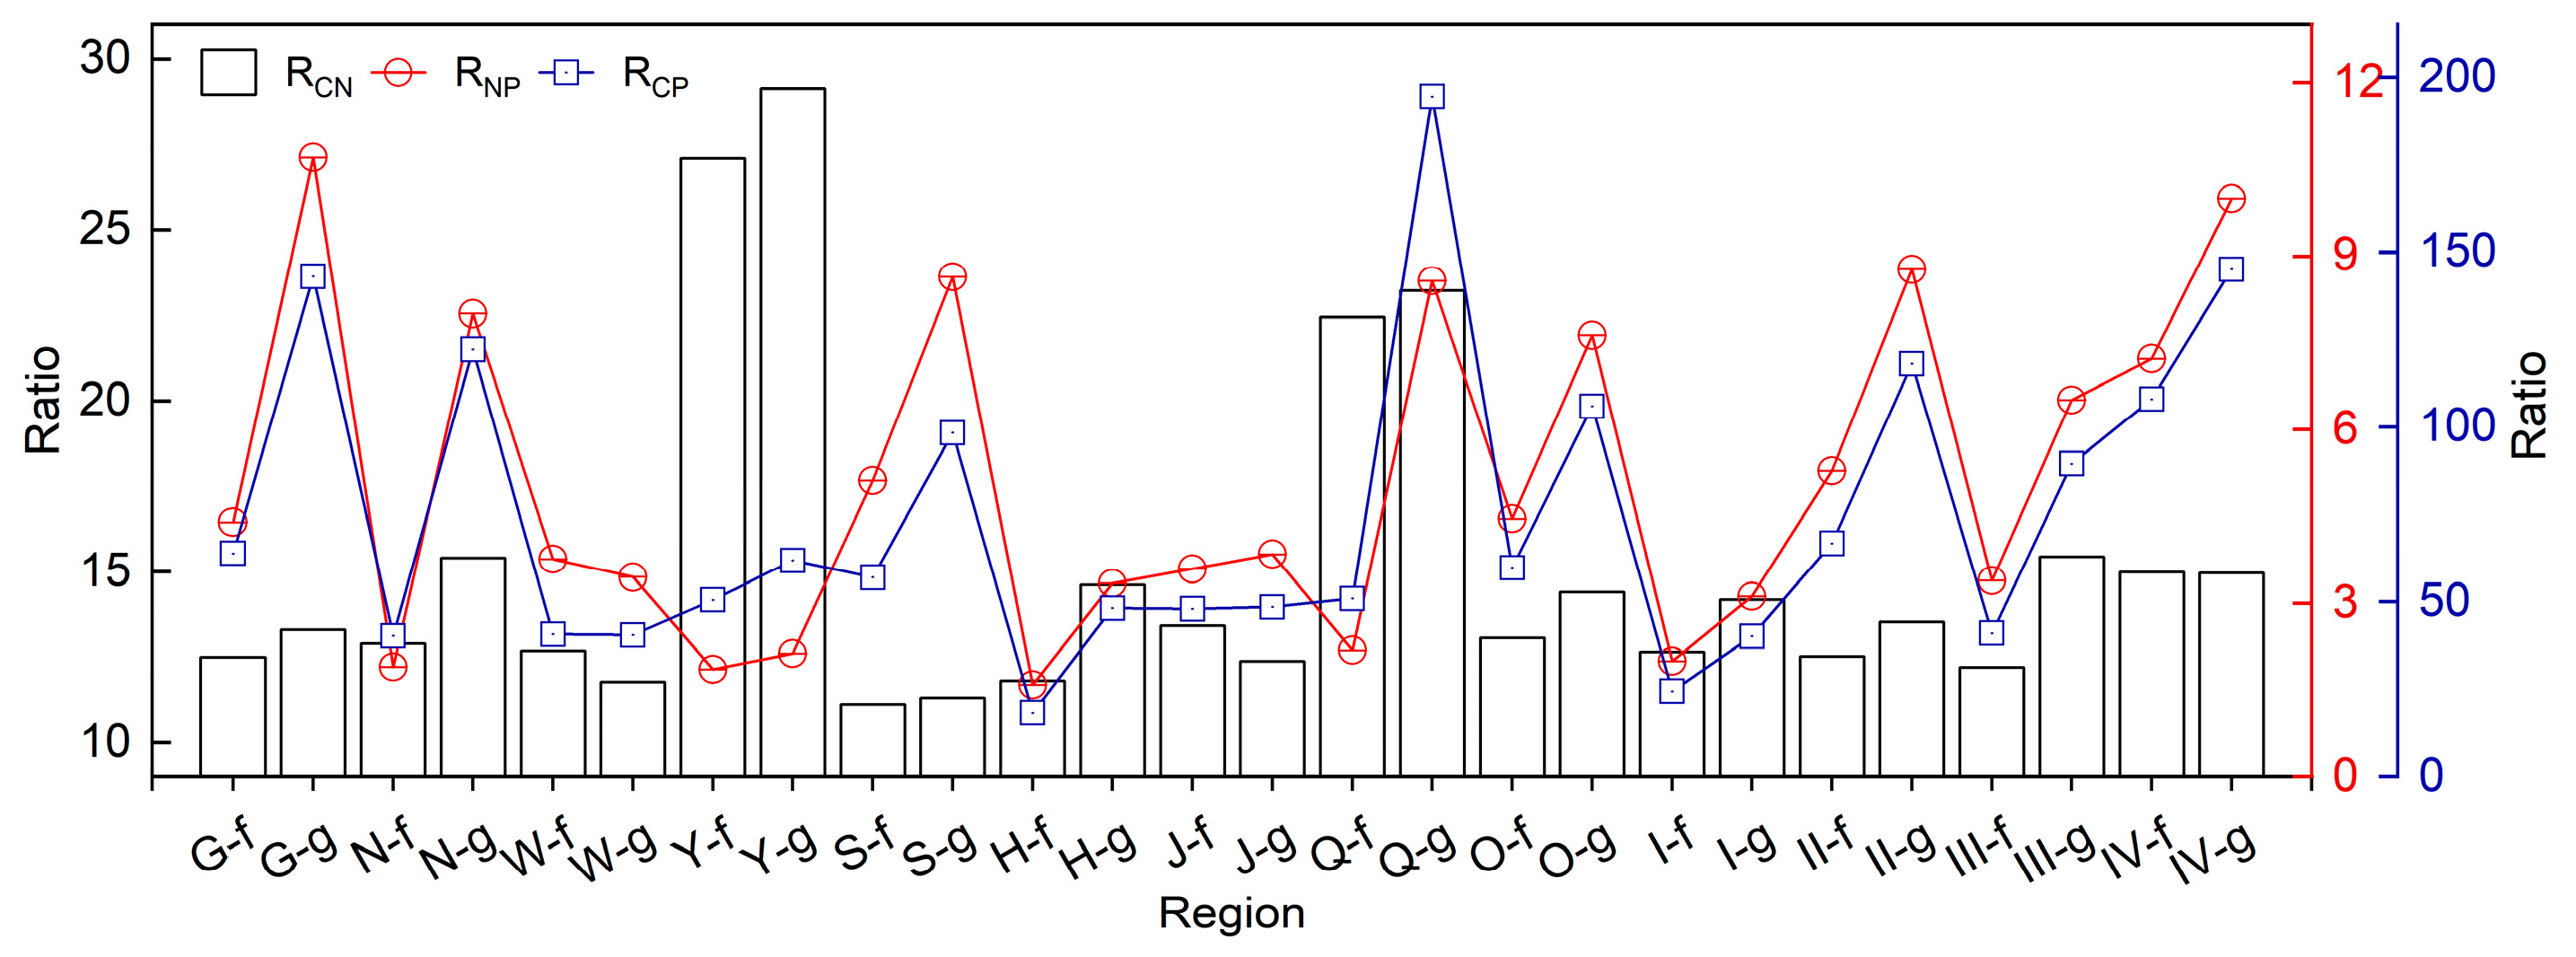
Figure 6.
Spearman correlation of soil stoichiometric with nutrient content and environmental factors of farmland and grassland in four agro-pastoral areas. The red oval indicates the positive correlation, the blue indicates the negative correlation, and the darker color means the greater correlation coefficient. *means significant correlation (P < 0.05), **means extremely significant correlation (P < 0.01).
Disclaimer/Publisher’s Note: The statements, opinions and data contained in all publications are solely those of the individual author(s) and contributor(s) and not of MDPI and/or the editor(s). MDPI and/or the editor(s) disclaim responsibility for any injury to people or property resulting from any ideas, methods, instructions or products referred to in the content. |
© 2023 by the authors. Licensee MDPI, Basel, Switzerland. This article is an open access article distributed under the terms and conditions of the Creative Commons Attribution (CC BY) license (http://creativecommons.org/licenses/by/4.0/).
Copyright: This open access article is published under a Creative Commons CC BY 4.0 license, which permit the free download, distribution, and reuse, provided that the author and preprint are cited in any reuse.


