

Submitted:
26 December 2023
Posted:
27 December 2023
You are already at the latest version
Abstract
The purpose of this study is to analyze the causes of cost variation in natural disaster prevention projects (NDPP) in Gyeongsangbuk-do and to develop effective cost and risk management strategies. The study collected data by conducting an online survey of 244 stakeholders. Binary logistic regression was used to analyze the impact of various variables on cost deviation, in-cluding project management risk (PMR), project costing and execution risk (PCER), project exe-cution strategy risk (PESR), construction project risk (CPR), project cost and schedule risk (PCSR), project management challenges (PMC), and construction project subcontractor and safety man-agement (CPSSM). The results showed that PMR (OR=3.744, 95% C.I. [1.657, 8.457]), PCER (OR=5.068, 95% C.I. [2.236, 11.484]), PESR (OR=3.447, 95% C.I. [1. 853, 6.413]), CPR (OR=2.292, 95% C.I. [1.020, 5.151]), PCSR (OR=4.817, 95% C.I. [2.250, 10.317]), PMC (OR=2.954, 95% C.I. [1.452, 6. 013]), and CPSSM (OR=2.419, 95% C.I. [1.297, 4.515]) had statistically significant effects on cost deviation. In particular, PMR, PCER, and PESR were identified as the main causes, and the effects of additional factors such as CPSSM were also important. The developed predictive model plays an important role in helping stakeholders of NDPP to manage risks in advance and take appro-priate preventive measures to ensure the success of the project. This study empirically supports the theoretical hypotheses of previous studies and provides a clear understanding of the causes of cost deviation in NDPP, which provides important insights for strategic decision-making and provides a new perspective on risk management.
Keywords:
Natural Disaster Prevention Projects
; Cost Deviation
; Binary Logistic Regression
; Risk Management Strategy
; Project Management Optimization
1. Introduction
1.1. Background and Purpose of the Study
Loss of life, economic loss, environmental destruction, and mental health problems caused by natural disasters are major challenges facing humanity [1]. In response, natural disaster prevention projects (NDPP) aim to protect lives, minimize economic losses, and protect the environment, but cost deviation due to lack of consistency in management and construction is a significant risk factor for project success [2].
The purpose of this study is to analyze in-depth the risks associated with cost deviation in NDPP and develop effective cost control strategies and risk management measures. In doing so, we hope to minimize disputes between owners and contractors and support the successful progress of the project.
Previous studies show that cost deviation in construction projects has not decreased over the past 70 years [3]. Ibrahim and Elshwadfy [4] determined that the experience and skill level of the cost estimator and the completeness of cost information are factors that affect cost deviation. Raghib et al. [5] revealed the impact of external economic factors such as inflation on cost deviation. This study focused on identifying the causes of cost deviations in the implementation process of NDPP and developing a risk management methodology to increase the predictability of cost deviations. In particular, an approach that combines project risk management methodology and binary logistic regression analysis was used to predict the probability of cost deviation.
The results of this study will contribute to reducing cost deviations and increasing the effectiveness of NDPP. It is also expected to recognize the importance of risk management and contribute to the establishment of related policies, providing essential knowledge for the successful management of NDPP.
1.2. Scope and Methodology
This study focuses on NDPP in Gyeongsangbuk-do. Gyeongsangbuk-do is carrying out various disaster prevention and maintenance projects with a budget of KRW 252 billion in 2023, and plans to allocate a total of KRW 4.686 trillion to river disaster prevention projects to prevent flood damage by 2025 [6].
In this study, we collect data by conducting a survey among stakeholders involved in disaster prevention projects in Gyeongsangbuk-do.
The progression of the study is summarized in Figure 1: The introduction highlights the importance of NDPP and the causes of cost deviations, and presents the research objectives and methods. Next, the theoretical background reviews previous studies and theories related to cost deviation in construction projects. Based on this, the research model and hypotheses are developed. In the empirical study, the collected survey data are analyzed to determine the key factors of cost deviation, and the binary logistic regression analysis is used to derive risk management optimization measures for NDPP. Finally, the conclusion summarizes the findings and discusses the implications and limitations of the study. This research methodology is not limited to NDPP in Gyeongsangbuk-do, but is expected to provide generalized results that can be applied to projects in other regions dealing with similar issues.
2. Literature Review
2.1. Construction Project Cost Deviation and Risk Management Theory
In construction projects, it has been widely recognized that cost deviations have a decisive impact on the success or failure of a project [7,8]. The deviation between the project budget and the final cost of the project results in financial risk and poses a significant challenge, especially for the client and the contractor [9].
According to Annamalaisami and Kuppuswamy [10], understanding project status, monitoring financial risks, and improving project performance are key factors in cost deviation risk management. Górecki and Diaz-Madronero [11] emphasize the development of a framework to determine and mitigate potential variances between planned budget and actual project costs, given the uncertainty and complexity of the built environment.
Previous studies have used different approaches to predict and control cost deviation in construction projects. Alsugair [9] and Gómez Cabrera [8] analyzed historical data and ongoing project information to predict cost deviation, while Górecki and Diaz-Madronero [11] proposed a four-step research methodology to address the complex challenges of sustainable construction projects. Przywara and Rak [12] analyzed time and cost variances using the earned value method (EVM), and Raut et al. [13] highlighted the limitations of existing monitoring practices and provided guidelines for cost risk management.
2.2. Research on cost deviation in construction projects
Cost deviation in construction projects is a key aspect of project management, and the literature has extensively explored its causes and effects.
Górecki and Diaz-Madronero [11] identify project characteristics, contractual procedures, and estimate performance as the main causes of cost variance and suggest that effective management of these factors can increase the efficiency of the cost estimation process. Flyvbjerg et al. [3] analyzed 258 highway projects and found that cost deviation has not decreased over the past 70 years, and the percentage of cost growth increases as project size increases. This trend was also observed in a study of Indian road and transportation infrastructure projects by Narayanan et al. [14], which found cost overruns ranging from 20% to 90%. In addition, Carr [15] reported an average cost overrun of 28% on New York State education construction projects.
External factors, such as price volatility of materials and labor, are the main causes of cost deviations [13,16]. Ibrahim and Elshwadfy [4] reported an average cost overrun of 10.30% in Egyptian construction projects, while Malaysian studies by Endut et al. [16] and Rahman and Memon [17] reported that only 46.8% and 37.2% of public and private projects, respectively, were completed within the contract amount, with an average cost deviation of 14% of the contract cost.
Alsugair [9] analyzed scope, organization, cost estimation, and quality and completeness of information as key factors in construction projects in Saudi Arabia. Similarly, Salim and Saeedi [19] examined various factors affecting cost deviation in projects in GCC countries, Asia, Africa, and Oman. Albtoush et al. [20] reported that completeness of information, estimator’s experience and methods affect the accuracy of cost estimates in projects in New Zealand, Nigeria, Malaysia, and Gaza Strip. Ibrahim and Elshwadfy [4] emphasized that clear drawings and specifications and estimator competence play a role in cost deviation in Egyptian projects. Cho and Kim [21] analyzed various risk factors affecting cost variance in river disaster prevention projects and reported that they include project management, technical, environmental, and external factors. These studies show that cost variation is influenced by project characteristics, contractor capabilities, quality and completeness of information, and external factors.
Previous studies have mainly focused on and analyzed various factors that influence cost variance and deviation, including the characteristics of the project, the organization and experience of the contractor, the quality and completeness of information, and external factors [8,9,11,12,21]. However, most of these studies are limited to specific regions or project types, which limits their generalizability.
This study aims to overcome the limitations of these previous studies, focusing specifically on cost deviation in NDPP, exploring the underlying issues of such deviation and innovative and practical management strategies. In doing so, this study aims to provide a differentiated approach from previous studies by proposing a cost deviation risk management plan that considers the specificities of NDPP.
3. Research Methodology
3.1. Deriving Cost Variation Influencing Factors
Table 1 provides a comprehensive review of the major studies conducted in different countries to further analyze the various factors affecting cost deviation in construction projects. In the Middle East, Abdel-Monem et al. [18] identified project complexity, site constraints, design changes, unavailability of skilled labor, inflation, and market fluctuations as the main factors. In Saudi Arabia, Alsugair [9] studied the quality of scope, contractor organization, estimator’s competence, quality of information, project characteristics, external factors, and contract procedures. In Egypt, Ibrahim and Elshwadfy [4] highlighted consultants, design parameters, information and estimators, and client characteristics as important factors.
Albtoush et al. [20] and Cong et al. [22] in New Zealand examined project and client characteristics, contractor characteristics, design, consultant, and tender conditions. In Malaysia, Azman and Adeleke [23] Endut et al. [16] and Memon et al. [24] focused on the quality of scope, quality of information, and level of uncertainty. In Colombia, Gómez Cabrera [8] analyzed the competitive bidding process as a key factor, while Przywara and Rak [12] in Poland studied time variances related to schedule and cost.
These extensive studies show that cost deviation in construction projects is a complex phenomenon that is influenced by a variety of internal and external factors. In particular, project scope, complexity, client and contractor characteristics, design and consultant roles, market conditions, and economic factors have been shown to have a significant impact on cost deviation. Based on the results of these previous studies, this study aims to develop a cost deviation management strategy specialized for NDPP. This study aims to provide a new perspective to reduce cost deviation in construction projects and support the successful execution of projects
Figure 2 illustrates a systematic approach to identifying key variables that influence construction project cost deviation using the Delphi technique.
The process begins with the collection of 355 survey questions that have been used in previous studies to measure factors affecting construction project cost variation. This is followed by a screening process to extract 127 questionnaires to remove duplicates and refine the data. Table 2 shows that an expert panel was assembled to apply the Delphi technique to review these items and distill them down to 48 key cost deviation factors. In the next step, these factors are reconstructed into seven independent variables through an in-depth exploratory factor analysis (EFA). To finalize this systematic process, a Delphi meeting is held once again to assign definitive names to these independent variables, thus establishing a conceptual framework for a cost deviation model specific to natural disaster prevention.
Table 3 summarizes the questions related to the operationalization of the variables based on the results of the EFA, detailing the different risk management areas of river disaster prevention projects:
PMR reflects the complex impact of these issues on the financial health of the project, including budget deviations, contract terms, environmental impacts, risk management, regulatory compliance, bidding processes, price changes, and stakeholder reactions.
PCER includes the manager’s calculation of labor costs, reliability of cost information, comparison of costs under alternative methods, time allowed for preparation of cost calculations, accuracy of appropriate costing methods, regulatory changes due to legislative/agency changes, and delays in contract execution.
PESR addresses issues related to the duration of the project, including securing financing and budget, experience and performance of the management team, profit and loss information from similar projects, relationships with subcontractors and suppliers, feasibility of design and execution, client’s financial condition and budget, clear and specific specifications and drawings, budget allocation and cost control based on project priorities.
CPR covers issues such as possible complaints from residents, construction stoppages during winter, additional costs due to maintenance considerations, delayed compensation, and imbalances between material supply and demand.
PCSR includes reduced productivity and additional costs due to weather conditions, increased budget due to low bids during the project, lack of technical skills of managers, additional costs due to short construction time, and cost reductions or changes due to budget shortfalls.
PMC include mismatches between design conditions and site conditions, cost increases and schedule delays due to additional work, risk of delayed project start and completion dates, conflicts between consortium members, risk of regulatory changes related to acquisitions, and lack of project risk management experts.
CPSSM emphasizes the importance of managing the risks and safety associated with a project’s subcontractors, including issues such as lack of subcontractor technical capabilities, pressure to meet target execution rates, possible subcontractor bankruptcy, and pressure for zero accidents on site.
3.2. Research models and hypotheses
Based on an in-depth literature review and theoretical foundation, this study empirically analyzes how independent variables such as PMR, PCER, PESR, PCSR, CPR, PMC, and CPSSM affect the cost deviation of river disaster prevention projects. According to Flyvbjerg et al. [3], cost variance in construction projects has been consistently affected by various factors such as time, cost, and organizational changes. Alsugair [9] pointed out that project characteristics, contracting procedures, and estimator’s competence have a significant impact on cost deviation. In this study, we will establish and test the hypotheses shown in Figure 3:
- H1
- PMR level has a significant effect on cost deviation in NDPP.
- H2
- PCER level has a significant effect on cost deviation in NDPP.
- H3
- PESR level has a significant effect on cost deviation in NDPP.
- H4
- CPR level has a significant effect on cost deviation in NDPP.
- H5
- PCSR level has a significant effect on cost deviation in NDPP.
- H6
- PMC level has a significant effect on cost deviation in NDPP.
- H7
- CPSSM level has a significant impact on cost deviation in NDPP.
These hypotheses, which were verified through rigorous data analysis, are expected to provide important insights for strategic decisions to minimize cost deviations in NDPP and ensure successful project implementation.
3.3. Research analysis procedures
The analysis procedure of this study aims to identify and evaluate the factors affecting the cost deviation of NDPP, as summarized in Figure 4.
In the first step, we extensively collected various factors that can affect project cost deviation and obtained a total of 355 items. A questionnaire was then designed and administered to refine the data to 48 items.
In the second phase of data analysis, we utilized Mahalanobis distance to identify outliers, coding and missing data processing for a total of 224 valid data.
In the third step, we conducted a demographic analysis of the collected data using IBM SPSS Statistics 25 software. This process was used to determine the basic statistics of the research data and to explore the basic relationships between the various variables.
In the fourth step, empirical analysis, the same software was used to analyze the reliability of the data by calculating the Cronbach’s alpha value, which is considered reliable only if it is above 0.6. EFA was used to identify structural relationships between the variables, and commonality values were set to 0.6 or higher to assess the fit of the variables. Correlation analysis was conducted to assess the strength and direction of the correlation between the variables by testing for significance using a two-tailed test at the 0.01 level.
Finally, in the regression analysis step, a binary logistic regression was performed to analyze the impact of the independent variables on the dependent variable of cost deviation. The results were considered significant only if the p-value was less than 0.05 to determine the factors affecting cost deviation.
Through this systematic procedure, this study aims to provide an in-depth understanding of the main factors that cause cost deviation in NDPP and suggest management measures accordingly.
This study conducted an online survey of stakeholders involved in NDPP in Gyeongsangbuk-do from July 1 to 20, 2023. A total of 244 participants were surveyed, and their responses were measured using a 7-point Likert scale to determine the impact of each independent variable. The dependent variable, “cost deviation,” was measured using a binary categorization based on whether or not it occurred, coded 0 for “no cost deviation” and 1 for “cost deviation”.
The details of the metrics can be found in Table 2 of the research paper.
To ensure the reliability of the data, the Mahalanobis distance was calculated during the analysis to detect outliers. Based on the chi-square distribution at the 99% confidence level, we removed 20 data that were deemed to be insincere responses. As a result, 224 valid responses were used in the analysis.
The demographic characteristics of the respondents are summarized in Table 4, with 96.43% of the total 224 respondents being male and 3.57% female. By work position, 78.57% of the respondents were construction managers, followed by 17.86% of construction project managers and 3.57% of owners. In terms of work experience, 65.18% had less than 10 years of experience, 29.46% had between 11 and 20 years, and 5.36% had more than 21 years. These sample characteristics may affect the generalizability of the findings and should be interpreted with caution.
4. Empirical Analysis
4.1. Reliability and validity analysis
Following the methodology presented in Figure 4, this study conducted a series of analytical procedures with the aim of exploring the underlying structure of the variables. To ensure a systematic approach to the study, the empirical analysis was conducted using data from a total of 224 respondents. As a basis for this, the results of the analysis are summarized in Table 5. Descriptive statistics were calculated for the survey items (Q1~Q48) and reliability statistics were calculated to assess the reliability of each item.
Reliability statistics were measured using Cronbach’s alpha coefficient, and if the value was greater than 0.6, the item or scale was considered to have a consistent response tendency. The results of the reliability analysis in this study showed high consistency, especially the Cronbach’s alpha value of 0.979, which is very high, indicating high reliability of the responses. In addition, a correlation matrix analysis was conducted to examine the correlation between the variables, and all variables were found to be suitable for factor analysis by recording a correlation coefficient of 0.3 or higher. These analyses contribute to understanding how the variables can be explained by related factors and provide results that further strengthen the validity of this study.
4.2. Exploratory factor and correlation analysis
The results of the KMO and Bartlett’s test in this study strongly support the appropriateness of factor analysis. The KMO measure was 0.838, suggesting that the sample was suitable for factor analysis, and the Bartlett’s test of sphericity was highly significant with a p-value of less than 0.001. This means that the selected variables are correlated with each other and can be explained by common factors.
The communality analysis showed that all variables had eigenvalues above 0.6, indicating that they share a significant amount of common variance. This indicates that the variables have a strong relationship with the potential factors.
The results of the EFA are summarized in Table 6, and Figure 5 shows that the principal component analysis method was applied to derive a total of seven factors with an Eigenvalue of 1 or higher. These factors accounted for approximately 81.655% of the total variance explained, indicating that they consisted of major factors that faithfully reflected the complexity of the research object. The extracted factors were subjected to a varimax orthogonal rotation to optimize the loading values of the variables, and variables with a loading value of ±0.5 or more were assigned to each factor.
Finally, we analyzed the correlations between the factors and measured their reliability. As shown in Table 7, the correlation analysis shows that the correlation between all factors is statistically significant, and the reliability analysis, measured by Cronbach’s alpha value above 0.8, shows that the internal consistency of these factors is high. These results provide justification for the interpretation of each factor and contribute to increasing the depth and accuracy of the study. These analytical procedures provide an important basis for the empirical chapter of the thesis and strengthen the validity of the overall findings.
4.3. Binary logistic regression analysis
The binary logistic regression analysis was used to analyze the various factors affecting the cost deviation in NDPP, and the model fit was statistically significant.
The results of the analysis are summarized in Table 8, and the Chi-square value of Omnibus Tests of Model Coefficients is 243.734 and the p-value is 0.000, indicating that the selected independent variables have a significant effect on cost deviation.
The Cox & Snell R Square value of 0.663 and Nagelkerke R Square value of 0.884, which indicates the explanatory power of the model, show high explanatory power.
The Chi-square value of the Hosmer and Lemeshow Test is 3.559 and the p-value is 0.895, indicating a good fit of the model, and the overall prediction accuracy of the model is 94.2%. Of the independent variables analyzed, seven variables have a statistically significant impact on cost deviation: PMR, PCER, PESR, PCSR, CPR, PMC, and CPSSM.
The regression coefficient B value for each of these variables indicates the magnitude and direction of the variable’s impact on cost deviation. For example, PCER has the largest B value of 1.623, which can be interpreted as PCER having the largest impact on cost deviation. On the other hand, the B-value of CPSSM is 0.884, indicating that it has a relatively small impact.
The results of the Wald analysis confirm that each independent variable has a statistically significant impact on the model, with all independent variables having a Wald test p-value of less than 0.05.
logit[P(CD = 1)] = β0 + (β1 × PMR) + (β2 × PCER)+(β3 × PESR) + (β4 × CPR) + (β5 × PCSR) +(β6 × PMC) + (β7 × CPSSM)
Using a logistic regression equation (1), we can predict the probability of a cost deviation occurring as follows:
logit[P(CD = 1)] = -39.529 + (1.320 × PMR) + (1.623 × PCER) + (1.238 × PESR) + (0.829 × CPR) + (1.572 × PCSR) + (1.083 × PMC) + (0.884 × CPSSM)
Here, a positive regression coefficient of B indicates that the variable tends to increase the probability of a cost deviation occurring.
The odds ratio (OR) shows how much each variable increases the odds of a cost deviation occurring for a one-unit increase, and the analysis shows that PMR (OR=3.744, 95% C.I. [1.657, 8.457]), PCER (OR=5.068, 95% C.I. [2.236, 11.484]), PESR (OR=3.447, 95% C.I. [1.853, 6. 413]), CPR (OR=2.292, 95% C.I. [1.020, 5.151]), PCSR (OR=4.817, 95% C.I. [2.250, 10.317]), PMC (OR=2.954, 95% C.I. [1.452, 6.013]), and CPSSM (OR=2.419, 95% C.I. [1.297, 4.515]) had a statistically significant effect on cost deviation.
This indicates that the probability of cost deviation increases as these variables increase. This result provides important information for cost deviation management strategies. The classification table’s prediction percentage indicates how well the model predicts the occurrence (CD=1) and non-occurrence (CD=0) of cost deviations, and in this study, the model actually predicted the non-occurrence of cost deviations with an accuracy of 95.4% and the occurrence of cost deviations with an accuracy of 93.0%.
These taxonomy results show that the model is classifying the data very accurately, which confirms that the logistic regression model is useful for clearly identifying the likelihood of a cost deviation occurring.
Figure 6 provides a visual representation of the relationship between the independent variables and the probability of having a cost deviation of 1 (CD=1) through a logistic regression model. Here, the slope of each line represents the predictive power of that variable for cost deviation, with a steeper slope indicating a greater influence of the variable. This visualization plays an important role in analyzing the importance of each variable to cost deviation.
Figure 7 shows a histogram of the expected probability of cost deviation from the logistic regression model. The x-axis shows the expected probability and the y-axis shows the frequency. The symbols ‘0’ and ‘1’ represent the cases of no cost deviation and occurrence, respectively. The ‘cut value’ of 0.50 is a predictive classification criterion, which distinguishes between deviations occurring and not occurring based on this threshold. In the histogram, we can see that the two observed groups are clearly separated, suggesting that the model can clearly identify the likelihood of cost deviations occurring.
For further diagnostics, we performed Cook’s Influence statistic and normalized residual analysis to verify the robustness and reliability of the model.
Figure 8 shows a scatter plot of the logistic regression using Cook’s influence statistic. The x-axis represents the observation index and the y-axis represents the Cook’s influence values. This graph evaluates the influence of each data point in the regression model, with influence values above 1 indicating points that have a greater impact on the model.
Figure 9 shows a scatterplot of the normalized residuals from a logistic regression model. The x-axis shows the observations and the y-axis shows the normalized residuals. The residuals are standardized by the estimated standard deviation of the difference between the observed and predicted values and tend to be randomly distributed around the zero line. This indicates the goodness of fit of the model and is useful for checking for problems with model assumptions such as nonlinearity, heterogeneous covariance, and outliers. This sophisticated analysis further strengthens the validity and depth of our findings.
4.4. Analyze and discuss cost deviation influence factors
This study provides an in-depth analysis of the main factors affecting the occurrence of cost deviation in NDPP and provides a predictive model of the main variables affecting cost variance and deviation through binary logistic regression analysis.
The foundation of the study is rooted in extensive prior research and theoretical foundations, and its importance has already been emphasized through in-depth studies by previous researchers such as Flyvbjerg et al. [3], Ibrahim and Elshwadfy [4], Gómez Cabrera [8], Alsugair [9], Salim and Saeedi [19], Albtoush et al. [20], Cho and Kim [21], Memon et al. [24], and Mahamid and Aichouni [25].
The results of this study reveal some important differences and similarities compared to previous studies. Previous studies have emphasized that PMR, PCER, and PESR have a significant impact on cost variance and deviation. This study refines these findings and provides empirical support for the theoretical hypotheses of previous studies by quantitatively analyzing the impact of each variable. In particular, we find that PMR, PCER, and PESR have a significant impact on the occurrence of cost deviations.
In addition to these typical factors, we present new findings that additional variables, such as CPSSM, influence cost deviation. This is an area that has been relatively under-emphasized in the literature, and this study sheds new light on existing research by showing that these factors can play a significant role in cost deviation. Our study also differs from previous studies by more precisely measuring the impact of each variable and building a predictive model of cost deviation. This means that this study goes beyond simply confirming the results of previous studies and provides a new direction to provide practical decision-making tools for stakeholders in NDPP. Therefore, the analysis of this study is an important study with both theoretical depth and practical applicability, emphasizing the importance of proactive management of risk factors and appropriate preventive measures for stakeholders in NDPP.
5. Conclusions
This study provides an in-depth analysis of the causes of cost deviations in NDPP in Gyeongsangbuk-do and suggests risk management and cost optimization strategies specific to the sector.
The results of the study quantitatively revealed the impact of various factors on cost deviation, such as PMR, PCER, PESR, PCSR, CPR, PMC, and CPSSM. By providing a predictive model for these cost deviations, stakeholders in NDPP can proactively manage risk factors and take appropriate preventive measures, which plays an important role in ensuring the success of the project. The study will also help to better understand the causes of cost deviations and develop more effective strategies to counteract them.
This study provides empirical support for the theoretical hypotheses of previous studies, but also provides a new perspective. In particular, it reveals the influence of additional factors such as CPSSM, providing a new level of understanding of cost deviation management in NDPP. This analysis provides important insights for stakeholders in NDPP to make strategic decisions to minimize cost deviations.
However, since this study was focused on NDPP in Gyeongsangbuk-do, the generalizability of the results is limited. Another limitation is that analyses based on data collected at a specific point in time may not fully capture changes in risk factors over time.
In future research, it is necessary to overcome these limitations by conducting longitudinal studies covering different regions and types of projects, and to analyze the dynamic changes in risk factors over time. Furthermore, more in-depth research on the interactions between various factors that influence the occurrence of cost deviations is needed, which will enable the development of more sophisticated and comprehensive risk management strategies.
Acknowledgments
This work was supported by the National Research Foundation of Korea (NRF) grant funded by the Korea Government (MSIT) (NRF-2021R1A2C1014267). This research was supported by the Regional University Outstanding Scientist Support Program through the National Research Foundation of Korea (NRF), grant number (NRF-2019R1I1A3A01062229).
References
- Simonds, E.A.; Gobenciong, K.A.P.; Wilson, J.E.; Jiroutek, M.R.; Nugent, N.R.; van Tilburg, M.A.L. Trauma Functioning and Well-Being in Children Who Receive Mental Health Aid after Natural Disaster or War. Children. 2022, 9, 951. [Google Scholar] [CrossRef] [PubMed]
- Kim, S.; Lee, D.S.; Development of an Integrated Management System for Disaster Prevention Centered on Living Areas. Nat. Hazards Earth Syst. Sci. 2022, 18, 35–44. Available online: https://www.earticle.net/Article/A424810 (accessed on 25.03.2023). (in Korean).
- Flyvbjerg, B.; Skamris Holm, M.K.; Buhl, S.L. How Common and How Large are Cost Overruns in Transport Infrastructure Projects? Transp. Rev. 2003, 23, 71–88. [Google Scholar] [CrossRef]
- Ibrahim, A.H.; Elshwadfy, L.M. Factors Affecting the Accuracy of Construction Project Cost Estimation in Egypt. Jordan J. Civ. Eng. 2021, 15, 2021–2329. [Google Scholar]
- Raghib, A.T.; Belayutham, S.; Mohammad, M.Z.; Ibrahim, C. Causes, Effects and Potential Measures of Cost Deviations in High-Rise Building Projects in Egypt. Int. J. Constr. Manag. 2023, 23, 1875–1885. [Google Scholar] [CrossRef]
- Gyeongbuk Province. Gyeongbuk Province has Invested the Most in Natural Disaster Prevention Projects in the Country This Year. Available online: https://url.kr/orqkbg (accessed on 25.03.2023). (in Korean).
- Bhargava, A.; Labi, S.; Chen, S.; Saeed, T.U.; Sinha, K.C. Predicting Cost Escalation Pathways and Deviation Severities of Infrastructure Projects Using Risk-Based Econometric Models and Monte Carlo Simulation. Comput.-Aided Civ. Infrastruct. Eng. 2017, 32, 620–640. [CrossRef]
- Gómez Cabrera, A. Identification of Factors Generating Time and Cost Deviation in Construction Projects: A Case Study in Rural Roads in Colombia. Available online: https://repositorio.uniandes.edu.co/handle/1992/52996 (accessed on 20.03.2023).
- Alsugair, A.M. Cost Deviation Model of Construction Projects in Saudi Arabia Using PLS-SEM. Sustainability. 2022, 14, 16391. [Google Scholar] [CrossRef]
- Annamalaisami, C.D.; Kuppuswamy, A. Managing Cost Risks: Toward a Taxonomy of Cost Overrun Factors in Building Construction Projects. ASCE-ASME J. Risk Uncertain. Eng. Syst. Part A: Civ. Eng. 2021, 7, 04021021. [CrossRef]
- Górecki, J.; Diaz-Madronero, M. Who Risks and Wins?—Simulated Cost Variance in Sustainable Construction Projects. Sustainability. 2020, 12, 3370. [Google Scholar] [CrossRef]
- Przywara, D.; Rak, A. Monitoring of Time and Cost Variances of Schedule Using Simple Earned Value Method Indicators. Appl. Sci. 2021, 11, 1357. [Google Scholar] [CrossRef]
- Raut, S.; Pimplikar, S.S.; Sawant, K. Effect of Project Cost and Time Monitoring on Progress of Construction Project. Int. J. Res. Eng. Technol. 2013, 2, 796–800. [Google Scholar]
- Narayanan, S.; Kure, A.M.; Palaniappan, S. Study on Time and Cost Overruns in Mega Infrastructure Projects in India. J. Inst. Eng. (India): Ser. A. 2019, 100, 139–145. [CrossRef]
- Carr, P.G. Investigation of Bid Price Competition Measured Through Prebid Project Estimates, Actual Bid Prices, and Number of Bidders. J. Constr. Eng. Manag. 2005, 131, 1165–1172. [Google Scholar] [CrossRef]
- Endut, I.R.; Akintoye, A.; Kelly, J. Cost and Time Overruns of Projects in Malaysia. Available online: https://www.researchgate.net/publication/265377554 (accessed on 25.06.2023).
- Rahman, I.A.; Memon, A.H. The Way Forward in Sustainable Construction: Issues and Challenges. Int. J. Adv. Appl. Sci. 2013, 2, 1321. [Google Scholar] [CrossRef]
- Abdel-Monem, M.; Alshaer, K.T.; El-Dash, K. Assessing Risk Factors Affecting the Accuracy of Conceptual Cost Estimation in the Middle East. Buildings. 2022, 12, 950. [Google Scholar] [CrossRef]
- Salim, A.; Saeedi, A. Major Factors of Delay in Developing Countries Construction Projects: Critical Review. Available online: https://www.researchgate.net/publication/355041672 (accessed on 25.06.2023). [CrossRef]
- Albtoush, F.; Shu Ing, D.; Rahman, R.A.; Aldiabat Al-Btoosh, F.A.; Faten Albtoush, A.M.; Doh, S.I.; Rahman, R.A.; Maria Zaidi, S. Factors Affecting the Accuracy of Cost Estimate in Construction Projects: A Review. Available online: https://www.researchgate.net/publication/355041672 (accessed on 15.06.2023).
- Cho, J.-H.; Kim, B.-S. Risk Influencing Factors in Performance of River Disaster Prevention Project. KSCE J. Civ. Eng. 2020, 40, 417–428. (in Korean). [Google Scholar] [CrossRef]
- Cong, J.; Mbachu, J.; Domingo, J. Factors Influencing the Accuracy of Pre-Contract Stage Estimation of Final Contract Price in New Zealand. Int. J. Constr. Supply Chain Manag. 2014, 4, 51–64. [Google Scholar] [CrossRef]
- Azman, N.A.M.; Adeleke, A.Q. Effect of Time Overruns on Apartment Building among Kuantan Malaysian Construction Industries. J. Adv. Res. Appl. Sci. Eng. Technol. 2018, 10, 41–47. [Google Scholar]
- Memon, A.H.; Rahman, I.A.; Abdullah, M.R.; Asmi, A.; Azis, A.; Factors Affecting Construction Cost in Mara Large Construction Project: Perspective of Project Management Consultant. Int. J. Sustain. Constr. Eng. Technol. 2010, 1, 41–54. Available online: https://penerbit.uthm.edu.my/ojs/index.php/IJSCET/article/view/62 (accessed on 25.06.2023).
- Mahamid, I.; Aichouni, M. Factors Affecting Accuracy of Pretender Post Estimate: Studies of Saudi Arabia. Available online: https://www.researchgate.net/publication/265377554 (accessed on 05.06.2023]).
Figure 1.
Research Flowchart.
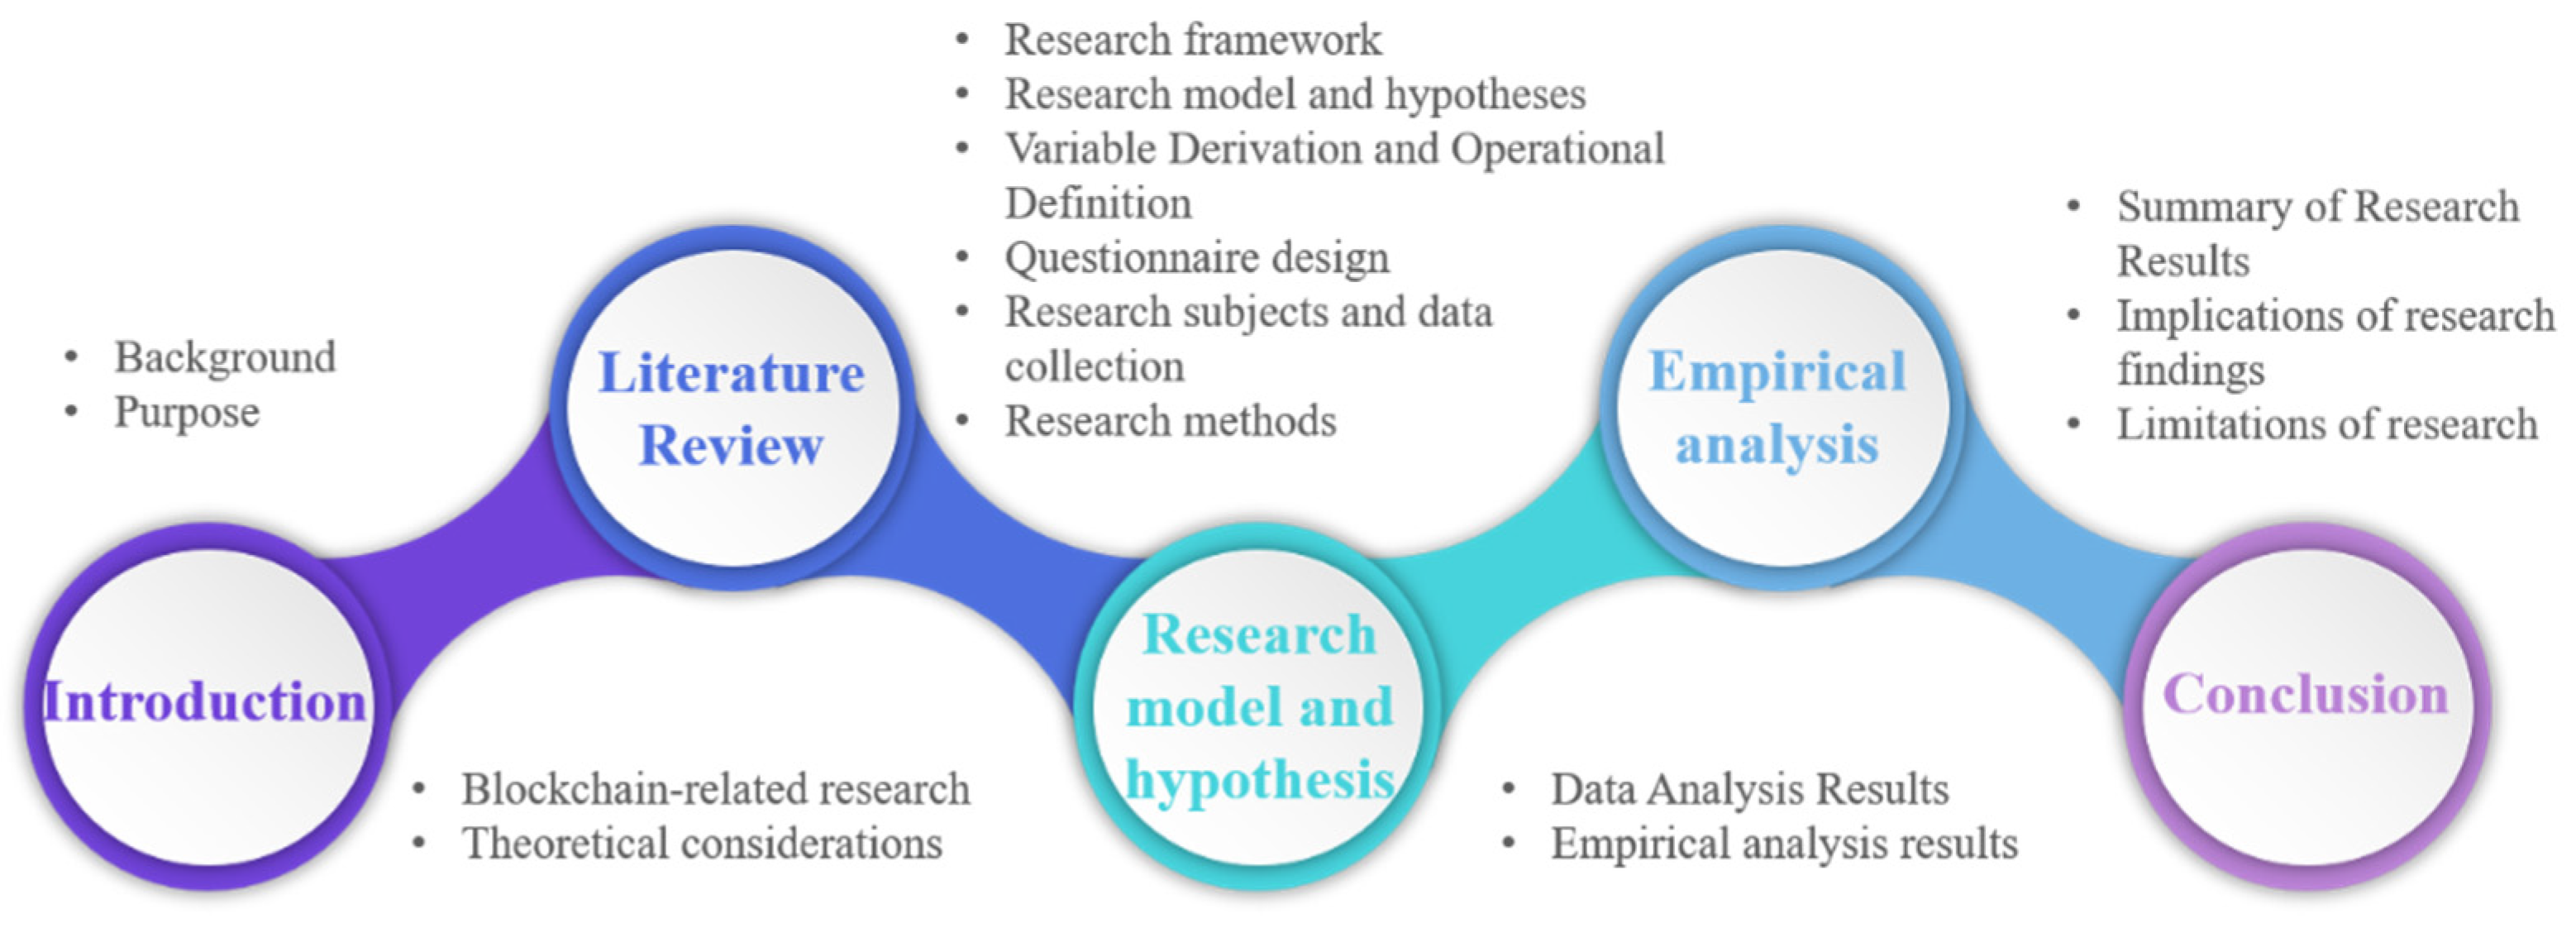
Figure 2.
Variable derivation process using the Delphi method to develop a cost deviation model.
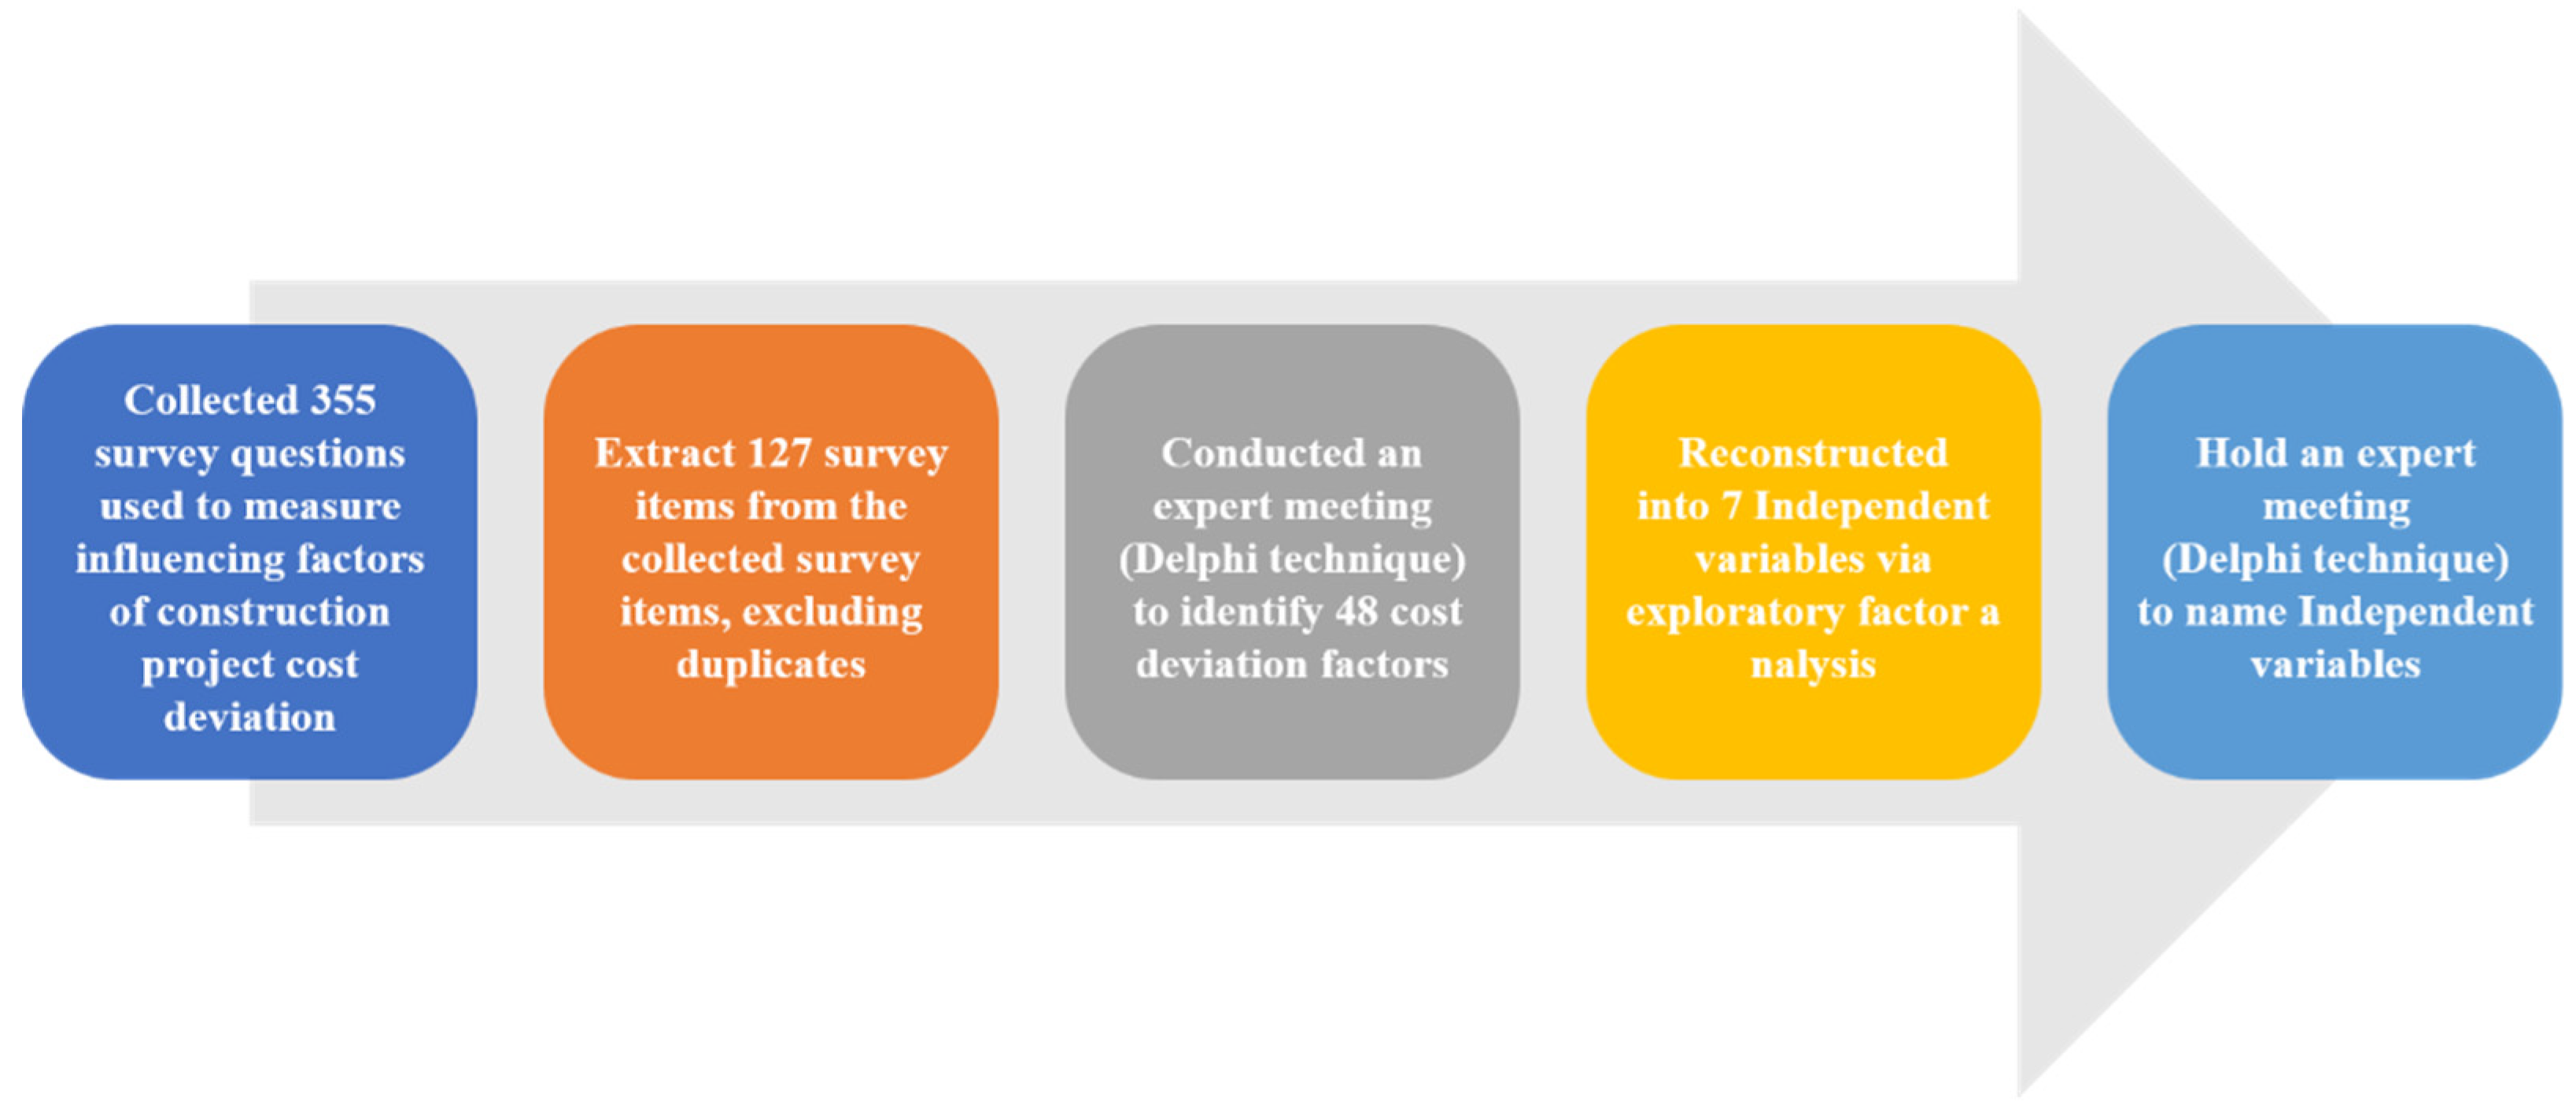
Figure 3.
Research Model.
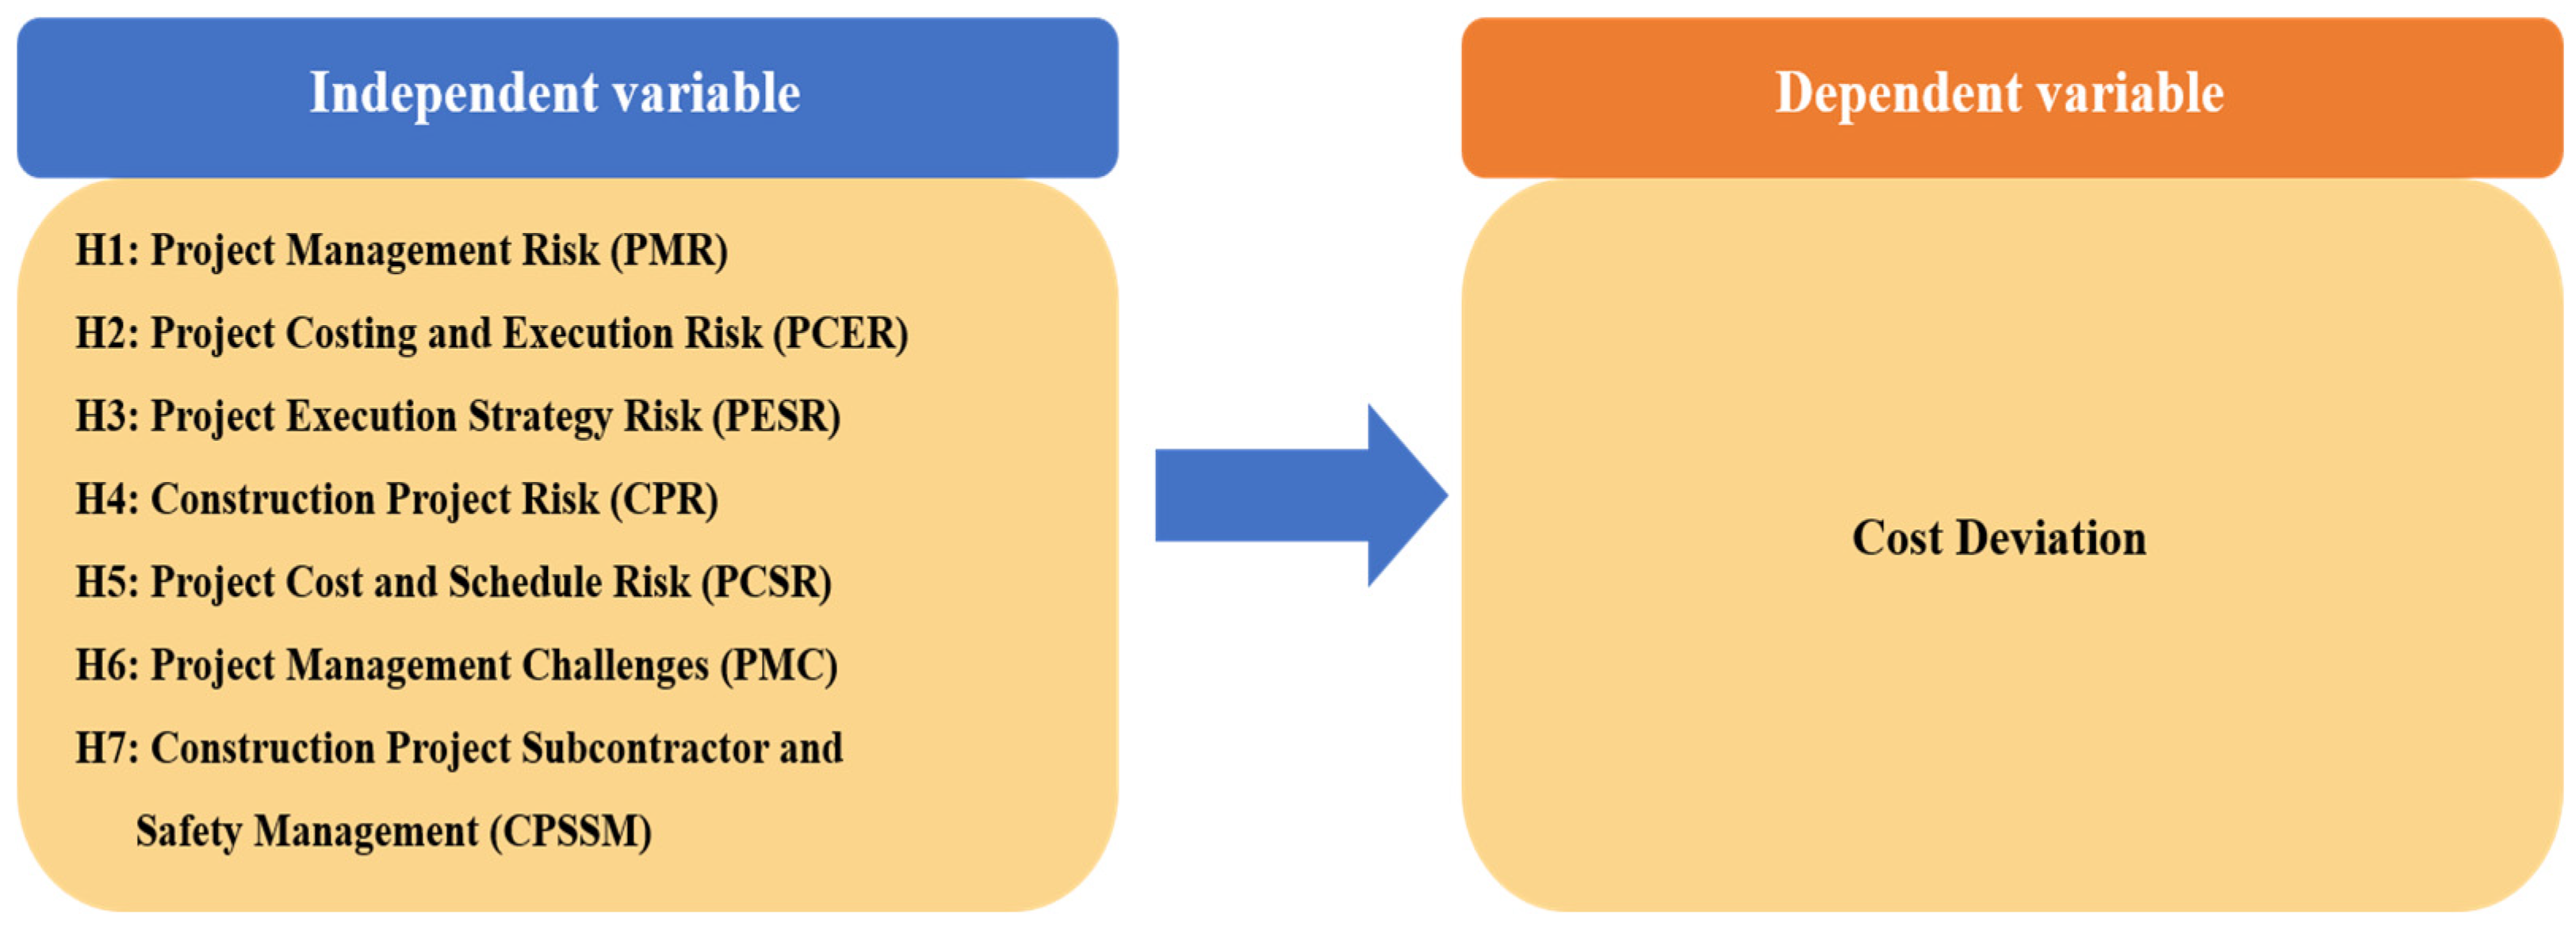
Figure 4.
Methodology Flowchart.
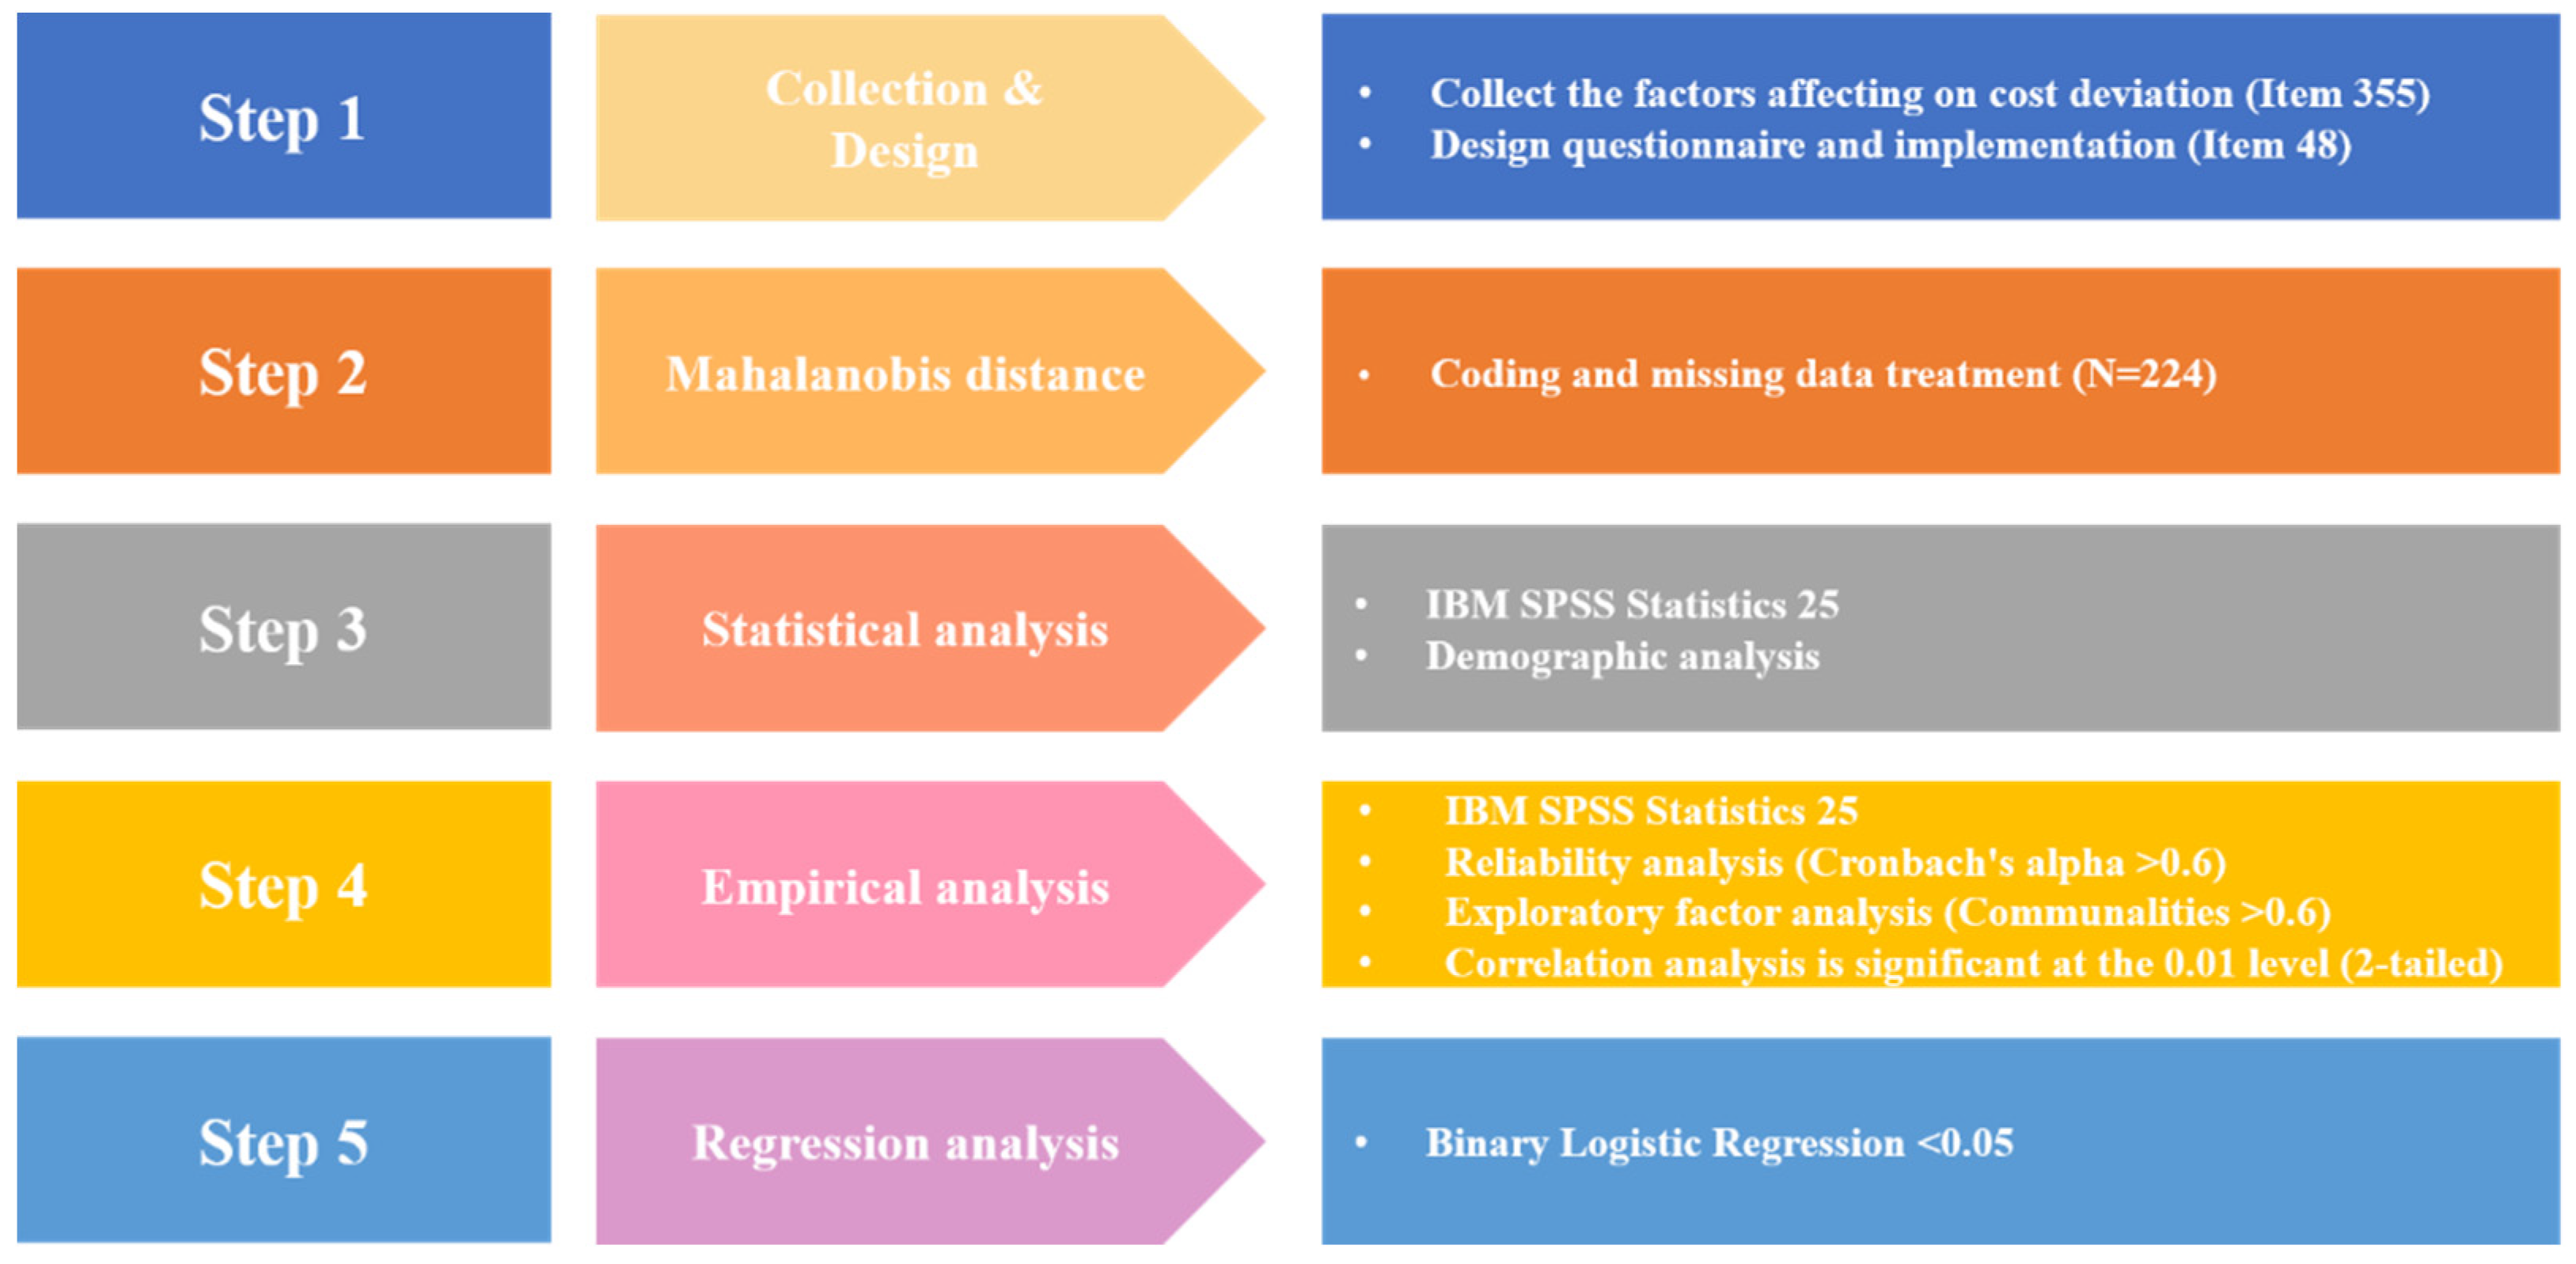
Figure 5.
Scree plot showing eigenvalues above 1.0.
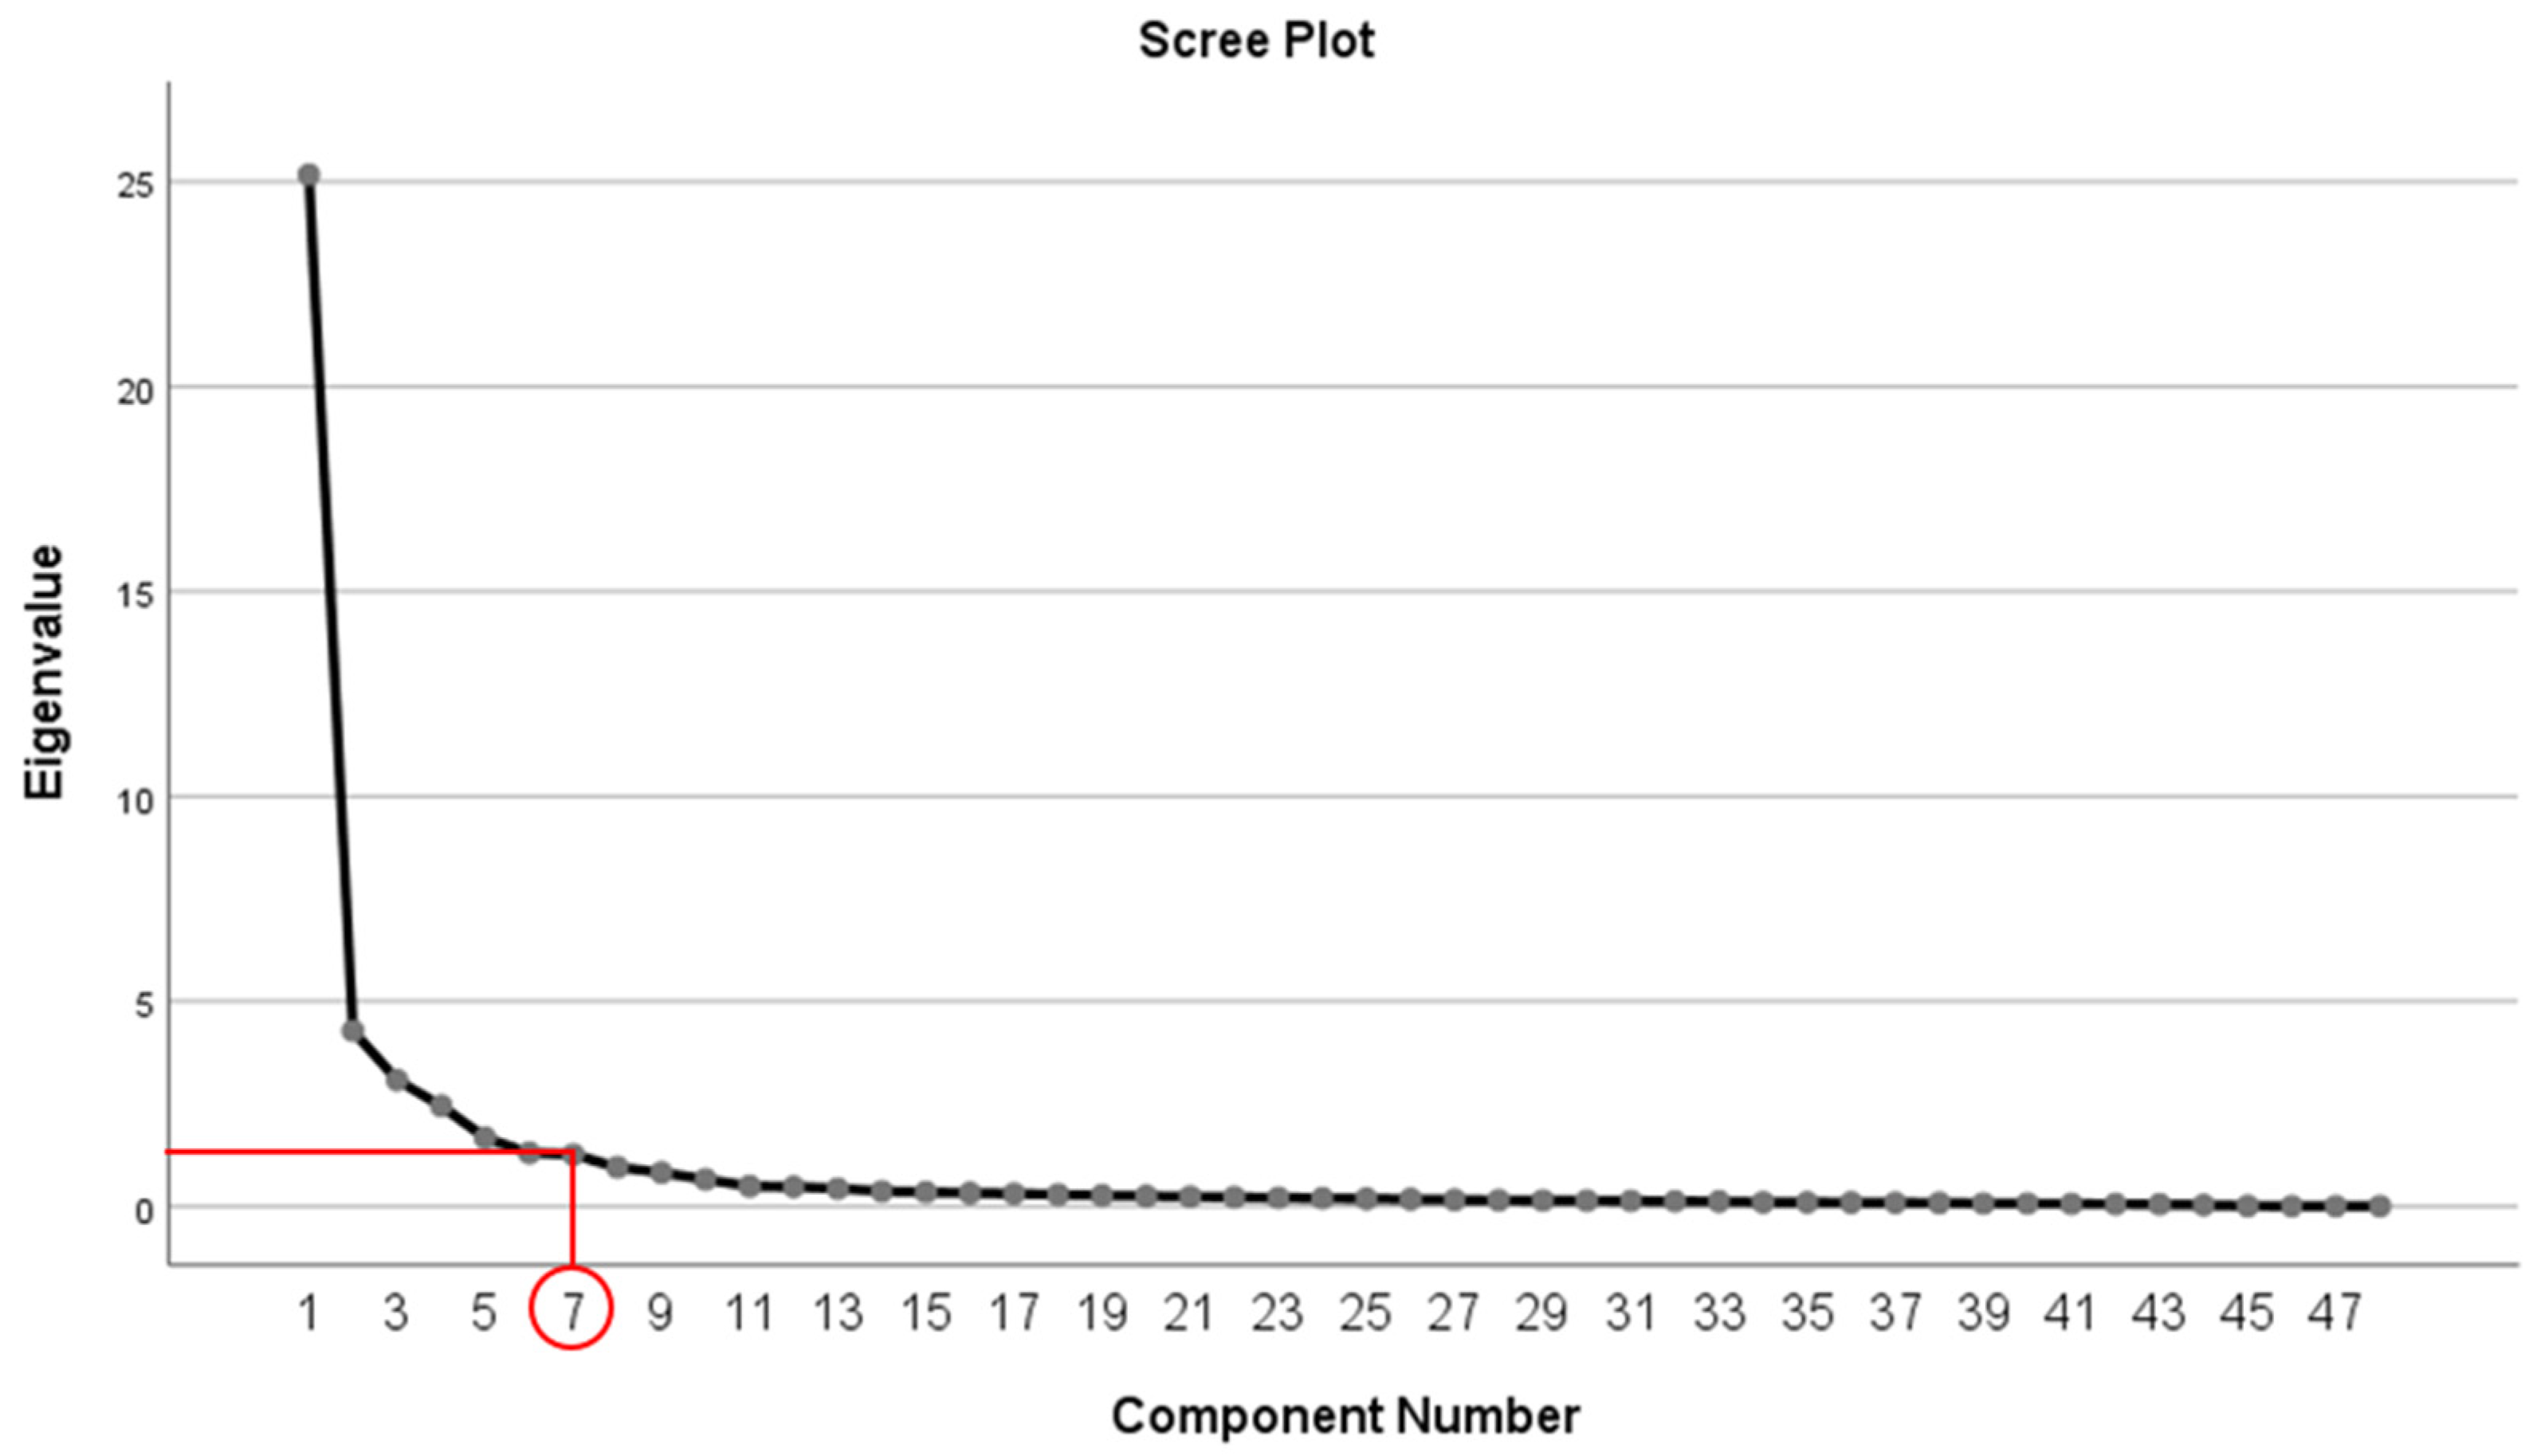
Figure 6.
Predicting cost deviation (CD=1) with a regression equation graph.
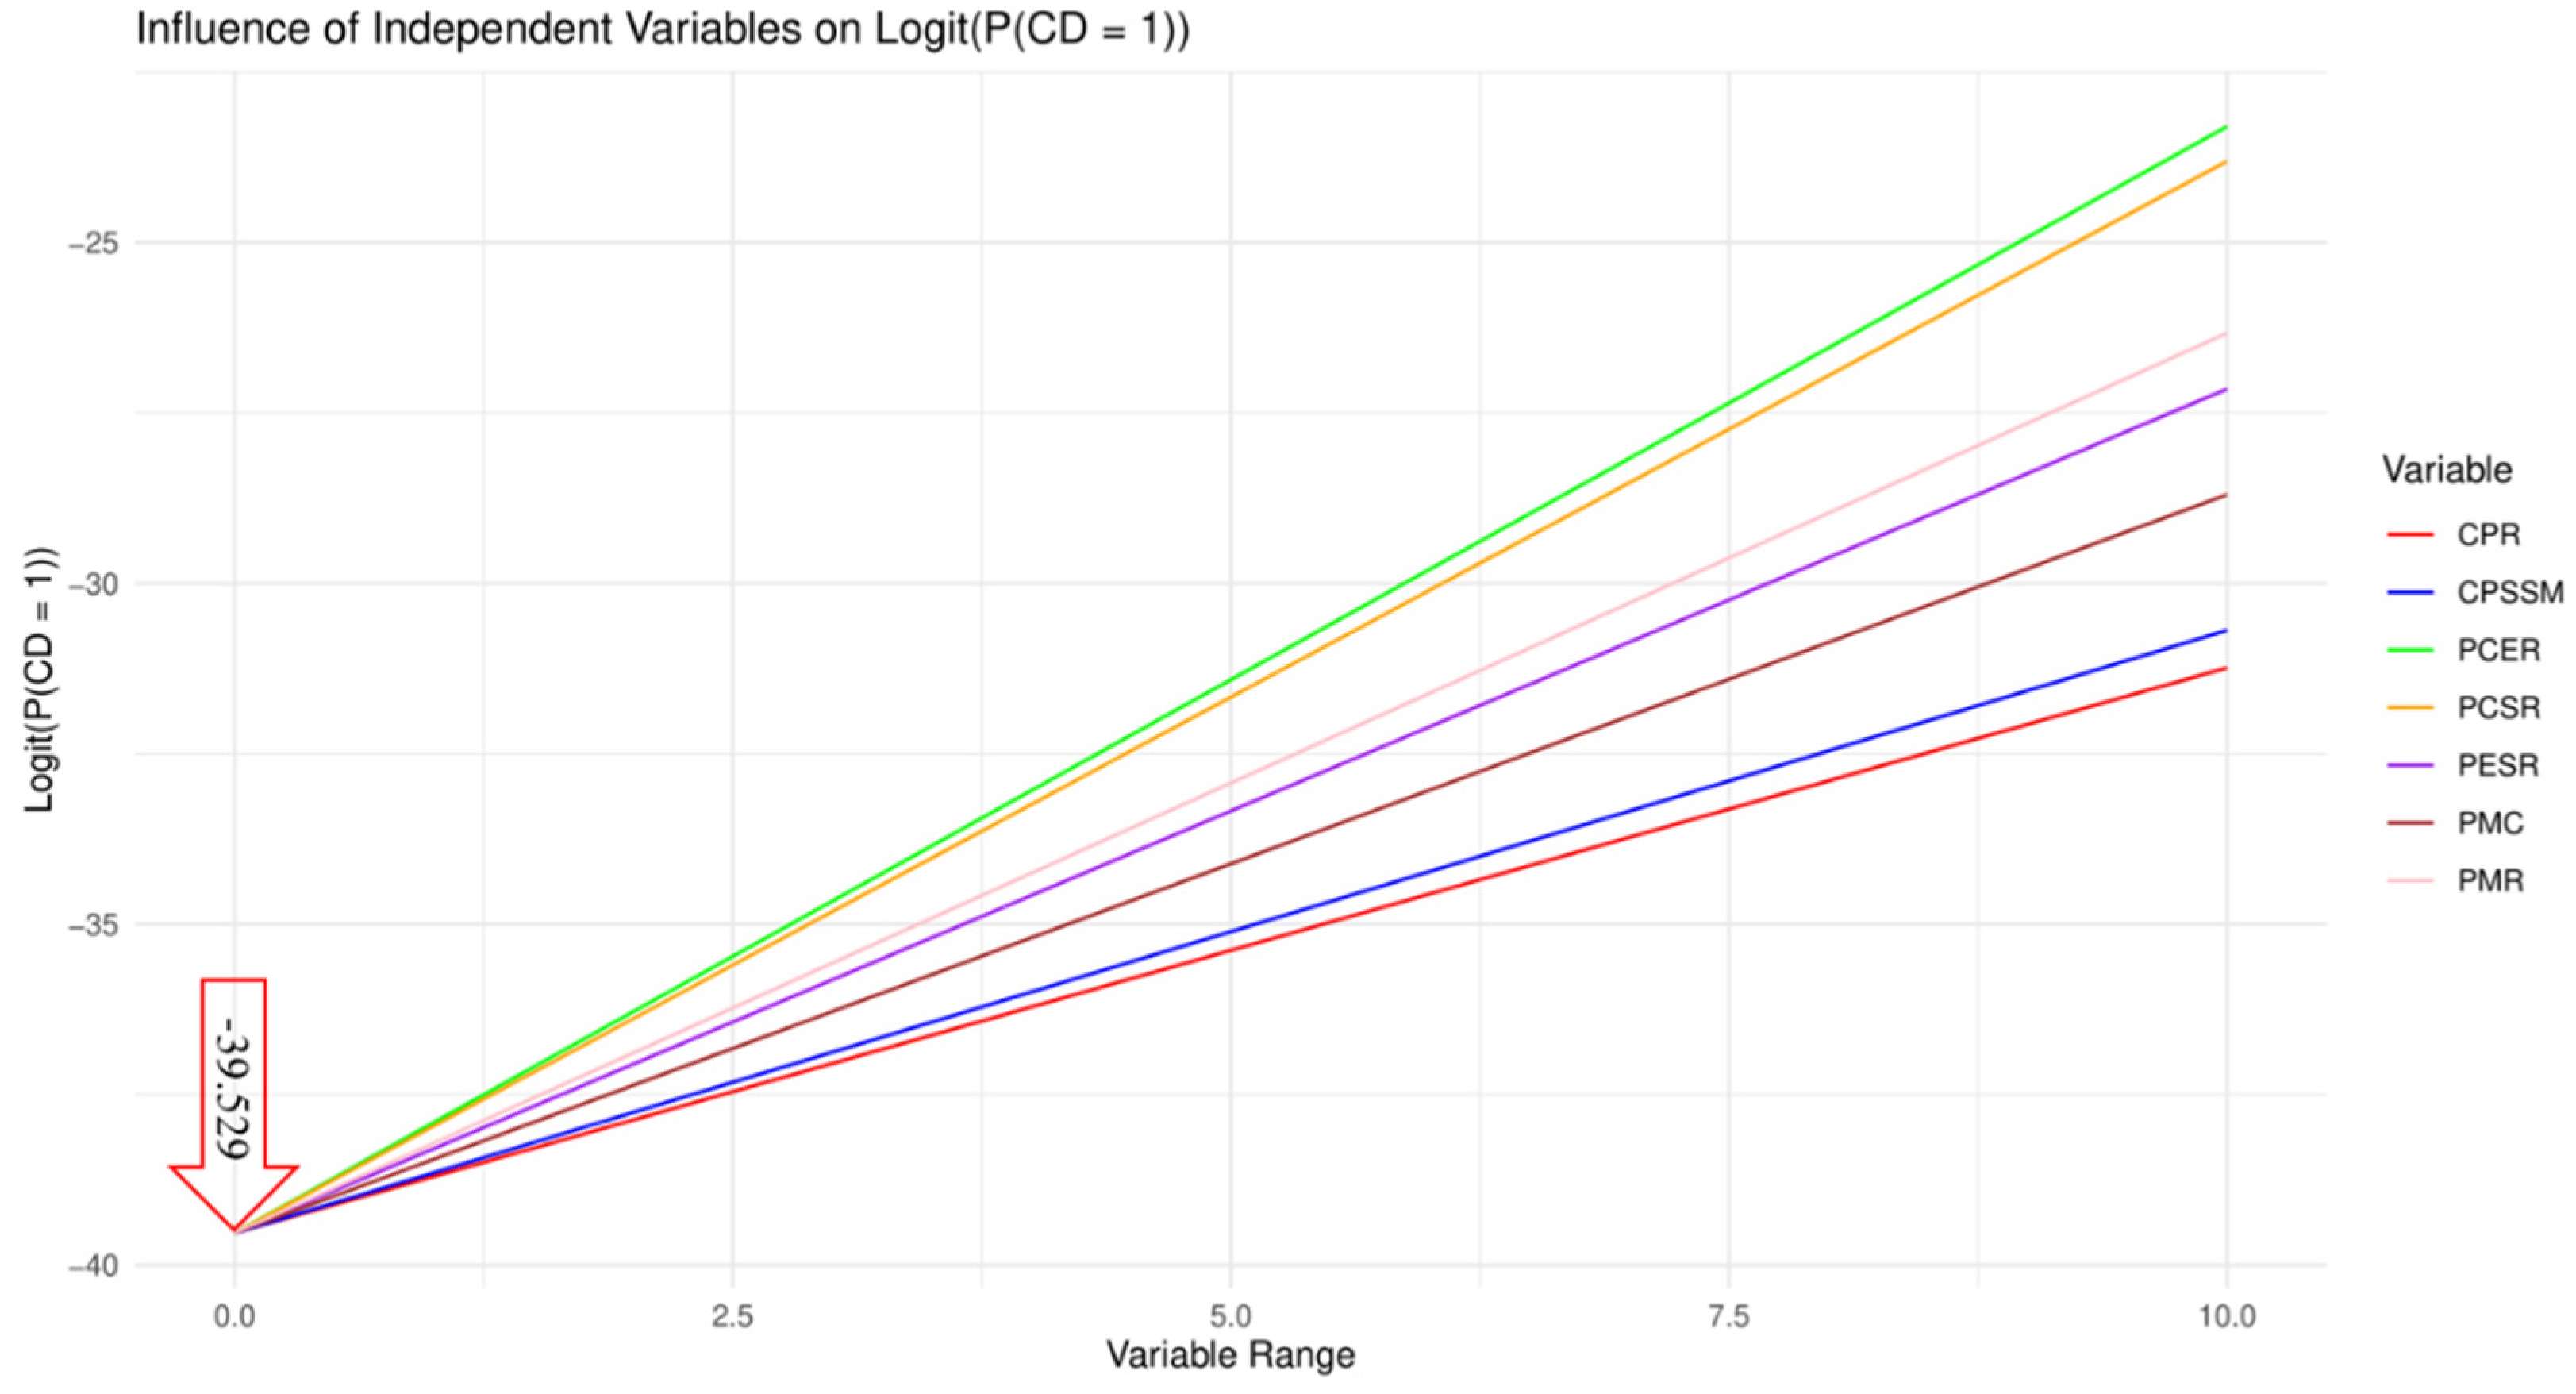
Figure 7.
Histogram of estimated probability.
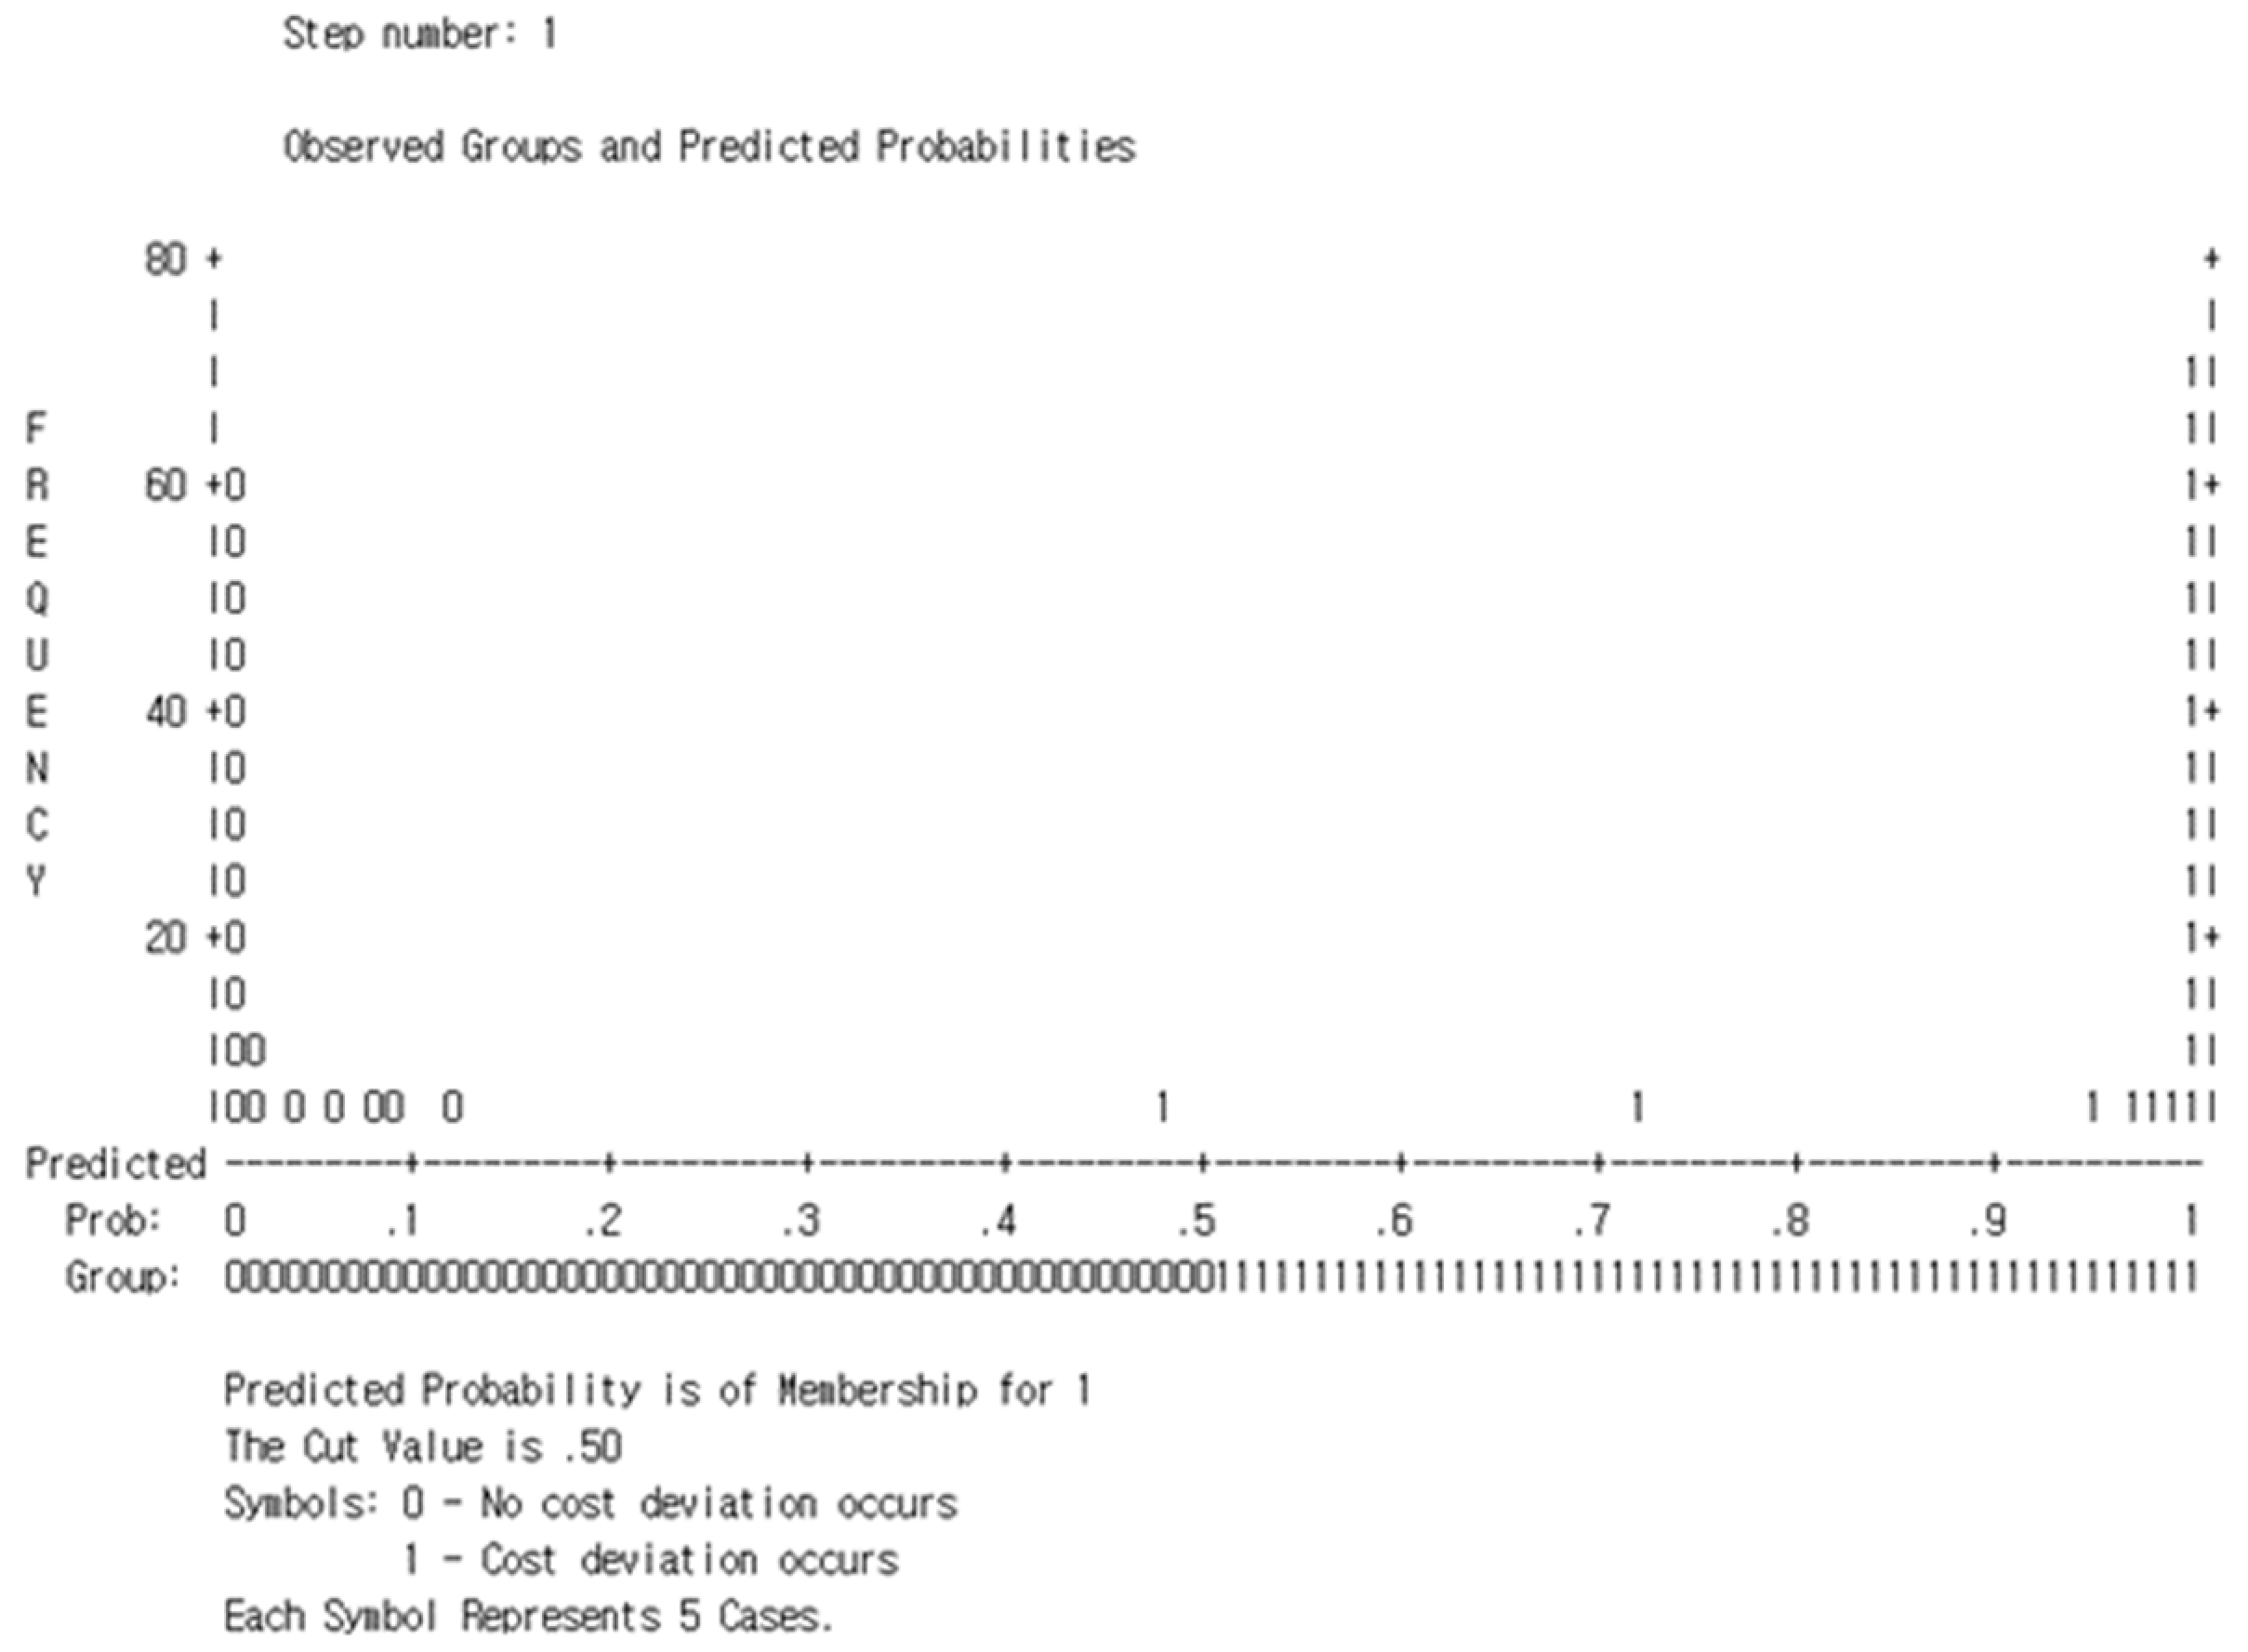
Figure 8.
Cook’s influence statistics graph above 1.0.
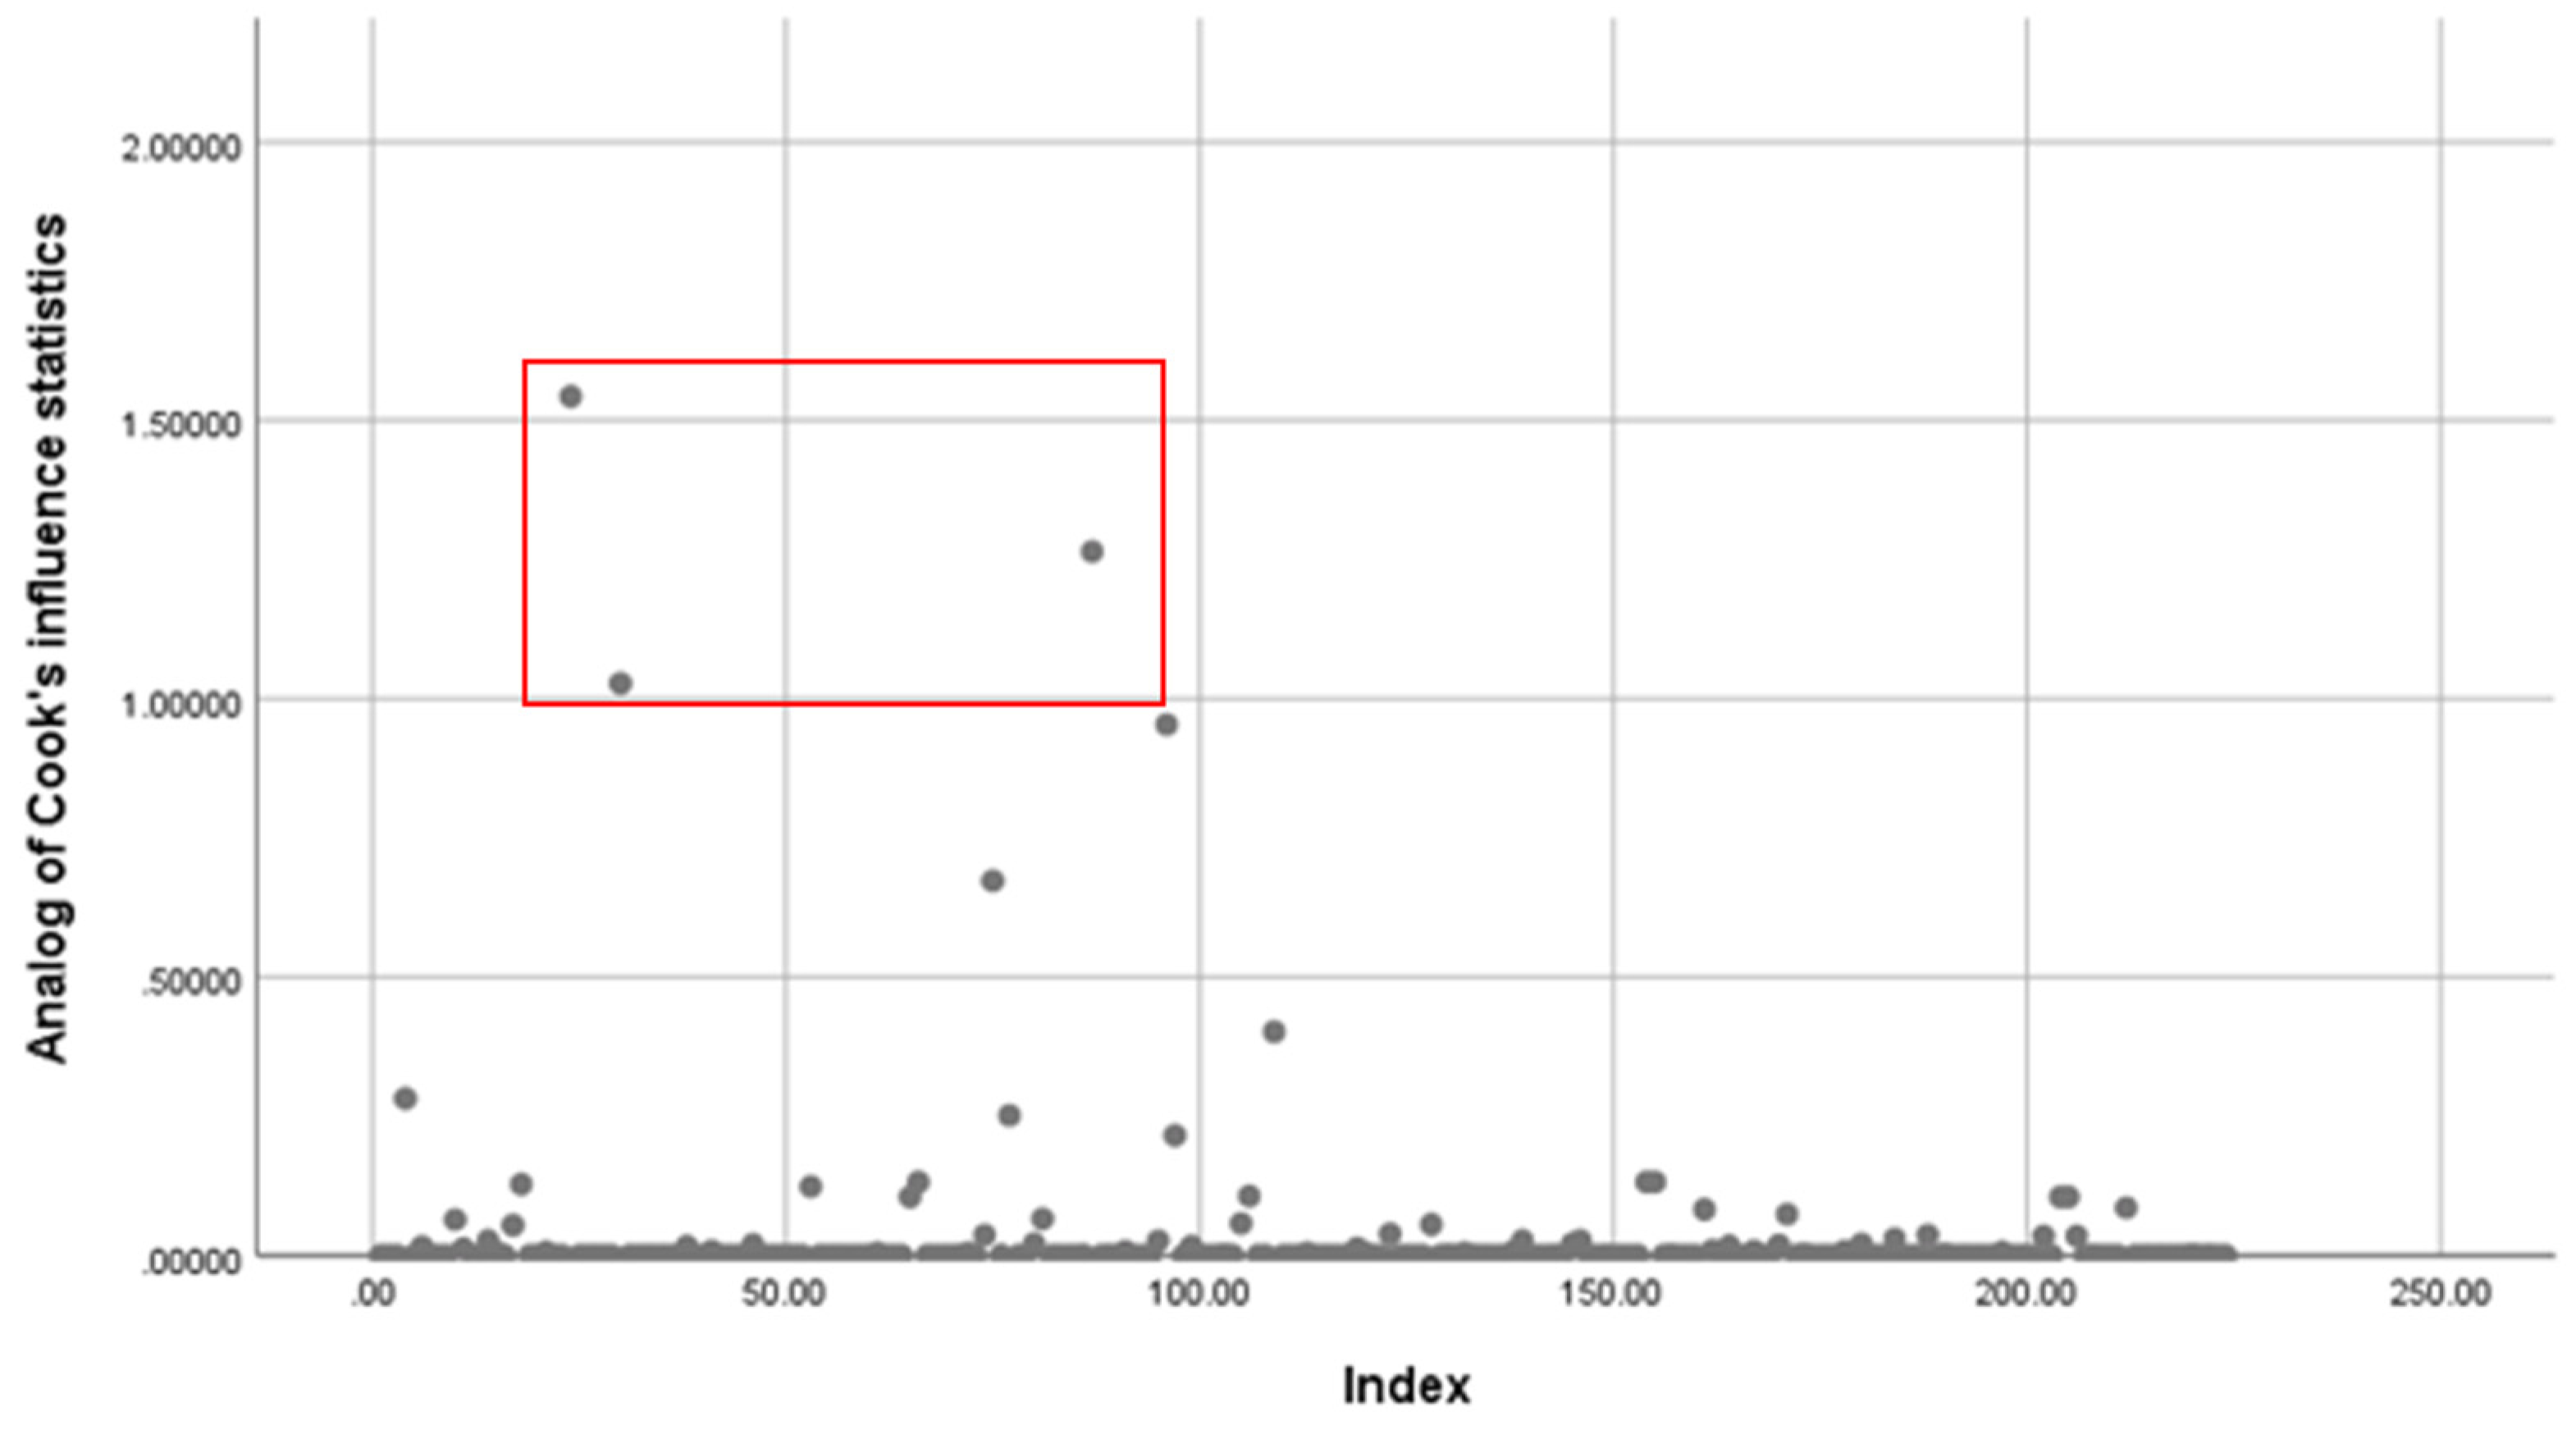
Figure 9.
Normalized residuals graph above |3.0|.
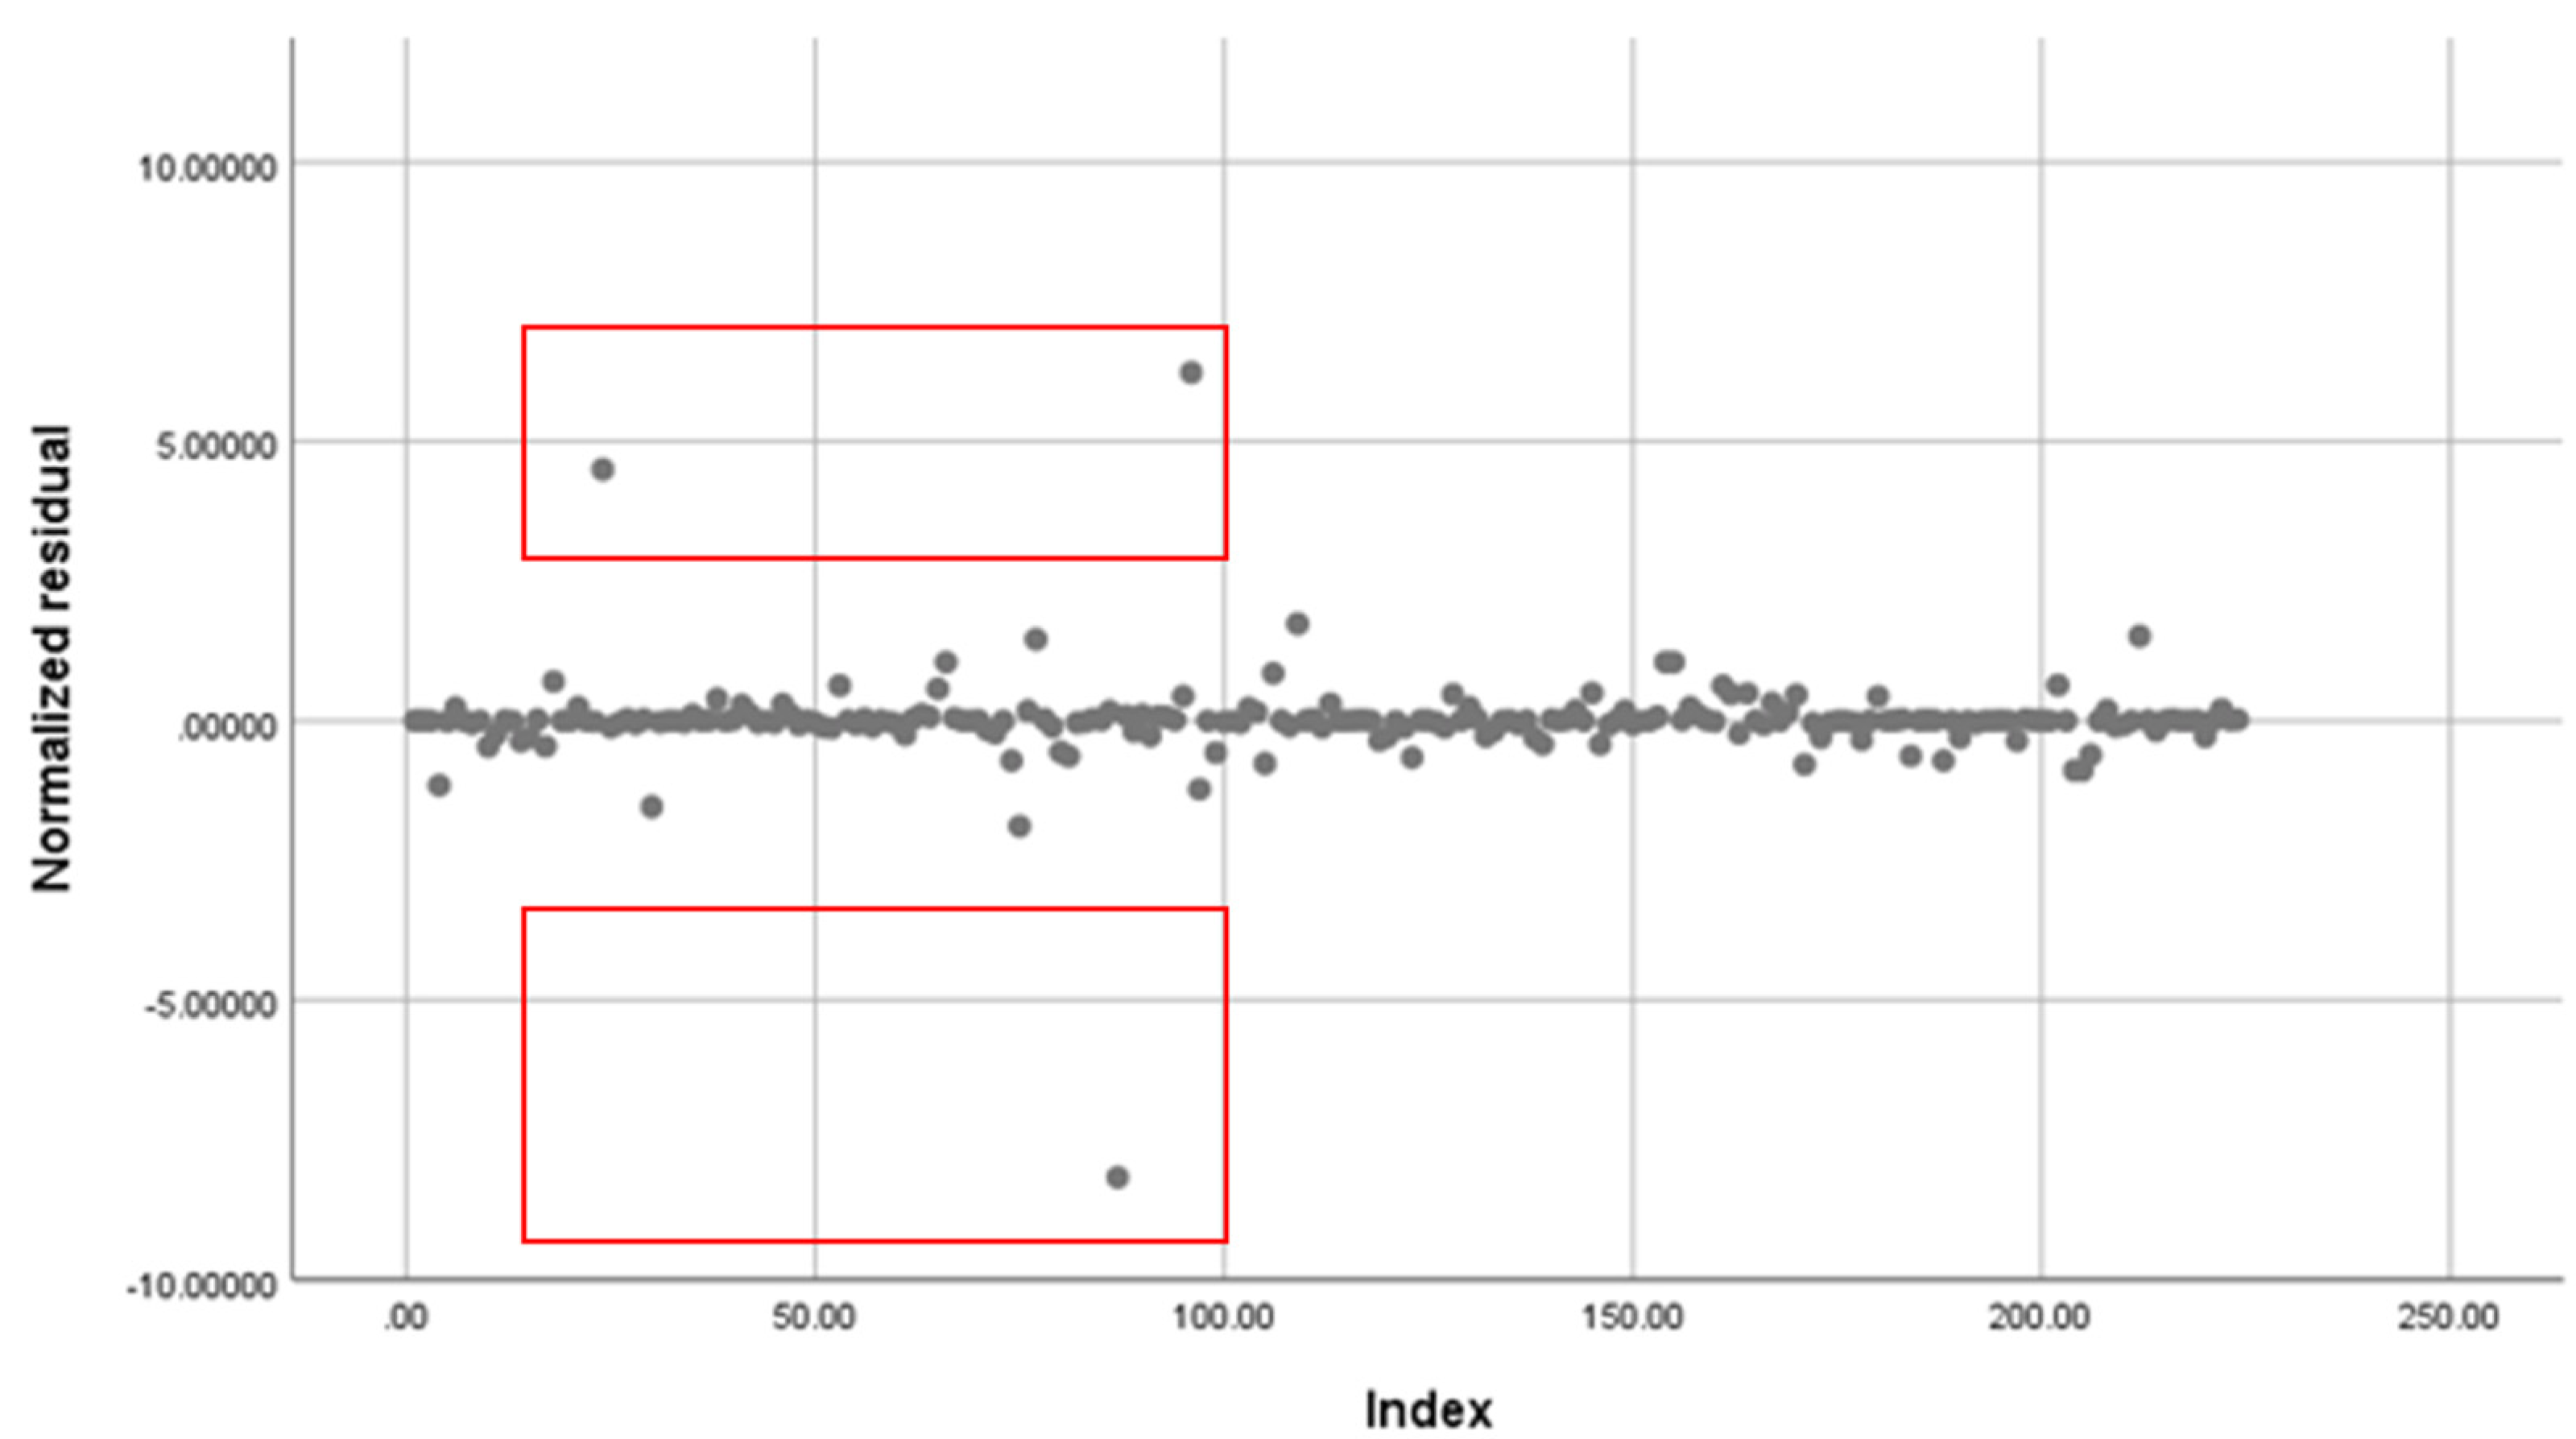

Table 1.
Cost Deviation-Related Factors, Countries, and Research Fields by Researcher.
| Researcher | Country | Research Field | Cost-Related Factors | Item |
|---|---|---|---|---|
| Abdel-Monem et al. [18] | Middle East | Construction projects | Project complexity, Site constraints, Design changes, Unavailability of skilled labor, Inflation, Market fluctuations, Changes in scope, Delays in construction, Acceleration, Claims and disputes | 57 |
| Alsugair [9] | Saudi Arabia | Construction projects | Scope quality, contractor organization, estimator performance, information quality, project characteristics, external factors, contractual procedures | 73 |
| Ibrahim and Elshwadfy [4] | Egypt | Construction projects | Consultants, design parameters, information and estimators, client characteristics, project characteristics, contract requirements, contractor characteristics, external factor | 70 |
| Albtoush et al. [20] | New Zealand | Construction projects | Project characteristics, client characteristics, contractor characteristics, design, consultant and tendering, external factors and market conditions, inaccurate cost estimating | - |
| Przywara and Rak [12] | Poland | multi-family housing | Time variances from the Schedule (T/S), Time variances from planned Costs (T/C) | - |
| Azman et al. [23] | Peninsular Malaysia | Construction industry |
Scope quality, information quality, uncertainty level, estimator performance, quality of estimating procedure | - |
| Gómez Cabrera [8] | Colombia | Rural road projects | Competitive bidding (Open Data), competitive bidding (Web Search) | 51 |
| Cong et al. [22] | New Zealand | Construction industry |
Project characteristics, client characteristics, contractor characteristics, tendering conditions, consultants and design, external factors and market condition, inaccuracies in cost estimation | 37 |
| Mahamid and Aichouni [25] | Saudi Arabia | Construction industry |
Client, consultants and design, cost estimating, project characteristics, contract and tendering, resources (labors, materials, equipments) | 43 |
| Raut et al. [13] | India | Roads & Highway etc |
Time, Cost, Quality | - |
| Memon et al. [24] | Malaysia | Construction projects | Causes affecting construction costs | 24 |
Table 2.
Classification of cost deviation factors using the Delphi technique.
| Variable | Item | Questionnaire |
|---|---|---|
| Project Management Risk (PMR) |
Q22 | Budget variation due to material purchase and rental costs |
| Q21 | Difference between project cost and budget | |
| Q20 | Bond and warranty clauses | |
| Q15 | Environmental impact of the project | |
| Q19 | Allowable contingency | |
| Q16 | Non-provision of regulatory information | |
| Q18 | Number of bidders participating in the project | |
| Q17 | Cost variation due to price fluctuation | |
| Q25 | Possibility of complaints from stakeholders | |
| Q24 | Additional costs due to inappropriate budget planning | |
| Q26 | Possibility of design errors and omissions issues | |
| Q27 | Additional costs and schedule delays due to change orders | |
| Project Costing and Execution Risk (PCER) |
Q8 | Managerial labor cost estimation and project efficiency |
| Q10 | Reliability and completeness of cost information | |
| Q9 | Cost comparison and selection according to alternative methods | |
| Q7 | Allowable time for cost estimation preparation | |
| Q6 | Accuracy of estimation according to proper estimation method | |
| Q23 | Regulatory changes due to legal, institutional, and policy changes | |
| Q28 | Contract execution delay | |
| Project Execution Strategy Risk (PESR) |
Q3 | Fundraising and budget securing |
| Q2 | Experience and performance of management team | |
| Q4 | Information on loss/profit experience from similar projects | |
| Q5 | Relationship with subcontractors and suppliers | |
| Q1 | Feasibility of design and implementation | |
| Q14 | Financial situation and budget of the client | |
| Q11 | Detailed and clear specifications and drawings | |
| Q12 | Budget allocation and cost management according to project priority | |
| Q13 | Project duration | |
| Construction Project Risk (CPR) |
Q44 | Possibility of complaints from residents |
| Q42 | Winter construction suspension | |
| Q40 | Additional costs due to maintenance convenience considerations | |
| Q41 | Compensation delay | |
| Q43 | Imbalance between supply and demand of materials | |
| Project Cost and Schedule Risk (PCSR) |
Q37 | Productivity decline and additional costs due to weather conditions |
| Q38 | Budget increase during project progress due to low bidding | |
| Q39 | Lack of technical competence of the manager | |
| Q36 | Additional costs due to insufficient construction period | |
| Q35 | Cost reduction or change due to budget shortage | |
| Project Management Challenges (PMC) |
Q34 | Mismatch between design conditions and site conditions |
| Q30 | Cost increase and schedule delay due to additional work | |
| Q32 | Risk of delay in project commencement date and completion date | |
| Q31 | Conflict among consortium members | |
| Q29 | Risk of regulatory changes related to acquisition | |
| Q33 | Lack of project risk management experts | |
| Construction Project Subcontractor and Safety Management (CPSSM) |
Q46 | Lack of subcontractor technical skills |
| Q47 | Pressure to achieve target execution rate | |
| Q45 | Possibility of subcontractor bankruptcy risk occurrence | |
| Q48 | On-site accident-free pressure |
Table 3.
Operational definition of variables according to EFA results.
| Variable | Operational Definition | Component Matrix | Item |
|---|---|---|---|
| PMR | These issues include budget deviations, contract terms, environmental impacts, risk management, regulatory compliance, bidding processes, price fluctuation, and stakeholder responses. | Q22, Q21, Q20, Q15, Q19, Q16, Q18, Q17, Q25, Q24, Q26, Q27 | 12 |
| PCER | Issues related to managers’ labor costings, reliability of cost information, cost comparison according to alternative methods, time allowed for costing preparation, accuracy according to appropriate costing methods, regulatory changes due to legal/institutional changes, delays in contract execution, etc. | Q8, Q10, Q9, Q7, Q6, Q23, Q28 | 7 |
| PESR | Securing financing and budget, experience and performance of management, profit and loss experience information on similar projects, relationships with subcontractors and suppliers, design and implementation feasibility, client’s financial situation and budget, clear and specific specifications and drawings, project priorities. These are issues related to budget allocation, cost management, and project period according to ranking. | Q3, Q2, Q4, Q5, Q1, Q14, Q11, Q12, Q13 | 9 |
| CPR | These issues include the possibility of complaints from residents, construction suspension in winter, additional costs due to consideration of maintenance convenience, delayed compensation, and imbalance between material supply and demand. | Q44, Q42, Q40, Q41, Q43 | 5 |
| PCSR | Related issues include decreased productivity and additional costs due to weather conditions, budget increases during project progress due to low-priced bids, lack of technical capabilities of managers, additional costs due to insufficient construction period, and cost reduction or change due to lack of budget. | Q37, Q38, Q39, Q36, Q35 | 5 |
| PMC | Related issues include mismatch between design conditions and site conditions, cost increases and schedule delays due to additional work, risk of delaying project start and completion dates, conflicts among consortium members, risk of regulatory changes related to acquisitions, and lack of project risk management experts. | Q34, Q30, Q32, Q31, Q29, Q33 | 6 |
| CPSSM | These are related issues such as lack of technical capabilities of subcontractors, pressure to achieve target execution rate, possibility of subcontractor bankruptcy risk, and pressure for zero accidents on site. | Q46, Q47, Q45, Q48 | 4 |
Table 4.
Demographic Characteristics (N=224).
| Category | N | % | |
|---|---|---|---|
| Gender | Male | 216 | 96.43 |
| Female | 8 | 3.57 | |
| Sector | Owner | 8 | 3.57 |
| Construction project manager | 40 | 17.86 | |
| Construction manager | 176 | 78.57 | |
| Period of work | Less than 10 years | 146 | 65.18 |
| 11∼20 years | 66 | 29.46 | |
| More than 21 years | 12 | 5.36 | |
Table 5.
Results of Descriptive Statistics, Reliability Statistics, and Communalities.
| Descriptive Statistics | Reliability Statistics | Communalities | |||||||||
|---|---|---|---|---|---|---|---|---|---|---|---|
| Item | N | Min | Max | M | SD | SMID | SVID | CITC | CAID | In | Ex |
| Q1 | 224 | 1 | 7.000 | 3.610 | 1.698 | 222.950 | 2422.980 | 0.516 | 0.979 | 1.000 | 0.626 |
| Q2 | 224 | 1 | 7.000 | 3.750 | 1.835 | 222.820 | 2396.052 | 0.627 | 0.979 | 1.000 | 0.827 |
| Q3 | 224 | 1 | 7.000 | 3.670 | 1.812 | 222.900 | 2389.043 | 0.676 | 0.979 | 1.000 | 0.903 |
| Q4 | 224 | 1 | 7.000 | 3.520 | 1.784 | 223.040 | 2403.859 | 0.600 | 0.979 | 1.000 | 0.793 |
| Q5 | 224 | 1 | 7.000 | 3.820 | 1.795 | 222.740 | 2401.466 | 0.610 | 0.979 | 1.000 | 0.733 |
| Q6 | 224 | 1 | 7.000 | 4.710 | 1.585 | 221.850 | 2393.391 | 0.749 | 0.979 | 1.000 | 0.886 |
| Q7 | 224 | 1 | 7.000 | 4.770 | 1.561 | 221.790 | 2395.521 | 0.747 | 0.979 | 1.000 | 0.872 |
| Q8 | 224 | 1 | 7.000 | 4.820 | 1.573 | 221.750 | 2393.635 | 0.754 | 0.979 | 1.000 | 0.954 |
| Q9 | 224 | 1 | 7.000 | 4.770 | 1.609 | 221.790 | 2394.615 | 0.729 | 0.979 | 1.000 | 0.892 |
| Q10 | 224 | 1 | 7.000 | 4.820 | 1.575 | 221.750 | 2393.491 | 0.753 | 0.979 | 1.000 | 0.947 |
| Q11 | 224 | 1 | 7.000 | 4.630 | 1.525 | 221.940 | 2393.243 | 0.781 | 0.978 | 1.000 | 0.832 |
| Q12 | 224 | 1 | 7.000 | 4.320 | 1.537 | 222.250 | 2403.325 | 0.706 | 0.979 | 1.000 | 0.692 |
| Q13 | 224 | 1 | 7.000 | 4.630 | 1.471 | 221.940 | 2403.628 | 0.737 | 0.979 | 1.000 | 0.743 |
| Q14 | 224 | 1 | 7.000 | 4.630 | 1.525 | 221.940 | 2393.243 | 0.781 | 0.978 | 1.000 | 0.832 |
| Q15 | 224 | 1 | 7.000 | 4.590 | 1.302 | 221.970 | 2420.403 | 0.702 | 0.979 | 1.000 | 0.770 |
| Q16 | 224 | 1 | 7.000 | 4.600 | 1.260 | 221.960 | 2416.914 | 0.756 | 0.979 | 1.000 | 0.756 |
| Q17 | 224 | 1 | 7.000 | 4.740 | 1.294 | 221.830 | 2416.422 | 0.739 | 0.979 | 1.000 | 0.695 |
| Q18 | 224 | 1 | 7.000 | 4.860 | 1.325 | 221.710 | 2413.195 | 0.746 | 0.979 | 1.000 | 0.747 |
| Q19 | 224 | 1 | 7.000 | 5.040 | 1.535 | 221.530 | 2410.600 | 0.657 | 0.979 | 1.000 | 0.682 |
| Q20 | 224 | 1 | 7.000 | 5.140 | 1.462 | 221.420 | 2412.819 | 0.676 | 0.979 | 1.000 | 0.788 |
| Q21 | 224 | 1 | 7.000 | 4.870 | 1.395 | 221.700 | 2417.755 | 0.673 | 0.979 | 1.000 | 0.806 |
| Q22 | 224 | 1 | 7.000 | 4.880 | 1.347 | 221.690 | 2427.857 | 0.621 | 0.979 | 1.000 | 0.745 |
| Q23 | 224 | 1 | 7.000 | 4.950 | 1.365 | 221.620 | 2399.843 | 0.825 | 0.978 | 1.000 | 0.792 |
| Q24 | 224 | 1 | 7.000 | 4.920 | 1.354 | 221.640 | 2402.258 | 0.814 | 0.978 | 1.000 | 0.753 |
| Q25 | 224 | 1 | 7.000 | 4.940 | 1.364 | 221.620 | 2400.926 | 0.817 | 0.978 | 1.000 | 0.756 |
| Q26 | 224 | 1 | 7.000 | 4.770 | 1.417 | 221.790 | 2400.272 | 0.791 | 0.978 | 1.000 | 0.685 |
| Q27 | 224 | 1 | 7.000 | 4.810 | 1.326 | 221.750 | 2411.327 | 0.760 | 0.979 | 1.000 | 0.645 |
| Q28 | 224 | 1 | 7.000 | 4.950 | 1.328 | 221.620 | 2406.238 | 0.799 | 0.978 | 1.000 | 0.724 |
| Q29 | 224 | 1 | 7.000 | 4.930 | 1.377 | 221.630 | 2398.350 | 0.829 | 0.978 | 1.000 | 0.867 |
| Q30 | 224 | 1 | 7.000 | 4.970 | 1.307 | 221.590 | 2404.215 | 0.828 | 0.978 | 1.000 | 0.878 |
| Q31 | 224 | 1 | 7.000 | 4.960 | 1.337 | 221.600 | 2403.801 | 0.812 | 0.978 | 1.000 | 0.835 |
| Q32 | 224 | 1 | 7.000 | 5.080 | 1.328 | 221.480 | 2408.278 | 0.783 | 0.979 | 1.000 | 0.815 |
| Q33 | 224 | 1 | 7.000 | 4.930 | 1.361 | 221.630 | 2402.574 | 0.807 | 0.978 | 1.000 | 0.808 |
| Q34 | 224 | 1 | 7.000 | 4.940 | 1.336 | 221.620 | 2410.380 | 0.761 | 0.979 | 1.000 | 0.800 |
| Q35 | 224 | 1 | 7.000 | 5.110 | 1.521 | 221.450 | 2417.298 | 0.618 | 0.979 | 1.000 | 0.816 |
| Q36 | 224 | 1 | 7.000 | 4.770 | 1.487 | 221.790 | 2430.884 | 0.539 | 0.979 | 1.000 | 0.804 |
| Q37 | 224 | 1 | 7.000 | 4.850 | 1.586 | 221.710 | 2429.335 | 0.513 | 0.979 | 1.000 | 0.867 |
| Q38 | 224 | 1 | 7.000 | 5.010 | 1.583 | 221.550 | 2434.446 | 0.481 | 0.979 | 1.000 | 0.845 |
| Q39 | 224 | 1 | 7.000 | 5.130 | 1.499 | 221.430 | 2428.103 | 0.553 | 0.979 | 1.000 | 0.846 |
| Q40 | 224 | 1 | 7.000 | 4.700 | 1.377 | 221.860 | 2416.676 | 0.691 | 0.979 | 1.000 | 0.983 |
| Q41 | 224 | 1 | 7.000 | 4.670 | 1.368 | 221.890 | 2418.907 | 0.679 | 0.979 | 1.000 | 0.932 |
| Q42 | 224 | 1 | 7.000 | 4.700 | 1.377 | 221.860 | 2416.676 | 0.691 | 0.979 | 1.000 | 0.983 |
| Q43 | 224 | 1 | 7.000 | 4.720 | 1.347 | 221.840 | 2415.615 | 0.715 | 0.979 | 1.000 | 0.944 |
| Q44 | 224 | 1 | 7.000 | 4.700 | 1.377 | 221.860 | 2416.676 | 0.691 | 0.979 | 1.000 | 0.983 |
| Q45 | 224 | 1 | 7.000 | 4.950 | 1.466 | 221.620 | 2415.242 | 0.657 | 0.979 | 1.000 | 0.799 |
| Q46 | 224 | 1 | 7.000 | 4.820 | 1.394 | 221.750 | 2421.805 | 0.644 | 0.979 | 1.000 | 0.834 |
| Q47 | 224 | 1 | 7.000 | 5.040 | 1.420 | 221.520 | 2413.309 | 0.694 | 0.979 | 1.000 | 0.876 |
| Q48 | 224 | 1 | 7.000 | 5.090 | 1.371 | 221.470 | 2422.672 | 0.649 | 0.979 | 1.000 | 0.804 |
Note: Min = Minimum, Max = Maximum, M = Mean, SD = Std. Deviation, S = Scale, MID = Mean if Item Deleted, SVID = Scale Variance if Item Deleted, CITC = Corrected Item-Total Correlation, CAID = Cronbach’s Alpha if Item Deleted, In = Initial, Ex = Extraction.
Table 6.
Results of Descriptive Statistics, EFA and Reliability.
| Variable | Item | Rotated Component Matrix | Reliability | ||||||
|---|---|---|---|---|---|---|---|---|---|
| 1 | 2 | 3 | 4 | 5 | 6 | 7 | α | ||
| PMR | Q22 | 0.796 | 0.189 | 0.035 | 0.087 | 0.067 | 0.115 | 0.223 | 0.956 |
| Q21 | 0.786 | 0.176 | 0.093 | 0.022 | 0.071 | 0.313 | 0.214 | ||
| Q20 | 0.766 | 0.235 | 0.076 | 0.059 | 0.050 | 0.337 | 0.142 | ||
| Q15 | 0.752 | 0.171 | 0.325 | 0.187 | 0.176 | 0.056 | 0.016 | ||
| Q19 | 0.725 | 0.112 | 0.228 | 0.114 | 0.121 | 0.249 | 0.053 | ||
| Q16 | 0.709 | 0.261 | 0.285 | 0.225 | 0.195 | 0.105 | 0.072 | ||
| Q18 | 0.664 | 0.396 | 0.092 | 0.222 | 0.173 | 0.101 | 0.227 | ||
| Q17 | 0.662 | 0.310 | 0.240 | 0.157 | 0.204 | 0.102 | 0.165 | ||
| Q25 | 0.502 | 0.419 | 0.178 | 0.201 | 0.215 | 0.328 | 0.319 | ||
| Q24 | 0.472 | 0.435 | 0.216 | 0.128 | 0.273 | 0.311 | 0.325 | ||
| Q26 | 0.455 | 0.309 | 0.232 | 0.221 | 0.239 | 0.349 | 0.317 | ||
| Q27 | 0.433 | 0.395 | 0.173 | 0.303 | 0.231 | 0.184 | 0.305 | ||
| PCER | Q8 | 0.290 | 0.844 | 0.303 | 0.174 | 0.033 | 0.163 | 0.084 | 0.964 |
| Q10 | 0.288 | 0.840 | 0.301 | 0.166 | 0.034 | 0.178 | 0.088 | ||
| Q9 | 0.278 | 0.815 | 0.264 | 0.188 | 0.025 | 0.194 | 0.081 | ||
| Q7 | 0.299 | 0.793 | 0.295 | 0.122 | 0.097 | 0.171 | 0.115 | ||
| Q6 | 0.304 | 0.792 | 0.318 | 0.151 | 0.046 | 0.157 | 0.123 | ||
| Q23 | 0.461 | 0.481 | 0.192 | 0.153 | 0.213 | 0.343 | 0.352 | ||
| Q28 | 0.385 | 0.459 | 0.248 | 0.188 | 0.239 | 0.223 | 0.402 | ||
| PESR | Q3 | 0.177 | 0.243 | 0.859 | 0.187 | 0.014 | 0.083 | 0.178 | 0.945 |
| Q2 | 0.123 | 0.224 | 0.835 | 0.146 | 0.017 | 0.138 | 0.153 | ||
| Q4 | 0.105 | 0.211 | 0.815 | 0.150 | 0.050 | 0.033 | 0.217 | ||
| Q5 | 0.112 | 0.287 | 0.760 | 0.147 | 0.009 | 0.155 | 0.119 | ||
| Q1 | 0.125 | 0.013 | 0.681 | 0.105 | 0.163 | 0.328 | -0.039 | ||
| Q14 | 0.489 | 0.338 | 0.612 | 0.213 | 0.209 | 0.108 | -0.055 | ||
| Q11 | 0.489 | 0.338 | 0.612 | 0.213 | 0.209 | 0.108 | -0.055 | ||
| Q12 | 0.370 | 0.288 | 0.595 | 0.144 | 0.295 | 0.104 | -0.010 | ||
| Q13 | 0.496 | 0.370 | 0.513 | 0.177 | 0.201 | 0.128 | -0.092 | ||
| CPR | Q44 | 0.163 | 0.164 | 0.192 | 0.897 | 0.141 | 0.164 | 0.202 | 0.992 |
| Q42 | 0.163 | 0.164 | 0.192 | 0.897 | 0.141 | 0.164 | 0.202 | ||
| Q40 | 0.163 | 0.164 | 0.192 | 0.897 | 0.141 | 0.164 | 0.202 | ||
| Q41 | 0.148 | 0.139 | 0.221 | 0.865 | 0.157 | 0.154 | 0.215 | ||
| Q43 | 0.176 | 0.188 | 0.175 | 0.848 | 0.171 | 0.193 | 0.248 | ||
| PCSR | Q37 | 0.129 | 0.034 | 0.133 | 0.176 | 0.888 | 0.094 | 0.059 | 0.885 |
| Q38 | 0.125 | 0.098 | -0.020 | 0.100 | 0.878 | 0.158 | 0.121 | ||
| Q39 | 0.287 | -0.017 | 0.099 | 0.097 | 0.833 | 0.097 | 0.203 | ||
| Q36 | 0.070 | 0.029 | 0.166 | 0.163 | 0.819 | 0.180 | 0.200 | ||
| Q35 | 0.164 | 0.199 | 0.070 | 0.123 | 0.774 | 0.171 | 0.319 | ||
| PMC | Q34 | 0.342 | 0.172 | 0.262 | 0.236 | 0.254 | 0.659 | 0.174 | 0.962 |
| Q30 | 0.338 | 0.333 | 0.233 | 0.281 | 0.248 | 0.655 | 0.171 | ||
| Q32 | 0.313 | 0.330 | 0.182 | 0.274 | 0.191 | 0.643 | 0.223 | ||
| Q31 | 0.356 | 0.279 | 0.240 | 0.272 | 0.210 | 0.630 | 0.240 | ||
| Q29 | 0.419 | 0.240 | 0.246 | 0.305 | 0.256 | 0.628 | 0.140 | ||
| Q33 | 0.363 | 0.278 | 0.222 | 0.236 | 0.299 | 0.603 | 0.204 | ||
| CPSSM | Q46 | 0.111 | 0.136 | 0.139 | 0.367 | 0.228 | 0.241 | 0.735 | 0.947 |
| Q47 | 0.339 | 0.096 | 0.065 | 0.364 | 0.287 | 0.152 | 0.714 | ||
| Q45 | 0.213 | 0.101 | 0.155 | 0.327 | 0.278 | 0.164 | 0.713 | ||
| Q48 | 0.207 | 0.165 | 0.082 | 0.312 | 0.329 | 0.120 | 0.712 | ||
| Initial Eigenvalues | 25.169 | 4.278 | 3.076 | 2.449 | 1.661 | 1.300 | 1.261 | ||
| % of Variance | 52.435 | 8.913 | 6.408 | 5.103 | 3.461 | 2.708 | 2.627 | ||
| Cumulative % | 52.435 | 61.348 | 67.756 | 72.859 | 76.320 | 79.028 | 81.655 | ||
| KMO=0.838, Bartlett’s Chi-Square=2138.321, df=1128 (p<.001) | |||||||||
Note: Extraction Method = Principal Component Analysis, Rotation Method = Varimax with Kaiser Normalization and Rotation converged in 7 iterations, α = Cronbach’s Alpha.
Table 7.
Pearson Correlation analysis.
| PMR | PCER | PESR | CPR | PCSR | PMC | CPSSM | ||
|---|---|---|---|---|---|---|---|---|
| PMR | PC | 1.000 | 0.480** | 0.308** | 0.335** | 0.214** | 0.467** | 0.322** |
| Sig. | 0.000 | 0.000 | 0.000 | 0.001 | 0.000 | 0.000 | ||
| N | 224 | 224 | 224 | 224 | 224 | 224 | 224 | |
| PCER | PC | 0.480** | 1.000 | 0.581** | 0.451** | 0.188** | 0.498** | 0.381** |
| Sig. | 0.000 | 0.000 | 0.000 | 0.005 | 0.000 | 0.000 | ||
| N | 224 | 224 | 224 | 224 | 224 | 224 | 224 | |
| PESR | PC | 0.308** | 0.581** | 1.000 | 0.463** | 0.215** | 0.477** | 0.363** |
| Sig. | 0.000 | 0.000 | 0.000 | 0.001 | 0.000 | 0.000 | ||
| N | 224 | 224 | 224 | 224 | 224 | 224 | 224 | |
| CPR | PC | 0.335** | 0.451** | 0.463** | 1.000 | 0.365** | 0.519** | 0.607** |
| Sig. | 0.000 | 0.000 | 0.000 | 0.000 | 0.000 | 0.000 | ||
| N | 224 | 224 | 224 | 224 | 224 | 224 | 224 | |
| PCSR | PC | 0.214** | 0.188** | 0.215** | 0.365** | 1.000 | 0.421** | 0.383** |
| Sig. | 0.001 | 0.005 | 0.001 | 0.000 | 0.000 | 0.000 | ||
| N | 224 | 224 | 224 | 224 | 224 | 224 | 224 | |
| PMC | PC | 0.467** | 0.498** | 0.477** | 0.519** | 0.421** | 1.000 | 0.531** |
| Sig. | 0.000 | 0.000 | 0.000 | 0.000 | 0.000 | 0.000 | ||
| N | 224 | 224 | 224 | 224 | 224 | 224 | 224 | |
| CPSSM | PC | 0.322** | 0.381** | 0.363** | 0.607** | 0.383** | 0.531** | 1.000 |
| Sig. | 0.000 | 0.000 | 0.000 | 0.000 | 0.000 | 0.000 | ||
| N | 224 | 224 | 224 | 224 | 224 | 224 | 224 | |
Note: PC = Pearson Correlation, ** = Correlation is significant at the 0.01 level (2-tailed).
Table 8.
Analysis of influencing factors cost deviation.
| H | DV | IV | B | S.E. | Wald | P | OR | 95% C.I.for EXP(B) | |
|---|---|---|---|---|---|---|---|---|---|
| Lower | Upper | ||||||||
| H1 | CD | PMR | 1.320 | 0.416 | 10.082 | 0.001 | 3.744 | 1.657 | 8.457 |
| H2 | CD | PCER | 1.623 | 0.417 | 15.117 | 0.000 | 5.068 | 2.236 | 11.484 |
| H3 | CD | PESR | 1.238 | 0.317 | 15.265 | 0.000 | 3.447 | 1.853 | 6.413 |
| H4 | CD | CPR | 0.829 | 0.413 | 4.030 | 0.045 | 2.292 | 1.020 | 5.151 |
| H5 | CD | PCSR | 1.572 | 0.389 | 16.375 | 0.000 | 4.817 | 2.250 | 10.317 |
| H6 | CD | PMC | 1.083 | 0.363 | 8.929 | 0.003 | 2.954 | 1.452 | 6.013 |
| H7 | CD | CPSSM | 0.884 | 0.318 | 7.705 | 0.006 | 2.419 | 1.297 | 4.515 |
| Constant | -39.529 | 7.301 | 29.315 | 0.000 | 0.000 | ||||
| Omnibus Tests of Model Coefficients: Chi-square=243.734, df=7, P=0.000 | |||||||||
| Model Summary: -2 Log likelihood=66.635, Cox & Snell R Square=0.663, Nagelkerke R Square=0.884 | |||||||||
| Hosmer and Lemeshow Test: Chi-square=3.559, df=8, P=0.895 | |||||||||
| Classification Table: Observed Cost Diviation Predicted Percentage 0=95.4, 1=93.0, Overall Percentage=94.2 | |||||||||
Note: H = Hypothesis, DV = Dependent Variable, IV = Independent Variable, CD = Cost Deviation, C = Constant.
Disclaimer/Publisher’s Note: The statements, opinions and data contained in all publications are solely those of the individual author(s) and contributor(s) and not of MDPI and/or the editor(s). MDPI and/or the editor(s) disclaim responsibility for any injury to people or property resulting from any ideas, methods, instructions or products referred to in the content. |
© 2023 by the authors. Licensee MDPI, Basel, Switzerland. This article is an open access article distributed under the terms and conditions of the Creative Commons Attribution (CC BY) license (http://creativecommons.org/licenses/by/4.0/).
Copyright: This open access article is published under a Creative Commons CC BY 4.0 license, which permit the free download, distribution, and reuse, provided that the author and preprint are cited in any reuse.