1. Introduction
Through the continuous development and improvement of optimization methods, structural optimization design has made significant progress in various engineering fields [
1,
2,
3,
4,
5,
6]. Structural topology optimization, as an effective method, is often used to obtain more novel design solutions and effectively improve structural performance. The importance of topology optimization methods is self-evident. However, in general, the optimal designs obtained by topology optimization method are often similar to the efficient design of statically structures. About these structures, the utilization rate of materials reaches the limit, the structures lack redundancy and are prone to the loss of structural stiffness caused by material damage. Especially in the face of structural stiffness loss caused by material defects, vibration impact and various environmental factors, its ability to resist risks is very limited [
7,
8,
9]. Even a small structural stiffness failure will lead to a sharp decline in the performance of the whole structure. In the engineering field, the demand for safety is usually far greater than the demand for cost reduction. Therefore, the research on reducing the sharp decline of structural performance caused by local damage in engineering structures is attracting more and more attention.
Based on the traditional topology optimization design, the fail-safe optimization method improves the ability of the structure to resist local damage scenarios [
10,
11,
12,
13,
14]. Considering the essence of fail-safe requirements, a simplified local damage model is introduced into the topology optimization process of fail-safe design to simulate the complex local damage phenomenon of the structure. In the process of structural optimization, all possible effects of structural local damage will be considered. On the premise of reducing the influence of local damage of the structure, the optimal design with strong redundancy is obtained. Compared with traditional topology design [
15,
16,
17], fail-safe optimization design has strong robustness in resisting risks, and can continue to operate until the location of local damage is repaired or the components are repositioned.
However, many local damage scenarios need to be considered in the process of fail-safe optimization, because each local damage scenario requires separate finite element analysis and sensitivity calculation, so compared with the traditional structural topology optimization algorithm, its calculation amount is very huge. For the determined optimization model, the calculation amount of the fail-safe optimization algorithm is usually many times that of the traditional topology optimization algorithm. In order to reduce the amount of computation required by the fail-safe optimization design, this paper filters the local failure scenarios when traversing the local damage scenarios, and improves the efficiency of the fail-safe structural optimization method by reducing the amount of computation caused by excessive local damage scenarios.
Aiming at some problems existing in the above research, scholars established a strict framework for the fail-safe topology optimization of general three-dimensional structures, and developed a computationally feasible solution for industrial applications. Then, the effectiveness of the proposed method was proved by corresponding numerical examples. Based on the independent continuous mapping method, combined with the discrete conditions of topology variables and fundamental frequency constraints, the fail-safe topology optimization model was established and solved [
18,
19,
20]. The numerical results show that, compared with the traditional frequency topology optimization design, the optimized fail-safe structure has more complex structure and more complete materials, obtaining higher redundancy and avoiding the sensitivity of structural frequency to local damage. Using the material characteristics of Von-Mises stress interpolation damage model, established an optimization model to obtain fail-safe structural design, and proposed an extended variable update scheme within the framework of optimality criterion method to suppress highly nonlinear stress behavior and optimize oscillation. Relevant benchmark tests show that the proposed strategy is effective in the process of obtaining the corresponding fail-safe design [
21,
22,
23,
24].
In order to reduce the amount of computation required by the fail-safe optimization design, on the basis of the above research, this paper introduces an algorithm based on density filtering, which filters the local damage scenarios when traversing the local damage scenarios, so as to reduce the amount of computation caused by excessive local damage scenarios, thereby improving the efficiency of the fail-safe structure optimization method Compared with the traditional structural topology optimization algorithm [
25,
26,
27,
28,
29], the design obtained by the improved fail-safe optimization algorithm has better robustness. Besides, compared with the traditional fail-safe topology optimization algorithm, the calculation amount of the whole optimization process has also been significantly reduced on the premise that the effective fail-safe structural de-sign could be obtained.
The remaining organization of this paper is as follows. In
Section 2, we provide a detailed exposition of the theory of failure-safe topology optimization and the density-filter-based failure-safe optimization method. In
Section 3, the algorithm based on density filtering is compared with standard failure-safe optimization algorithms to validate the effectiveness of the density-filter-based failure-safe optimization method. Furthermore, the impact of density thresholds on the failure-safe optimization method is investigated. Finally, in
Section 4, an analysis and summary of the work presented in this paper are conducted, addressing potential issues and outlining avenues for future research.
2. Theory of fail-safe structural topology optimization
In this section, the basic theory of fail-safe topology optimization is discussed. For topology optimization of linear elastic materials, Young's modulus
Ee could be obtained by the modified the Solid Isotropic Material with Penalization (SIMP) [
4,
30,
31] given, as shown in (1), where
E0 is the elastic modulus of solid materials,
p is the penalty coefficient of void phase materials, and is the design variable of the optimization problem, that is, the unit density,
Emin is the elastic modulus of void materials, which is used to avoid the singularity and non-zero of the finite element stiffness matrix.
2.1. Theory of fail-safe topology optimization
The design domain of a given continuum structure Ω is discretized by N finite elements, and each element is associated with a relative density
varying in the range of [0, 1]. The compliance minimization design formula of classical deterministic topology optimization is as follows:
where
is the vector of structural topology design variables,
is the compliance of the structure,
is the stiffness matrix of the structure;
U is the displacement vector generated by the load vector
F acting on the structure;
V and
Vmax are respectively the material volume in the structural design domain and the material volume after the structural optimization design.
In order to establish the mathematical model of fail-safe topology optimization, the element stiffness matrix of local damage model needs to be established. By setting the material stiffness of components in the damage area of predefined size as
Emin, the corresponding element set is expressed as
, and the remaining element set without local damage is expressed as
, where
Ne is the set of all elements in the whole structure, and then the overall stiffness matrix of the structure is expressed as:
The overall stiffness
of the structure can be obtained by integrating the element stiffness matrix
of the damage area and the element stiffness matrix
of the non-damage area, where m represents the local damage scenario of the m-th structure and j is the element number. Then, the finite equilibrium equation is established and the structural compliance
under the m-th damage scenarios solved by:
When the design domain and local damage domain are determined, different local damage would cause different effects in different locations in the design domain. The fail-safe topology optimization method takes all the possible effects of local damage into account, and could obtain optimal structure that is not sensitive to local damage at the same time. It is defined here as the total number of local damage scenarios to be considered in an optimization iteration. For the structural design obtained in each optimization iteration, the most dangerous damage scenario is determined by comparing the structural strain energy under different damage scenarios, and the minimum structural strain energy under the most serious damage scenario is taken as the objective function. The mathematical model of topology optimization of fail-safe structure is obtained.
Where,
represents the modified objective function, and
and
represent the node displacement vector and node load vector of the structure in the global coordinate system respectively.
and
represent the total volume of the structure and the maximum volume constraint in the optimization problem respectively.
K is the integral stiffness matrix of the structure integrated by the element stiffness matrix in order to establish the equilibrium equation and then obtain the displacement field. In the formula, it represents the strain energy of the structure under the m-th damage scenarios. γ is a regularization parameter, which determines the size of the envelope space composed of variable
, the value suggested in the relevant literature can vary from 1 to 100:
2.2. Sensitivity analysis
There exist many design variables in the fail-safe topology optimization problem, and the finite element method is usually used to solve the problem, in this process, each analysis needs to reassemble the stiffness matrix and solve the multi-element equilibrium equation, so the optimization criterion method is an ideal choice. In this section, based on the SIMP material interpolation theory, the optimization criterion algorithm in the fail-safe optimization problem is studied in detail. The optimization criterion method formula described by Lagrange function for updating design variables is derived from the objective function and constraint conditions. The Lagrange function corresponding to the optimization problem in the previous section is constructed as follows:
In the Eq.(7),
are the Lagrange multipliers, and for the topology optimization problem of fail-safe structure,
is the matrix composed of
. When
takes the extreme value, the above Lagrange function would meet the Kuhn-Tucker condition as follows:
After establishing the mathematical model for topology optimization of fail-safe structures, similar to standard topology optimization, it is necessary to solve the sensitivity information required when updating the design variables, that is, the sensitivity calculation of the objective function obtained by KS function with respect to the cell density. According to the chain derivation rule, the partial derivative of the objective function with respect to the unit density is expressed as:
In Eq.(9), For the convenience of description, let
,
, the constraint condition is the calculation of the sensitivity information of the volume fraction to the design variable:
In the formula(10), after merging, the above formula can be reduced to:
In Eq.(11), make the left side of the equation equal to 0 and the following results could be obtained by:
It represents the deformation energy of the structure under local damage, and the proportion of the second local failure scenario in all failure scenarios. Next, we can construct a density iteration scheme for topology optimization of fail-safe structures, as follows:
Compared with the traditional topology optimization method, is added to the density iteration scheme. The existence of makes the fail-safe topology optimization method give priority to those local damage scenarios that cause a sharp increase in structural strain energy, and reduce the adverse effects caused by these damage scenarios by adjusting the optimization direction.
2.3. Damage scenaios filtering
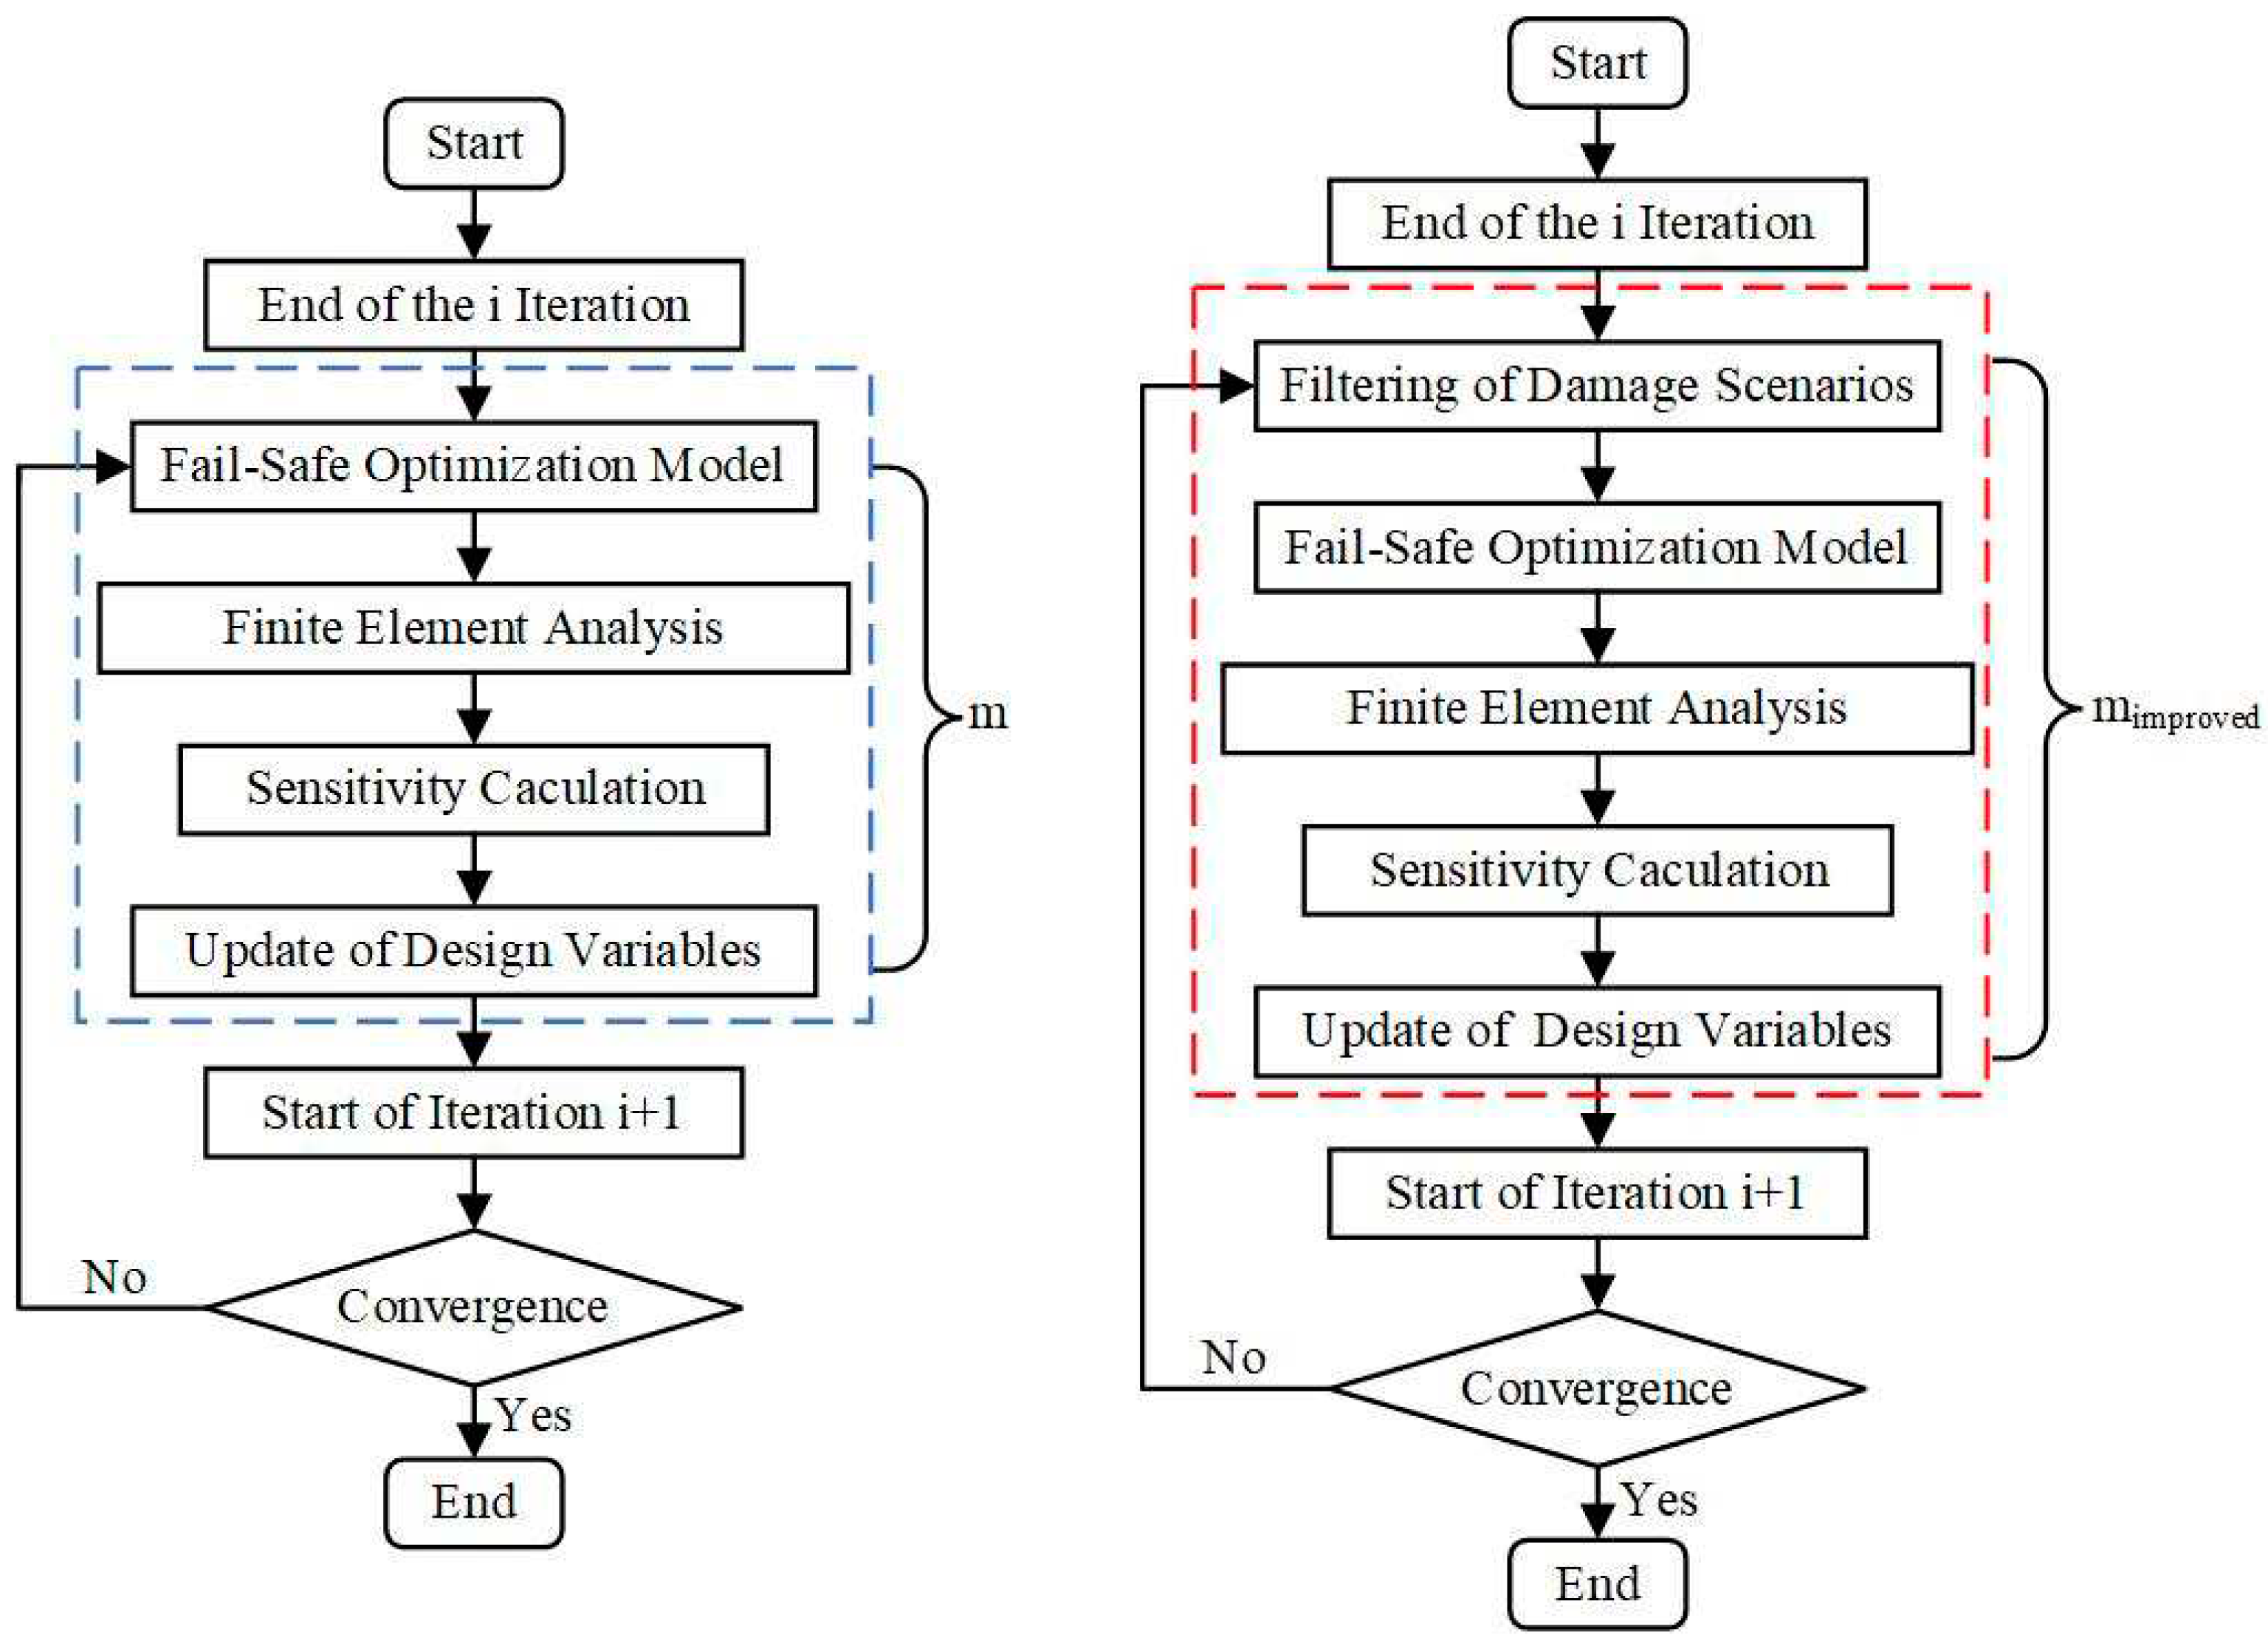
Generally speaking, there are two main factors that lead to the large amount of calculation in the topology optimization method of fail-safe structure. The first is to solve the structural finite element equation and calculate the sensitivity information in every case of local damage. The second is the number of local damage scenarios to be considered in the optimization process, because each local damage scenario needs to obtain the optimization information.
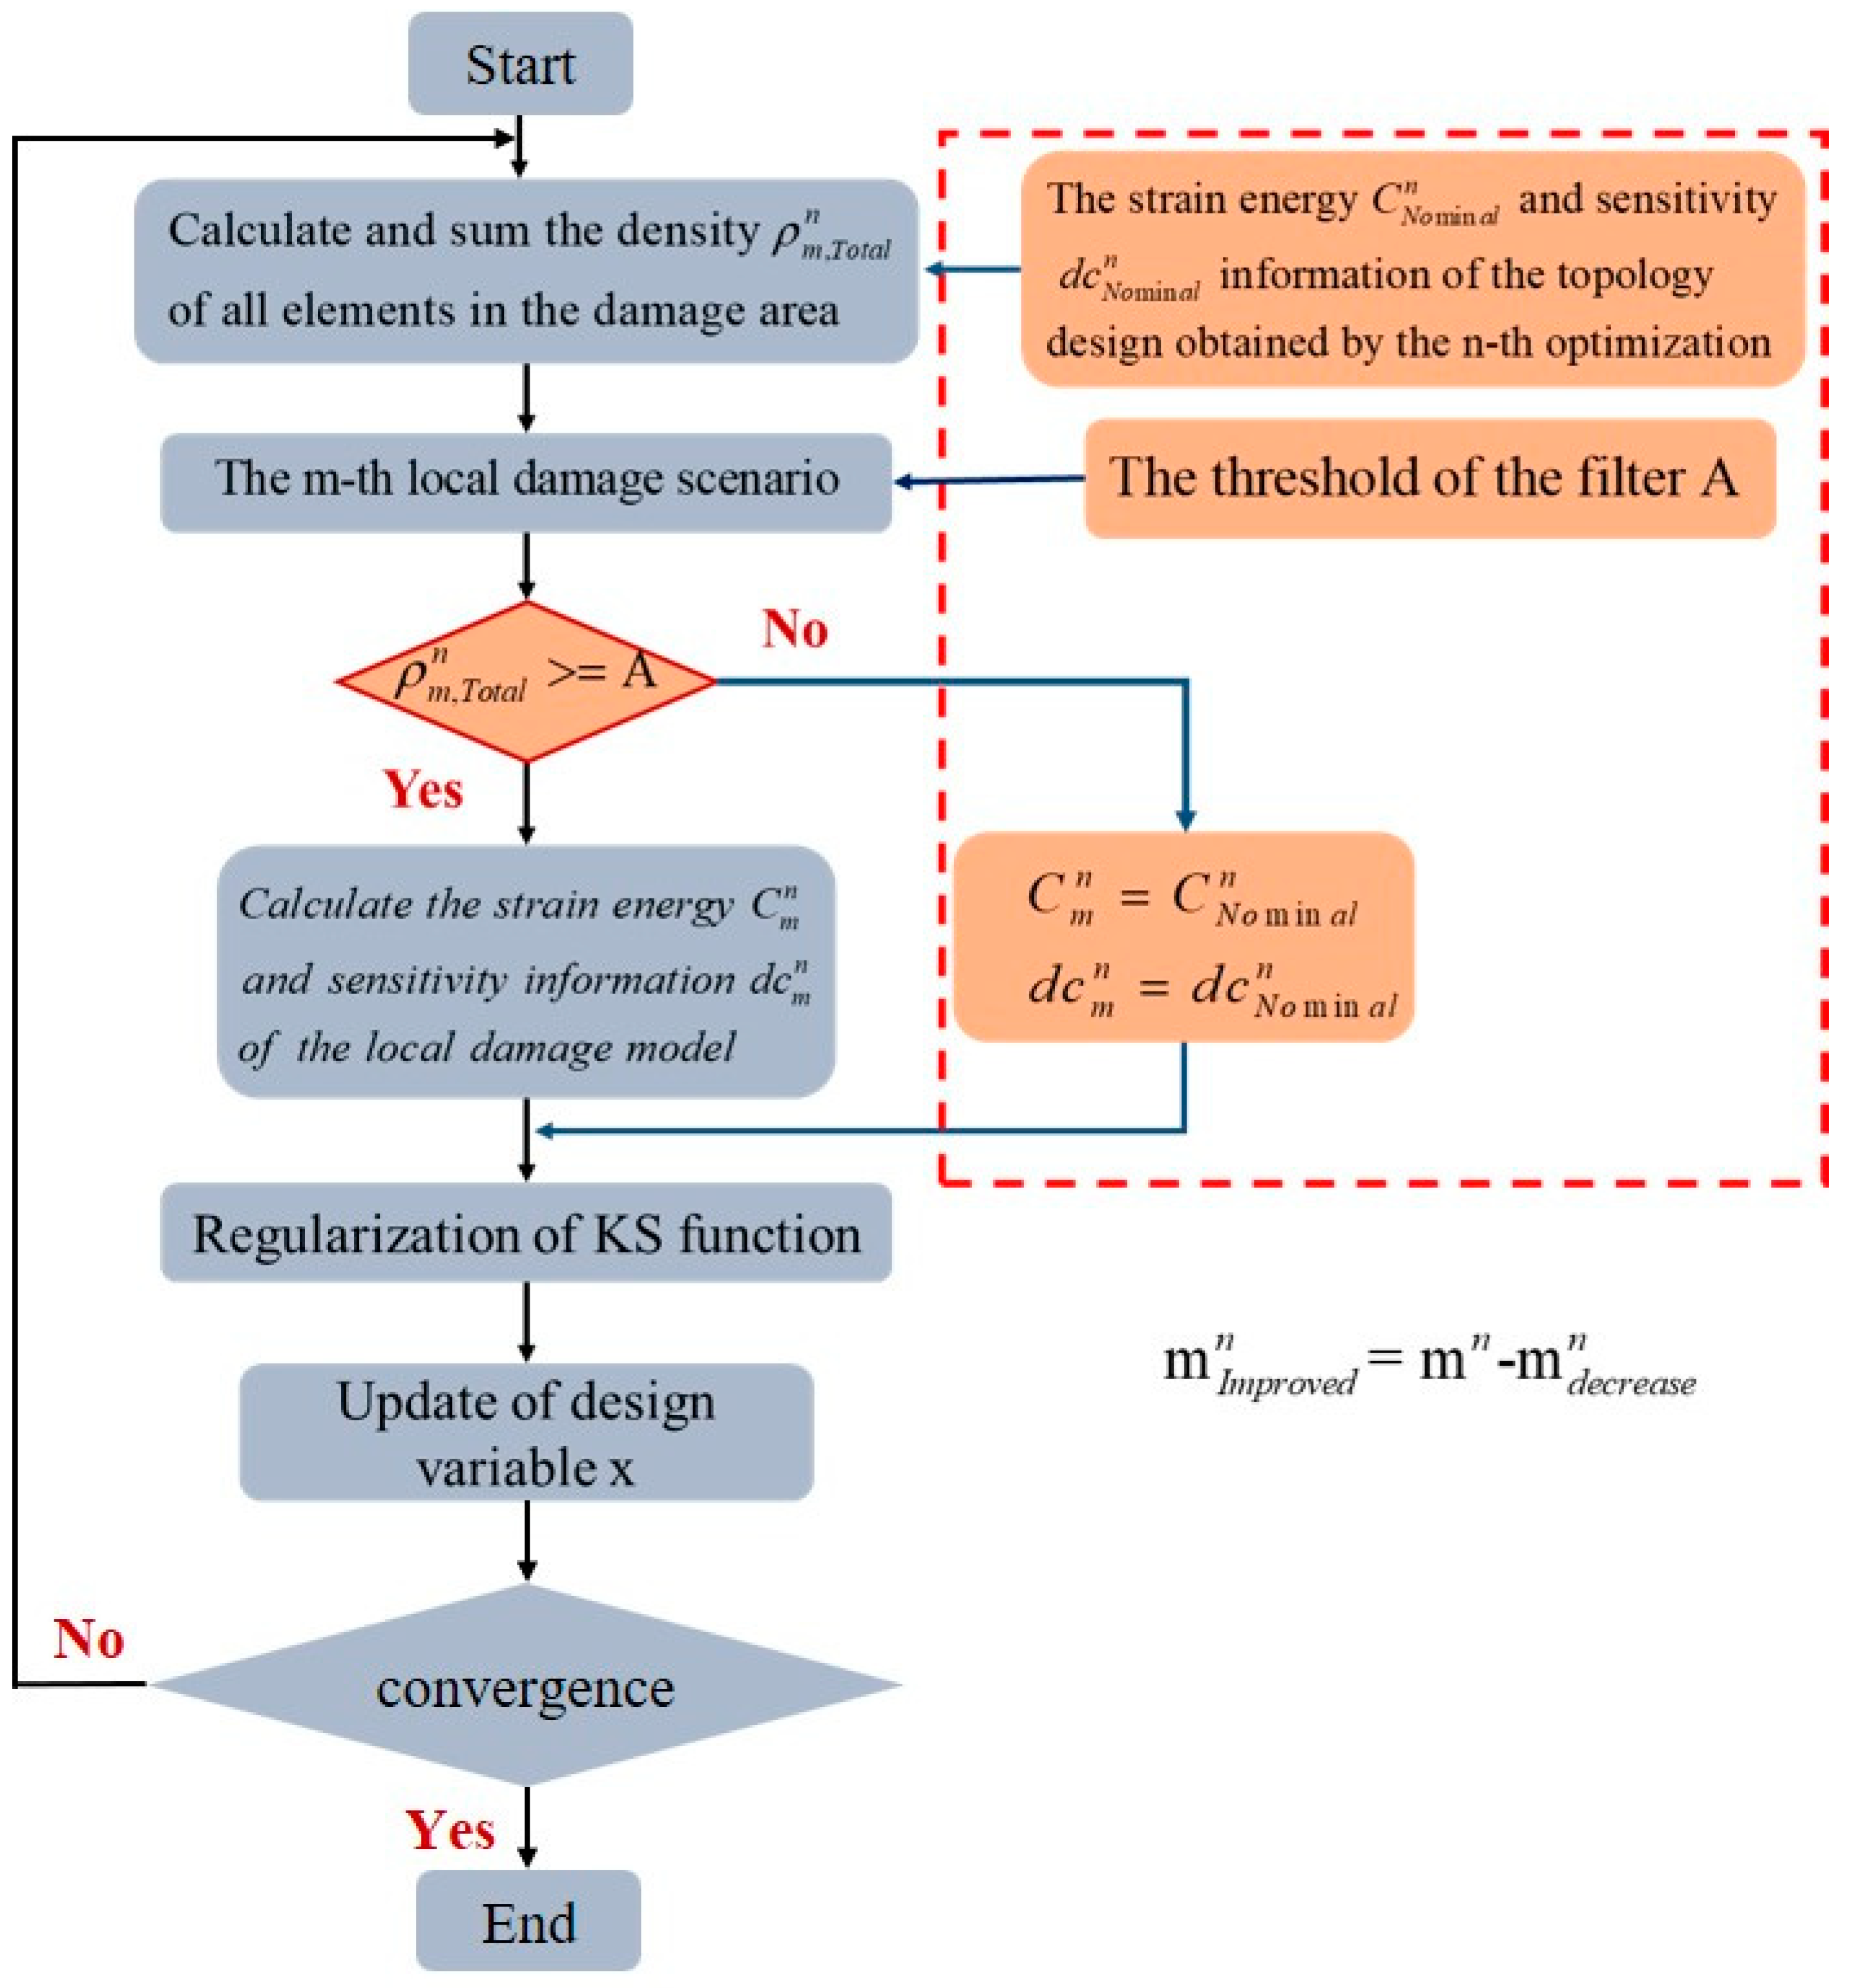
Figure 1 shows the optimization process in the n-th iteration,
represent the number of damage scenarios to be considered,
is the reduced number of damage scenarios and
represent the number of damage scenarios to be considered after the improved algorithm are adopted.
For the first case, the combined approximate reanalysis method can be used to improve the efficiency of obtaining optimization information. The second case is also the main research content of this paper. By extending the activation set method, this method can be considered as reducing the calculation amount of fail-safe structure optimization by simplifying the number of local damage scenarios.
Aiming at the problems existing in the standard fail-safe topology optimization, this paper calculates the element density in the dimensioned local damage area using a density-based filter, and then judges the impact of local damage on the structure, so as to eliminate the situation that there are no elements or few elements in the local damage area, because in the above case. Even if the stiffness of some materials in the design domain is lost, it will not have a significant impact on the structure.
In the above case, the sensitivity calculation in the local damage scenario is no longer required, and the corresponding sensitivity information in the damage scenario only needs to be used as the sensitivity information when the structure has no local damage. Referring to
Figure 2, it could be understood that the differences between the traditional topology optimization method, the fail-safe topology optimization method and the improved fail-safe optimization method adopted in this paper, especially in the number of finite element analysis and sensitivity calculation in the optimization process. A is defined as the sum of unit densities in the damage area,
. The effectiveness of damage scenarios is judged according to whether the sum of unit densities in the damage area exceeds the set threshold. The number of damage scenarios is reasonably adjusted by adjusting the threshold to improve the calculation efficiency of the fail-safe optimization method.
3. Numerical benchmarks
This section would show the performance of the proposed fail-safe improvement method by comparing with the traditional fail-safe topology optimization. From now on, the traditional fail-safe topology optimization is called as general fail-safe optimization method. It should be noted that although no overlapping patch distribution is sufficient to achieve a suitable solution, its disadvantages are also obvious. Therefore, in order to obtain a standard fail-safe optimization design, the Jansen's fail-safe framework is used in most examples. In all subsequent chapters, if there is no special description, it is uniformly assumed that the young's modulus of solid material E = 1 MPa and Poisson's ratio u = 0.3. In the following example, referring to the suggestions of Zhou and combined with the actual situation of fail-safe topology optimization, the maximum number of iterations defined in the relevant examples of cantilever beam is 250, and the maximum number of iterations defined in the relevant examples of L-shaped beam is 100.
3.1. Cantilever beam
Taking the cantilever beam often discussed in many references as an example, as shown in
Figure 3, the design domain of the cantilever beam is discretized, which is composed of 120 * 40 elements, and the whole design domain contains a total of 4800 elements. Support the left edge of the cantilever beam and apply a vertical load f = 1 N in the lower right corner. The volume fraction of solid material to be preserved is limited to 0.4.
It represents the deformation energy of the structure under local damage, and the proportion of the second local failure scenario in all failure scenarios. Next, we can construct a density iteration
Firstly, the cantilever beam is optimized so that the patch size is 5 * 5 mm2. In addition, the local damage near the loading position, that is, at the red arrow, is not considered in the optimization process. The loading conditions are kept unchanged and the influence of stress concentration at the loading point is avoided.
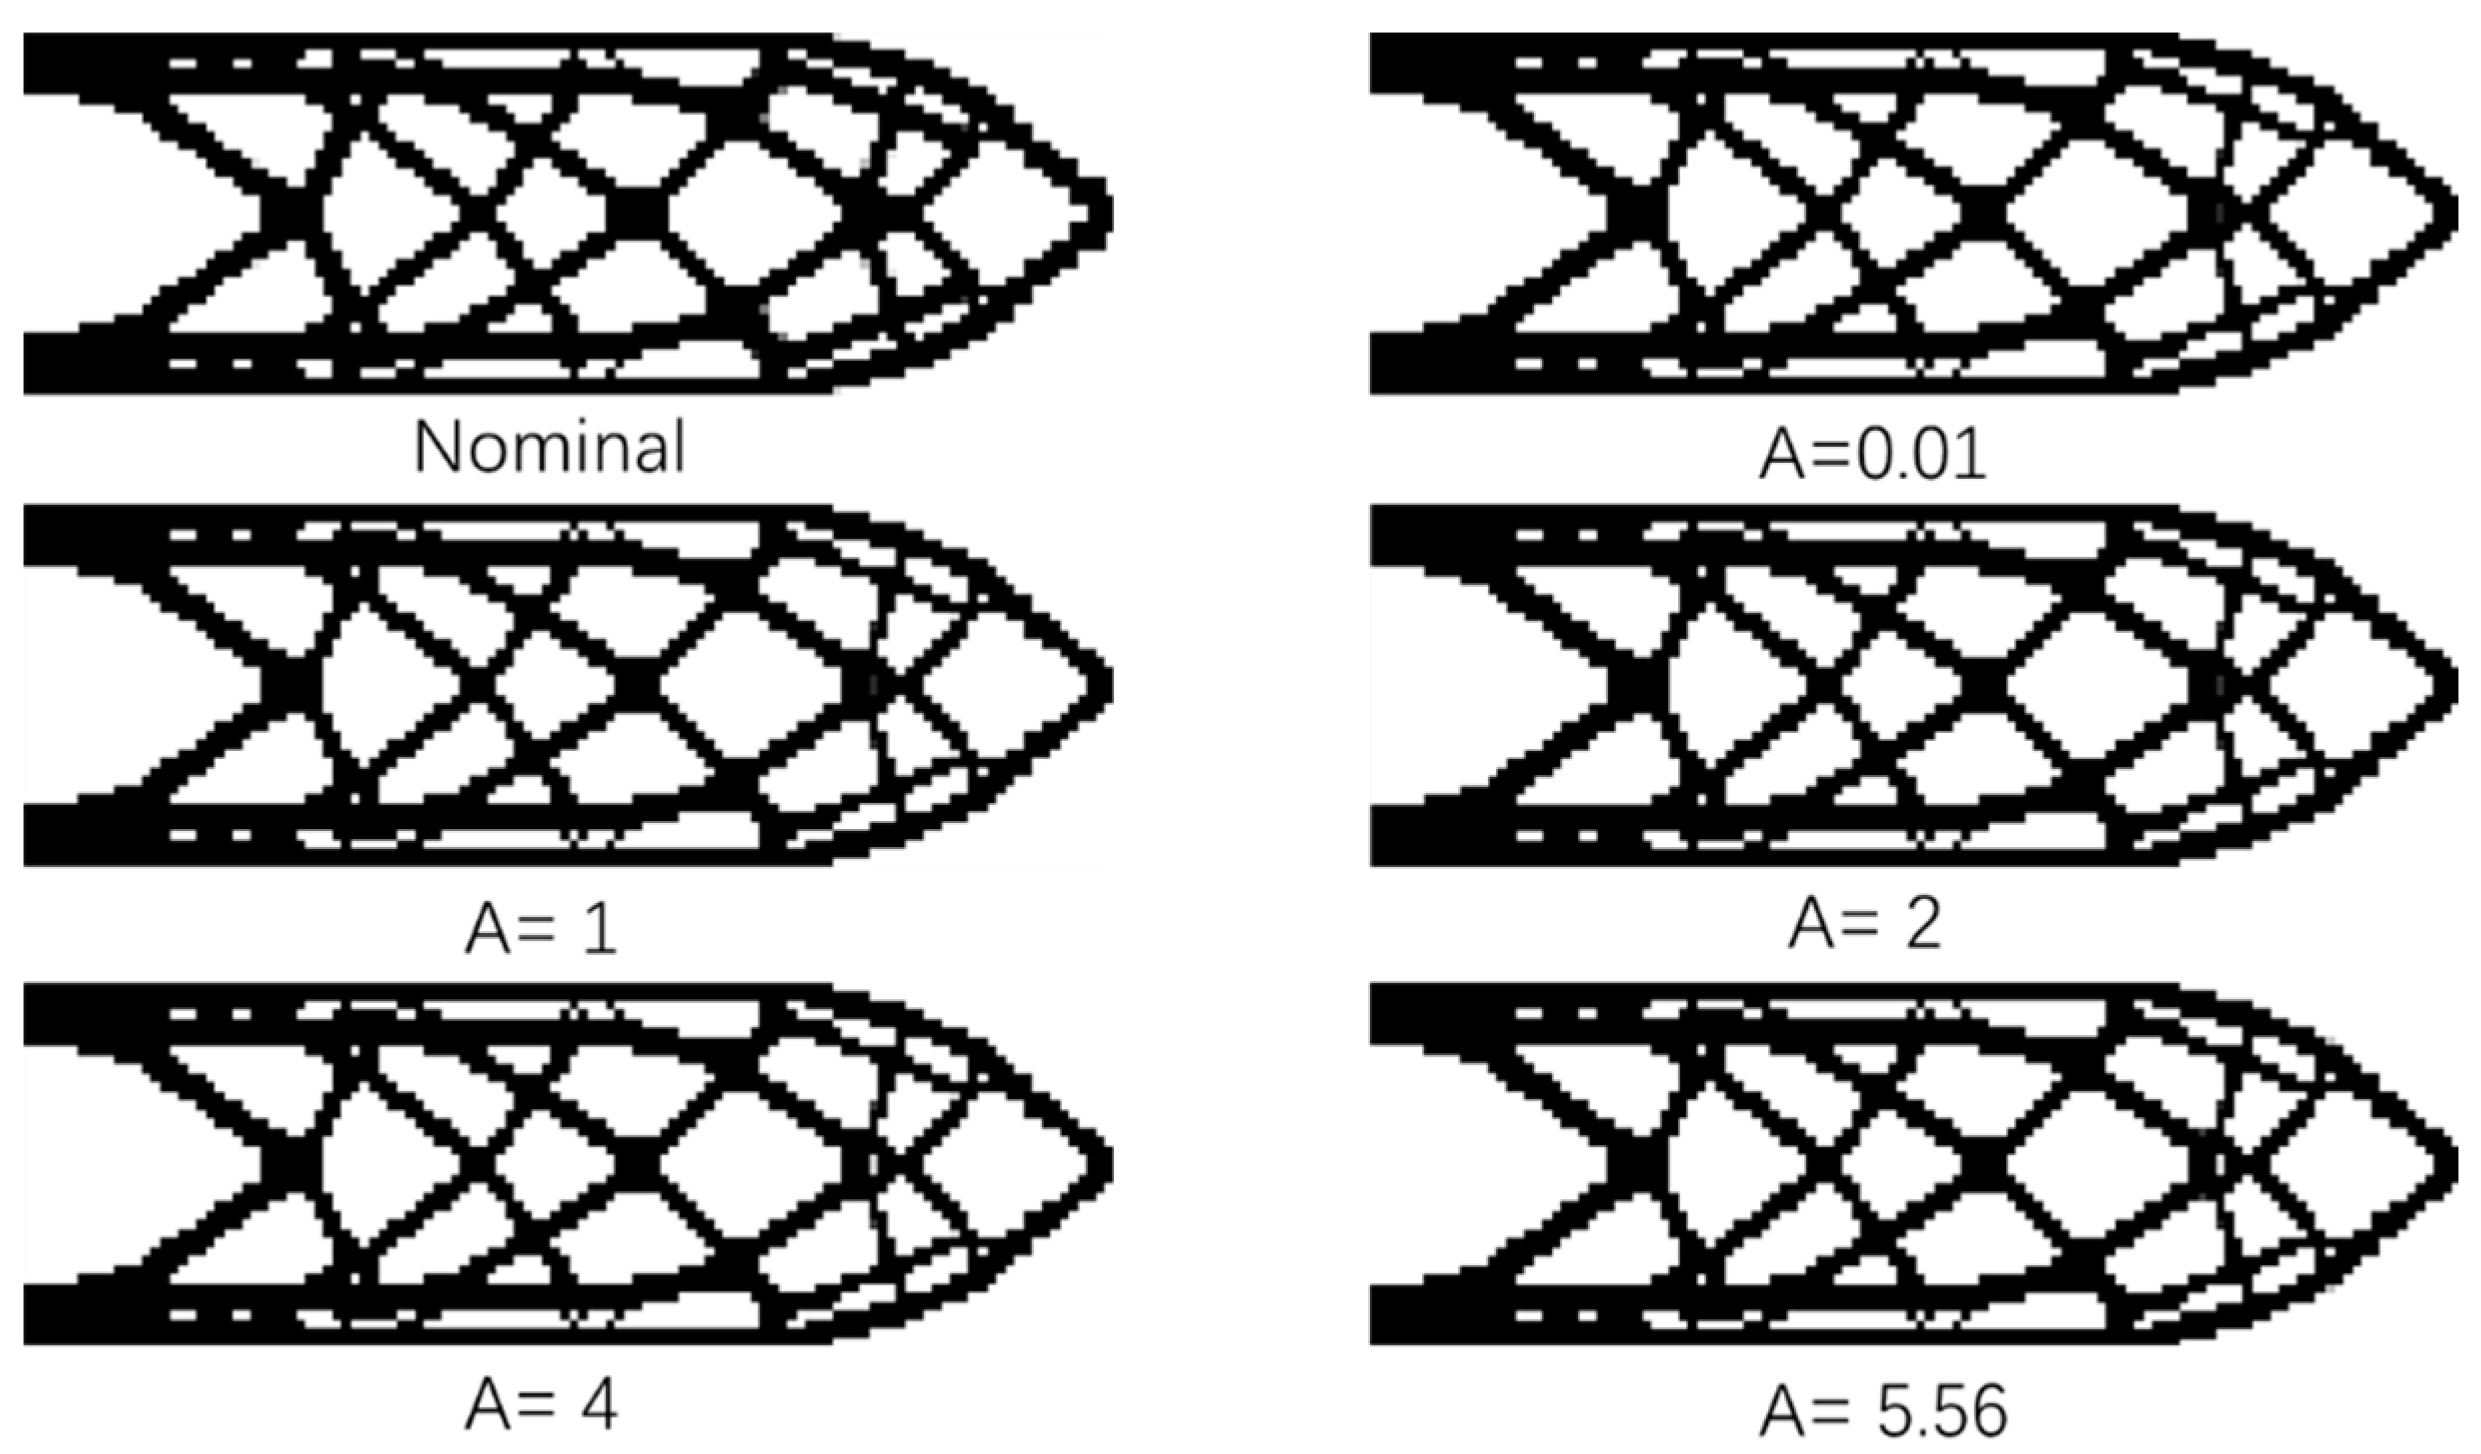
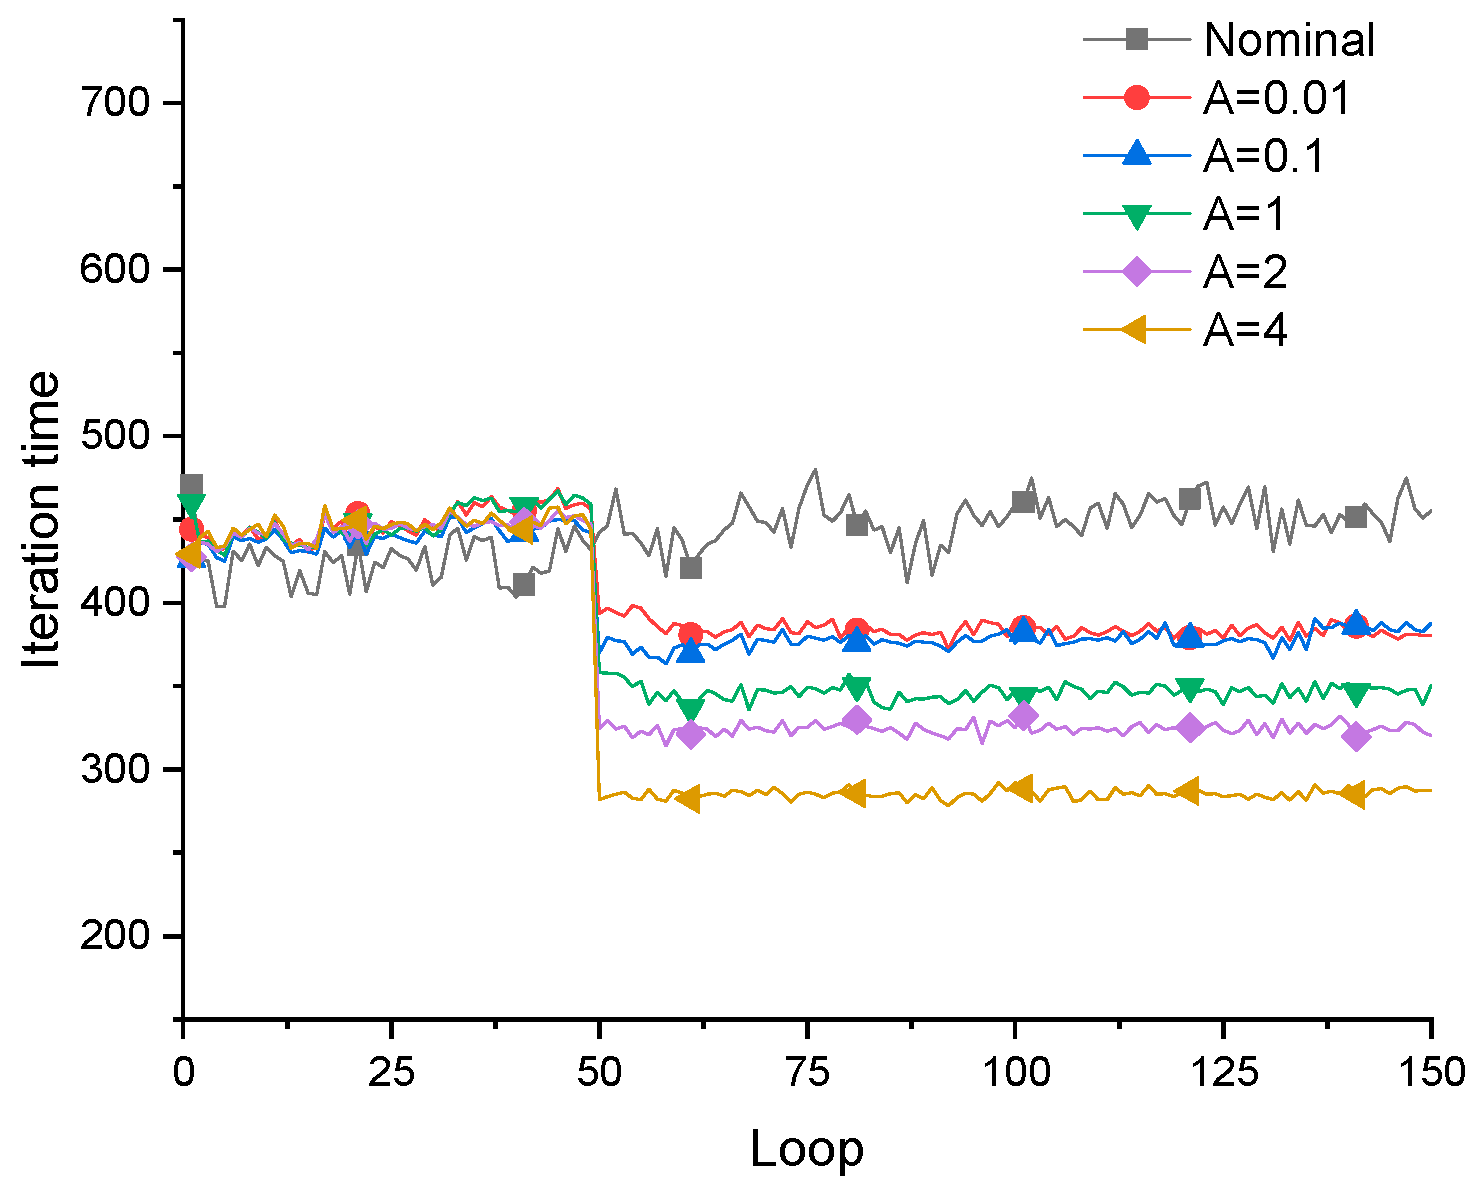
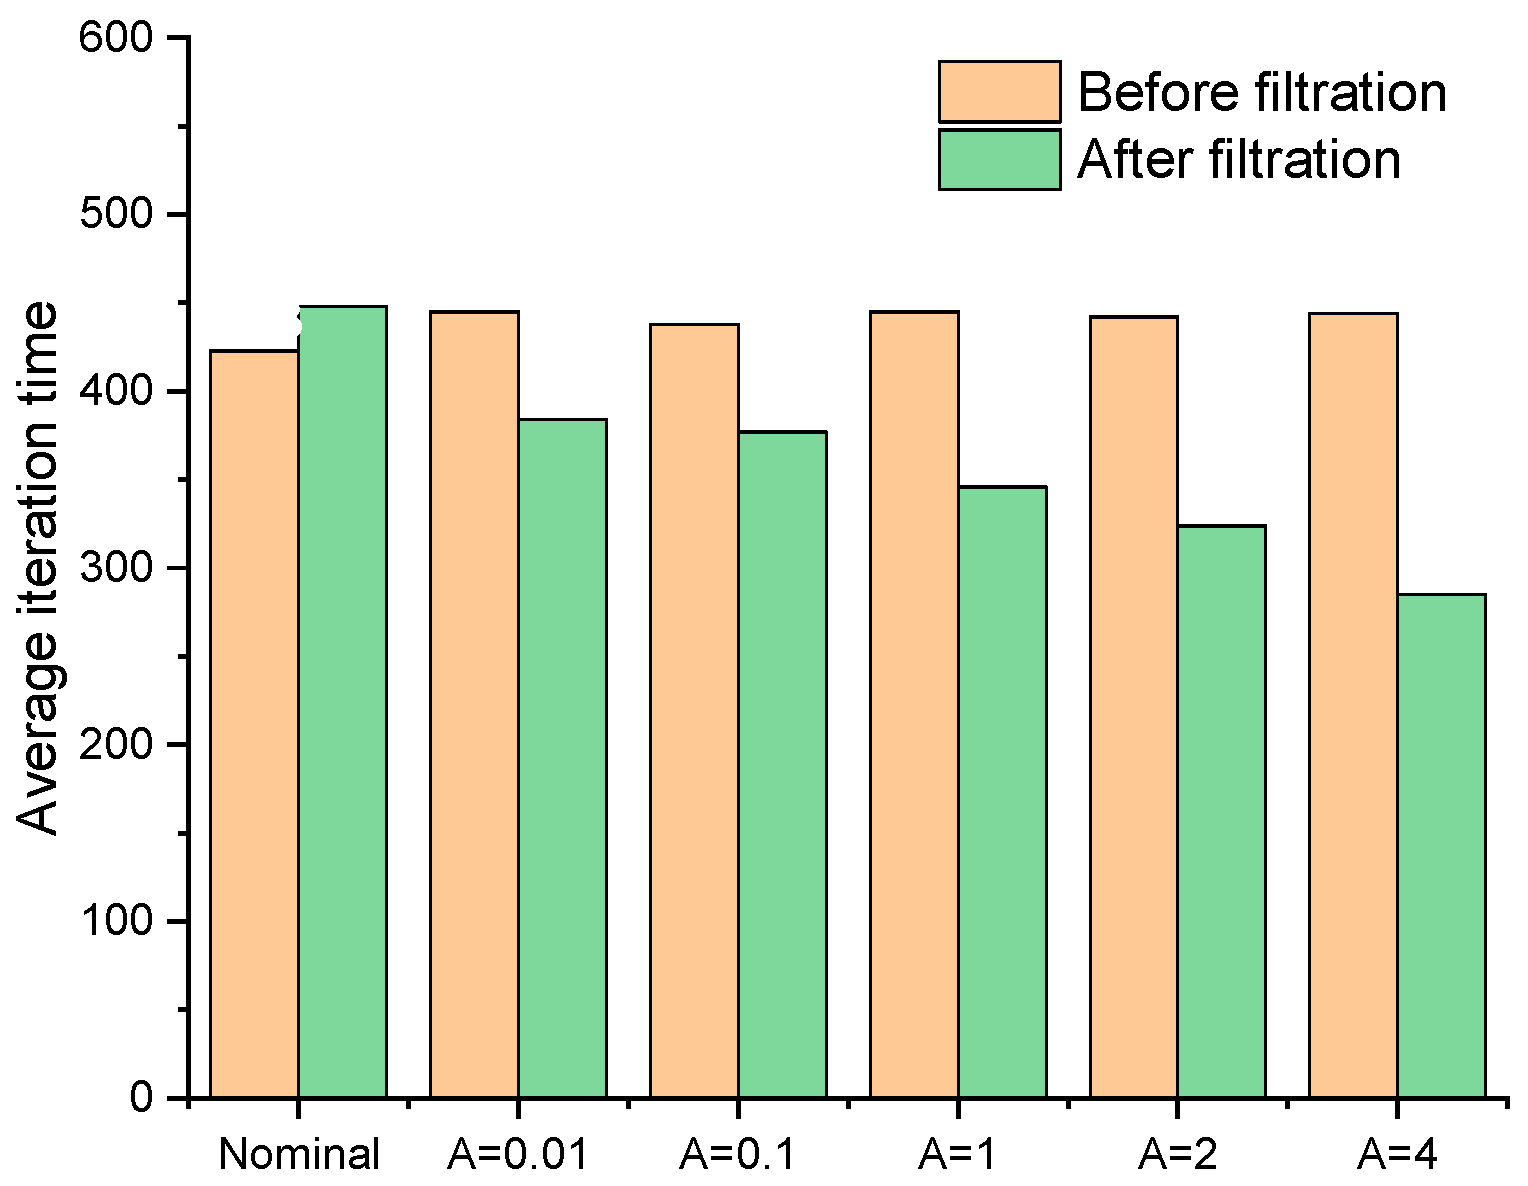
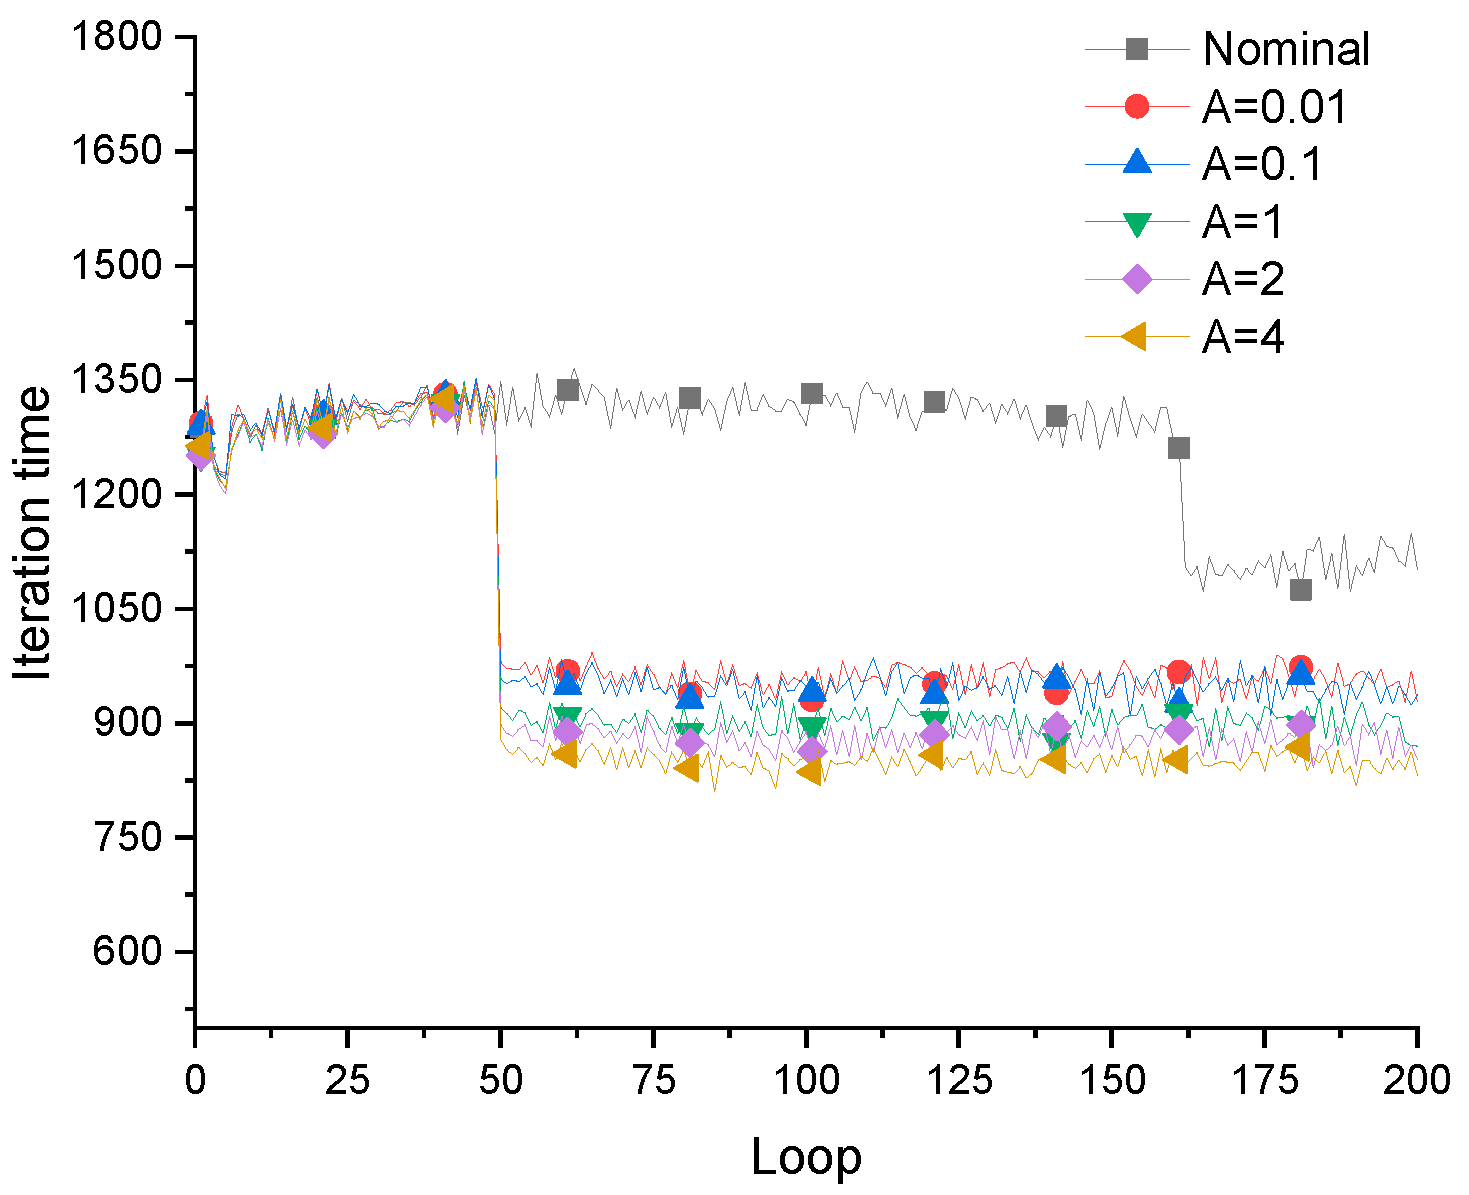
Figure 4 shows the cantilever structure obtained by the fail-safe optimization algorithm when the size of damage model L = 5, including the traditional fail-safe optimization design and the fail-safe optimization design obtained by the improved algorithm, in which nominal represents the optimization design obtained by the traditional optimization algorithm, and the rest are the fail-safe optimization design obtained by the improved algorithm. In the optimized design obtained by the improved algorithm, the corresponding fail-safe optimal design can be achieved when the threshold value of the density filter is adjusted to be 0.01, 1, 2, 4 and 5.56 respectively. By comparing the fail-safe optimization design obtained by the improved algorithm with the structure obtained by the standard fail-safe optimization algorithm, it can be found that the improved fail-safe optimization algorithm can not only obtain the required fail-safe optimization design, but also greatly reduce the amount of calculation required for optimization. The larger the threshold of the filter, the smaller the amount of calculation required in the optimization process, as is shown in
Figure 5 and
Figure 6.
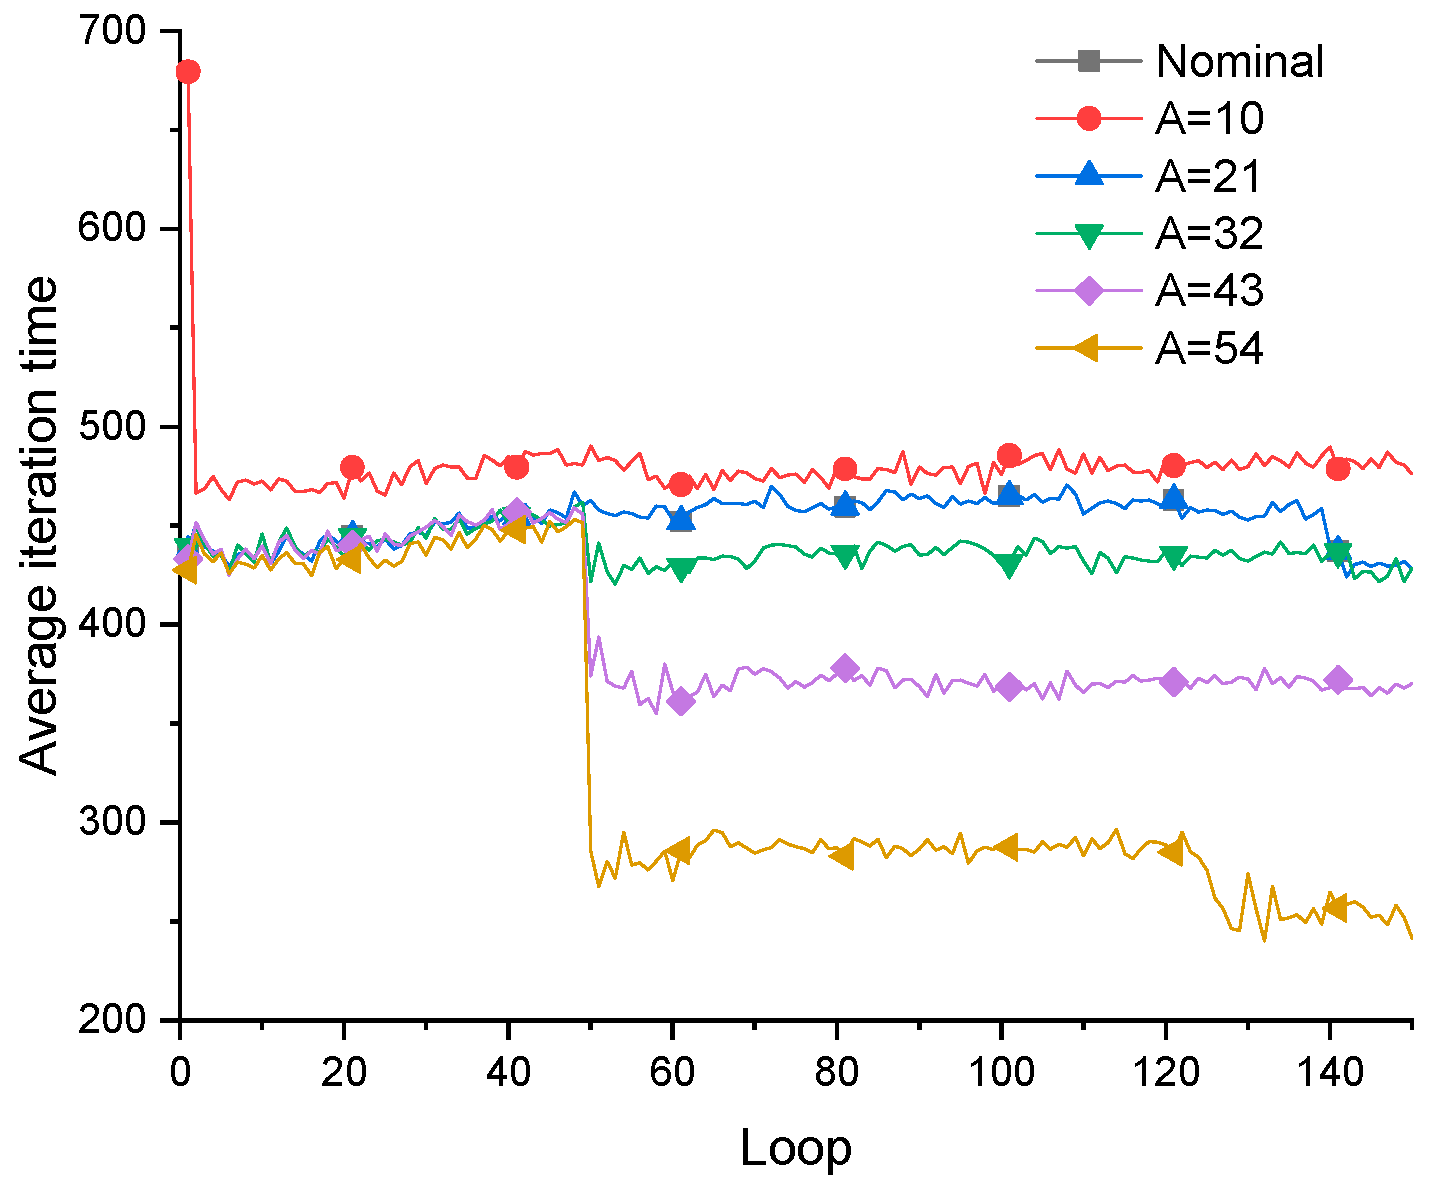
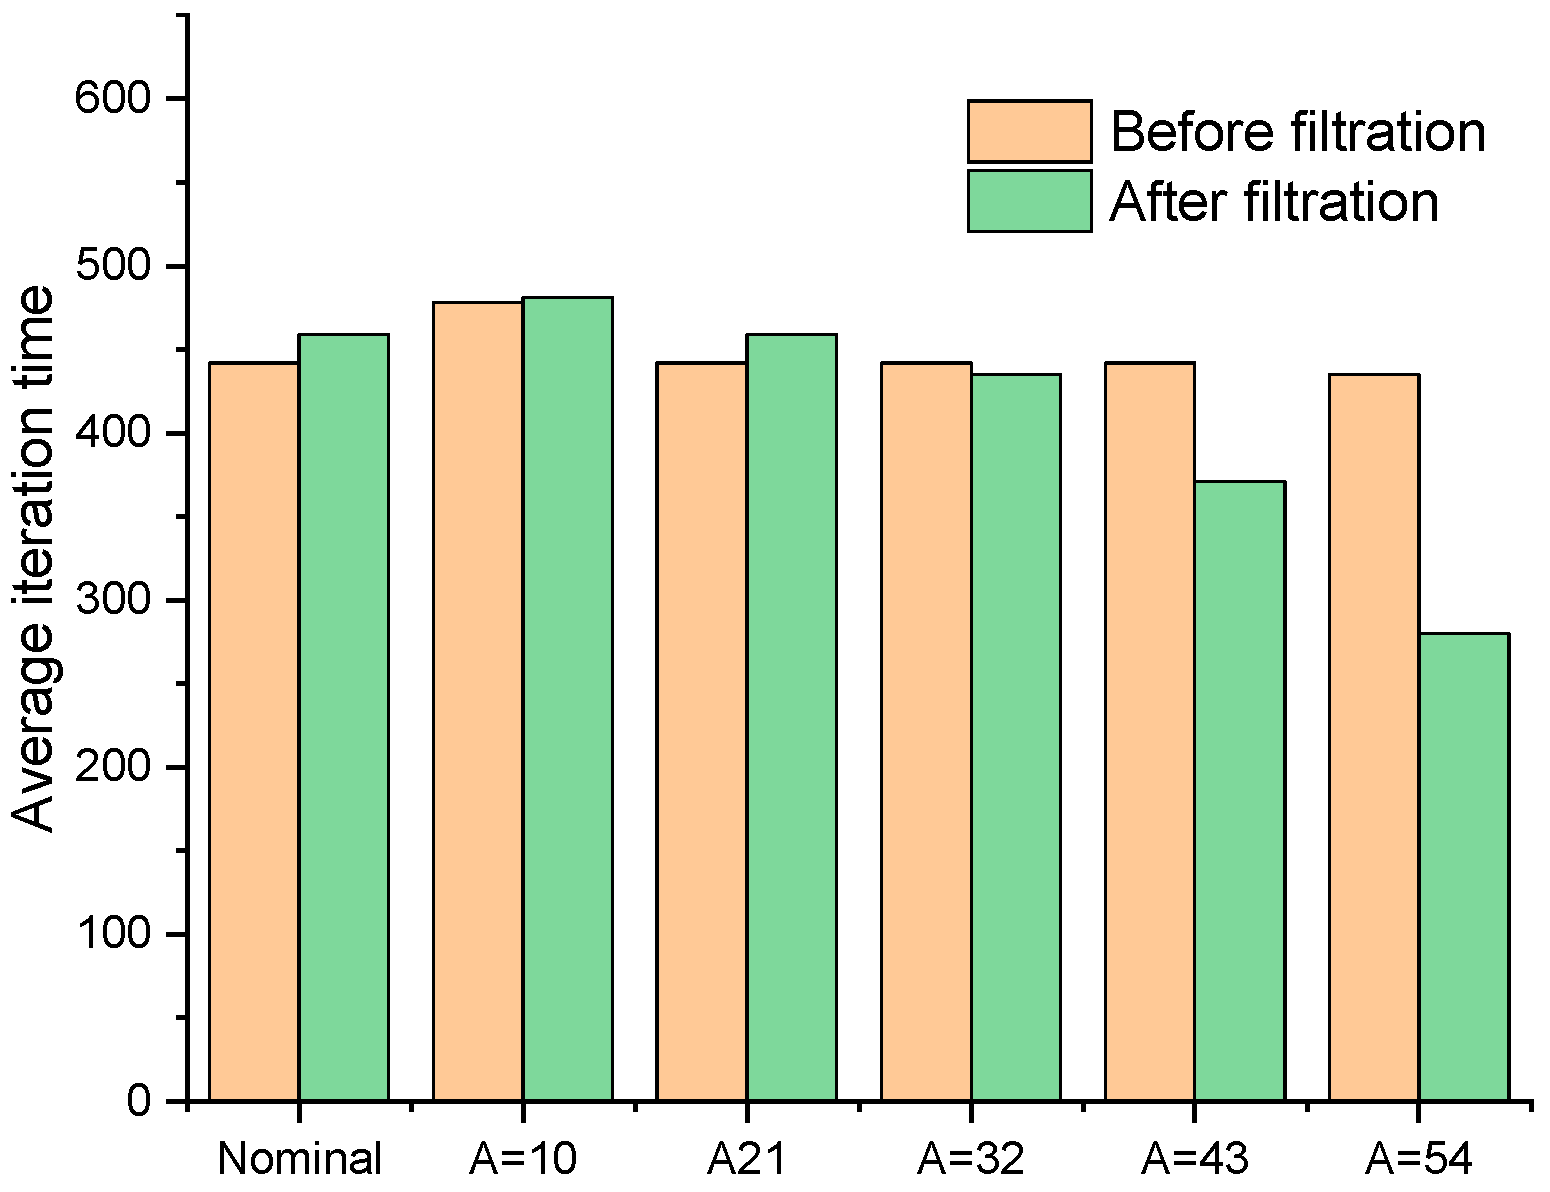
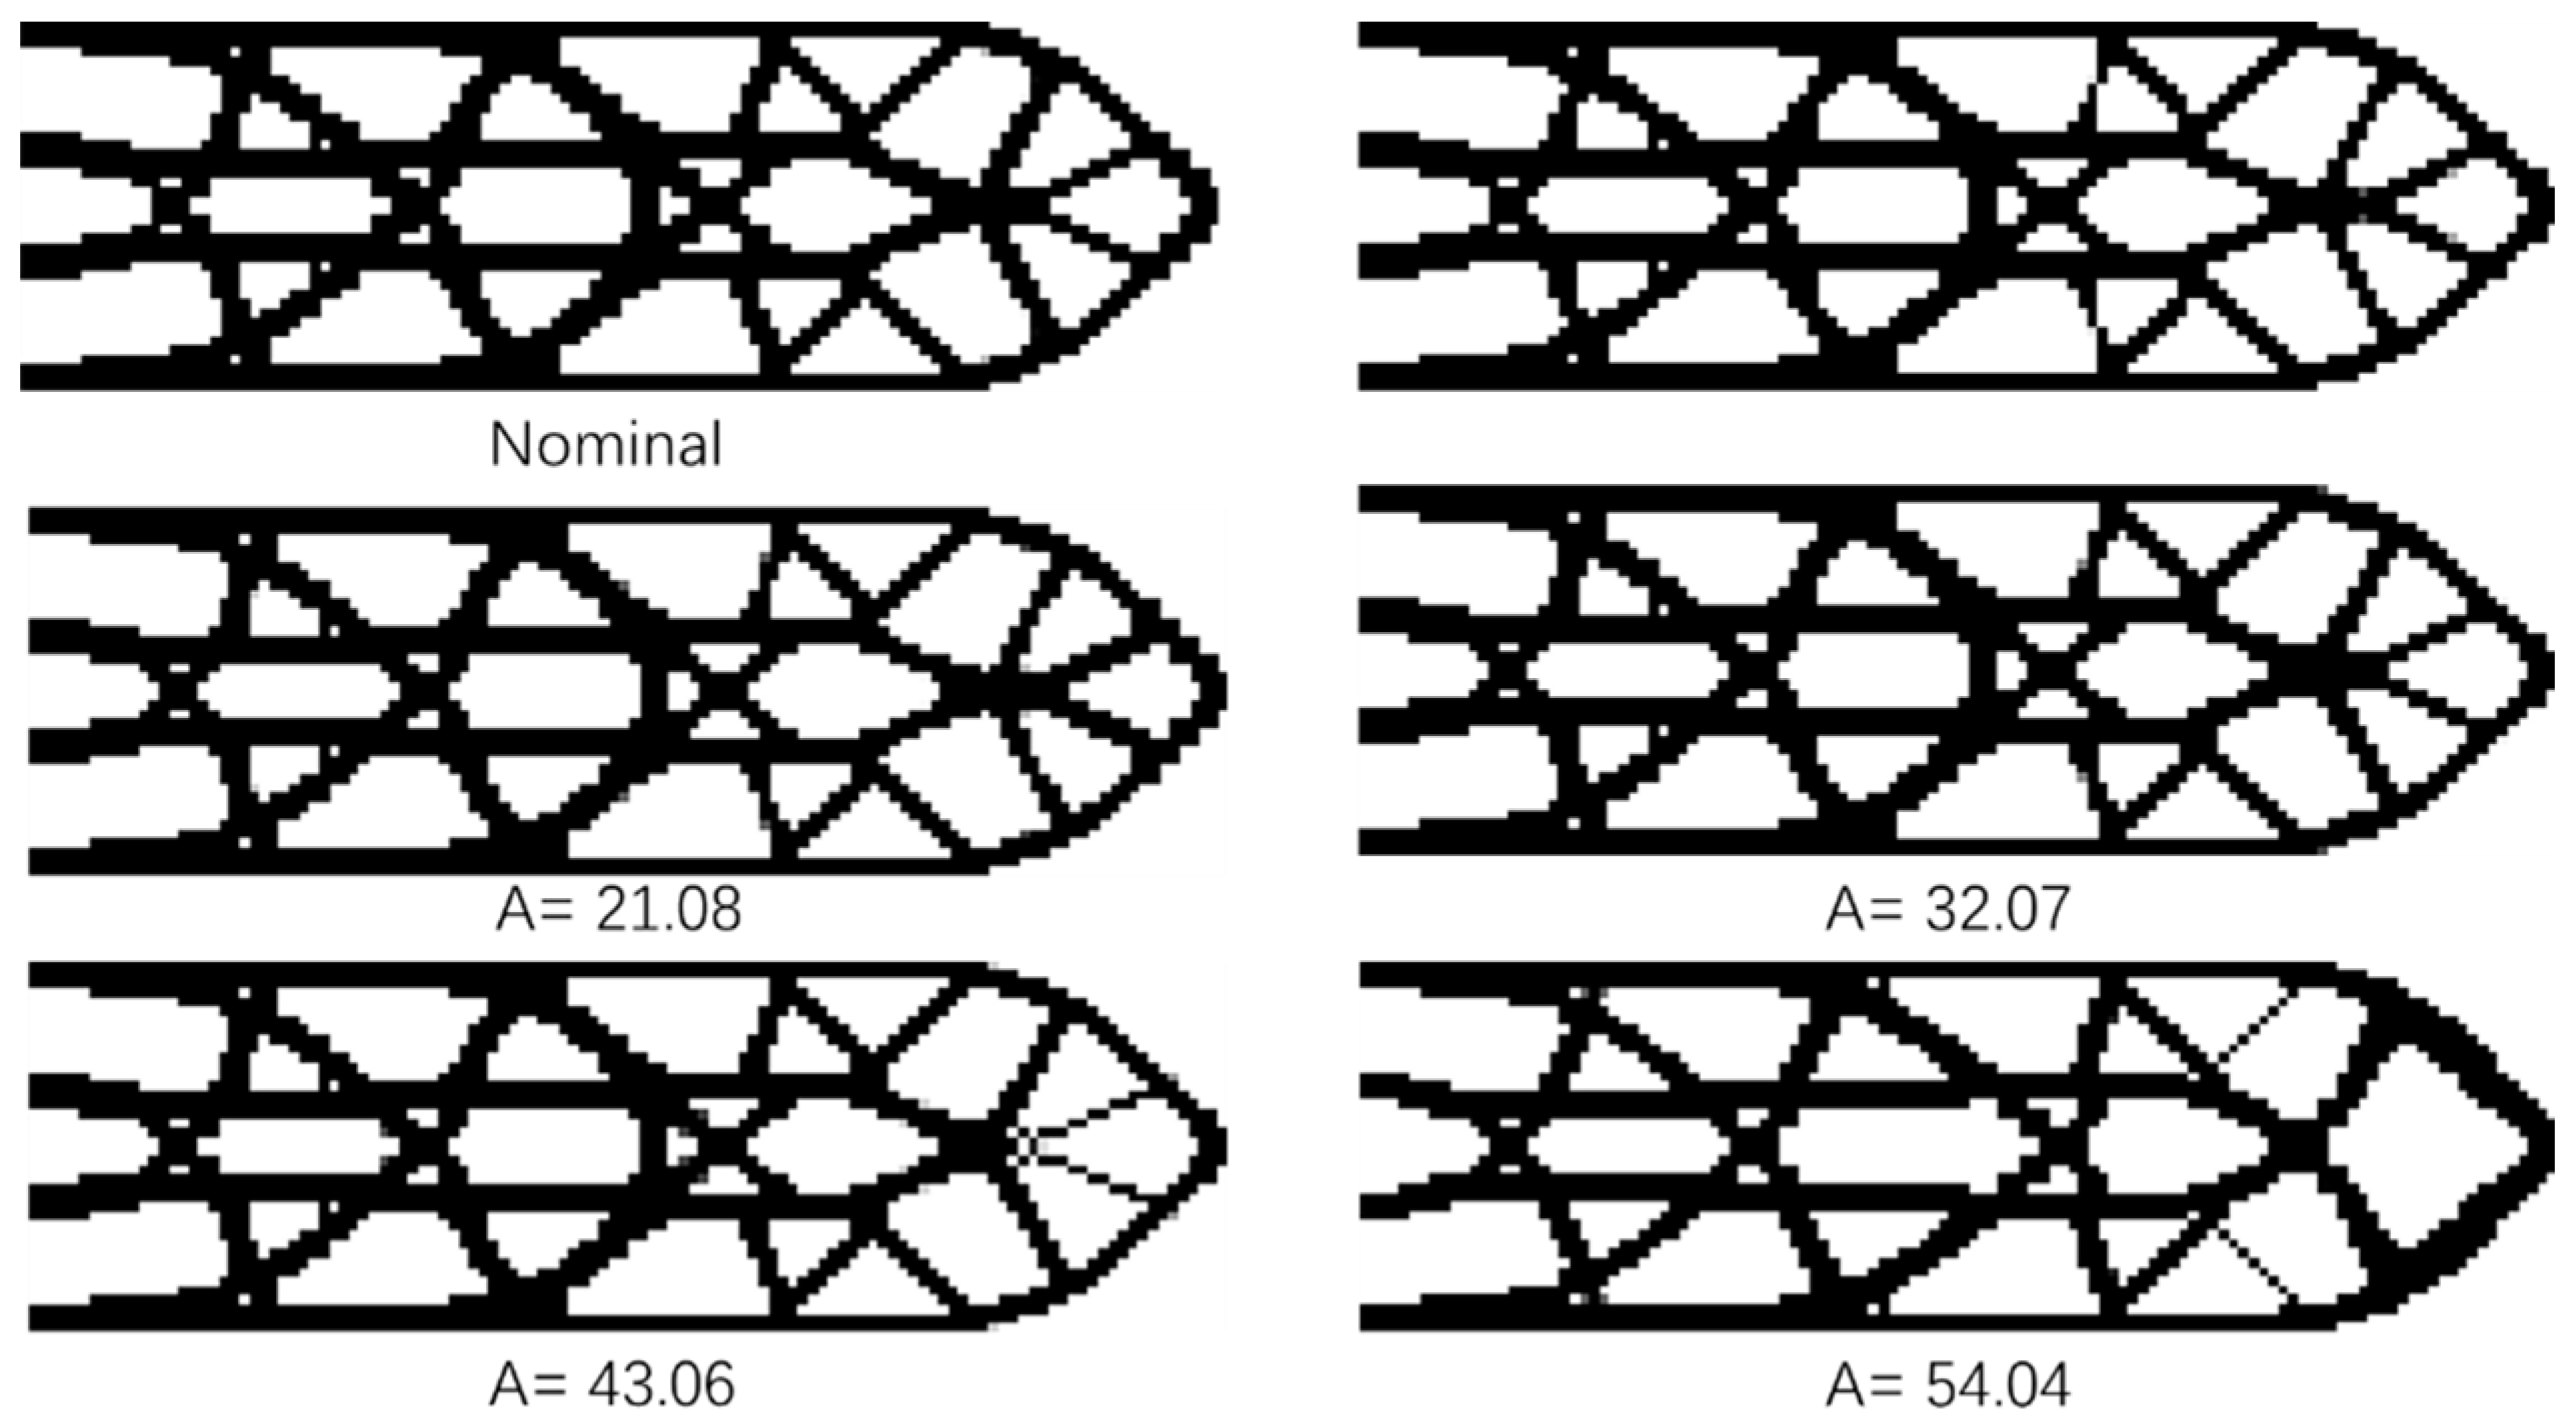
Figure 7 show the cantilever structure obtained by the nominal fail-safe optimization algorithm when adjusting the size L = 14 of the local damage model. As the area of local damage area increases, the threshold of damage scenario filter also needs to increase, which are 10, 21, 32, 43 and 54 respectively. Through the comparative analysis of the optimization results, it can be found that the improved fail-safe optimization algorithm can obtain the ideal structural design and reduce the amount of calculation required in the optimization process. However, with the increase of filter threshold, the difference between the junction obtained by the improved algorithm and the standard structure becomes larger and larger. Obviously, the optimization process deviates from the correct direction, which is not the expected result. The reasonable and efficient selection of filter threshold is worthy of further research, which will not be introduced in detail here.
Figure 8.
The change of iteration time in the optimization process.
Figure 8.
The change of iteration time in the optimization process.
Figure 8.
The comparison of average iteration time of each method.
Figure 8.
The comparison of average iteration time of each method.
In
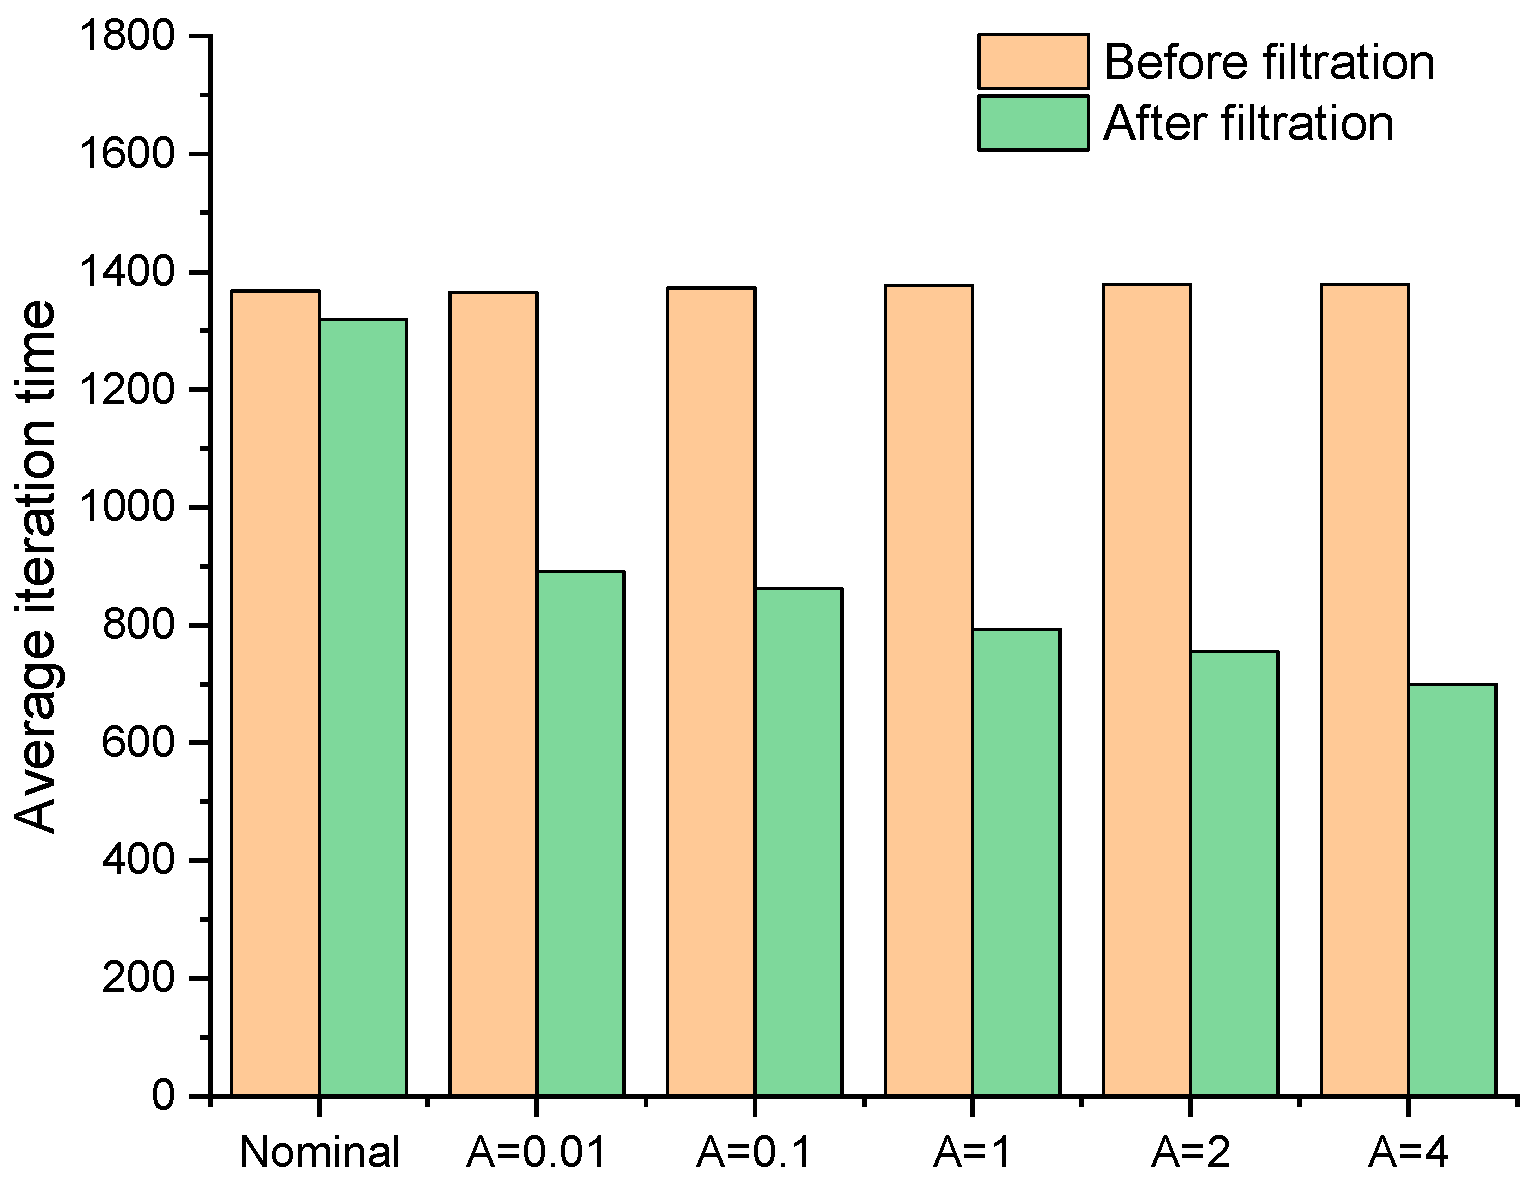
Table 1, the threshold of the filter is adjusted for filtering the local damage scenario, and reduce the rate of iteration step in the optimization process of the improved fail-safe optimization method. It can be seen that the average iteration time in the fail-safe optimization process decreases continuously with the increase of the threshold. Obviously, by judging the effectiveness of local damage scenarios, the calculation of topology optimization of fail-safe structures can be reduced. In addition, this text also organically combines the preconditioned conjugate gradient method with the fail-safe topology optimization algorithm to improve the computational efficiency of the fail-safe topology optimization algorithm. For details about the optimization results and calculation efficiency of the traditional fail-safe optimization algorithm, PCG-fail-safety optimization algorithm and the fail-safe optimization algorithm based on density filtering, please refer to
Appendix A.
3.2. L-bracket
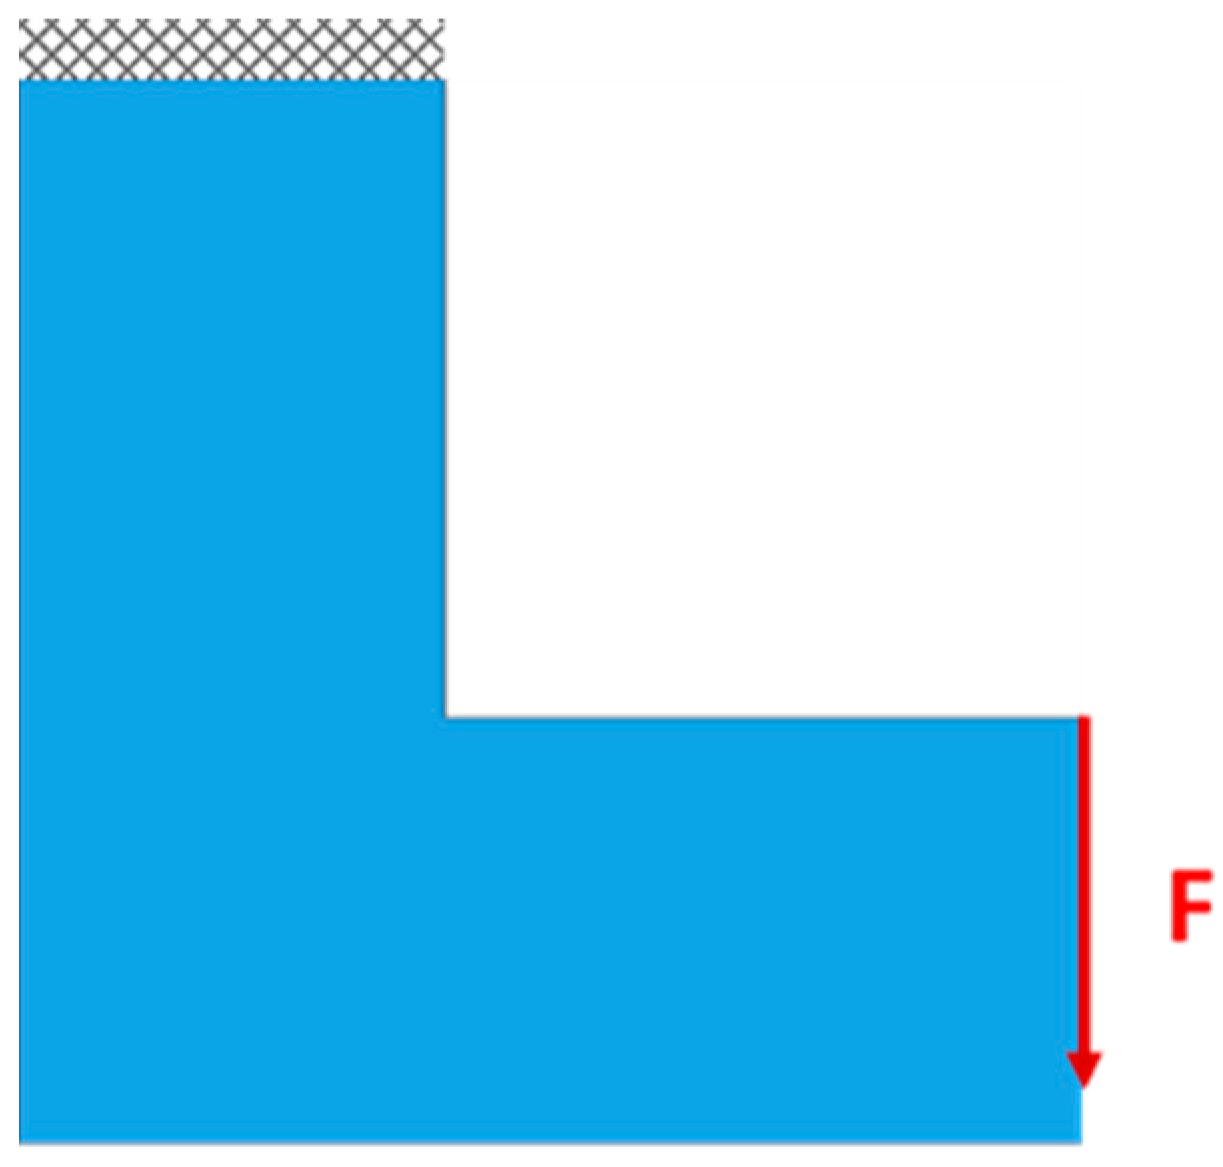
The well-known L-beam is shown in
Figure 9. The structure is discretized using a four-node finite element with a size of 1 * 1 mm2, in which the number of elements is 10000. In the final topology, only 35% of the materials are available. The top of the L-shaped support is clamped, and the external load f = 1 N is applied to the top of the lower right corner
Figure 9. Materials close to point loads (gray areas) are assumed to be inactive areas. The width of the inactive area is equal to the side length of the local damage model.
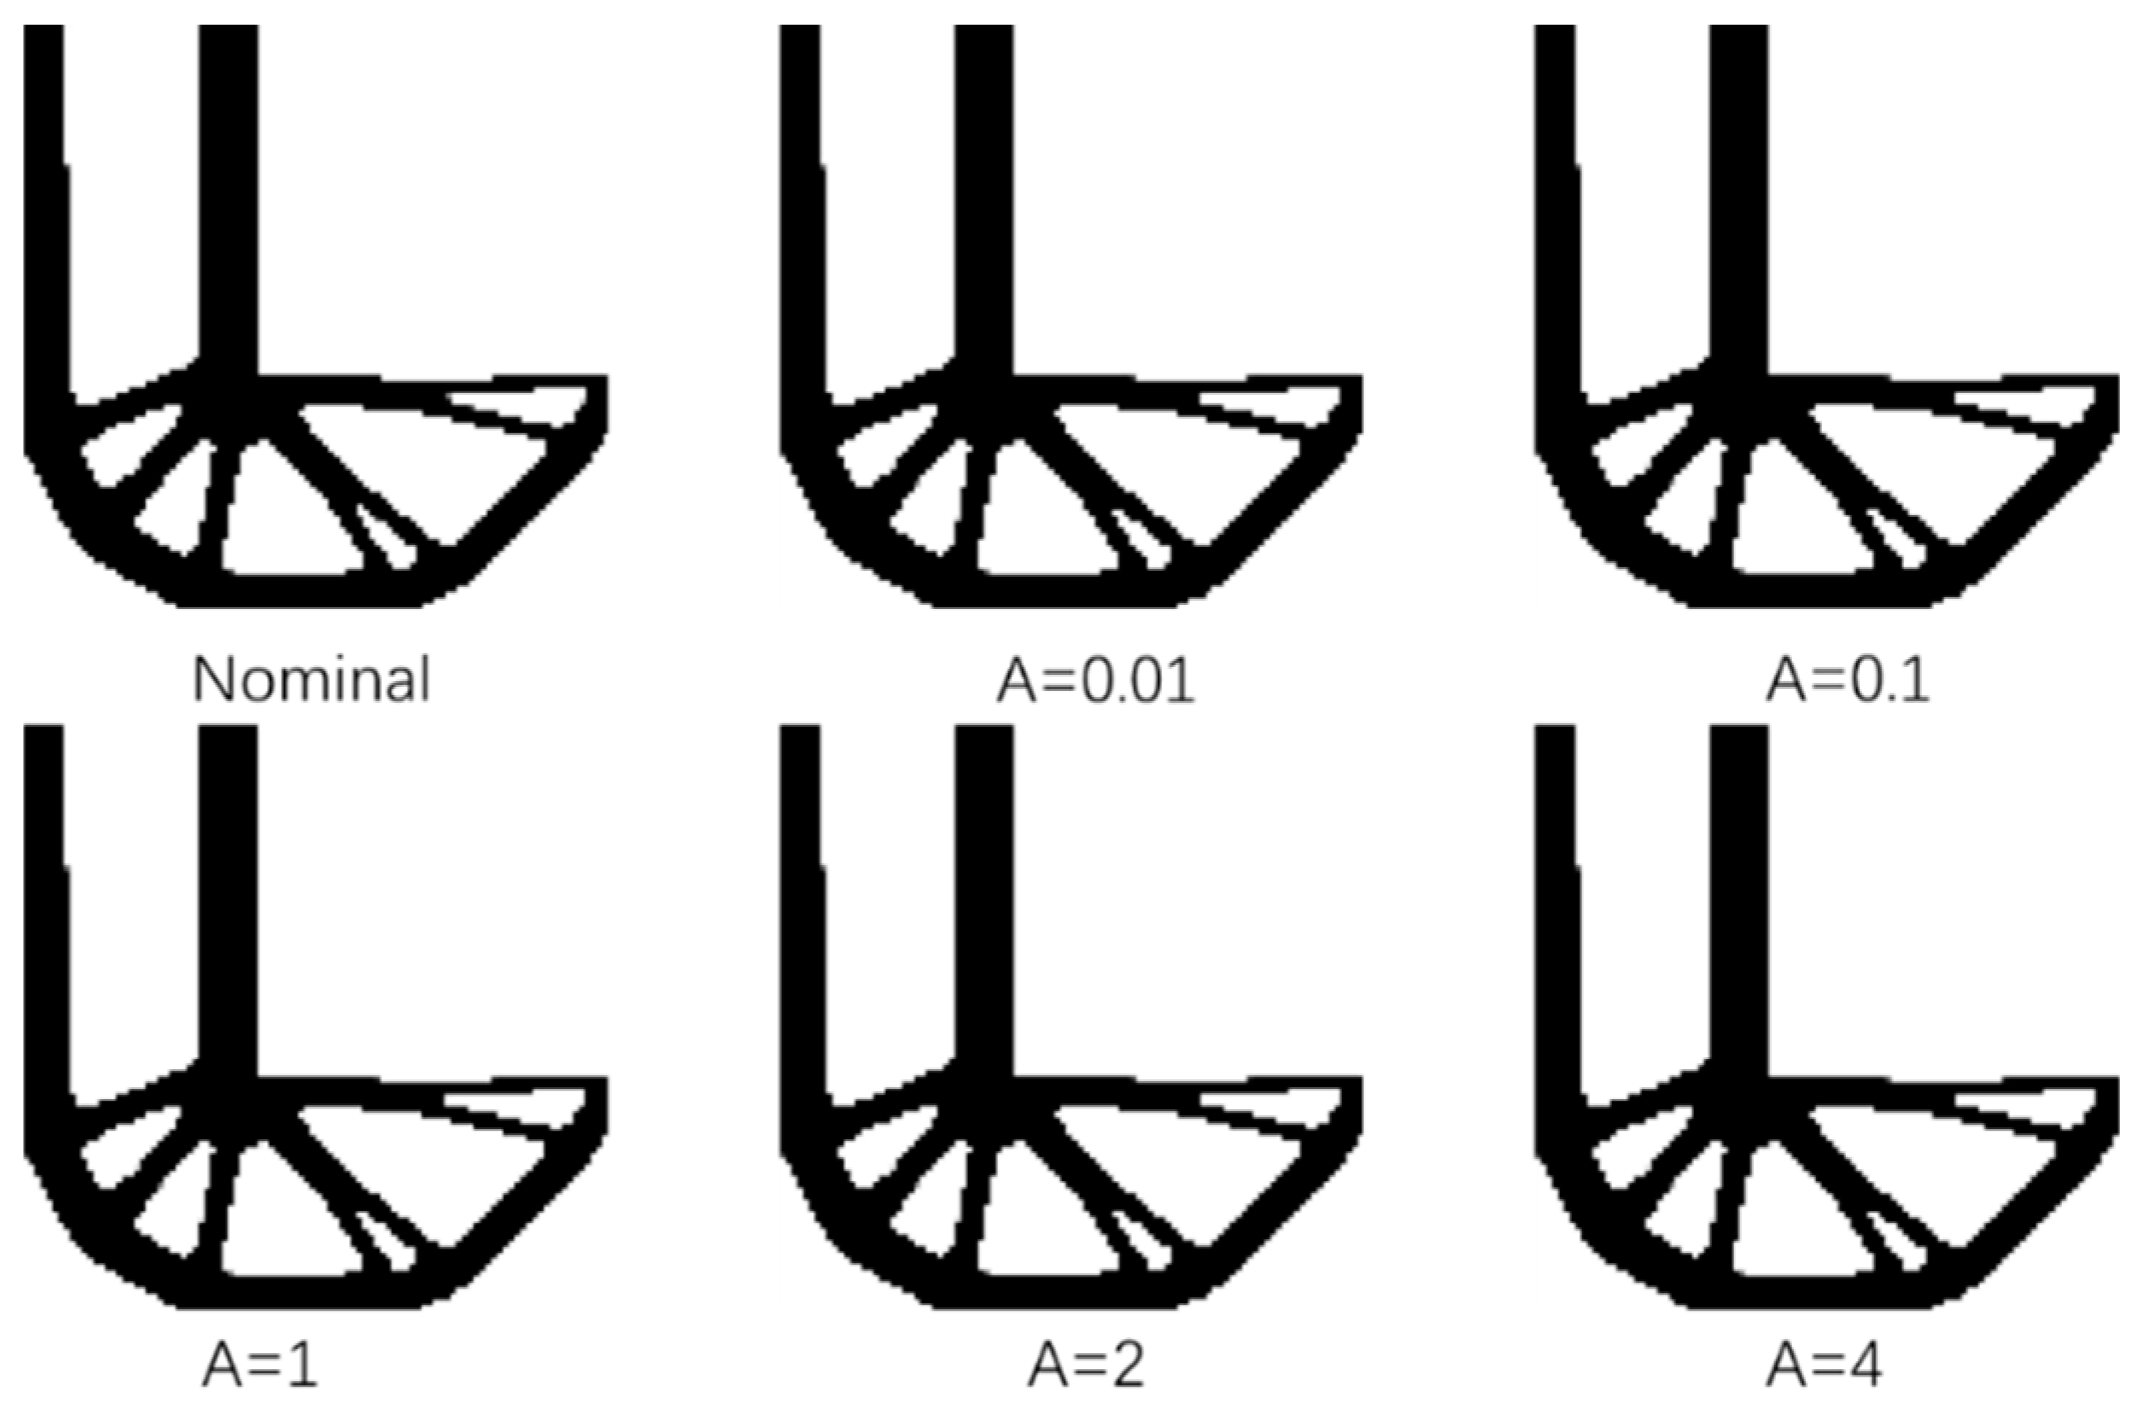
Figure 10.
Comparison of optimization results of L-shaped beam when L = 4.
Figure 10.
Comparison of optimization results of L-shaped beam when L = 4.
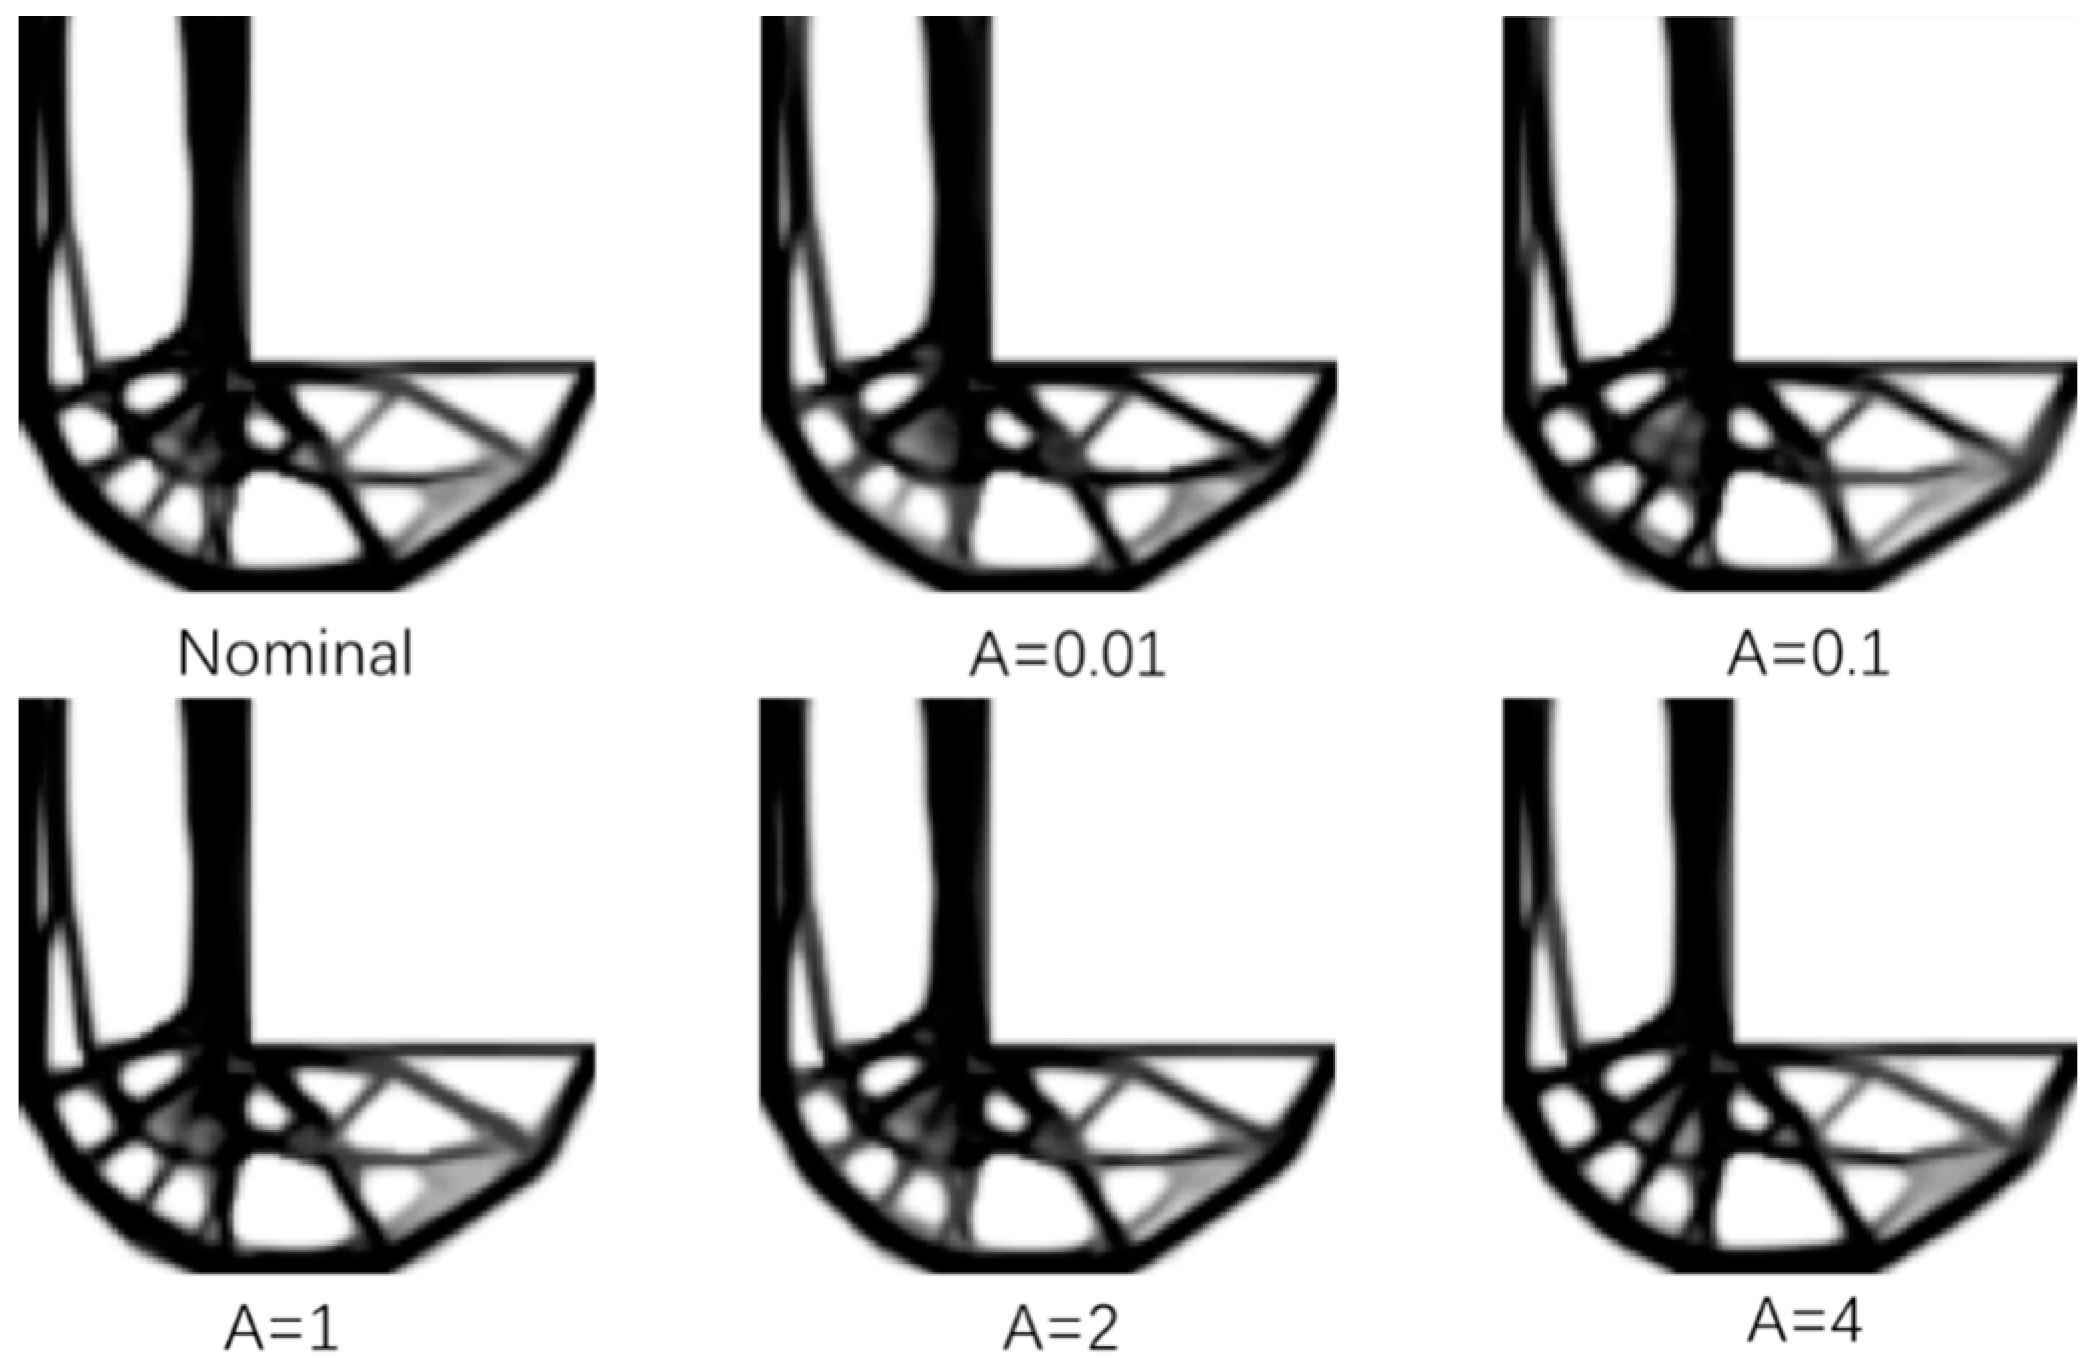
The dimensions of the local damage model are l = 4 * 4 respectively to optimize the L-shaped support.
Figure 9 shows the L support structure obtained through the standard fail safe optimization method, and then adjusts the threshold of the density filter a to be 0.01, 0.1, 1, 2 and 4, respectively, through the improved structure design of the fail-safe topology optimization algorithm. It is almost difficult to judge the difference between them from the final results. When the side length of the damage model is L = 4, the optimization results obtained by the traditional fail-safe optimization method and the improved fail-safe optimization algorithm with different thresholds are almost the same.
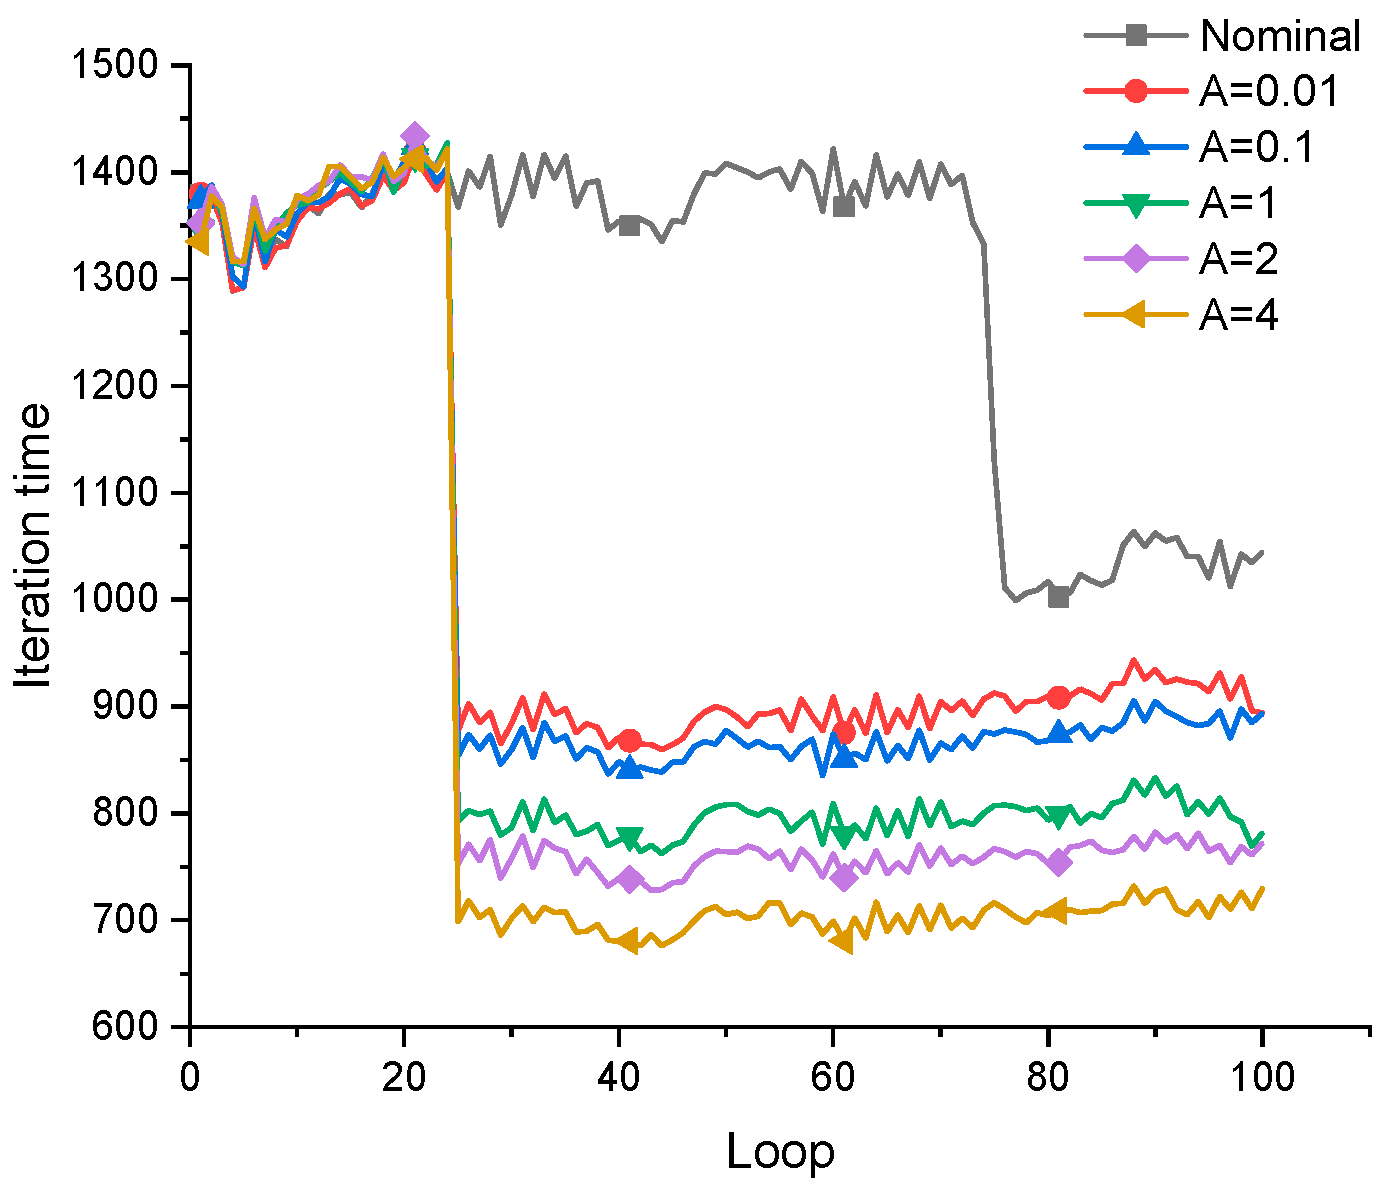
Figure 11.
The change of iteration time in the optimization process of the optimization method.
Figure 11.
The change of iteration time in the optimization process of the optimization method.
In
Figure 12, the abscissa is the threshold of the filter, the ordinate is the reduction of the average iterative steps in the optimization process, and the reduction of the average iterative steps in fail safe topology optimization (with different thresholds).
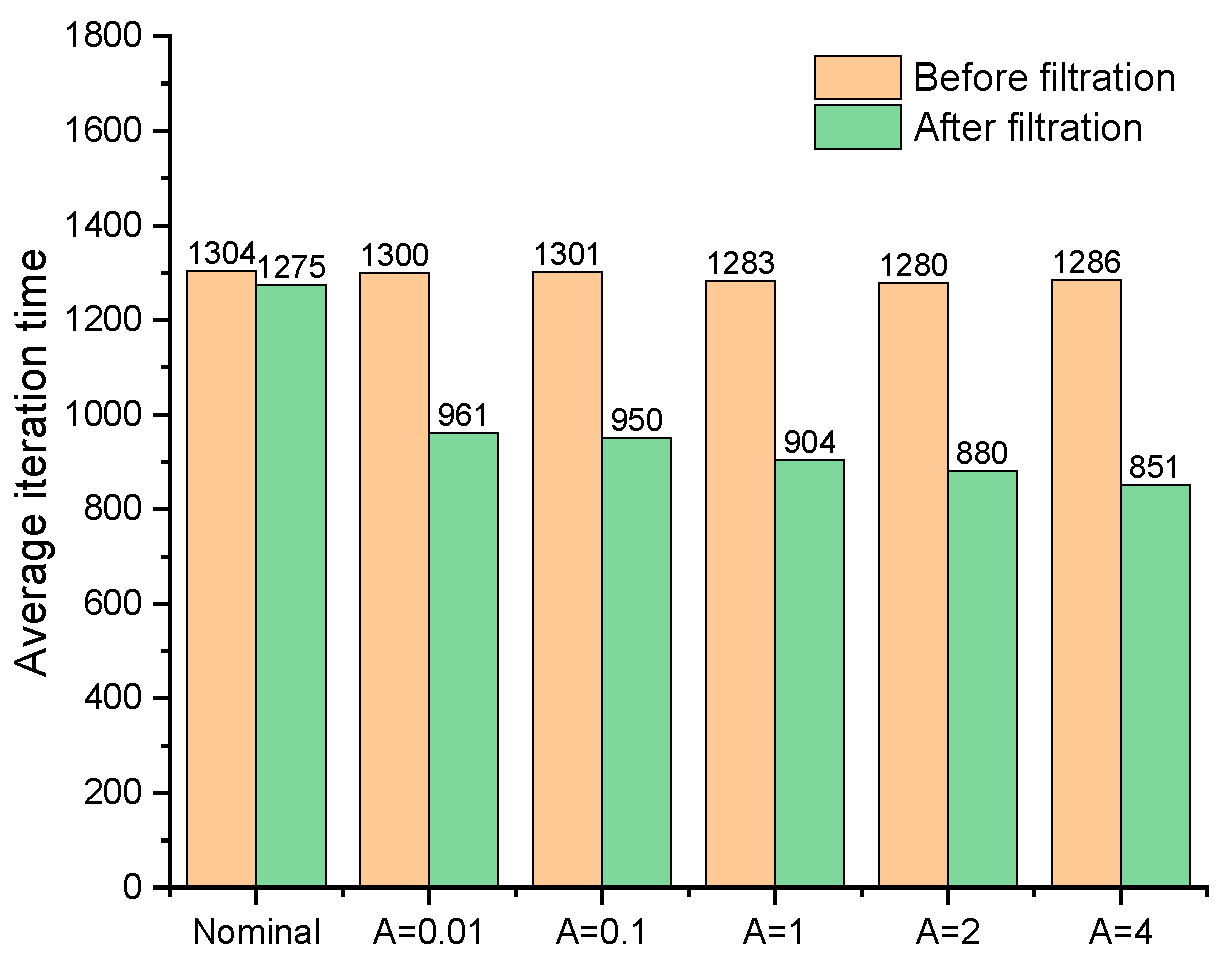
Figure 13 shows the average iteration time before and after the improvement of the fail-safe structure optimization method.
Figure 13.
Comparison of optimization results of L-shaped beam when L = 6.
Figure 13.
Comparison of optimization results of L-shaped beam when L = 6.
Figure 14 is the fail-safe optimization design of L-shaped support obtained by fail-safe optimization method when the size of local damage model is L = 6 * 6, the threshold of the filter is set to 0.01, 0.1, 1, 2 and 4, respectively. After analyzing the optimization results of the standard fail-safe optimization method and the improved fail-safe optimization method, it could be found in
Figure 14 and
Figure 15 that the greater the threshold value of the density filter, the greater the difference between the final optimization results of each algorithm.
In addition, with the increase of filter threshold, the time required for each iteration in the optimization process gradually decreases. However, when L = 6, although the whole optimization solution can converge to the optimal structure, the stability problem has begun to appear in the optimization process. This is because the size of local damage model will directly affect the change of sensitivity information in the optimization process. With the increase of the size of local damage model, the problems of stability and convergence in the optimization process will become more obvious.
Table 2.
Reduction ratio of average iteration time in optimization process.
Table 2.
Reduction ratio of average iteration time in optimization process.
| L=4 |
A |
0.01 |
0.1 |
1 |
2 |
4 |
| Rate |
34.7% |
37.2% |
42.4% |
45.2% |
49.2% |
| L=6 |
A |
0.01 |
0.1 |
1 |
2 |
4 |
| Rate |
26.1% |
27.0% |
29.5% |
31.3% |
33.8% |
It can be found that by adjusting the threshold of the filter, the amount of calculation required for topology optimization of fail-safe structure can be effectively reduced. When L = 4, the average iteration step of fail-safe structure optimization can be reduced by more than 35%, and the average iteration time of fail-safe structure optimization can also be reduced by 25% when L = 6, This method is obviously feasible for the whole fail-safe optimization process. However, it is worth noting that there is an upper limit to the threshold. Excessive threshold will make the optimization deviate from the correct direction and cause the cells with intermediate density that cannot be eliminated, which is particularly obvious in the case of large local damage area.
4. Discussion
To enhance the computational efficiency of the fail-safe topology optimization method, a density-based filter is introduced to determine whether additional finite element analyses and sensitivity calculations are necessary when traversing local damage scenarios. Through a comparative analysis of optimization results, it is observed that the introduced approach can reduce the computational burden arising from numerous damage scenarios. The locally simplified damage scenario method based on density filtering ensures optimization accuracy and improves the computational efficiency of the failure-safe structural topology optimization algorithm. Additionally, considering some a priori knowledge of the optimization model, such as the symmetry of the structure or loads during the optimization process, further enhances the computational efficiency of the failure-safe topology optimization algorithm.
However, this study is limited to the elastic phase in the research of structural failure-safe topology optimization algorithms and does not account for failure-safe optimization design after structural plastic deformation. The determination of regularization parameters poses a challenging problem. In failure-safe topology design, unreasonable regularization parameters often lead to more unnecessary details or the presence of numerous intermediate density elements in the optimization results. Therefore, for failure-safe topology optimization algorithms in the plastic phase and the efficient and rational selection of regularization parameters, further in-depth research and discussion are required.
Author Contributions
Conceptualization, Yunfei Liu and Wuhe Sun; methodology: Yunfei Liu and Yong Zhang; software: Yunfei Liu; validation: Yunfei Liu and Kai Cheng; formal analysis: Yunfei Liu and Fei Cheng.; investigation, Yunfei Liu and Wuhe Sun; resources: Wuhe Sun; data management: Yunfei Liu; writing—original draft preparation: Yunfei Liu; writing and editing: Yunfei Liu and Wuhe Sun; visualization: Yunfei Liu and Yong Zhang; supervision, Wuhe Sun; project administration: Wuhe Sun; funding acquisition: Wuhe Sun. All authors have read and agreed to the published version of the manuscript.
Funding
This research was supported by the Outstanding Young Researcher Fund from Department of Science and Technology of Jilin Province (20190103067JH).
Institutional Review Board Statement
Not applicable.
Informed Consent Statement
Not applicable.
Data Availability Statement
Not applicable.
Acknowledgments
This work was supported by the National Natural Science Foundation of China (No. 11217020530) and the National Key Research and Development Program of China (No. 2020YFA0713604).
Conflicts of Interest
The authors declare that they have no conflict of interest.
Conflicts of Interest
The authors declare no conflict of interest.
Appendix A
The following contents compare the results of standard topology optimization algorithm, PCG method and fail-safe optimization based on density filtering. And analyze the difference between them in calculation efficiency and accuracy.
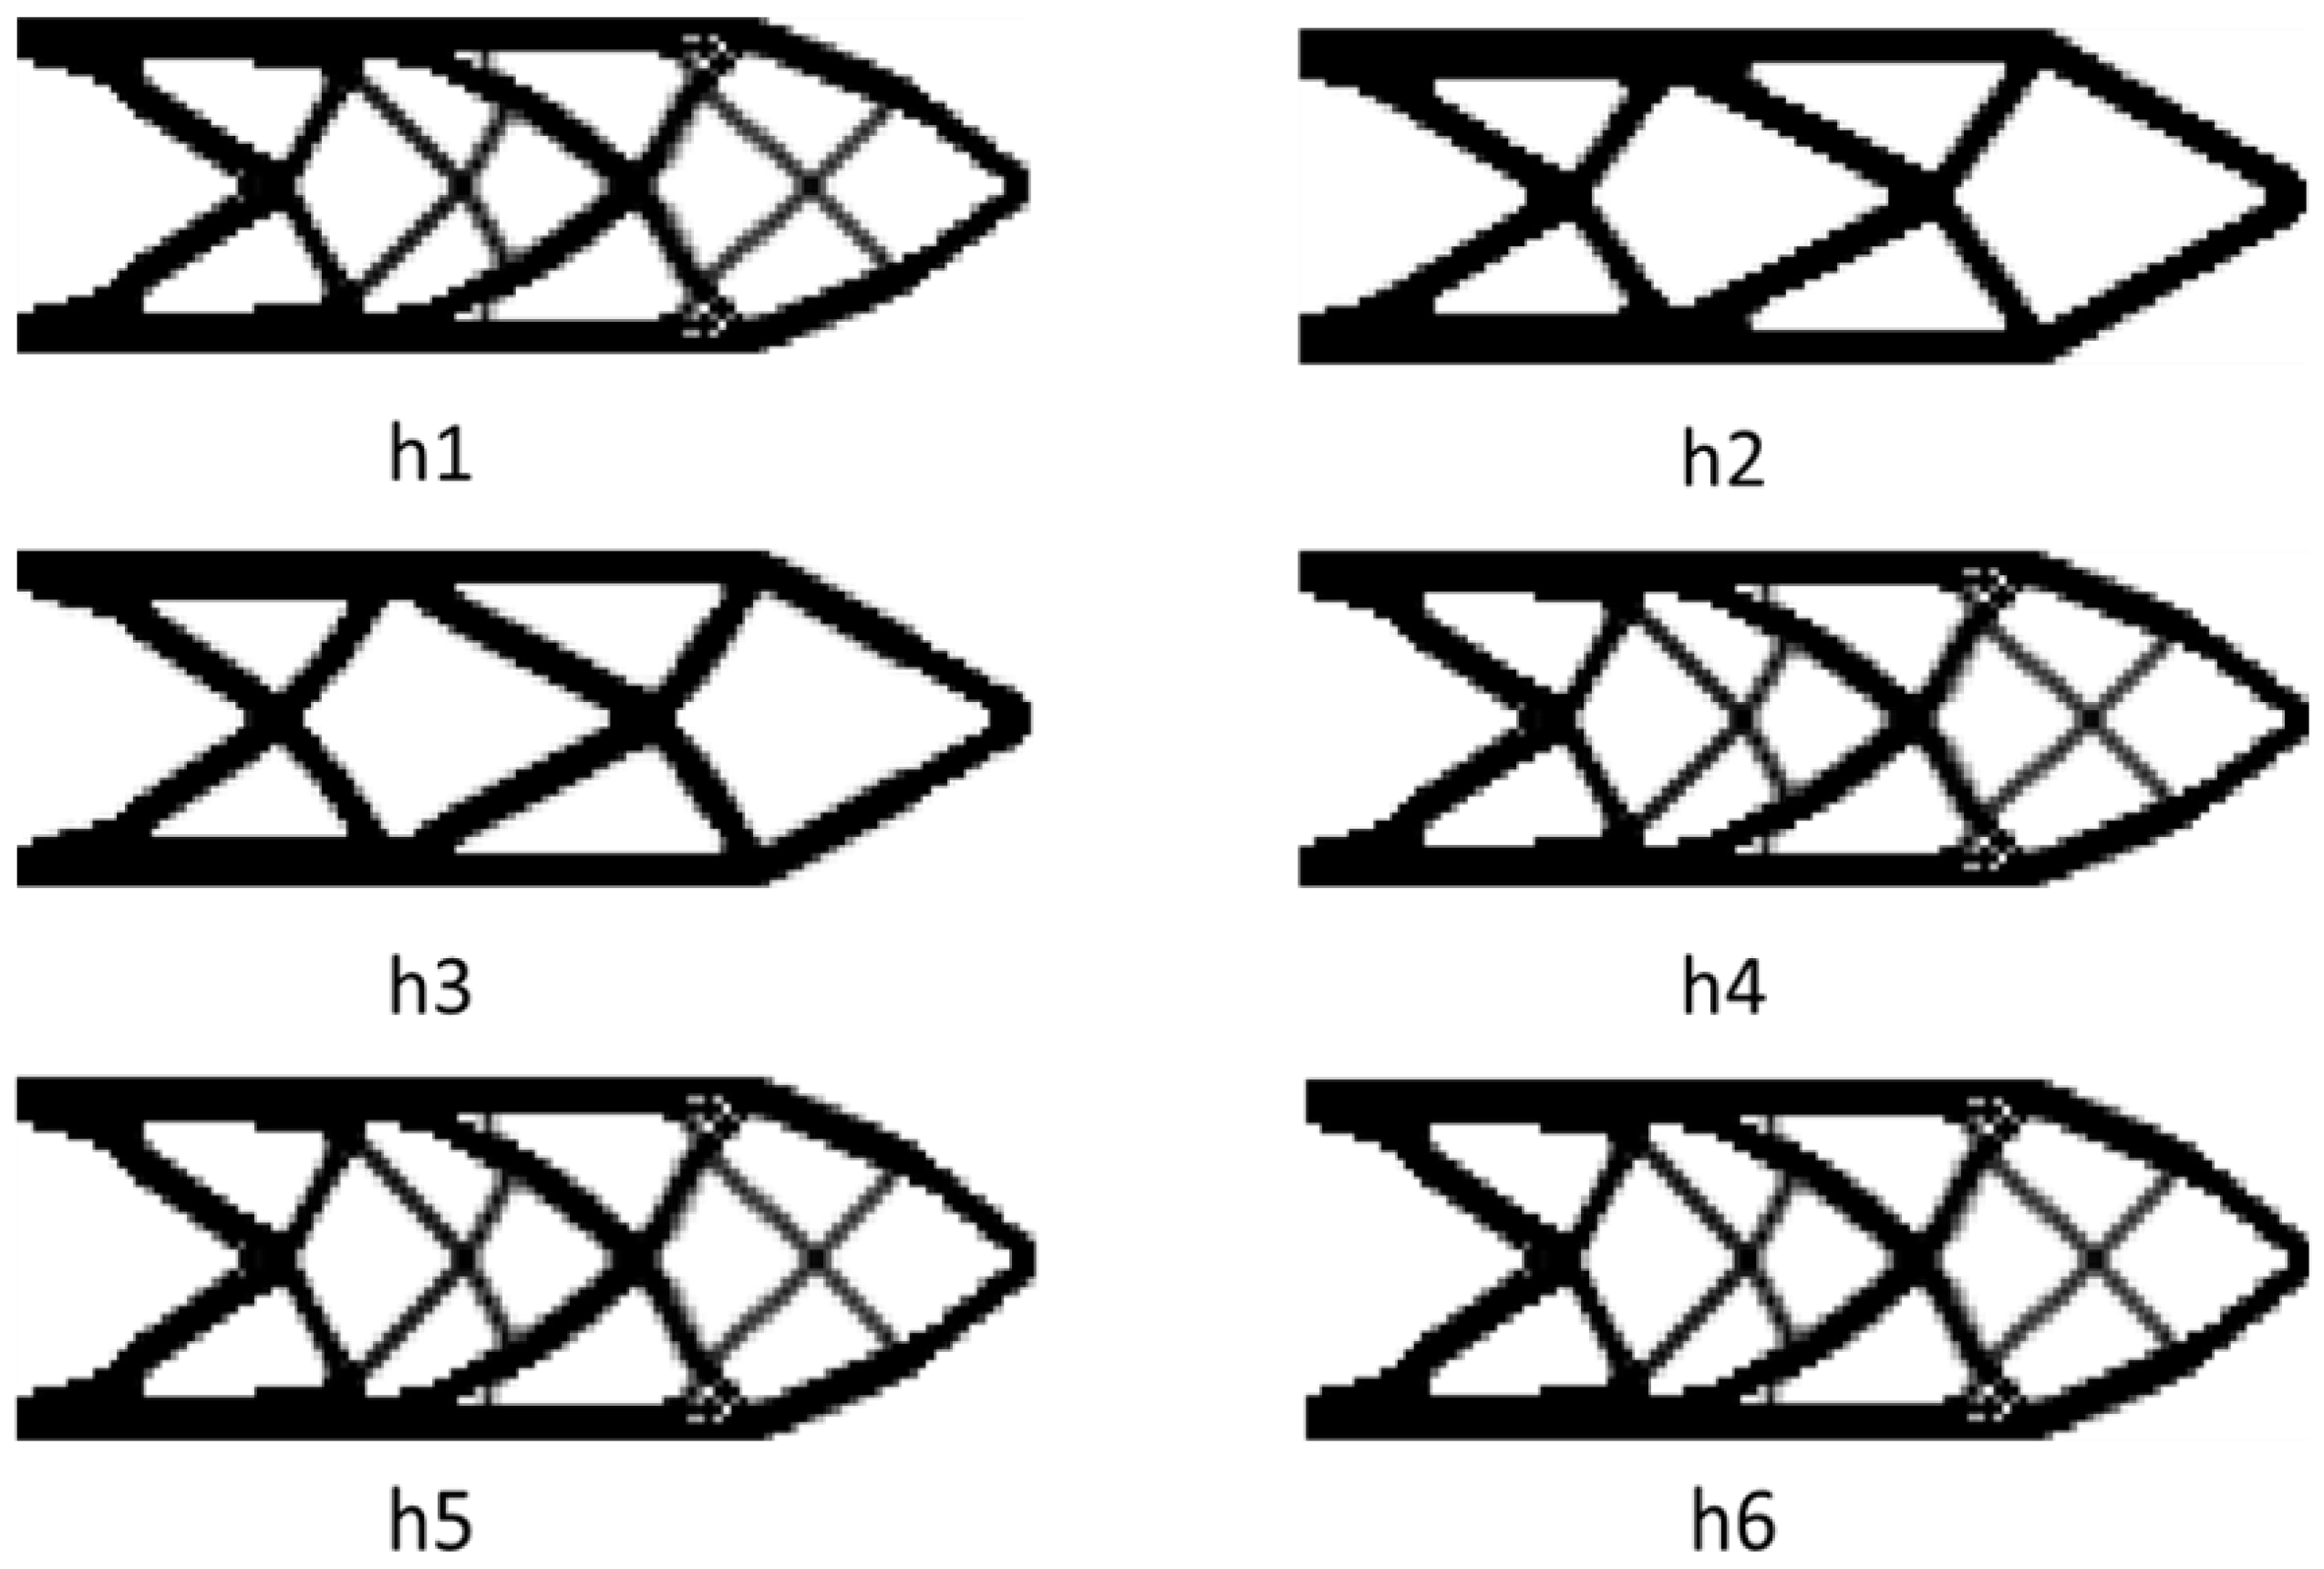
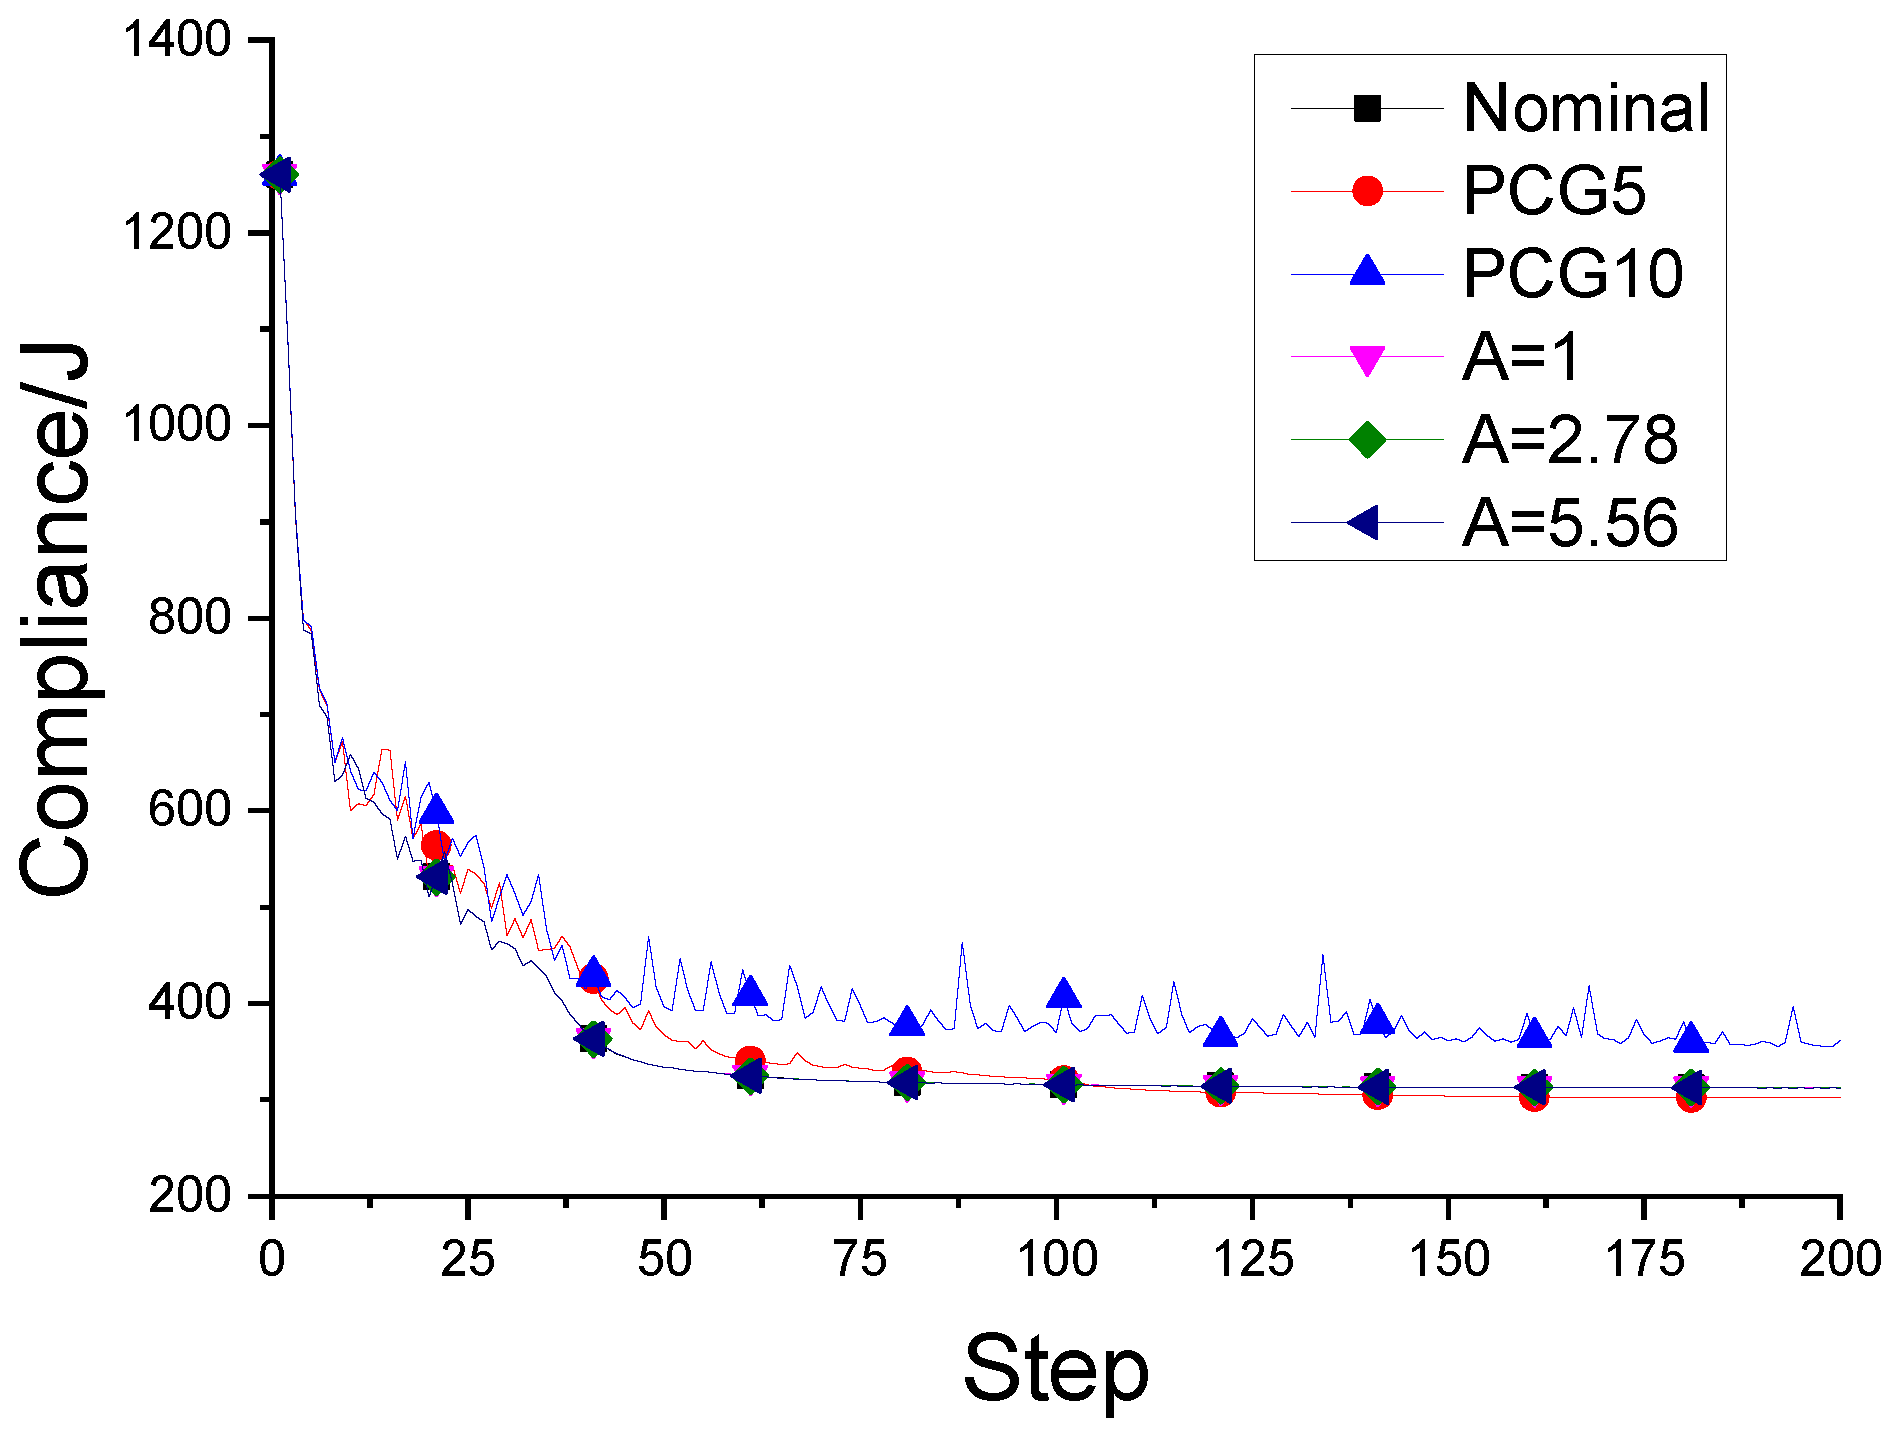
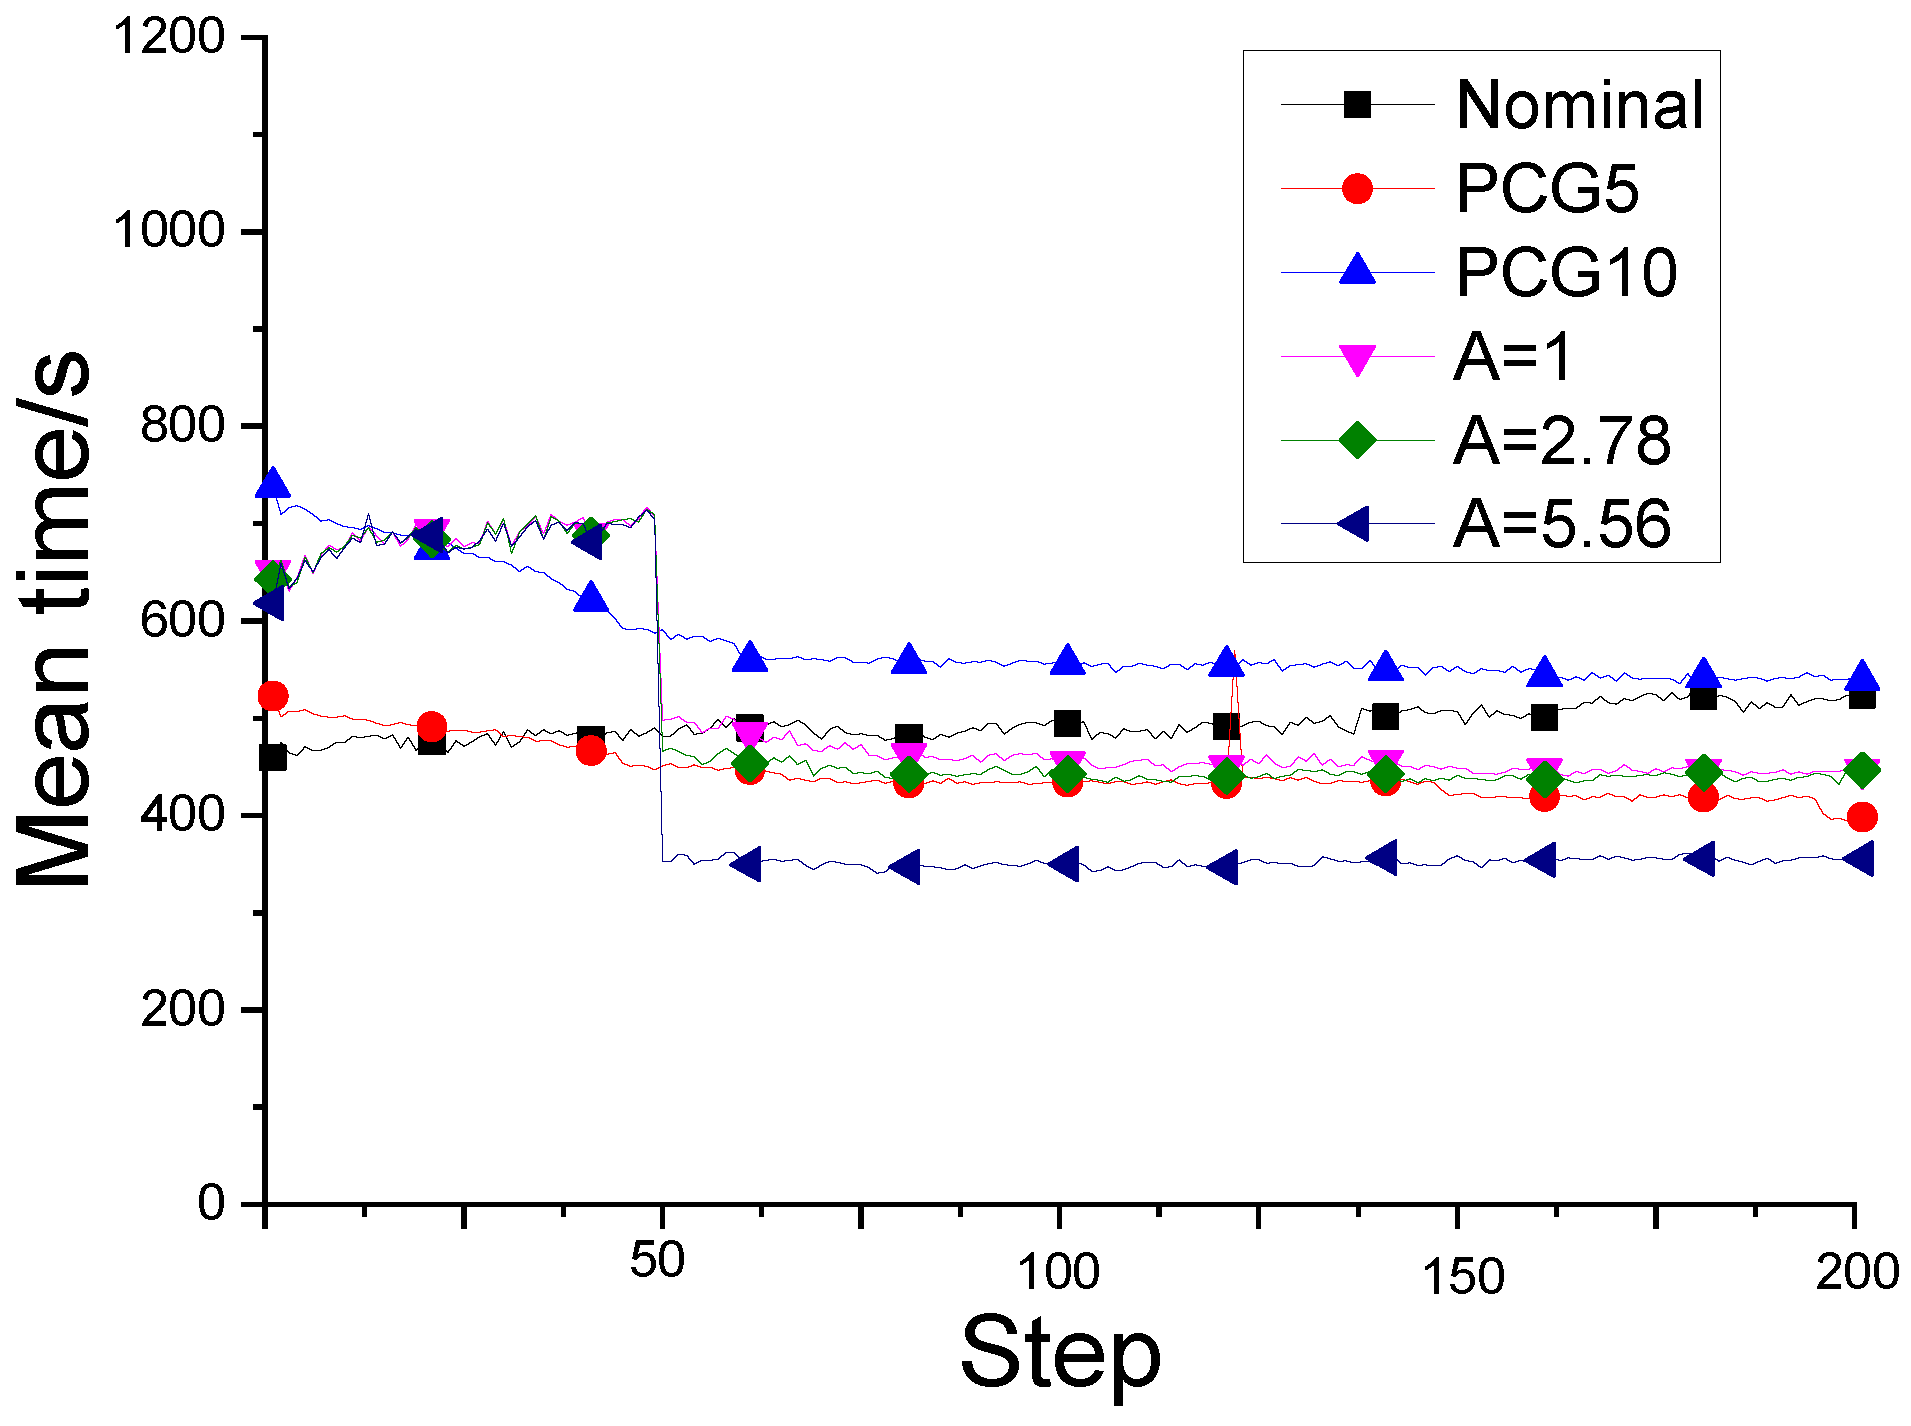
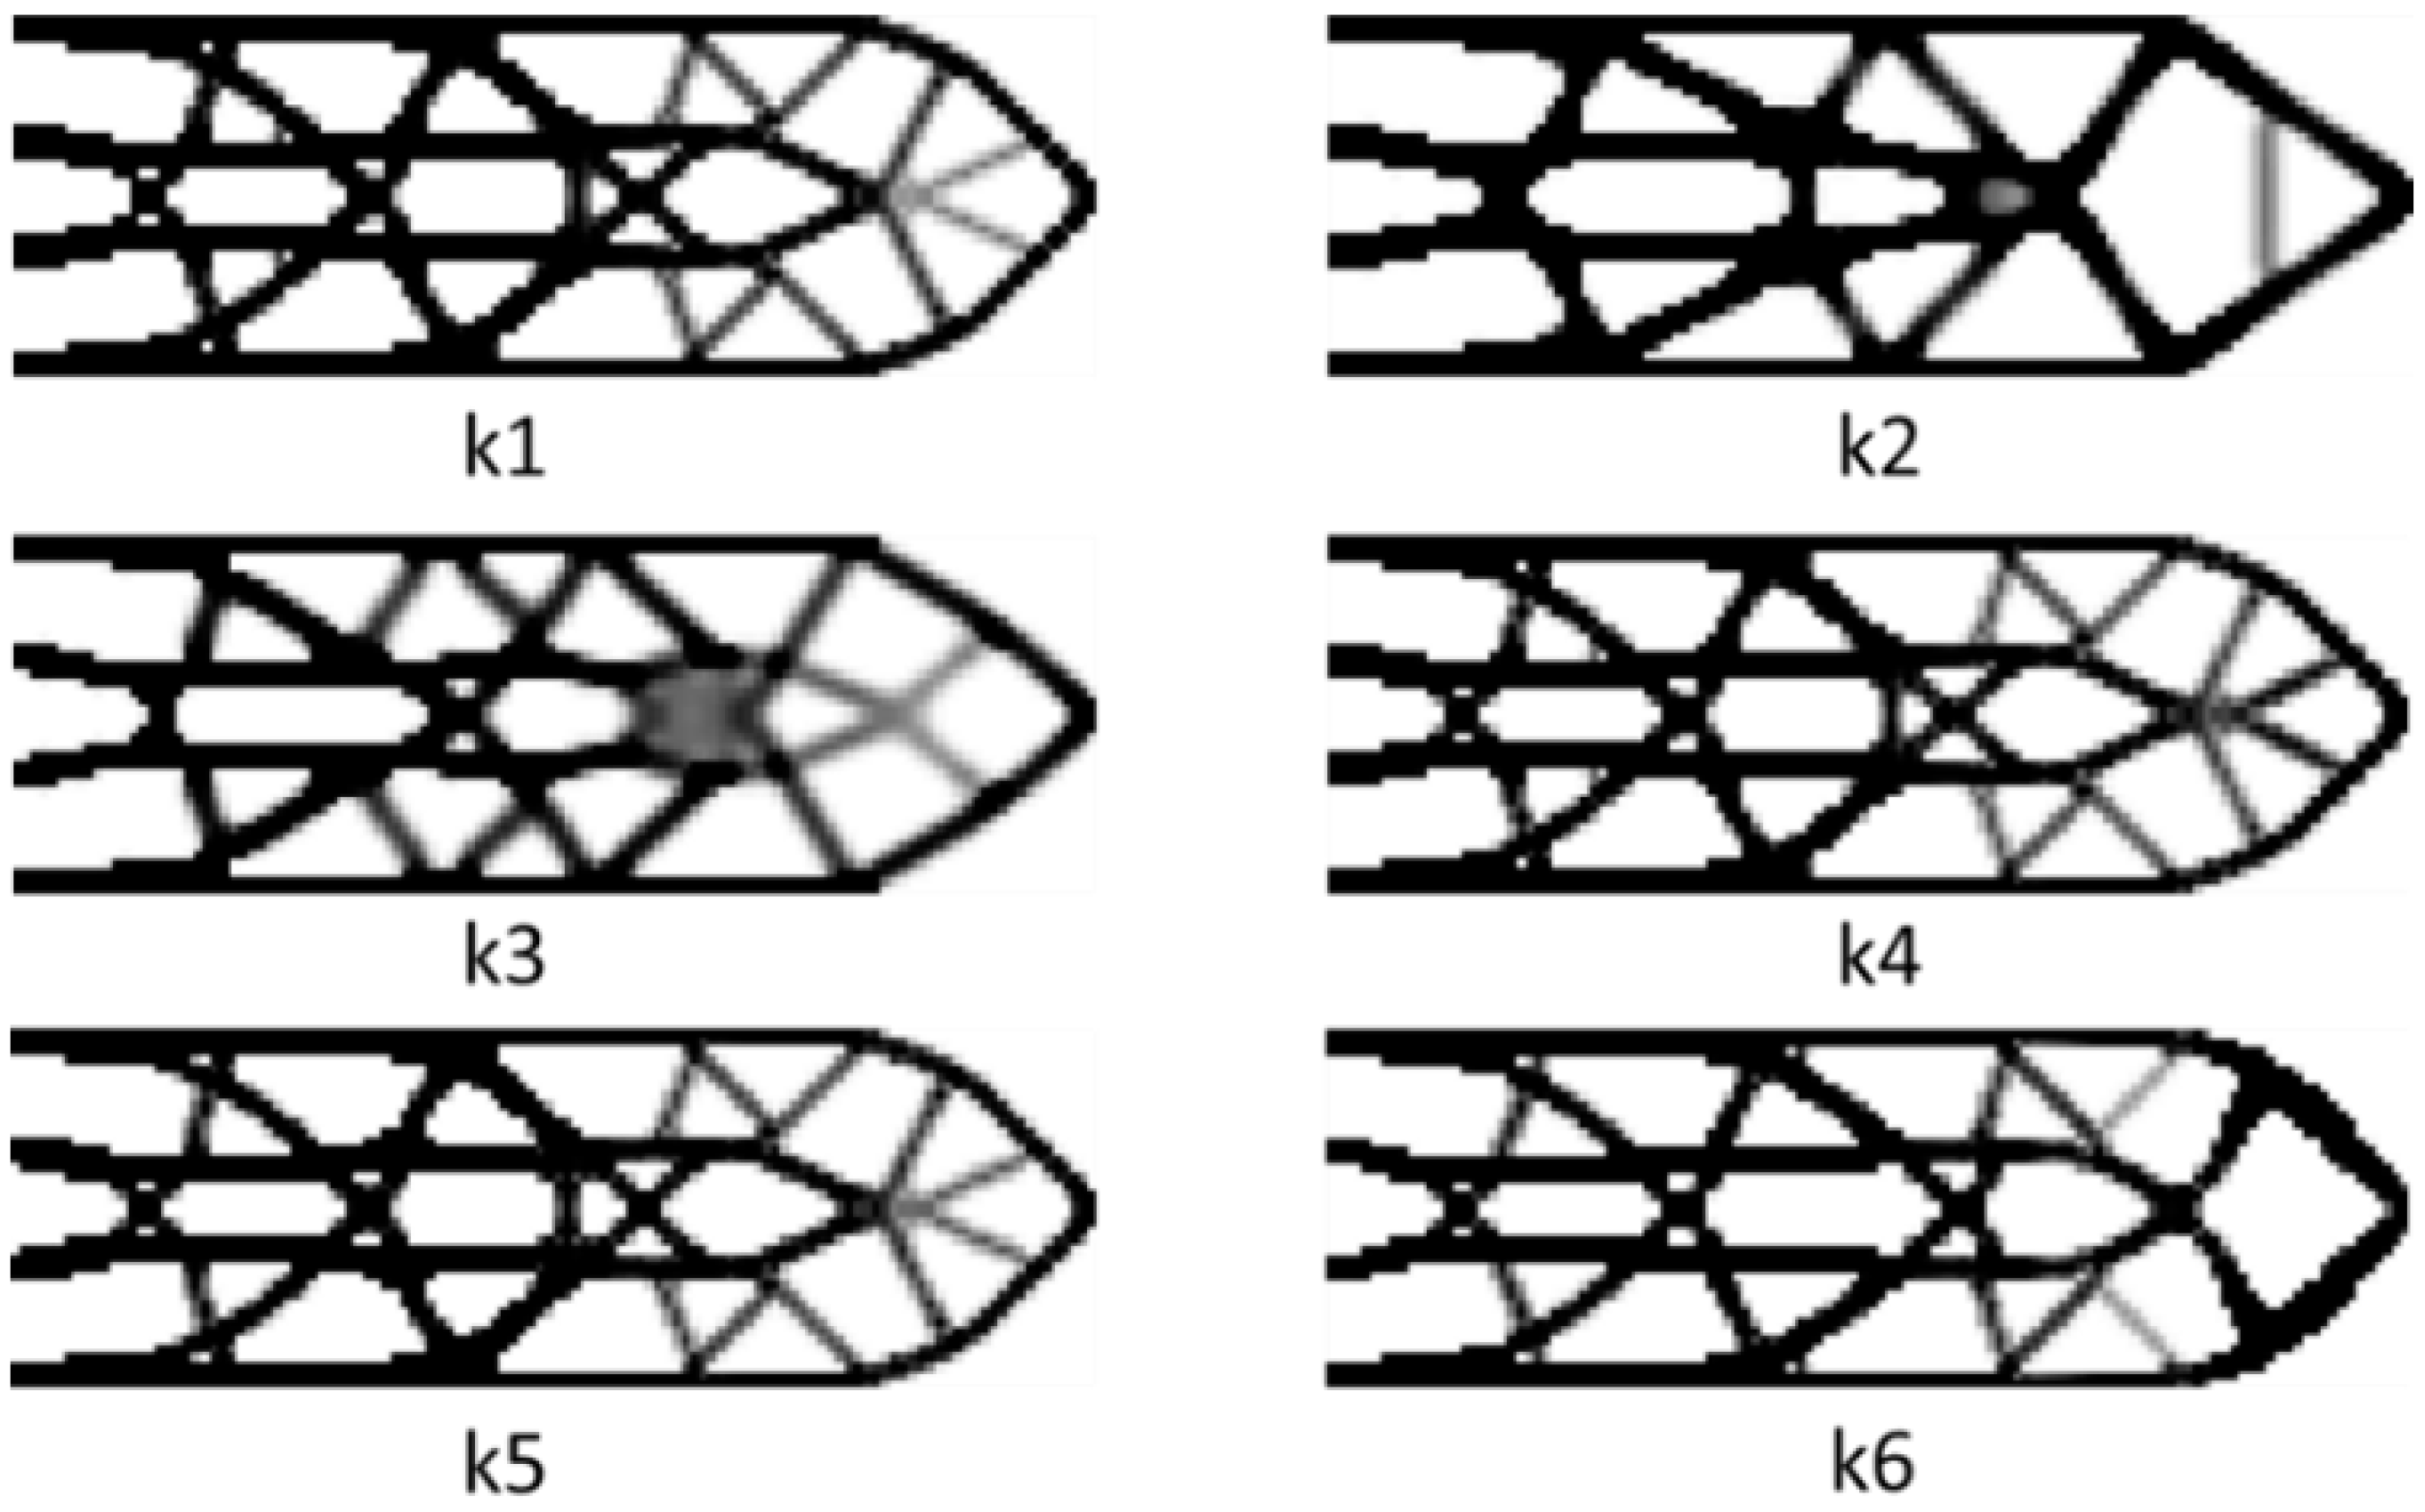
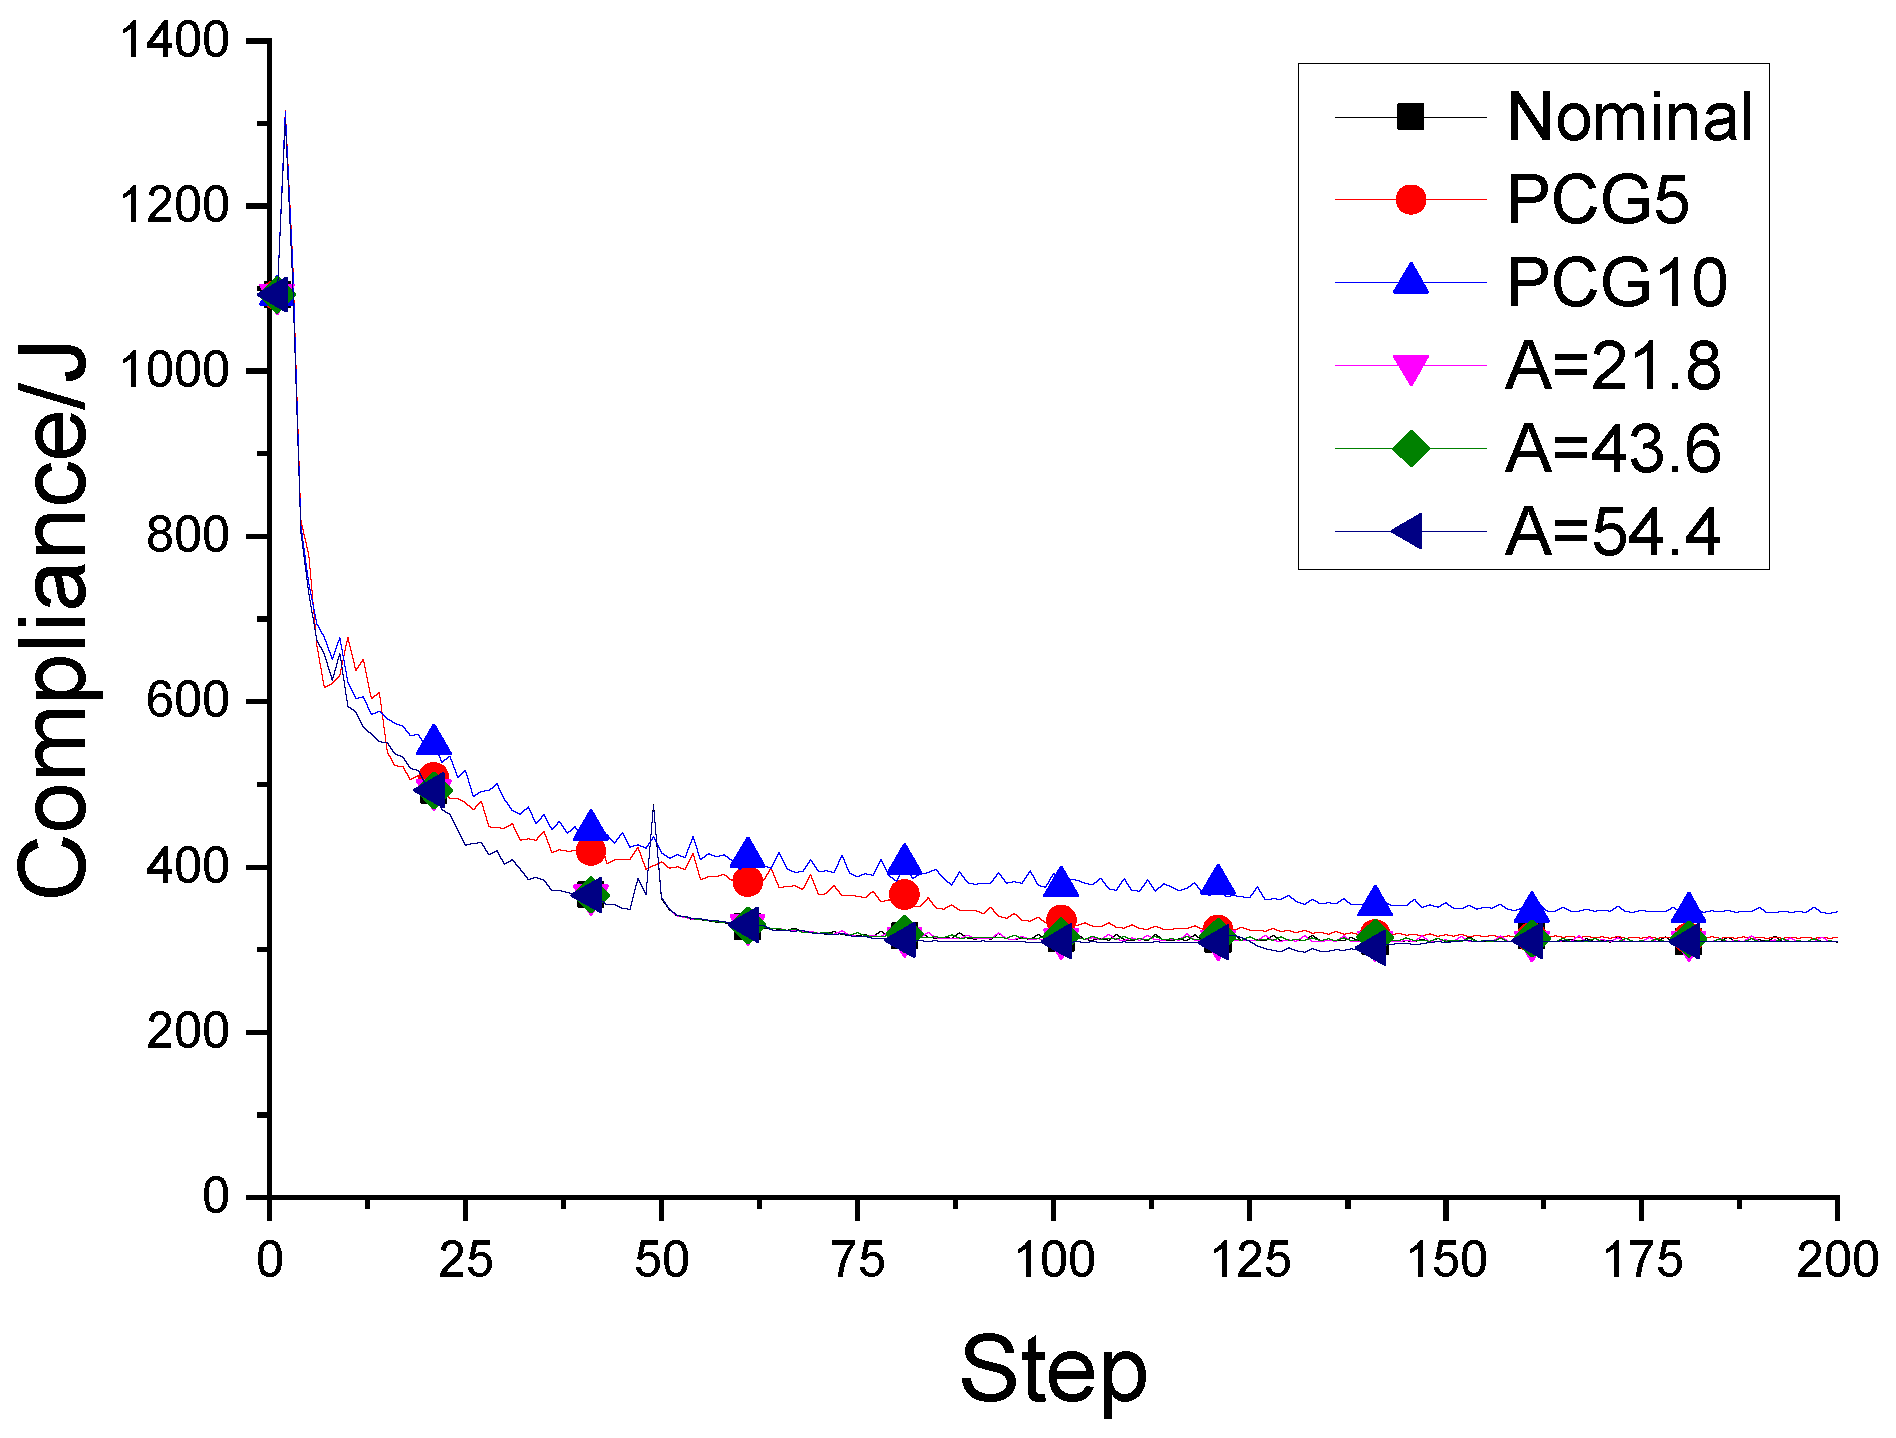
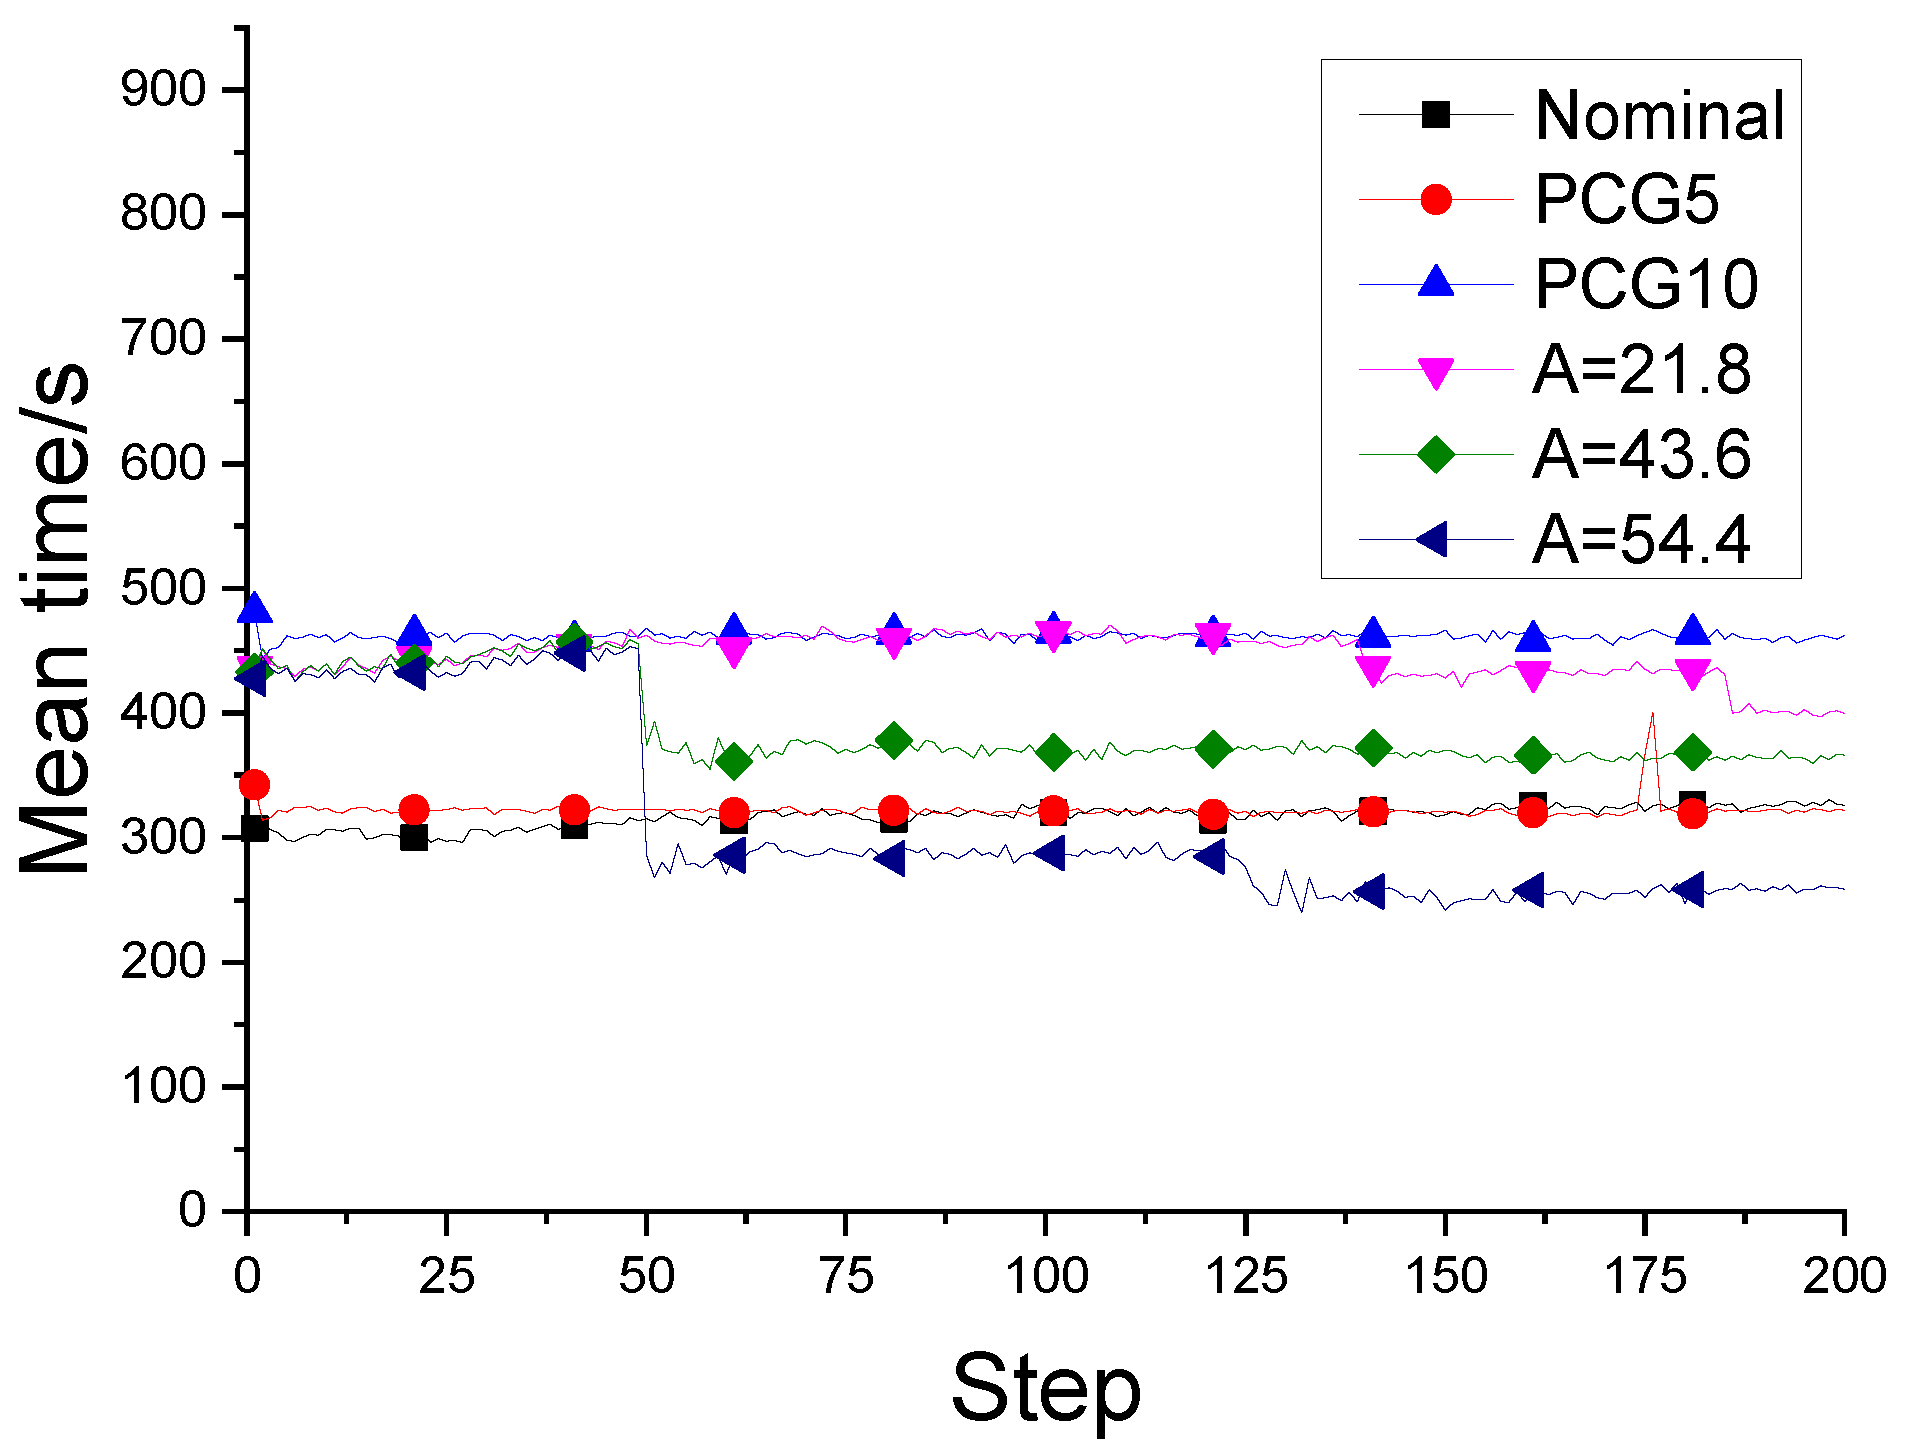
Well, h1 is the result of nominal fail-safe topology optimization. h2 and h3 are optimal designs obtained by combining the PCG method with the fail-safe optimization algorithm. The difference lies in the maximum number of iterations allowed when solving the node displacement vector. In addition, h4, h5 and h6 are topology designs obtained by the density filter-based fail-safe optimization algorithm when using different density filter thresholds. In addition, it also includes the change of the objective function in the optimization process and the average time required for each iteration of each algorithm in the optimization process.
Figure A1.
Comparison of final optimization results when L=3.
Figure A1.
Comparison of final optimization results when L=3.
Figure A2.
Tendency of objective function when L=3.
Figure A2.
Tendency of objective function when L=3.
Figure A3.
Change of iteration step size during optimization when L=3.
Figure A3.
Change of iteration step size during optimization when L=3.
When the side length of the local damage model is L = 14, the fail-safe optimization design obtained when each optimization algorithm is adopted, the change of the objective function in the optimization process, and the average time required for each iteration of each algorithm in the optimization process.
Figure A4.
Comparison of final optimization results when L=14.
Figure A4.
Comparison of final optimization results when L=14.
Figure A5.
Tendency of objective function when L=14.
Figure A5.
Tendency of objective function when L=14.
Figure A6.
Change of iteration step size during optimization when L=14.
Figure A6.
Change of iteration step size during optimization when L=14.
References
- Allaire, G., et al., MULTI-PHASE STRUCTURAL OPTIMIZATION VIA A LEVEL SET METHOD. Esaim-Control Optimisation and Calculus of Variations, 2014. 20(2): p. 576-611.
- Almeida, S.R.M., G.H. Paulino, and E.C.N. Silva, A simple and effective inverse projection scheme for void distribution control in topology optimization. Structural and Multidisciplinary Optimization, 2009. 39(4): p. 359-371. [CrossRef]
- Guest, J.K., J.H. Prevost, and T. Belytschko, Achieving minimum length scale in topology optimization using nodal design variables and projection functions. International Journal for Numerical Methods in Engineering, 2004. 61(2): p. 238-254. [CrossRef]
- Sigmund, O., A 99 line topology optimization code written in Matlab. Structural and Multidisciplinary Optimization, 2001. 21(2): p. 120-127. [CrossRef]
- Sigmund, O., Morphology-based black and white filters for topology optimization. Structural and Multidisciplinary Optimization, 2007. 33(4-5): p. 401-424. [CrossRef]
- van Dijk, N.P., et al., Level-set methods for structural topology optimization: a review. Structural and Multidisciplinary Optimization, 2013. 48(3): p. 437-472. [CrossRef]
- Dou, S., M.J.S. Stolpe, and M. Optimization, On stress-constrained fail-safe structural optimization considering partial damage. Vol. 63. 2021. 929-933. [CrossRef]
- Du, J.-Z., et al., Fail-safe topology optimization of continuum structures with fundamental frequency constraints based on the ICM method. Acta Mechanica Sinica, 2020. 36(5): p. 1065-1077. [CrossRef]
- Jansen, M., et al., Topology optimization of fail-safe structures using a simplified local damage model. Structural and Multidisciplinary Optimization, 2014. 49(4): p. 657-666. [CrossRef]
- Lüdeker, J.K. and B. Kriegesmann, Fail-safe optimization of beam structures. Journal of Computational Design and Engineering, 2019. 6(3): p. 260-268.
- Pollini, N.J.a.e.-p., Fail-safe optimization of viscous dampers for seismic retrofitting. 2020.
- Stolpe, M., Fail-safe truss topology optimization. Structural and Multidisciplinary Optimization, 2019. 60(4): p. 1605-1618.
- Zhao, T., et al., Fail-safe topology optimization considering fatigue. Structural and Multidisciplinary Optimization, 2023. 66(6). [CrossRef]
- Zhou, M. and R. Fleury, Fail-safe topology optimization. Structural and Multidisciplinary Optimization, 2016. 54(5): p. 1225-1243.
- Guest, J.K., Topology optimization with multiple phase projection. Computer Methods in Applied Mechanics and Engineering, 2009. 199(1-4): p. 123-135.
- Wei, P., et al., An 88-line MATLAB code for the parameterized level set method based topology optimization using radial basis functions. Structural and Multidisciplinary Optimization, 2018. 58(2): p. 831-849. [CrossRef]
- Zhou, M., et al., Minimum length scale in topology optimization by geometric constraints. Computer Methods in Applied Mechanics and Engineering, 2015. 293: p. 266-282. [CrossRef]
- Deng, H., A Heaviside function-based density representation algorithm for truss-like buckling-induced mechanism design. International Journal for Numerical Methods in Engineering, 2019. 119(11): p. 1069-1097.
- Luo, C. and J.K. Guest, Optimizing Topology and Fiber Orientations With Minimum Length Scale Control in Laminated Composites. Journal of Mechanical Design, 2021. 143(2). [CrossRef]
- Wang, Y., L. Zhang, and M.Y. Wang, Length scale control for structural optimization by level sets. Computer Methods in Applied Mechanics and Engineering, 2016. 305: p. 891-909. [CrossRef]
- Behrou, R., et al., Revisiting element removal for density-based structural topology optimization with reintroduction by Heaviside projection. Computer Methods in Applied Mechanics and Engineering, 2021. 380. [CrossRef]
- Hederberg, H. and C.J. Thore, Topology optimization for fail-safe designs using moving morphable components as a representation of damage. Structural and Multidisciplinary Optimization, 2021. 64(4): p. 2307-2321. [CrossRef]
- Peng, X.R. and Y.K. Sui, Lightweight topology optimization with consideration of the fail-safe design principle for continuum structures. Engineering Optimization, 2021. 53(1): p. 32-48. [CrossRef]
- Tromme, E., A. Kawamoto, and J.K. Guest, Topology optimization based on reduction methods with applications to multiscale design and additive manufacturing. Frontiers of Mechanical Engineering, 2020. 15(1): p. 151-165. [CrossRef]
- Ambrozkiewicz, O. and B. Kriegesmann, Density-based shape optimization for fail-safe design. Journal of Computational Design and Engineering, 2020. 7(5): p. 615-629. [CrossRef]
- Gao, J., B. Song, and Z. Mao, A novel approach for length scale control in structural topology optimization. Engineering Optimization, 2019. 51(10): p. 1668-1686. [CrossRef]
- Sivapuram, R., P.D. Dunning, and H.A. Kim, Simultaneous material and structural optimization by multiscale topology optimization. Structural and Multidisciplinary Optimization, 2016. 54(5): p. 1267-1281. [CrossRef]
- Vatanabe, S.L., et al., Topology optimization with manufacturing constraints: A unified projection-based approach. Advances in Engineering Software, 2016. 100: p. 97-112. [CrossRef]
- Wang, X., et al., Reliability-Based Topology Optimization of Fail-Safe Structures Using Moving Morphable Bars. Cmes-Computer Modeling in Engineering & Sciences, 2023. 136(3): p. 3173-3195. [CrossRef]
- Andreassen, E., et al., Efficient topology optimization in MATLAB using 88 lines of code. Structural and Multidisciplinary Optimization, 2011. 43(1): p. 1-16. [CrossRef]
- Luo, Z., et al., Topology optimization of structures using meshless density variable approximants. International Journal for Numerical Methods in Engineering, 2013. 93(4): p. 443-464.
|
Disclaimer/Publisher’s Note: The statements, opinions and data contained in all publications are solely those of the individual author(s) and contributor(s) and not of MDPI and/or the editor(s). MDPI and/or the editor(s) disclaim responsibility for any injury to people or property resulting from any ideas, methods, instructions or products referred to in the content. |
© 2023 by the authors. Licensee MDPI, Basel, Switzerland. This article is an open access article distributed under the terms and conditions of the Creative Commons Attribution (CC BY) license (http://creativecommons.org/licenses/by/4.0/).
