Submitted:
21 December 2023
Posted:
25 December 2023
You are already at the latest version
Abstract
Process mining offers significant services in the development of digital threads and digital twin applications for healthcare. One of the sub-emerging case studies is the use of patients’ location data in process mining analyses. While the streamlining of published works is focused on introducing process discovery algorithms, there is a necessity to address challenges beyond that. Literature analysis indicates that explainability, reasoning, and characterizing the root causes of process drifts in healthcare processes is an important but overlooked challenge. In addition, incorporating domain-specific knowledge into process discovery could be a significant contribution to process mining literature. To address this, we present the DIAG approach that consists of a meta-model and an algorithm that enables diagnosing in process mining through an ontology-driven approach. With DIAG, we modeled the healthcare semantics in a process mining application and diagnosed the causes of drifts in patients’ pathways. We performed an experiment in a hospital living lab to examine the effectiveness of the DIAG approach.
Keywords:
process mining
; ontology
; care pathways
; digital thread
; model-based system engineering
; real-time location systems
1. Introduction
Process-oriented data science projects are offering significant results in the healthcare sector through applications of process mining [1,2]. Process mining [3] is a research paradigm that offers analytical services to extract and transform data into illustrative information. Three main proposed services are process discovery, conformance checking, and enhancement. Process discovery extracts models from event logs, whereas conformance checking evaluates the observed behavior against a reference model. Enhancement looks for opportunities to improve either the structure or performance of the processes. These services help healthcare providers to identify and prevent adverse situations such as medication errors, and deviations leading to inefficient care pathways. One of the known applications of process mining is related to extracting patients’ pathways from location event logs [2]. The combination of process mining and patient localization provides a powerful tool to gain insight to identify bottlenecks, safety hazards, and optimization opportunities within the processes in which patients are involved. However, such analyses are limited to just visualization of processes or some basic statistical analysis [4].
Recently, researchers reviewed the main challenges confronting process mining applications in healthcare [1]. Following their guidelines, Table 1 presents these characteristics and challenges. Looking at C2 & C3 in Table 1, it is important for process mining applications to provide extended information about healthcare processes, such as causes of drifts and deviations in processes. Research has shown that diagnosing inefficiencies and reasoning in healthcare processes are often ignored [5,6,7].
Accordingly, the research question here is:
- “How to embed the domain knowledge into process mining applications in such a way that we can diagnose the causes of deviations and drifts from the reference patients’ pathways?"(RQ 3, c.f. Figure 1).
We aim to answer this question by introducing the DIAG approach that uses a meta-model and an algorithm. Accordingly, we integrate the domain knowledge by an ontology-driven framework, which could play a crucial role in reasoning and diagnosing process deviations. By identifying concepts, relationships, and rules within the patients’ pathways analysis, the DIAG meta-model offers a formal and structured framework for capturing and harmonizing domain knowledge. The association of the DIAG meta-model and the presented algorithm helps to augment process mining conventional approaches with a cognitive ability to explain and diagnose causes of concept drifts.
Figure 1 provides an overview of the paper’s focus, highlighting what has been discussed and what will be addressed. Globally, this research project aims at improving patient’s pathways by looking into their location data. To do so, many research questions appeared. For instance, RQ 1 describes how to interpret a raw location event log.RQ 2 introduces an important requirement for diagnosing causes of inefficiencies, which is aboutdiscovering a reference process model of patient’s pathways. After addressing these RQs in previous works [8], we faced the explainability in analyzing and diagnosing potential assignable causes (PAC) of concept drifts, which is presented as RQ 3 and the focus of this paper.
The structure of the content unfolds in the following manner. Section 2 offers an overview of related and similar works with a focus on conformance checking and concept drift analyses in process mining. Section 3 will demonstrate the proposal and preliminary concepts. Section 4 evaluates the proposed method within the context of a case study. Finally, section 5 draws a conclusion and outlines possible areas of future research.
2. Background
Conformance checking and concept drift analyses are two process mining research avenues that are important to the development of this paper’s contributions.
2.1. Conformance checking
Conformance checking methods enable users to draw conclusions about the relation and misalignment between an event log and its corresponding process model. Generally, conformance-checking methods provide measurements to evaluate how well a process model could represent the behavior recorded in an event log [3]. These measurements or quality metrics are fitness, simplicity, precision, and generalization [9]. As much as these metrics can provide insights about deviations between two behaviors (modeled, and recorded), they lack the necessary semantics to highlight the reasons for observing such deviations.
Conformance checking is not limited only to analyzing the control-flow perspective. Other methods that focus on other perspectives are data-aware, resource-aware alignments, and integrated approaches. They evaluate the performance metrics of a process (such as cycle time) by looking at defined objectives. Some works also focus on statistical and machine learning approaches to detect the proper objectives of the process and compare the current process performance with those goals [10,11,12].
It is important to recall the attention to this issue that conformance checking methods help us to detect deviating behaviors; however, they are not capable of detecting the cause(s) of deviations in processes without considering the relevant domain knowledge. Simply put, they lack the cognitive ability for reasoning.
Many existing conformance-checking applications are capable of detecting deviations in process mining [9,13,14,15,16,17]; however, these analyses do not cover the important issue of explainability and integration of domain knowledge into process mining analyses. This issue has also been highlighted in [18,19]. Authors in [18] mentioned that clinical decision-support systems are required to integrate human interpretation in conformance-checking analyses. In addition, they have emphasized the need for computer-interpretable guidelines. Based on our reviews of these existing works, we imply that it is important to go beyond detection and discovery, a statement that has been seen previously in [1,5].
This is the motivation behind using an ontology-driven approach and introducing the meta-model in the proposal section of this paper (c.f. Figure 2).
2.2. Concept drifts
Concept drifts in process mining is associated with a challenge to analyze processes and detect changes in their state while they are being monitored [20]. Originally, concept drifts had their roots in data mining, and it refers to a situation where the relationship between the input data and the target values changes [21].
Researchers in [22] mentioned that while working on concept drifts in process mining, there are three challenges that should be addressed: (i) change point detection which is about detecting a specific trend or seasonality in changes happening to the process. (ii) Change localization and characterization addresses the detection of the nature of a change. This is the closest term to the diagnosing of deviations in a business process, and the research done in this area is similar to our proposal. After identifying and localizing the changes, (iii) change process discovery challenge addresses several methods that help us to predict the future modifications in the process.
Concept drift analyses have five different aspects:
- Change perspective:time, control-flow, resource, data
- Change analysis:online, offline
- Change duration:momentary, permenant
- Change type:sudden, gradual, recurring, incremental
- Change dynamic:multi-order (i.e., process changes happen at different time periods)
Despite identifying these aspects, one of the missing links in the literature on concept drift analyses is how to create a response system to address the detected deviations in the process in a manner so the system can be agile and flexible in fixing the drift.
2.3. Related works
The work in [23] introduces a method for change point detection in processes by making use of the activity correlation strength feature extracted using an event log. The proposed technique helps to localize a deviation by applying statistical hypothesis testing methods.
Authors in [5] highlight the importance of root-cause analysis in an ever-changing business environment by proposing a framework that eventually could help companies in handling concept drifts and uncertainty in their operational processes. The mentioned framework adds an explainability layer to concept drift detection.
Previous works in [8] signify the importance of model-based system engineering approaches for eliciting knowledge prior to applying process mining analysis, whereas most existing research has focused on detecting and locating significant changes in a process. Such works go further and add a causality check/explainability that determines the origin of concept drifts.
Moreover, results of [21] show a literature review of 45 papers based on two aspects: the concept drift detection, which addresses the perspective aspect, and the analysis aspect to see whether online monitoring is used to monitor the evolution of the process environment. Accordingly, Detection of the nature of concept drifts is something that did not receive adequate attention in the literature. It should be highlighted that one of the main reasons is identified as the challenge to integrate specific domain knowledge in process mining applications. This is one of the motivations of the DIAG.
In addition, looking at the application of process mining and real-time location systems, most of the current works have evolved around information extraction and how we can discover process models from location event logs [24] rather than integrating the domain knowledge. However, as mentioned here, we must venture beyond process discovery as it has been indicated in Table 1 by [1].
The first prerequisite in diagnosing patients’ pathways is to detect the drifts from a reference model. This is labeled as RQ2 in Figure 1. To achieve this, we leveraged the stable heuristic miner algorithm [25]. There are other algorithms to discover the reference process model [26,27]; however, to our humble knowledge, they have not been tested using location event logs. The stable heuristic miner algorithm identifies and localizes drifts by assessing the statistical stability in an event log. It automatically establishes two thresholds: the LCL (lower control limit), and UCL (upper control limit). Behaviors between LCL and UCL are determined stable, while those with a score lower than LCL require diagnoses. Activities or edges with a frequency higher than the UCL may pose a risk to the normal process execution and could lead to potential problems. The results of the stable heuristic miner algorithm are used as inputs for running the DIAG algorithm (i.e., algorithm 1), which will extend the capability of the previous algorithm.
3. Proposal
The proposed ontology-driven process mining approach consists of two main contributions:
- The DIAG meta-model is an ontology-based knowledge representation to engage domain-based semantics in the process mining analyses.
- The DIAG algorithm is a semantic-based algorithm that leverages the DIAG meta-model to generate meaningful insights and add the cognitive capability to process discovery.
Together, these contributions provide the cognitive ability for process mining analytics. Such an approach could outline a potential progression from discovery to conformance checking and, eventually, the enhancement of business processes.
3.1. DIAG meta-model
The DIAG meta-model is shown in Figure 2. This conceptual model shows an explicit use of a domain-specific ontology to define the process domain and promote interoperability. However, we go beyond just a conceptual model. DIAG meta-model is implemented in the R.IO-DIAG1 tool.
This meta-model is made up of eight packages, each of which contains a number of classes for tracking patient’s activities utilizing location information. To start the experimentation, for now, we have developed packages such as Healthcare resources, Organization, Objectives, Location Event Logs, Processes, Functions, Healthcare Functions, and Context.
Inside the Context package, the Potential Assignable Causes (PAC) class has 4 inherited sub-classes defined here as environmental causes, equipment-related causes, human-related causes,and rules and procedures. This class and its inherited sub-classes serve as resources for explainability and reasoning rules to diagnose process drifts.
These deviations are a subset of the fact class, which shows unexpected events in patients’ pathways. The context package primarily includes the domain knowledge that healthcare experts can provide prior to the analyzing phase and using process mining methods. While we have outlined four categories to identify potential assignable causes, it’s worth mentioning that this classification is not limited to only four classes. As experiments become more complex, it may be necessary to identify other categories or identify non-linear relationships.
Additionally, we have modeled the objectives package, which includes important classes to evaluate the quality of business processes and patient’s pathways according to the detected drifts. In this package, we have the objective class, which could be realized by the process class. Objectives define the CTQ (Critical To Quality) characteristics that will define KPI (key performance indicators) to evaluate the quality of a process based on identified quality characteristics. This evaluation will be based on certain specification/target values that are defined by the performance objectives of an organization.
The organization class is defined within the organization package, including other important information that should be modeled prior to launching process mining analyses. In this package, we identify the used resources and components that could [help to] run business processes, according to the capacity and competence of the organization.
Furthermore, to better assess the quality of processes, we defined the function package. Within this, we identified a class as function that is the parent to the healthcare functions. This entity contains a value class, which has three sub-classes that identify the value of executing a certain function (i.e., value-added, non-value added, business value-added). This helps to understand if a deviation or an activity exists, how, and to what extent it would impact a process.
Moreover, we have described the model for integrating location data within the location event-logs package and presented how such information could be defined as resources of an organization for executing business processes.
These modeled domain specifications help to augment the capability of process mining analyses to be more cognitive and capable of diagnosing drifts and issues and assessing the quality of a business process.
As mentioned earlier, to assess the effectiveness of this meta-model, we applied it to depict the underlying architecture of a cognitive process mining tool titled R.IO-DIAG [8]. This open-source tool is developed by incorporating the meta-model as its core semantic engine to capture the important relationships in an experimental setting.
This meta-model is realized by constructing a knowledge graph, which makes it easier to update and extend the knowledge base. The significance of this meta-model lies in its ability to provide the necessary semantics for conducting process-oriented analyses and diagnoses of business processes. Without such a semantic foundation, it would not be feasible to diagnose unanticipated events in patients’ pathways automatically. Figure 3 and Figure 4 provide screenshots of how domain knowledge is modeled in the tool, and an online demonstration video2 is available for a more detailed understanding of how the meta-model provides interoperability and incorporation of the domain knowledge in process mining analyses and its implementation within the tool’s architecture.
Figure 3 and Figure 4 serve as illustrative examples to show how the conceptual DIAG meta-model is actually used in practice to provide cognition to process mining analyses. For instance, these figures show how location tags are dedicated as a resource to each patient to run a process, and how functions are modeled. This information is used to enrich conventional process discovery event logs. In the following, we illustrate the DIAG algorithm’s operation in light of this improvement.
3.2. DIAG algorithm
As outlined in Section 2.3, and shown in Figure 1, prior to diagnosing a cause, it is necessary to detect any drifts or deviations in the patients’ pathways. To achieve this, the DIAG algorithm is based on the stable heuristic miner algorithm [25], and it extends the previous capability of the algorithm to take into account the domain knowledge while discovering process models. Once this step is completed, the DIAG algorithm matches the discovered drifts with PACs modeled by the domain experts in R.IO-DIAG. The steps of this method are presented in algorithm 1. A running example in the following subsection illustrates our approach and each step of the algorithm.
3.2.1. An illustrative example
Potential assignable causes (PAC) for organizational actions can be found, and their repercussions can be recorded thanks to the DIAG meta-model. A knowledge graph incorporates this information, with vertices representing the activities and their PACs. An illustration of this domain knowledge can be seen in Table 2. This method enables a better comprehension of the connections between the various process entities and how PACs may affect healthcare operations.
Now, let’s assume during a data-gathering procedure, an event log like the one below is collected as L:
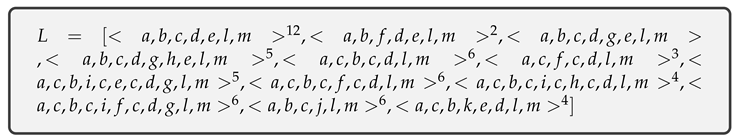 |
As shown in the first two lines of algorithm 1, boththe domain knowledge and the event log will be received as inputs. This is a different approach compared to the conventional process discovery methods. The activities will be extracted from the event log, and a data frame of the domain knowledge will be detected and merged into the raw event log for further analysis.
Thanks to the execution of the stable heuristic miner, the two thresholds of (Upper Control Limit) and (Lower Control Limit) are identified. Then, as shown in lines 10 to 19, lists of unstable_activities, deviating_activities and stable_activities are detected.
To diagnose the causes of drifts, a matrix is generated and placed adjacent to the data, and the algorithm matches the domain knowledge and the data frame of deviating behaviors. This matrix will be used in the extraction of edges/connections among activities and it will help to detect the causes of deviations. Finally, we aim to identify each type of extracted behavior by a different color. This helps domain experts to distinguish between stable behaviors, drifts, and corresponding causes of deviations. Consequently, the DIAG algorithm 1 produces the model depicted in Figure 5.
The activities and edges that are shown in black are expressing stable behaviorswhich are activities that are typically present in multiple iterations of the process and are considered major activities in the execution of patients’ pathways. The red color indicates activities and edges that exhibit higher variations compared to the normal, stable state of the entire data set. The dashed edges are drifting connections among activities. The activities in green are drifting activities.
Once the ensemble of behaviors has been discovered, we can enhance the model by incorporating information from the knowledge graph associated with each activity, healthcare function, and the observed drift. For instance, the deviation between activity `b’ and activity `k’ corresponds to an environmental cause. The deviation between activity `c’ and `j’ is related to a human error. The edge between activity `c’ and `h’ is related to a change in rules and procedures. When some edges demonstrate 0 values, it means that the modeled PAC did not match these deviations. Simply put, the domain knowledge was not adequate. A case study in a hospital living lab is devised to assess pragmatically the effectiveness and applicability of our method and proposal which will be introduced in the next section.
| Algorithm 1 DIAG algorithm |
|
4. Case study
4.1. Presentation of the case study
For this experiment, we modeled the patients’ activities via seven departments and about 300 patients at Toulouse Hospital. Despite the hospital having high patient traffic, our experiment was limited by dangerous procedures. We gathered data regarding the hospital’s layout and departments while concentrating on the urology department’s analysis.
We modeled important information related to the environment, such as activity types, potential assignable causes, and performance objectives for patients’ pathways using the DIAG meta-model. An example of these actions can be seen in Figure 3 and Figure 4.
Later on, we clarified each step of our approach with the objective of diagnosing deviations in patients’ pathways. These steps were: Configuration of the environment and systems, Location data gathering, Location data interpretation, Business process modeling, Business process analyzing, Business process diagnosing, and Business process simulating.
4.2. Results & analyses
In the first step, we obtained and modeled the domain knowledge and other relevant information about the hospital premises to start the location data gathering. This is similar to the running example and what is presented in Table 2 and Figure 3 and Figure 4. The third, fourth, and fifth steps have been previously discussed in our works [4,8]. To illustrate the diagnosing step, we incorporated the modeled knowledge as an input for the DIAG algorithm 1. For a better illustration of the knowledge graph output, we used Table 3 to display the outcome of our model for each healthcare function in the urology department. Here, users considered the relationships among activities and mentioned “what will be the deviation if a certain PAC is present?"
After receiving the event log and the knowledge set, DIAG (c.f. algorithm 1) discovered the descriptive reference process model and associated each drift with the modeled causes of deviations for unexpected behaviors. The result of applying this method is shown in Figure 6.
Similar to what has been presented by the running example, there are three types of discovered behaviors from the event log:
- Stable activities and edges: these behaviors are shown in black. They are presenting the most common and normal behaviors.
- Activities and edges with high variations (unstable behaviors): these behaviors are shown in red. They correspond to observations with a higher level of variations than the upper control limit of the stability state.
- Drifts: these behaviors are represented by activities modeled in green, and dashed edges. They illustrate unanticipated occurrences recorded in the event log.
Furthermore, the causes of deviations among activities are displayed alongside the drifting edges. In cases where the information in the knowledge set does not align with the extracted deviations, or it does not exist, a 0 value is assigned to those deviations. Consequently, it can be inferred that some cases in the “Exam Room IDE” finished their processes because of a problem related to the “Equipment”. Similarly, due to human-related errors, certain patients had to return to waiting room 5. These errors could be attributed to miscommunication between staff, improper training of personnel, or inadequate staffing levels. Further investigation may be required to highlight the specific cause of these errors and take appropriate measures to prevent similar incidents from happening in the future. This task could be considered as the prognosis initiatives and tackled through simulation in future research.
To our humble knowledge, such a mixture of process discovery while detecting and explaining concept drift and deviations was not addressed before in the literature of process mining. The approach we took in developing DIAG helps domain experts not to be left out with process discovery results that are not augmented enough with specific explanations. In essence, providing a framework that offers explainability and reasoning to analyze healthcare processes should be a necessity since we are dealing with a sensible sector such as healthcare.
5. Conclusion
We observed that researchers examined the expansion of process mining applications in healthcare and proposed crucial scientific avenues for the future, such as explainability and reasoning in analysis and going beyond process discovery. Although patients and care pathways discovery is receiving lots of attention, reasoning, and incorporating domain knowledge are neglected. More research is required to employ semantics in such analyses, and this is axiomatic for digital and cognitive twin applications in healthcare.
This paper addresses the need to incorporate healthcare domain knowledge into process mining applications and presents a method to achieve this. This led to the presentation of two contributions.
First, the DIAG meta-model provides a framework for a process mining application that can use patients’ location data and other semantics such as experts’ knowledge. Second, theDIAG algorithm. This algorithm is based on the previously established stable heuristic miner algorithm; however, it adds cognitive ability to the previous algorithm, and it uses the modeled domain knowledge to perform diagnosis on top of the detected deviations in patients’ pathways. This algorithm can aid healthcare providers in identifying the root causes of drifts in patients’ pathways, which can inform interventions to enhance patients’ experience inside hospitals and streamline healthcare processes.
Our approach offers several benefits to healthcare providers. Firstly, it allows for the automatic discovery of a reference patients’ pathway, which can identify normal activities and drifts in the flow of patients through the healthcare system. Secondly, it enables the automatic reasoning and diagnosis of drifts and unexpected behaviors. This helps to identify the root causes of inefficiencies and errors. We demonstrated the applicability of this method through an experiment conducted at a university hospital. To the best of our knowledge, attaining such results has never been addressed by previous process mining activities. In addition, previous process discovery algorithms were not able to diagnose deviating behaviors in an event log automatically.
Limitations and future works
There are certain aspects of this approach that could raise concerns for users. For instance, ontology-driven methods often have limited flexibility. This means they are designed with a specific domain in mind and may not be easily adaptable to other sectors. Therefore, it is necessary to address this issue. The development of such methods could be a time-consuming and resource-intensive process. Also, we are heavily dependent on experts’ understanding of the domain. We believe that there is an open research avenue for developing standard and reference ontologies for the healthcare sector and aligning this with process-oriented analyses.
Moreover, in this work, the non-linear relationships of potential assignable causes are not well addressed. This is a limitation that should be addressed if this primary method for domain knowledge integration in healthcare is seen as applicable in supplementary experimentation.
Despite that, we pave the path to embed healthcare domain-specific knowledge into process mining analysis, which helps to go beyond process discovery and provide explainability while performing process mining analyses.
Given these limitations, we strongly believe there is a lot of potential for fusing model-based system engineering approaches and ontologies into process mining analyses. We are planning to improve our methods to extract process models with a procedural modeling language that could be used in the simulation of patients’ pathways. For this reason, there is a need to improve the gathered semantics which could help us to detect the decision points.
Conflicts of Interest
The authors declare no conflict of interest.
Abbreviations
The following abbreviations are used in this manuscript:
| DIAG | Data, Information, Awareness, Governance |
| UCL | Upper Control Limit |
| CL | Central Line |
| LCL | Lower Control Limit |
| PAC | Potential Assignable Cause |
References
- Munoz-Gama, J.; Martin, N.; Fernandez-Llatas, C.; Johnson, O.A.; Sepúlveda, M.; Helm, E.; Galvez-Yanjari, V.; Rojas, E.; Martinez-Millana, A.; Aloini, D.; Amantea, I.A.; Andrews, R.; Arias, M.; Beerepoot, I.; Benevento, E.; Burattin, A.; Capurro, D.; Carmona, J.; Comuzzi, M.; Dalmas, B.; Fuente, R.d.l.; Francescomarino, C.D.; Ciccio, C.D.; Gatta, R.; Ghidini, C.; Gonzalez-Lopez, F.; Ibanez-Sanchez, G.; Klasky, H.B.; Kurniati, A.P.; Lu, X.; Mannhardt, F.; Mans, R.; Marcos, M.; Carvalho, R.M.d.; Pegoraro, M.; Poon, S.K.; Pufahl, L.; Reijers, H.A.; Remy, S.; Rinderle-Ma, S.; Sacchi, L.; Seoane, F.; Song, M.; Stefanini, A.; Sulis, E.; Hofstede, A.H.M.t.; Toussaint, P.J.; Traver, V.; Valero-Ramon, Z.; Weerd, I.v.d.; Aalst, W.M.P.v.d.; Vanwersch, R.; Weske, M.; Wynn, M.T.; Zerbato, F. Process mining for healthcare: Characteristics and challenges. Journal of Biomedical Informatics 2022, 127, 103994. [CrossRef]
- De Roock, E.; Martin, N. Process mining in healthcare – An updated perspective on the state of the art. Journal of Biomedical Informatics 2022, 127, 103995. [CrossRef]
- van der Aalst, W. Data Science in Action. In Process Mining: Data Science in Action; Springer Berlin Heidelberg: Berlin, Heidelberg, 2016; pp. 3–23. [CrossRef]
- Namaki Araghi, S.; Fontaili, F.; Lamine, E.; Salatge, N.; Lesbegueries, J.; Pouyade, S.R.; Tancerel, L.; Benaben, F. A Conceptual Framework to Support Discovering of Patients’ Pathways as Operational Process Charts. 2018 IEEE/ACS 15th International Conference on Computer Systems and Applications (AICCSA), 2018, pp. 1–6. [CrossRef]
- Adams, J.N.; van Zelst, S.J.; Quack, L.; Hausmann, K.; van der Aalst, W.M.P.; Rose, T. A Framework for Explainable Concept Drift Detection in Process Mining. arXiv:2105.13155 [cs] 2021. arXiv: 2105.13155. [CrossRef]
- Namaki Araghi, S.; Fontanili, F.; Lamine, E.; Salatge, N.; Benaben, F. Interpretation of Patients’ Location Data to Support the Application of Process Mining Notations. HEALTHINF 2020 - 13th International Conference on Health Informatics; SCITEPRESS - Science and Technology Publications: La Valette, Malta, 2020; Vol. 5, Proceedings of the 13th International Joint Conference on Biomedical Engineering Systems and Technologies - HEALTHINF, pp. 472–481. [CrossRef]
- Yang, W.; Su, Q. Process mining for clinical pathway: Literature review and future directions. Service Systems and Service Management (ICSSSM), 2014 11th International Conference on. IEEE, 2014, pp. 1–5. [CrossRef]
- Namaki Araghi, S. A methodology for business process discovery and diagnosis based on indoor location data : Application to patient pathways improvement. Theses, Ecole des Mines d’Albi-Carmaux, 2019.
- Carmona, J.; van Dongen, B.; Weidlich, M. Conformance Checking: Foundations, Milestones and Challenges. In Process Mining Handbook; van der Aalst, W.M.P.; Carmona, J., Eds.; Lecture Notes in Business Information Processing, Springer International Publishing: Cham, 2022; pp. 155–190. [CrossRef]
- Rodriguez-Fernandez, V.; Trzcionkowska, A.; Gonzalez-Pardo, A.; Brzychczy, E.; Nalepa, G.J.; Camacho, D. Conformance Checking for Time-Series-Aware Processes. IEEE Transactions on Industrial Informatics 2021, 17, 871–881. [CrossRef]
- Van der Aalst, W.; Adriansyah, A.; van Dongen, B. Replaying history on process models for conformance checking and performance analysis. Wiley Interdisciplinary Reviews: Data Mining and Knowledge Discovery 2012, 2, 182–192. [CrossRef]
- Carmona, J.; van Dongen, B.; Solti, A.; Weidlich, M. Conformance checking. Switzerland: Springer.[Google Scholar] 2018. [CrossRef]
- Burattin, A.; Maggi, F.M.; Sperduti, A. Conformance checking based on multi-perspective declarative process models. Expert Systems with Applications 2016, 65, 194–211. [CrossRef]
- Gatta, R.; Vallati, M.; Fernandez-Llatas, C.; Martinez-Millana, A.; Orini, S.; Sacchi, L.; Lenkowicz, J.; Marcos, M.; Munoz-Gama, J.; Cuendet, M.; de Bari, B.; Marco-Ruiz, L.; Stefanini, A.; Castellano, M. Clinical Guidelines: A Crossroad of Many Research Areas. Challenges and Opportunities in Process Mining for Healthcare. Business Process Management Workshops; Di Francescomarino, C.; Dijkman, R.; Zdun, U., Eds.; Springer International Publishing: Cham, 2019; Lecture Notes in Business Information Processing, pp. 545–556. [CrossRef]
- Dunzer, S.; Stierle, M.; Matzner, M.; Baier, S. Conformance checking: a state-of-the-art literature review. Proceedings of the 11th International Conference on Subject-Oriented Business Process Management; Association for Computing Machinery: New York, NY, USA, 2019; S-BPM ONE ’19, pp. 1–10. [CrossRef]
- Asare, E.; Wang, L.; Fang, X. Conformance Checking: Workflow of Hospitals and Workflow of Open-Source EMRs. IEEE Access 2020, 8, 139546–139566. Conference Name: IEEE Access. [CrossRef]
- Benevento, E.; Pegoraro, M.; Antoniazzi, M.; Beyel, H.H.; Peeva, V.; Balfanz, P.; van der Aalst, W.M.P.; Martin, L.; Marx, G. Process Modeling and Conformance Checking in Healthcare: A COVID-19 Case Study. Process Mining Workshops; Montali, M.; Senderovich, A.; Weidlich, M., Eds.; Springer Nature Switzerland: Cham, 2023; Lecture Notes in Business Information Processing, pp. 315–327. [CrossRef]
- Oliart, E.; Rojas, E.; Capurro, D. Are we ready for conformance checking in healthcare? Measuring adherence to clinical guidelines: A scoping systematic literature review. Journal of Biomedical Informatics 2022, 130, 104076. [CrossRef]
- Soliman-Junior, J.; Tzortzopoulos, P.; Baldauf, J.P.; Pedo, B.; Kagioglou, M.; Formoso, C.T.; Humphreys, J. Automated compliance checking in healthcare building design. Automation in Construction 2021, 129, 103822. [CrossRef]
- Elkhawaga, G.; Abuelkheir, M.; Barakat, S.I.; Riad, A.M.; Reichert, M. CONDA-PM—A Systematic Review and Framework for Concept Drift Analysis in Process Mining. Algorithms 2020, 13, 161. Number: 7 Publisher: Multidisciplinary Digital Publishing Institute. [CrossRef]
- Sato, D.M.V.; De Freitas, S.C.; Barddal, J.P.; Scalabrin, E.E. A Survey on Concept Drift in Process Mining. ACM Computing Surveys 2021, 54, 189:1–189:38. [CrossRef]
- Bose, R.P.J.C.; van der Aalst, W.M.P.; Žliobaitė, I.; Pechenizkiy, M. Dealing With Concept Drifts in Process Mining. IEEE Transactions on Neural Networks and Learning Systems 2014, 25, 154–171. Conference Name: IEEE Transactions on Neural Networks and Learning Systems. [CrossRef]
- ManojKumarM, V.; Thomas, L.; Basava, A. Capturing the Sudden Concept Drift in Process Mining. 2015.
- Martinez-Millana, A.; Lizondo, A.; Gatta, R.; Vera, S.; Salcedo, V.T.; Fernandez-Llatas, C. Process Mining Dashboard in Operating Rooms: Analysis of Staff Expectations with Analytic Hierarchy Process. International Journal of Environmental Research and Public Health 2019, 16. [CrossRef]
- Namaki Araghi, S.; Fontanili, F.; Lamine, E.; Okongwu, U.; Benaben, F. Stable Heuristic Miner: applying statistical stability to discover the common patient pathways from location event logs. Intelligent Systems with Applications 2022, 14, 200071. [CrossRef]
- Augusto, A.; Conforti, R.; Dumas, M.; La Rosa, M. Split Miner: Discovering Accurate and Simple Business Process Models from Event Logs. 2017 IEEE International Conference on Data Mining (ICDM), 2017, pp. 1–10. [CrossRef]
- Pulsanong, W.; Porouhan, P.; Tumswadi, S.; Premchaiswadi, W. Using inductive miner to find the most optimized path of workflow process. 2017 15th International Conference on ICT and Knowledge Engineering (ICT&KE), 2017, pp. 1–5. [CrossRef]
| 1 | |
| 2 |
Figure 1.
General presentation of this article and its focus.
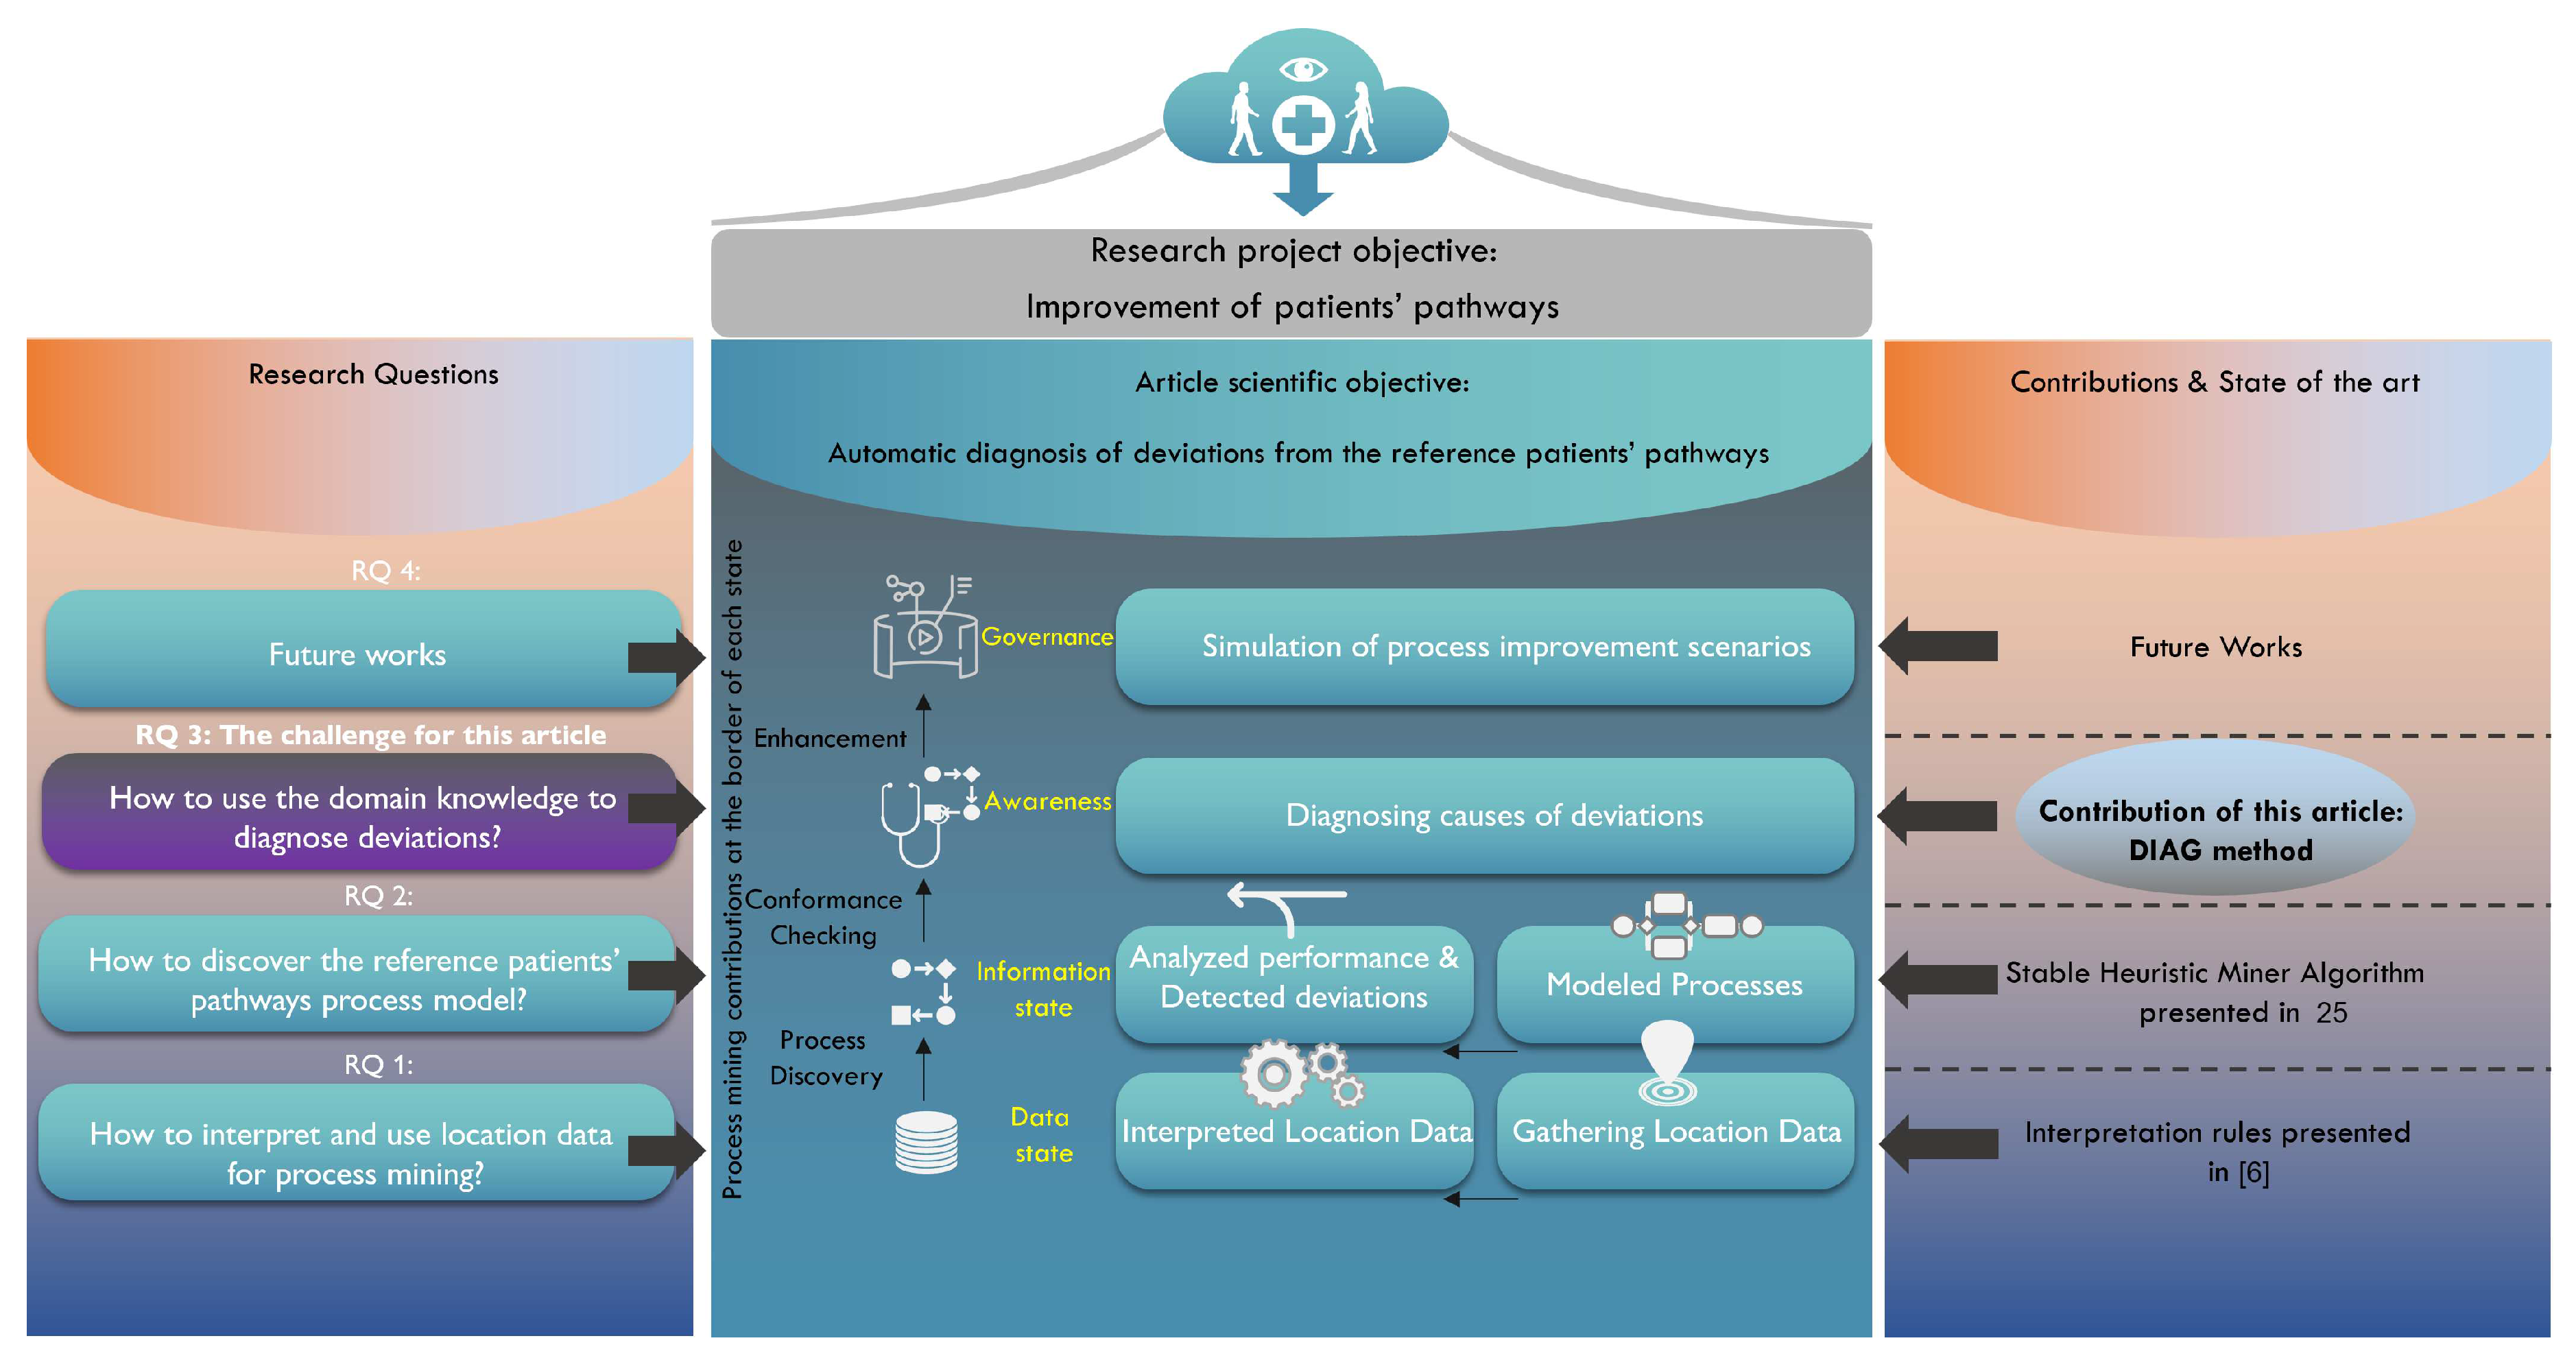
Figure 2.
DIAG meta-model. The architecture behind the application of process discovery and diagnosis of patients’ pathways by using their location data.
Figure 2.
DIAG meta-model. The architecture behind the application of process discovery and diagnosis of patients’ pathways by using their location data.
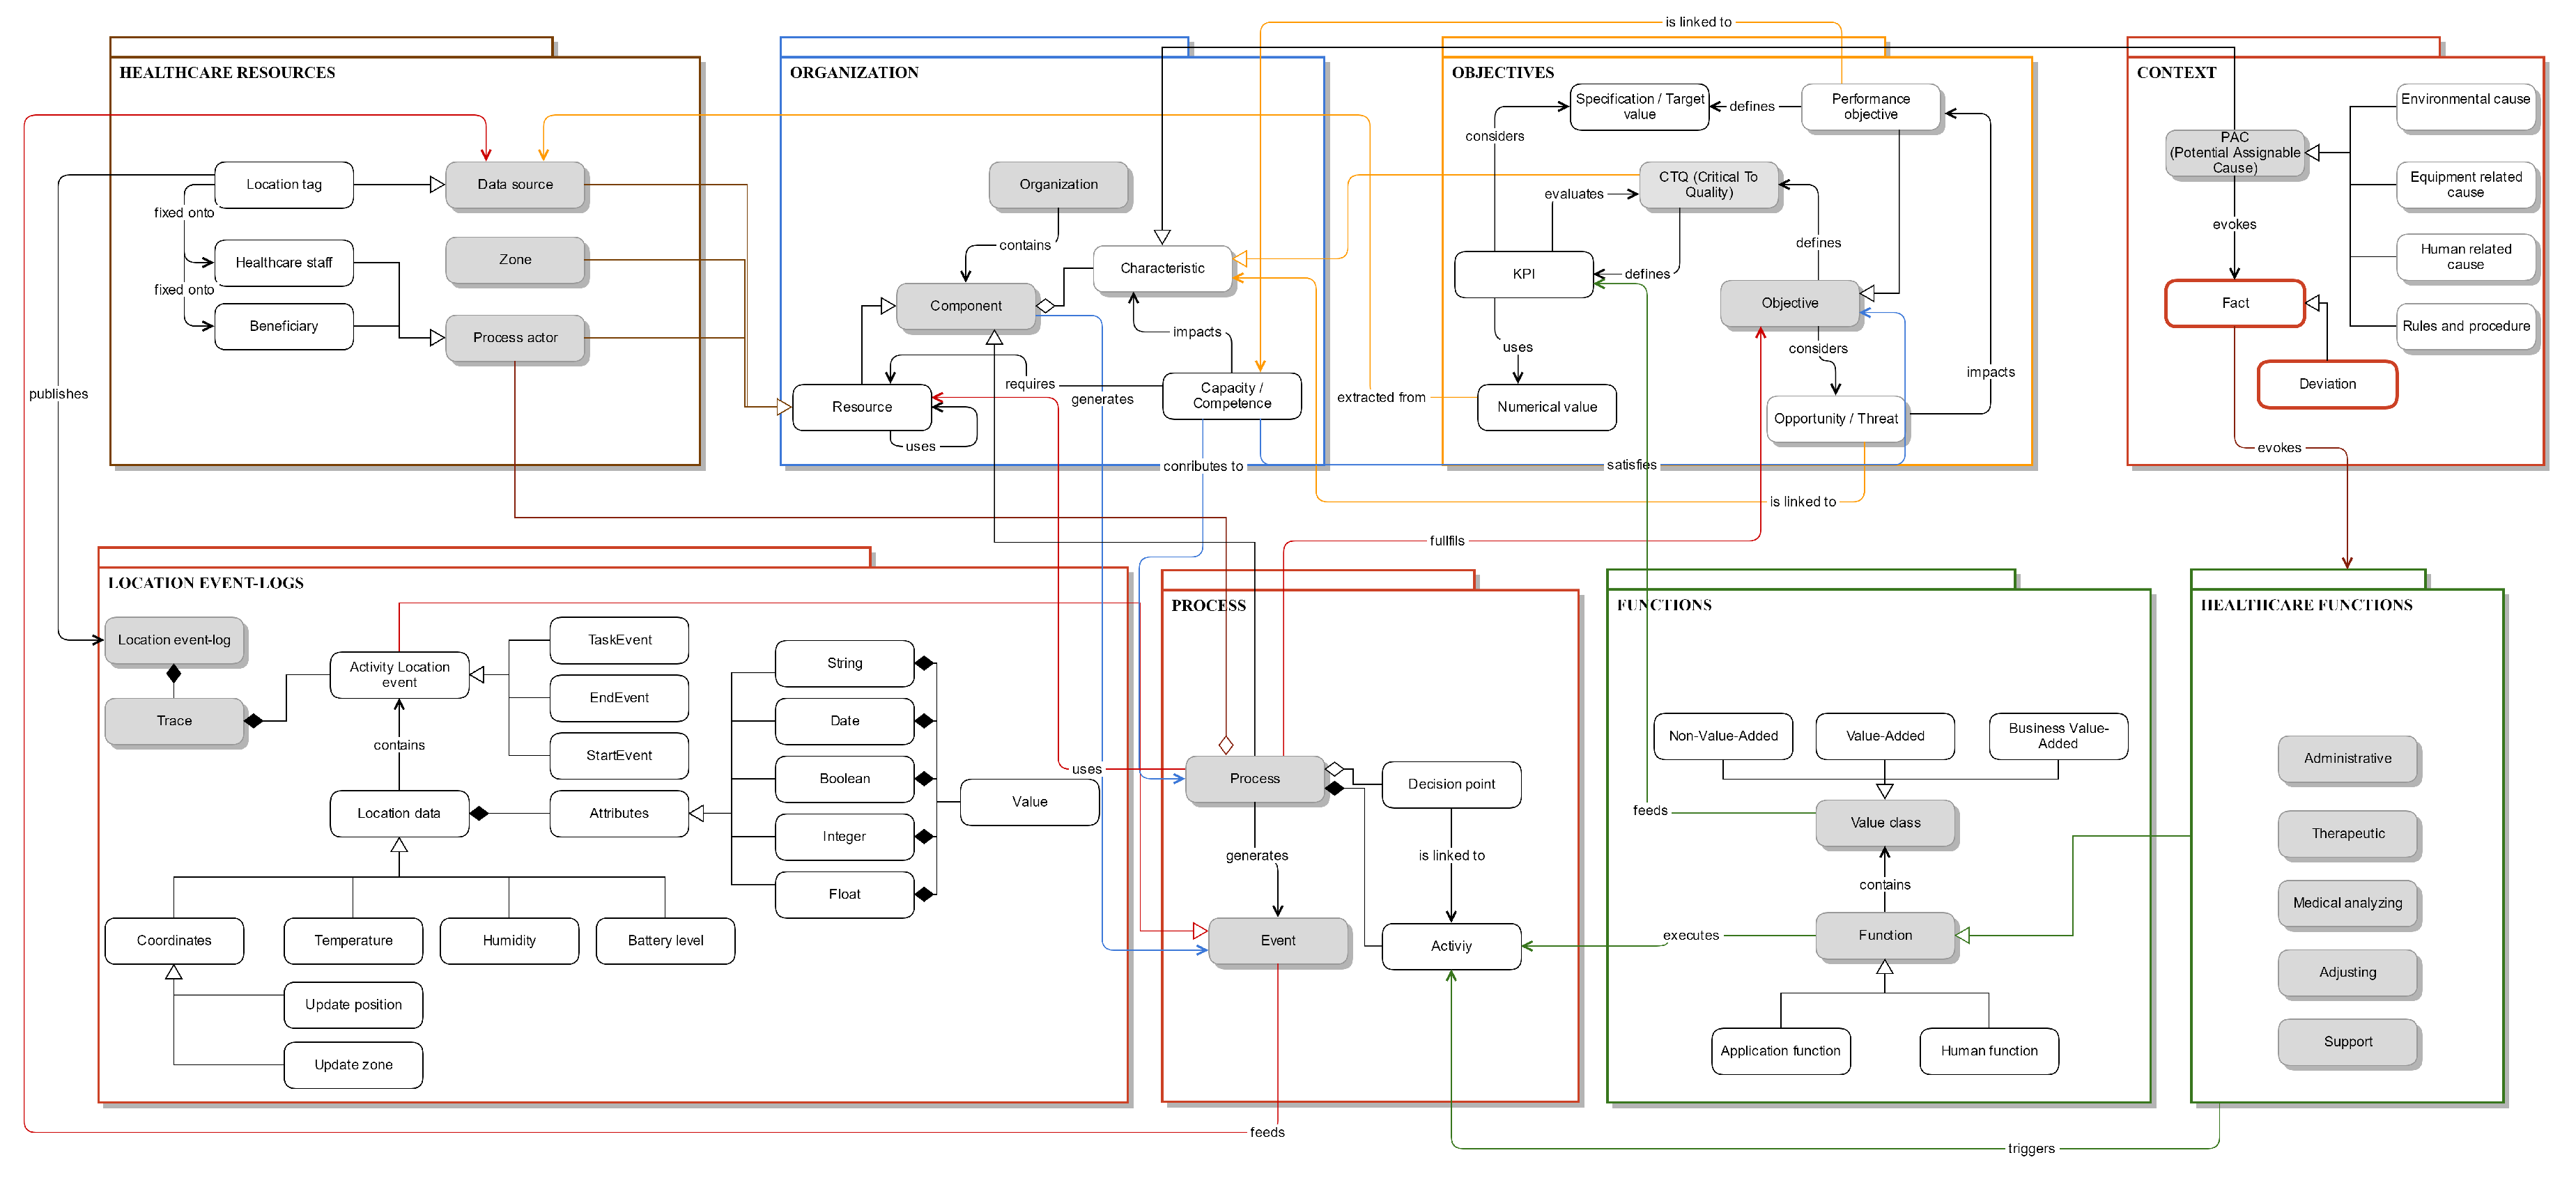
Figure 3.
A screenshot of the R.IO-DIAG tool developed to realize the modeling of different concepts defined in the DIAG meta-model such as healthcare resources, organizations, location event-logs, and etc. for monitoring patients pathways.
Figure 3.
A screenshot of the R.IO-DIAG tool developed to realize the modeling of different concepts defined in the DIAG meta-model such as healthcare resources, organizations, location event-logs, and etc. for monitoring patients pathways.
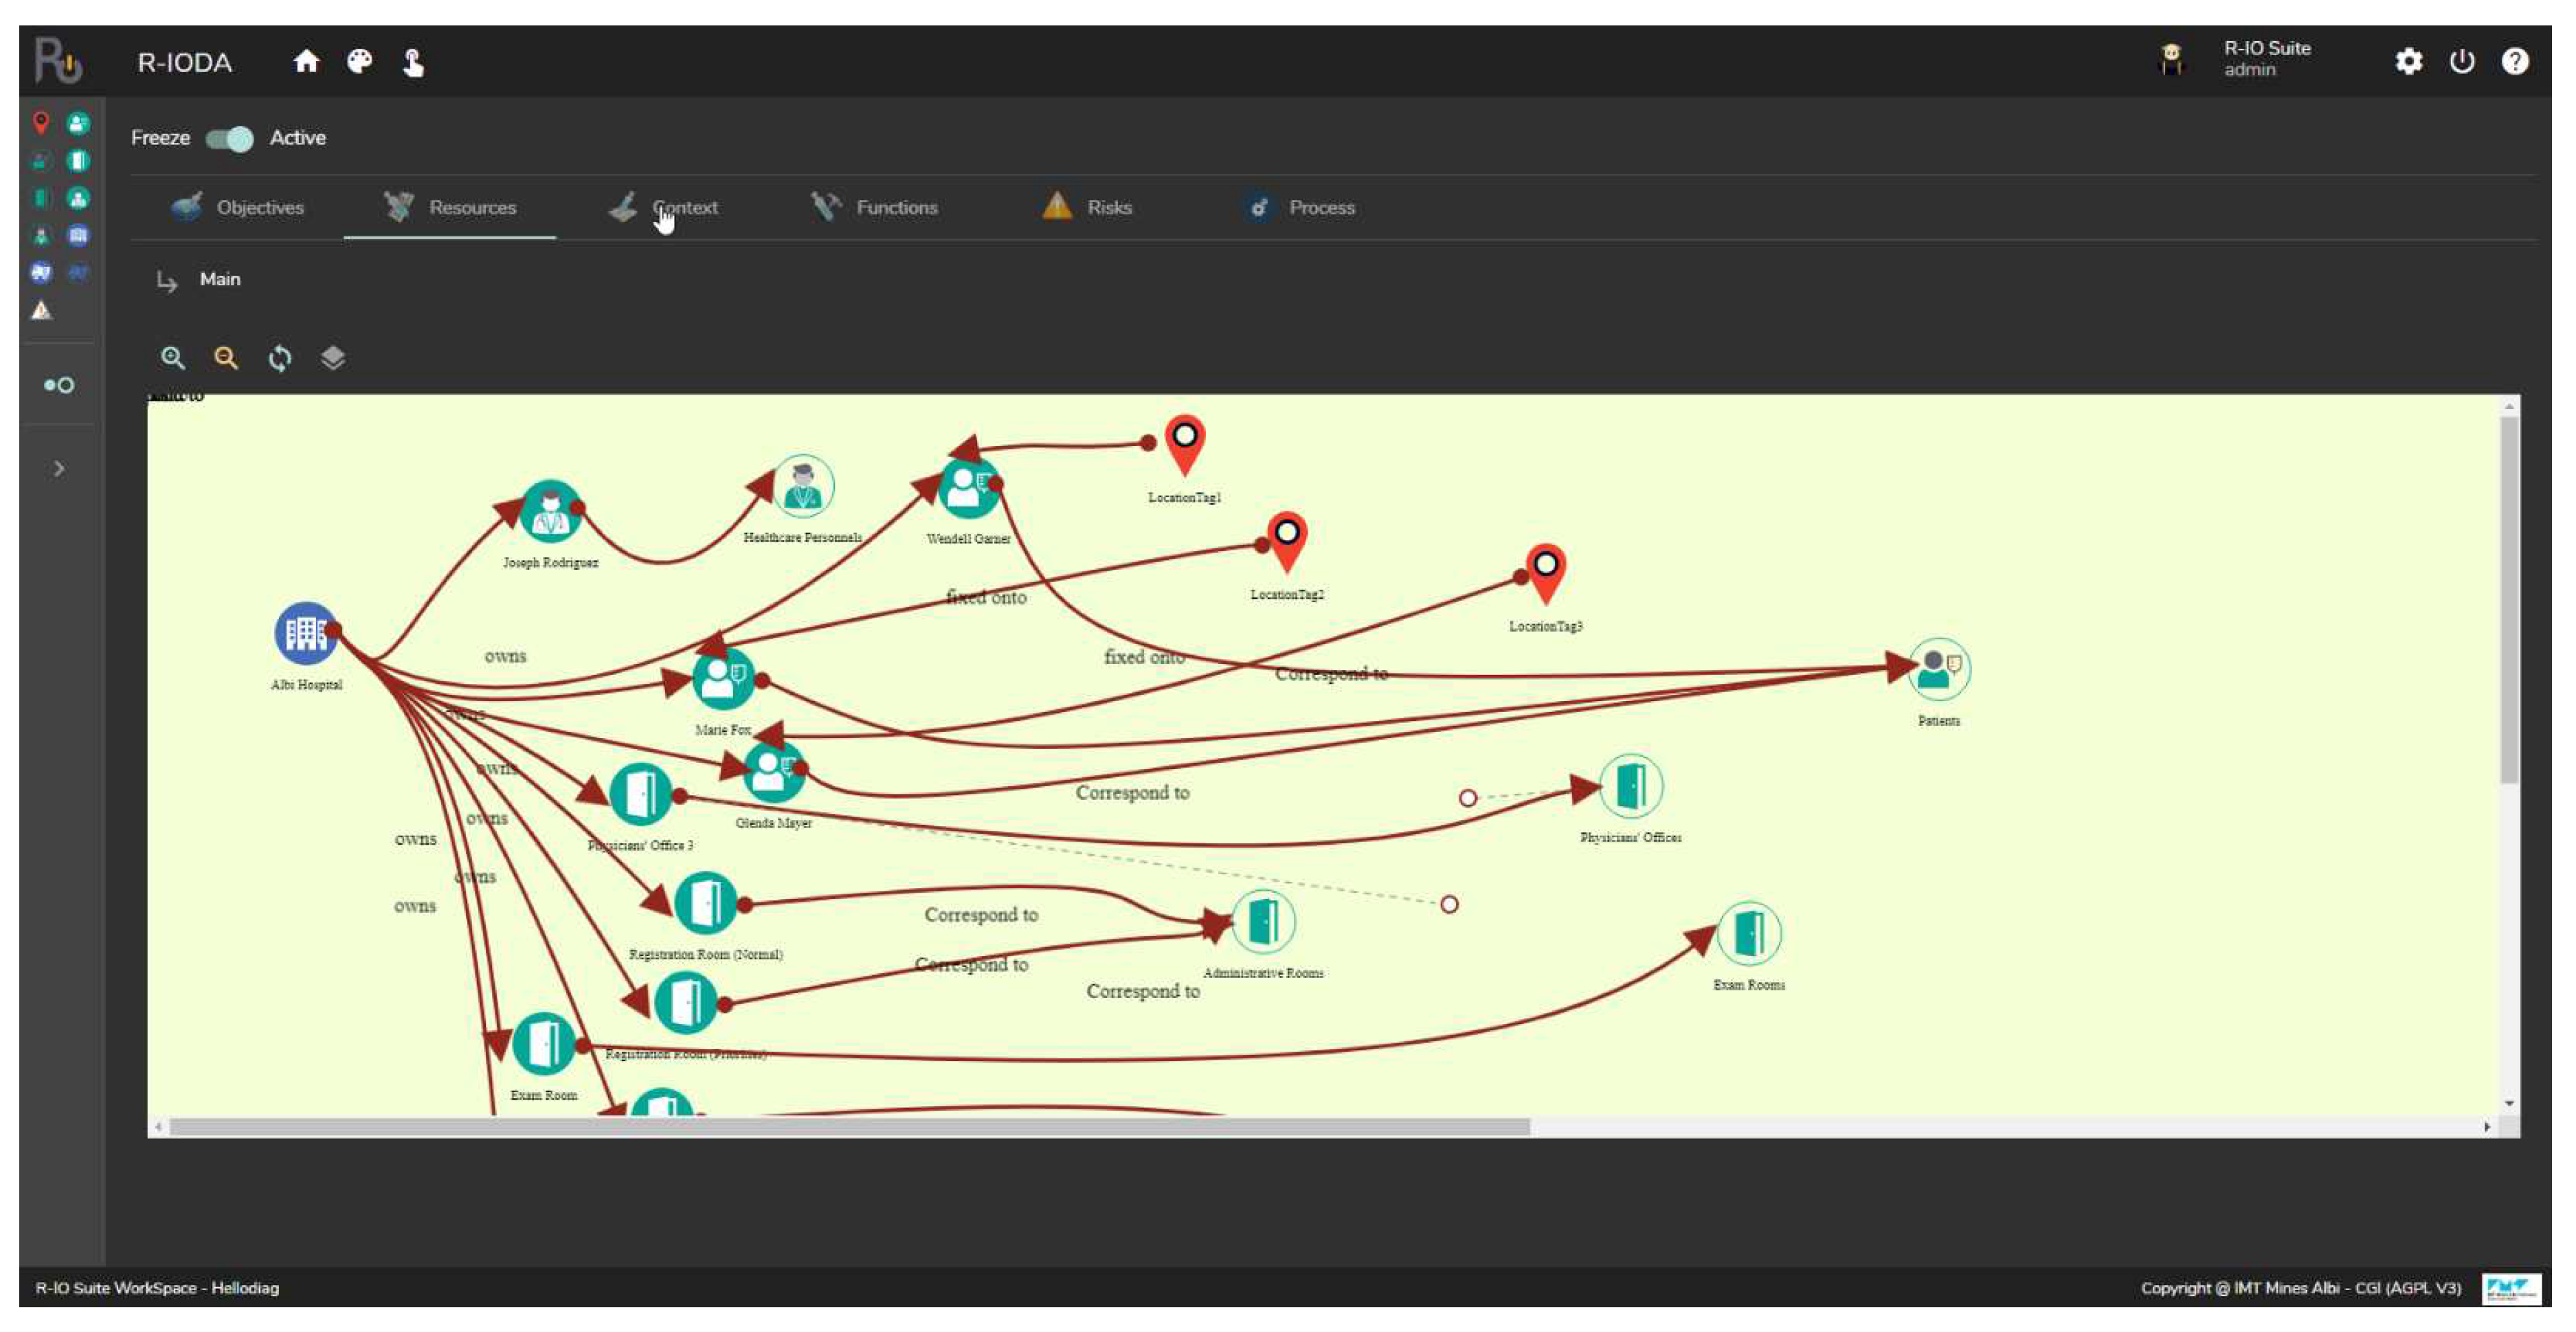
Figure 4.
A screenshot of R.IO-DIAG tool developed to realize the modeling of Healthcare Functions. This domain-specific knowledge is integrated into process mining analyses.
Figure 4.
A screenshot of R.IO-DIAG tool developed to realize the modeling of Healthcare Functions. This domain-specific knowledge is integrated into process mining analyses.
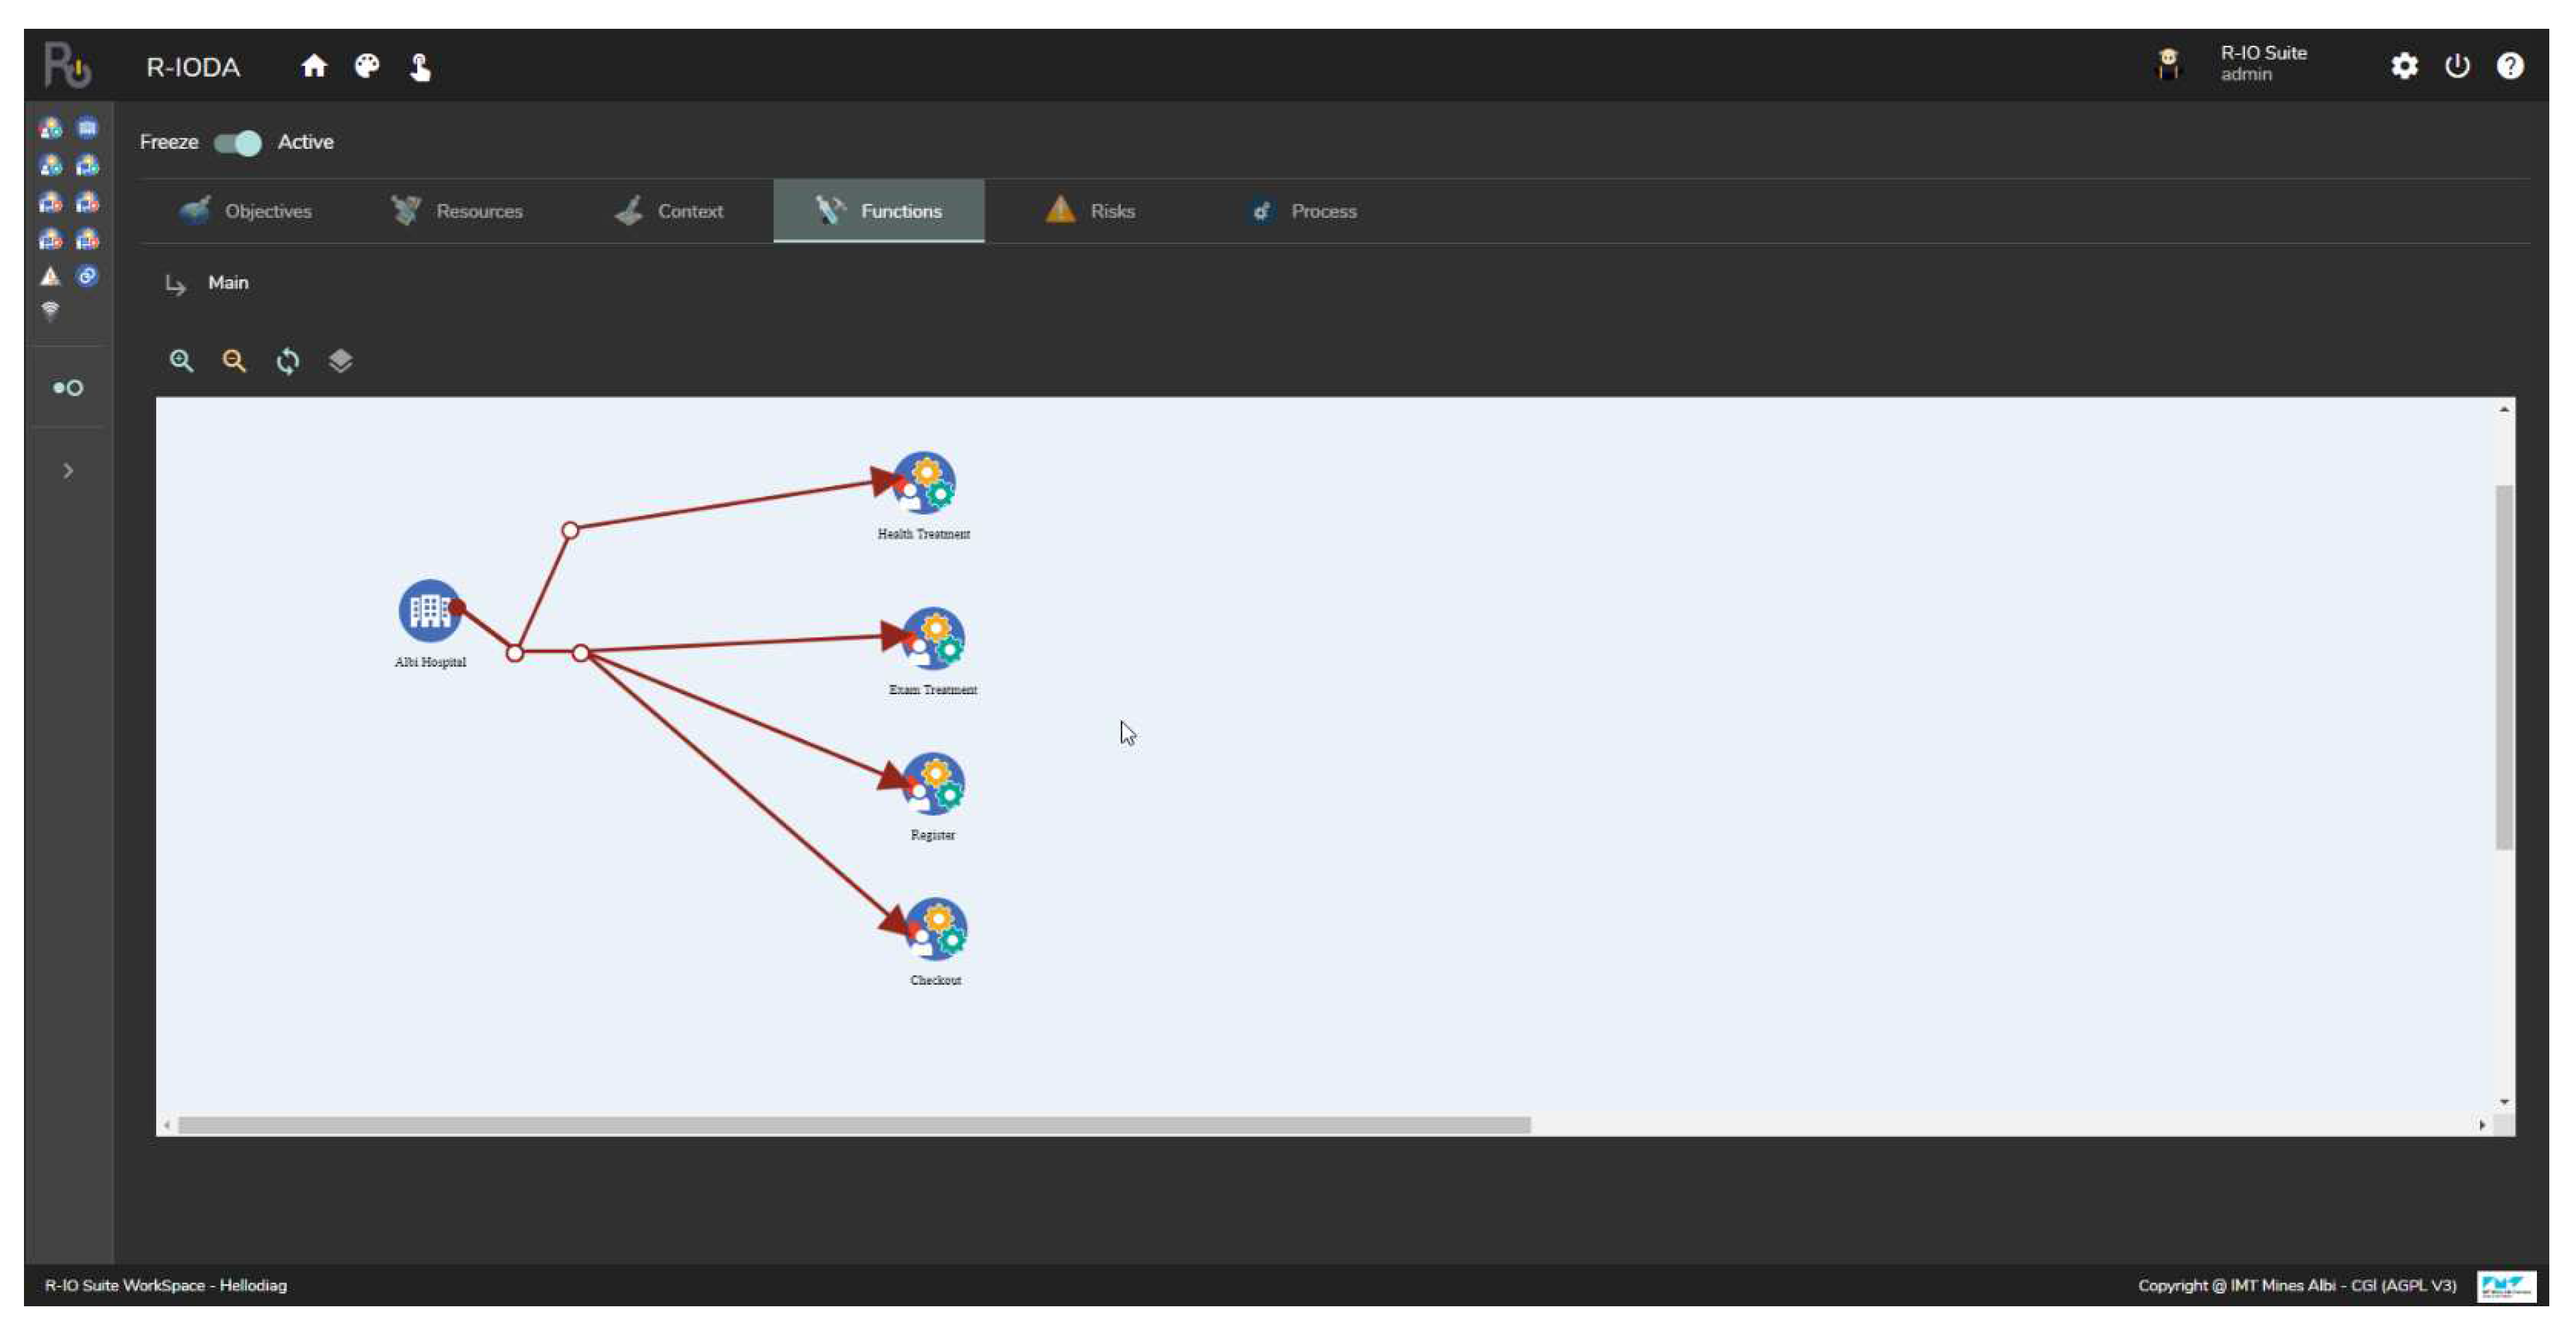
Figure 5.
The discovered model with the corresponding diagnoses of drifts.
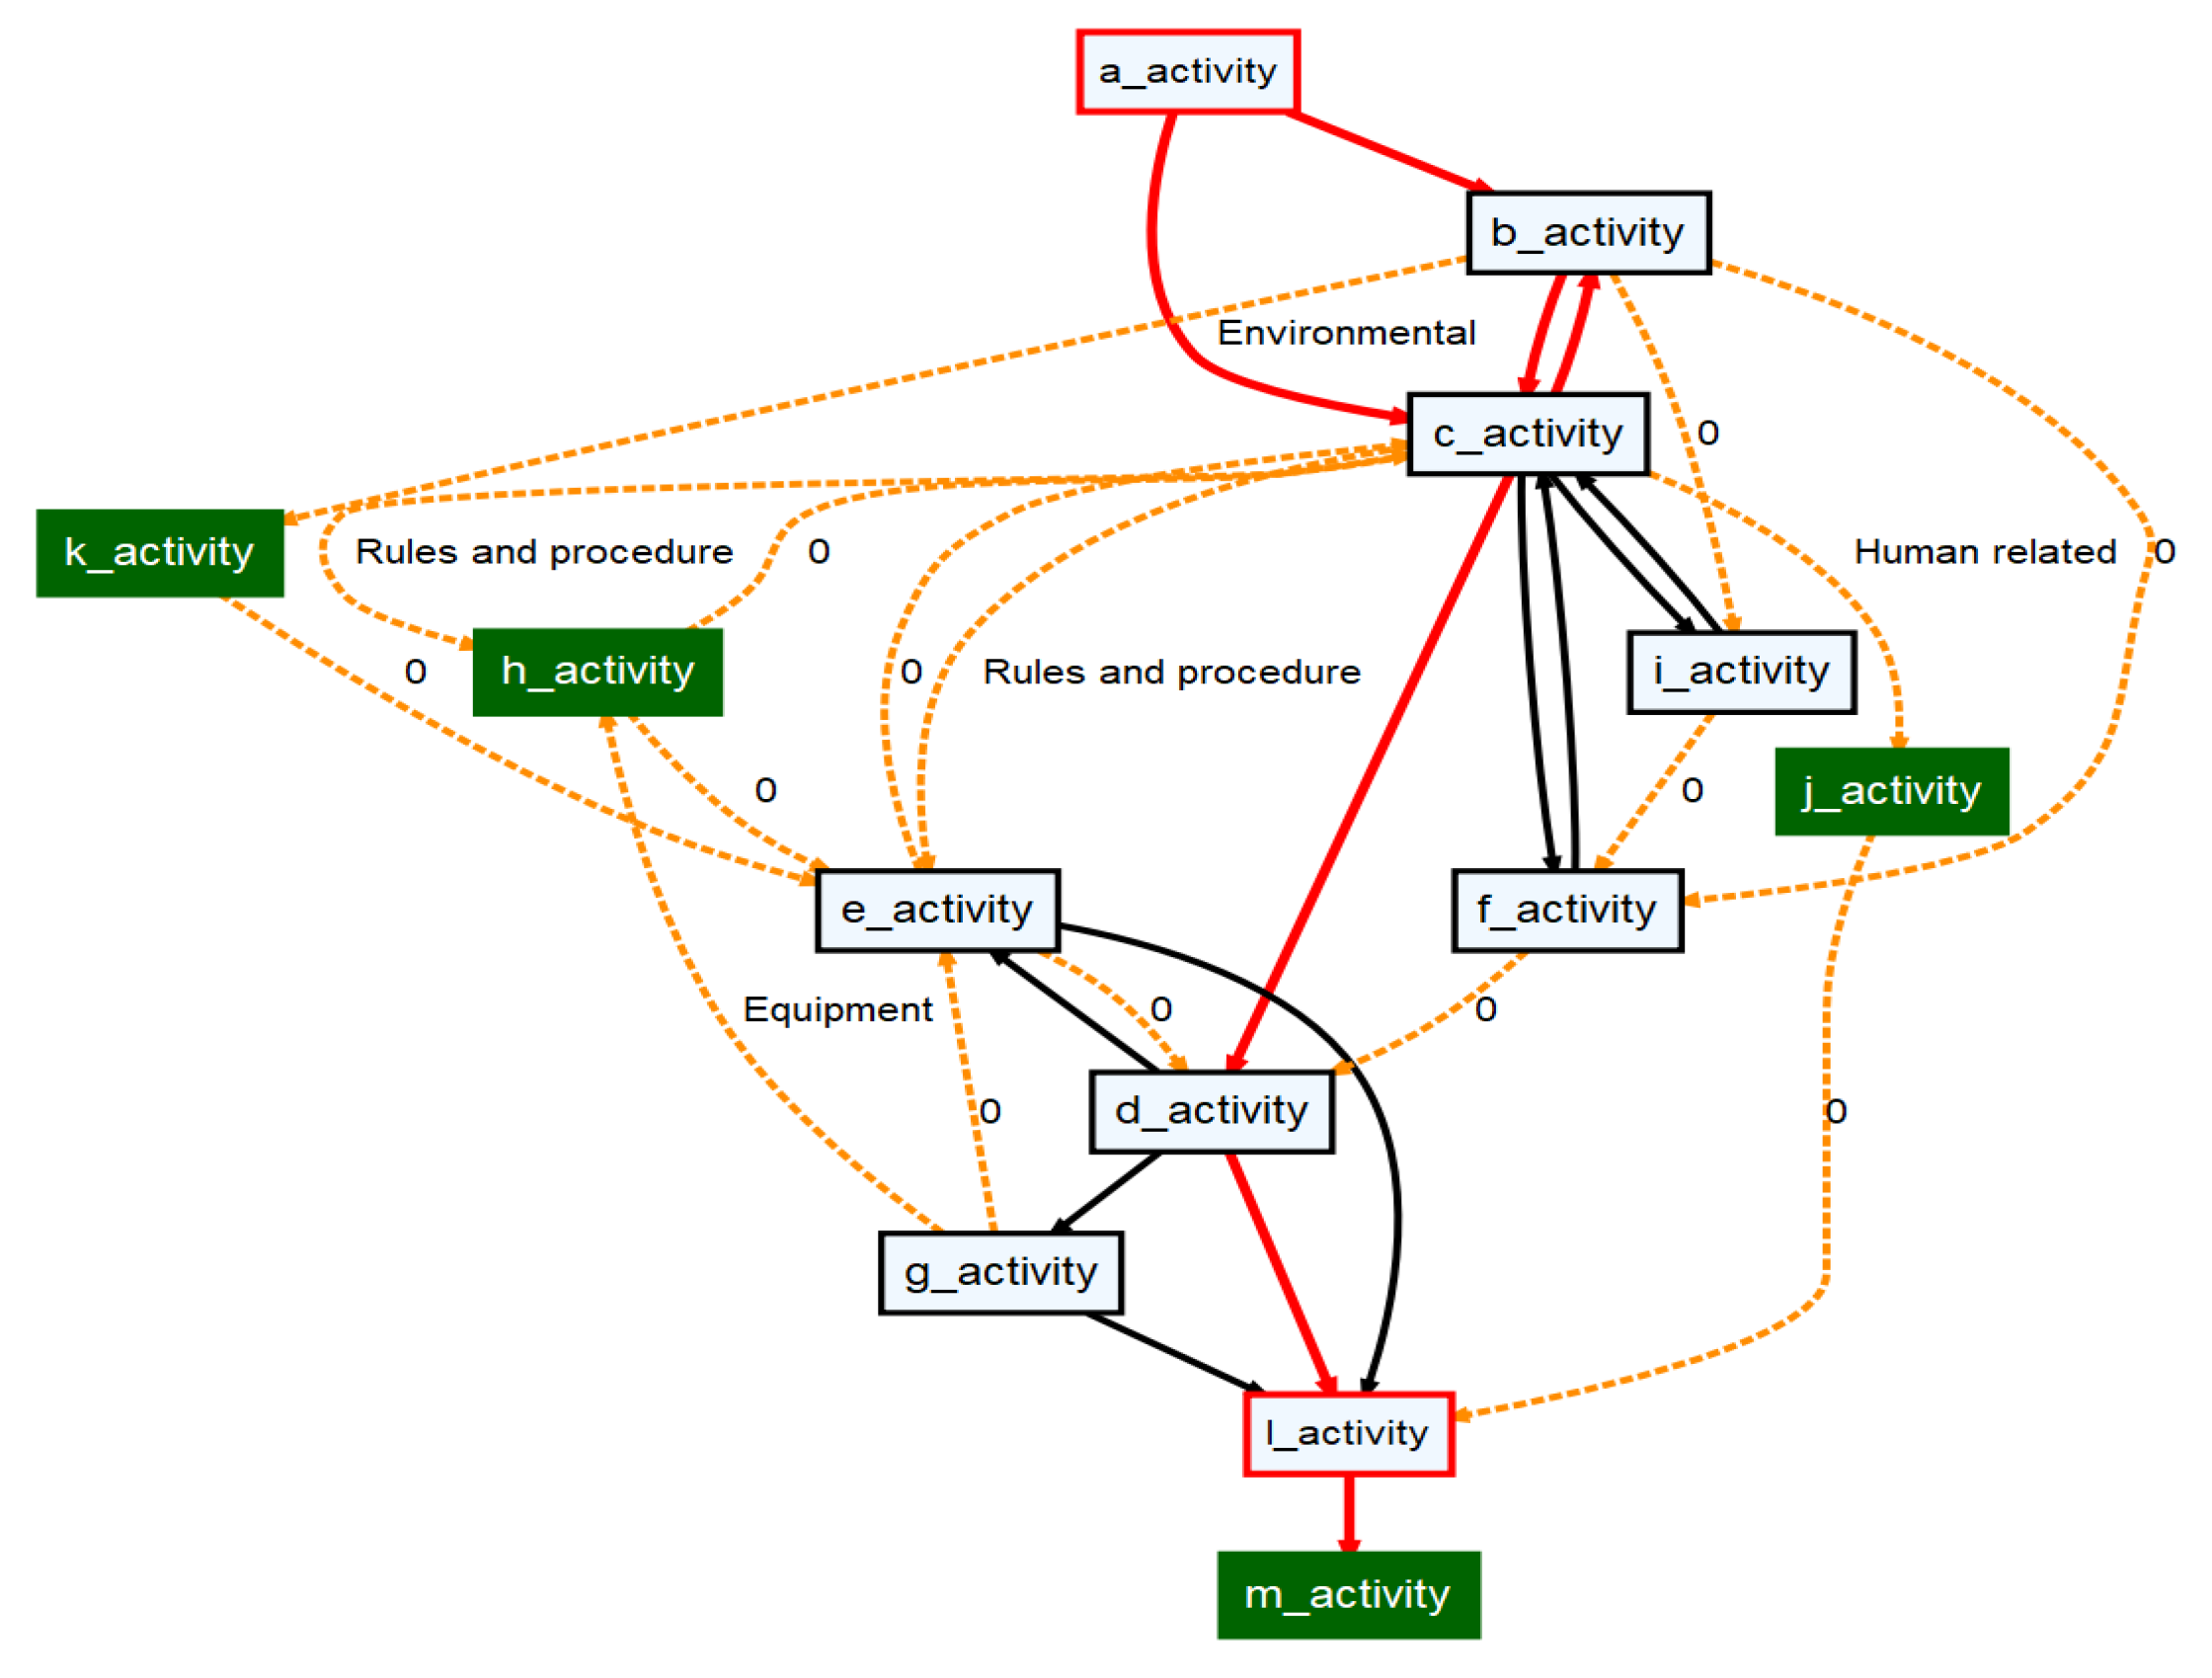
Figure 6.
The result of our approach in diagnosing the process deviations of the urology department.
Figure 6.
The result of our approach in diagnosing the process deviations of the urology department.
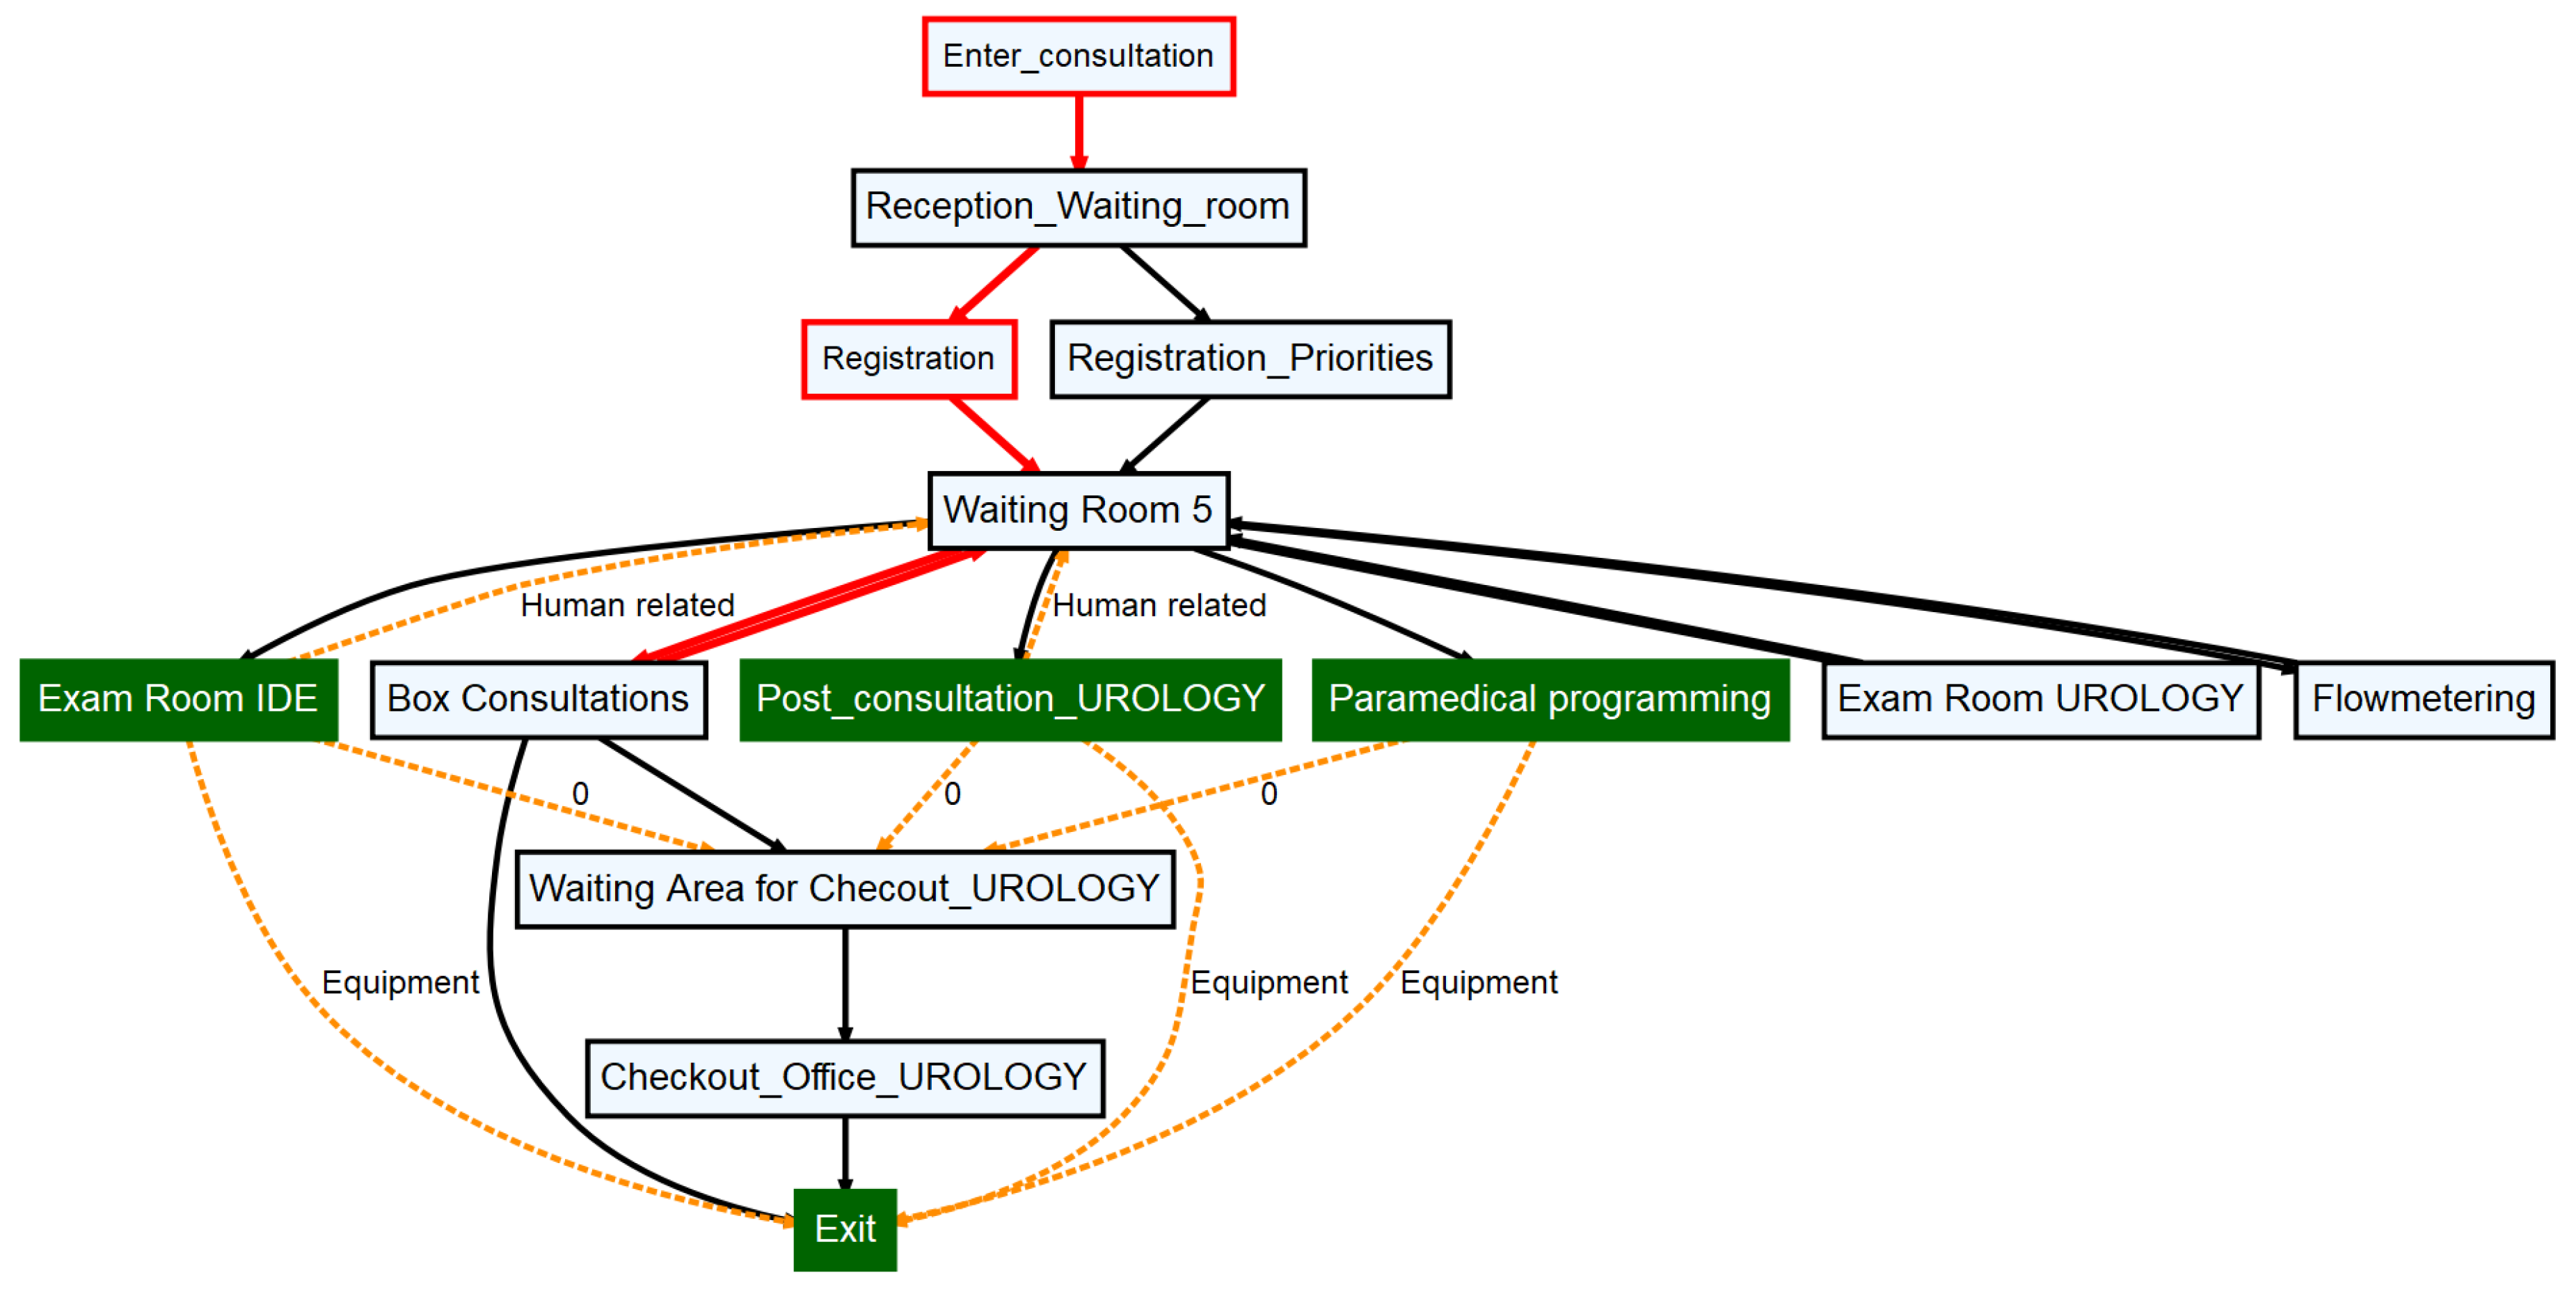

Table 1.
Distinguishing Characteristics (D) and Challenges (C) of Process Mining Research in Healthcare [1].
Table 1.
Distinguishing Characteristics (D) and Challenges (C) of Process Mining Research in Healthcare [1].
| Distinguished Characteristics | Challenges |
|---|---|
| D1: Exhibit Substantial Variability | C1: Design Dedicated / Tailored Methodologies and Frameworks |
| D2: Value the Infrequent Behaviour | C2: Discover Beyond Discovery |
| D3: Use Guidelines and Protocols | C3: Mind the Concept Drift |
| D4: Break the glass | C4: Deal with Reality |
| D5: Consider Data at Multiple Abstraction Levels | C5: Do it Yourself |
| D6: Involve a Multidisciplinary Team | C6: Pay Attention to Data Quality |
| D7: Focus on the Patient | C7: Take Care of Privacy and Security |
| D8: Think about White-box Approaches | C8: Look at the Process through the Patient’s Eyes |
| D9: Generate Sensitive and Low-Quality Data | C9: Complement HISs with the Process Perspective |
| D10: Handle Rapid Evolutions and New Paradigms | C10: Evolve in Symbiosis with the Development in the Healthcare Domain |
Table 2.
This table shows an illustration of how the domain knowledge will be extracted from the knowledge graph. This will be embedded as an input into the process discovery procedure.
Table 2.
This table shows an illustration of how the domain knowledge will be extracted from the knowledge graph. This will be embedded as an input into the process discovery procedure.
| Activity | Deviation | PAC |
|---|---|---|
| c | j | Human related |
| b | k | Environmental |
| c | h | Rules and procedure |
| j | i | Human related |
| c | e | Rules and procedure |
| g | h | Equipment |
| ... | ... | ... |
Table 3.
The knowledge set provided by the domain expert to be used by DIAG method.
| Activity | Deviation | PAC |
|---|---|---|
| Enter_consultation | Box Consultation | Rules and procedure |
| Reception_Waiting_room | Registration_Priorities | Rules and procedure |
| Registration | Reception_Waiting_room | Rules and procedure |
| Waiting_room 5 | Registration | Rules and procedure |
| Waiting_room 5 | Exam Room UROLOGY | Rules and procedure |
| Box_Consultation | Waiting_room 5 | Human related |
| Box_Consultation | Registration | Environmental |
| Checkout_Office_UROLOGY | Registration | Rules and procedure |
| Paramedical programming | Exit | Equipment |
| Flowmetering | Waiting_room 5 | Human related |
| Post_consultation | Box_Consultation | Rules and procedure |
| Post_consultation | Waiting_room 5 | Human related |
| Post_consultation | Exit | Equipment |
| Exit | Checkout_Office_UROLOGY | Rules and procedure |
Disclaimer/Publisher’s Note: The statements, opinions and data contained in all publications are solely those of the individual author(s) and contributor(s) and not of MDPI and/or the editor(s). MDPI and/or the editor(s) disclaim responsibility for any injury to people or property resulting from any ideas, methods, instructions or products referred to in the content. |
© 2023 by the authors. Licensee MDPI, Basel, Switzerland. This article is an open access article distributed under the terms and conditions of the Creative Commons Attribution (CC BY) license (http://creativecommons.org/licenses/by/4.0/).
Copyright: This open access article is published under a Creative Commons CC BY 4.0 license, which permit the free download, distribution, and reuse, provided that the author and preprint are cited in any reuse.


