Submitted:
21 December 2023
Posted:
22 December 2023
You are already at the latest version
Abstract
The study introduces a novel method to identify potential citation manipulation in academic papers using perturbations of a deep embedding model, incorporating Graph Masked Autoencoders. This approach integrates textual information with graph connectivity evidence, resulting in a more sophisticated model of citation distribution. By training a deep network using partial data and reconstructing masked connections, the method leverages the inherent characteristics of central connections under network perturbations. Quantitative evaluations demonstrate its remarkable ability to pinpoint trustworthy citations in the analyzed data and raise concerns about potentially unreliable references due to potential manipulation.
Keywords:
graph masked autoencoders
; manipulated citations
; network perturbation
1. Introduction
Manipulated citations involve the intentional inclusion of references in academic works to gain biased advantages rather than for their authentic academic merit. Rather than supporting the author’s arguments or providing relevant background information, the primary aim is to artificially boost the citation count of the author, their work, a specific journal, and so forth. There are several key aspects associated with manipulated citations commonly utilized to enhance researchers’ perceived impact and prestige and artificially inflate journal metrics. A widespread practice involves promoting citation manipulation to increase a journal’s citation impact factor, eventually assessing the journal’s quality and prestige.
The detrimental effects of this practice reach far and wide, jeopardizing the cornerstone of academic discourse - precision, impartiality, and scientific credibility. Although researchers acknowledge the uneven value of citations and attempt to address it by differentiating and assigning weights based on type, most studies only focus on this specific approach, neglecting broader considerations. Prabha [1] sheds light on the vastness of the problem by revealing that over two-thirds of references in a paper are deemed unnecessary, providing further evidence of the widespread presence of dubious citations.
The most prevalent forms of citation manipulation include excessive self-citation, where an author cites their own irrelevant work, and coercive citation, in which reviewers or editors pressure authors to cite specific work, including the author’s own or publications in particular journals. Additionally, practices such as citation rings and ghost citations warrant consideration in this context.
The manipulation of academic citations poses a serious threat to the scientific community. This common unethical practice erodes trust in research, distorts the research landscape by inflating citation counts for personal gain, and misallocates resources. Measures like journal policies, reviewer training, researcher transparency, and metrics improvement are used to combat this. Comprehending and addressing manipulated citations is pivotal for upholding the integrity of academic research, safeguarding its credibility, and ensuring reliability.
Several surveys have examined various aspects associated with the manipulation of reference lists. In this context, it merits particular attention [2,3,4]. Many authors recognize that these citations, like rumors, deviate from the norm in their context when compared to typical or regular references.
While conventional techniques such as manual inspection and basic statistical analyses have been utilized, they come with limitations in capturing intricate patterns and subtle manipulations. In recent years, network-based approaches have emerged as promising methods for identifying and comprehending citation manipulation. The intricate nature of graph data, characterized by irregular structures and relational dependencies, poses a challenge for conventional anomaly detection techniques.
By harnessing the inherent structure and connections within citation networks, network-based approaches can reveal hidden relationships and anomalies indicative of potential citation manipulation. These methods transcend individual paper analysis, delving into the broader network dynamics to foster a more comprehensive understanding of manipulation patterns. Many research papers have explored this avenue, including [5], [6], [7], and [8]. While primarily focused on deep learning methods for identifying rumors and fake news within networks, their insights, and methodologies hold immense value in developing effective network-based approaches for detecting citation manipulation in academic research.
In contrast to traditional methods, anomaly detection approaches leveraging graph learning possess the capability to simultaneously preserve both node attributes and network structures throughout the learning process. It offers a more suitable approach for addressing the complexities associated with graph data. By utilizing the structure and connections within the citation network, network-based approaches can uncover hidden relationships and abnormalities indicative of potential citation manipulation. These methods extend beyond individual papers, delving into broader network dynamics, thereby providing a more comprehensive understanding of manipulation patterns. Papers [7,9] present research of this kind.
This study builds upon the general approach presented in [10], focusing on the concept of characterizing connections within a citation graph by analyzing their behavior under network perturbations. In other words, the conjecture is that genuine relationships within the network are more resistant to disruptions. The approach is suggested using the Note2Vec method [11], which provides a graph embedding using random walks within a graph. The research is predicated on the idea that manipulated or fraudulent citations manifest anomalies within a citation network. These anomalies make them vulnerable to appropriate network perturbations, resulting in instability and detectability. The hypothesis is grounded in the belief that manipulated citations, strategically inserted to artificially enhance the impact or credibility of specific publications, deviate from the natural patterns and structures inherent in the citation network. Consequently, when exposed to network perturbations such as the removal of specific nodes, manipulated citations are more likely to exhibit inconsistencies that distinguish them from genuine citations.
Notwithstanding certain limitations in its applicability, the offered implementation of the general concept leads to demonstrably acceptable results that exhibit a high degree of concordance with empirical data. However, one of this approach’s disadvantages is ignoring the papers’ textual component and resting upon just inner network connectivity.
Applying graph transformers (e.g., [12]) demonstrates promising performance in learning graph representations, which appears natural. Unlike traditional transformers, which process sequential data like text, graph transformers handle data represented as graphs taking into account the inner graph structure and the features of the nodes to learn informative representations of nodes by considering both their own attributes and the attributes and relationships of their connected nodes. Similar to traditional transformers, they use attention mechanisms to focus on relevant parts of the graph, allowing them to capture long-range dependencies and complex relationships.
Despite their effectiveness, applying deep transformers in real-world scenarios poses challenges. Training them from scratch requires significant resources, and their memory consumption grows quadratically with the number of nodes, further hindering their practical implementation. To tackle these challenges, the concept of Graph Masked Autoencoders (GMAEs) is introduced in [13] as a self-supervised transformer-based model for acquiring graph representations. GMAEs utilize a masking mechanism and an asymmetric encoder-decoder architecture to address the aforementioned limitations. Comprehensively, GMAEs take partially masked graphs as input and reconstruct the features of the masked nodes. The encoder-decoder architecture is deliberately designed with asymmetry, utilizing a deep transformer for encoding and a shallow transformer for decoding. This specific design, in conjunction with the masking mechanism, results in GMAEs being notably more memory-efficient compared to conventional transformers.
The approach suggested in this paper involves a network perturbation type that suggesting systematically removes a fixed set of nodes and reconstructs their features by leveraging GMAE trained on the remaining nodes. This iterative procedure includes substantial link prediction based on the omitted nodes features recovering. Assessing the stability of citation reconstruction amid these node-masking perturbations has the potential to unveil abnormal citations. These anomalies could serve as cues for potential manipulation or fraudulent behavior within the citation network.
The rest of the manuscript is structured as follows: Section 2 furnishes an outline of the pertinent mathematical foundations for the study. Section 3 introduces the proposed model designed for detecting citation manipulation. The experimental study assessing the efficacy of the model is outlined in Section 4. The paper concludes in Section 5 by summarizing key findings and discussing their implications.
2. Preliminaries
A graph, denoted as G = (V, E), consists of a set of vertices (nodes) denoted by V and a set of edges denoted by E. If a graph has NV nodes and NE edges, an NV x NV adjacency matrix A denotes the connections between nodes. Each element in A is assigned a value of either 1 or 0, indicating the presence or absence of an edge between the corresponding nodes. In some instances, graphs may include additional information, such as node features XV (with dimension dV) and edge features XE (with dimension dE).
The Graphormer architype, presented in [14], addresses the challenges faced by transformers in adapting to graph structures. These problems include capturing relational information and managing the complexities of large graphs. To overcome these limitations while leveraging the strengths of transformers, the paper introduces a novel architecture.
The proposed model incorporates positional embeddings that inject structural information into the transformer architecture. This is achieved by encoding node centrality (in-degree and out-degree) into the transformer. Furthermore, the model captures pairwise node relationships through shortest path distances and integrates these distances as biases in the attention mechanism. The utilization of edge features enhances the overall ability of the Graphormer model to handle graph representations effectively.
The paper [13] suggests the utilization of graph-masked autoencoders (GMAEs) with Graphormer as the foundational model. Specifically, both the encoder and decoder components are designed as graph transformers, inheriting their architecture from the Graphormer model. This implies that the transformer-based structure introduced by Graphormer serves as the backbone for both encoding and decoding processes within the context of graph-masked autoencoders. The paper explores the application of Graphormer’s transformer design in the GMAE framework, aiming to enhance the capabilities of graph autoencoding tasks.
Drawing inspiration from existing work, the paper considers, in particular, Masked language modeling as a technique for learning representations from partially masked data, reducing training complexity and memory footprint and providing, moreover, the opportunity to evaluate the stability of the general model.
GMAEs employ several technical details to enhance their performance:
- Masking Mechanism: GMAEs take partially masked graphs as input, where a predetermined number of nodes is intentionally masked. This selective masking reduces the amount of information the model needs to process simultaneously, leading to increased memory efficiency during training.
- Asymmetric Encoder-Decoder Architecture: The GMAE model adopts an asymmetric architecture, employing a deep transformer encoder to extract rich representations from the unmasked nodes in the graph. On the other hand, the decoder consists of a shallower transformer network. The role of the decoder is to reconstruct the features of the masked nodes based on the encoded information obtained from the encoder. This design choice may contribute to a more effective and efficient information flow within the model.
- Self-Supervised Learning: GMAEs are trained using a self-supervised learning approach. In this context, the model is tasked with predicting the features of the masked nodes from the remaining information in the graph. This self-supervised learning paradigm is advantageous as it eliminates the dependency on labeled data, which is often scarce or expensive to obtain in real-world scenarios. The model learns to capture meaningful representations and relationships within the graph by leveraging the data’s intrinsic structure.
By incorporating these technical details, GMAE aims to address challenges related to memory efficiency, information reconstruction, and the availability of labeled data in the context of graph-based tasks.
In general, the forward propagation of GMAE comprises the following four steps:
- Randomly mask nodes in the input graph.
- Feed the non-masked nodes into the encoder and obtain their embeddings.
- Use a shared learnable mask token to represent the embeddings of the masked nodes and insert them into the output of the encoder.
- Feed the embedding matrix with inserted mask tokens into the decoder to reconstruct the features of the masked nodes.
A random subset of nodes is sequentially masked throughout the training phase for an input graph. The encoder, crucial to this process, is intentionally kept unaware of these masked nodes. It exclusively processes the features of the nodes that remain observable and subsequently generates embeddings for each of these observed nodes.
Node positional embeddings are enriched with centrality, spatial, and edge encodings, similar to Graphormer, necessitating knowledge of node degrees, all-pairs shortest paths, and (optionally) edge features.
3. Approach
This section introduces our approach for identifying anomalous citations in academic networks, potentially signifying manipulation or fraud. The fundamental assumption, akin to one discussed in a previously published article [10], is that manipulated citations, strategically inserted to enhance the impact of particular publications, deviate from the natural structure of the network. These manipulated citations are expected to show inconsistencies and stand out when subjected to perturbations. We hypothesize that analyzing citation stability under perturbations, such as node removal, can reveal these deviations and identify suspicious citations. We aim to unveil potentially fraudulent behavior within the network by investigating anomalies and analyzing deviations from expected patterns.
The perturbations introduced in the considered citation network bear some resemblance to those discussed earlier in perturbation analyses of models involving artificial modifications to network structures. Specifically, within the context of the citation network, these perturbations entail the random removal of nodes corresponding to papers. These deliberate alterations simulate various scenarios or conditions to assess the robustness, stability, or integrity of both the citation network and individual links. Such perturbations serve as a mechanism to unveil vulnerabilities or weaknesses in a network. They increase the likelihood of anomalies or manipulated elements manifesting abnormal behavior or standing out amidst genuine components.
In the subsequent phase, link prediction using embeddings is carried out. Following the acquisition of embeddings, the similarity or proximity between pairs of nodes is quantified using diverse similarity metrics such as cosine similarity, Euclidean distance, or graph-based measures like mutual neighbors or the Jaccard coefficient.
The citation graph under consideration is treated as undirected, emphasizing the connections between papers rather than the specific directionality of citations. This focus on connectivity enables a comprehensive analysis of the network’s structure and patterns by capturing the relationships and dependencies between papers, regardless of their citing or cited status.
To enhance the link prediction process, we propose the inclusion of two additional parameters: a similarity measure (S) and a threshold value (Tr). The similarity measure gauges the similarity between pairs of nodes, while the threshold value serves as the cutoff point for determining whether pairs are considered "connected" or not. Specifically, if the similarity score between two nodes surpasses the threshold (Tr), they are deemed connected, while pairs with a similarity score below the threshold are considered disconnected. This approach facilitates a nuanced and customizable evaluation of link predictions based on the defined similarity measure and threshold.
In broad terms, an adapted approach to evaluating the reliability of citations involves the following steps:
- Load a graph G = (V, E) including additional information containing node features XV (with dimension dV).
-
Repeat Niter times:
- Randomly mask a fraction Fr of nodes in the input graph.
- Feed the non-masked nodes into the encoder and obtain their embeddings.
- Use a shared learnable mask token to represent the embeddings of the masked nodes and insert them into the output of the encoder.
- Calculate the similarity score for all pairs of the masked nodes using the measure S.
- Reconstruct the network of the omitted masked nodes by identifying potential links with similarity scores that meet or surpass the threshold (Tr).
- For each connection, count how many times it is rebuilt throughout the iterations.
As was previously mentioned, in the GMAE model, the encoder and decoder exhibit asymmetry. The encoder is a deep graph transformer, while the decoder is a shallow graph transformer. The experiments in [13] found that employing an encoder with 16 layers and a decoder with 2 layers yields state-of-the-art performance in most cases. This design choice results in an expressive encoder, optimizing performance and simultaneously it conserves computational resources. Despite the depth of the encoder, the input feature matrix’s size is reduced due to the masking mechanism. In contrast, a conventional end-to-end graph transformer employs a deep transformer similar to our encoder but utilizes a full feature matrix as input, leading to considerable memory consumption.
Conversely, the decoder input is an embedding matrix of full size, potentially implying large memory consumption. However, given the shallowness of the decoder, the computational load remains relatively small. This strategic design balances expressive power and computational efficiency in both the encoder and decoder components of the GMAE model.
An ego graph refers to a subset of a network focused on a specific node, commonly referred to as the "ego." This subset encompasses all nodes directly linked to the ego and the edges connecting them. Picture it as a zoomed-in perspective, providing a detailed view of a node’s immediate neighborhood within the broader network. In GMAE, some nodes are "masked" during training, meaning their features are hidden. This makes it challenging to directly learn their connections to other nodes. Ego-graphs come in handy here because:
- Focused analysis: By focusing on the ego-graph of a masked node, the model can concentrate its resources on reconstructing the missing connections for that specific node.
- Similarity-based reconstruction: GMAE utilizes similarity scores between nodes to infer potential connections. The ego graph provides a smaller, more manageable context for comparing the similarity of neighboring nodes to the masked node, making the reconstruction process more efficient.
- Threshold-based filtering: The model can set a threshold for the similarity score. Only edges with similarity scores exceeding this threshold are considered potential connections for the masked node. This helps avoid reconstructing spurious connections based on weak similarities.
Focusing on ego graphs allows for a more accurate reconstruction of connections for masked nodes compared to analyzing the entire network. So, by limiting the scope of analysis, ego graphs reduce the computational burden of the reconstruction process, and as the network size increases, ego graphs remain manageable, making the GMAE model scalable to large datasets.
Like GMAE, our method follows the approach outlined in Graphormer [14] to extract ego graphs to train the model. Specifically, we leverage the neighbor sampler, as introduced in GraphSAGE [15], to create subgraphs by randomly sampling a designated number of nodes from the neighborhood of the target node. GraphSAGE operates by iterative sampling and aggregating information from a node’s immediate neighbors. This involves the neighbor sampler selecting a subset of neighbors for each node during each iteration, thereby reducing computational complexity and memory usage compared to processing the entire neighborhood. Considering our research task, which aims to assess suitableness citations, our approach involves sampling from the immediate surroundings of each vertex. This method ensures that the model focuses on the relevant information within the node’s neighborhood, contributing to the efficiency and effectiveness of the training process. Each ego graph captures the central node’s direct connections (one hop), excluding further indirect connections.
4. Experiments
GMAE explores a variety of settings for its encoder layers, ranging from 1 to 30 while maintaining a constant of 2 layers for the decoder. Additionally, the mask ratio, determining the percentage of nodes subjected to masking, is adjusted between 0.7 and 0.8 with a step size of 0.1. The hidden dimensions are set at 64 for each layer, and each transformer layer incorporates 8 attention heads. A linear decay learning rate scheduler is applied to enhance the training process, starting with a warm-up stage of 40,000 steps and gradually reducing the learning rate to a final value of 1e-9 after a maximum of 400,000 training steps. The peak learning rate is defined as 1e-4.
Our implementation incorporates the EarlyStopping Hooks callback from the PyTorch Lightning library to address a specific task to detect early signs of process stabilization. This callback is employed to halt training when a monitored metric ceases to improve. It is initialized with four parameters. The first parameter, ’metric’, is set to ’train_loss’. The second parameter, ’mode’, is set to ’min’, signifying that training will conclude when the monitored metric stops decreasing. The third parameter, ’patience’, is set to ’5’, indicating the number of training epochs with no improvement after which training will be terminated. In this scenario, training will stop if the monitored metric shows no improvement for 5 training epochs. The fourth parameter, ’check_on_train_epoch_end’, is set to ’True’. When this is true, the callback assesses whether to stop training at the conclusion of each training epoch.
4.1. Cora dataset
The Cora dataset, accessible at https://relational.fit.cvut.cz/dataset/CORA, stands as a well-established and extensively utilized resource in the realms of machine learning and natural language processing. Its principal focus lies in the exploration of citation networks. Comprising a collection of diverse scientific research papers, predominantly from the field of computer science, the dataset spans various subfields such as machine learning, artificial intelligence, databases, and information retrieval. Each paper within the dataset is represented by a bag-of-words feature vector, indicating the presence or absence of specific words in the document. Furthermore, the Cora dataset furnishes details on citation links between papers, facilitating the examination of citation patterns and the exploration of techniques for analyzing citation networks.
With 2,708 publications across seven categories and 5,429 citation links, the Cora dataset offers a comprehensive and well-organized resource for studying scientific literature. Each publication is further characterized by a binary word vector of 1,433 elements, where each element indicates the presence or absence of a specific word from the provided dictionary.
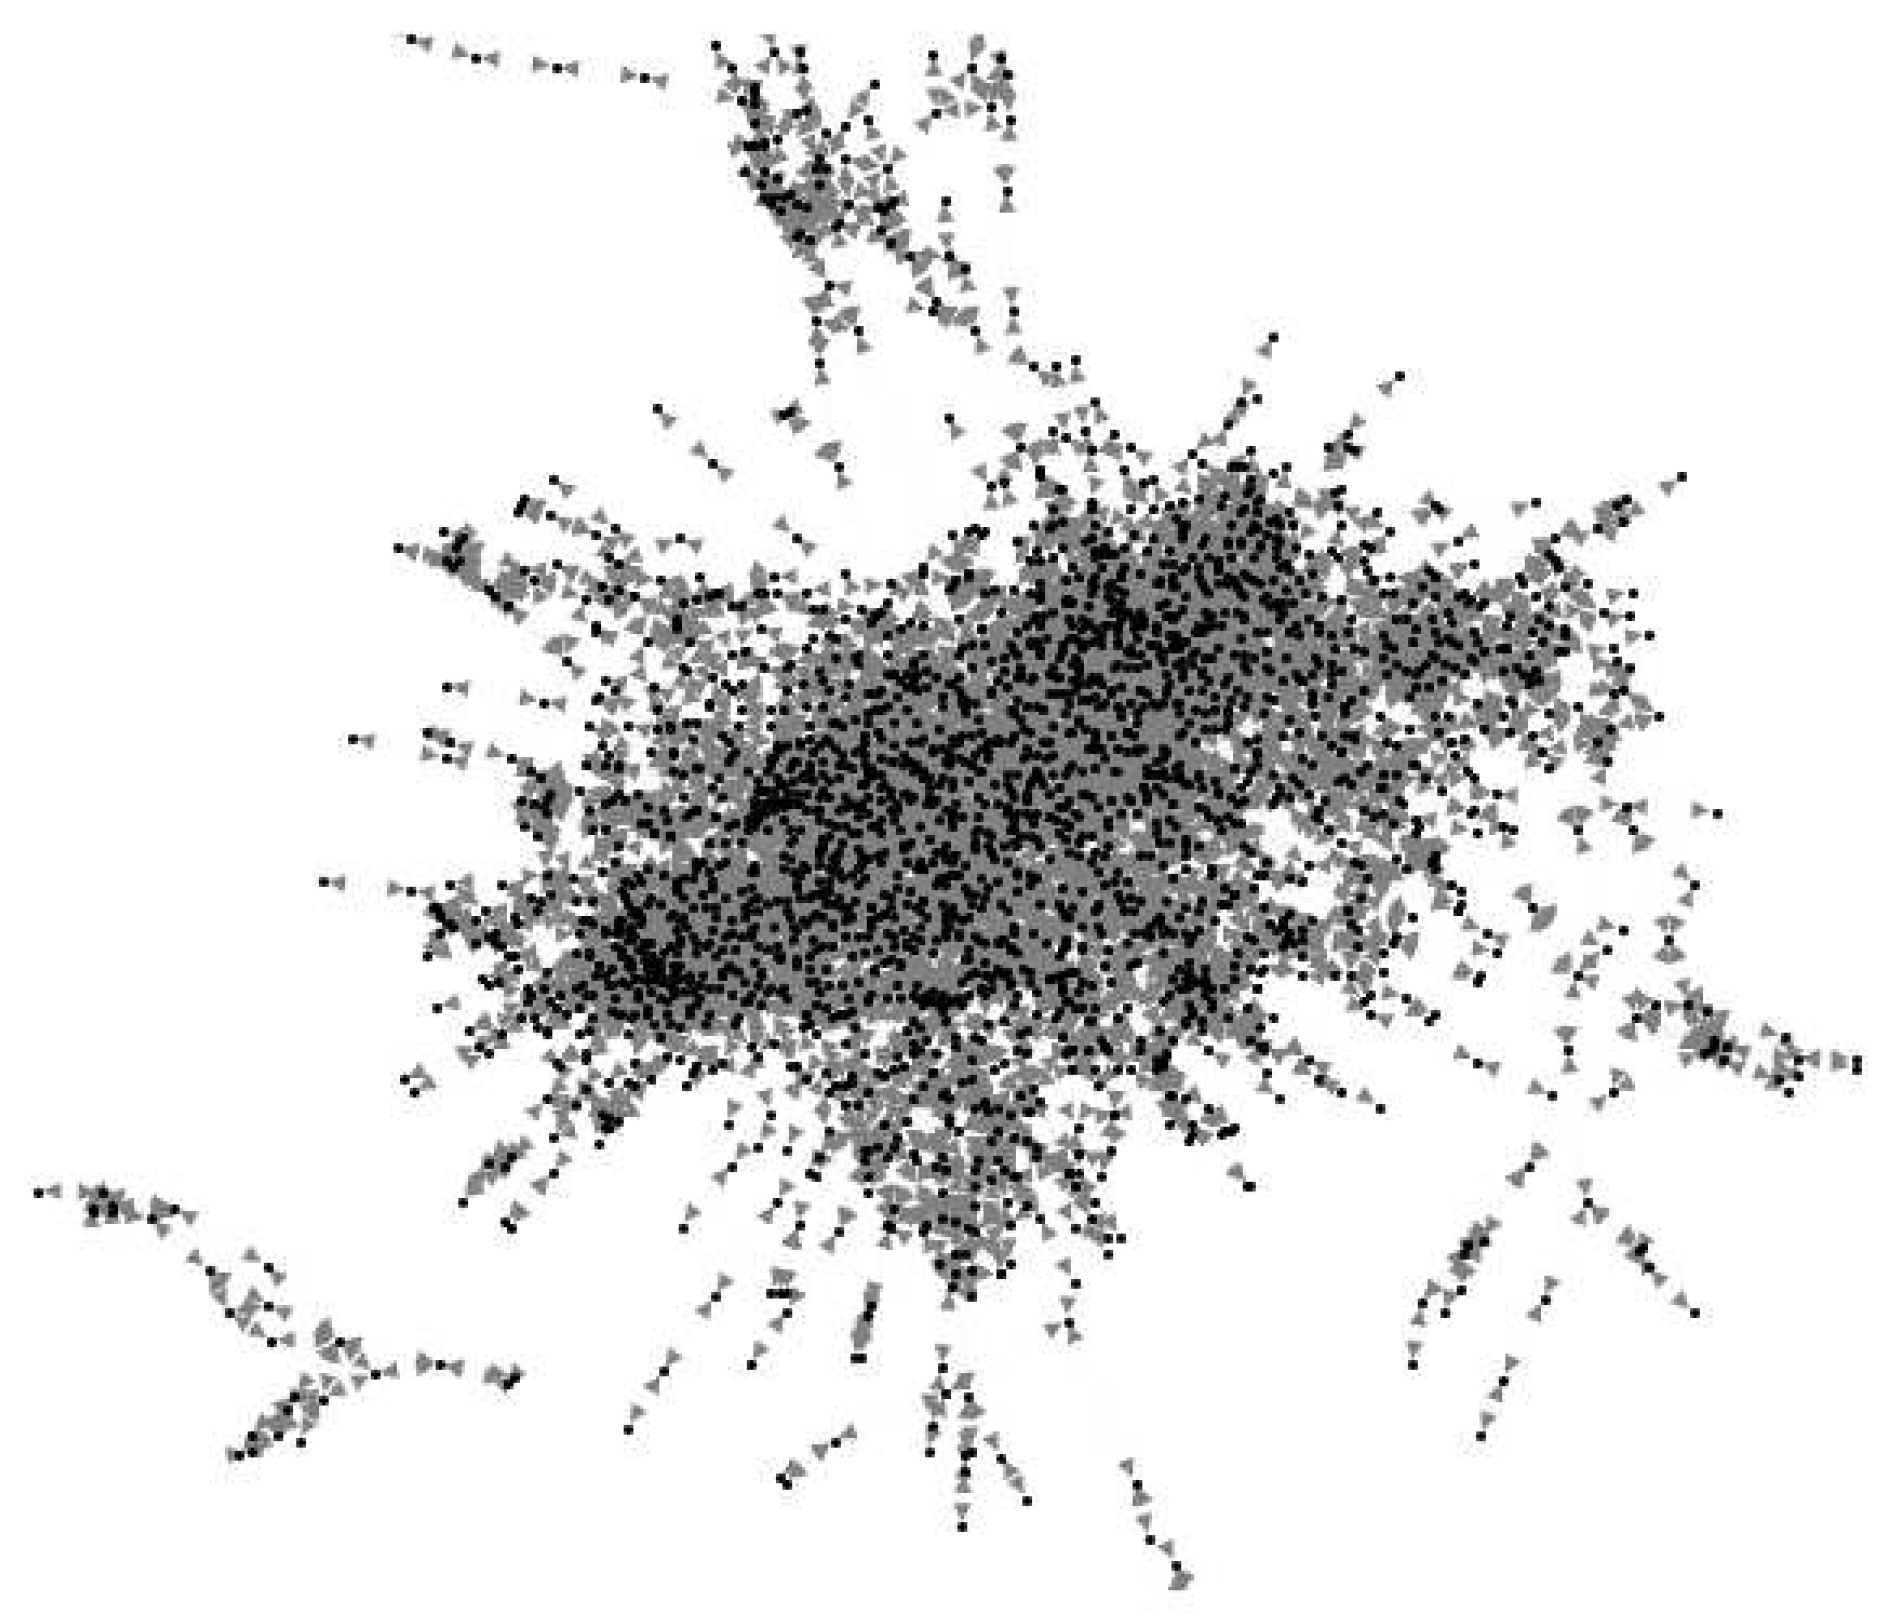
Figure 1.
Partial visualization of the CORA dataset.
Experiments are performed with the following set of parameters:
- d= 64. (Embedding dimension)
- N_encoder_layers =4 (Number of encoder layers)
- L2=5/2708 (Numbers of neighbors in ego graphs)
- N_iter = 100. (Number of epochs in the training process)
- Fr – 20 %. (The fraction of the omitted nodes)
- S – the cosine similarity.
- Tr – 0.95. (The link prediction threshold)
Cosine similarity functions as a metric for assessing the similarity between two vectors within a vector space by determining the angle’s cosine. This yields a numerical representation indicating the degree of similarity. The scale of cosine similarity ranges from -1 to 1, where a value of 1 signifies identical vectors, 0 implies no similarity, and -1 denotes entirely dissimilar vectors. The calculation involves dividing the dot product of the vectors by the product of their magnitudes or norms, ensuring that the similarity measure remains invariant to the lengths of the vectors, depending solely on their directions.
The utility of cosine similarity extends across various domains, including natural language processing, information retrieval, and data mining. It provides a method for quantifying the similarity between vectors or documents based on their respective orientations within a multi-dimensional space.
Two bar charts analyze the distribution of scores obtained during the tests at two predefined confidence thresholds: L2=5 and L2=2708 (the number of edges in the graph). The data range is partitioned into four equal segments outlined by data quartiles, each assigned a distinct color for visual clarity: red, yellow, blue, and green. This color scheme highlights specific regions of interest, particularly the red zone at the bottom, which is expected to contain a higher proportion of low-confidence scores, and the green zone at the top, where high-confidence scores are anticipated.
The horizontal axis of each histogram represents the count of instances where a specific number of papers (shown on the vertical axis) were successfully recovered based on the chosen threshold. This allows us to analyze the distribution of recovered citations at different confidence levels and identify potential patterns within the data. The "red" category at the bottom of the graph is predicted to contain a higher proportion of suspected citations, while the "green" category at the top is expected to include consistently cited papers.
The charts portray the count of successfully recovered instances on the horizontal axis, with the associated unnormalized frequencies displayed on the vertical axis. These frequencies signify the number of notes successfully retrieved corresponding to each recovery count. Notably, the categories marked by colors, such as the lowest "red" category (anticipated to contain the most suspected citations) and the highest "green" category (indicative of the most consistent ones), are of primary interest.

Table 1.
Distributions of edge recovering for the CORA dataset for L2=5.
| Length | 13 | 3 | 2 | 9 |
| Upper bound | 13 | 16 | 18 | 27 |
| Mean | 7 | 15 | 17.5 | 23 |
As evident from the data, the maximum recovery score is 27. Upon comparing these results given in Figure 2 and Table 2 with those outlined in [10], it becomes apparent that the higher recovery threshold (0.95) contributes to this outcome. The dataset exhibits a mean of 16.8 and a median of 16, indicating a " Positively Skewed distribution".
The next experiment is provided with L2=2708.
Upon examination of the bar chart in Figure 2 and Figure 3 and Table 2 and Table 3 generated for different L2 values, a distinct similarity among them becomes evident. This observation suggests the presence of a consistent underlying structure within the dataset that remains resilient to variations. However, it is notable that the last chart exhibits more evident characteristics indicative of a "Positively skewed distribution." Essentially, the majority of data points cluster toward the left side, with a right tail extending further. Notably, the mean of 16.9 is less than the median (16), and the distribution displays a longer and more gradual decrease on the right side.
Figure 3.
Distributions of edge recovering for the CORA dataset for L2=2708.
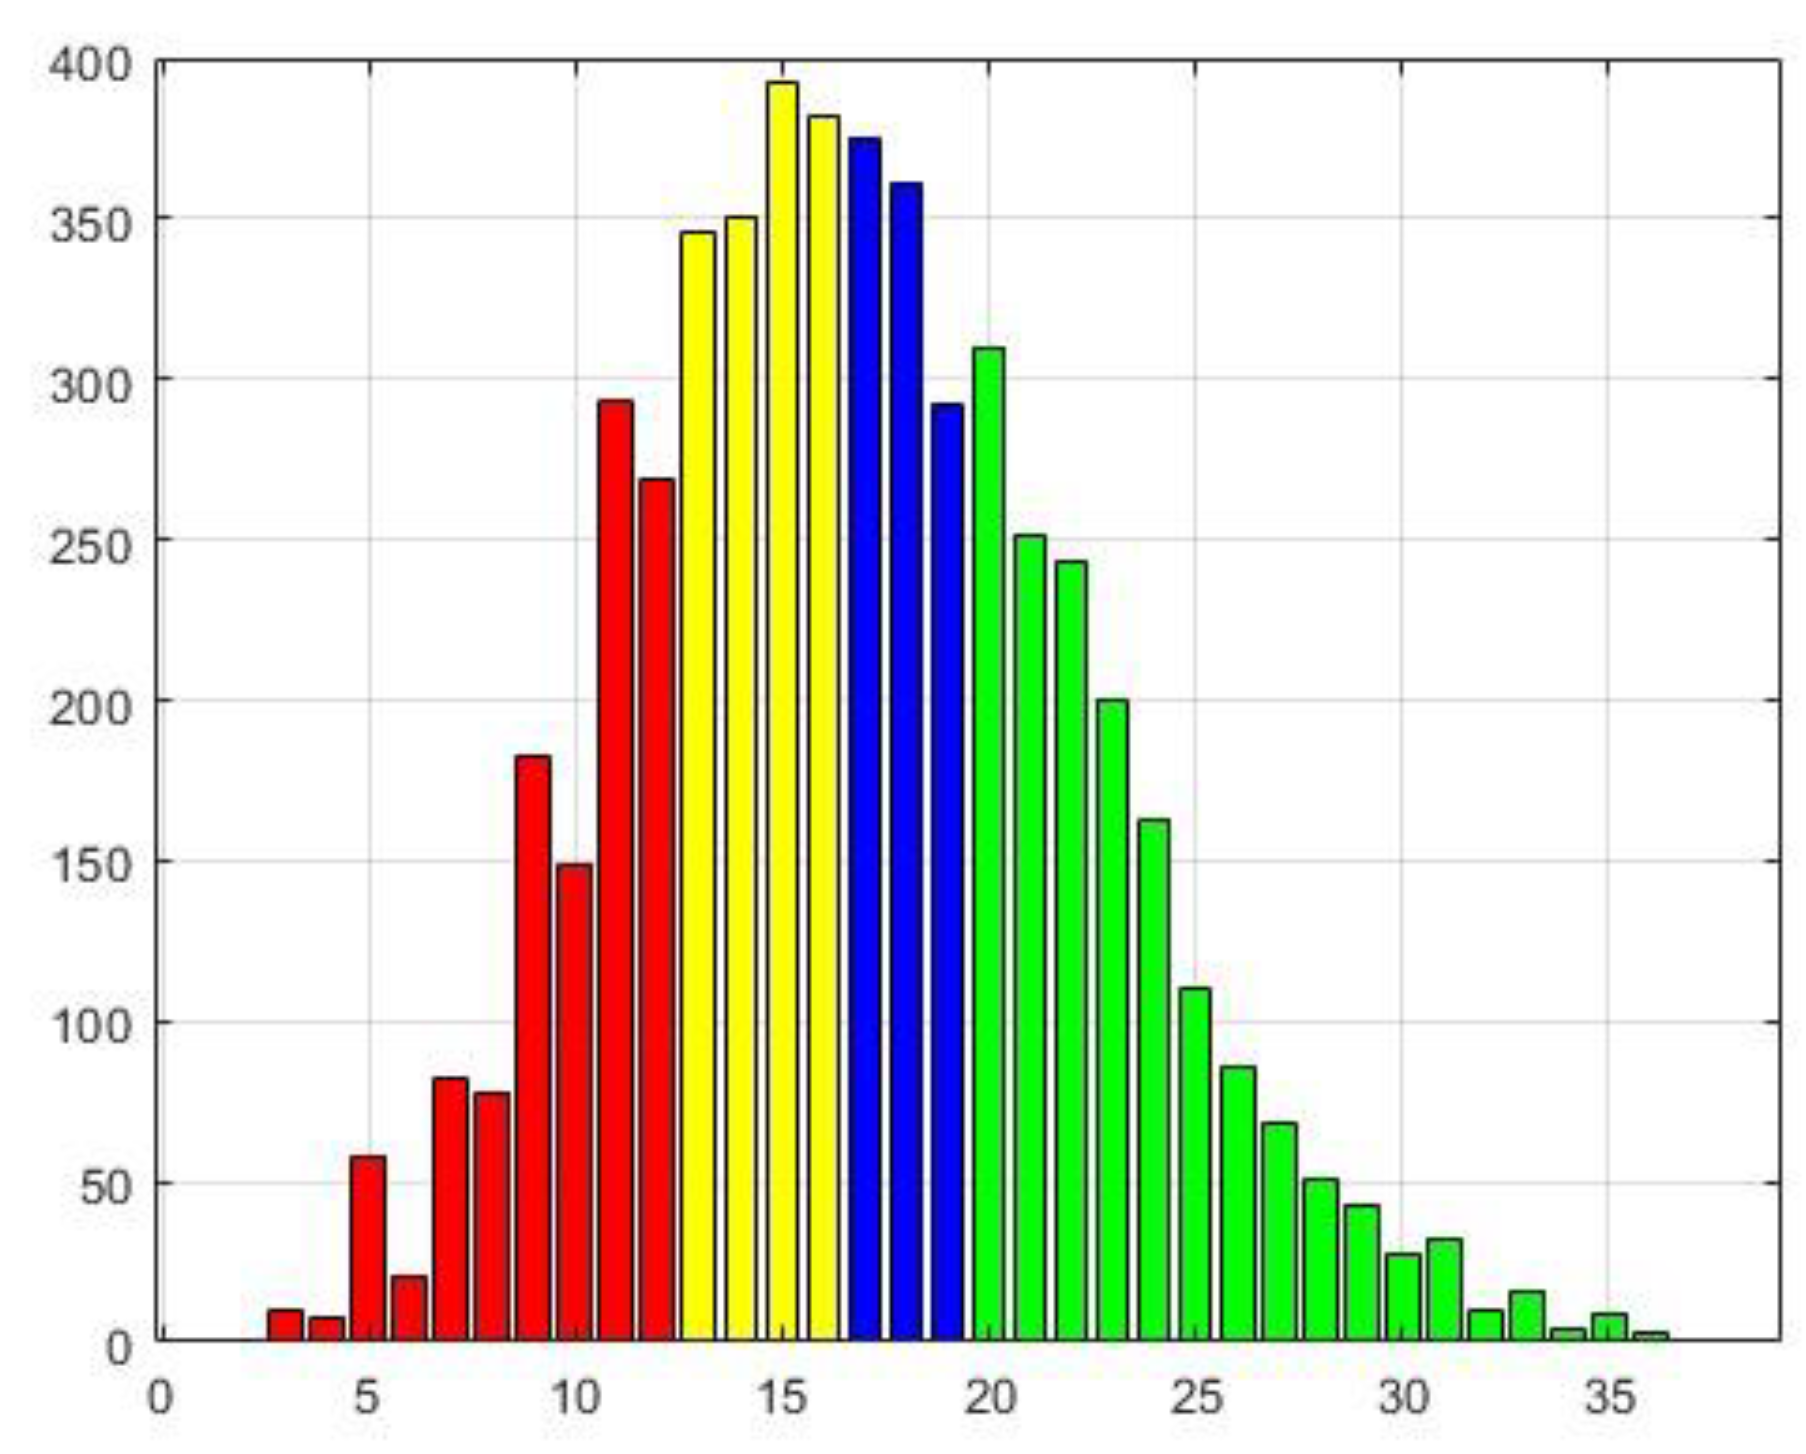
Table 3.
Distributions of edge recovering for the CORA dataset for L2=2708.
| Length | 12 | 4 | 3 | 19 |
| Upper bound | 12 | 16 | 19 | 28 |
| Mean | 6.5 | 14.5 | 18 | 29 |
A distinct similarity emerges with a meticulous examination of the charts and tables corresponding to different L2 values, where the initial case appears as a condensed iteration of the latter. This outcome is attributed to the artificial constraint on the number of neighbors considered in ego graphs. Intriguingly, this limitation seems to homogenize the degrees of the nodes, resulting in a more symmetrical and smoothed visual representation. While the overall trend remains unaltered, this observation highlights the existence of a robust and unwavering underlying structure within the dataset that remains impervious to permutations.
Further analysis reveals a fascinating subgroup of edges exhibiting consistent behavior across all perturbations, implying a heightened probability of accurate reconstruction. These resilient connections, forming the backbone of the data, constitute a substantial portion of the network’s critical interactions.
4.2. CiteSeer dataset
The CiteSeer dataset (see, e.g. https://paperswithcode.com/dataset/citeseer) is a well-established and frequently employed academic dataset within the realms of information retrieval and machine learning. It serves as a valuable resource for tasks such as citation network analysis and document clustering, particularly focusing on scientific papers in the field of computer science and related domains. The CiteSeer dataset includes 3,312 scientific publications classified into six distinct classes, with a citation network featuring 4,732 links. Each publication is represented by a binary word vector, using 0 and 1 to signify the absence or presence of the corresponding word from the dataset’s dictionary. This dictionary encompasses a total of 3,703 unique words.
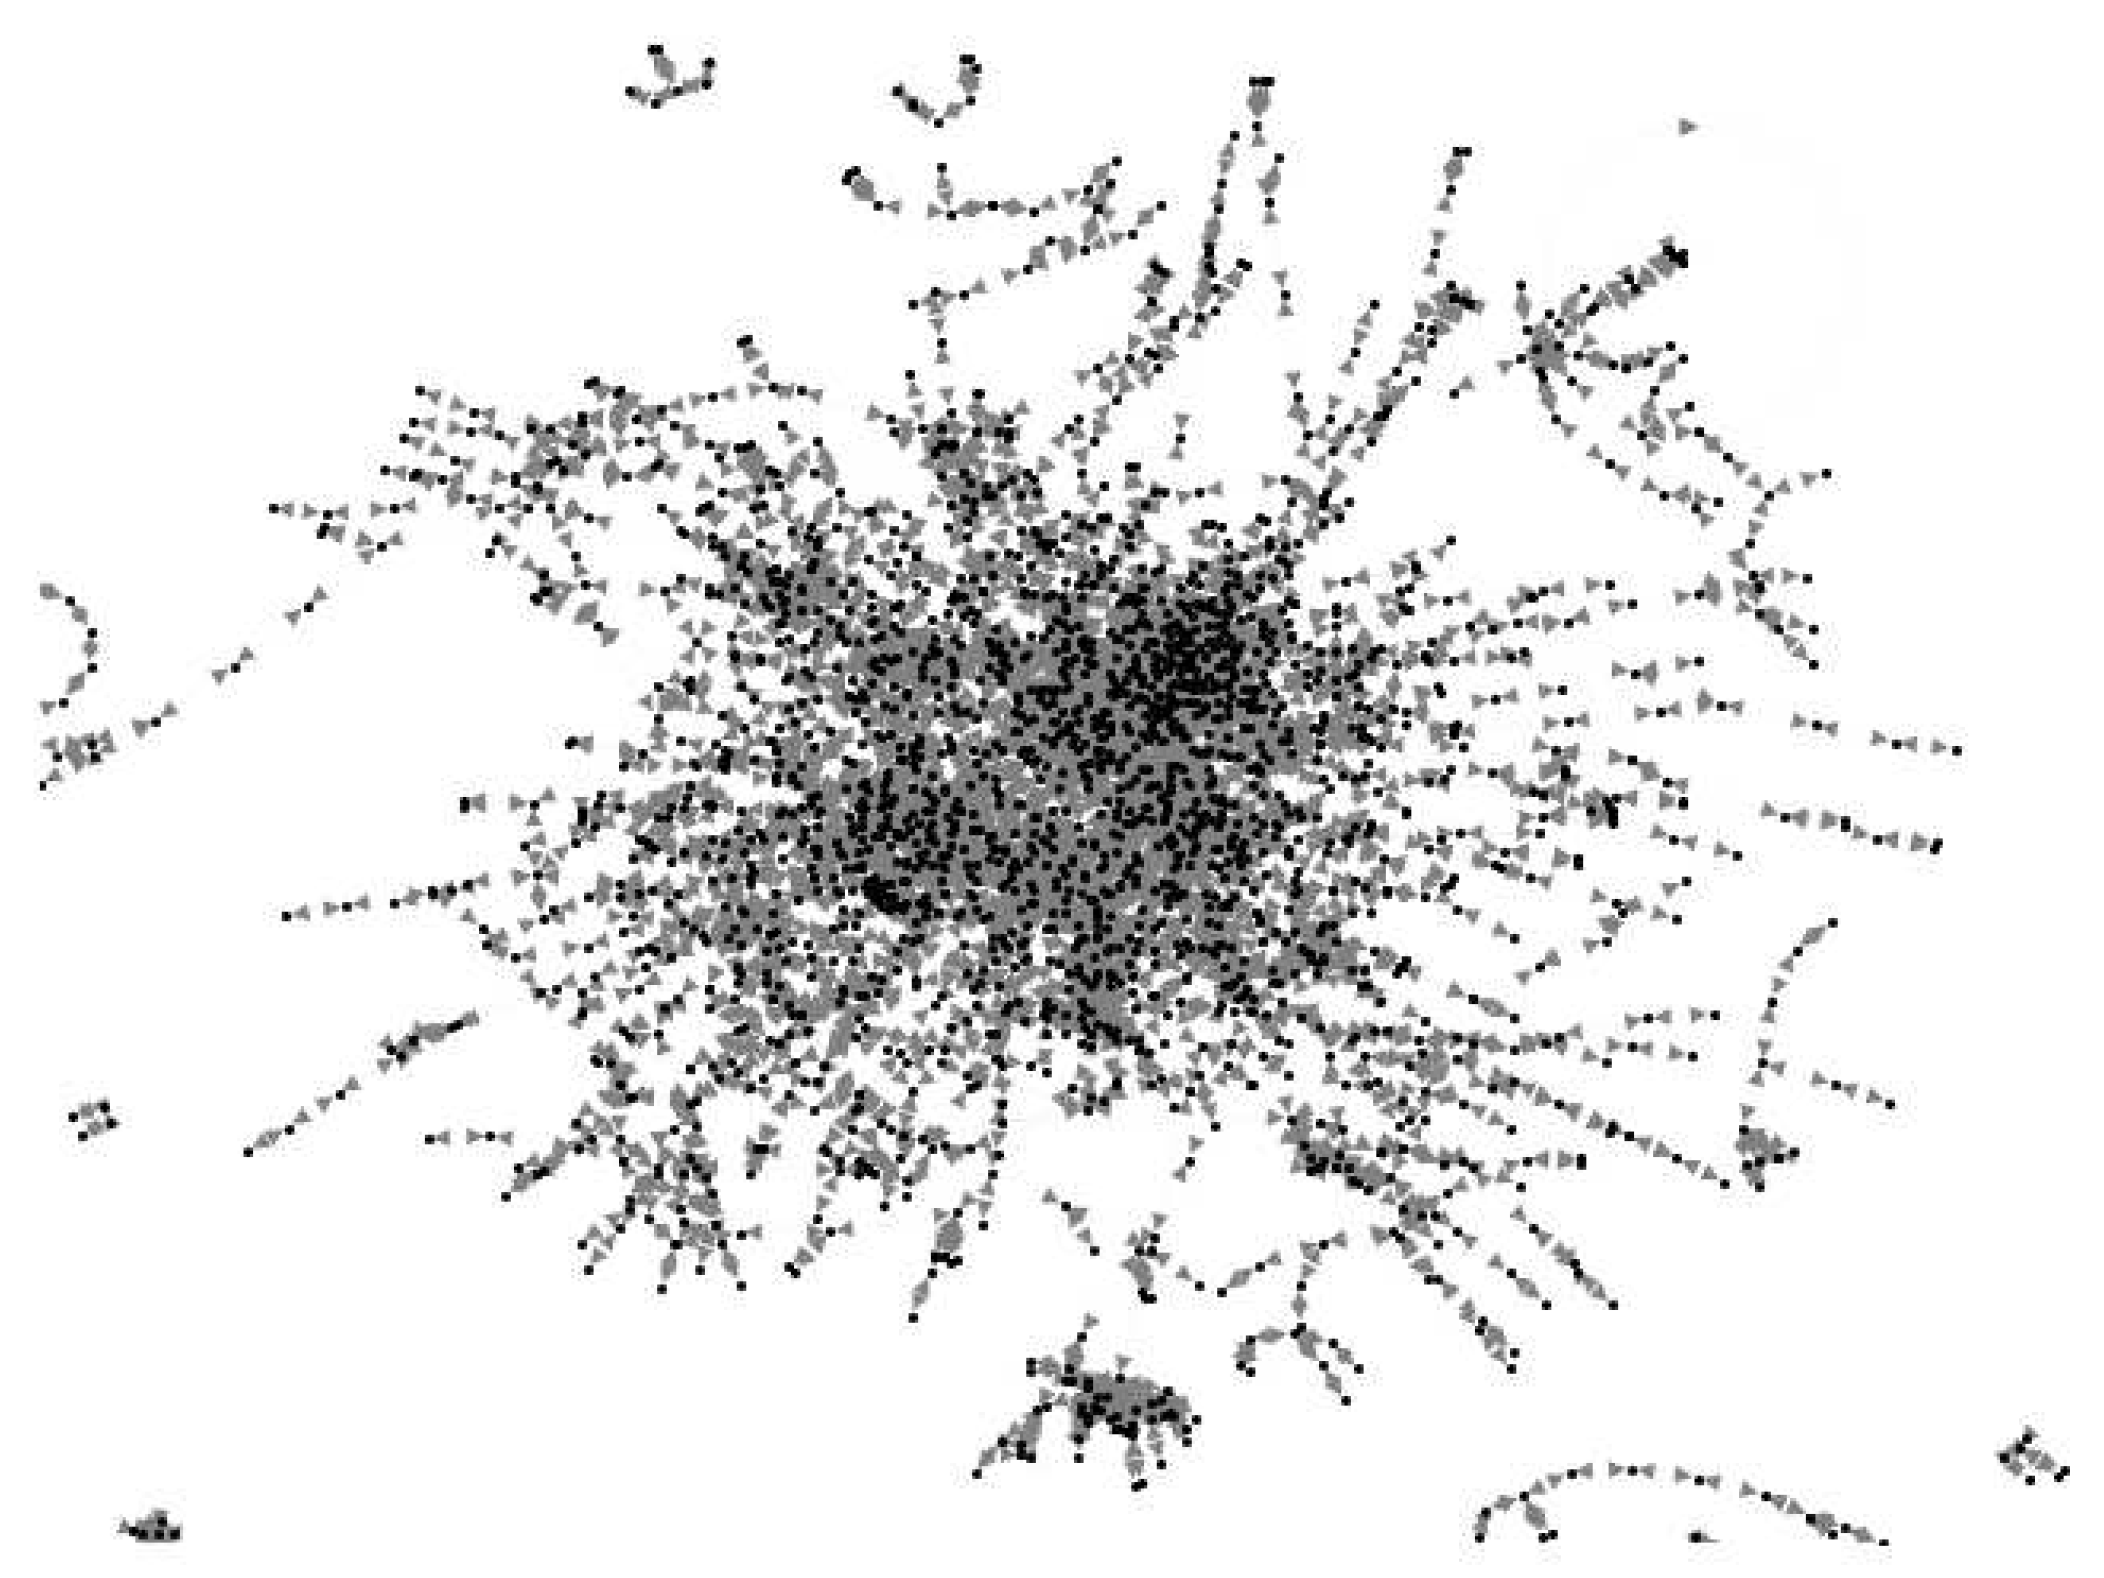
Figure 4.
Partial visualization of the CiteSeer dataset.
Key attributes of the CiteSeer dataset encompass:
Citation Network: The dataset provides comprehensive information on citation links among different papers, facilitating the examination of citation patterns and relationships between scientific publications.
Document Metadata: Each document within the dataset is accompanied by metadata such as title, authors, and abstract, supplying essential details for text-based analyses.
Bag-of-Words Representation: Documents are often represented using a bag-of-words model, where the presence or absence of specific words serves as features.
Clustering and Classification Tasks: Researchers commonly leverage the CiteSeer dataset for tasks like document clustering and classification, aiming to group similar documents or predict document categories.
The CiteSeer dataset has significantly contributed to advancements in research areas such as information retrieval, machine learning, and natural language processing. Its content and structure provide a foundation for developing and evaluating algorithms pertaining to analyzing academic documents.
Experiments are performed with а similar to the previous parameter set:
- d= 64. (Embedding dimension)
- N_encoder_layers =4 (Number of encoder layers)
- L2=5/100 (Numbers of neighbors in ego graphs)
- N_iter = 100. (Number of epochs in the training process)
- Fr – 70 %. (The fraction of the omitted nodes)
- S – the cosine similarity.
- Tr – 0.9, 0.95. (The link prediction threshold)
Let us provide the results
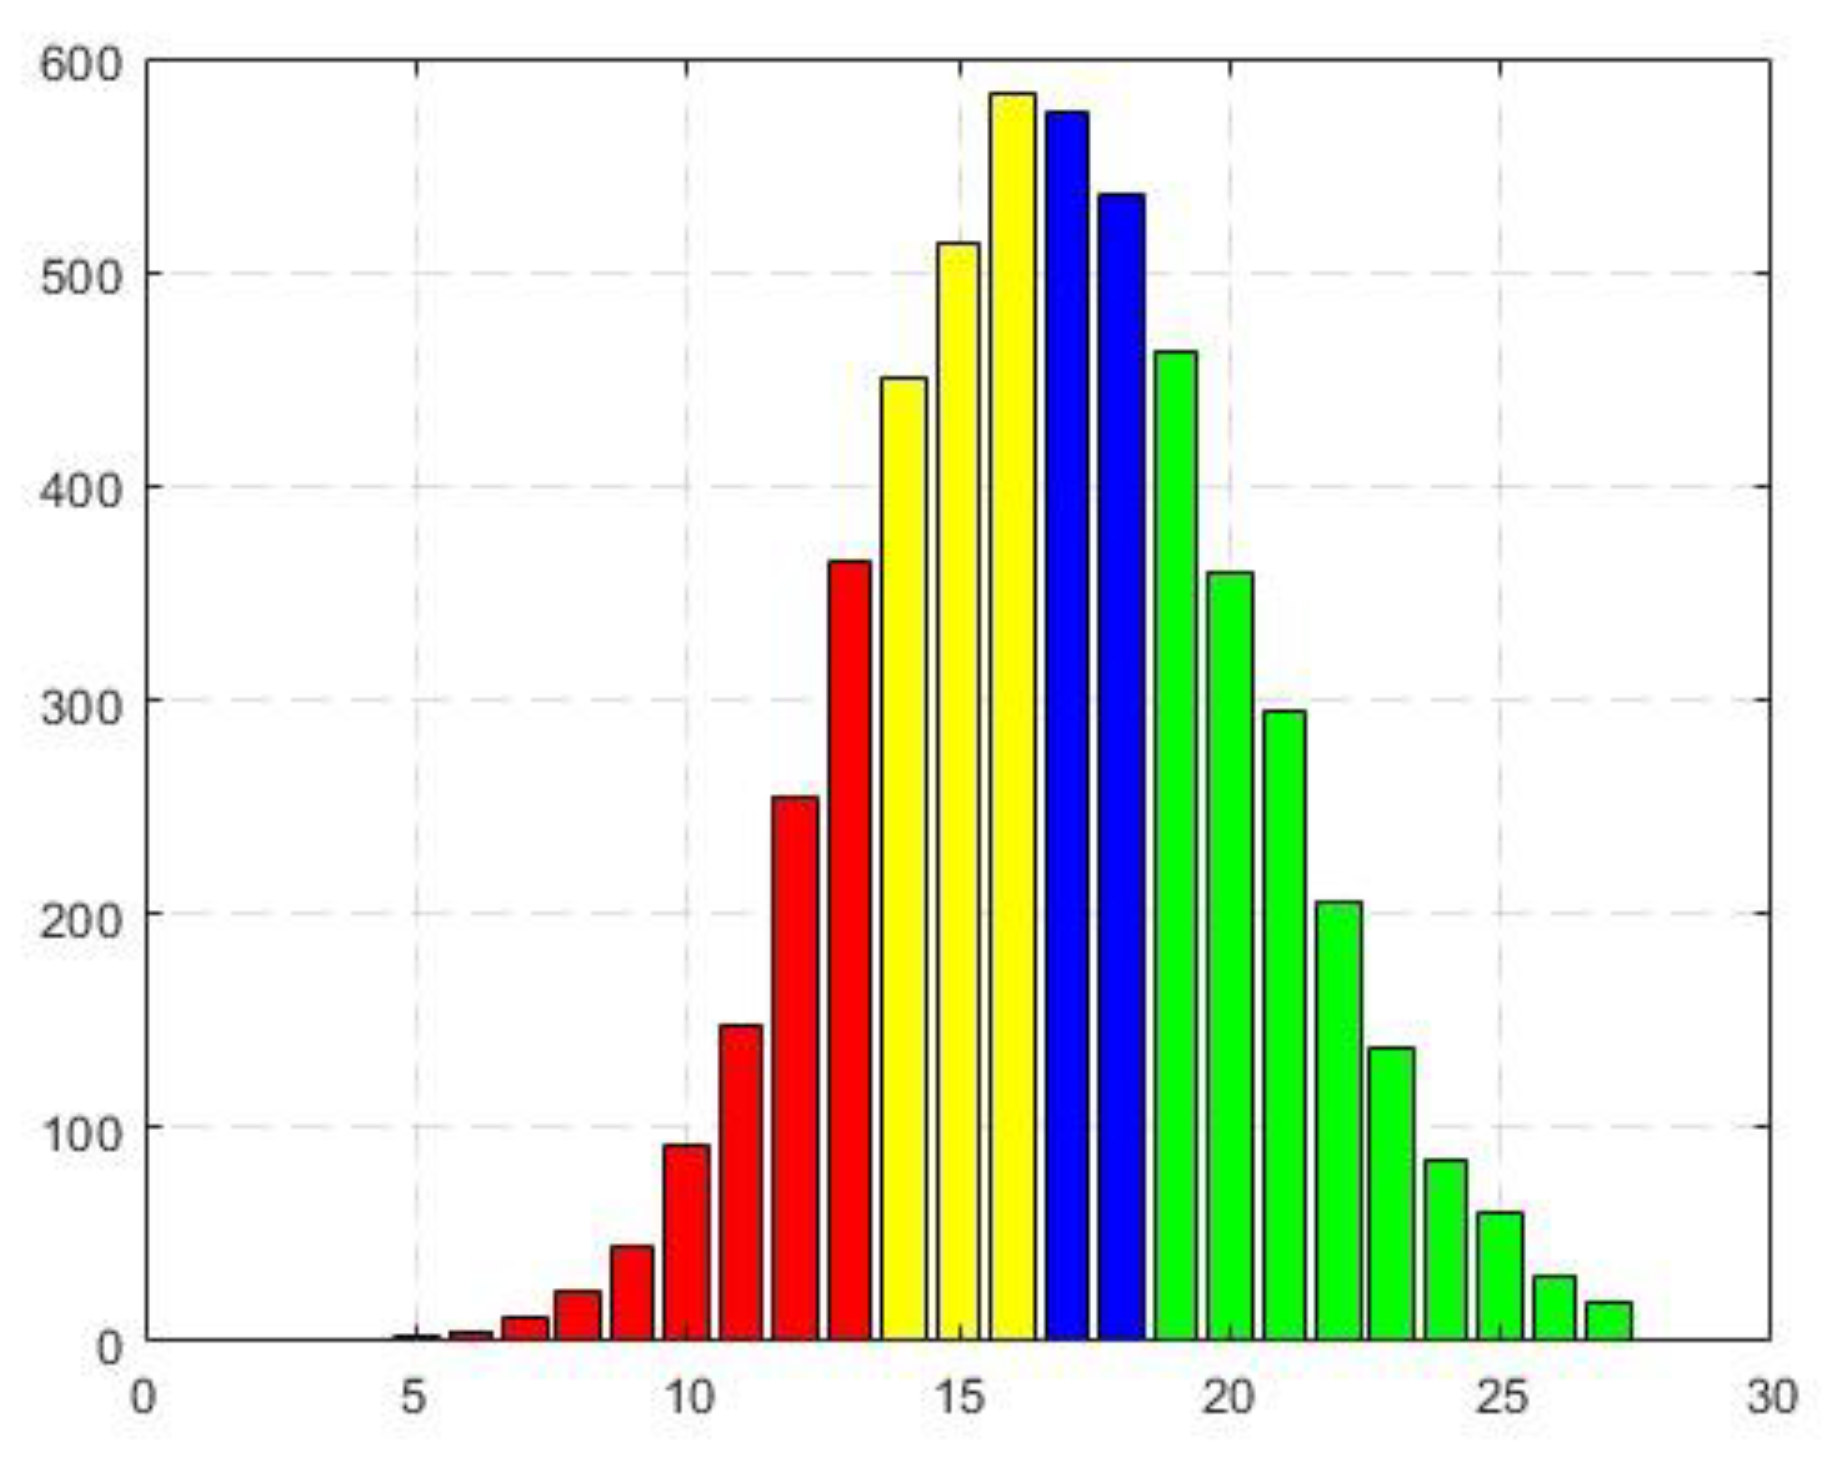
4.2.1. The case of L2=5 and Tr=0.95
The observed distribution given in Figure 5 and Table 4 illustrates a distinct “Positively skewed distribution”.
Figure 5.
Distributions of edge recovering for the CiteSeer dataset for L2=5 and Tr=0.95.
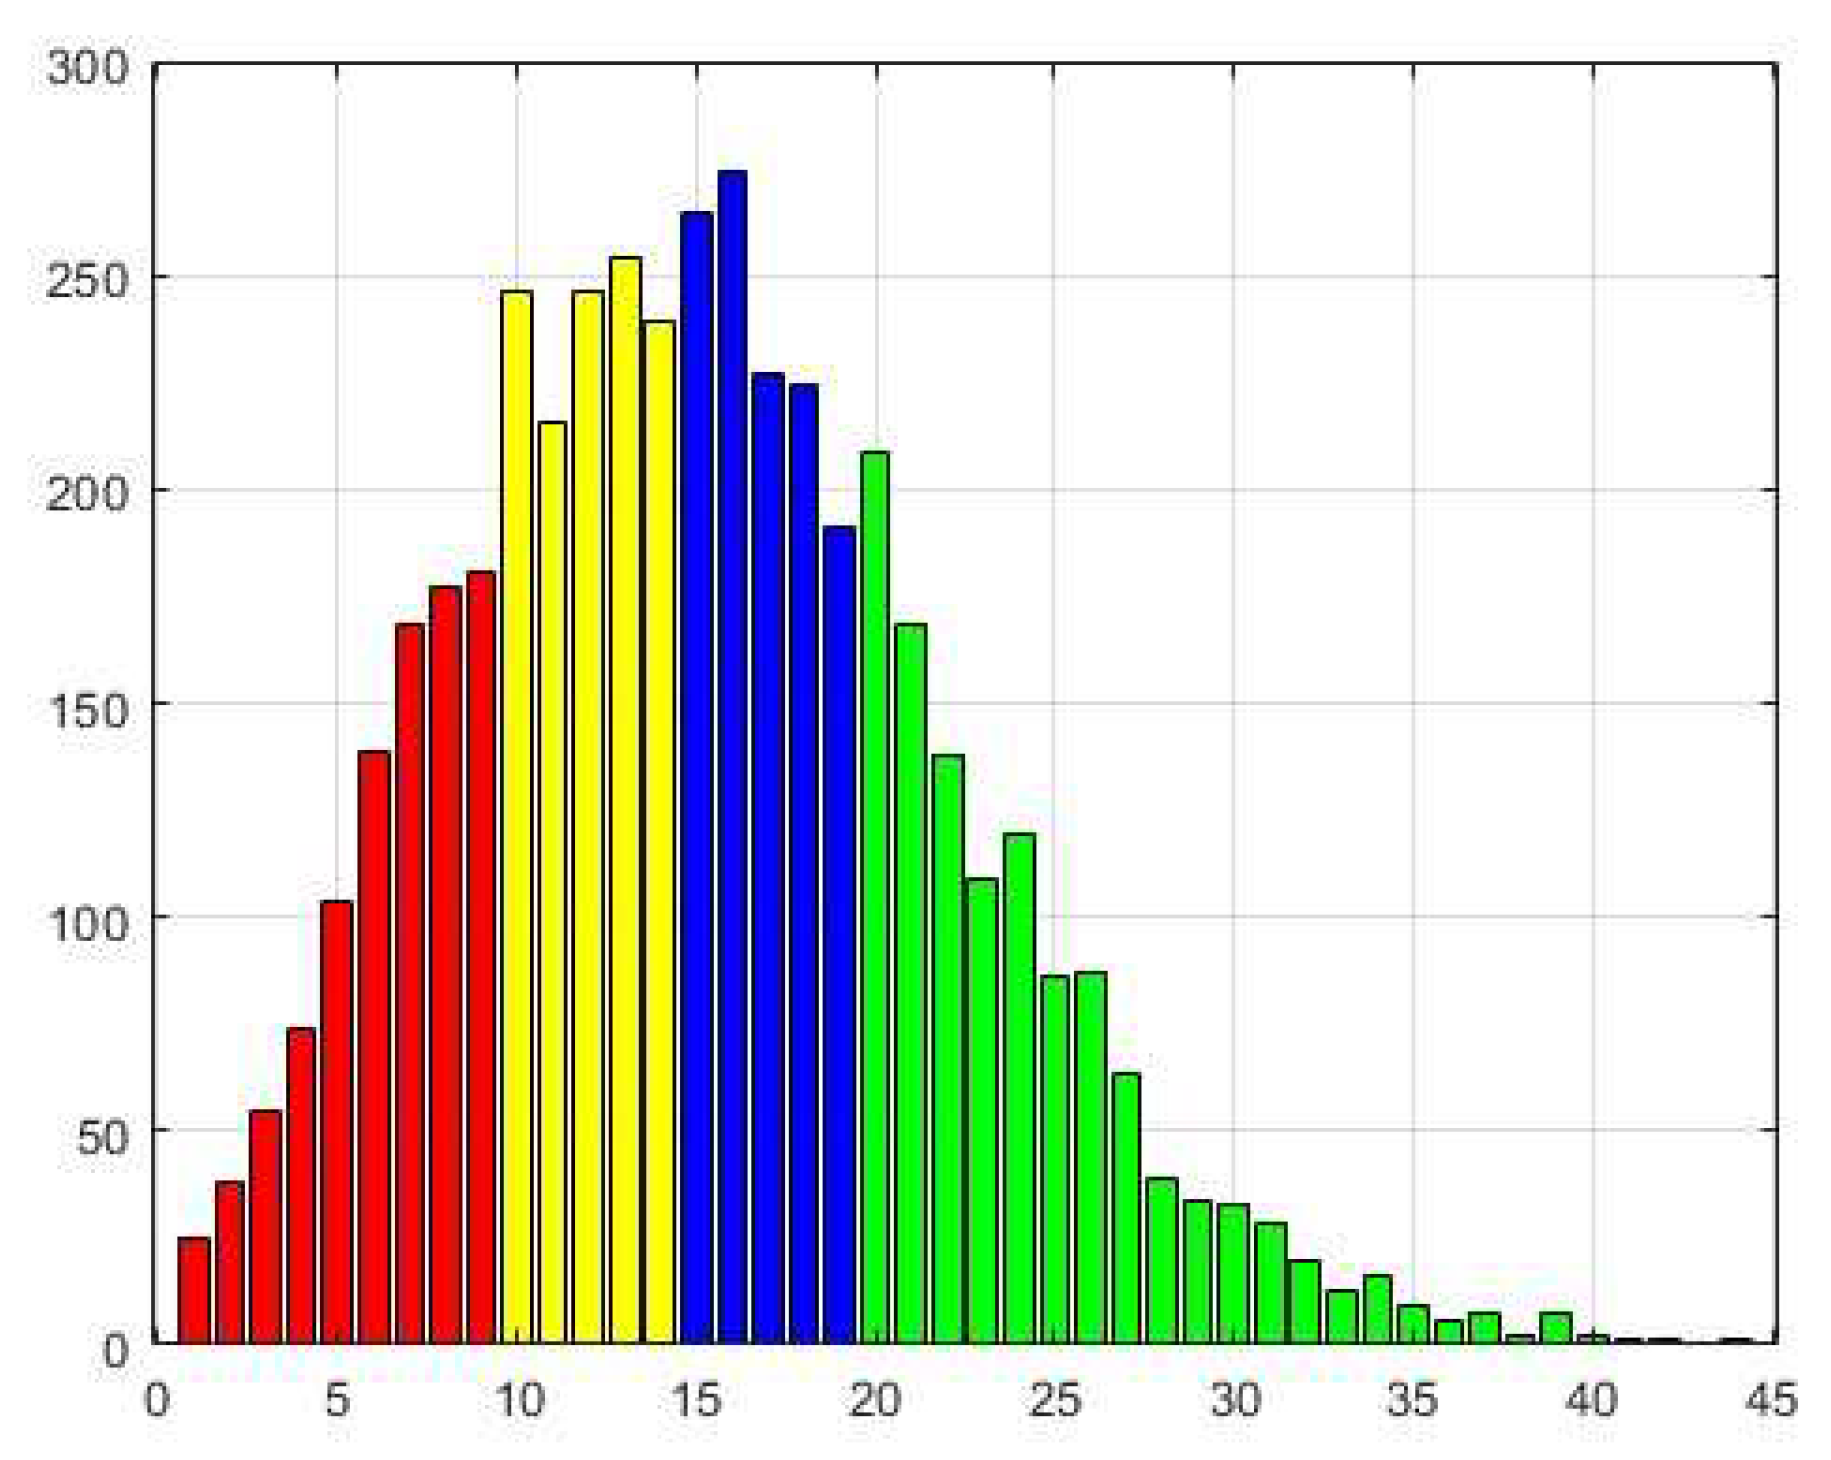
Table 4.
Distributions of edge recovering for the CiteSeer dataset for L2=5 and Tr=0.95.
| Length | 9 | 5 | 5 | 25 |
| Upper bound | 9 | 14 | 19 | 44 |
| Mean | 5 | 12 | 17 | 32 |
4.2.2. The case of L2=100 and Tr=0.95
As observed in the previous results, the template utilized in the prior experiment appears to be a condensed version of the current one. This smoothing effect is evidently influenced by the constraint on the number of neighbors in ego graphs. Additionally, there is a substantial increase in the number of successfully recovered edges.
Figure 6.
Distributions of edge recovering for the CiteSeer dataset for L2=100 and Tr=0.95.
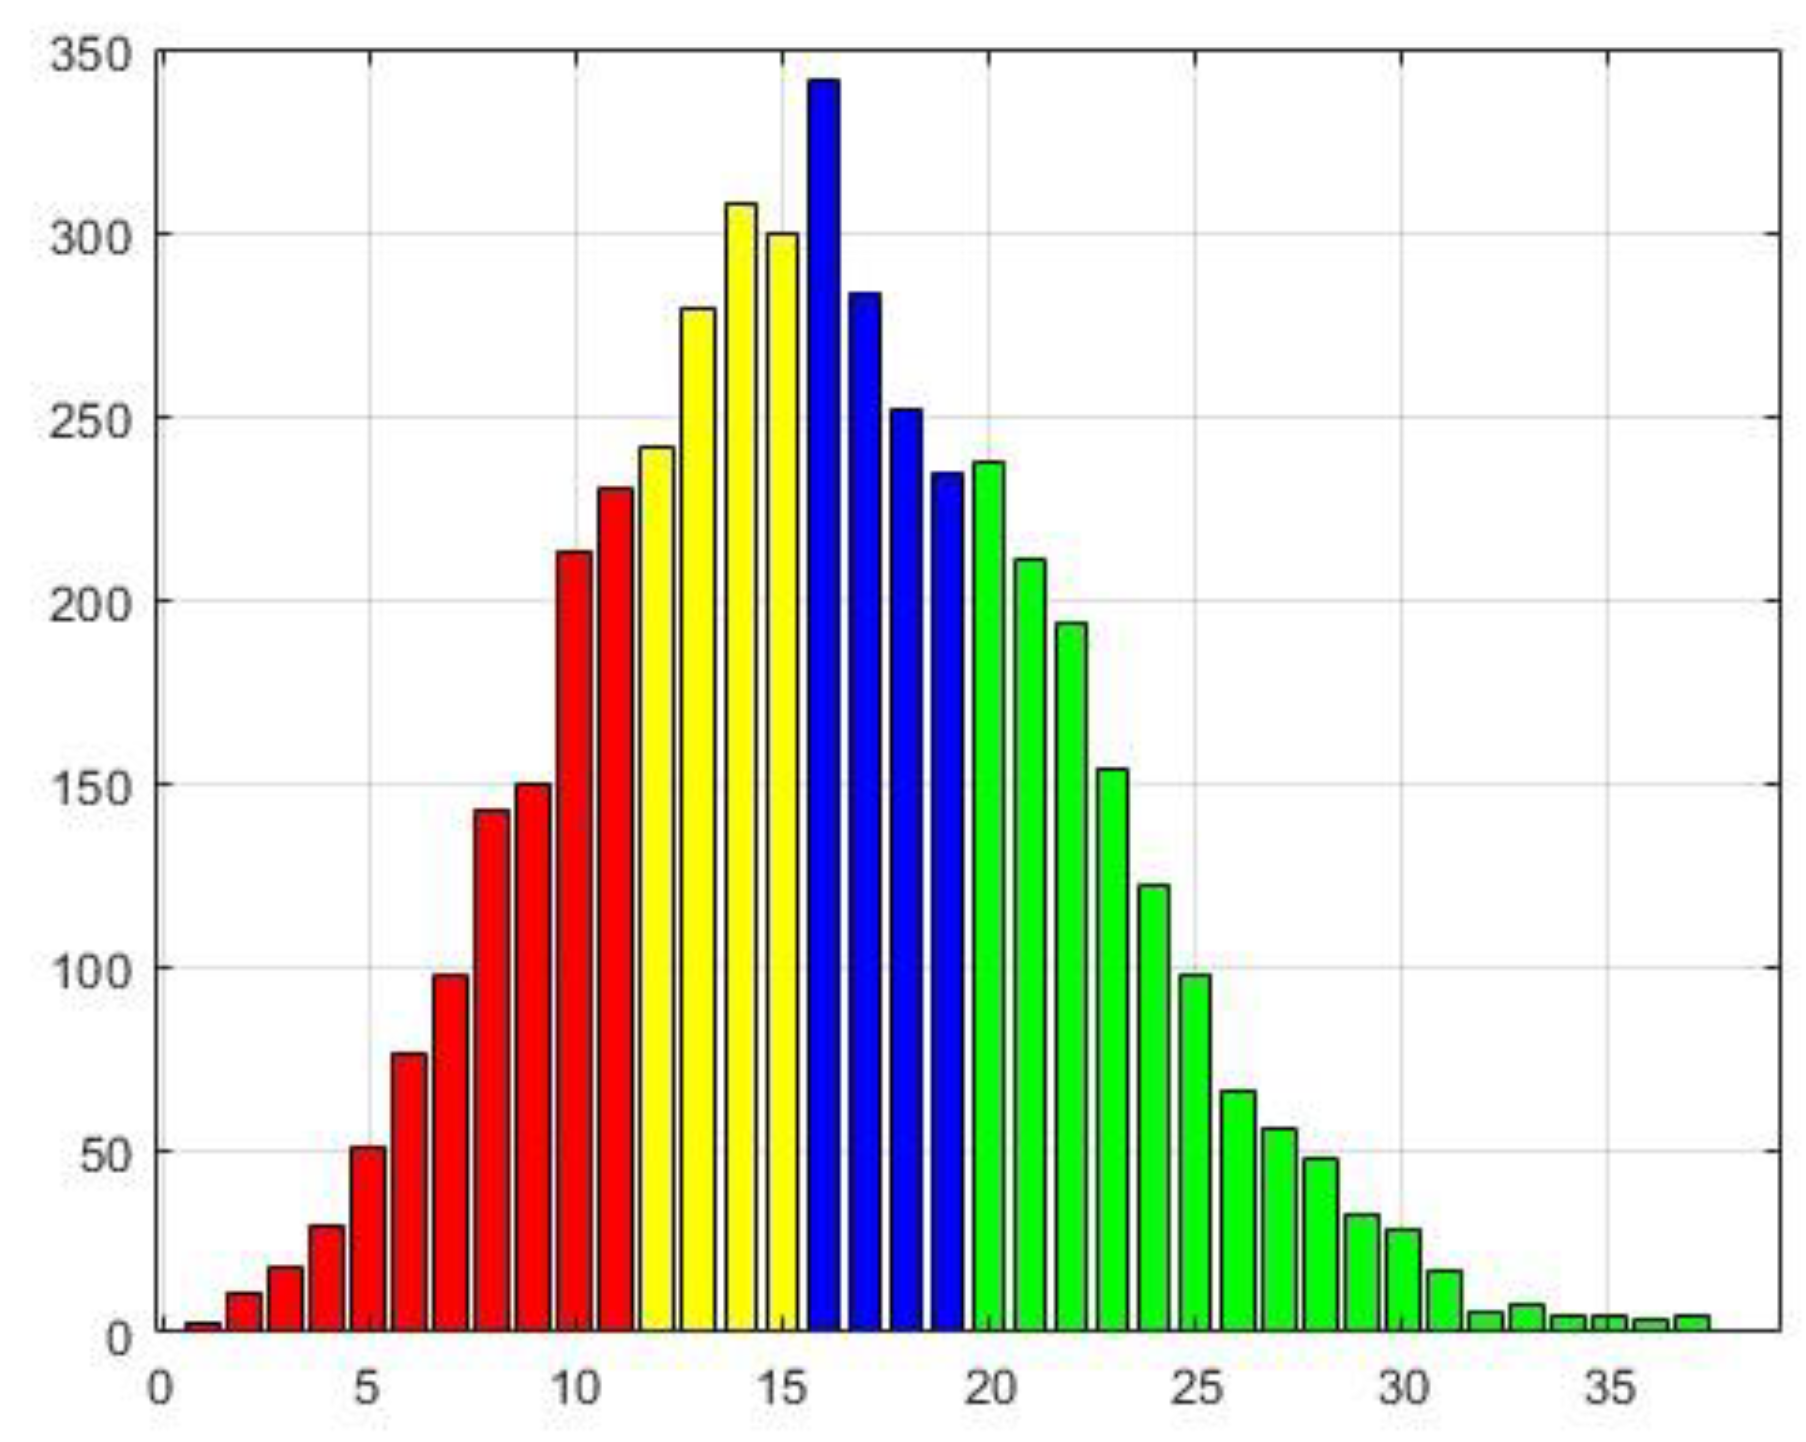
Table 5.
Distributions of edge recovering for the CiteSeer dataset for L2=5 and Tr=0.95.
| Length | 11 | 4 | 4 | 19 |
| Upper bound | 11 | 15 | 19 | 38 |
| Mean | 11 | 15 | 19 | 38 |
4.2.3. The case of L2=100 and Tr=0.9
The results displayed in Figure 7 and Table 6 are evidently a rendition of those obtained for L2=5 and Tr=0.95. Nevertheless, when maintaining the symmetry template, the distribution skewness becomes less distinct and appears to be more obscured by noise, with a mean of 16.18 and a median of 15. It also interesting to note that the threshold change does not affect the results.
Figure 7.
Distributions of edge recovering for the CiteSeer dataset for L2=100 and Tr=0.9.
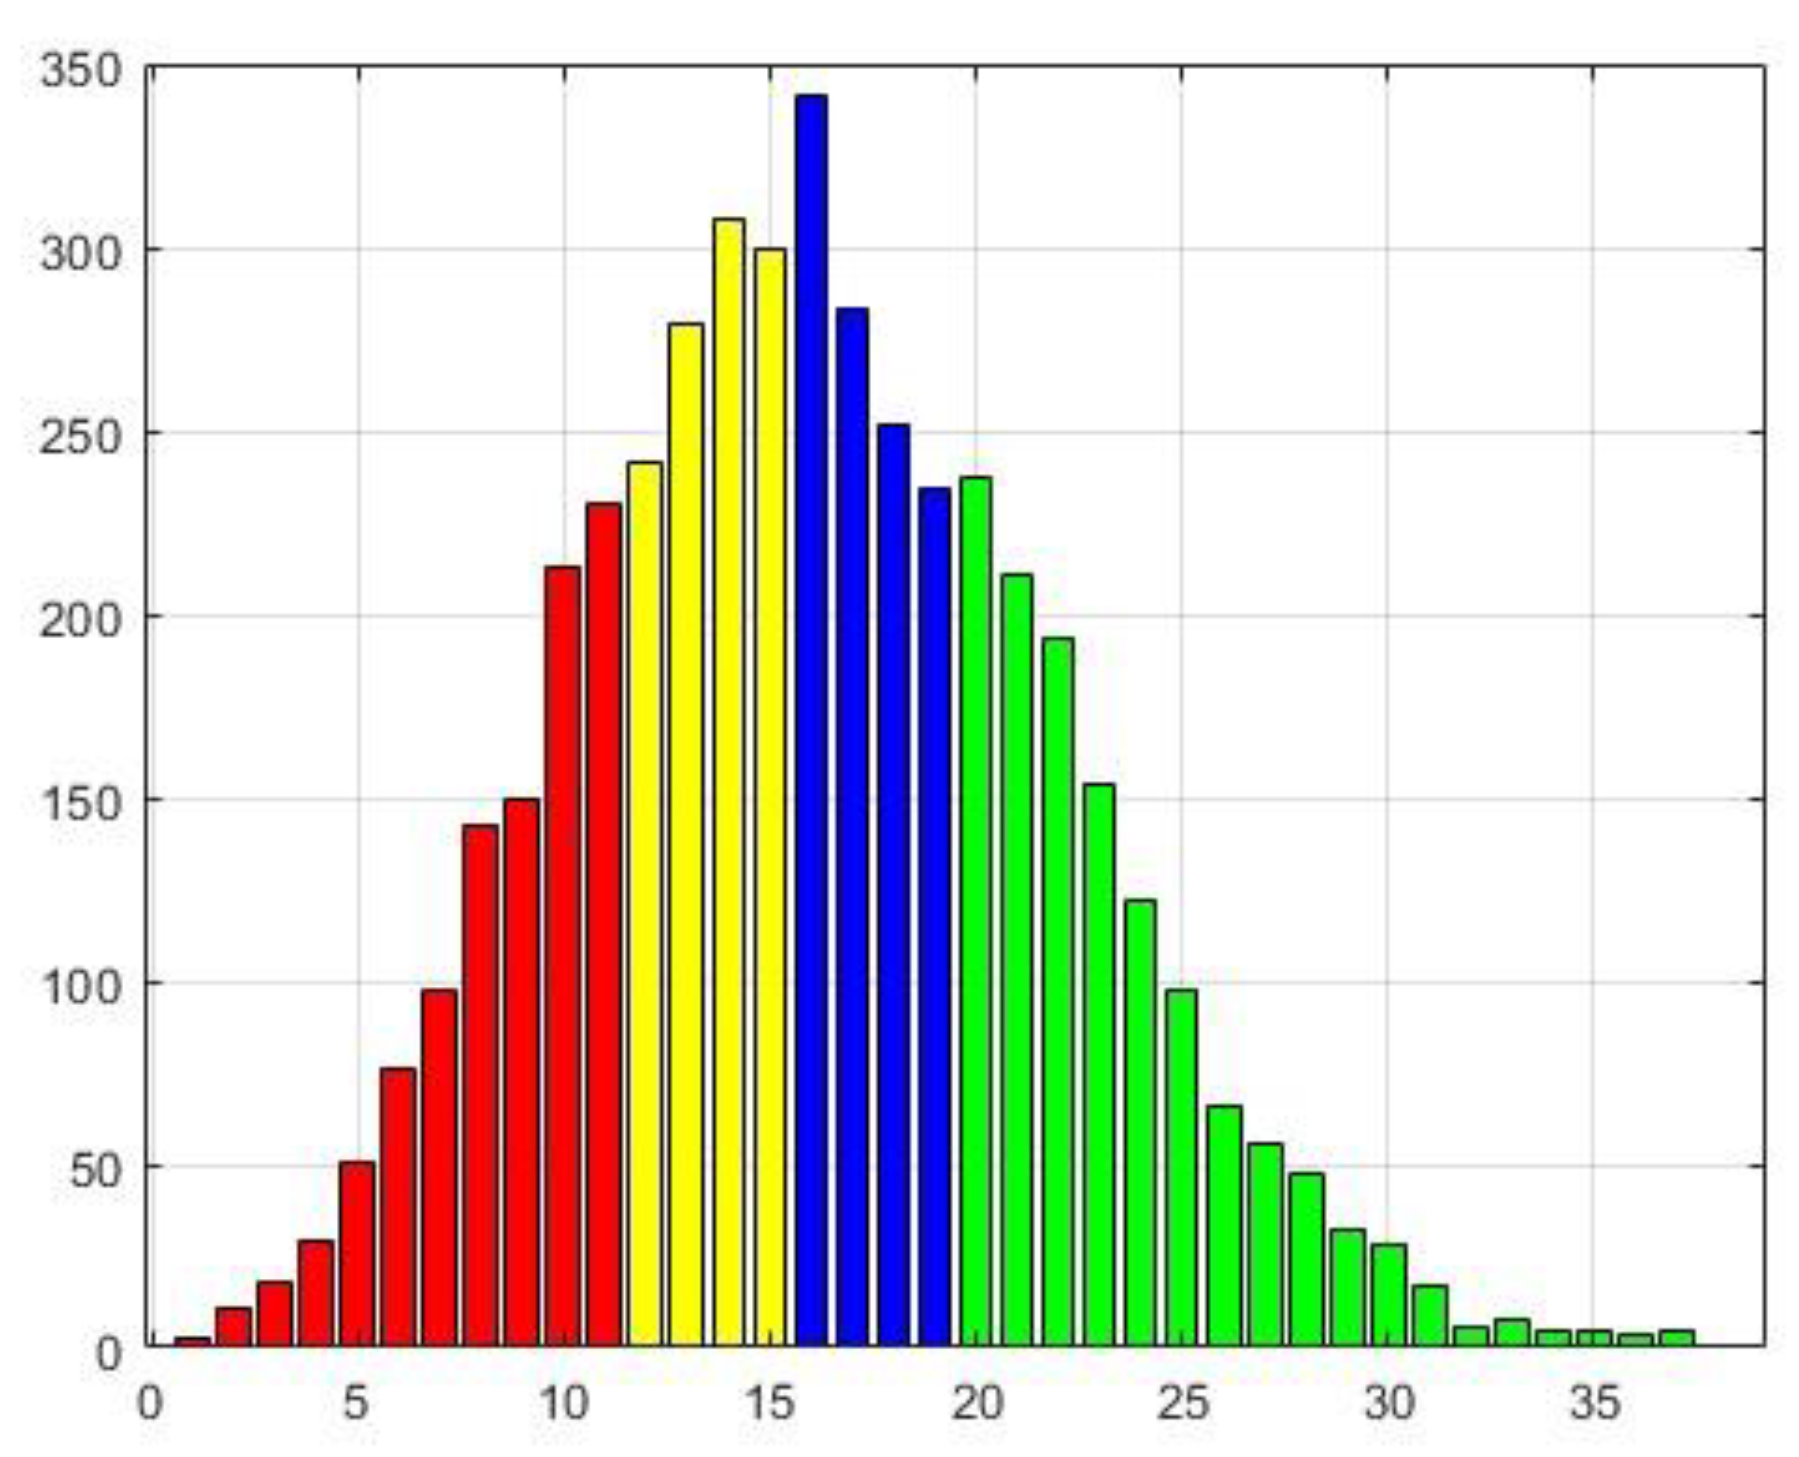
Table 6.
Distributions of edge recovering for the CiteSeer dataset for L2=100 and Tr=0.9.
| Length | 11 | 4 | 4 | 19 |
| Upper bound | 11 | 15 | 19 | 38 |
| Mean | 6 | 13.5 | 17.5 | 29 |
5. Conclusions
Breaking new ground in identifying illegitimate citations, this paper proposes an approach. It builds upon the Generalization of Transformer Networks for Graphs and incorporates a masking mechanism to disrupt patterns in altered citation embeddings. Extensive testing validates the method’s efficacy, with masking embeddings provided by the transformer method shining as a dependable tool for uncovering citation manipulation. Moreover, the findings obtained on the chosen dataset closely mirror those observed in actual academic settings.
While excelling at detecting anomalies under regular citation patterns, the approach has limitations with multi-disciplinary works and "sleeping beauties" - articles went unnoticed initially but later experienced a surge in recognition. This phenomenon can arise from breakthrough discoveries or simply later appreciation, challenging this method’s detection capabilities.
Around 30-50% of the total edges (citations) prove susceptible to the distortion procedure, failing to withstand it. These edges, characterized by their heightened sensitivity to data transformation, deviate from the stable inner structure of the core system. Consequently, the associated citations may be deemed dubious and potentially manipulated. This underscores a nuanced dimension of the dataset’s integrity and emphasizes the potential impact of specific edges on its structural stability.
The analysis, even though exploring datasets with distinct internal structures, yields strikingly similar results. This unexpected finding points towards a possible universal inclination within the mutual citation system, suggesting the presence of shared characteristics that transcend the specificities of individual datasets. An intriguing observation is the consistent revelation of a stable core within the citation network across both datasets. While the precise mechanism behind this core’s formation remains unclear, it could be linked to the gradual accumulation of reliable links over time. Interestingly, even in datasets like these, which receive regular updates to incorporate newly published articles, as indicated in [10], approximately one-third of the edges (potentially slightly more due to the smaller proportion in the first category) showcase instability and a lack of relevance. This remarkable consistency across different datasets points toward a generalizable property regarding edge reliability, implying that a considerable portion of connections within citation datasets might be less trustworthy or susceptible to manipulation.
Expanding on this observation, it is imperative to recognize that the positive skewness in the distribution of reconstruction scores signifies a prevailing tendency for data points to lean toward lower scores. With its right-skewed tail, this unimodal distribution indicates that a substantial portion of the data is concentrated on the left side. At the same time, the mean is disproportionately influenced towards higher scores. Consequently, the prevailing pattern suggests that a significant number of references exhibit relatively modest reconstruction scores, prompting consideration of their potential suspicion or manipulation.
The consumption of Graph Masked Autoencoders (GMAEs) results in a more refined model of citation distribution, capturing the intrinsic connections between papers by using additional textual information. This approach distinguishes itself from [10] by uncovering characteristic right-skewed unimodal empirical distributions, indicating a closer alignment with actual citation behavior.
Author Contributions
A collaborative effort brought this project to life. Dr. Avros, Elena Ravve, and Prof. Volkovich teamed up to develop the model and craft the paper, while Mor Ben Haim and Almog Madar’s skillful design and execution of the experiments provided crucial validation.
Funding
This research received no external funding.
Conflicts of Interest
The authors declare no conflict of interest.
References
- Chandra G. Prabha. Some aspects of citation behavior: A pilot study in business administration. Journal of the American Society for Information Science 1983, 34(3), 202–206.
- D. B., Gutierrez-Ford, C.; Peddada, S. Perceptions of Ethical Problems with Scientific Journal Peer Review: An Exploratory Study. Science and Engineering Ethics 2008, 14(3), 305-310. [CrossRef]
- Wilhite, A.; Fong, E. Coercive citation in academic publishing. Science 2012, 335(6068), 542-543. [CrossRef]
- Wren, J.D.; Georgescu, C. Detecting anomalous referencing patterns. In PubMed papers suggestive of author-centric reference list manipulation. Scientometrics 2022, 127, 5753-5771.
- M. Dong: B. Zheng; N. Quoc Viet Hung; H. Su; G. Li. Multiple rumor source detection with graph convolutional networks. In Proceedings of the 28th ACM International Conference on Information and Knowledge Management, 569–578, Beijing, China, November 3 - 7, 2019.
- Y.-J. Lu ; C.-T. Li. Gcan. Graph-aware co-attention networks for explainable fake news detection on social media. In Proceedings of the 58th Annual Meeting of the Association for Computational Linguistics, 505–514, Virtual conference July 5 - 10, 2020.
- T. Bian; X. Xiao; T. Xu; P. Zhao; W. Huang; Y. Rong; J. Huang. Rumor detection on social media with bi-directional graph convolutional networks. In Proceedings of the AAAI Conference on Artificial Intelligence, 34(1), 549–556, New York, NY, USA, February 7–12, 2020.
- S. Yu; F. Xia; Y. Sun; T. Tang; X. Yan; I. Lee. Detecting outlier patterns with query-based artificially generated searching conditions. IEEE Transactions on Computational Social Systems 2020, 8(1), 134–147.
- J. Liu; F. Xia; X. Feng; J. Ren; H. Liu. Deep Graph Learning for Anomalous Citation Detection. IEEE Transactions on Neural Networks and Learning Systems 2022, 33(6), 2543-2557. [CrossRef]
- Avros, R.; Keshet, S.; Kitai, D.T.; Vexler, E.; Volkovich, Z. Detecting Pseudo-Manipulated Citations in Scientific Literature through Perturbations of the Citation Graph. Mathematics 2023, 11, 3820. [Google Scholar] [CrossRef]
- Grover, A.; Leskovec J. Node2vec: Scalable Feature Learning for Networks. In Proceedings of the 22nd ACM SIGKDD International Conference on Knowledge Discovery and Data Mining, KDD ’16, p. 855-864, Publisher: ACM. San Francisco California, 648 USA, 13 – 17 August 2016.
- V. Prakash Dwivedi and X. Bresson A Generalization of Transformer Networks to Graphs, CoRR, abs/2012.09699,2020, https://arxiv.org/abs/2012.09699.
- S. Zhang, H. Chen, H. Yang, X. Sun, Ph. S. Yu, G. Xu., Graph Masked Autoencoders with Transformers, arXiv: https://arxiv.org/abs/2202.08391.
- C. Ying, T. Cai, S. Luo, S. Zheng, G. Ke, D. He, Y. Shen, and T.-Y. Liu, titled "Do transformers really perform bad for graph representation?" , arXiv:2106.05234, 2021.
- W. Hamilton, Z. Ying, and J. Leskovec, “Inductive representation learning on large graphs,” Advances in neural information processing systems, vol. 30, 2017.
Figure 2.
Distributions of edge recovering for the CORA dataset for L2=5.
Disclaimer/Publisher’s Note: The statements, opinions and data contained in all publications are solely those of the individual author(s) and contributor(s) and not of MDPI and/or the editor(s). MDPI and/or the editor(s) disclaim responsibility for any injury to people or property resulting from any ideas, methods, instructions or products referred to in the content. |
© 2023 by the authors. Licensee MDPI, Basel, Switzerland. This article is an open access article distributed under the terms and conditions of the Creative Commons Attribution (CC BY) license (http://creativecommons.org/licenses/by/4.0/).
Copyright: This open access article is published under a Creative Commons CC BY 4.0 license, which permit the free download, distribution, and reuse, provided that the author and preprint are cited in any reuse.


