1. Introduction
The brain is a highly complex organ that regulates many body functions. To perform these roles, it relies on complex metabolic processes which are energy dependent [
1,
2]. Consequently, the brain is susceptible to toxic environmental chemicals that target mitochondria and impair energy metabolism. An example of such chemicals is hydrogen sulfide (H
2S), a potent gas produced endogenously and in the environment. Endogenously produced H
2S plays key roles in brain signaling, essential for normal brain physiologic functions. However, excessive amounts of H
2S in the brain, either from aberrant endogenous metabolic pathways (genetic defects) or environmental exposures, leads to neuronal dysfunction, including neurodegeneration [
3,
4,
5,
6,
7,
8,
9,
10]. Ethylmalonic encephalopathy (OMIM 602473), a life-limiting disease, is caused by a genetic defect in H
2S metabolism in mitochondria, resulting in chronic excessive H
2S exposure in the brain [
11].
Studies from our laboratory showed that acute exogenous H
2S exposure induces transcriptomic and proteomic changes in the brainstem, thalamus, and other brain regions [
3,
5,
6,
7,
8,
9,
12,
13]. A wealth of literature show that H
2S impairs mitochondrial function, specifically targeting cytochrome c oxidase (Complex IV) in the electron transport chain, thus inhibiting ATP production [
14,
15,
16,
17]. Chemical hypoxia and/or energy deficits are linked to loss of central respiratory drive, convulsions, and death following acute H
2S exposures [
18,
19]. In cases without a fatal outcome, it is likely that deficits in brain metabolism may cause immediate, intermediate, delayed, and long-term neurotoxicity following acute or chronic H
2S exposure. It is possible that some of these H
2S-induced toxicological changes may predispose exposed individuals to other neurological conditions, including neurodegenerative conditions via gene-environment interactions. To our knowledge, despite the well-known impact of H
2S on cellular metabolism, there are no metabolomics studies on the brainstem upon acute and chronic H
2S exposures. This is a knowledge gap curtailing our understanding of toxic mechanisms of H
2S -induced neurotoxicity.
We postulated that metabolic signatures of acute H
2S poisoning were different from those following subchronic exposure to low level ambient H
2S as clinical presentations are different [
3,
5,
6,
7,
8,
9,
12,
13,
20]. We therefore conducted this study to understand brain metabolomic changes induced by a single acute exposure to a high concentration of H
2S and that caused by subchronic exposure to ambient concentration of H
2S. To do this, we used our well-established inhalation whole-mouse model because human exposure to H
2S gas is typically
via inhalation. For this project, we focused on the brainstem because this region has been previously shown to undergo neurodegeneration following acute H
2S exposure and also because it controls vital autonomic functions such as breathing [
3]. Impaired breathing is widely implicated as a cause of death following acute H
2S poisoning [
18]. It was also previously reported that H
2S preferentially accumulates in the brainstem region [
21]. Therefore, understanding the metabolomic changes in the brainstem following H
2S exposure will advance our knowledge of the mechanisms underlying H
2S-induced neurotoxicity, neuropathology, and death.
4. Discussion
Hydrogen sulfide is widely reported to have a broad spectrum of physiological functions. It is also reported to be a highly toxic compound with steep dose-response relationships. The brain is a primary target organ. Acute high dose exposures are linked to acute death and to permanent neurobehavioral abnormalities and neurodegeneration [
25,
26,
27,
28] while the impacts of chronic low level H
2S exposure in humans remain ambiguous. Despite the significance of this compound in health and disease the lack of data on impact of H
2S on brain metabolism is striking. This is the first comprehensive metabolomic study of acute high dose H
2S exposure and subchronic low dose H
2S exposure on the brain. For the subchronic low dose study, we used 5 ppm H
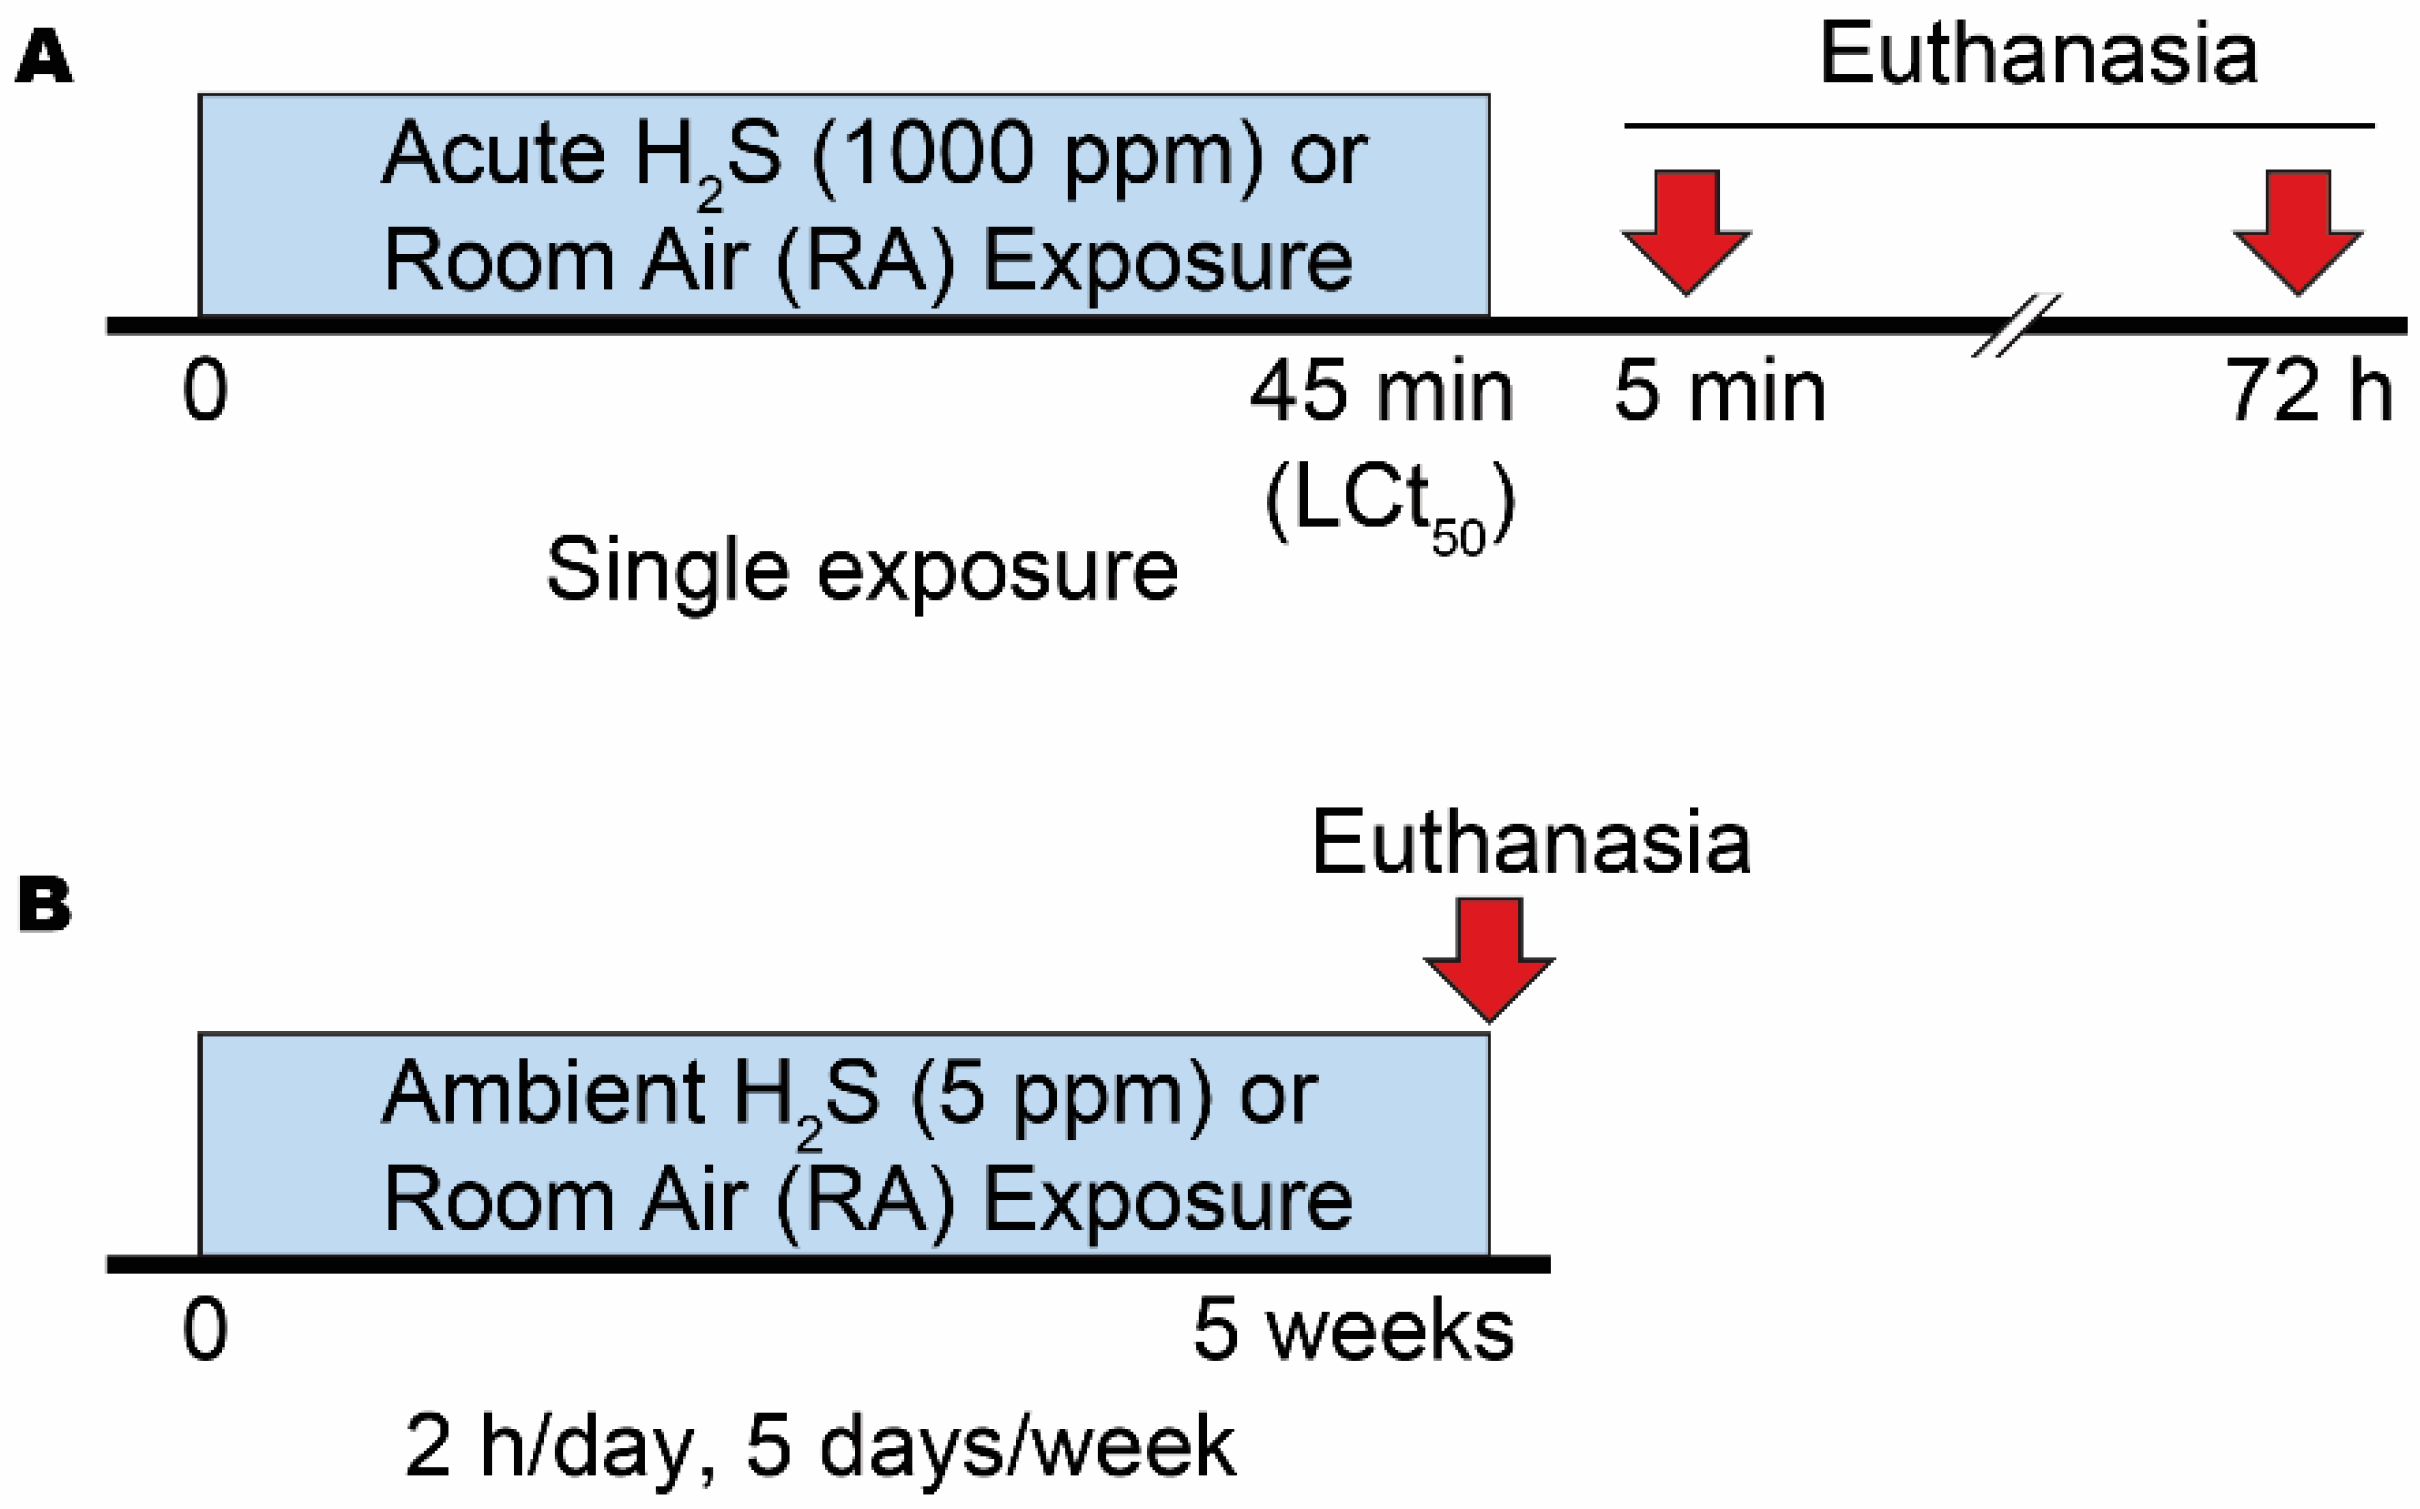
2S to expose mice only for 2 h per day Monday through Friday for 5 weeks. As a reference, the OSHA TWA exposure guidelines for an 8 h workday 5 days a week is 10 ppm. Results showed that both acute and subchronic ambient H
2S significantly altered many classes of metabolites including organic oxygen compounds, organic acids, phenylpropanoids, polyketides, organoheterocyclic compounds, benzenoids, nucleosides, nucleotides, organic nitrogen compounds, lipids, and lipid-like molecules in the brain. Importantly, metabolic changes induced by H
2S exposure were different depending on whether it was a high dose exposure or subchronic low dose exposure. Some metabolites, however, were increased both by acute and by subchronic exposures suggesting such compounds are sensitive indicators of H
2S exposure.
3-Methylhistidine, a derivative of histidine and methionine amino acids, and phosphatidylethanol 18:1_18:1 (PEtOH 18:1_18:1) a glycerophosphoethanol were both significantly increased following both a single H2S exposure and by subchronic ambient H2S exposure. The functions of these two metabolites in brainstem are not clear at the moment.Vanillin was decreased while vanillin-4-sulfate was increased by acute H2S exposure. Vanillin has been linked to colorectal cancer. Roles of vanillin and vanillin-4-sulfate and roles of H2S exposure in altering vanillin and vanillin-4-sulfate remain to be determined. However, these metabolites may serve as potential biomarkers of H2S-poisoning.
Several metabolites were altered at 5 min and 72 h following a single acute H
2S exposure. N8-acetyl spermindine was increased by 0.8 fold following acute H
2S exposure. It is a polyamine derived from spermidine by deacetylation and reported to play a role in regulating cell signaling and gene expression among other functions [
29]. It was previously reported that increase of N8-acetyl spermidine is caused by by inhibiting N8-acetylspermidine deacetylase. This compound is linked to the differentiation of neurons and to elevated dopamine [
29]. Interestingly, acute H
2S exposure increased dopamine concentration in the brainstem [
3]. N8-acetyl spermidine is also considered as a biomarker for ischemic cardiomyopathy [
30]
. Interestingly, H
2S
is a cytochrome c oxidase inhibitor and causes chemical ischemia [31]. The exact role of N8-acetyl spermidine remains to be studied, but it may signal brain ischemia.
Flavin adenine, a derivative of riboflavin or vitamin B2, is also known as flavin adenine dinucleotide (FAD), and it plays a crtical role as a cofactor of many enzymes. FAD was increased more than 1 fold at 5 min and 0.5 fold after 72 h following a single acute exposure and is therefore a potential biomarker of acute H2S exposure in the brainstem. Since FAD plays a significant role as a cofactor in brain energy metabolism, it is possible that sudden increase of FAD in the brainstem may indicate an imbalance in the redox cellular state (favoring FAD over FADH). FADH is non detectable by any of the mass spectrometers used in this study.
Adenosine and behenic acid were decreased 1 fold and 2 fold at 5 min and 72 h post acute H
2S exposure, respectively. Adenosine is a nucleoside which plays many important roles in energy transfer, signal transduction, as a neurotransmitter, and as a potent vasodilator [
32]. H
2S is well known to reduce ATP generation by inhibiting cytochrome c oxidase in the electron transport chain. Adenosine 5’-monophosphate was significantly decreased by about 1.5 fold following subchronic ambient H
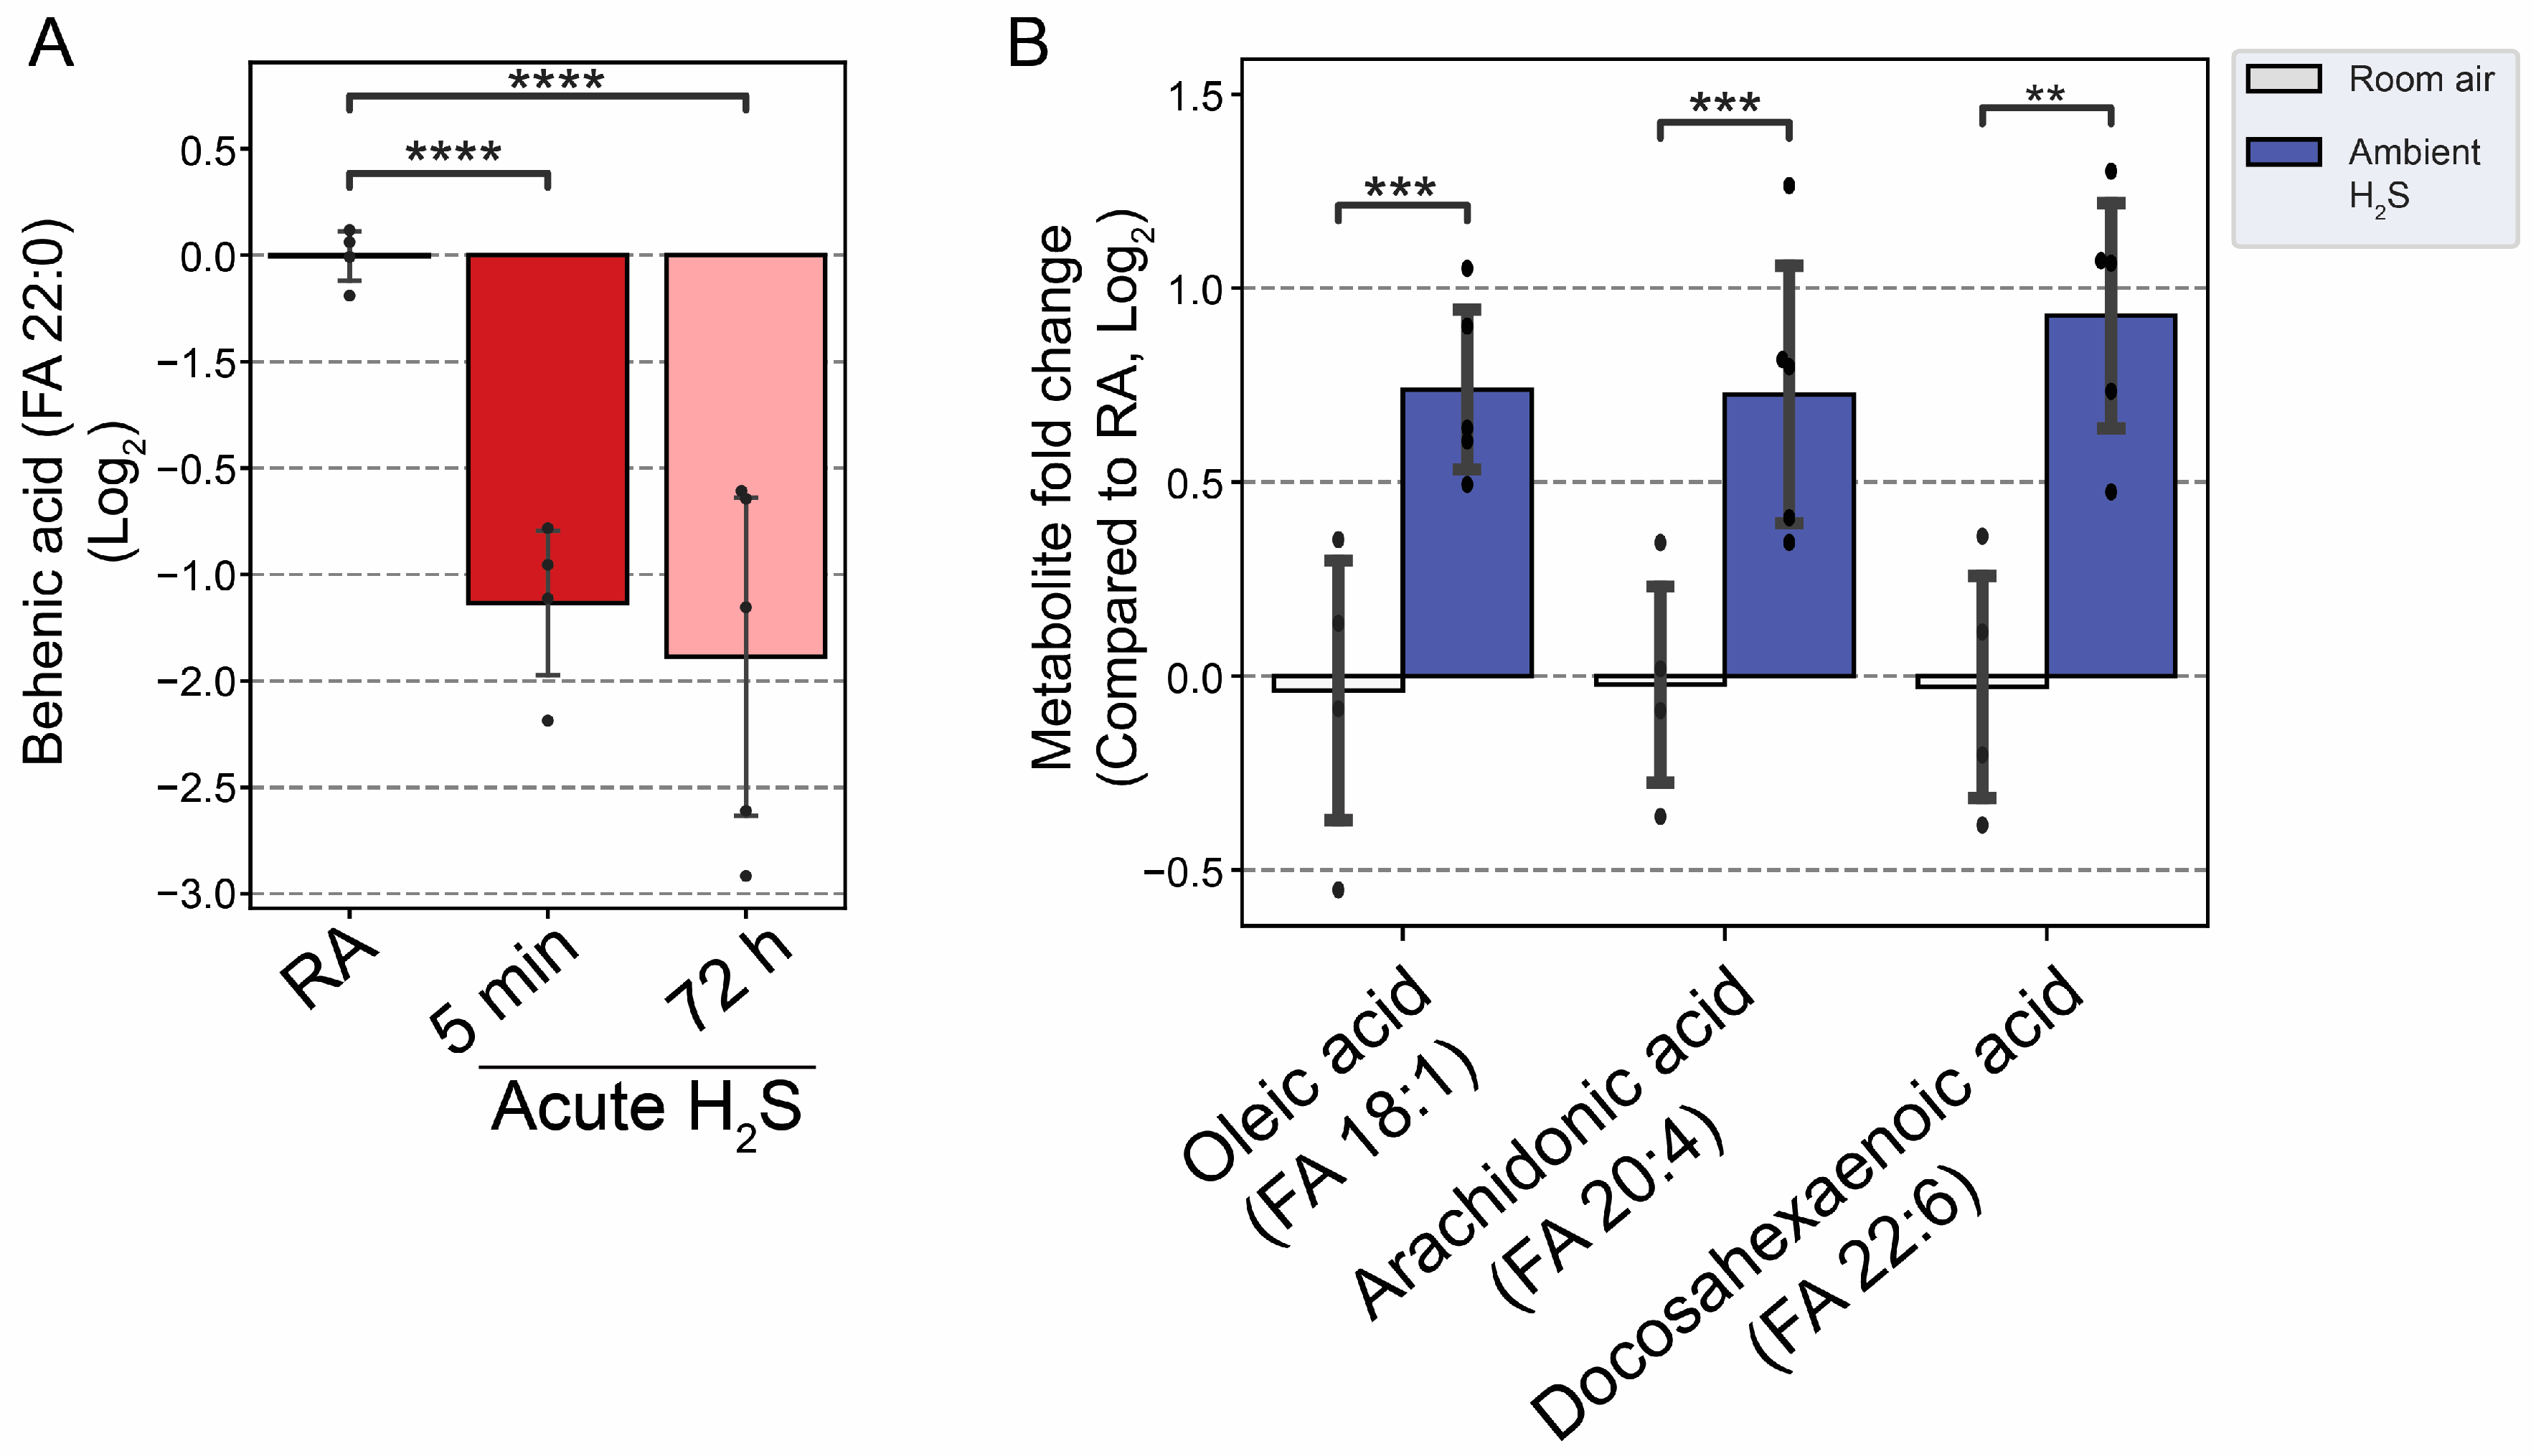
2S exposure. A decrease of adenosine concentration may limit several biological functions in which it is involved. Behenic acid, in contrast, is a very long-chain saturated fatty acid (VLCFA) and was decreased by more than 1.5 fold at 5 min and 72 h post acute H
2S exposure; but not by subchronic H
2S exposure. The reduction in behenic acid concentration may negatively impact energy production and homeostasis among other effects. These results suggest that both acute and subchronic H
2S exposure alter brainstem metabolism, but in different ways. More research is needed to undertand the implications of these results on brain function.
The brainstem has been reported to be particularly vulnerable to acute H
2S poisoning. Following exogenous exposure, H
2S was reportedly found in highest concentrations in this brain region [
21]. This brain region is also recognized as the center of regulation for key autonomic functions [
33,
34]. We have also previously shown that the brainstem is susceptible to H
2S -induced neurodegeneration [
3]. In addition, we showed that the inhibition of central respiratory drive (from the brainstem) is a key cause of death in our mouse model {Santana Maldonado, 2023 #17406}. Clinical effects of acute H
2S poisoning characterized by seizures, and apnea among others were not seen in mice exposed to 5 ppm H
2S for 1 month, indicating mechanisms involved were different. In this study, the only clinical effects noted following subchronic H
2S exposure in mice was a loss in body weight.
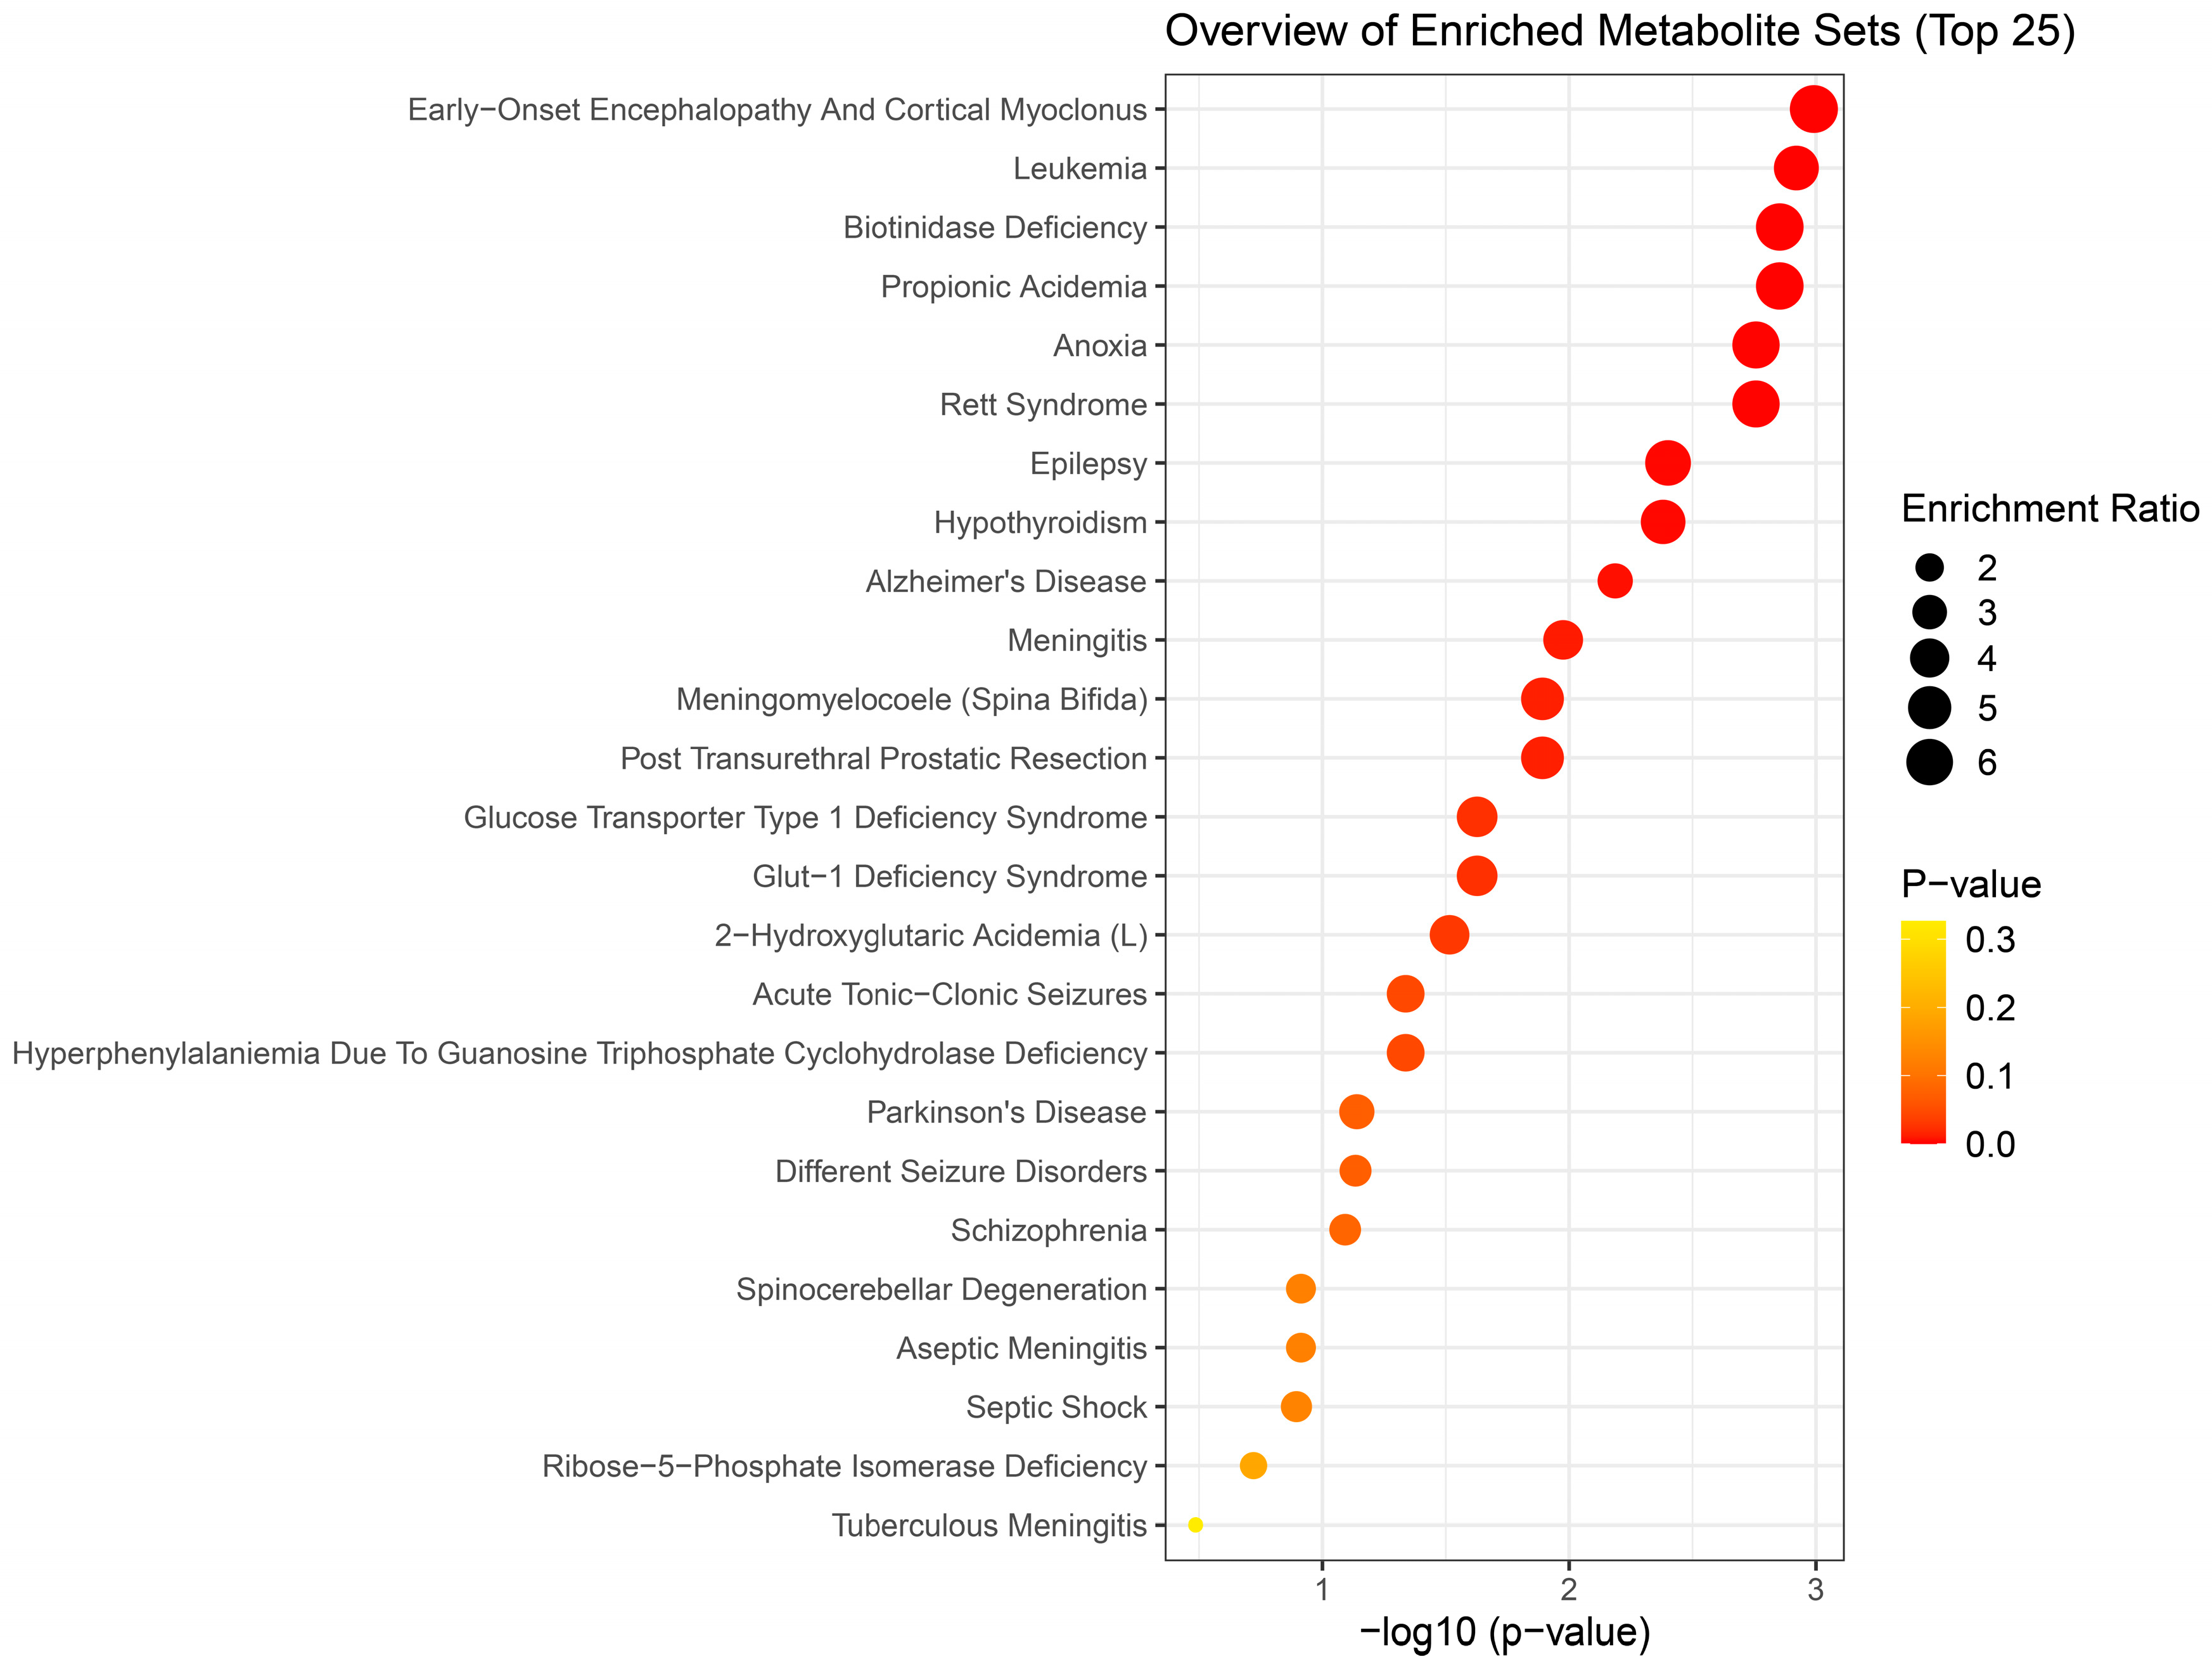
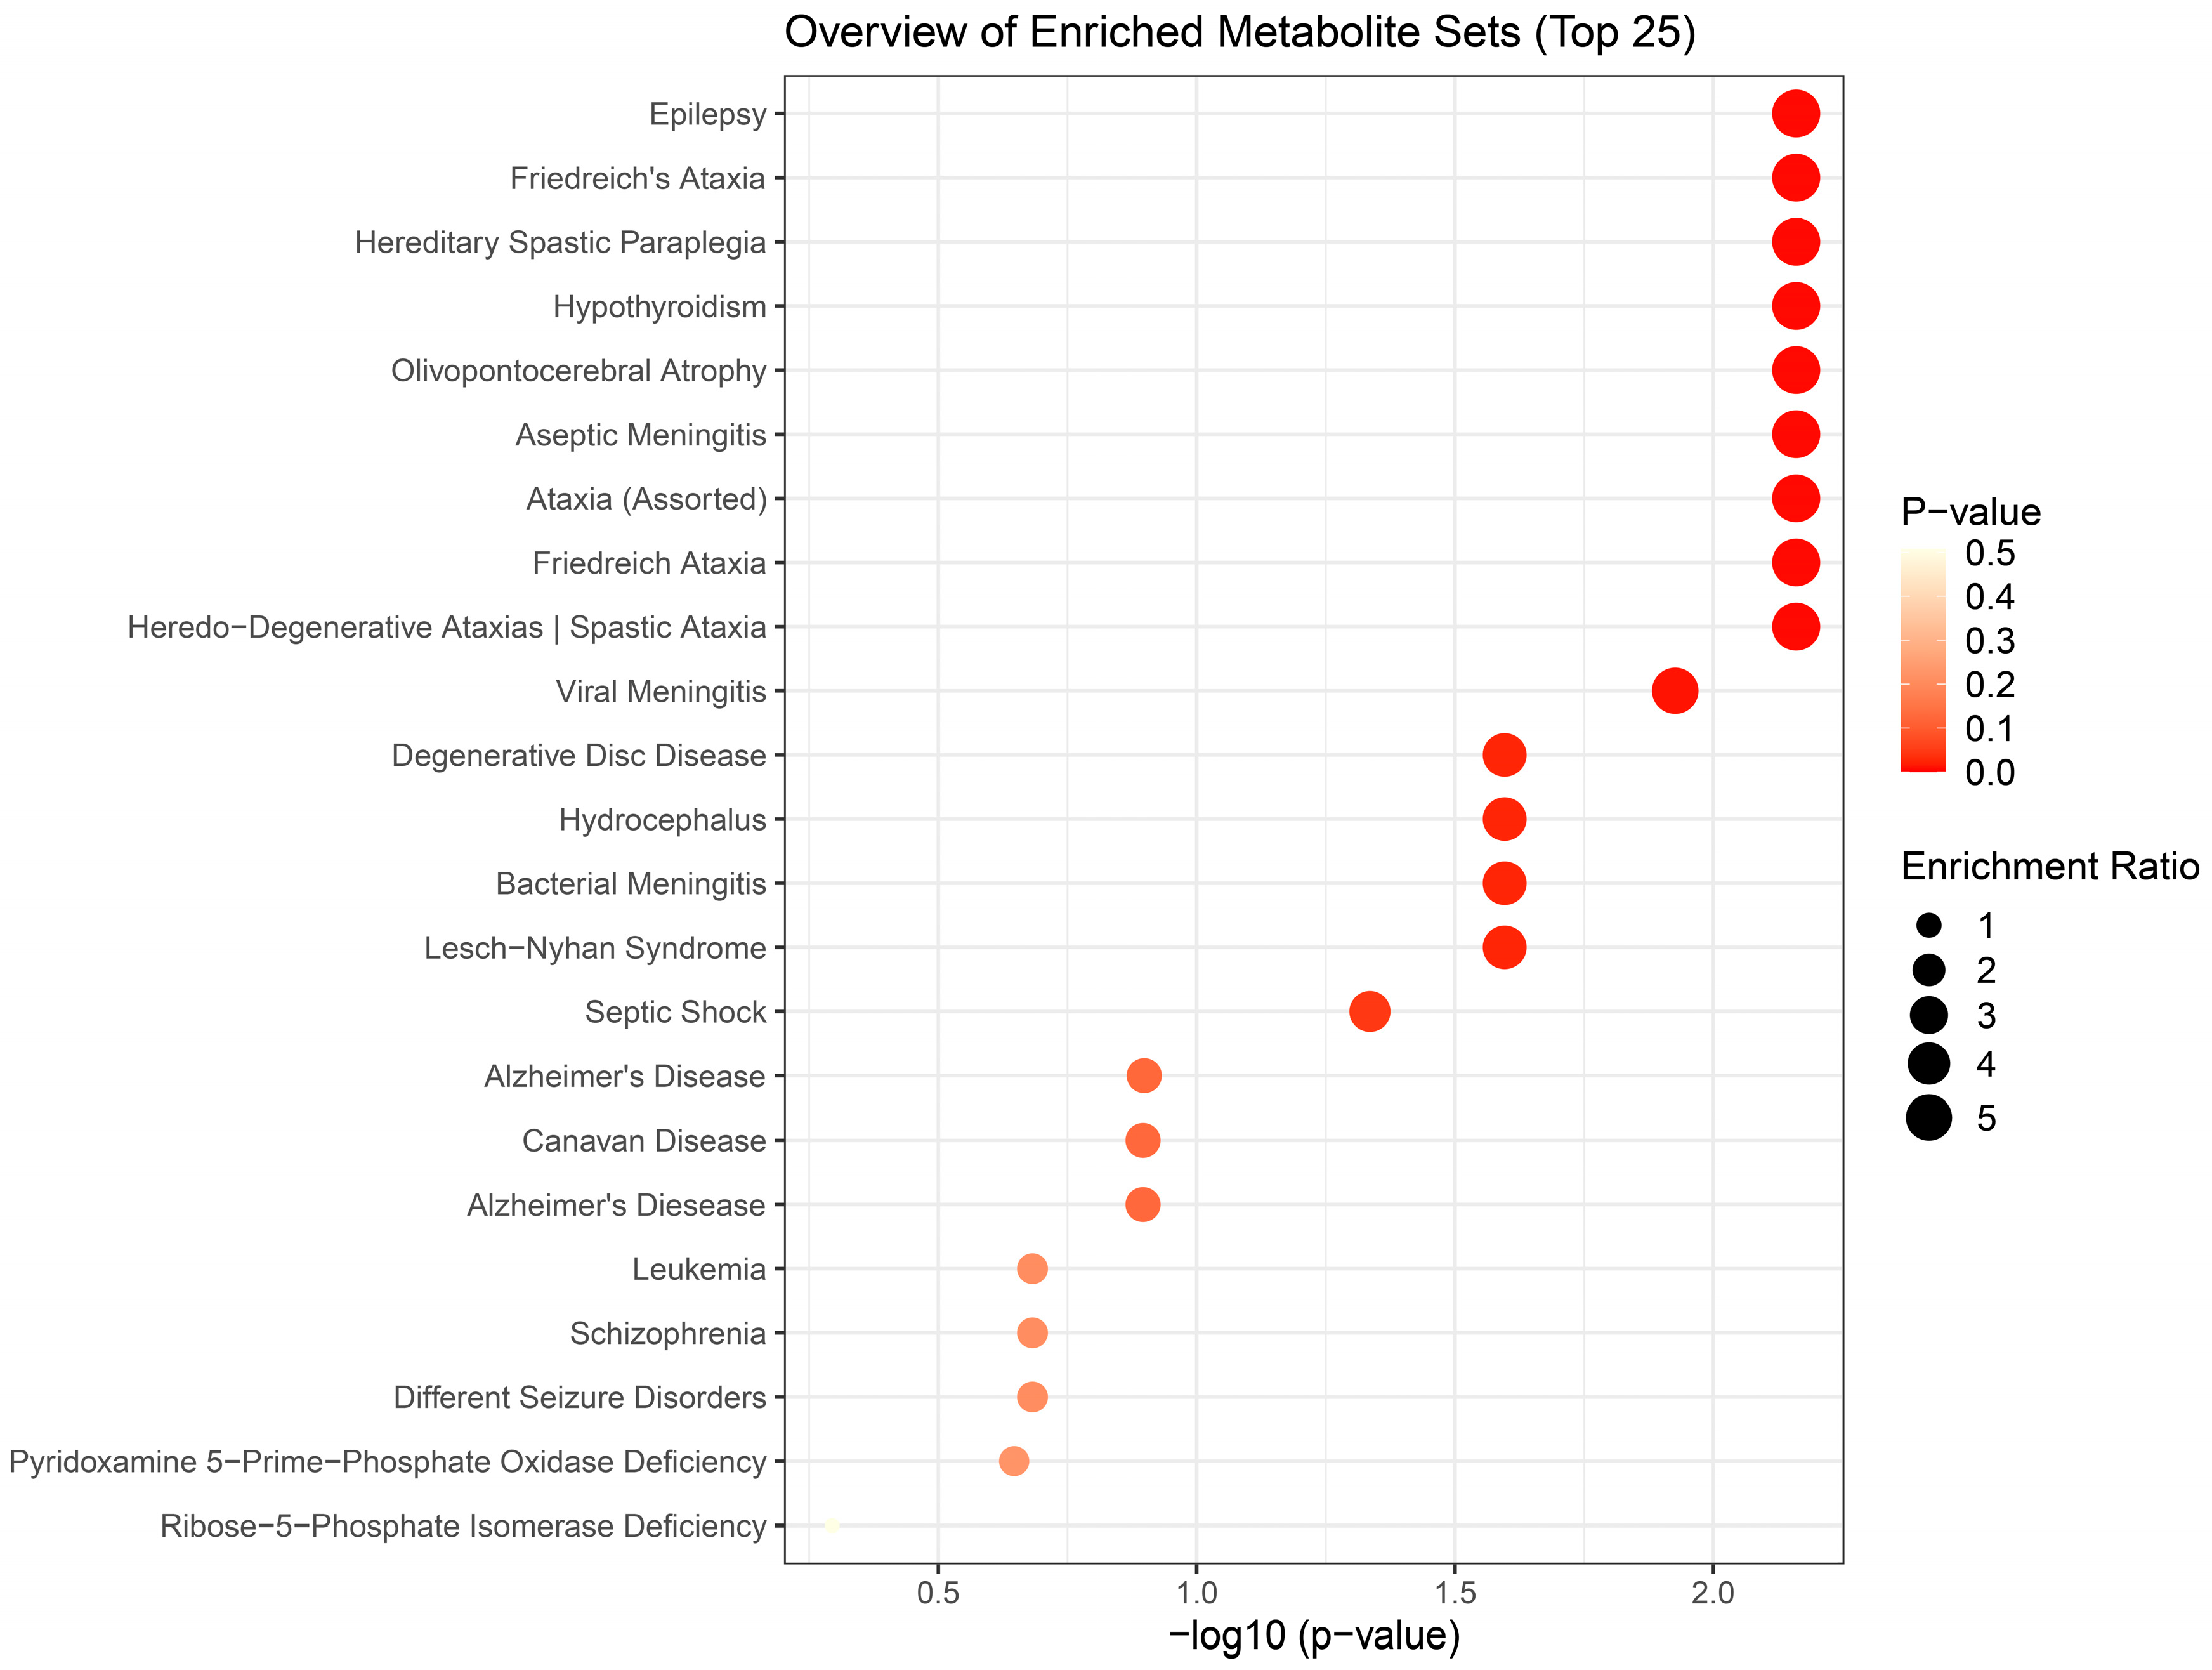
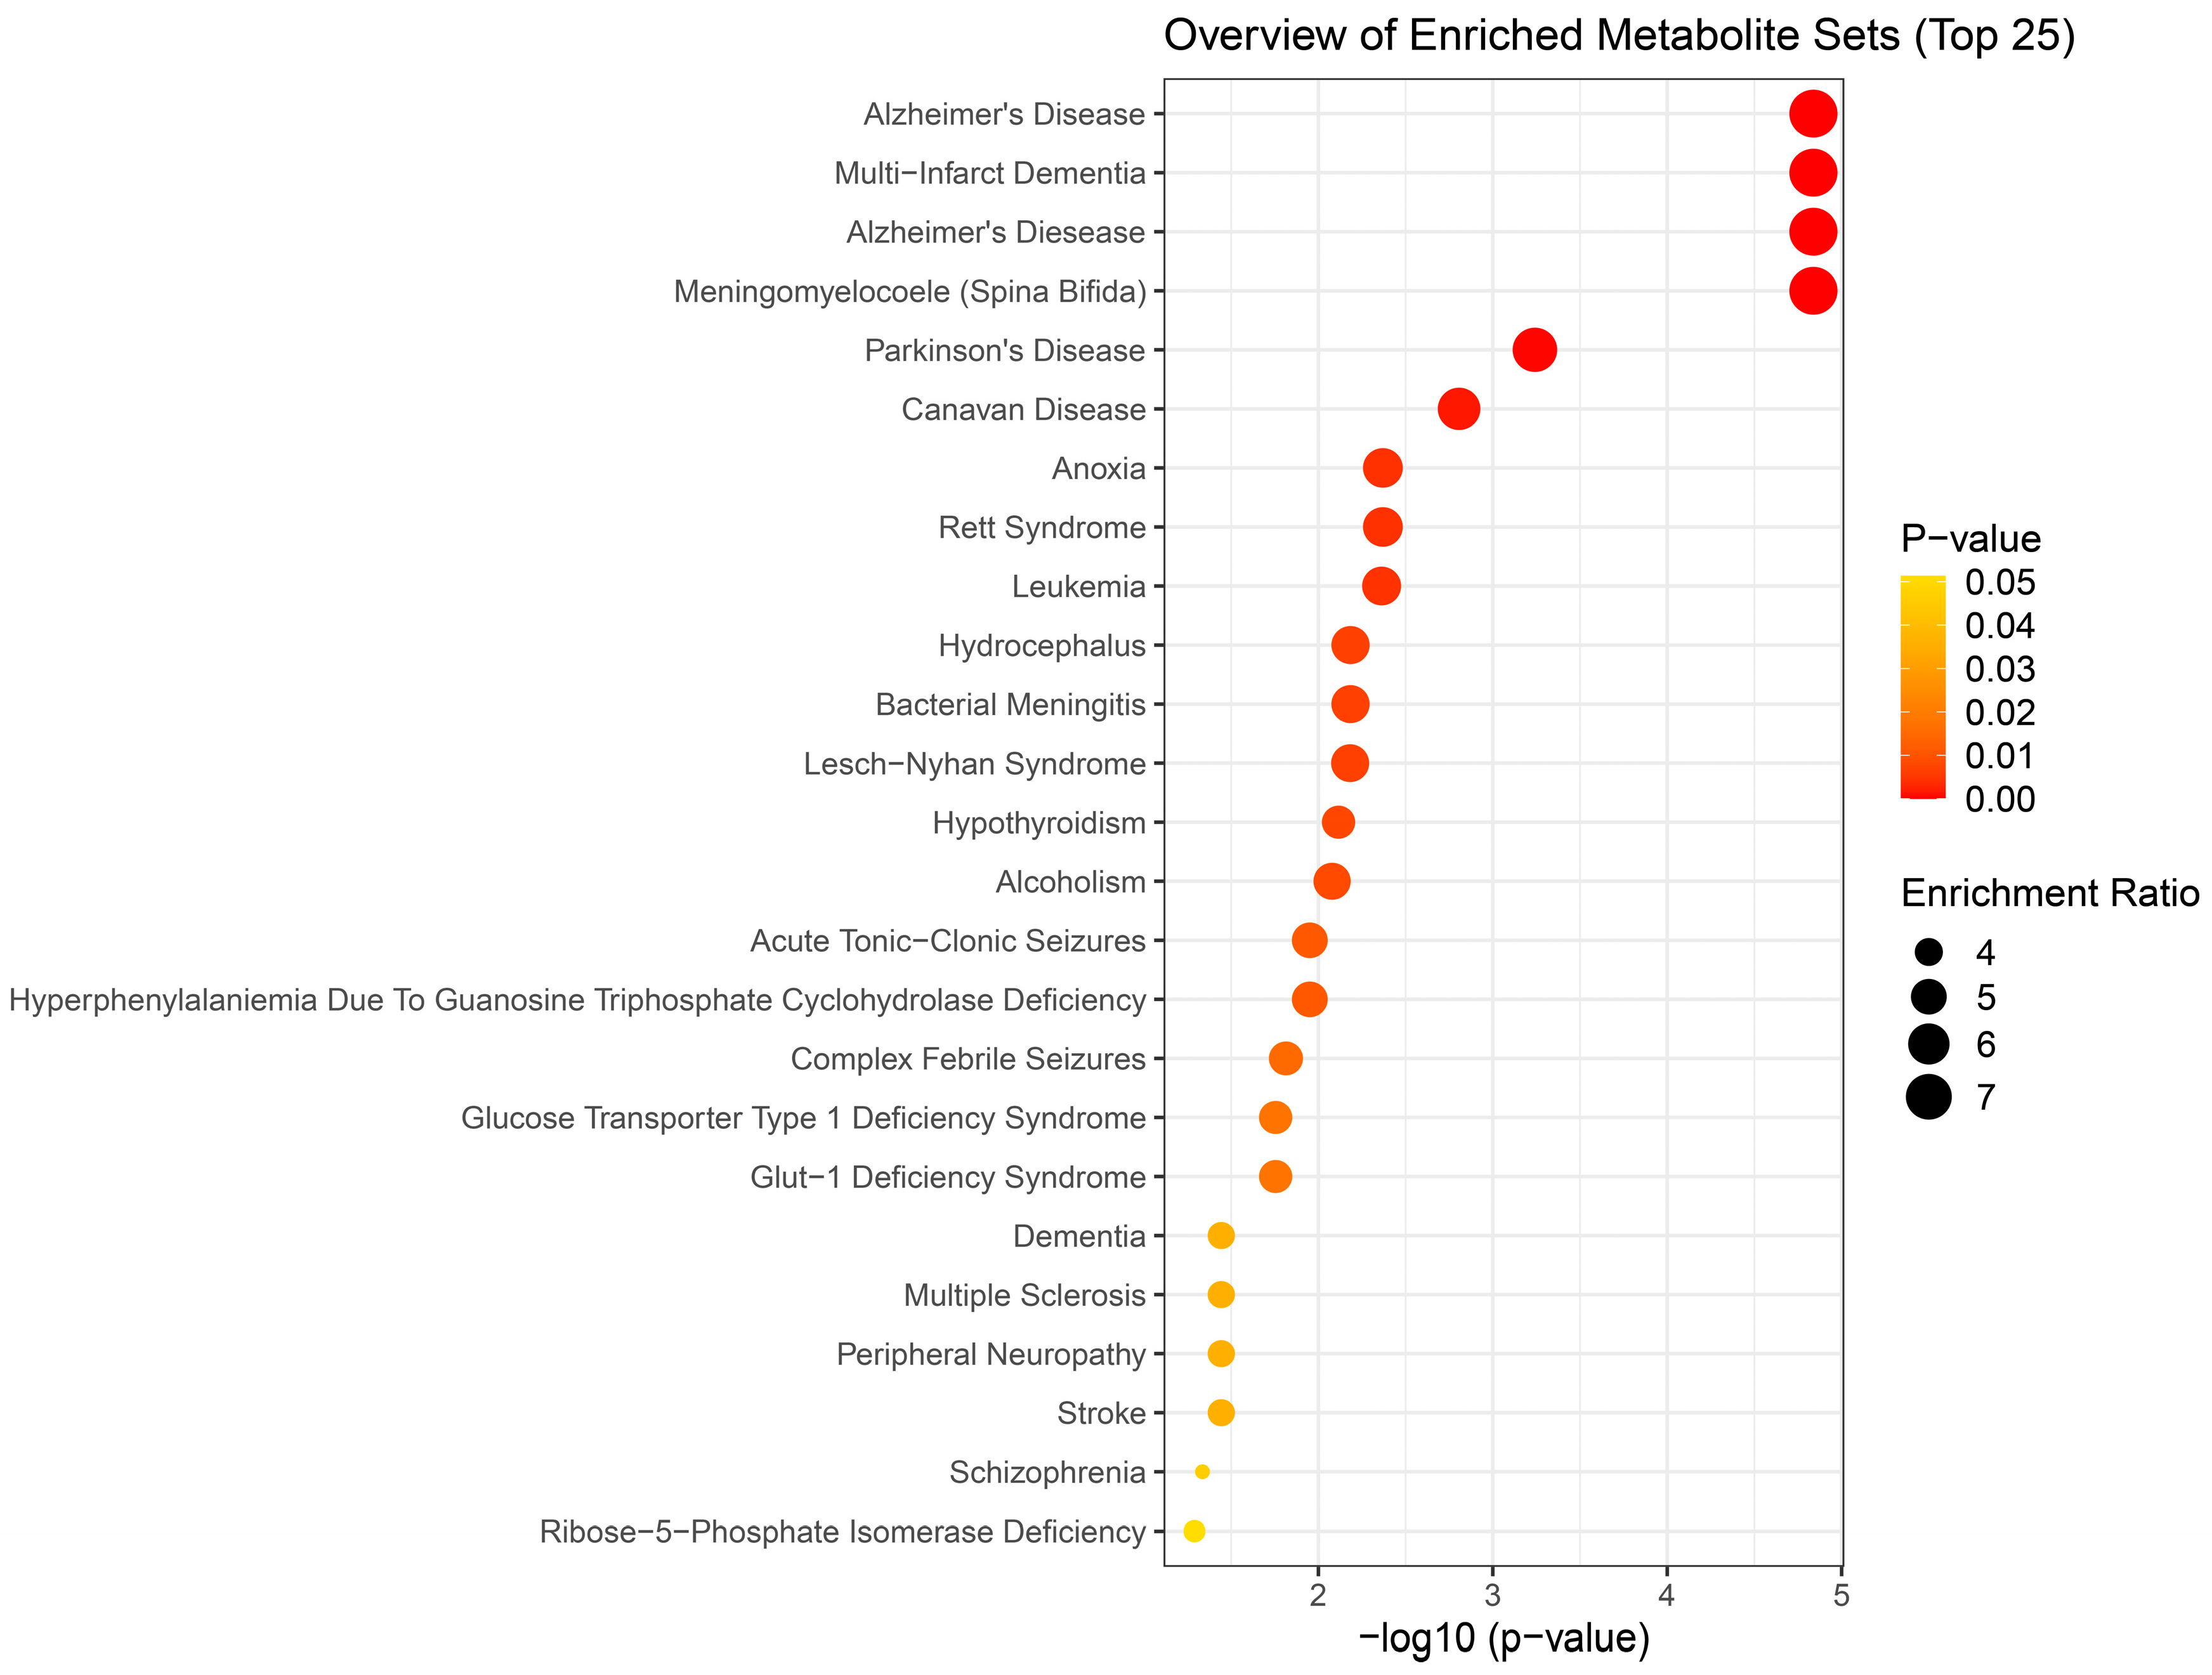
Results of metabolite enrichment analysis summarized in
Figure 5,
Figure 6 and
Figure 7 are very interesting. When the metabolomic profiles of acute and subchronic H
2S exposure in mice are compared to existing databases of metabolomics of the cerebrospinal fluid from patients suffering from different neurological conditions, a pattern of similarities and differences emerges. At 5 min post exposure, the metabolomics enrichment pattern of acute H
2S poisoning matches with many human neurological disorders including early-onset encephalopathy and cortical myoclonus, leukemia, propionic acidemia, anoxia, Rett syndrome, epilepsy, Alzheimer’s disease (AD), Parkinson’s disease (PD), Glut-1 deficiency syndrome, different seizure disorders, and schizophrenia among others. In this mouse model we have reported convulsions, and neurodegeneration [
3,
7,
8,
9,
12,
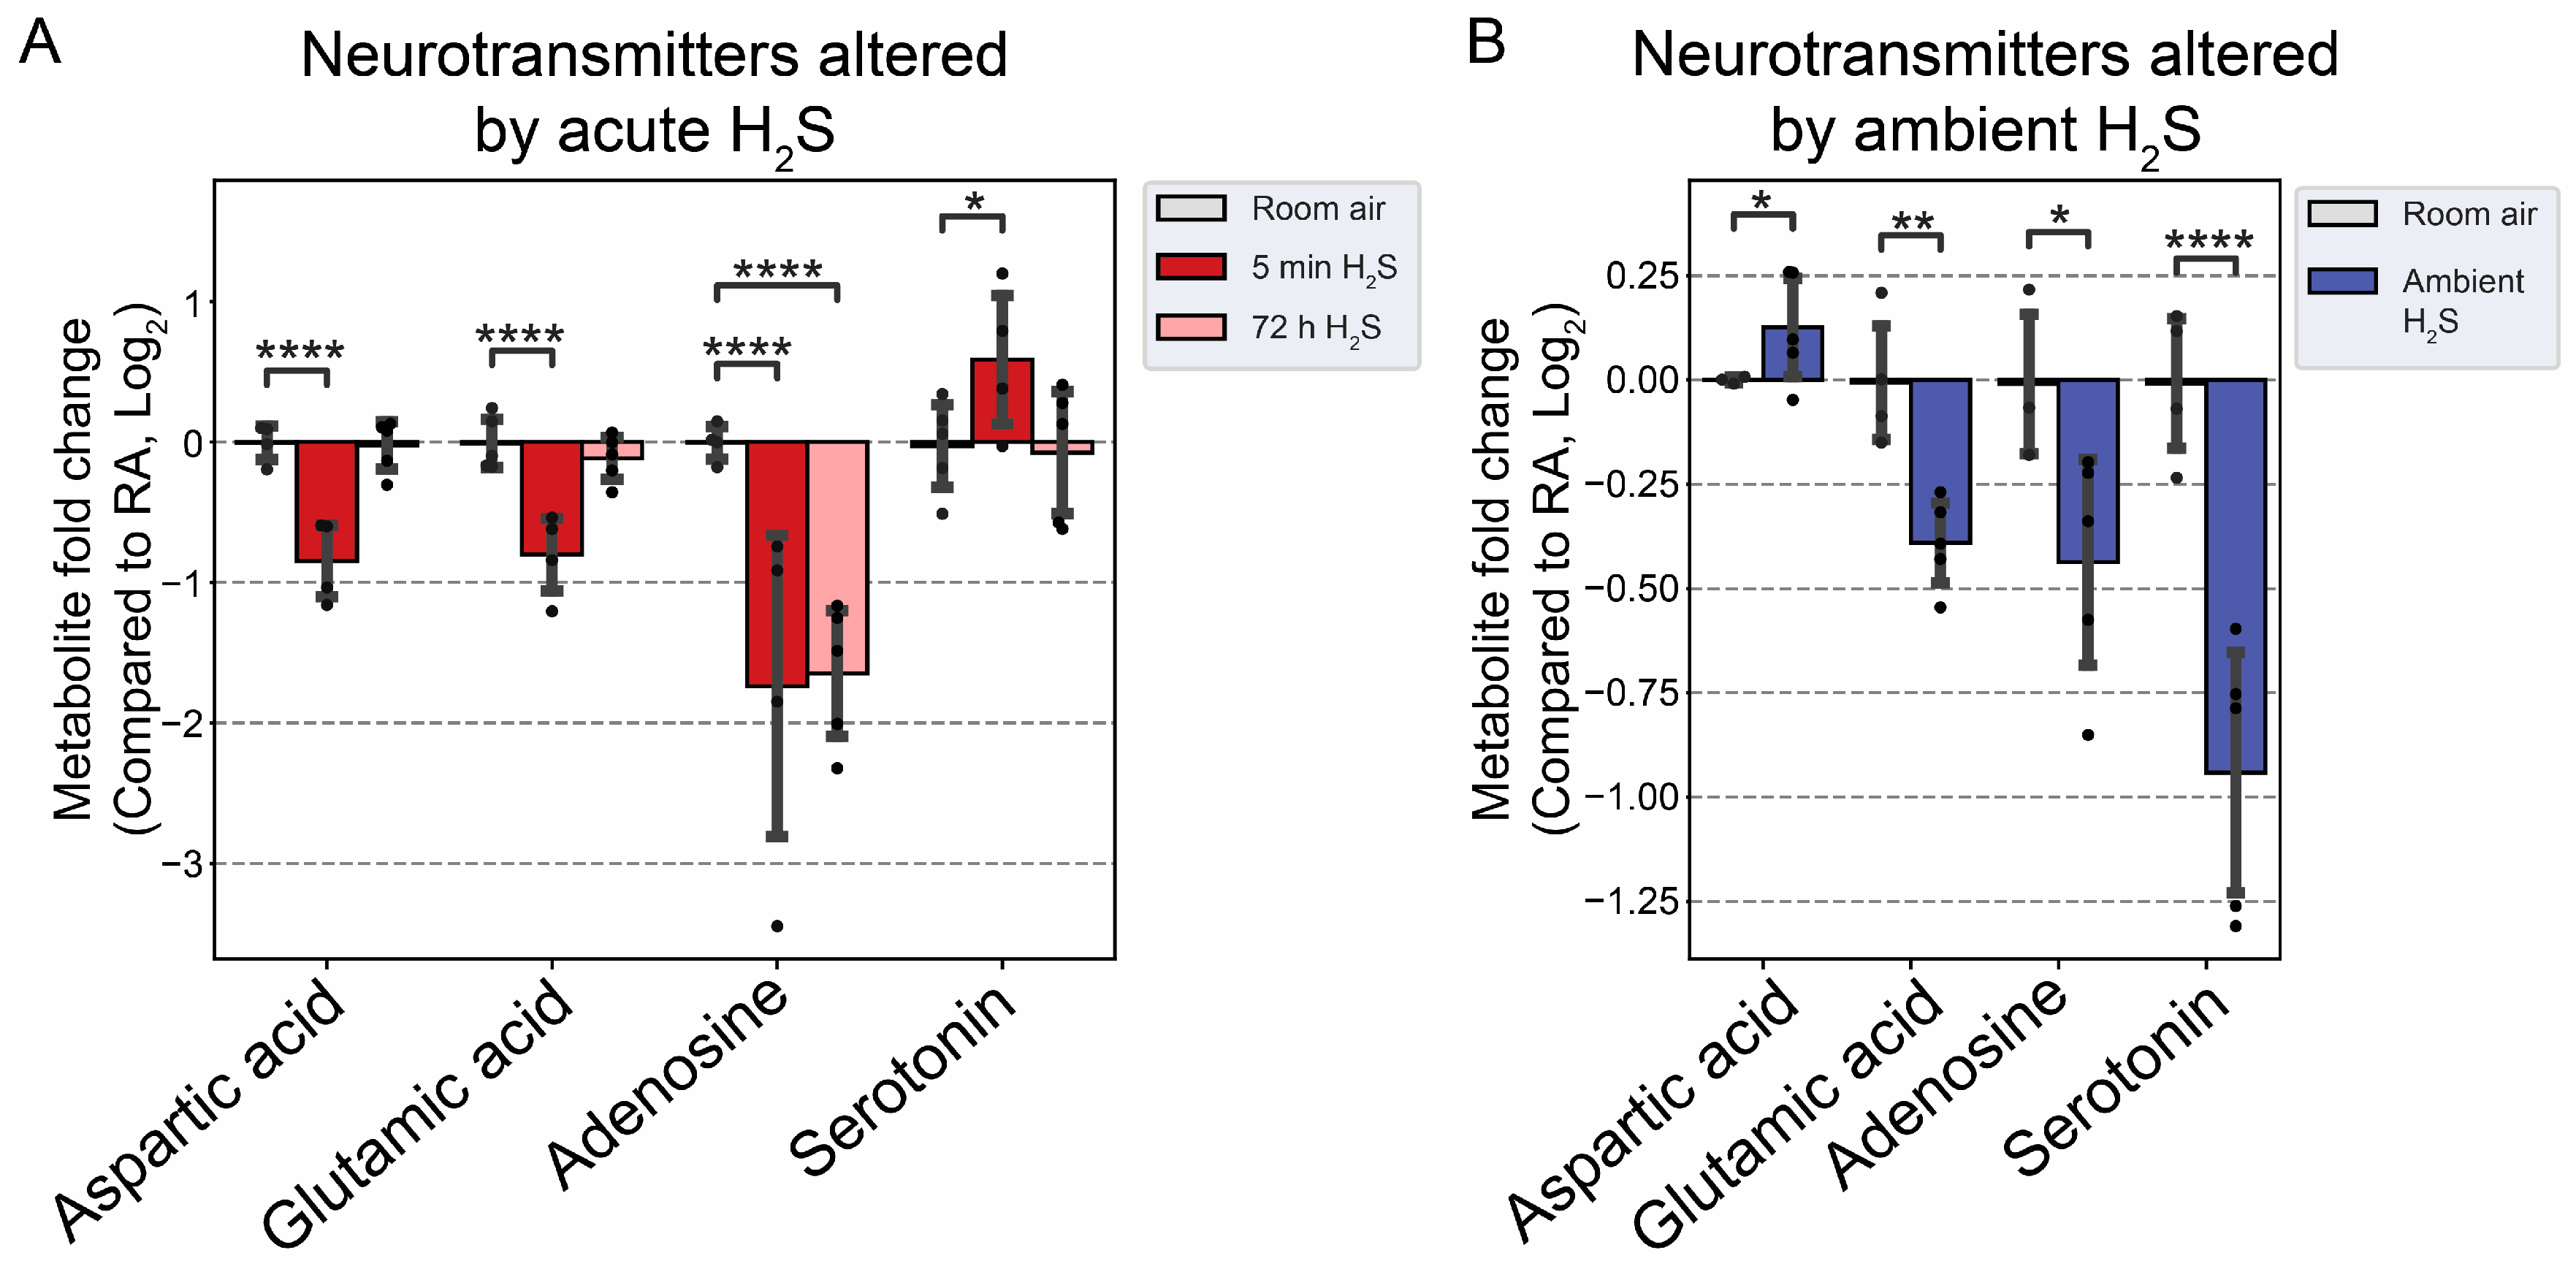
13]. AD and PD are neurodegenerative diseases while epilepsy matched with convultions in our mouse model. We have also reported a significant increase in dopamine and serotonin concentrations in this model {Santana Maldonado, 2023 #17406}{Anantharam, 2017 #17414;Anantharam, 2017 #17413}. Dopamine is a modulatory neurotransmitter which is both excitatory or inhibitory depending on which receptors in binds to. Serotonin is predominantly inhibitory and has been linked to schizophrenia. The summary of neurotransmitter changes in
Figure 8 suggests that acute and subchronic H
2S exposure tilts towards inhibitory and excitatory effects, respectively.
H
2S exposure is widely reported to cause hypoxic neuronal injury which is consistent with its mechanism of action of inhibiting cytochrome C oxidase activity [
31]. Reduced cytochrome
c oxidase activity is also reported in Alzheimer’s disease [
35] and chronic neurodegenerative diseases are characterized by brain energy deficits [
1,
2]. The metabolomic profiles at 5 mins post acute H
2S exposure matched a metabolic profile of neurological disorders observed at 72 h min postacute exposure, including epilepsy, aseptic menigitis, Alzheimer’s disease, shizophrenia, and different seizure disorders.
We were surprised to see that subchronic H
2S exposure to 5 ppm, which is within the OSHA guidelines of 10 ppm for an 8 h work day, caused metabolic derangement in the brainstem. This is a significant finding which needs confirmation because of the health implications in the workplace. Strikingly, the metabolome of subchronic ambient H
2S also matched with many human neurological disorders including Alzheimer’s disease, Parknson’s disease, and Schizophrenia, which was similar to what we observed after a single acute H
2S exposure with some exceptions. Notably, the metabolome of subchronic ambient H
2S exposure additionally matched that of CSF from patients with dementia, canavan disease, alcoholism, and multiple sclerosis. Common themes to both acute and subchronic low dose H
2S exposure revolve around metabolomic similarities between the metabolome of H
2S exposure and that of seizure disorders, neurodegenerative conditions especially Alzheimer’s disease, Parkinson’s disease, neuroinflammation, ataxia, and hypoxic-induced injury. This possibly signals that environmental H
2S exposure, shifts brain metabolism which may predispose or increase susceptibility to these debilitating disease conditions. Indeed, this mouse model with acute H
2S exposure exhibited seizure and loss of consiousness {Santana Maldonado, 2023 #17406;Kim, 2018 #17411;Anantharam, 2017 #17414;Anantharam, 2017 #17413;Kim, 2023 #17405;Anantharam, 2018 #17412;Kim, 2020 #17410}. These results signal that H
2S-induced metabolomic changes play important roles in H
2S-induced physiological symptoms including seizure and loss of consiousness. Notably, it is interesting that patients predisposed to seizures or neurofibromatosis are very sensitive to acute H
2S poisoning [
36]. Also, H
2S aggravated seizure-like events in rat seizure model [
37]. Regarding the discovery of similarities in the metabolomes of acute and subchronic H
2S exposure to the of CSF of patients with Alzheimer’s disease, there is meagre literature on this topic. It is well known that the interaction of gene and environment plays important roles in many neurological disorders including Alzheimers disease and Parkinson’s disease. Considering that H
2S is an environmental pollutant and of occupational concern and that H
2S exposure may be closely linked to many nuerological disorders with big burden in the society, more work should be focused in this area to investigate the potential role of ambient H
2S exposure in AD and/or other neurological conditions in
Figure 5,
Figure 6 and
Figure 7.
The effects of acute H
2S and subchronic ambient H
2S exposures on neurotransmitters were investigated. Acute H
2S exposure decreased aspartic acid, glutamic acid and adenosine while serotonin was increased. Serotonin was significantly decreased by subchronic ambient H
2S exposure. Aspartic acid and glutamic acid are exatatory neurotransmitters while serotonin is inhibitory [
38,
39]. Adenosine acts both as excitatory and inhibitory neurotransmitter. We previously reported that dopamine and serotonin were significantly increased in brainstem at 5 min post acute H
2S [
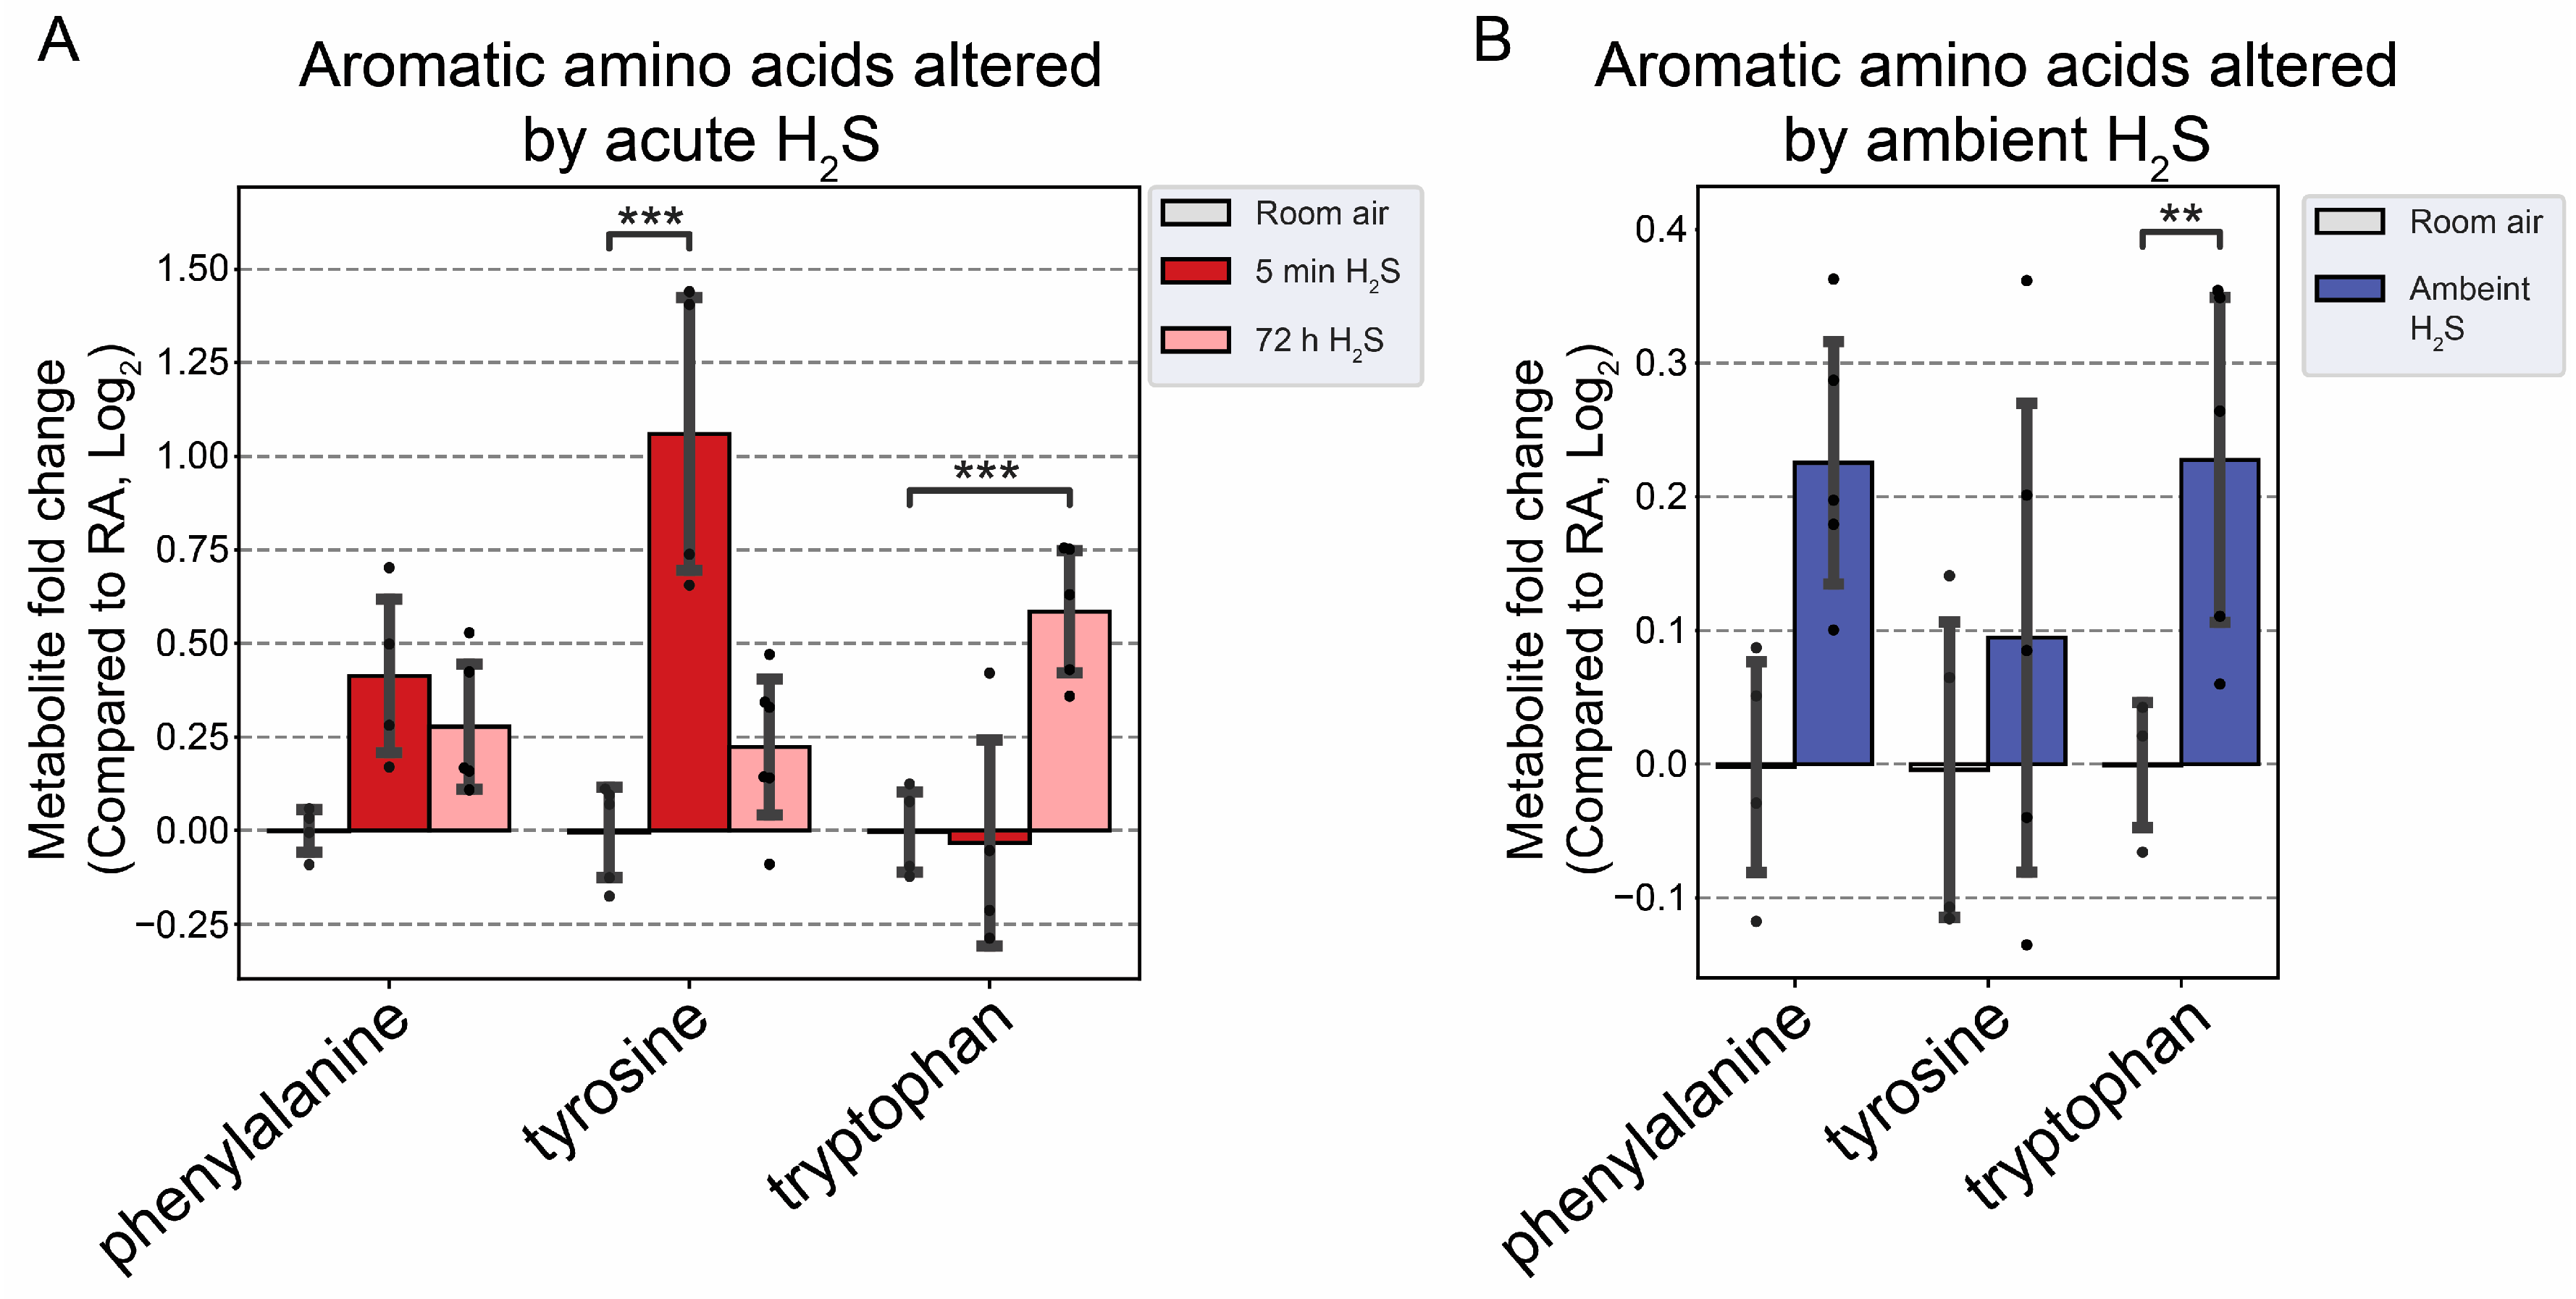
3], which is consistent with findings in this study. Tryptophan is a precurosor to serotonin while phenylalanine and tyrosine are precursor to dopamine. In this study tyrosine was significanlty increased at 5 min post acute exposure in brainstem while tryptophan was increased by subchronic ambient H
2S exposure. Other neurotransmitters including acetylcholine, histidine, serine, noradrenaline, γ-aminobutyric acid (GABA), glycine, and histamine were not significantly altered in this study (data not shown).
Glutamate and aspartate are main excitatory neurotransmitters in brain and are released in a Ca
2+-dependent manner upon electrical stimulation. Serotonin is an inhibitory neurotransmitter and has impact on a wide range from behavioral effects such appetie, aggression, memory, fear, depression. It is also involved in other CNS effects such as respiration, body temperature, motor control, and bowel movement [
40]. It is well known that acute exposure to high concentrations of H
2S induces loss of consicousness in humans. However, the exact mechanisms behind H
2S-induced loss of consiousness are not known. A decrease of glutamate and aspartate coupled with an increase of serotonin following acute H
2S exposure may play important roles in H
2S-induced loss of consciousness. Interestingly, we recently reportated that sodium sulfide, a H
2S donor, suppressed neuronal activity
in vitro by suppressing Ca
2+ oscillation in primay cortical neurons [
6]. Electrical stimulus releases glutamate from synaptic vesicles to synaptic cleft. The released glutmate is taken up to glial cells by glutamate-aspartate transporter and converted to glutamine which was transported back to the neuron. Glutaminase in mitochondria convertes glutamine to glutamate and aspartate. Acute H
2S induced increased glutamine at 5 min post acute acute exposure indicating that glutamate-glutamine cycling may be dysregulated. Decrease of aspartate may influence in conversion of glutamine to glutamate leading to decrease of glutamate upon acute H
2S exposure. Serotonin was also reported to inhibit glutamate release and the action of released glutamate [
39]. Besides, an acute surge of serotonin induces focal seizures [
41].
Interestingly, subchronic ambient H
2S exposure significantly decreased serotonin concentration. Current OSHA guideline sets recommended airborne exposure limit (REL) to 10 ppm for hydrogen sulfide in the workplaces [
23]. To the best of our knowledge, it has not been previously reported that subchronic ambient H
2S exposure dysregulates serotonin. Therefore, this finding is novel. There are many serotonin receptors. It should be interesting to investigate the health impact of decreased serotonin in subchronic ambient H
2S exposure.
Glutamate not only acts as a neurotransmitter but also as a anaplerotic component in tricarboxylic acid (TCA) cycle in enegery balance. Glutamate is converted to α-ketoglutarate. In addition to the altered glutamate and glutamine, fumarate and malate were increased by 0.5 fold compared to the RA control mice at 5 min post acute H
2S , which may indicate that acute H
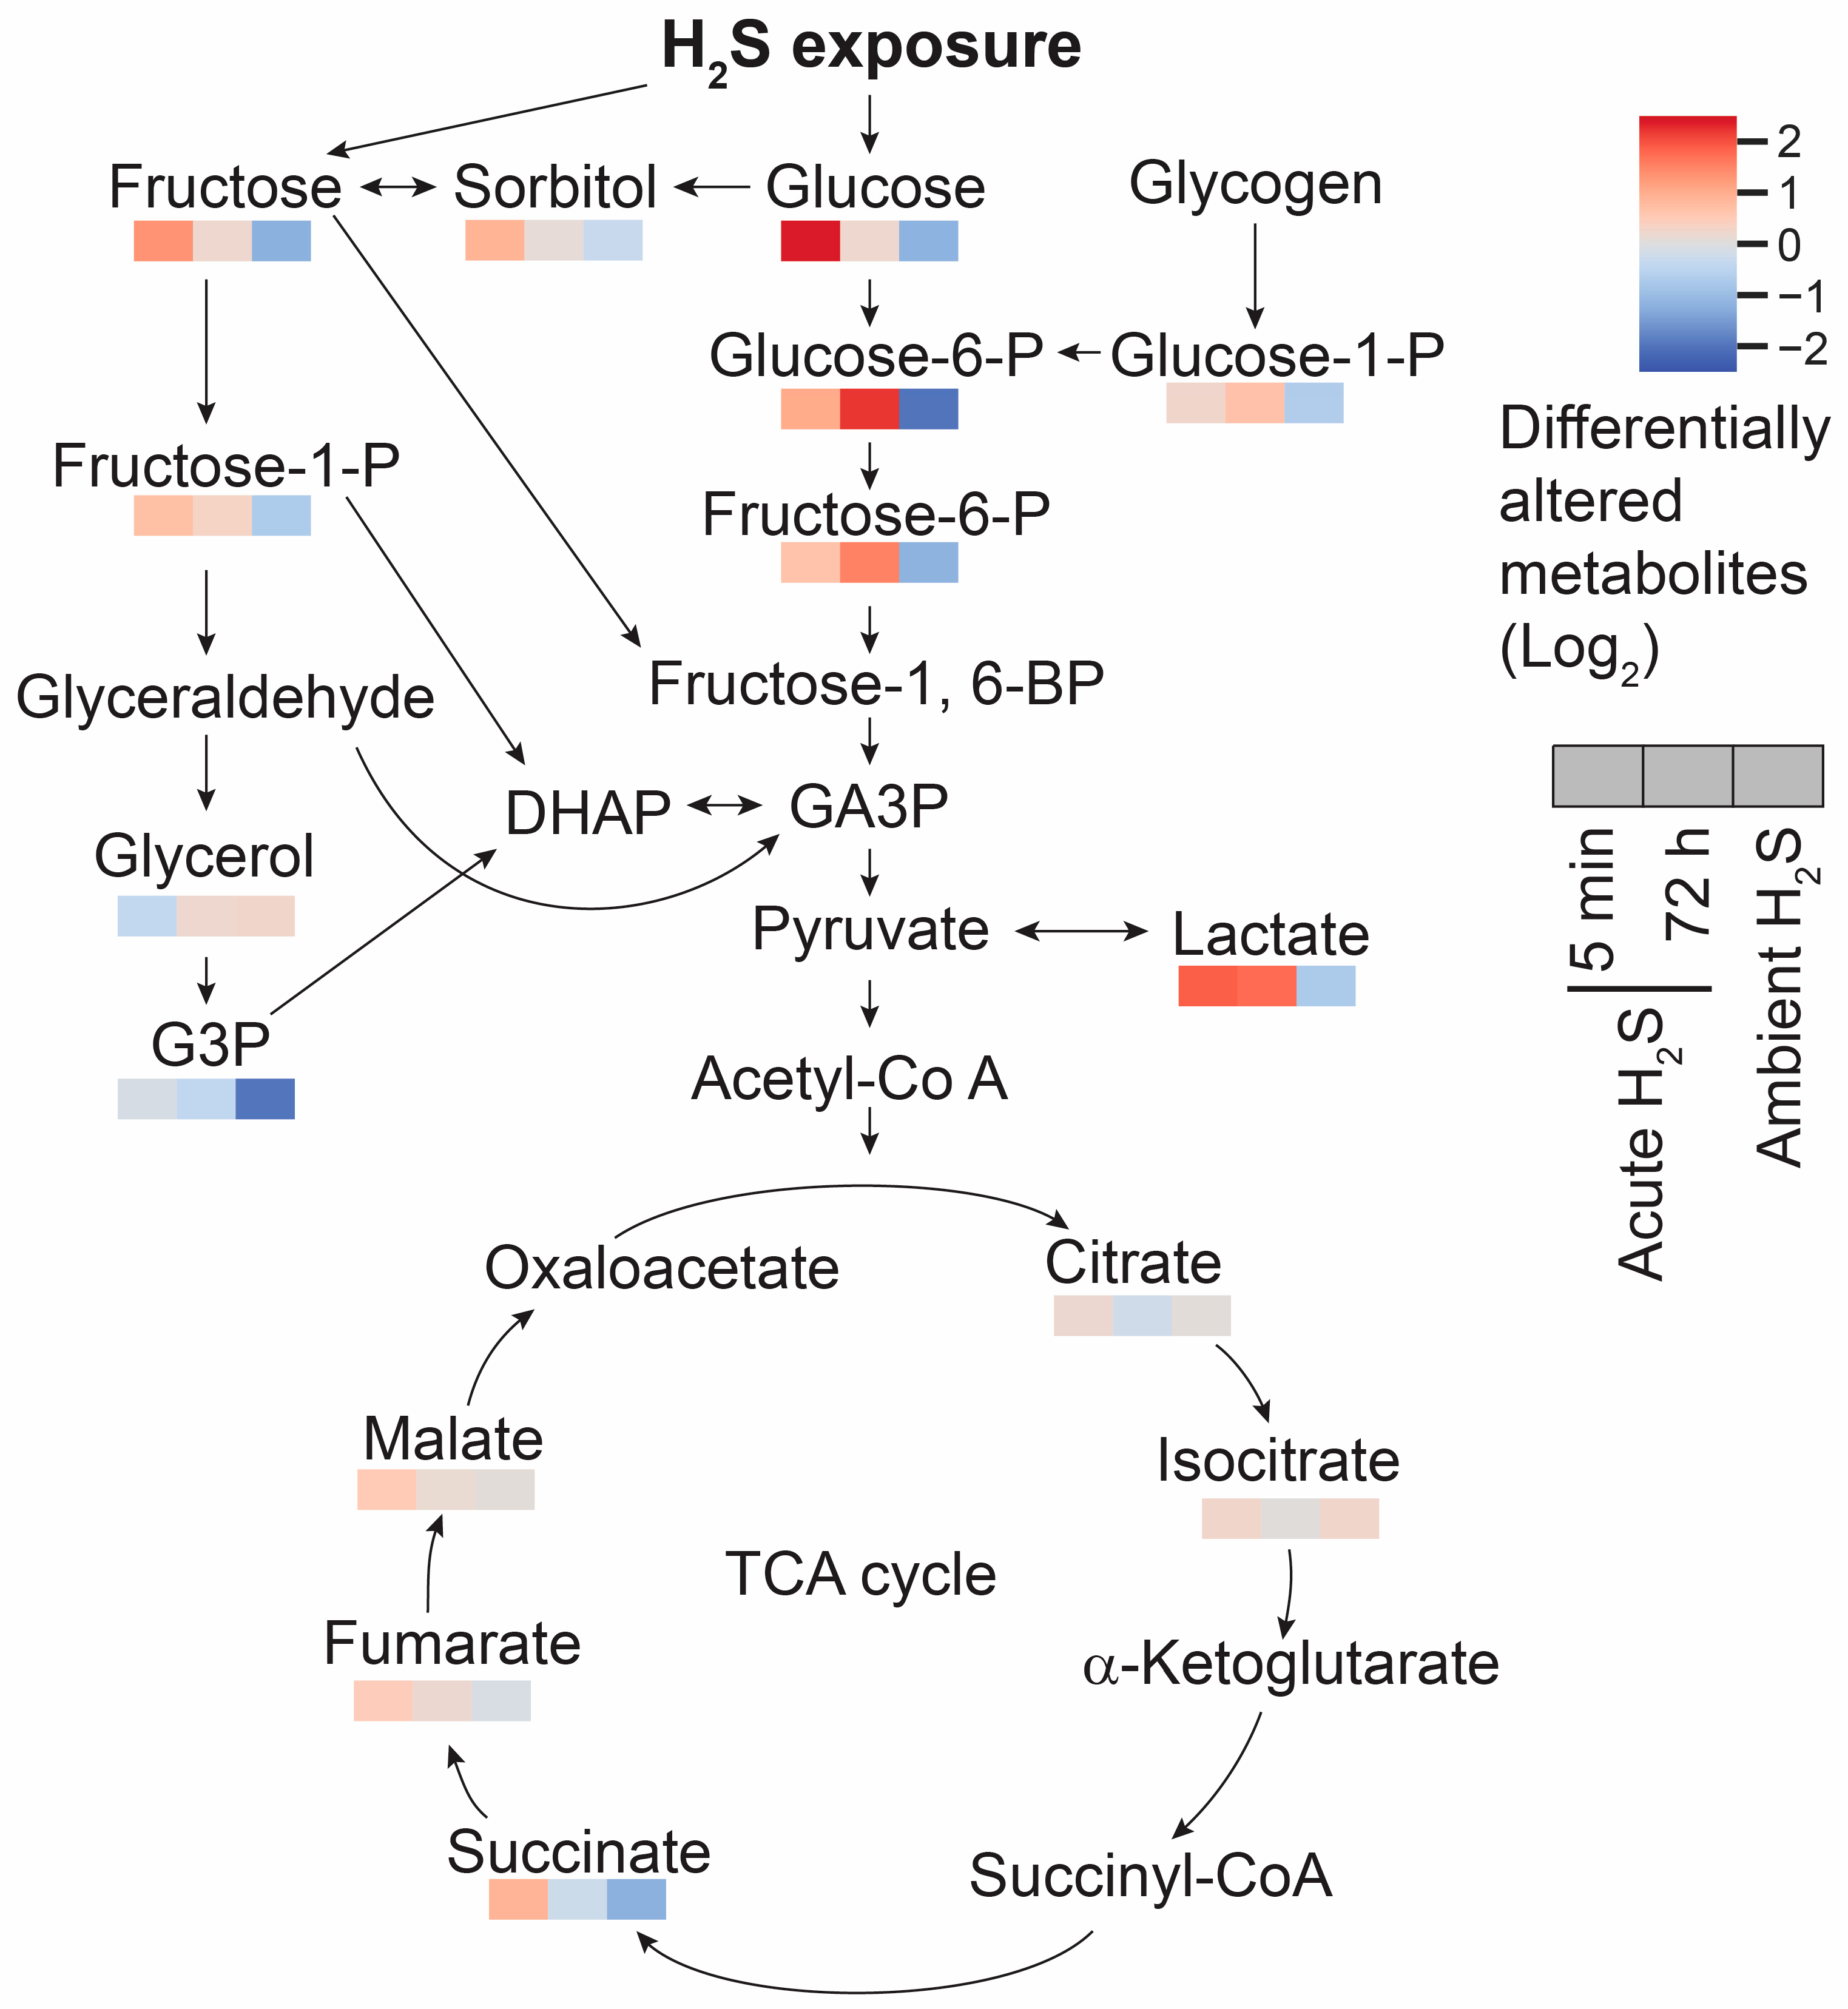
2S exposure dysregulates the TCA cycle in other ways besides inhibiting cytochrome c oxidase in the electron transport chain (ETC). Indeed, intermediates of the TCA cycle including succinate, fumarate, and malate were increased at 5 min post acute H
2S exposure while succinate and fumarate were decreased following ambient H
2S exposure. Glucose is a key compound in glycolysis. Glucose concentration was significantly increased at 5 min post acute H
2S exposure while decreased following ambient H
2S exposure. Increase in brain glucose during acute H
2S exposure may suggest it is spared following inhibition of cytochrome c oxidase by H
2S. Elevated glucose concentration can affect multiple biological pathways including polyol, glycolysis, PPP, and HBP. Intermediates of polyol and glycolysis were increased while PPP and HBP were not significantly altered at 5 min post acute H
2S exposure, indicating acute H
2S exposure significantly dysregulate energy balance. Accumulation of succinate may be caused by inverse activity of succinate dehydrogenase converting fumate to succinate {Zhang, 2020 #17728} indicating the TCA cycle was inhibited. Lactate concentration remained elevated following acute H
2S exposure, which is in line with previous findings that treatment of sodium hydrosulfide induced elevation of lactate [
42]. It was shown that acute H
2S exposure-induced inhibition of cytochrome c oxidase in brain including brainstem remained upto 72 h [
3]. It is plausible that inhibition of cytochrome c oxidase subsequently inhibit ETC and TCA cycle, which could not meet the energy demand in central nervous system. Accumulation of succinate was shown to produce ROS and induce static epielpticus in a kainic acid rat model [
43].
Fatty acids have multiple important roles in nervous system; from serving as structural component of membranes, energy source, signaling molecule, cellular differentiation, apoptosis, to pathological conditions such as aging and neurodegeneartive diseases [
44]. Regulation of fatty acid is tightly-controlled and differently in different brain regions. Behenic acid is a VLCFA. VLCFA are preferentially metabolized in the peroxisome. The statistically significant reduction of behenic acid observed in this study may indicate altered peroxisome fatty acid beta oxidation. Subchronic ambient H
2S strikingly increased metabolites of both the mono-unsaturated fatty acid (MUFA) and poly-unsaturated fatty acid (PUFA) synthesis pathways in brainstem including oleic acid, arachidonic acid (AA), and docosahexaenoic acid (DHA) in brainstem. Arachidonic acid, which was also increased, is pro-inflammatory and is also linked to neurodegenerative diseases such as AD [
45]. A deficiency of DHA has been been associated with neurodegenerative disorders [
46]. We have also previously reported that acute H
2S poisoning causes neuroinflammation and neurodegeneration [
3,
9,
12,
13].
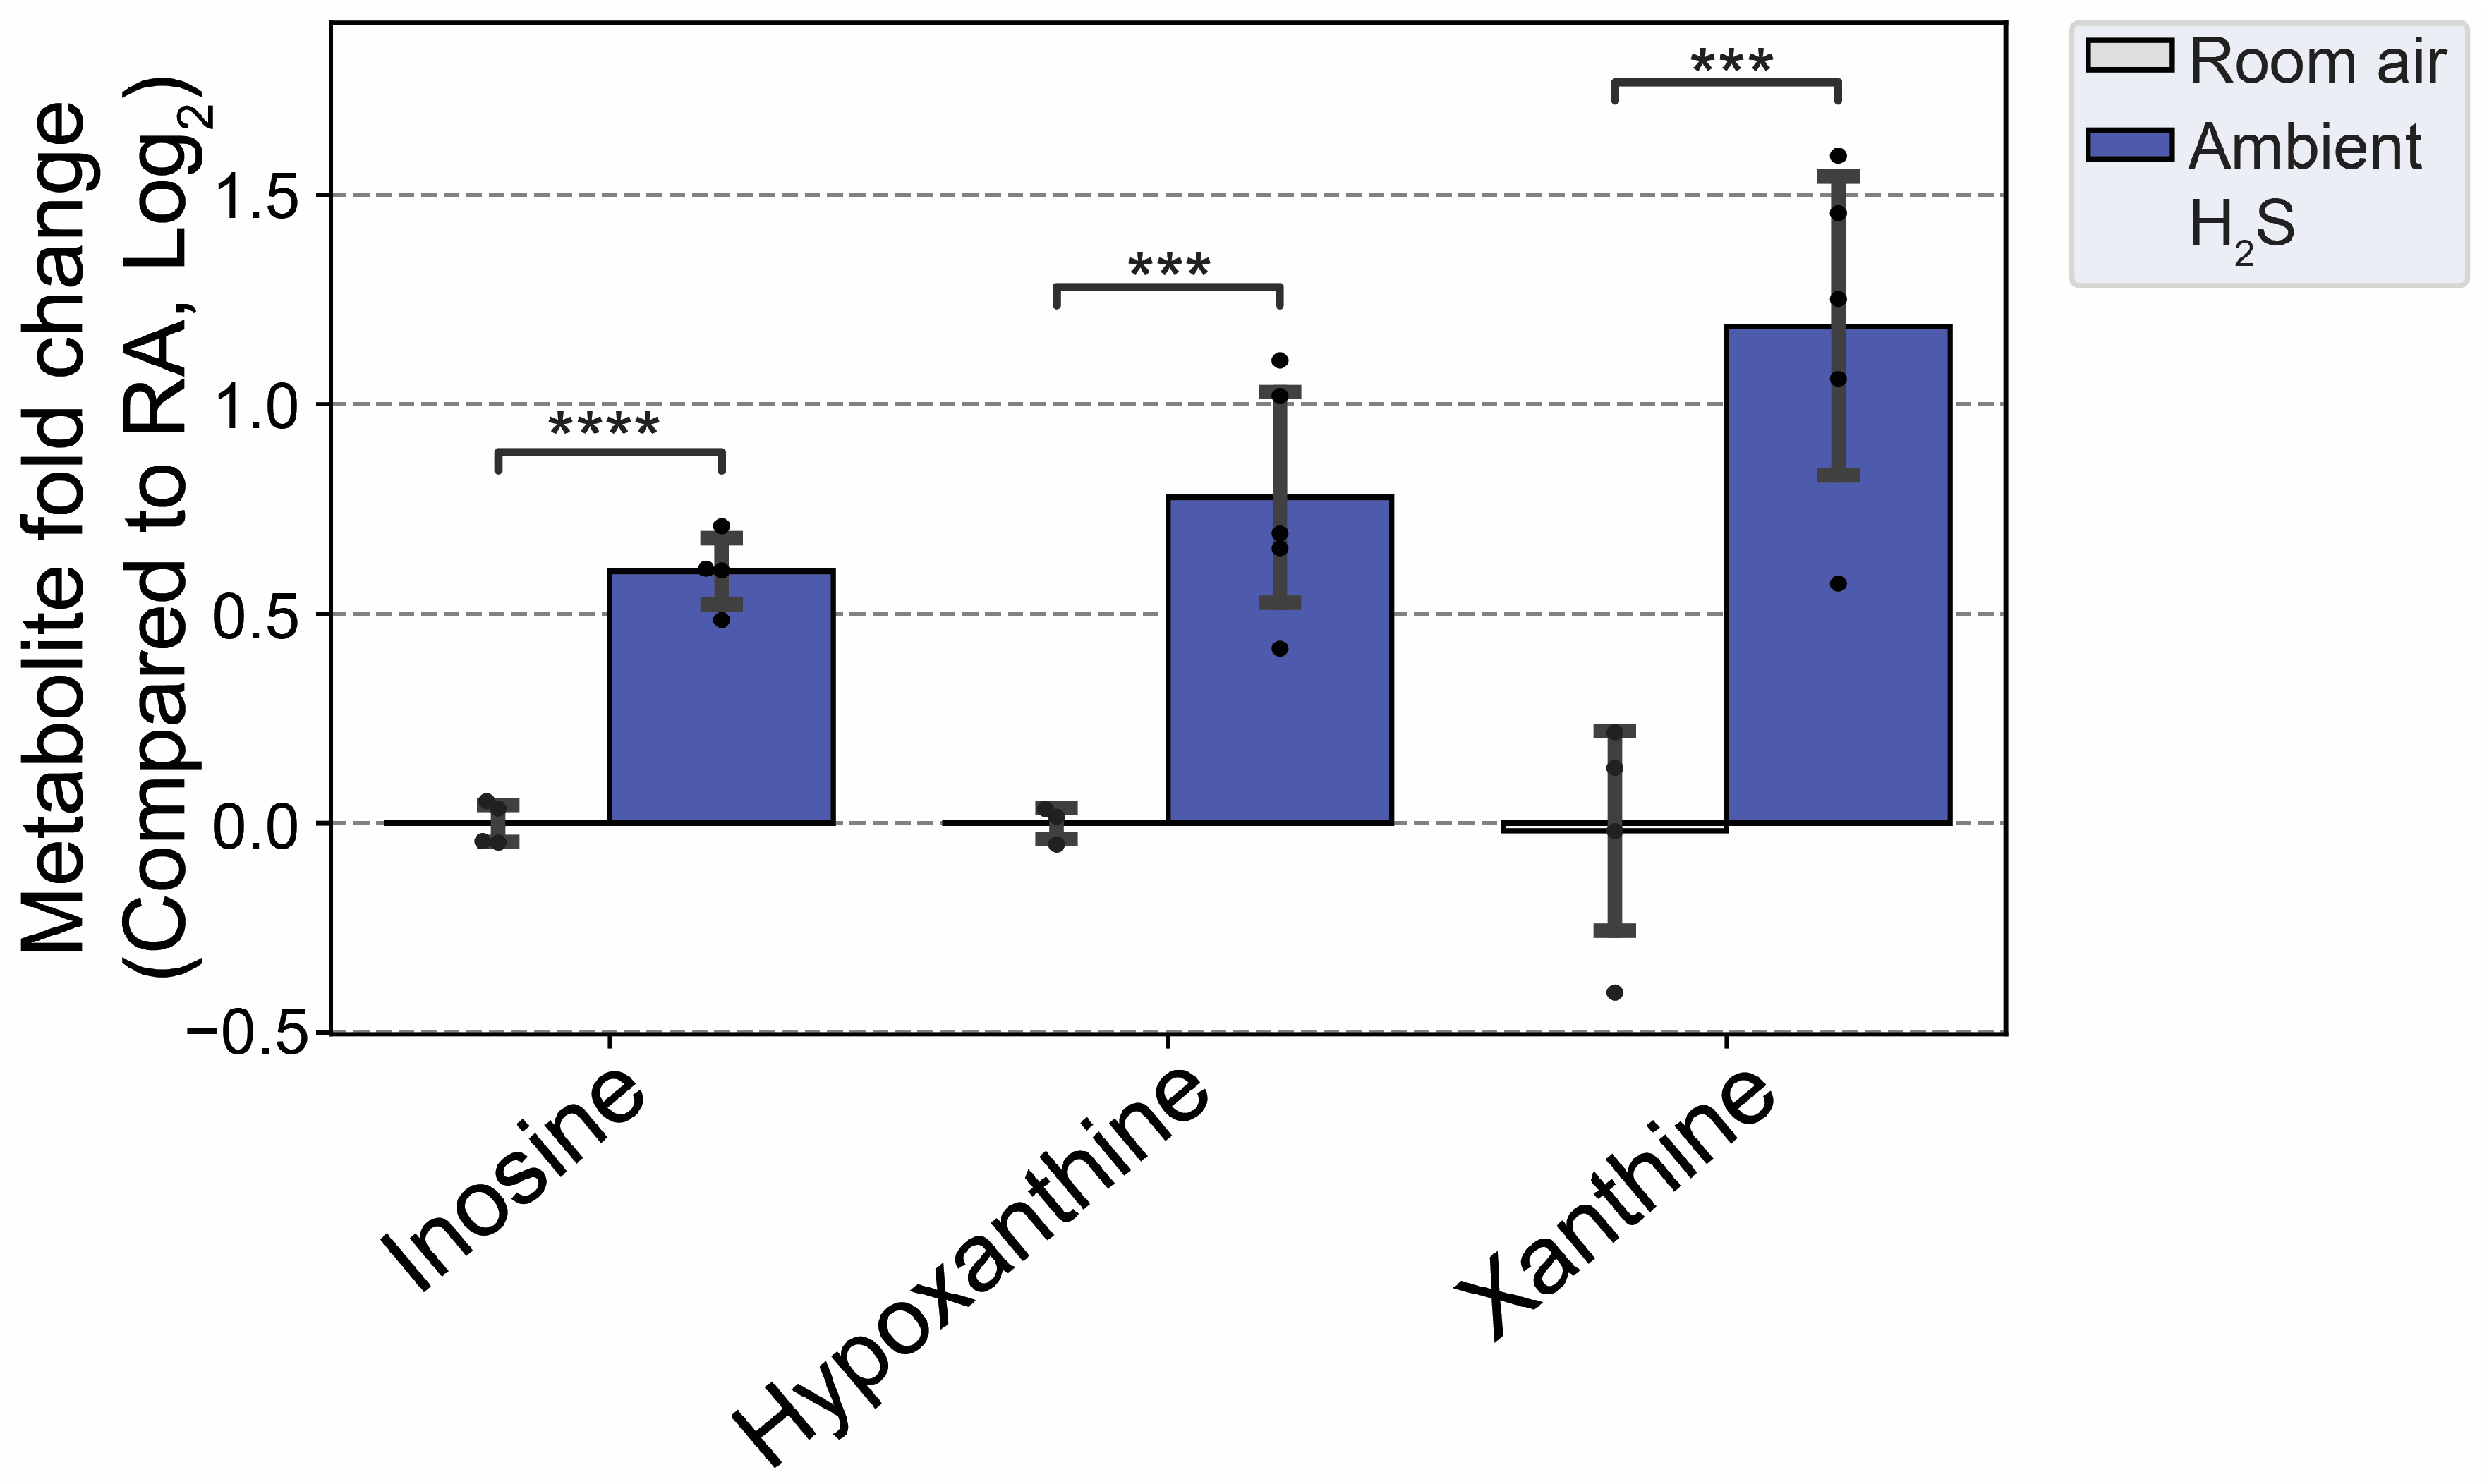
Subchronic ambient H
2S also dysregulated inosine metabolism and increased inosine, hypoxanthine, and xanthine. Inosine is metabolized to hypoxanthine, xanthine and finally to uric acid [
47]. Inosine was shown to play important roles in neuroprotection among others, presumably via anti-inflammatory and antioxidant properties [
48]. AMP was shown to be metabolised to IMP, hypoxanthine, xanthine and uric acid to enhance ATP production during acute energy consumption [
47]. Administration of inosine was shown to induce hypoglycemicaemia [
49]. Indeed, subchronic ambient H
2S decreased glucose concentration more than 1 fold compared to the RA control group. This finding shows that subchronic ambient H
2S dysregulate energy homeostasis. More work is needed on this topic to determine whether subchronic ambient H
2S exposure causes a brain energy deficit. Brain energy deficit has been cited a contributing factor in neurodegeneration [
1,
2]. Potentially this suggests that ambient H
2S exposure may be an environmental factor predisposing to neurodegeneration.
This study, though yielding interesting results had some limitations. For example, the study only consisted of male, adult mice. Future studies should include female mice as well so as to determine whether there may be sex differences in brain metabolism following H
2S exposure. As has been reported [
9], male mice were more sensitive to acute H
2S poisoning than females. Therefore, including female mice in the study may shed light on toxic mechanisms of H
2S . The other limitation of this study was that the acute study only lasted up to 72 h post H
2S exposure. In previous studies, we have shown neurodegeneration to be fully manifested on day 7 in the brain stem and other brain regions [
3,
5,
7,
8,
9]. Also, in human victims of single acute H
2S poisoning accidents, a plethora of long-term debilitating neurological sequalae including neuropsychiatric disturbance, sleep disorders, headaches, memory and cognition deficits and persistent vegetative states are reported [
25,
26,
27,
28,
50]. Therefore, future studies should investigate metabolomic changes in the brain-stem several months later to determine the metabolomic profiles of delayed neurotoxic effects.
Figure 1.
A summary of experimental exposure paradigms. A) Exposure paradigm of single acute exposure to 1000 ppm H2S. This exposure model induces 50 % mortality (LCt50). B) Exposure paradigm of subchronic ambient exposure to 5 ppm H2S. In this model mice were exposed to 5 ppm H2S for 2 h/day, 5 days/week for 5 weeks.
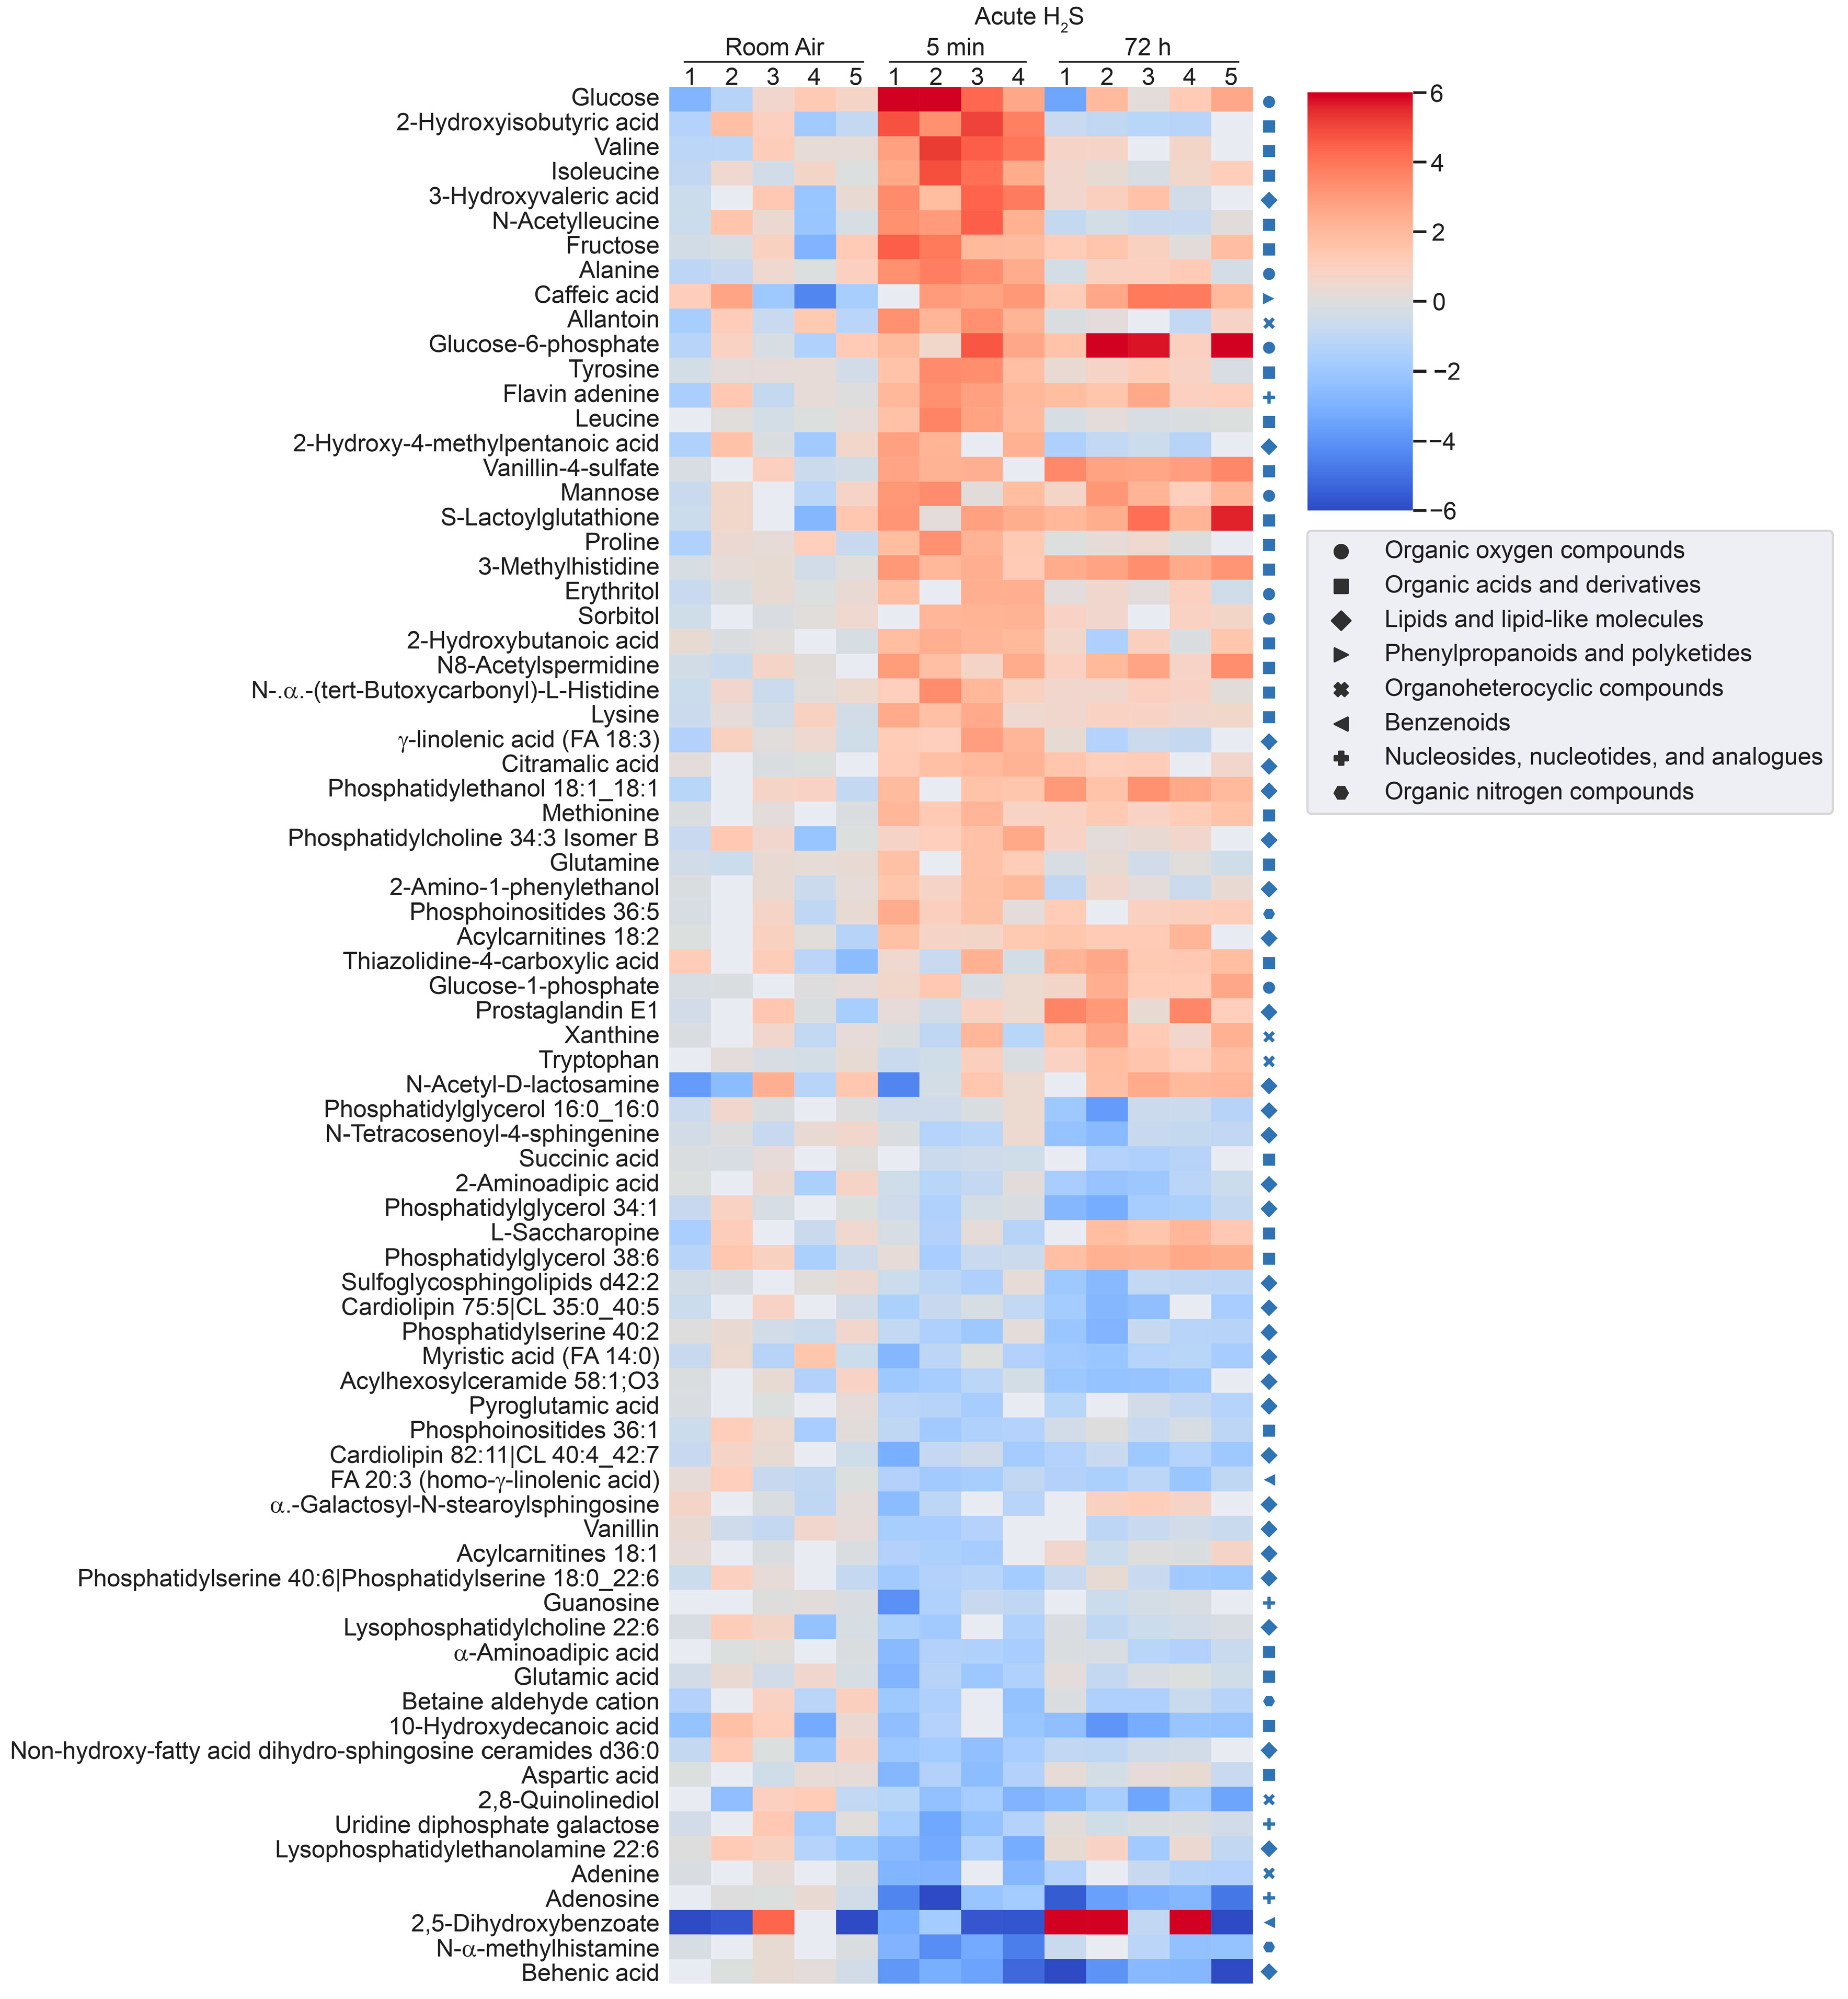
Figure 2.
Heatmap analysis of significantly altered metabolites following a single acute H2S exposure. Concentrations of significantly altered metabolites from primary metabolites, biogenic amines, and lipidomic metabolites are visualized in a heatmap by fold-change (log2 scale). Classification of individual metabolites is shown on the right side of the heatmap.
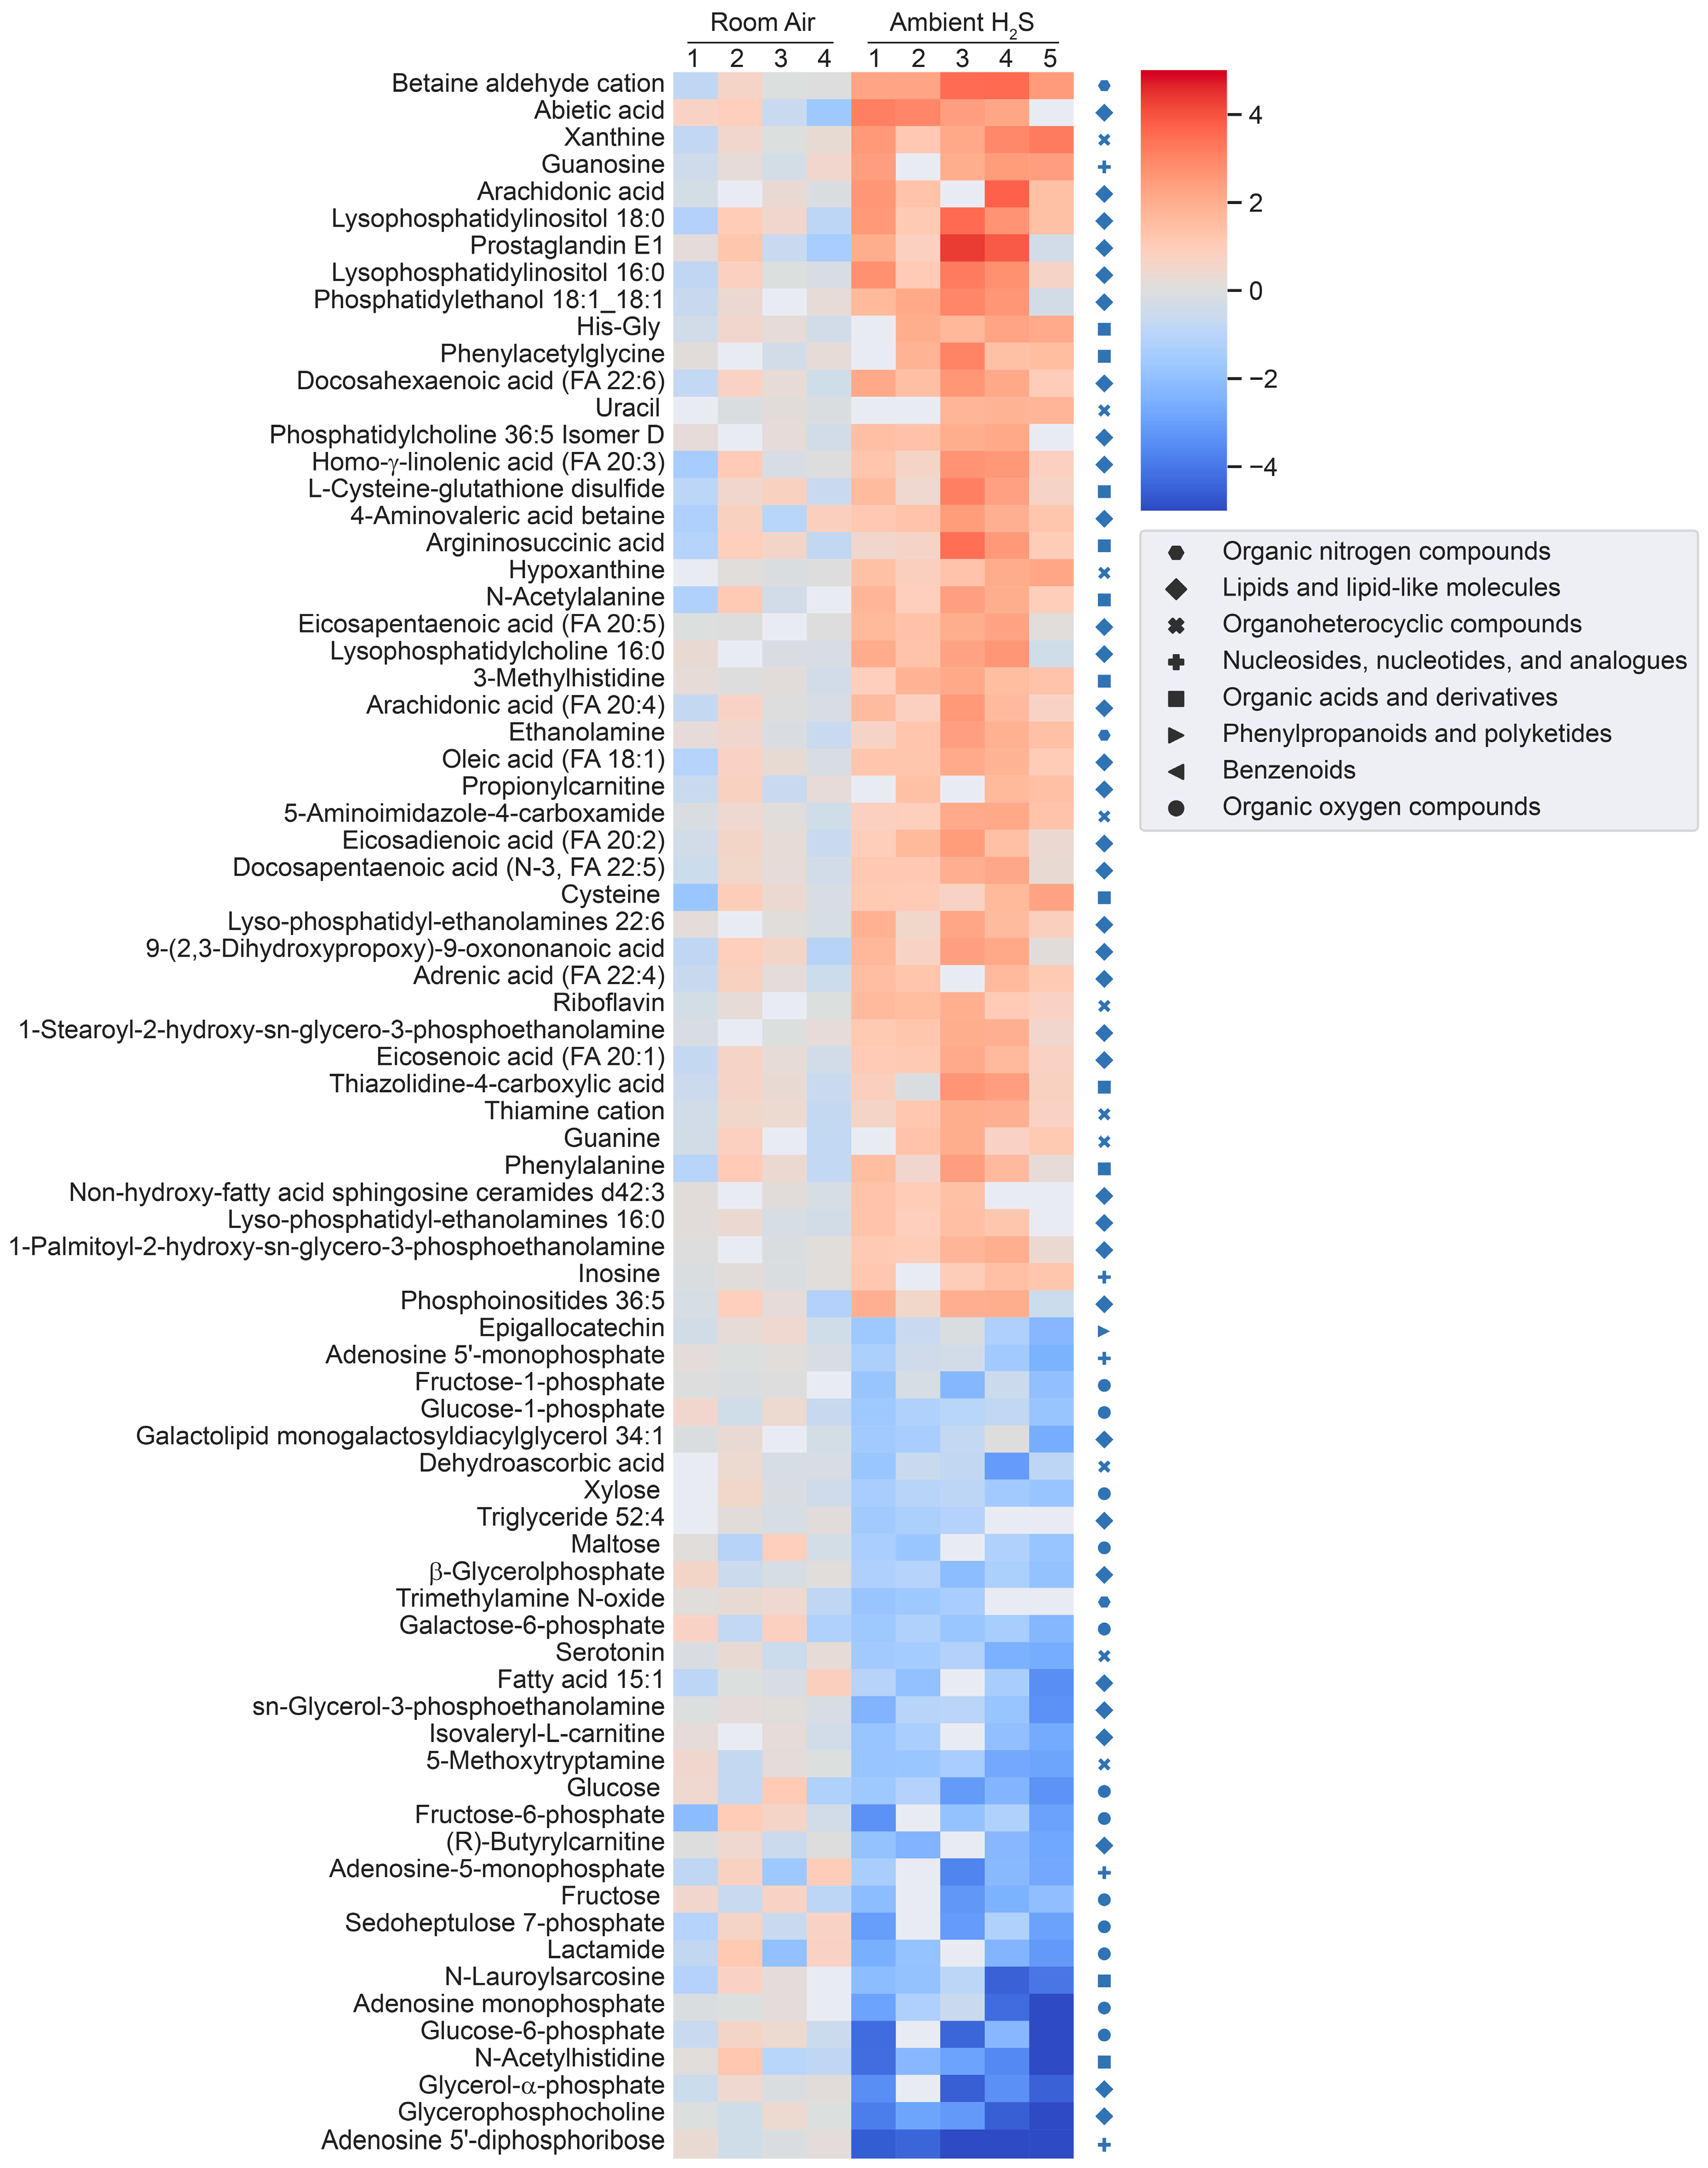
Figure 3.
Heatmap analysis of significantly altered metabolites following subchronic ambient H2S exposure. Concentrations of significantly altered primary organic metabolites, hydrophilic compounds including biogenic amines, and lipidomic metabolites are visualized in a heatmap by fold-change (log2 scale). Classification of individual metabolites is shown on the right side of the heatmap.
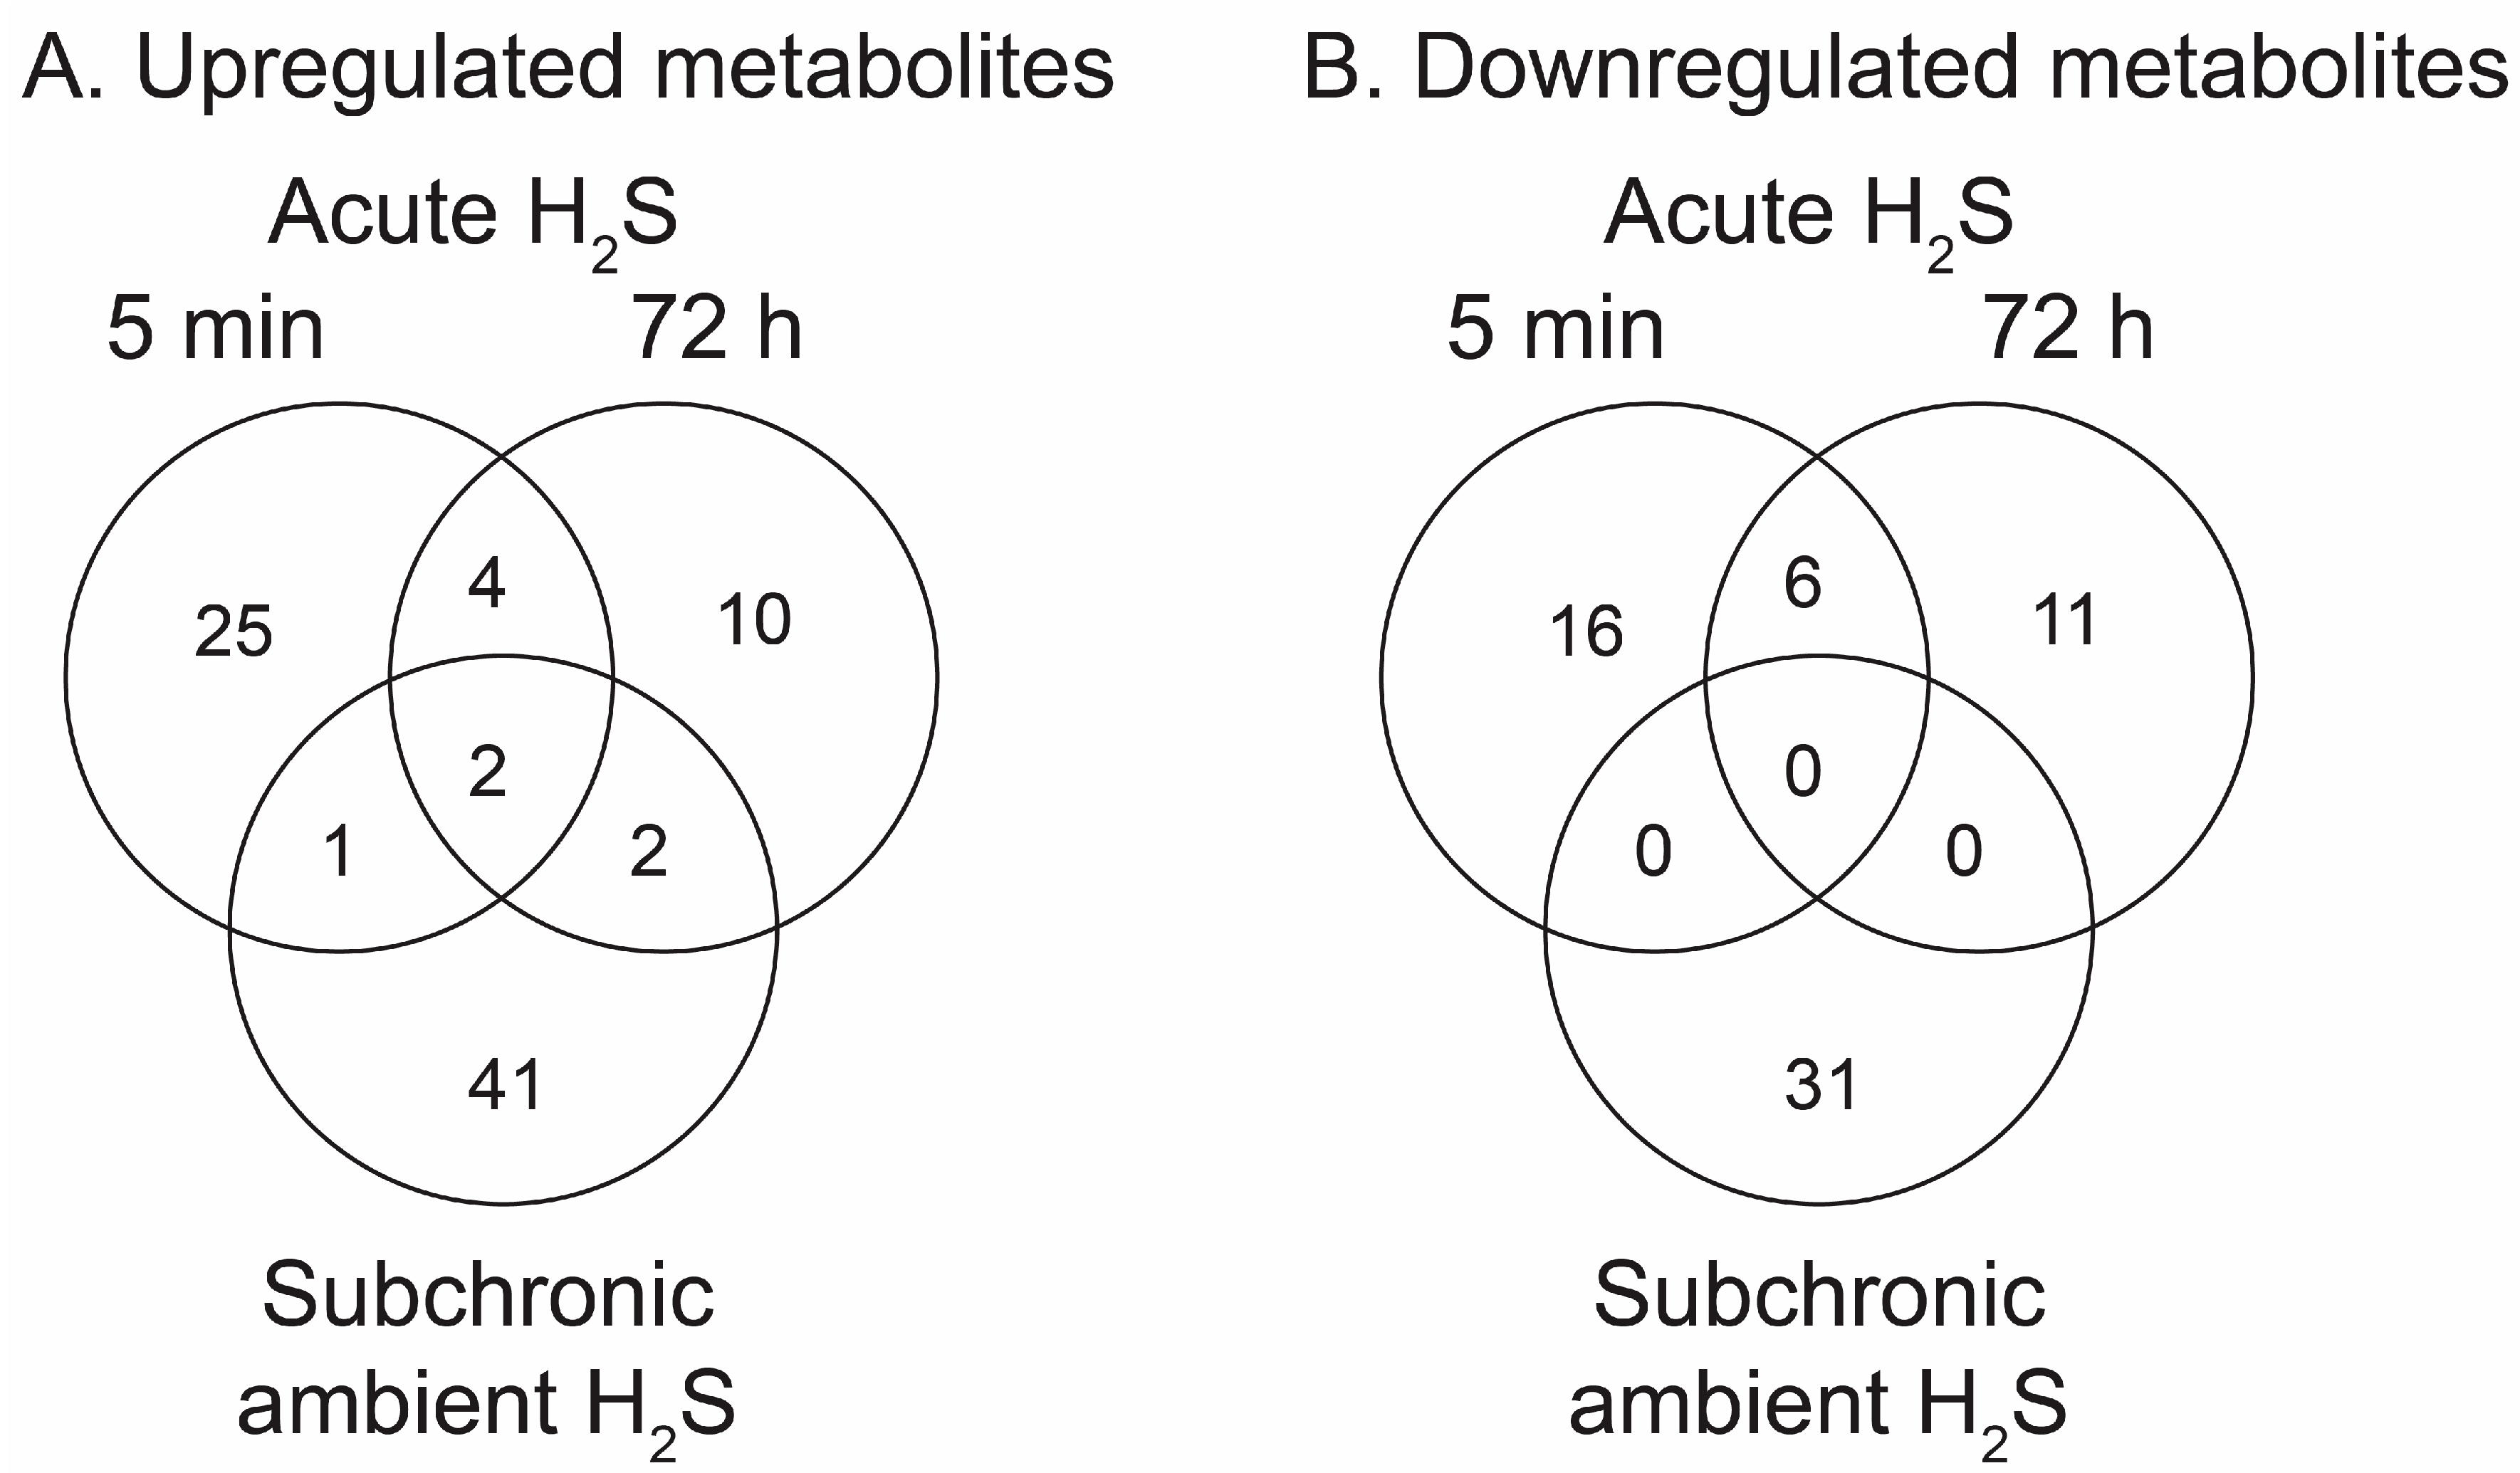
Figure 4.
Venn diagrams summarising numbers of significantly altered metabolites following acute and ambient H2S exposure. Immediate (5 min) and early (72 h) responses to acute H2S and response to ambient H2S exposure in brainstem are shown. A) Increased metabolites compared to RA control group. B) Decreased metabolites compared to RA control group.
Figure 5.
Disease-based enrichment analysis of signficantly altered metabolites of immediate response to H2S exposure (5 min post a single acute H2S exposure) for primary metabolites, biogenic amines, and lipidomic metabolites.
Figure 5.
Disease-based enrichment analysis of signficantly altered metabolites of immediate response to H2S exposure (5 min post a single acute H2S exposure) for primary metabolites, biogenic amines, and lipidomic metabolites.
Figure 6.
Disease-based enrichment analysis of signficantly altered metabolites of early response 72 h post a single acute H2S exposure for primary metabolites, biogenic amines, and lipidomic metabolites.
Figure 6.
Disease-based enrichment analysis of signficantly altered metabolites of early response 72 h post a single acute H2S exposure for primary metabolites, biogenic amines, and lipidomic metabolites.
Figure 7.
Disease-based enrichment analysis of signficantly altered metabolites of subchronic response to repeated H2S exposure for 5 weeks for primary metabolites, biogenic amines, and lipidomic metabolites.
Figure 7.
Disease-based enrichment analysis of signficantly altered metabolites of subchronic response to repeated H2S exposure for 5 weeks for primary metabolites, biogenic amines, and lipidomic metabolites.
Figure 8.
Neurotransmitter changes following H2S exposure. A) Fold change of neurotransmitters following acute 1000 ppm H2S exposure. B) Fold change of neurotransmitters following subchronic ambient H2S exposure. Values are presented as mean ± standard deviation. ANOVA with post-hoc Tukey HSD test was performed for acute H2S exposure groups while unpaired Students’ t-test was performed for subchronic ambient H2S exposure groups to test for statistical significance. Asterisks indicate significant differences compared to RA group. P *< 0.1, ** < 0.05, and ****<0.001.
Figure 9.
Altered aromatic amino acids following H2S exposure. A) Fold change of aromatic amino acids following acute 1000 ppm H2S exposure. B) Fold change of aromatic amino acids following subchronic ambient H2S exposure. Values are presented as mean ± standard deviation. ANOVA with post-hoc Tukey HSD test was performed for acute H2S exposure groups while unpaired Students’ t-test was performed for subchronic ambient H2S exposure groups to test for statistical significance. Asterisks indicate statistically significant differences compared to RA group. P ** < 0.05 and ***<0.01.
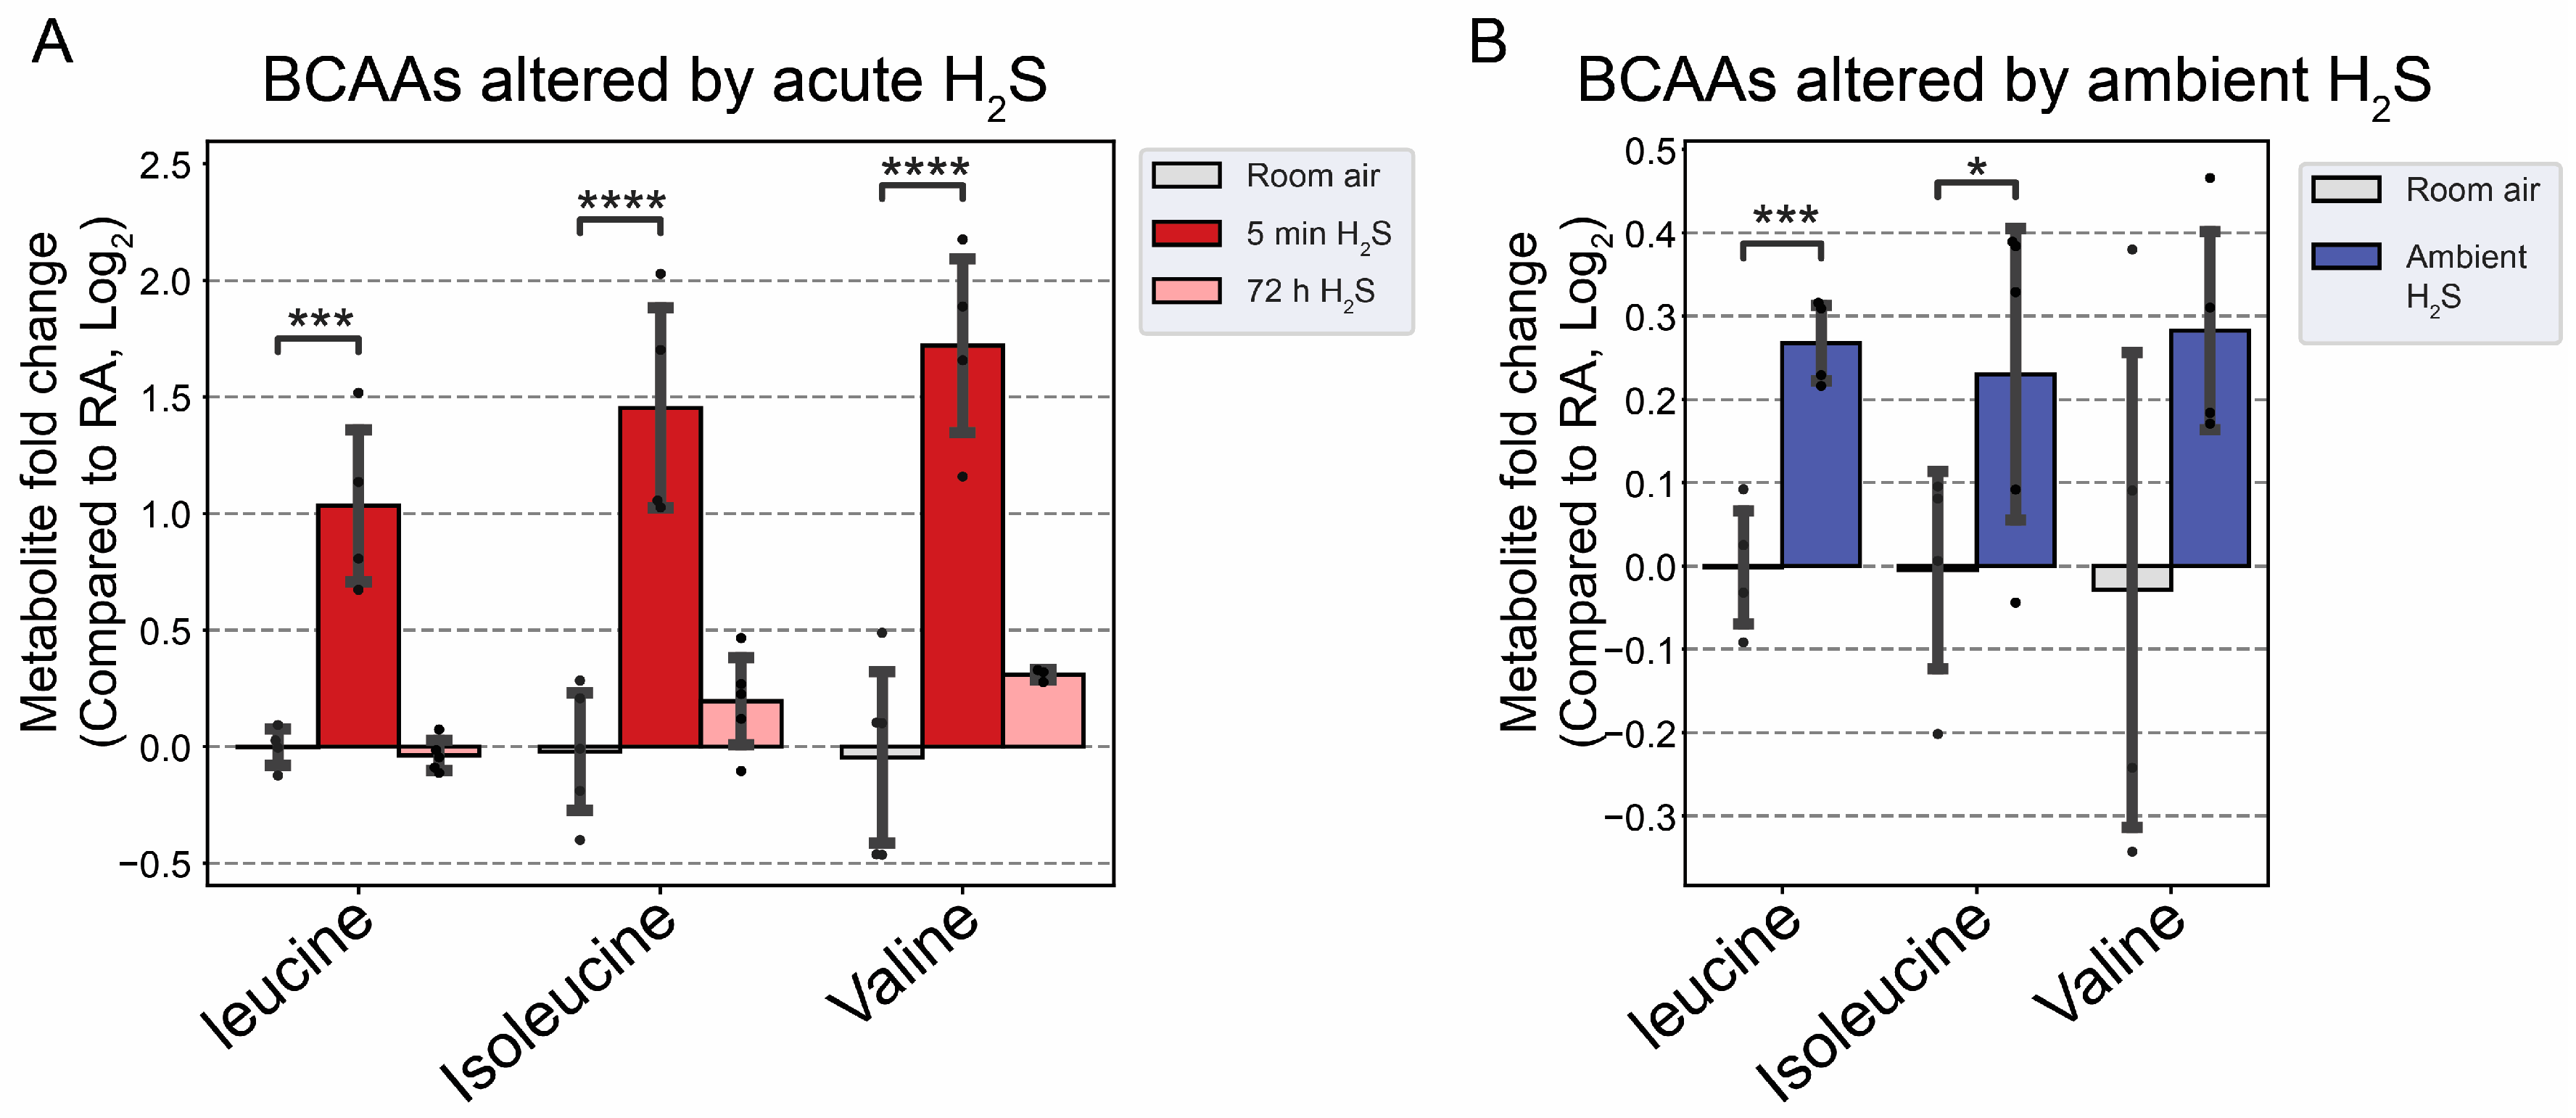
Figure 10.
Fold change of branched chain amino acid following H2S exposure. A) Fold change of BCAA following acute H2S exposure. B) Fold change of BCAA following subchronic ambient H2S exposure. Values are presented as mean ± standard deviation. ANOVA with post-hoc Tukey HSD test was performed for acute H2S exposure groups while unpaired Students’ t-test was performed for subchronic ambient H2S exposure groups for statistical significance. Asterisks indicate significant differences compared to RA group. P *< 0.1, ***<0.01, and ****<0.001.
Figure 11.
Altered fatty acids following H2S exposure. A) Decreased behenic acid, a very long-chain fatty acid (VLCFA), following acute H2S exposure. B) Major unsaturated fatty acids in brain were increased following subchronic ambient H2S exposure. Values are presented as mean ± standard deviation. ANOVA with post-hoc Tukey HSD test was performed for acute H2S exposure groups while unpaired Students’ t-test was performed for subchronic ambient H2S exposure groups for statistical significance. Asterisks indicate significant differences compared to RA group. P ** < 0.05, ***<0.01, and ****<0.001.
Figure 12.
Schematic pathway of glycolysis and TCA cycle. Responses at 5 min and 72 post acute H2S exposure and also following subchronic ambient H2S are presented in a heatmap analysis. Fructose, sorbitol, and glucose were significantly increased by acute H2S exposure but decreased by subchronic ambient H2S exposures compared to RA control. Changes in lactic acid are shown in a similar fashion. Succinate, fumarate, and malate concentrations were increased at 5 min of acute H2S exposure. Differentially altered metabolites are presented in fold changes (log 2 scale). Abbreviation: DHAP: Dihydroxyacetone phosphate, Fructose-1-P: Fructose 1-phosphate, Fructose-1,6-BP: Fructose 1,6-bisphosphate, Fructose-6-P: Fructose 6-phosphate, G3P: Glycerol-3-phosphate, GA3P: Glyceraldehyde 3-phosphate, Glucose-1-P: Glucose 1-phosphate, Glucose-6-P: Glucose 6-phosphate, and TCA cycle: Tricarboxylic acid cycle.
Figure 13.
Altered inosine and metabolites following subchronic ambient H2S exposure. Values are presented as mean ± standard deviation. ANOVA with post-hoc Tukey HSD test was performed for acute H2S exposure groups while unpaired Students’ t-test was performed for subchronic ambient H2S exposure groups for statistical significance. Asterisks indicate significant differences compared to RA group. P ***<0.01 and ****<0.001.
Table 1.
Significantly altered metabolites at 5 min post acute H2S exposure compared to room air control group. Common metabolite name, mass-to-charge ratio, fold change (log2 scale), and statistical significance were listed. ANOVA with post-hoc Tukey HSD test was performed for statistical significance. Asterisks indicate significant differences compared to RA group. P *< 0.1, * * < 0.05, ***<0.01, and ****<0.001.
| Metabolites |
m/z |
5min |
72h |
| Fold Change |
Significance |
Fold Change |
Significance |
| 10-hydroxydecanoic acid |
187.135 |
1.77 |
**** |
0.31 |
|
| 2,5-dihydroxybenzoate |
329.025 |
1.52 |
**** |
0.21 |
|
| 2,8-quinolinediol |
162.057 |
1.46 |
*** |
0.32 |
|
| 2-amino-1-phenylethanol |
120.08 |
1.41 |
**** |
-0.2 |
|
| 2-aminoadipic acid |
162.076 |
1.36 |
*** |
0.48 |
|
| 2-hydroxy-4-methylpentanoic acid |
131.071 |
1.35 |
**** |
0.23 |
|
| 2-hydroxybutanoic acid |
131 |
1.22 |
* |
1.18 |
** |
| 2-hydroxyisobutyric acid |
103.041 |
1.15 |
*** |
0.02 |
|
| 3-hydroxyvaleric acid |
117.056 |
1.15 |
|
2.88 |
* |
| 3-methylhistidine |
170.091 |
1.11 |
*** |
0.25 |
|
| Acylcarnitines 18:1 |
426.358 |
0.9 |
**** |
0.31 |
*** |
| Acylcarnitines 18:2 |
424.344 |
0.87 |
*** |
0.19 |
|
| Acylhexosylceramide 58:1;O3 |
1048.91 |
1.07 |
*** |
-0.04 |
|
| Adenine |
136.062 |
1.1 |
|
1.33 |
* |
| Adenosine |
236 |
1.07 |
*** |
0.68 |
** |
| Alanine |
116 |
1.01 |
*** |
-0.44 |
|
| Allantoin |
157.038 |
1 |
*** |
1.29 |
**** |
| α-galactosyl-N-stearoylsphingosine |
728.598 |
1.79 |
**** |
-0.43 |
|
| α-aminoadipic acid |
260 |
0.97 |
* |
0.81 |
|
| Aspartic acid |
232 |
0.96 |
|
1.49 |
** |
| Behenic acid |
117 |
0.93 |
*** |
0.08 |
|
| Betaine aldehyde cation |
120.1019_102.0893 |
0.93 |
*** |
1.19 |
**** |
| Caffeic acid |
181.057 |
0.91 |
**** |
0.13 |
|
| Cardiolipin 75:5|Cardiolipin 35:0_40:5 |
1496.04 |
0.79 |
*** |
0.29 |
|
| Cardiolipin 82:11|Cardiolipin 40:4_42:7 |
1582.09 |
0.78 |
** |
-0.24 |
|
| Citramalic acid |
247 |
0.83 |
** |
0.26 |
|
| Erythritol |
217 |
0.78 |
* |
0.76 |
** |
| Flavin adenine |
246 |
0.66 |
** |
0.2 |
|
| Fructose |
307 |
0.63 |
**** |
-0.06 |
|
| γ-Linolenic acid (FA 18:3) |
277.216 |
0.69 |
* |
1.06 |
*** |
| Glucose |
319 |
0.62 |
*** |
-0.02 |
|
| Glucose-1-phosphate |
217 |
0.59 |
* |
0.45 |
|
| Glucose-6-phosphate |
387 |
0.47 |
* |
0.65 |
** |
| Glutamic acid |
246 |
0.27 |
|
0.8 |
* |
| Glutamine |
156 |
0.26 |
|
0.7 |
** |
| Guanosine |
324 |
0.12 |
|
1.07 |
** |
| Homo-gamma-linolenic acid (FA 20:3) |
305.249 |
0.68 |
*** |
0.48 |
** |
| Isoleucine |
158 |
0.09 |
|
0.71 |
* |
| Leucine |
158 |
-0.06 |
|
0.87 |
* |
| L-Saccharopine |
277.139 |
-0.23 |
*** |
-0.58 |
**** |
| Lysine |
317 |
-0.24 |
|
-0.62 |
** |
| Lysophosphatidylcholine 22:6 |
568.339 |
-0.07 |
|
-0.61 |
** |
| Lysophosphatidylethanolamine 22:6 |
526.288 |
-0.18 |
|
-0.58 |
** |
| Mannose |
205 |
-0.24 |
|
-0.8 |
*** |
| Methionine |
150.056 |
-0.26 |
|
0.71 |
** |
| Myristic acid (FA 14:0) |
227.202 |
0.75 |
*** |
0.47 |
** |
| N-(Octadecanoyl)-sphinganine (Cer-NDS d36:0) |
566.547 |
0.86 |
* |
0.88 |
* |
| N-α-(Tert-Butoxycarbonyl)-L-histidine |
110.069 |
-0.27 |
|
0.93 |
**** |
| N8-Acetylspermidine |
188.175 |
-0.28 |
|
-0.6 |
** |
| N-Acetyl-D-lactosamine |
406.13 |
-0.35 |
|
-0.9 |
*** |
| N-Acetylleucine |
172.096 |
-0.4 |
|
-0.66 |
** |
| N-α-Methylhistamine |
126.101 |
-0.49 |
|
-0.68 |
* |
| N-tetracosenoyl-4-sphingenine |
648.6272_630.6146 |
-0.5 |
* |
-0.89 |
** |
| Phosphatidylcholine 34:3 Isomer B |
756.5538_778.5289 |
-0.58 |
*** |
-0.39 |
*** |
| Phosphatidylglycerol 16:0_16:0 |
721.502 |
-0.6 |
** |
-0.6 |
** |
| Phosphatidylserine 40:2 |
844.603 |
-0.69 |
* |
-0.19 |
|
| Phosphatidylserine 40:6|PS 18:0_22:6 |
836.547 |
-0.74 |
*** |
-0.29 |
* |
| Phosphoinositides 34:1 |
835.536 |
-0.61 |
** |
-0.59 |
** |
| Phosphoinositides 36:1 |
863.56 |
-0.65 |
** |
0.38 |
* |
| Phosphoinositides 36:5 |
855.5 |
-0.66 |
*** |
-0.3 |
|
| Phosphoinositides 38:6 |
881.512 |
-0.66 |
*** |
0.07 |
|
| Phostatidylethanol 18:1_18:1 |
727.527 |
-0.6 |
* |
-0.19 |
|
| Proline |
142 |
-0.66 |
* |
-0.37 |
|
| Prostaglandin E1 |
353.232 |
-0.67 |
** |
-0.16 |
|
| Pyroglutamic acid |
130.05 |
-0.78 |
**** |
-0.11 |
|
| S-Lactoylglutathione |
380.111 |
-0.82 |
|
-1.13 |
* |
| Sorbitol |
217 |
-0.83 |
** |
-0.3 |
|
| Succinic acid |
117.019 |
-0.83 |
**** |
-0.02 |
|
| Sulfoglycosphingolipids d42:2 |
890.639 |
-0.8 |
* |
-0.41 |
|
| Thiazolidine-4-carboxylic acid |
134.025 |
-0.84 |
* |
-1.05 |
** |
| Tryptophan |
202 |
-0.87 |
** |
-0.08 |
|
| Tyrosine |
218 |
-1.06 |
* |
-0.05 |
|
| Uridine diphosphate galactose |
565.044 |
-1.18 |
**** |
-0.49 |
**** |
| Valine |
144 |
-1.42 |
**** |
-1.58 |
**** |
| Vanillin |
151.04 |
-1.53 |
|
4.94 |
* |
| Vanillin-4-sulfate |
230.996 |
-1.54 |
**** |
-0.64 |
*** |
| Xanthine |
153.037 |
-1.6 |
**** |
-1.71 |
**** |
Table 2.
Significantly altered metabolites following subchronic ambient H2S exposure compared to RA control group. Common metabolite name, mass-to-charge ratio, fold change (log2 scale), and statistical significance were listed. Unpaired Students’ t-test was performed for statistical significance. Asterisks indicate significant differences compared to RA group. P *< 0.1, * * < 0.05, ***<0.01, and ****<0.001.
| Metabolites |
m/z |
Fold Change |
Significance |
| (R)-Butyrylcarnitine |
232.1547 |
-1.18 |
*** |
| 1-Palmitoyl-2-hydroxy-sn-glycero-3-phosphoethanolamine |
454.2927 |
0.61 |
** |
| 1-Stearoyl-2-hydroxy-sn-glycero-3-phosphoethanolamine |
482.3181 |
0.68 |
** |
| 3-Methylhistidine |
170.0913 |
0.77 |
*** |
| 4-Aminovaleric acid betaine |
160.133 |
0.8 |
** |
| 5-Aminoimidazole-4-carboxamide |
110.0322 |
0.72 |
** |
| 5-Methoxytryptamine |
174 |
-1.03 |
*** |
| 9-(2,3-Dihydroxypropoxy)-9-oxononanoic acid |
261.1345 |
0.7 |
** |
| Abietic acid |
301.216 |
1.34 |
*** |
| Adenosine 5'-diphosphoribose |
560.0761_582.0571 |
-3.46 |
**** |
| Adenosine 5'-monophosphate |
370.0487 |
-0.61 |
** |
| Adenosine monophosphate |
695.1267 |
-1.48 |
** |
| Adenosine-5-monophosphate |
315 |
-1.2 |
* |
| Adrenic acid (FA 22:4) |
331.2637 |
0.69 |
*** |
| Arachidonic acid |
303.2328 |
1.13 |
* |
| Arachidonic acid (FA 20:4) |
303.2333 |
0.77 |
** |
| Argininosuccinic acid |
291.127 |
0.8 |
* |
| β-Glycerolphosphate |
243 |
-0.76 |
*** |
| Betaine aldehyde cation |
120.1019_102.0893 |
1.4 |
*** |
| Cysteine |
220 |
0.71 |
** |
| Dehydroascorbic acid |
173 |
-0.65 |
** |
| Docosahexaenoic acid (FA 22:6) |
327.2328 |
0.96 |
*** |
| Docosapentaenoic acid (n-3, FA 22:5) |
329.2473 |
0.71 |
** |
| Eicosadienoic acid (FA 20:2) |
307.2637 |
0.72 |
** |
| Eicosapentaenoic acid (FA 20:5) |
301.2167 |
0.79 |
** |
| Eicosenoic acid (FA 20:1) |
309.2798 |
0.68 |
** |
| Epigallocatechin |
307.0835 |
-0.59 |
** |
| Ethanolamine |
62.0596 |
0.76 |
** |
| Fatty acid 15:1 |
239.2009 |
-0.92 |
** |
| Fructose |
307 |
-1.21 |
** |
| Fructose-1-phosphate |
387 |
-0.62 |
** |
| Fructose-6-phosphate |
315 |
-1.13 |
* |
| Galactolipid monogalactosyldiacylglycerol 34:1 |
774.605 |
-0.64 |
** |
| Galactose-6-phosphate |
387 |
-0.82 |
* |
| Glucose |
319 |
-1.11 |
** |
| Glucose-1-phosphate |
217 |
-0.63 |
** |
| Glucose-6-phosphate |
387 |
-1.9 |
*** |
| Glycerol-alpha-phosphate |
357 |
-1.97 |
**** |
| Glycerophosphocholine |
515.2116_772.3096_280.0915_258.1106_296.0648 |
-2.04 |
**** |
| Guanine |
152.0564 |
0.64 |
* |
| Guanosine |
324 |
1.16 |
**** |
| His-Gly |
213.0949 |
1.01 |
**** |
| Homo-γ-linolenic acid (FA 20:3) |
305.2487 |
0.86 |
** |
| Hypoxanthine |
265 |
0.8 |
*** |
| Inosine |
230 |
0.6 |
**** |
| Isovaleryl-L-carnitine |
246.17 |
-0.98 |
*** |
| Lactamide |
90.0544 |
-1.25 |
* |
| L-Cysteine-glutathione disulfide |
427.0924 |
0.81 |
* |
| Lysophosphatidylcholine 16:0 |
540.3289 |
0.78 |
** |
| Lyso-phosphatidyl-ethanolamines 16:0 |
452.2776 |
0.62 |
**** |
| Lyso-phosphatidyl-ethanolamines 22:6 |
526.2883 |
0.7 |
** |
| Lysophosphatidylinositol 16:0 |
571.2842 |
1.03 |
** |
| Lysophosphatidylinositol 18:0 |
599.3185 |
1.11 |
** |
| Maltose |
361 |
-0.76 |
* |
| N-Acetylalanine |
130.0515 |
0.79 |
* |
| N-Acetylhistidine |
198.0888 |
-1.96 |
** |
| N-Lauroylsarcosine |
272.2221 |
-1.35 |
* |
| Non-hydroxy-fatty acid sphingosine ceramides d42:3 |
704.6138 |
0.62 |
*** |
| Oleic acid (FA 18:1) |
281.2491 |
0.75 |
*** |
| Phenylacetylglycine |
192.0664 |
0.97 |
** |
| Phenylalanine |
164.0721 |
0.62 |
* |
| Phosphatidylcholine 36:5 Isomer D |
780.555 |
0.88 |
*** |
| Phosphoinositides 36:5 |
855.5001 |
0.6 |
* |
| Phosphatidylethanol 18:1_18:1 |
727.5266 |
1.01 |
** |
| Propionylcarnitine |
218.1366 |
0.75 |
*** |
| Prostaglandin E1 |
353.2316 |
1.07 |
* |
| Riboflavin |
377.1473 |
0.69 |
*** |
| Sedoheptulose 7-phosphate |
387 |
-1.24 |
** |
| Serotonin |
174 |
-0.91 |
**** |
| sn-glycerol-3-phosphoethanolamine |
238.0433 |
-0.96 |
*** |
| Thiamine cation |
265.1075 |
0.65 |
** |
| Thiazolidine-4-carboxylic acid |
134.0252 |
0.66 |
* |
| Triglyceride 52:4 |
872.7704 |
-0.67 |
*** |
| Trimethylamine N-oxide |
76.0748 |
-0.8 |
** |
| Uracil |
241 |
0.89 |
**** |
| Xanthine |
353 |
1.23 |
*** |
| Xylose |
103 |
-0.66 |
* |
